ultrasonic nondestructive evaluation of impact-damaged ... · nasa contractor report 3293...
TRANSCRIPT
NASA Contractor Report 3293
Ultrasonic Nondestructive Evaluation of Impact-Damaged Graphite Fiber Composite -
LoAN copy: RETURN AfWLTECHN\CAL l-16 KIRTLAND AFB, N.M. ,
James H. Williams, Jr., and Norman R. Lampert
GRANT NSG-3210 MAY 1980
https://ntrs.nasa.gov/search.jsp?R=19800016142 2018-07-17T02:58:24+00:00Z

NASA Contractor Report 3293
Ultrasonic Nondestructive Evaluation of Impact-Damaged Graphite Fiber Composite
James H. Williams, Jr., and Norman R. Lampert Massachusetts hstitute of Technology Cambridge, Massachusetts
Prepared for Lewis Research Center under Grant NSG-3210
NASA National Aeronautics and Space Administration
Scientific and Technical Information Office
1980


INTRODUCTION
The mechanical behavior of graphite fiber polymeric composites is significantly affected by fabrication procedures, environmental exposure and service loading. Often, the strength and stiffness of graphite fiber com- posi tes are degraded without changes in the visual appearance and without the presence of overt flaws such as delaminations and macrocracks. As observed by Vary ill, the conditions that predispose composites to failure may consist of dispersed microstructural and morphological anomalies. Thus, the NDE of graphite fiber composites must go beyond the detection and characterization of overt flaws to considerations of the integrated micromechanical defect state. Such NDE techniques should be considered for assessing the initial as-fabricated strength, the in-service residual strength, and the strength following repair operations. ,
Ultrasonic NDE techniques provide encouraging possibilities for quan- tifying the microstructural and morphological properties which may govern structural performance. Vary et al . [Z-4] d f e ined the ultrasonic parameter called the stress wave factor which has been positively correlated with the tensile strength and the interlaminar shear strength of graphite fiber com- posites. In testing graphite fiber composites, Hayford et al. [5] observed good correlation between the initial attenuation and the shear strength as determined by the short beam shear test. Recently, Wil 1 iams and Do1 1 [6] found the initial attenuation to be an effective indicator of the fatigue life of unidirectional graphite fiber composites subjected to transfiber compression- compression fatigue. And, a preliminary effort by Lampert [7] indicated that the number of cycles to failure of graphite fiber composi tension-tension fatigue can be correlated with initial va and stress wave factor.
tes subjected to lues of atr.enuat
The purpose of this report is to present the results of exper imenta 1 laboratory investigations of the ultrasonic characterizat ions of graphite fiber composites subjected to drop-weight impact testing. The drop-weigh impact test is devised to provide controlled degradation of the co,.:pol;ite strength from 100% to 50% of the undamaged material strength. Throug i:-
thickness attenuation and stress wave tactor measurements are made ttiroughout the degradation process. The results of these two ultrasonic characterizations are correlated with the number of impacts, the composite residual tensile strength, and each other.
ion
1

COMPOSITE SPECIMENS AND EXPERIMENTAL EQUIPMENT
Compos i te Spec imens
The composite specimens were lo-ply unidirectional Hercules AS/3501-6 continuous graphite fiber reinforced epoxy, A schematic of the specimens is shown in Fig, 1, direction),
The between-tabs length of the specimens was 12.7 cm (xl
0.635 cm and and the width (x2 direction) and thickness (x3 direction) were
0,135 cm, respectively, A total of fourteen specimens was tested. Four of the specimens were
chosen randomly to determine the 0” tensile modulus and strength. These resu 1 ts are given in the table below. The other ten specimens were subjected to the drop-weight impact tests and ul trasonical ly characterized. The complete set of ten specimens was used in both the through-thickness attenuation and the stress wave factor measurements.
Tab1 e: 0” Tens ile Properties of ~~/35Ol-6 Specimens
9.
Number of Ultimate Standard of Specimens Tensile Deviation
ity Tested Strength, o” of cT”
IO-ply 1 129 GN/m’ (18.8 Msi) ’
Hercul es _ 138 GN/m’ _
,SZron cifi- (20 Msi)
1 .72 GN/m’ (250 ksi)
I .59 GN/m’ (230 ksi)
12.7 MN/m2 (1.84 ksi)
Drop-Weight Impact Assembly
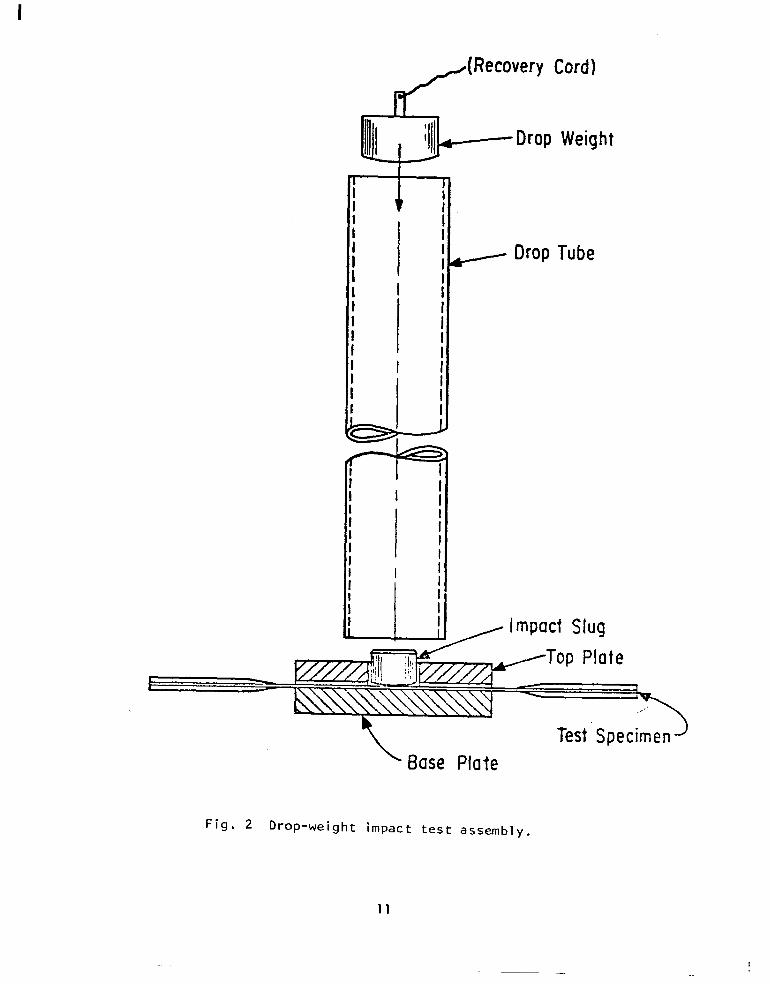
The drop-weight impact test assembly which was used to introduce degradation into the specimens is sketched in Fig. 2. The device consisted of a l/4 kg drop weight which freely fell under gravity through the 0.816 m long drop tube and struck the impact slug. The impact slug rested on the specimen and was restrained by the top plate. The impact slug had a sl ight radius on its face which contacted the specimen in order to prevent stress concentrations along its outer per imeter. The specimen was completely backed-up by the base plate so that no bending was introduced into the specimen during impact. The impact velocity was 4.0 m/s and the impact momentum was 1 .O kg-m/s with negligible rebound of the drop weight and the impact slug.

Through-Transmission Velocity and Attenuation System
A schematic of the through-transmission velocity and attenuation mea- suring system is shown in Fig. 3. The system consisted of a pulsed oscillator (Arenburg model PG-652C) for generating the si nsusoidai waves; a low frequency inductor (Arenburg model LFT-500); broadband (0.1 to 3.0 MHz) transmitting and receiving transducers (Acoustic Emission Technology (AET) FC-500) having an approximately flat sensitivity of -85dB (re 1 V/pBar); a transducer-specimen interface couplant (AET SC-~); and an oscilloscope (Textronix model 455). Plots of the transducer sensitivity-frequency response curves are given in [7].
The speck-men and the transducers were supported by a structure (not shown). In order to ensure high repeatability between the location and the orientation
of the transducers and the specimens, a specimen al ignment fixture and a stop were designed and used throughout the testing,
Two step attenuators were also used. One attenuator ,set at 10 d3,reduced the input signal to 1OOV (peak-to-peak) into the transmitting transducer, while a second attenuator, set at 20dB,reduced the 1OOV signal to lOVat the oscilloscope only. No filters were used on either the input or the output signals.
A clamping pressure of 0.3 MN/m2 was applied to the transducer-specimen Interface. As shown in [8] , this pressure exceeds the “saturation pressure”,
which is defined as the minimum interface pressure that results in the maximum output signal amp1 i tude, all other parameters being held constant. This saturation pressure level is similar to that found by Vary [g].
Stress Wave Factor System
A schematic of the stress wave factor measuring system is shown in Fig. 4. The system consisted of a pulsedoscil lator (Arenburg model PG-652~) for gen- erating a 1OOV input spike signal; a broadband (0.1 to 3.0 MHz) transmitting transducer (AET FC-500) having an approximately flat sensitivity of -85 dB (re 1 V/uBar) ; a resonant receiving transducer (AET AC-375) having a peak response at 375 kHz at a sensitivity of -85 dB (t-e 1 V/vBar); a low frequency amp1 ifier (Arenburg model LFA-550) to amp1 ify the receiving transducer signal by 60 dB; a transducer-specimen interface couplant (AET SC-~); and an osc i 1 loscope (Textron ix model 455). No filters were used on either the input or the output signals. Plots of the transducer sensitivity-frequency response curves are given in [7].
‘In order to simulate a free support of the specimen, the specimen and the transducers were supported on foam rubber pads. Because of this type of specimen support, a low clamping pressure of 0.025 MN/m2 was used.

EXPERIMENTAL PROCEDURES
Drop-Weight Impact Tests
Each specimen was drop-weight impact tested a total of 5, 10, 20, 40 or 100 times, at which point the residual static 0’ tensile strength was de- termlned, The through-thickness attenuation and velocity and the stress wave factor were measured at these same intervals, up to the point of the tensile test. For example, for specimens Impacted a total of 40 times, the ultrasonic parameters were measured after 5, 10, 20 and 40 Impacts.
Through-Transmission Velocity and Attenuation
The through-transmission velocity and attenuation were measured in the x3 direction at the impactydamaged area of the composite, These measurements were made at four frequencies: 1.0, 1.6, 2.0 and 3,0 MHz,. The velocity was computed via a time-difference measurement of one of the first few cycle peaks in the input signal and that same cycle peak in the output signal. The
attenuation was measured using a technique recently developed by Lee and Williams [lo]. This technique takes into account all multiple stress wave reflectlons, and so It can be used to measure attenuation in thin specimens even where overlapping echoes are contained in the output signal.
(Mod if ied) Stress Wave Factor
Vary and Bowles [2 or 111 have defined the ultrasonic parameter E = grn where E is called the stress wave factor, g is the accumulation time after which the counter is automatically reset, r is the (transmitting transducer) pulser repetition rate, and n is the number of (cycle) oscillations exceeding a fixed threshold in the output waveform generated by the input pulses. The stress wave factor depends on the input signal characteristics, transducer characteristics, system gain, reset time, threshold voltage, repetition rate, distance between transducers, and so forth. These factors must be kept constant for any series of comparable measurements and, therefore, E indicates a relative ability of the tested specimens to transmit the input signal.
As used here, both the transmitting and receiving transducers are located on the same (x3 direct ion) specimen surface, with the impact-damaged area between the transducers. So the stress wave factor is a characteristic primarily (though not exclusively) along the specimen length (xl direction) whereas the attenuation is a characteristic through the specimen thickness (x3 direction).
In this report, a modified stress wave factor will be devised. However, because the same concepts as defined by Vary and Bowles [2] will be used and because we prefer to minimize the introduction of new phraseology into this concept at this early stage of its development, “stress wave factor” will be used to indicate the “modif ied stress wave factor” as well. However, for the

purpose of future reference, we shall designate this modif led stress wave factor by ‘ISWF I’ to provide a distinguishing notation. As indicated by the description in the next paragraph, we believe that the SWF provides a simpler
(9 = 0~ and r = 1 per test) yet more sensitive measure of the same material characteristics as those reflected in c,
The input signal to the transmitting transducer (Fig, 4) is shown in Fig. 5. A typical stress wave factor output trace is shown in Fig, 6a. In accordance with these input and output signals, the (modified) stress wave factor is defined as the summation of the amp1 itudes (.heights) of the oscillations in large-division units on the output signal trace, (This is the same as n in 121 except that the magnitudes of the osci 1 lations are considered in the SWF count.) Only the upper half of the signal is summed and oscillation amp1 itudes are rounded-off to a whole division, depending on whether they are above or below one-half division. By definition, the threshold is equal to the minimum one-half division. For example, the trace in Fig, 6a is summed to 31 SWF counts.
5

RESULTS AND DISCUSSION
Residual Tensile Strength
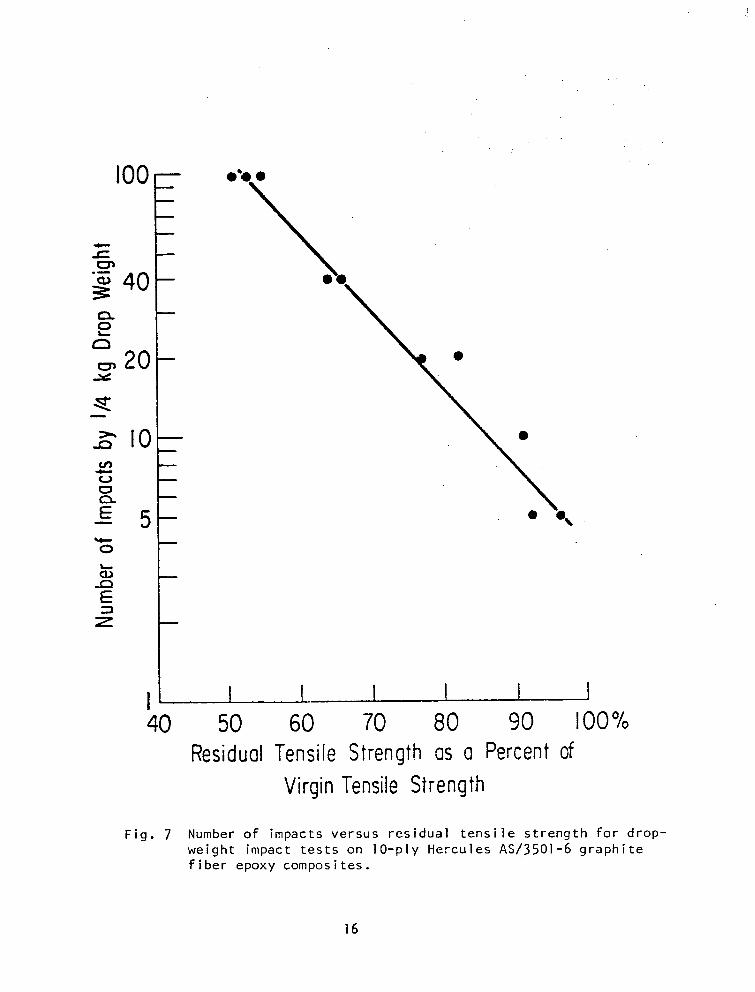
The relative residual static 0” tensile strength versus the number of drop-weight impacts is shown in Fig, 7, The correlation line in Fig, 7 and all subsequent correlation I ines have been simply drawn by eye, The relative residual strength varied from 51%, 53% and 55% for the three specimens subjected to 100 impacts to 92% and 96% for the two specimens tensile tested after 5 impacts,
Using the unaided eye, no visual damage was observed after 5 impacts. After 10 impacts, the damaged area was marginally distinguishable from the undamaged area. After 20 impacts, a sl ight chalking appearance on the surface occurred. After 40 impacts, it was obvious that some structural damage had resulted as some fine matrix cracks appeared on the surface, The damage after 100 impacts, however, visually appeared to be about the same as that after 40 impacts. Microscopic and dye penetrant tests are currently underway to study this degradation process further (Unpublished work by J. H. Williams, Jr.).
Through-Transmission Velocity and Attenuation
The narrow band longitudinal wave group velocity in the x3 direction as measured with the through-transmission system was 2.8 x 10” m/s. Within the 25% accuracy of the measurements, this velocity was the same for all the specimens at all four of the monitored ultrasonic frequencies and remained constant throughout the drop-weight impact tests.
The attenuation (x3 direction) at 2.0 MHz versus the residual 0” (x1 direction) tensile strength is given in Fig. 8. In Fig. 9, the attenuation at 2.0 MHz is plotted versus the number of impacts. Both Figs. 8 and 9 show distinct trends. The analogous data as given in Figs. 8 and 9 are plotted for 1.0, 1.6 and 3.0 MHz in [7] where the same trends are displayed.
Stress Wave Factor (SWF)
Fig. 6b shows the SWF output signal for a specimen subjected to 100 drop- weight impacts. While this signal is typical, it is by no means universal because the envelopes of some of the signals were double-peaked whereas the envelope in Fig. 6b is substantially single-peaked.
The SWF versus the residual O0 tensile strength is plotted in Fig. 10. The SWF versus the number of drop-weight impacts is plotted in [7]. It is important to note that al though there appears to be substantial scatter at the lower values of the tensile strength, this is not necessar.ily the case. For example, the SWF corresponding to 53% residual strength is 23 which is less than 2 counts above the correlation 1 ine. (This value, 2, is probably the

level of accuracy of the measurement.) Also, the SWF corresponding to 55% residual strength is 22 which is less than 1 count above the correlation line. This, of course, suggests a potentlal advantage in proceeding to an even finer amp1 itude measurement of the individual oscillations,
As indicated earlier and as illustrated in Fig, 4, the specimens were supported at the transducer locations by foam rubber pads. This support resulted in the rather low (and somewhat unsatisfactory) transducer-specimen contact pressure of 0.025 MN/m’, With such a low contact pressure, extra care had to be exercised to avoid vibrating the system during the SWF measurements. Late in these experiments, this pressure was increased to 0.3 MN/m2 which resulted in a very stable system. This increase in contact pressure resulted in changes in the SWF from zero in some cases to 210% in other cases.
Finally, Fig. 11 is a plot of the through-thickness attenuation at 2.0 MHz versus the SWF for two specimens subjected to 100 impacts and arbi trar i ly designated as No, 1 and No. 2. Thls figure provides an interesting correlation and gives encouragement to efforts to relate these two ultrasonic parameters.
7

CONCLUSIONS
A drop-weight impact test has been devised to produce controlled degradation In fiber composite specimens, Unidirectional Hercules AS/3501-6 continuous graphite fiber epoxy composites have been subjected to this drop-weight impact test and the resulting damage has been ultrasonically monitored.
A modified stress wave factor has been defined and designated as SW.F. While the SWF is based on the stress wave factor concepts by Vary and Bowles WI, it appears to be simpler and, perhaps, more sensi t-ive than the stress wave factor as originally defined.
The composite through-thickness attenuation and the SWF have been correlated with the number of drop-weight Impacts, the residual tensile strength as well as with each other. These correlations strongly suggest that impact damage in graphite fiber composites can be nondestructively assessed quantitatively using either the through-thickness attenuation or the SWF, Furthermore, although the through-thickness attenuation and the SWF are conceptually different ultrasonic parameters and were measured along different axes of the composite, they can be correlated for the type of tests described in this report. These correlations suggest several areas for future study in order to reveal the underlying principles of these correlations.
8
REFERENCES
1. A. Vary, “A Review of Issues and Strategies in Nondestructive Evaluation of Fiber Reinforced Structural Composites”, in New Horizons - Materials and Processes for the Eighties, Vol. 11, Proc. 1 lth National SAMPE (Sot. for the Advancement of Material and Process Engineering) Technical Con- ference, Azuza, Cal ifornia, Nov. 1979. (Al so NASA TM-79246).
2. A. Vary and K. J. Bowles, “Ultrasonic Evaluation of the Strength of Unidirectional Graphite-Polyimide Composites”, NASA Technical Memorandum 73646, Apri 1 1977.
3. A. Vary and K. J. Bowles, “Use of an Ultrasonic-Acoustic Technique for Nondestructive Evaluation of Fiber Composite Strength”, NASA Technical Memorandum 73813, February 1978.
4. A. Vary and R. F. Lark, “Correlation of Fiber Composite Tensile Strength with the Ultrasonic Stress Wave Factor”, Journal of Testing and Evaluation, JTEVA, Vol. 7, No. 4, July 1979, pp. 185-191. (Al so NASA TM-78846).
5. D. T. Hayford, E. G. Henneke, II, and W, W. Stinchcomb, “The Correlation of Ultrasonic Attenuation and Shear Strength in Graphite-Polyimide Composites”, Journal of Composite Materials, Vol. 11, October 1977, pp. 429-444.
6. J. H. Williams, Jr. and 8. Doll, “Ultrasonic Attenuation as an Indicator of Fatigue Life of Graphite Fiber Epoxy Composite, (To appear in Materials Evaluation). Also, see NASA Contractor Report 3179, December 1979.
7. N. R. Lampert, “Ultrasonic Nondestructive Evaluation of Graphite Fiber Epoxy Laminates Subjected to Tensile Fatigue and Impact Loading”, S. M. Thesis, Department of Mechanical Engineering, M.I.T., August 1979.
8. J. H. Williams, Jr., H. Nayeb-Hashemi and S. S. Lee, “Ultrasonic Attenuation and Velocity in AS/3501-6 Graphite/Epoxy Fiber Composite”, NASA Contractor Report 3180, December 1979.
9. A. Vary, “Computer Signal Processing for Ultrasonic Attenuation and Velocity Measurements for Material Property Characterizations”, NASA Technical Memorandum 79180, April, 1979.
10. S. S. Lee and J. H. Will iams, Jr., “Stress Wave Attenuation in Thin Structures by Ultrasonic Through-Transmission”, NASA Contractor Report 3203, January 1980.
11. A. Vary and K. J. Bowles, “An Ultrasonic-Acoustic Technique for Non- destructive Evaluation of Fiber Composite Quality”, Polymer Engineering and Science, Vol. 19, No. 5, April 1979.
9
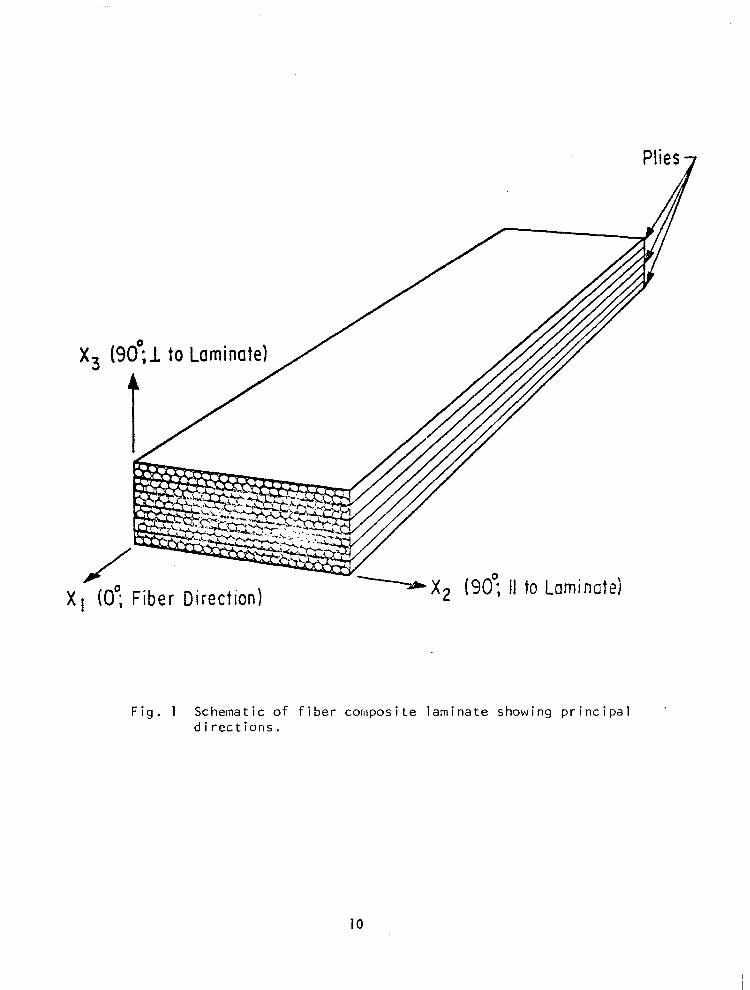
Fig. 1 Schematic of fiber composite laminate showing principal ’ directions.
10
- Drop Tube
Fig. 2 Drop-weight impact test assembly. Fig. 2 Drop-weight impact test assembly.
11 11

Pulsed Oscillator
RF output, 0 1
4 -Pulse Length
I Step 1 1 Attenuator 1
J
Low Frequency Inductor
Input Oscilloscope Sional Chon. I
0 lzzl
L 2 TimeQ Sweep
Transmitting 4 Step Attenuator I
output Signal
Fig. 3 System for velocity and attenuation measurements.

W
Pulsed Oscillator
Pulse Gate Out I
Osci I loscope
-I Min. B
Pulse Length
Input Signal Ghan, -I 1 0 1 I I 0
1 RF Input ILo w
Output Signal
1 Ime Sweep
Transmitting Transducer -----+ L -
ng Transducer
SDecimen ‘Foam Rubber mr -~
Fig. 4 Sys teni for s t ress wave factor (SWF) measurements.
Pads
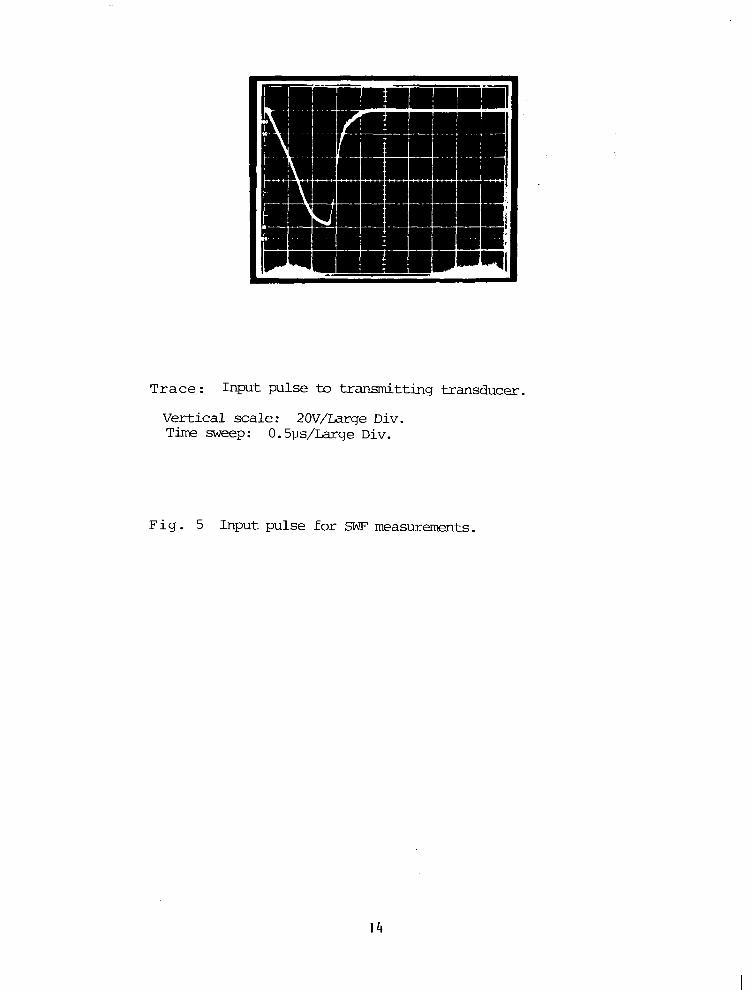
Trace: Input pulse to transmitting transducer.
Vertical scale: 20V/Laxge Div. Time sweep: 0.5ps/Larqe Div.
Fig. 5 Input pulse for SWF measurements.
14

a. SWF signal for a virgin lo-ply-specimen.
b. SWF signal for same lo-ply specimen degraded by 100 impacts.
Trace: Output signals from receiving transducer.
Vertical scales: Time sweeps:
O.lV/Large Div. lO?&/'Large Div.
Fig. 6 Output signals for SW measurements on lo-ply A!3/3501-6 graphite fiber epoxy specimen along x1 direction.
15
40 50 60 70 80 90 100% Residual Tensile Strength QS a Percent of
Virgin Tensile Strength
Fig. 7 Number of impacts versus residual tensile strength for drop- weight impact tests on lo-ply Hercules AS/3501-6 graphite fiber epoxy composites.
16

5 I- 5 4 t W
z
2
l e
\ 0
40 50 60 70 80 90 100% Residual Tensile Strength as a Percent of
Virgin Tensile Strength Fig. 8 Attenuation at 2.0 MHz versus residual tensile strength for
drop-weight impact tests on lo-ply Hercules AS/3501-6 graphite fiber epoxy composites.
17

b z W
20
15
IO
r 0
I I I I I lllll I I I I I!II
I 5 IO 20 40 100 Number of Impacts by 114 kg Drop Weight
Fig. 9 Attenuation at 2.0 MHz versus number of impacts for drop- weight impact tests on lo-ply Hercules AS/3501-6 graphite fiber epoxy composites.
18

-
-
-
-
21 1 40 50 60 70 80 90 100%
Residual Tensile Strength as a Percent of Virgin Tensile Strength
Fig. 10 Stress wave factor (SWF) versus residual tensile strength fer drop-weight impact tests on !O-ply Hercules AS/3501-6 graphite fiber epoxy composite.
IV
-

I-
,-
2o0
0 Specimen No. I A Specimen No. 2
Attenuation at 2.0 MH~inec”,“~)
Fig. II Stress wave factor (SWF) versus attenuation at 2.0 MHz Tar drop-weight impact tests on IO-ply Hercules AS/3501-6 (graphi 1s’ fiber epoxy composite sprcilnens Nos. I and 2.
20

~- 1 Repor! NO 2. GovelnmPnf *cce35,on NO. 3. ReC,p’enc’r catalog NO
NAs‘l CR-3193
4. TIIIe d”d Sublllle 5. Relm, oarr
ULTRASONIC NONDESTRUCTIVE EVALUATION OF Ploy ,980
IMPACT-DAMAGED GRAPHITE FIBER COMPOSITE 6. Prrlolmlng O,ganlla,lon code
7. *“thorl,l 8. PerfOrmlng Organlrarlon RCPOll N” James H. Williams, Jr., and Norman R. Lampert NWle -
10. work ““ll NO. 9. Perlormlng Organllario” Name and *rMreu
Massachusetts Institute of Technology 7 I. Cantracr or oran, NO Cambridge, Massachusetts 02139 NSG-3210
13. Typ Of Repm, sod PPrmd Cuvcred 2. S~anroring .a.gency Name and Add,esI Contractor Report
National Aeronautics and Space Administration 14. semxormg Agency code Washington, D.C. 20546
5 SuDolemenlar” Nmel Final report. Project Manager. Ales Vary, Materials Division, NASA Lewis Research Center. Cleveland, Ohio 44135.
6. *br,laCt Unidirectional Hercules AS/3501-6 graphite fiber epoxy composites are subjected to repealed controlled low-velocity drop-weight impacts in the laminate direction. The degradation is ultrasonically monitored using through-thickness attenuation and a modified stress wave factor. SWF. There appear to be strong correlations behveen the number of drop-weight impacts. the residual tensile strength, the through-thickness attenuation and the SWF. The results are very encouraging with respect to the NDE potential of both of these ultrasonic parameters to provide strength characterizations in virgin as well as impact-damaged fiber composite structures.
1. Key wordr ,S”gges!rd by hthorlr,~ 18. Dirlrlbullon s,atemen, Ultrasonics; Ultrasonic attenuation; Stress Unclassified - unlimited waves; Nondestructive testing; Composites; STAR Category 38 Quality control and reliability
3. seCuri,y c,aui,. lo, Ihld repa.,, 20 securirv Clad (01 lhil page, 21. No. Of Pager 22 PmF Unclassified Unclassified 22 A02
Fat sale by the National TechnIcal Inio~m~l~on Swce. S~fqileld VU@W 22161 ,,m,,-Lanllr.l. !“1111