ultraviolet spectroscopy and remote … spectroscopy and remote sensing cedar workshop boulder co...
TRANSCRIPT
ULTRAVIOLET SPECTROSCOPY AND REMOTE SENSING
CEDAR WORKSHOP
Boulder CO
June 22, 1993
Robert R. MeierCode 7640
Naval Research Laboratory202-767-2773
OVERVIEW
The Ultraviolet Earth: Images and Spectra
Background and Early History
Present Status of UV Remote Sensing
o Global Imaging from High Altitude: DE
o Limb Imaging from Low Altitude
Inversion Techniques
Global Change and Climatological Databases
Summary

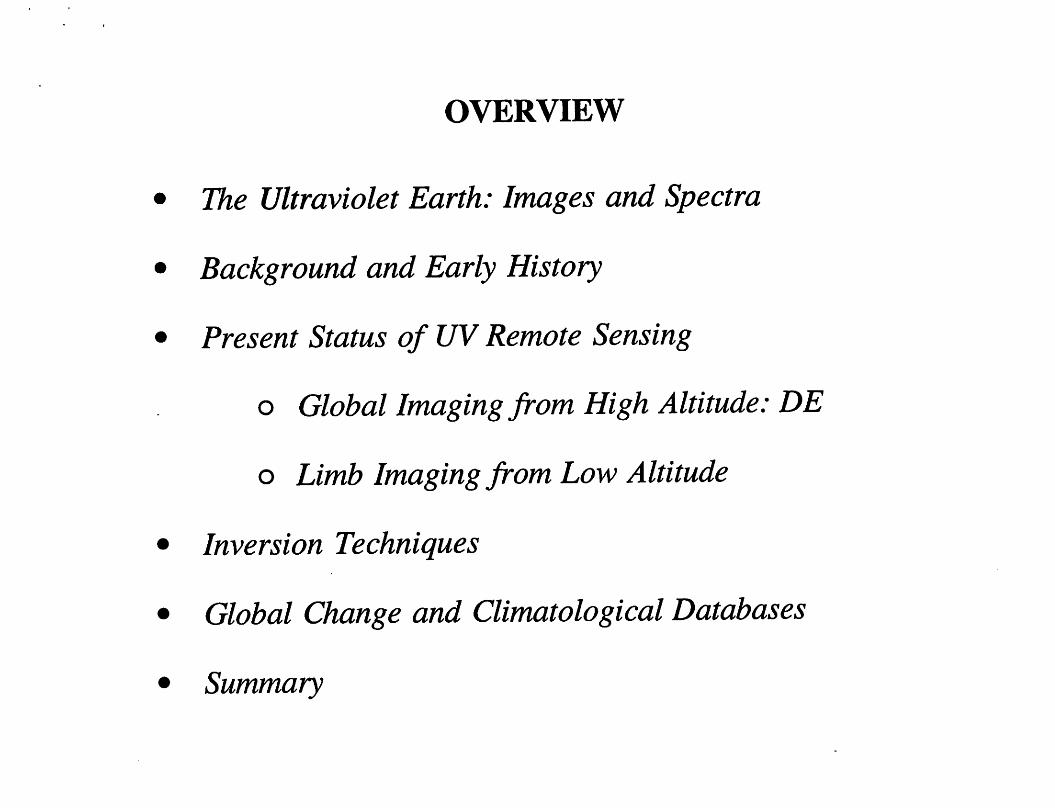
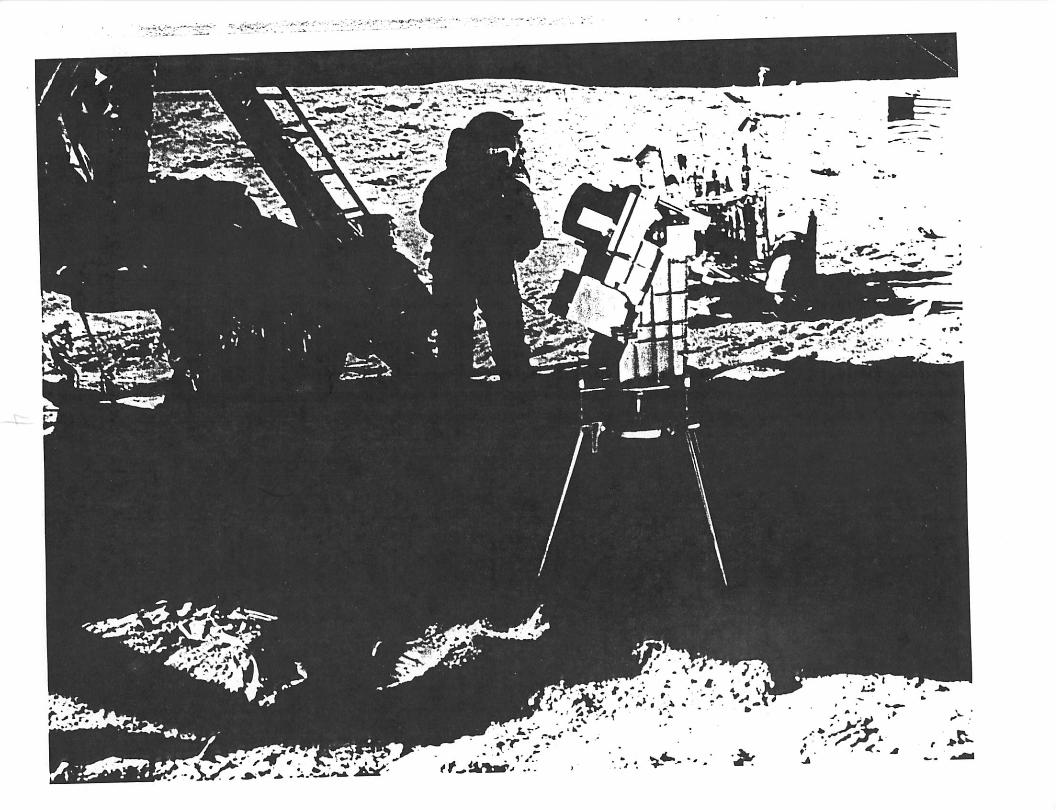
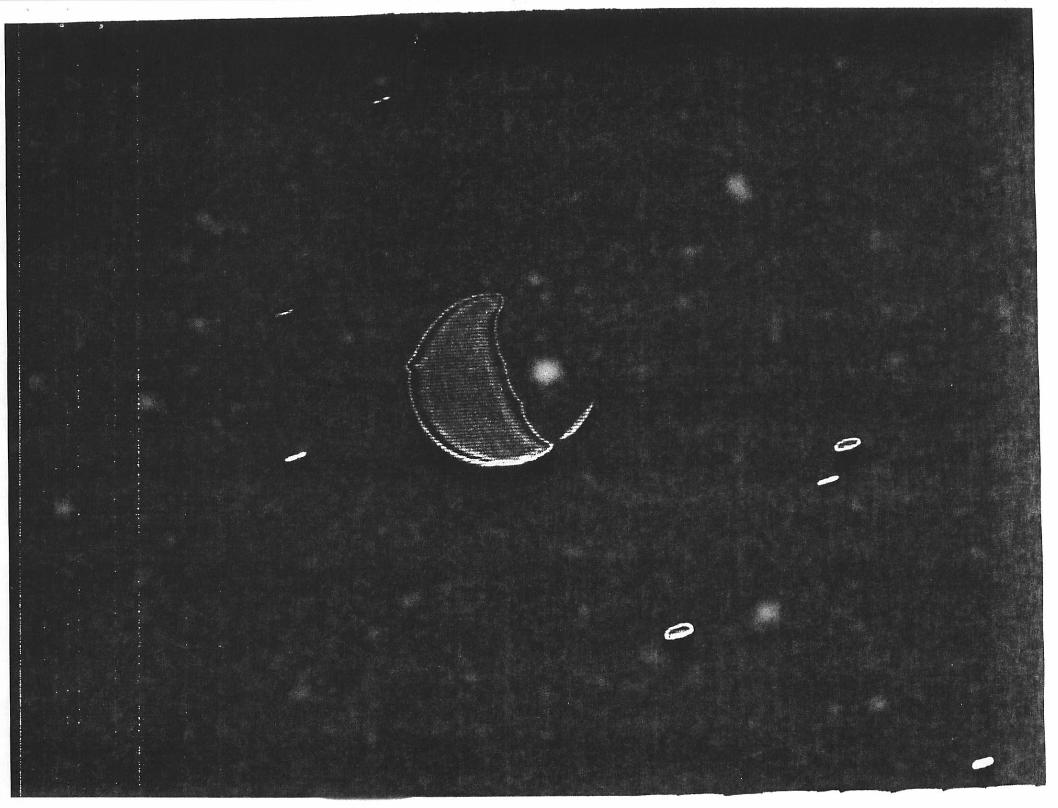
NRL FUV CAMERA ON APOLLO-16
Observations: 21-23 April 1972
Location: Lunar Surface
Sun-Earth-Moon Angle: 105 deg
Broadband Imagery:
• 1250 - 1600 A
• 1050 - 1600 A
o
Spectroscopy: 500 - 1600 A
•T-.-
1-1
T
xr-
<fl
''V
-^
Iii
T«•
*1?^
.'
'.*''•
'•:•"'''*^
'.-.
.ti"
h'''f¥''
\
•-?r
?1s^»T''
'...ft;
a;
\1
^.
'-^-
\

U. IOWA EXPERIMENT ON DYNAMICS EXPLORER (DE) - I
Launch: 3 August 1981
Initial orbit: 570 km x 3.65 Rg
Initial latitude of apogee: 78.T
Spin-scan imaging with about 12 min per image at apogee
• Photometer A: visible
• Photometer B: visible
• Photometer C: Far UV
with 12 filters each
Photometer instantaneous field-of-view 0.32°

o< 8
o
6CD
I—H
cd
HH
CO
^ 2iz;
§ 0
EARTH ULTRAVIOLET SPECTRA
0 2 absorption
0 abs.
H I 1
rn 1
0 I
0"-1—I—I
> I
MlM
n 1
V
MUV
0 2 absorption
NO
NIGHT
I I I I I I—I
DAY
0,
Code 7640
NRL
500 1000 1500 2000 2500 3000 3500 4000WAVELENGTH (8)

o
oo
0.0 -
0.6 _
0.4 _
0.2 -
800 650
i
UVLIM PASS - 121
v
V/ v:a
900 950 lOOO
WAVELENGTH (A)
1050 llOO

o
CO
oo
0.15
0.05 -
550
f600
UVLIM PASS —123
e i
650 700 750WAVELENGTH (A)
S
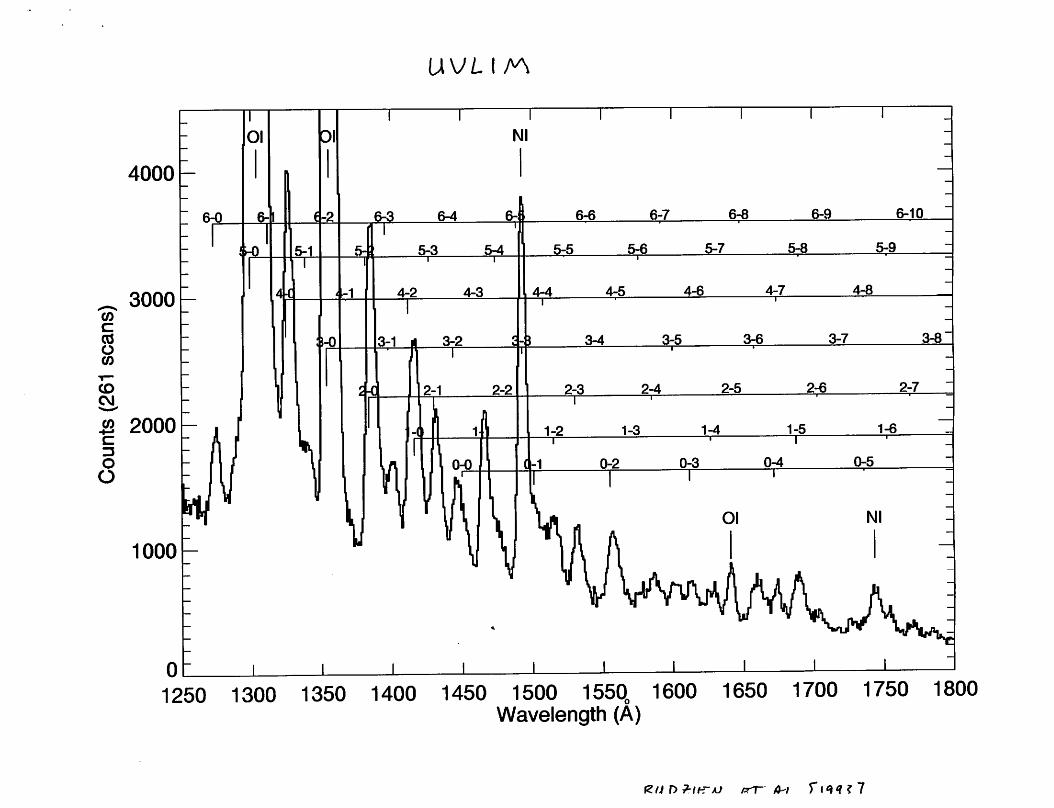
UVL I M
£2 2000
1250 1300 1350 1400 1450 1500 155Q. 1600 1650 1700 1750 1800Wavelength (A)
iz/jOP-itTAj prr

•<olO
\od)m
10
10
10
10
14
13
12
11
SOLAR IRRADIANCE
CN2
a 10o
V)
o-•-»
oX!fX
10Hell Hel HI HI 01II ' ' Solar max
Solar min10^ h
lO^h
10' -6
10
r-
I • • t I • I
UNIT OPTICAL DEPTH250
I I I I I
I 150
H 100
0
0
2 absorptionbands
Solar max
Solar min
ionization limits11 I I
1000 2000 3000
WAVELENGTH (A)4000
Heating of the Atnnosphere
by Variable Solar
Ultraviolet Radiation
300
250 -
200 -
150 -
100 z
50
NRL Codes 7640 & 7670
TEMPERATUREI I I I i I I I I I M I I I I I
Solarmin max
Thermosphere
Mesosphere
Stratosphere
TroposphereI I I I 1 ri I I 1,1-1 I 1 I I I I 1 I I 10 I I I I I I I itkI I I I 1I I I I I I I I I I I I I I t I
100 300 500 700 900 1100 1300
TEMPERATURE (K)
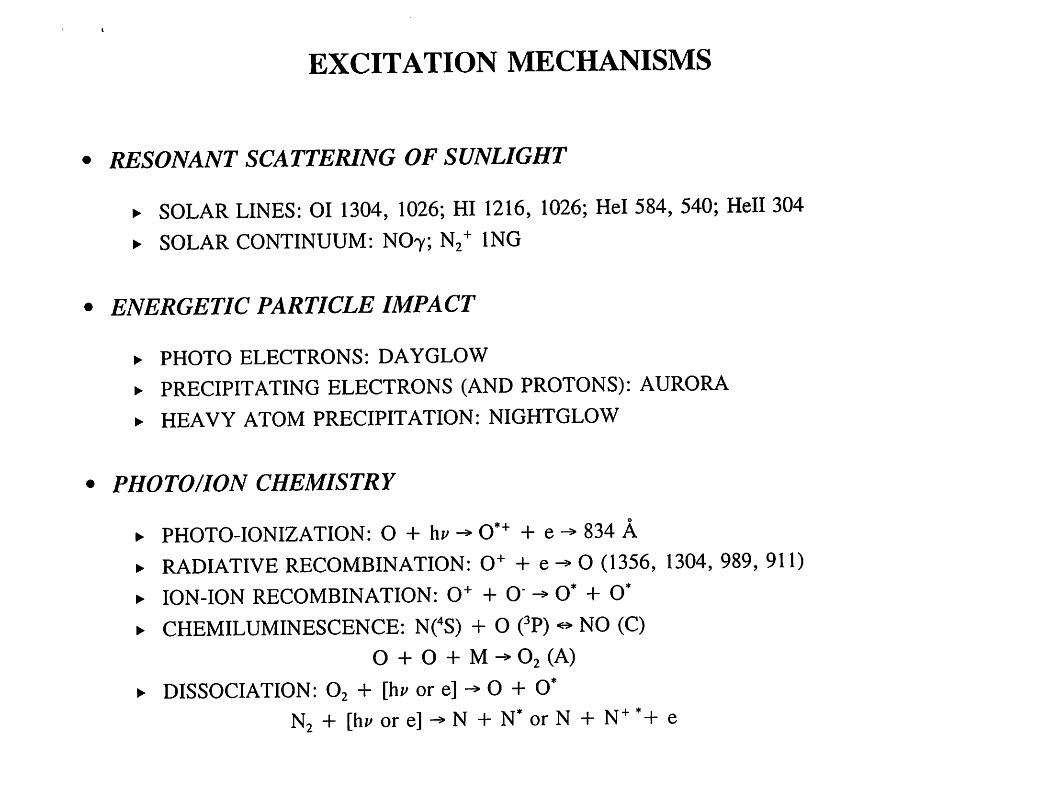
EXCITATION MECHANISMS
RESONANT SCATTERING OF SUNLIGHT
• SOLAR LINES: 01 1304, 1026; HI 1216, 1026; Hel 584, 540; Hell 304• SOLAR CONTINUUM: NO7; N2^ ING
ENERGETIC PARTICLE IMPACT
• PHOTO ELECTRONS: DAYGLOW
• PRECIPITATING ELECTRONS (AND PROTONS): AURORA
• HEAVY ATOM PRECIPITATION: NIGHTGLOW
PHOTO/ION CHEMISTRY
• PHOTO-IONIZATION: O + hi- ^ 0*+ + e 834 A• RADIATIVE RECOMBINATION: O"" + e ^ O (1356, 1304, 989, 911)
• ION-ION RECOMBINATION: O"" + O" ^ O* + O*
• CHEMILUMINESCENCE: N^S) + O (^P) « NO (C)O + O + M ^ O2 (A)
• DISSOCIATION: O2 + [hp or e] O + O*N2 + [hi* or e] N + N* or N + N"*" *+ e

1946
1949
1955
1960, 1963
EARLY HISTORY OF UV SPECTROSCOPY
Sun observed to 2100 A,O3 observed to 55 km
O2 extinction observed
H Lyman a discovered
01 & N, LBH discovered
Baum et al. [1946]
Friedman et al. [1951]
Byram et al. [1961]
Fastie et al. [1961, 1964]
Other early contributors: T.M. Donahue, R. Tousey, J.W. Chamberlain, J. Brandt, F.S. Johnson, I.S.Shklovsky, C. Barth, V.G.Kurt, S.A. Kaplan

VERY LONG MATURATION TIME FOR ROUTINE UV
REMOTE SENSING MISSIONS
because:
Reliable cross sections, oscillator strengths... required
High sensitivity imagers and spectrographs needed
Science models had to be developed
Retrieval algorithms necessary for parameter extraction

GLOBAL IMAGING MODEL
AIRGLOW MODEL
• MSIS-86 SPECIFIES GLOBAL CONCENTRATIONS
• HINTEREGGER SOLAR EUV FLUX ALGORITHM
• STRICKLAND AND MEIER PHOTOELECTRON MODEL
• RADL\TIVE TRANSPORT MODELS
- OI 1356: Strickland and Anderson
- 01 1304: Gladstone or Meier
IMAGING MODEL
• MODEL DESCRIBED BY: Strickland, Cox, Barnes, Paxton, Meier, Thonnard
-accepted in Applied Optics [1993]
• USES GEOGRAPHIC GRID WITH VARIABLE SPACING IN SOLAR ZENITH AND
AZIMUTH ANGLES
• PRE-COMPUTES INTENSITIES VS LOOK ANGLE AT EACH GRID POINT ANDINTERPOLATES TO DYNAMICS EXPLORER LOOK ANGLES
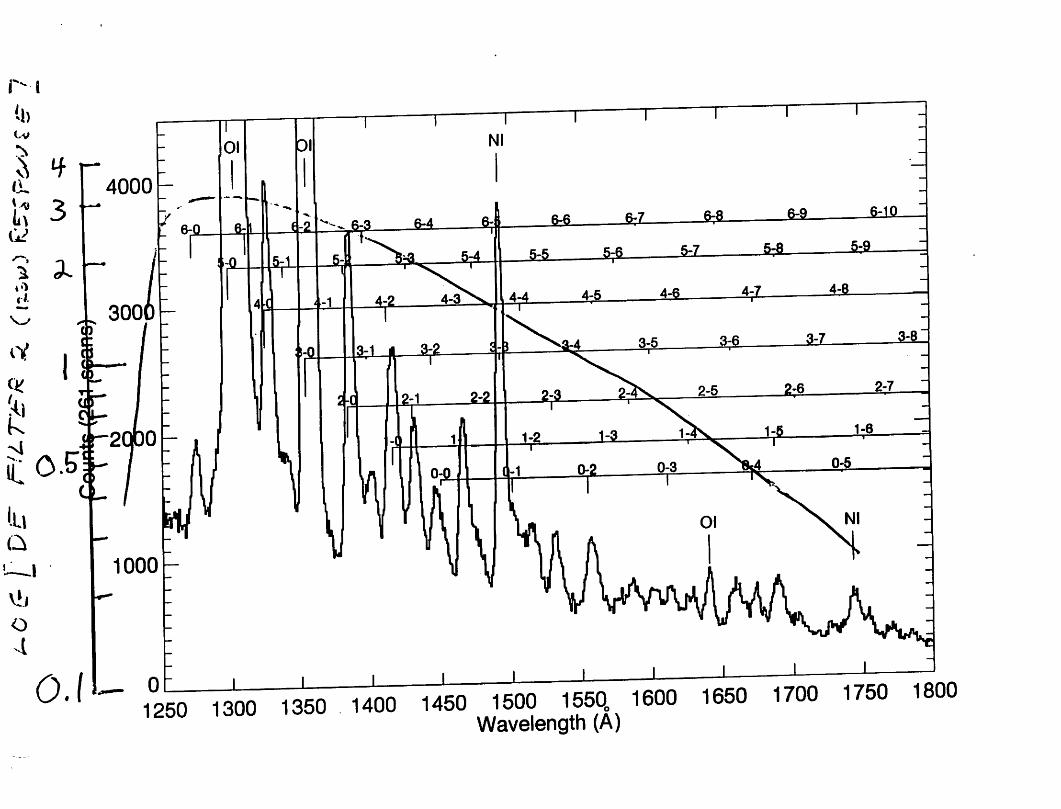
1250 1300 1350 1400 1450 1500 1550„ 1600 1650 1700 1750 1800Wavelength (A)
01:^600105 11; Hill a..M,'
•:*ri
% ,I 4 •< I
ur
ni;i(UK}ior)i i; \\o^\v\
ur
1.0
(1 a
0.0
0,:>
1 0
0 n
0.5
0 M
tn^fuuno:")! !: DuIm Mod'-i.•♦'Tr'A'
/:f
i V: ^Ik:V
n«/.:l •• V
IIV
1 :>
1 0
600
Bp
2
400 -
200 -
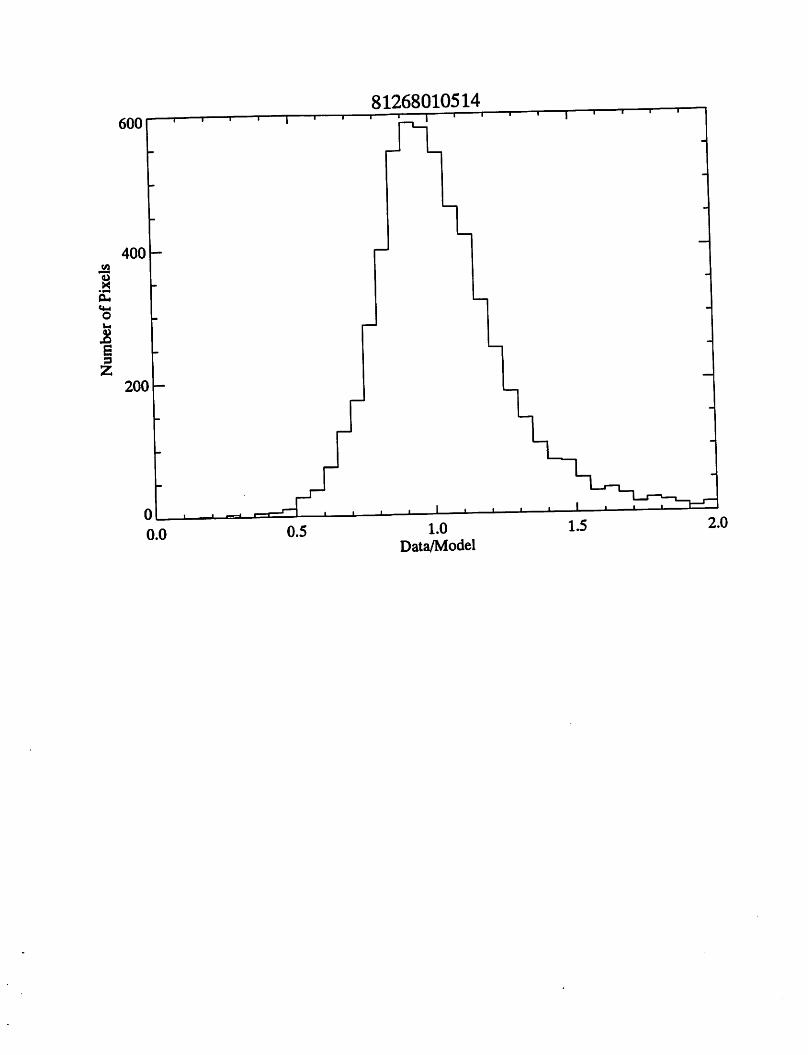
81268010514
1.0Data/Model
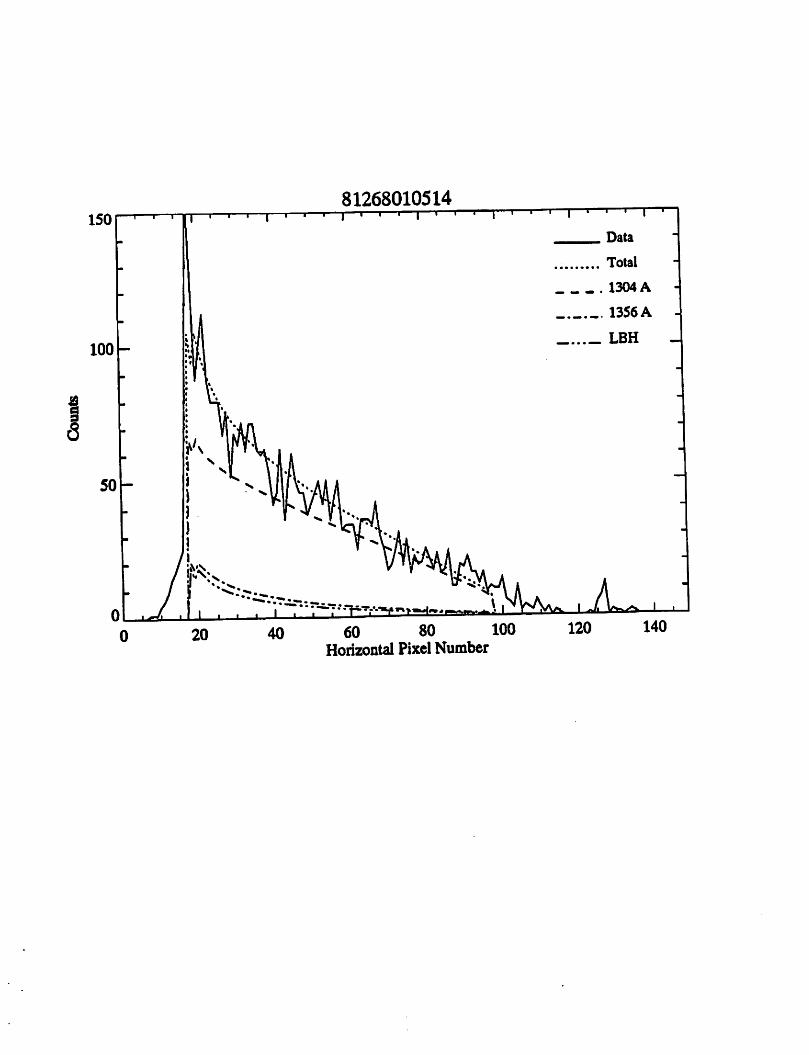
81268010514
60 80 100Horizontal Pixel Number
1304A
1356 A
LBH -
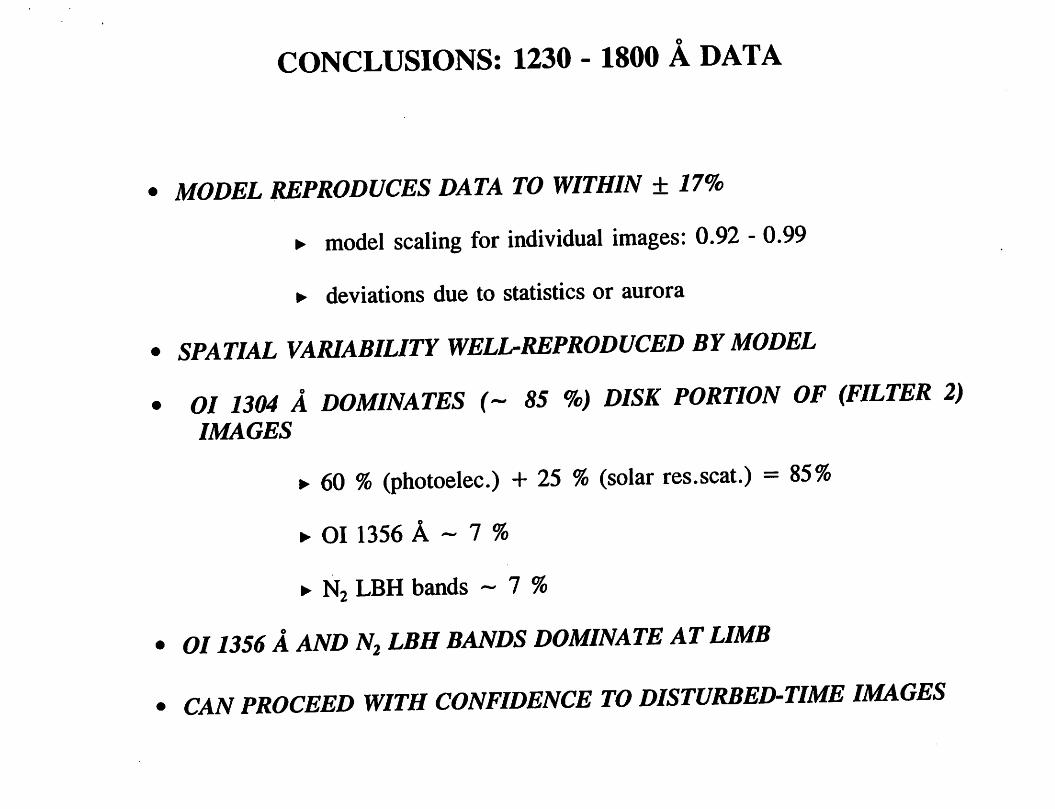
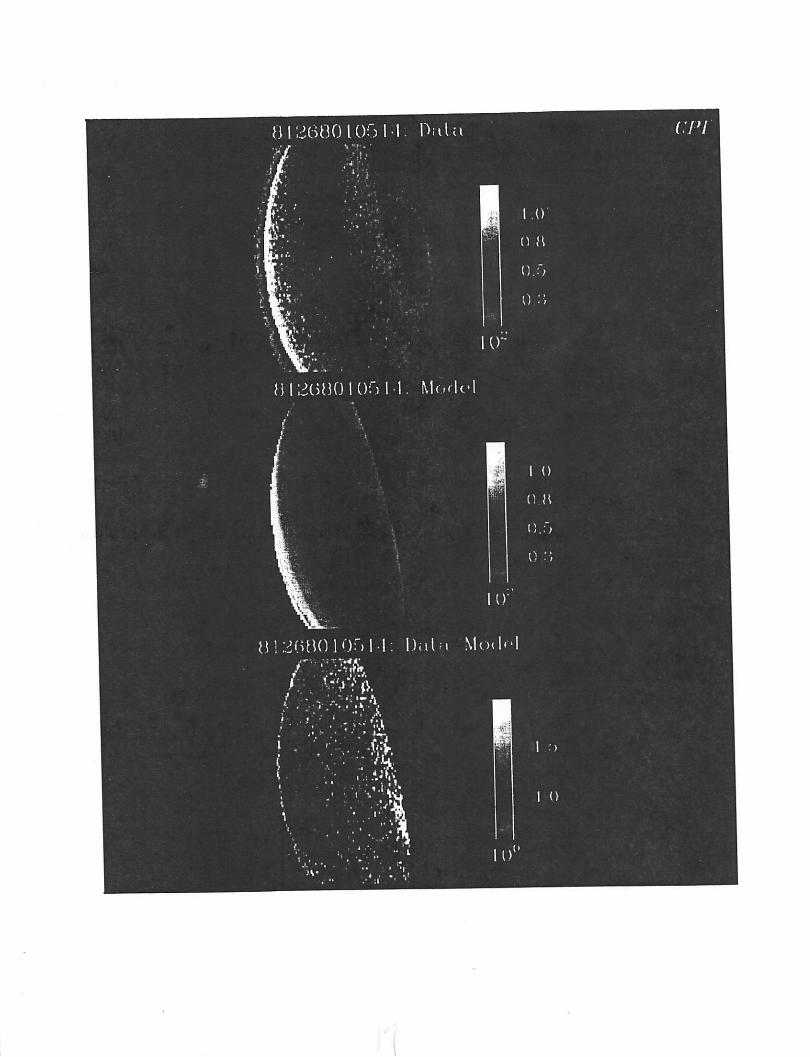
CONCLUSIONS: 1230 - 1800 A DATA
» MODEL REPRODUCES DATA TO WITHIN ± 17%
• model scaling for individual images: 0.92 - 0.99
• deviations due to statistics or aurora
• SPATIAL VARIABILITY WELL-REPRODUCED BY MODEL
. 01 1304 A DOMINATES 85 %) DISK PORTION OF (FILTER 2)IMAGES
• 60 %(photoelec.) + 25 %(solar res.scat.) = 85%
• 01 1356 k ~ 1 %
• N2 LBH bands ~ 7 %
• 011356 AAND N^ LBH BANDS DOMINATE AT LIMB
• CAN PROCEED WITH CONFIDENCE TO DISTURBED-TIME IMAGES
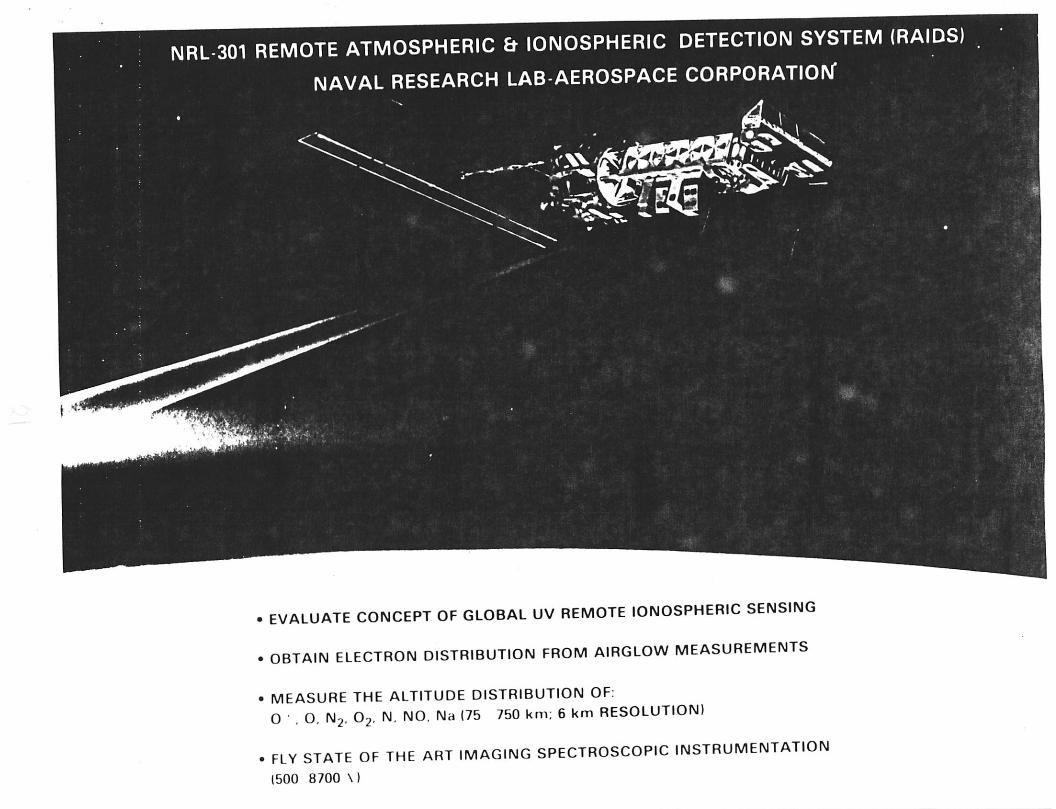
IMRL-301 REMOTE ATMOSPHERIC &IONOSPHERIC DETECTION SYSTEM (RAIDS)NAVAL RESEARCH LAB-AEROSPACE CORPORATION"
• EVALUATE CONCEPT OF GLOBAL UV REMOTE IONOSPHERIC SENSING
• OBTAIN ELECTRON DISTRIBUTION FROM AIRGLOW MEASUREMENTS
• MEASURE THE ALTITUDE DISTRIBUTION OF:O•. O. N2. O2, N, NO. Na (75 750 km: 6km RESOLUTION)
. FLY STATE OF THE ART IMAGING SPECTROSCOPIC INSTRUMENTATION(500 8700 \)
400
350
^ 300
Q 250
200 -
150
100
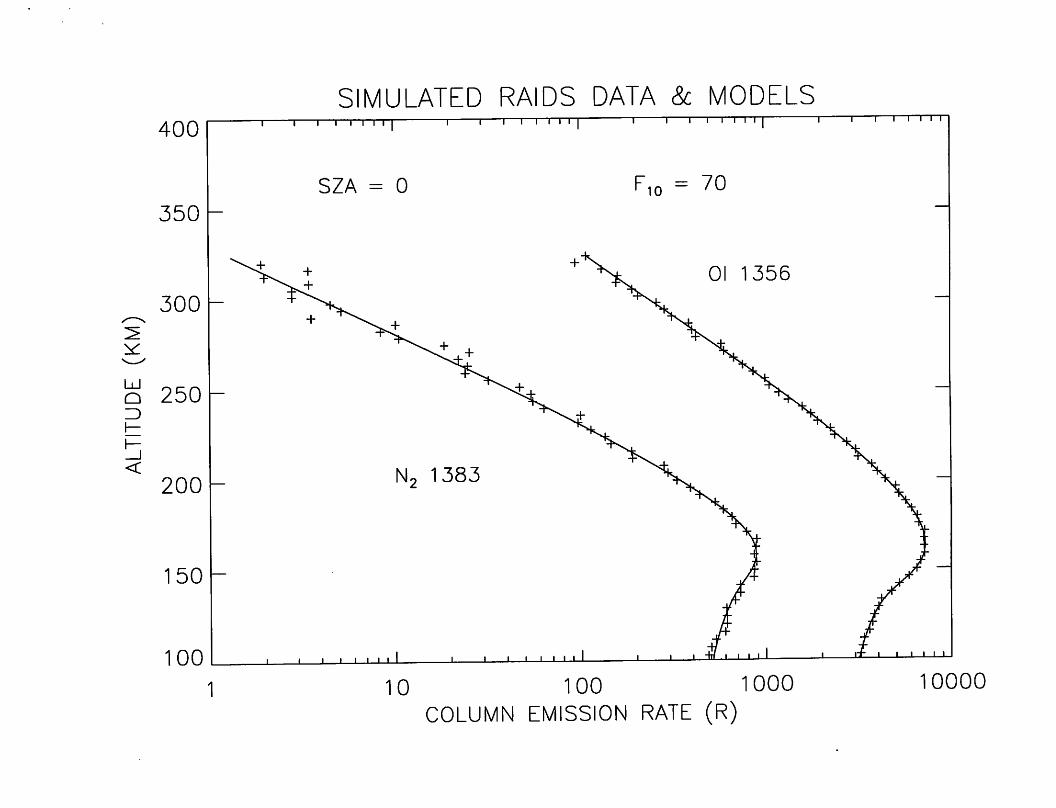
SIMULATED RAIDS DATA & MODELS
SZA = 0 F,o = 70
10 100 1000COLUMN EMISSION RATE (R)
I I I I.
10000
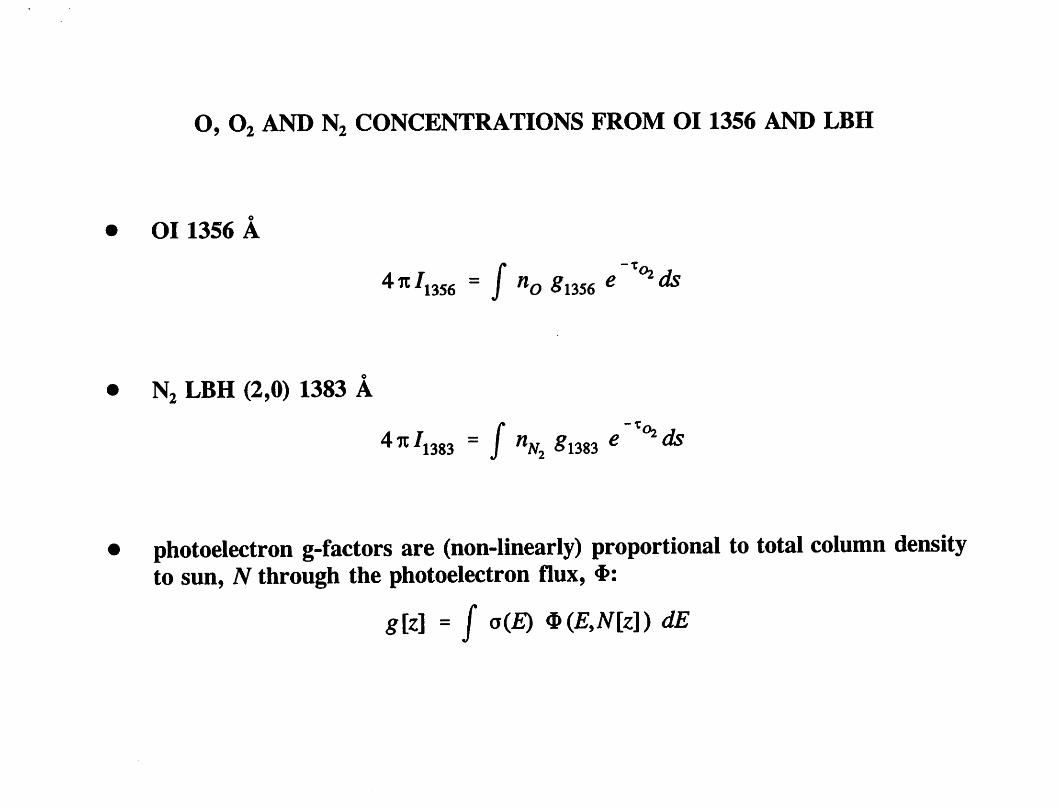
O, O2 AND N2 CONCENTRATIONS FROM OI1356 AND LBH
01 1356 A
4^^356 =/ "O ^1356 «
Nj LBH (2,0) 1383 A
'̂ ^^383 " / "aTj ^1383 ^ ^
photoelectron g-factors are (non-linearly) proportional to total column densityto sun, N through the photoelectron flux, 4>:
g{z\ =/ a(£) ^(EMz]) dE
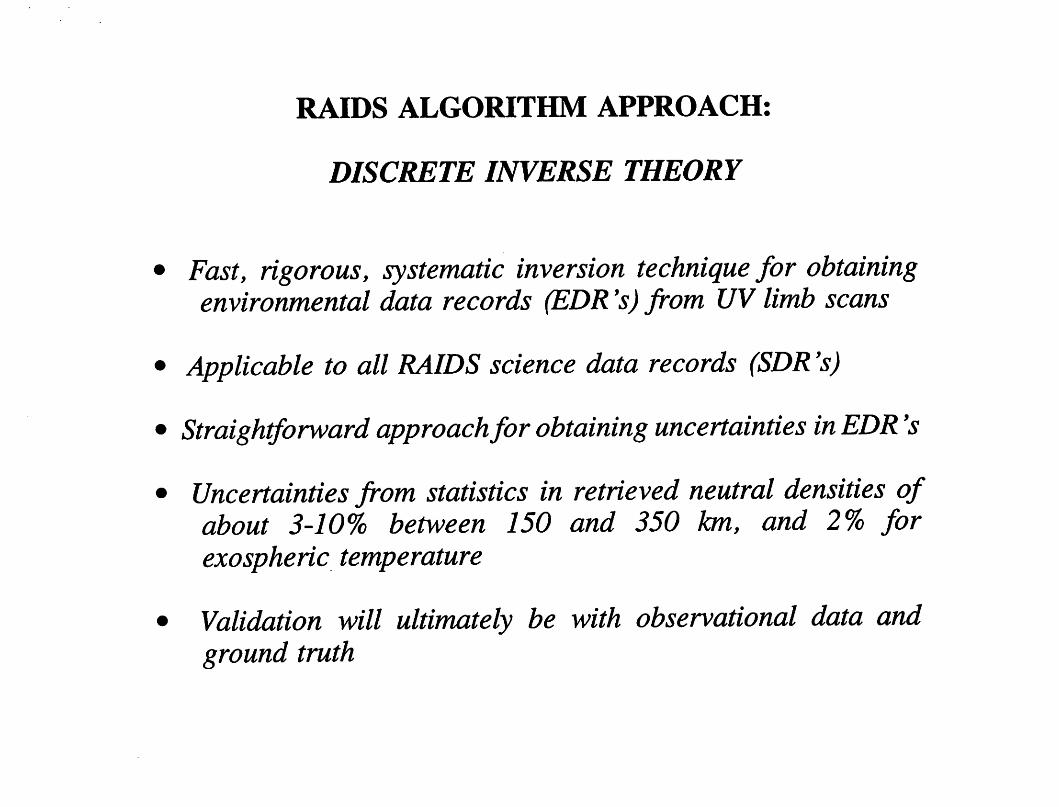
RAroS ALGORITHM APPROACH;
DISCRETE INVERSE THEORY
Fast, rigorous, systematic inversion technique for obtainingenvironmental data records (EDR's) from UV limb scans
Applicable to all RAIDS science data records (SDR's)
Straightforward approachfor obtaining uncertainties in EDR's
Uncertainties from statistics in retrieved neutral densities ofabout 3-10% between 150 and 350 km, and 2% forexospheric temperature
Validation will ultimately be with observational data andground truth
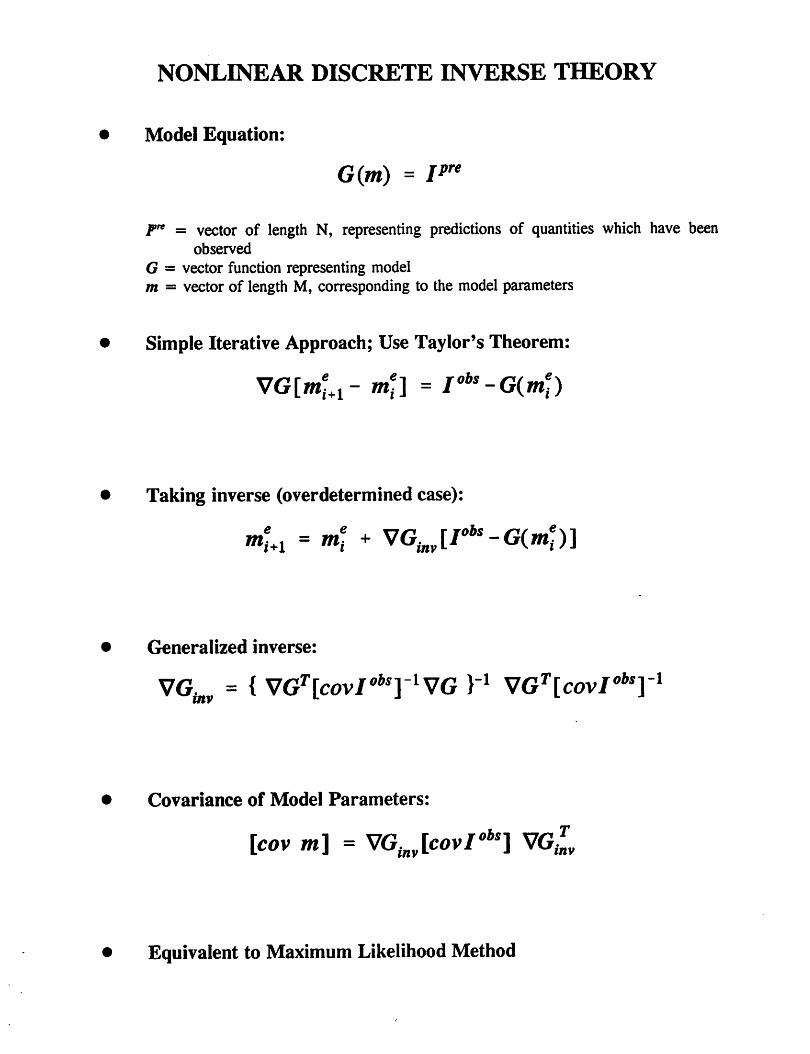
NONLDJEAR DISCRETE INVERSE THEORY
Model Equation:
G(m) = P''
P" = vector of length N, representing predictions of quantities which have beenobserved
G = vector function representing modelm = vector of length M, corresponding to the model parameters
Simple Iterative Approach; Use Taylor's Theorem:
• Taking inverse (overdetermined case):
mU - m] »
Generalized inverse:
^invVG. = { VG^Ecov/'̂ ^J-^VG VG '̂Ecov/"®^]-!
Covariance of Model Parameters:
ohsi Tin ^[cov m] = VG.^^icovI'""] VG^,
• Equivalent to Maximum Likelihood Method
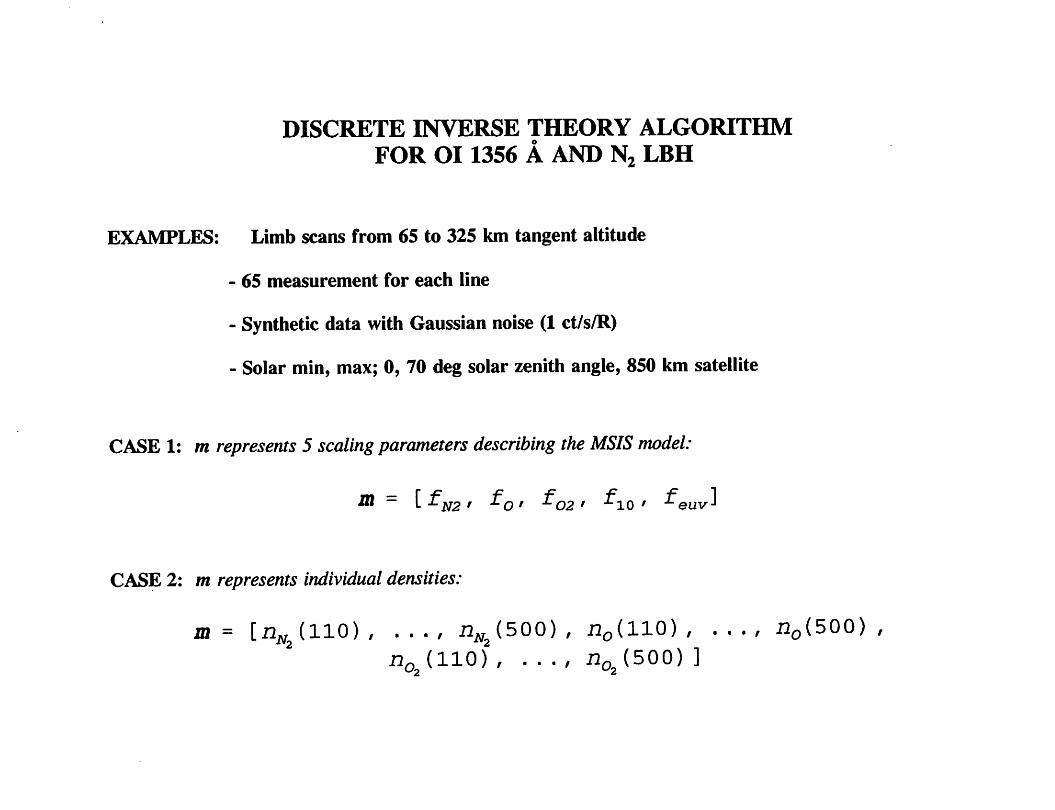
DISCRETE INVERSE THEORY ALGORITHMFOR OI 1356 A AND N2 LBH
EXAMPLES: Limb scans from 65 to 325 km tangent altitude
- 65 measurement for each line
- Synthetic data with Gaussian noise (1 ct/s/R)
- Solar min, max; 0, 70 deg solar zenith angle, 850 km satellite
CASE 1: m represents 5 scaling parameters describing the MSIS model:
Itt — [ fjj2 ' ' ^02 ' ^10 ' ^euv^
CASE 2: m represents individual densities:
jn = [72^^(110) , . . . , il^^(500) , rZodlO) , . . . , i3o(500) ,Hq (110) , . . . , IIq (500) ]
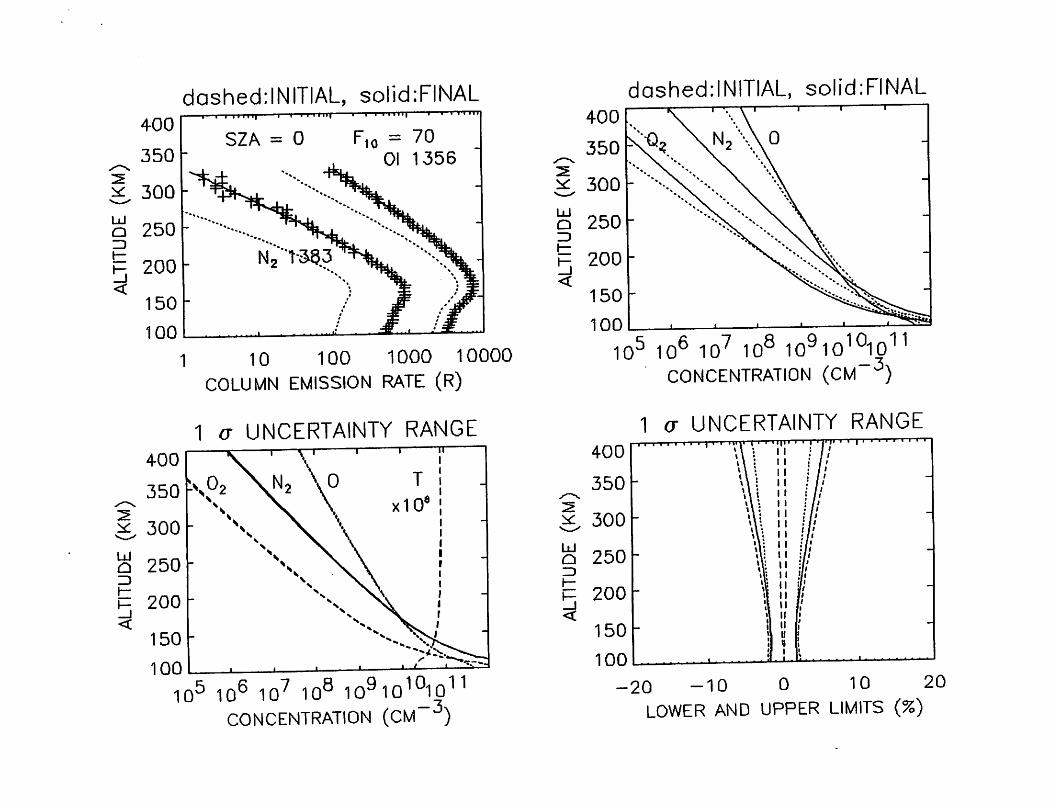
dashecl:INITIAL, solid:FINAL
SZA = 001 1356
300
Q 250
LUQZD
1 10 100 1000 10000COLUMN EMISSION RATE (R)
1 (T UNCERTAINTY RANGE+00
350
300
\02 ^\ \
T
x10'
1
250 -
-
200 -
N X. *
"v. ^X
*-
150
100 1 1 1 '—. /
10^ 10^ 10^ 10® lO^IO^^O^^CONCENTRATION (CM~^)
dashed:INITIAL, solid;FINAL
a 250
UJoZD
10^ 10^ 10^ 10® 10^10^^10^^CONCENTRATION (CM~^)
1 a UNCERTAINTY RANGE
-20 -10 0 10 20LOWER AND UPPER LIMITS (%)

I 300
a 250
o 2503
I 300
a 2503
MSM & CSM SOLUTIONS: F,« = 70
N,
10^0 10^^
10' 10- 10® , io'°CONCENTRATION (CM
± 1 a UNCERTAINTY RANGE
K
c10 0 10
LOWER AND UPPER LIMITS {%)
* ^
490
-wo
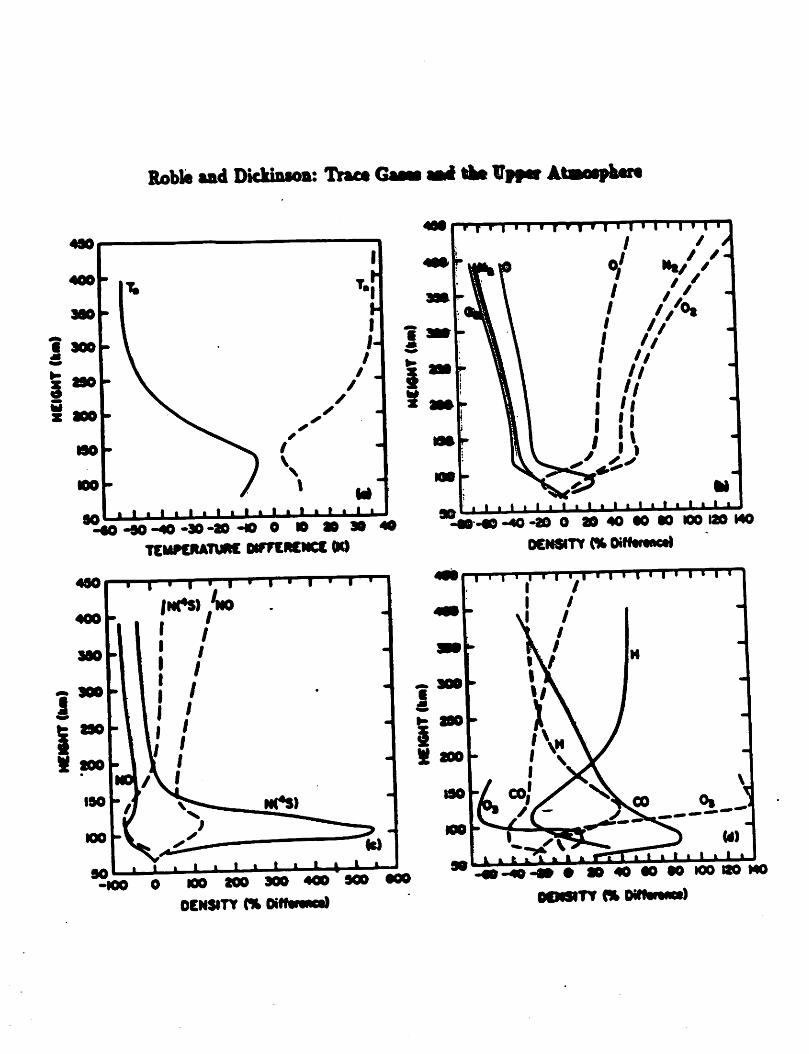
Robfe aad DkkiBMm: TkM* GaM Mi< At VtVV AtaMptot
-90*20 HO 0 0 » 2
TCHraUTVUC MfrCRCNCC CKI
no too 900 400
OCNSITY (% OilfMMll
1It
-€0 *40 *20 0 2D40tOtOIOOI20l40OCNSITY (% OiHtrtactl
• ao40«oMiooaoMO
ecMsrrr (» oifiMM*)
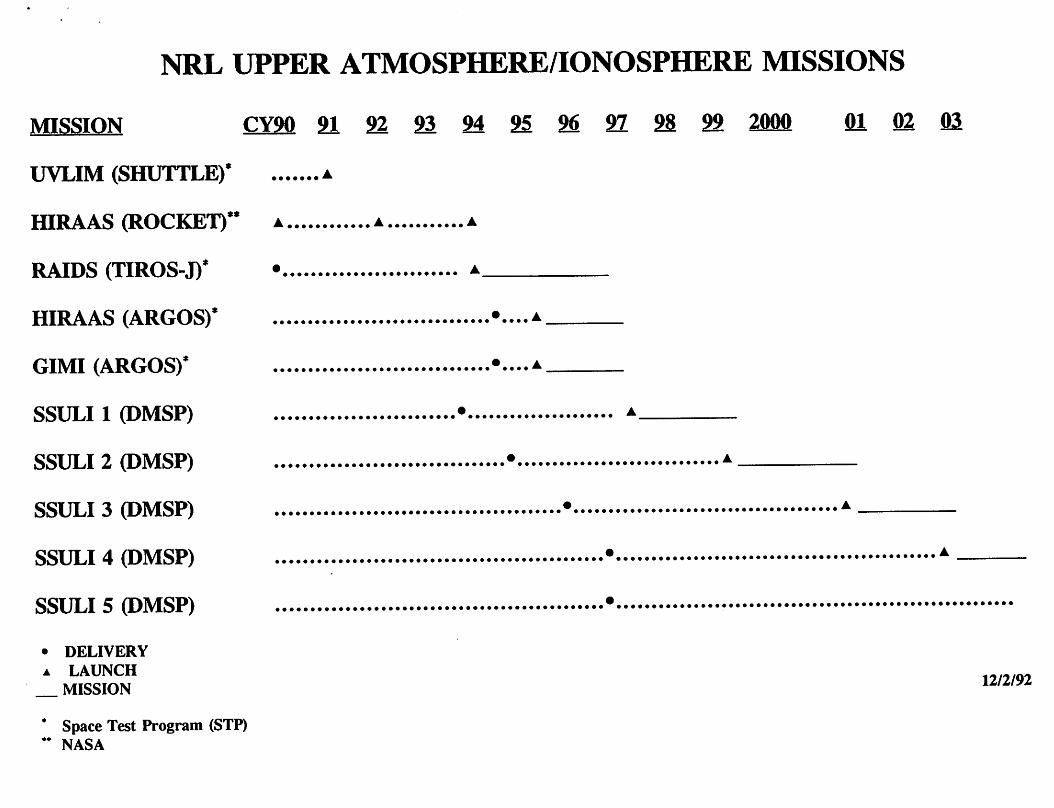
NRL UPPER ATMOSPHERE/IONOSPHERE MISSIONS
MISSION CY90 212292242S262798222QQfi 0102^
UVLIM (SHUTTLE)' a
HIRAAS (ROCKET)" a a a
RAIDS (TIROS-J)* • A
HIRAAS (ARGOS)* •-..a
GIMI (ARGOS)* •.. .A
SSULI I (DMSP) • ^
SSULI 2 (DMSP) • ^
SSULI 3 (DMSP) • ^
SSULI 4 (DMSP) • ^
SSULI 5 (DMSP) •
• DELIVERY
A LAUNCHMISSION
Space Test Program (STP)•• NASA

SUMMARY
UV remote sensing has evolved sufficiently that accurate,routine observations of the upper atmosphere (andionosphere) are possible on a global scale
Non-linear inversion methods show greatpromisefor retrievalof concentrations from airglow observations
Validation is underway with various data sets
DoD missions shouldprovide continuous observations over 1-2 solar cycles, beginning next year with RAIDS