remote chemical sensing using nuclear spectroscopy · clbe001-ess2e november 11, 2006 4:43 remote...
TRANSCRIPT

CLBE001-ESS2E November 11, 2006 4:43
100-C 25-C 50-C 75-C C+M 50-C+M C+Y 50-C+Y M+Y 50-M+Y 100-M 25-M 50-M 75-M 100-Y 25-Y 50-Y 75-Y 100-K 25-K 25-19-19 50-K 50-40-40 75-K 75-64-64
CHAPTER 41
Remote ChemicalSensing Using
Nuclear Spectroscopy
Thomas H. PrettymanLos Alamos National Laboratory,
Los Alamos, New Mexico
1. Introduction 5. Science
2. Origin of gamma rays and neutrons 6. Future Prospects
3. Instrumentation Bibliography
4. Missions
1. Introduction
Nuclear spectroscopy techniques are used to determinethe elemental composition of planetary surfaces and atmo-spheres. Radiation, including gamma rays and neutrons, isproduced steadily by cosmic ray bombardment of the sur-faces and atmospheres of planetary bodies and by the decayof radionuclides within the solid surface. The leakage fluxof gamma rays and neutrons contains information about theabundance of major elements, selected trace elements, andlight elements such as H and C. Gamma rays and neutronscan be measured from high altitudes (less than a plane-tary radius), enabling global mapping of elemental com-position by an orbiting spacecraft. Radiation that escapesinto space originates from shallow depths (<1 m within thesolid surface). Consequently, nuclear spectroscopy is com-plementary to other surface mapping techniques, such asreflectance spectroscopy, which is used to determine themineralogy of planetary surfaces.
The main benefit of gamma ray and neutron spec-troscopy is the ability to reliably identify elements importantto planetary geochemistry and to accurately determine theirabundance. This information can be combined with otherremote sensing data, including surface thermal inertia andmineralogy, to investigate many aspects of planetary sci-ence. This article provides an overview of this burgeoning
area of remote sensing. The origin of gamma rays and neu-trons, their information content, measurement techniques,and scientific results from the Lunar Prospector and MarsOdyssey missions are described.
Nuclear reactions and radioactive decay result in theemission of gamma rays with discrete energies, which pro-vide a fingerprint that can uniquely identify specific ele-ments in the surface. Depending on the composition of thesurface, the abundance of major rock-forming elements,such as O, Mg, Al, Si, Cl, Ca, Ti, Fe, and radioactive traceelements, such as K, Th, and U can be determined frommeasurements of the gamma ray spectrum. The geochem-ical data provided by nuclear spectroscopy can be used toinvestigate a wide range of topics, including the following:
• Determining bulk composition for comparative stud-ies of planetary geochemistry and the investigation oftheories of planetary origins and evolution;
• Constraining planetary structure and differentiationprocesses by measuring large-scale stratigraphic vari-ations within impact basins that probe the crust andmantle;
• Characterization of regional scale geological units,such as lunar mare and highlands;
• Estimating the global heat balance by measuring theabundance of radioisotopes such as K, Th, and U;
Encyclopedia of the Solar System 2e C©2007 by Academic Press. All rights of reproduction in any form reserved. 765

CLBE001-ESS2E November 11, 2006 4:43
766 Encyclopedia of the Solar System
• Measuring the ratio of the volatile element K to therefractory element Th to determine the depletion ofvolatile elements in the source material from whichplanets were accreted and to estimate the volatile in-ventory of the terrestrial planets.
Neutrons are produced by cosmic ray interactions andare sensitive to the presence of light elements within plan-etary surfaces and atmospheres, including H, C, and N,which are the major constituents of ices as well as elementssuch as Gd and Sm, which are strong neutron absorbers. Inaddition, alpha particles are produced by radioactive decayof heavy elements such as U and Th and have been usedto identify radon emissions from the lunar surface, possiblyassociated with tectonic activity.
Close proximity to the planetary body is needed to mea-sure neutrons and gamma rays because their productionrate is relatively low. Unlike optical techniques, distancescloser than a few hundred kilometers are needed in order toobtain a strong signal. In addition, sensors used for gammaray and neutron spectroscopy are generally insensitive to in-cident direction. Consequently, spatial resolution dependson orbital altitude, and higher resolution can be achieved bymoving closer to the planet. Regional scale measurementsare generally achieved using nuclear spectroscopy, in con-trast to the meter to kilometer scale generally achieved byoptical remote sensing methods.
Measurements of the solid surface are not possible forplanets with thick atmospheres, including the Earth, Venus,and outer planets other than Pluto. Variations in atmo-spheric composition can be measured and have importantimplications to understanding seasonal weather patterns.Gamma ray and neutron spectroscopy can be applied toinvestigate the surfaces of planets with thin atmospheres,such as Mercury, Mars, the Moon, comets, and asteroids.In principle, the satellites of Jupiter and Saturn could beinvestigated using nuclear spectroscopy; however, the in-tense radiation environment within the magnetospheres ofthese planets may be a limiting factor.
X-ray spectroscopy can also be used to determine ele-mental composition and is complementary to nuclear spec-troscopy. Intense bursts of x-rays produced by solar flarescause planetary surfaces to fluoresce. The characteristicx-rays that are emitted can be analyzed to determine theabundance of rock-forming elements such as Fe and Mg.In contrast to nuclear spectroscopy, surface coverage maybe limited, especially when solar activity is low; however,high statistical precision for elemental abundances can beachieved during flares. The depth sensitivity of x-ray andnuclear spectroscopy is very different. X-rays are producedmuch closer to the surface than gamma rays and neutrons.Missions that have used x-ray spectroscopy include Apolloand NEAR [see Near-Earth Asteroids], and SMART-1. TheMESSENGER mission will use both x-ray and nuclearspectrometers to determine the elemental composition of
Mercury, and an x-ray spectrometer will be on the payloadof Chandrayaan-1, the Indian Space Research Organiza-tion’s first mission to the Moon.
2. Origin of Gamma Rays and Neutrons
Neutrons and gamma rays are produced by the interac-tion of energetic particles and cosmic rays with planetarysurfaces and atmospheres. While solar energetic particleevents can produce copious gamma rays and neutrons, wewill focus our attention on galactic cosmic rays, whichare somewhat higher in energy, penetrate more deeply intothe surface, and have a constant flux over relatively long pe-riods of time. Gamma rays are also produced steadily bythe decay of radioactive elements such as K, Th, and U. Adiagram of production and transport processes for neutronsand gamma rays is shown in Fig. 1.
2.1 Galactic Cosmic Rays
Galactic cosmic rays consist primarily of protons with an av-erage flux of about 4 protons per cm2 per s and with a widedistribution of energies extending to many GeV (Fig. 2; in-set). The flux and energy distribution of galactic protonsreaching a planetary surface is modulated by the solar cy-cle [see The Sun]. Sunspot counts are a measure of so-lar activity (Fig. 2). Higher fluxes of galactic protons areobserved during periods of low solar activity. In addition,more low-energy protons penetrate the heliosphere duringsolar minimum, resulting in a shift in the population to-wards lower energies. The flux and energy distribution ofthe cosmic rays are controlling factors in the productionrate, energy distribution, and depth of production of neu-trons and gamma rays. For example, the neutron countingrates at MacMurdo Station in Antarctica are modulated bythe solar cycle as shown in Fig. 2.
The GeV-scale energy of galactic protons can be com-pared to the relatively small binding energy of protons andneutrons in the nucleus (for example, 8.8 MeV/nucleon for56Fe). High energy interactions with nuclei can be modeledas an intranuclear cascade, in which the energy of the inci-dent particle is transferred to the nucleons, resulting in theemission of secondary particles by spallation, followed byevaporation, and subsequent de-excitation of the residualnuclei. The secondary particles, which include neutrons andprotons, undergo additional reactions with nuclei until theinitial energy of the cosmic ray is absorbed by the medium.Since most of the gamma ray production is caused by re-actions with neutrons, we will focus our attention on howneutrons slow down in matter.
2.2 Fundamentals of Neutron Moderation
Neutrons transfer their energy to the medium through suc-cessive interactions with nuclei and are eventually absorbed

CLBE001-ESS2E November 11, 2006 4:43
Remote Chemical Sensing Using Nuclear Spectroscopy 767
FIGURE 1 Overview of the production of gamma rays and neutrons by cosmic ray interactionsand radioactive decay. Fast neutrons produced by high-energy cosmic ray interactions undergoinelastic collisions, resulting in the production of characteristic gamma rays that can be measuredfrom orbit. Neutrons lose energy through successive collisions with nuclei and approach thermalequilibrium with the surface. Thermal and epithermal neutrons provide information aboutthe abundance of light elements, such as H and C, and strong thermal neutron absorbers, suchas Gd and Sm. Fast neutrons are sensitive to the average atomic mass of the surface. Gamma raysproduced by neutron capture and inelastic scattering can be used to measure the abundance ofrock-forming elements, such as O and Fe. Gamma rays are also produced by the decay of long-livedradioisotopes, including K, Th, and U. While cosmic rays can penetrate deep into the surface,the radiation escaping the surface originates from shallow depths, generally less than 100 g/cm2.
in the surface or atmosphere or escape into space. Theprocess of slowing-down via repeated collisions is knownas “moderation.” There are three general interaction cate-gories that are important in the context of planetary science:(1) nonelastic reactions, in which the incident neutron isabsorbed, forming a compound nucleus, which decays byemitting one or more neutrons followed by the emissionof gamma rays; (2) elastic scattering, a process that can becompared to billiard ball collisions for which kinetic energyis conserved; (3) neutron radiative capture, in which theneutron is absorbed and gamma rays are emitted.
The probability that a neutron will interact with a nu-cleus can be expressed in terms of an effective area of thetarget nucleus, known as the microscopic cross section, σ ,which depends on the energy of the neutron (E) and has
units of barns. One barn is 10−24 cm2. Microscopic crosssections for natural Fe are shown, for example, in Fig. 3for radiative capture, elastic scattering, and inelastic scat-tering. Inelastic scattering occurs above a threshold deter-mined by the energy required to produce the first excitedstate of the compound nucleus. The elastic scattering crosssection is constant over a wide range of energies. The crosssection for radiative capture usually varies as E−1/2. Con-sequently, radiative capture is important at low energies.The sharp peaks that appear at high energy (greater than100 eV) are resonances associated with the nuclear struc-ture of the Fe isotopes. Neutron inelastic scattering is animportant energy loss mechanism at high energies (greaterthan about 0.5 MeV for most isotopes of interest to planetaryscience).

CLBE001-ESS2E November 11, 2006 4:43
FIGURE 2 The variation of neutron counting rates (with units of hundreds of counts per hour)measured at McMurdo Station in Antarctica as a function of time (neutron monitors of the BartolResearch Institute are supported by NSF grant ATM-0000315). Monthly sunspot counts(multiplied by 10) are shown for comparison (Courtesy SIDC, RWC Belgium, World Data Centerfor the Sunspot Index, Royal Observatory of Belgium, 1961–2004). During periods of low solaractivity (low sunspot counts), low energy galactic cosmic rays penetrate the heliosphere, whichresults in relatively high neutron production rates. During periods of high solar activity (highsunspot counts), the low energy galactic cosmic rays are cut off, resulting in lower neutroncounting rates. The variation in neutron counting rates is about 20% over the solar cycle.Theoretical galactic proton energy spectra within the heliosphere, representative of quiet andactive solar years, are shown (inset).
FIGURE 3 Neutron microscopiccross sections for natural Fe (seetext).
768

CLBE001-ESS2E November 11, 2006 4:43
Remote Chemical Sensing Using Nuclear Spectroscopy 769
FIGURE 4 (a) Model of the martian surface at high latitudes; (b) The current of neutrons leakingaway from Mars for three different solid surface compositions. Neutron energy ranges areindicated. (See text for details.)
Under the steady bombardment of cosmic rays, the pop-ulation of neutrons slowing down in the surface is, on aver-age, constant with time. The steady-state neutron energy-,angle-, and spatial-distributions depend on the compositionand stratigraphy of the surface and atmosphere. An impor-tant property of the neutron population is the scalar flux(ϕ), which depends on depth and is given by the product ofthe speed of the neutrons, v (cm/s), and the number densityof neutrons slowing down in the medium (n neutrons percm3): ϕ = nv, with units of neutrons per cm2 per s. Therate at which neutrons interact with nuclei is given by theproduct of the flux of neutrons, the density of the target nu-clei (N nuclei per cm3), and the microscopic cross section:R = ϕNσ (interactions per cm3 per s).
Cosmic ray showers can be modeled using Monte Carlomethods, in which the random processes of particle pro-duction and transport are simulated. The number of timessomething interesting happens, such as a particle crossinga surface, is tallied. Statistical averages of these interestingevents are used to determine different aspects of the par-ticle population such as fluxes and currents. Monte Carlotransport simulations generally provide for the following: adescription of the cosmic ray source and the target medium(including geometry, composition, and density); detailed
physical models of interaction mechanisms and transportprocesses (including tabulated data for interaction crosssections); and a system of tallies.
The general purpose code Monte Carlo N-Particle eX-tended (MCNPX) developed by Los Alamos National Lab-oratory provides a detailed model of cosmic ray showers,including the intranuclear cascade and subsequent interac-tions of particles within the surface and atmosphere. For ex-ample, a model of the martian surface used to calculate neu-tron leakage spectra is shown in Fig. 4a, and includes severallayers, representative of the high latitude surface, which isseasonally covered by CO2 ice due to condensation of atmo-spheric CO2 in the polar night, and whose frost-free surfaceconsists of a dry lag deposit covering ice rich soil. The curva-ture of Mars was included in the MCNPX calculations alongwith details of the incident galactic proton energy distribu-tion. The goal was to determine the effect of surface param-eters on neutron output, including the column abundance(g/cm2) of the layers, their water abundance, and major el-ement composition. The variation of the density of the at-mosphere with altitude (the scale height is roughly 11 km)and atmospheric mass were modeled. An accurate treat-ment of the atmosphere is needed in order to account forvariations in neutron production with density by particles

CLBE001-ESS2E November 11, 2006 4:43
770 Encyclopedia of the Solar System
such as pions that have very short half-lives. For dense at-mospheres, these particles interact more frequently withatmospheric nuclei, resulting in increased neutron produc-tion in the atmosphere.
The population of neutrons escaping the surface or atmo-sphere can be represented as a current, J, which is the ratioof the number of neutrons escaping into space per galacticcosmic ray incident on the planet. The energy distribution ofleakage neutrons is given by the current density j (E), whichis the number of escaping particles per unit energy perincident cosmic ray, such that J = ∫ ∞
0 dEj (E). The currentdensity of neutrons leaking away from Mars was calculatedby MCNPX for homogeneous solid surfaces consisting ofwater ice, which is representative of the north polar residualcap; relatively dry soil bearing 2% water ice, which is rep-resentative of dry equatorial regions; and CO2 ice, which isrepresentative of the seasonal polar caps. The relative neu-tron output, given by the product of the current density andneutron energy is shown in Fig. 4b for each of these mate-rials. Integrating over all energies gives 5, 3, and 1 for thetotal number of neutrons escaping the surface per incidentcosmic ray proton for the CO2 ice, dry soil, and water icesurfaces, respectively.
The neutron current density spans 14 decades of energyand can be divided into three broad ranges (Fig. 4b), repre-senting different physical processes: (1) Thermal neutrons,which have undergone many collisions, have energies lessthan about 0.1 eV and are nearly in thermal equilibrium withthe surface; (2) epithermal neutrons, which have energiesgreater than about 0.1 eV and are in the process of slowingdown from higher energies; and (3) fast neutrons, includingsource neutrons and neutrons with energy greater than thethreshold for inelastic scattering. Absorption and leakageresult in a nonequilibrium energy distribution for the ther-mal spectrum. Consequently, the most probable neutronenergy is slightly higher than would be predicted given thetemperature of the surface.
Elastic scattering is the most important loss mecha-nism for planetary neutron spectroscopy because it providesstrong differentiation between H and other more massivenuclei. For elastic scattering, the energy loss per collisionvaries systematically with atomic mass. The maximum en-ergy that a neutron can lose in a collision is given by fE,where f = 1 − [(A − 1)/(A + 1)]2, E is the energy of theneutron before the collision, and A is the atomic mass of thetarget nucleus. Thus, a neutron could lose all of its energy ina single collision with hydrogen (A = 1), which has roughlythe same mass as a neutron. This fact is easily verified by ob-serving head-on collisions in a game of billiards. In contrast,the maximum energy loss in a collision with C, which is thenext most massive nucleus of interest in planetary science, is28%. For Fe, the maximum energy loss per collision is 7%.The average energy loss per collision follows a similar trend.Consequently, for materials that are rich in H, such as water
ice, energy loss by elastic collisions is high and neutrons slowdown more quickly than for materials that do not contain H.
For H-rich materials, the population of neutrons thatare slowing down is strongly suppressed relative to materi-als without H. For example, the epithermal current densityfor the simulated water ice surface in Fig. 4b is considerablylower than either the soil or CO2 surfaces. The current den-sity of fast neutrons, which have undergone relatively fewcollisions following their production, are influenced by elas-tic scattering, but also by variations in neutron production,which depend on the average atomic mass of the medium.
Absorption of neutrons by radiative capture significantlyinfluences the population of thermal neutrons. Elementssuch as H, Cl, Fe, and Ti have relatively high absorptioncross sections and can significantly suppress the thermalneutron flux. C and O have very low absorption cross sec-tions compared to H. Consequently, the thermal neutronoutput for the water ice in Fig. 4b is suppressed relative tothe surfaces containing CO2 ice and soil.
2.3 Gamma Ray Production and Transport
For galactic cosmic ray interactions, gamma rays are primar-ily produced by neutron inelastic scattering and radiativecapture. De-excitation of residual nuclei produced by thesereactions results in the emission of gamma rays with dis-crete energies. The energies and intensities of the gammarays provide a characteristic fingerprint that can be used toidentify the residual nucleus. Since, in most cases, a residualnucleus can only be produced by a reaction with a specifictarget isotope, gamma rays provide direct information aboutthe elemental composition of the surface.
For example, neutron inelastic scattering with 56Fe fre-quently leaves the residual 56Fe nucleus in its first excitedstate, which transitions promptly to ground state by theemission of an 847 keV gamma ray. The presence of a peakat 847 keV in a planetary gamma ray spectrum indicates thatthe surface contains Fe. The intensity of the peak is relateddirectly to the abundance of elemental Fe in the surface.
Gamma rays produced by the decay of short-lived neu-tron activation products and long-lived (primordial) ra-dioisotopes also provide useful information about elementalabundance. Radioactive elements such as K, Th, and U canbe detected when present in trace quantities. Most notably,the Th decay chain produces a prominent gamma ray at2.6 MeV, which can be measured when Th is present in thesurface at low levels (>1 ppm).
To illustrate a typical gamma ray leakage spectrum, aMonte Carlo simulation of the lunar gamma ray leakagecurrent induced by galactic cosmic ray protons is shown inFig. 5. The composition of the surface was assumed to be themean soil composition from the Apollo 11 landing site. Con-tributions from nonelastic reactions and capture are plottedseparately. A background component associated primarily

CLBE001-ESS2E November 11, 2006 4:43
Remote Chemical Sensing Using Nuclear Spectroscopy 771
FIGURE 5 The current of gammarays leaking away from the Moonfor a composition representative ofthe Apollo 11 landing site.
with the decay of pions is also shown. The peaks correspondto gamma rays that escape into space without interactingwith the surface material. The peaks are superimposed on acontinuum, which results from the scattering of gamma raysin the surface. The total number of gamma rays escapingthe surface per incident cosmic ray proton was 2.7, whichis within the range of values for the number of neutronsescaping the martian surface, presented in Section 2.1.
Gamma ray peaks associated with neutron interactionswith major elements are labeled with the target element inFig. 5. The intensity (or area) of each peak is proportional tothe product of the abundance of the target element and thenumber density of neutrons slowing down in the medium.Specifically, the measured intensity (I) of a gamma ray peakwith energy E for a selected reaction can be modeled as theproduct of three terms: I ∝ f yR, where f accounts for at-tenuation of gamma rays by intervening surface materialsand the variation of detection efficiency with gamma rayenergy; y is the number of gamma rays of energy E pro-duced per reaction; and R = ϕNσ is the reaction rate,the product of the neutron flux, cross section, and numberdensity of the target element.
Because gamma rays are produced by neutron inter-actions, the absolute number density or, equivalently, theweight fraction of the target element cannot be deter-mined unless the neutron flux is known. Thus, neutron spec-troscopy plays an important role in the analysis of gammaray data. Relative abundances can be determined withoutknowledge of the magnitude of the neutron flux. For ex-ample, the ratio of Fe to Si abundances can be determinedfrom the ratio of the intensities of the prominent Fe doublet(at 7.65 MeV and 7.63 MeV) the Si gamma ray at 4.93 MeV.Because the magnitude of the attenuation of gamma raysby surface materials depends on gamma ray energy and thedistribution of gamma ray production with depth, models
of the depth profile of the neutron flux are needed in orderto analyze gamma ray data.
For homogeneous surfaces, accurate results can be ob-tained for absolute and relative abundances; however, sur-faces with strong stratigraphic variations present a difficultchallenge for analyzing nuclear spectroscopy data. Compo-sitional layering of major elements on a submeter scale iswidespread on Mars as shown, for example, by the Spiritand Opportunity rovers [see Mars Site Geology and Geo-chemistry]. In some cases, geophysical assumptions can bemade that simplify the analysis and allow quantitative resultsto be obtained; however, it is often the case that insufficientinformation is available. In these cases, it is sometimes pos-sible to establish bounds on composition that are usefulfor geochemical analysis. Development of accurate algo-rithms for determining elemental abundances, absolute orrelative, requires careful synthesis of nuclear physics withconstraints from geology, geophysics, and geochemistry.
3. Detection of Gamma Rays and Neutrons
In this section, a simple model of the counting rate ob-served by orbiting neutron and gamma ray spectrometersis presented along with an overview of radiation detectionconcepts for planetary science applications.
3.1 Counting Rate Models
The flux of radiation reaching an orbiting spectrometervaries in proportion to the solid angle subtended by theplanet at the detector, which depends on orbital altitude.The fractional solid angle of a spherical body is given by
�(h) = 1 −√
1 − R2/(R + h)2, (1)

CLBE001-ESS2E November 11, 2006 4:43
772 Encyclopedia of the Solar System
where h is the orbital altitude and R is the radius. The frac-tional solid angle varies from 1 at the surface (for h = 0) to0 far away from the planet. For galactic cosmic ray inter-actions, the flux of gamma rays or neutrons at the orbitingspectrometer is approximately
φ(h) = 1/4�J �(h), (2)
where � is the flux of galactic cosmic ray protons far fromthe planet (about 4 protons/cm2/s, depending on the solarcycle and location within the heliosphere), and J is the leak-age current. Because alpha particles and heavier nuclei ofgalactic origin contribute to neutron and gamma ray pro-duction, Eq. 2 must be multiplied by a factor, approximately1.4, in order to estimate the total leakage flux.
Eq. 2 can be used, for example, to calculate the flux ofneutrons incident on the Mars Odyssey neutron spectrom-eter. The orbital altitude for Mars Odyssey is 400 km, andthe volumetric mean radius of Mars is 3390 km. The frac-tional solid angle, given by Eq. 1, is 0.55. The total leakagecurrent for a surface consisting of thick CO2 ice, represen-tative of the polar seasonal caps during winter, was J = 5(from Section 2.2). Consequently, from Eq. 2, the total fluxof neutrons at Odyssey’s orbit from thick CO2 deposits isapproximately 4 neutrons per cm2 per s. For a surface thatis 100% water, which is representative of the north polarresidual cap, J was 1, and the total flux at orbital altitude isexpected to be 0.8 neutrons per cm2 per s.
Radiation detectors, such as the gamma ray and neutronspectrometers on Mars Odyssey, count particle interactionsand bin them into energy or pulse-height spectra, for ex-ample, with units of counts per s per unit energy. For bothgamma rays and neutrons, the net counting rate (with unitsof counts per s) for selected peaks in the spectrum is neededin order to determine elemental abundances.
The flux of particles (gamma rays or neutrons) incidenton a spectrometer can be converted to counting rate (C),given the intrinsic efficiency (ε) and projected area (A) ofthe spectrometer in the direction of the incident particles:
C = ϕ(h) εA. (3)
The intrinsic efficiency is the probability that an inci-dent particle will interact with the spectrometer to pro-duce an event that is counted. Because particles can passthrough the spectrometer without interacting, the intrinsicefficiency is always less than or equal to 1. For example, εAis on the order of 10 cm2 for the Mars Odyssey epithermalneutron detector, which has a maximum projected area ofabout 100 cm2. The efficiency-area product (εA) varies withthe energy and angle of incidence of the particles. So, thevalue for εA used in Eq. 3 must be appropriately averagedover neutron energy and direction.
One of the main sources of uncertainty in measuredcounting rates is statistical fluctuations due to the random
nature of the production, transport, and detection of radi-ation. While a detailed discussion of error-propagation isbeyond the scope of this article, the most important resultis given here: The statistical uncertainty (precision) in thecounting rate is given by σ = √
C/t, where t is the mea-surement time and C is the mean counting rate. For exam-ple, to achieve a precision of (1% σ/C = 0.01) when C =10 counts per s, which is typical of the epithermal and ther-mal counting rates measured by the Mars Odyssey neutronspectrometer, a counting time of 1000 s is required. Longercounting times are needed when background contribu-tions are subtracted, for example, to determine countingrates for peaks in gamma ray and neutron spectra. Uncer-tainties in the counting rate due to random fluctuationspropagate to the uncertainties in elemental abundance andother parameters determined in the analysis of spectroscopydata. Long counting times are desired to minimize statis-tical contributions. Alternatively, improved precision canbe achieved by increasing the counting rate, which can beaccomplished through instrument design, by maximizing,and/or by making measurements at low altitude.
3.2 Gamma Ray and Neutron Detection
Radiation spectrometers measure ionization producedby the interaction of particles within a sensitive volume.Gamma ray interactions produce swift primary electronsthat cause ionization as they slow down in the sensitivevolume. Neutrons undergo reactions that produce ener-getic ions and gamma rays. The recoil proton from neutronelastic scattering with hydrogen can produce measurableionization. The charge liberated by these interactions canbe measured using a wide variety of techniques, two ofwhich are illustrated here.
Semiconductor radiation detectors typically consist of asemiconductor dielectric material sandwiched between twoelectrodes. An electric field is established in the dielectricby applying high voltage across the electrodes. Gamma rayinteractions produce free electron-hole pairs which drift inopposite directions in the electric field. As they drift, theyinduce charge on the electrodes, which is measured us-ing a charge-sensitive preamplifier. The amplitude of thecharge pulse, or pulse-height, is proportional to the energydeposited by the gamma ray. Consequently, a histogramof pulse heights, known as a pulse-height spectrum, mea-sured for many interactions provides information about theenergy distribution of the incident gamma rays.
For example, a diagram of a high-purity germanium(HPGe) detector is shown in Fig. 6a along with a photo-graph of an HPGe crystal in Fig. 6b. The closed-end coax-ial geometry is designed to minimize trapping of carriersas they drift to the electrodes. To minimize noise due toleakage current, the HPGe must be operated at very lowtemperatures. The requirement for cooling adds to the massand complexity of the design for space applications.

CLBE001-ESS2E November 11, 2006 4:43
Remote Chemical Sensing Using Nuclear Spectroscopy 773
FIGURE 6 (a) Schematic diagram of a coaxial HPGe spectrometer and gamma ray interactions;(b) photograph of a HPGe cystal; (c) diagram of a scintillation-based spectrometer with neutroninteractions; and (d) assembly diagram for a boron-loaded plastic scintillator for a flightexperiment, including the mechanical structure (including packaging designed to withstand thevibrational environment during launch). (Part b courtesy of AMETEK, Advanced MeasurementTechnology, Inc., ORTEC Product Line, 801 South Illinois Avenue, Oak Ridge, TN 37830).
A hypothetical gamma ray interaction is superimposedon the diagram in Fig. 6a. Gamma rays undergo three typesof interactions: pair production, Compton scattering, andthe photoelectric effect. High-energy gamma rays (greaterthan 1.022 MeV) can undergo pair production, in whichthe gamma ray disappears and an electron-positron pair isproduced. The kinetic energy of the electron and positron isabsorbed by the medium. When the positron is annihilatedby an electron, two, back-to-back (511 keV) gamma rays areproduced, which can undergo additional interactions. InCompton scattering, a portion of the energy of the gammaray is transferred to an electron. The energy lost by thegamma ray depends on the scattering angle. At low energies,the gamma ray can be absorbed by an electron via the
photoelectric effect. All of these interactions vary stronglywith the atomic number (Z) and density of the detectormaterial. High Z, high density and a large sensitive volumeis desired to maximize the probability that all of theenergy of the incident gamma ray is absorbed in thedetector.
A pulse height spectrum for a large volume (slightlylarger than the crystal flown on Mars Odyssey), coaxialHPGe detector is shown in Fig. 7. The gamma rays wereproduced by moderated neutrons, with an energy distribu-tion similar to the lunar leakage spectrum, incident on an Feslab. Well-defined peaks corresponding to neutron captureand inelastic scattering with Fe appear in the spectrum. Forexample, the doublet labeled Fe(1) corresponds to gamma

CLBE001-ESS2E November 11, 2006 4:43
774 Encyclopedia of the Solar System
FIGURE 7 Gamma ray spectra acquired by HPGe (black) and BGO (red) spectrometers. Toimprove visualization, the spectrum for BGO has been multiplied by 100. The source wasmoderated neutrons, with energy distribution similar to a planetary leakage spectrum, incident onan iron slab. Gamma rays from natural radioactivity in the environment are also visible (from K at1461 keV and Th at 2615 keV). A gamma ray at 2223 keV from neutron capture with H (frompolyethylene in the moderator) is a prominent feature in the HPGe and BGO spectra. Majorgamma rays from neutron interactions with Fe that are resolved by the HPGe spectrometer arelabeled: (1) 7646- and 7631-keV doublet from neutron capture; (2) their single escape peaks; (3)6019- and 5921-keV gamma rays from neutron capture; (4) their single escape peaks; and (5)846.7 keV gamma ray from neutron inelastic scattering. (HPGe spectrum courtesy ofS. Garner, J. Shergur, and D. Mercer of Los Alamos National Laboratory).
rays (7646- and 7631-keV) produced by neutron capturewith Fe. The peaks labeled Fe(2) are shifted 511 keV lowerin energy and correspond to the escape of one of the 511 keVgamma rays produced by pair production in the spectrom-eter. The continuum that underlies the peaks is caused byexternal Compton scattering and the escape of gamma raysthat scattered in the spectrometer. Gamma rays from neu-tron capture with H and the radioactive decay of K and Thare also visible.
Scintillators provide an alternative method of detect-ing ionizing radiation, which can be used for gamma ray andneutron spectroscopy. Scintillators consist of a transparentmaterial that emits detectable light when ionized. The lightis measured by a photomultiplier tube or photodiode, whichis optically coupled to the scintillator. The amount of lightproduced and the amplitude of the corresponding chargepulse from the photomultiplier tube and pulse processingcircuit is proportional to the energy deposited by the radi-ation interaction.
A diagram of a boron-loaded, plastic scintillation detec-tor is shown in Fig. 6c along with an assembly diagram offlight sensor (Fig. 6d). Thermal and epithermal neutronsare detected by the 10B(n,αγ )7Li reaction. The recoilingreaction products (alpha particle and 7Li ion) produceionization equivalent to a 93 keV electron, which makes awell-defined peak in the pulse height spectrum. The areaof the peak depends on the flux of incident thermal and ep-ithermal neutrons. Thermal neutrons can be filtered out bywrapping the scintillator in a Cd foil, which strongly absorbsneutrons with energies below about 0.5 eV. Thus, the com-bination of a bare and Cd-covered scintillator can be usedto separately measure contributions from thermal and ep-ithermal neutrons. Above about 500 keV, light is producedby recoiling protons from neutron elastic scattering with hy-drogen in the scintillator. Fast neutrons (greater than about500 keV) can be detected by a prompt pulse from protonrecoils followed a short time later by a second pulse, corre-sponding to neutron capture of the moderated neutron by

CLBE001-ESS2E November 11, 2006 4:43
Remote Chemical Sensing Using Nuclear Spectroscopy 775
10B. This characteristic, double-pulse time signature canbe used to identify, and separately measure, fast neutronevents.
Scintillators are also used routinely for gamma ray spec-troscopy. For example, a pulse height spectrum acquired bya bismuth germanate (BGO) scintillator is shown in Fig. 7.The source was exactly the same as measured by the HPGespectrometer, and the two spectra share similar peak fea-tures. Note, however, that the peaks measured by BGOare considerably broader than those measured by HPGe.The width of the peaks is caused by statistical variations inthe number of scintillation photons produced in the BGO.Similar dispersion occurs for charge carriers (electrons andholes) in the HPGe crystal; however, the effect is far lesspronounced. The pulse height resolution as measured bythe full-width-at-half-maximum (FWHM) of the gammaray peaks is much worse for the BGO than the HPGe. Theability of the HPGe technology to resolve individual peaks iscoveted by the planetary spectroscopist; however, the addedcost and complexity of HPGe relative to scintillation tech-nology has made scintillators competitive for some missions.
Other technologies that have been flown for gamma rayand neutron detection include 3He ionization chambers(for thermal and epithermal neutron detection on LunarProspector) and various scintillators, including Tl-dopedNaI on NEAR and Apollo and Tl-doped CsI on Phobos.The Dawn mission will fly a new compound semiconduc-tor technology (CdZnTe), which has significantly improvedpulse height resolution relative to BGO and, in contrast toHPGe, can be operated at ambient temperatures.
3.3 Spatial Resolution
The spatial resolution that can be achieved by a spectrome-ter depends on the angular distribution of radiation emittedfrom the surface, the angular response of the spectrometer,and the altitude of the orbit. The angular response of mostspectrometers is roughly isotropic or weakly dependent onincident direction. Consequently, the spectrometer is sen-sitive to radiation emitted from locations from underneaththe spectrometer all the way out to the limb. Due to theirincreased area, off-nadir regions contribute more to thecounting rate than regions directly beneath the spacecraft.
When the spectrometer passes over a point source of ra-diation on the surface, the counting rate as a function of dis-tance along the orbital path has an approximately Gaussianshape, with the peak occurring when the spacecraft passesover the source. Consequently, the ability of the spectrom-eter to resolve spatial regions with different compositionsdepends on the FWHM of the Gaussian, which as a rule ofthumb is approximately 1.5 times the orbital altitude. Forexample, the lowest orbital altitude of Lunar Prospectorwas 30 km for which the spatial resolution was 45 km or1.5◦ of arc length. For Mars Odyssey, the orbital altitude
was 400 km, and the spatial resolution was approximately600 km or 10◦ of arc length.
The broad spatial response of gamma ray and neutronspectrometers must be considered in the analysis and in-terpretation of data, especially where comparisons to high-resolution data (for example, from optical spectroscopy) areconcerned. It may be possible to increase the resolution ofa spectrometer by the addition of a collimator, which wouldadd mass to the instrument and also reduce the precisionof the measurements. Alternatively, spatial deconvolutionand instrument modeling techniques can sometimes be em-ployed to study regions that are smaller in scale than thespatial resolution of the spectrometer.
4. Missions
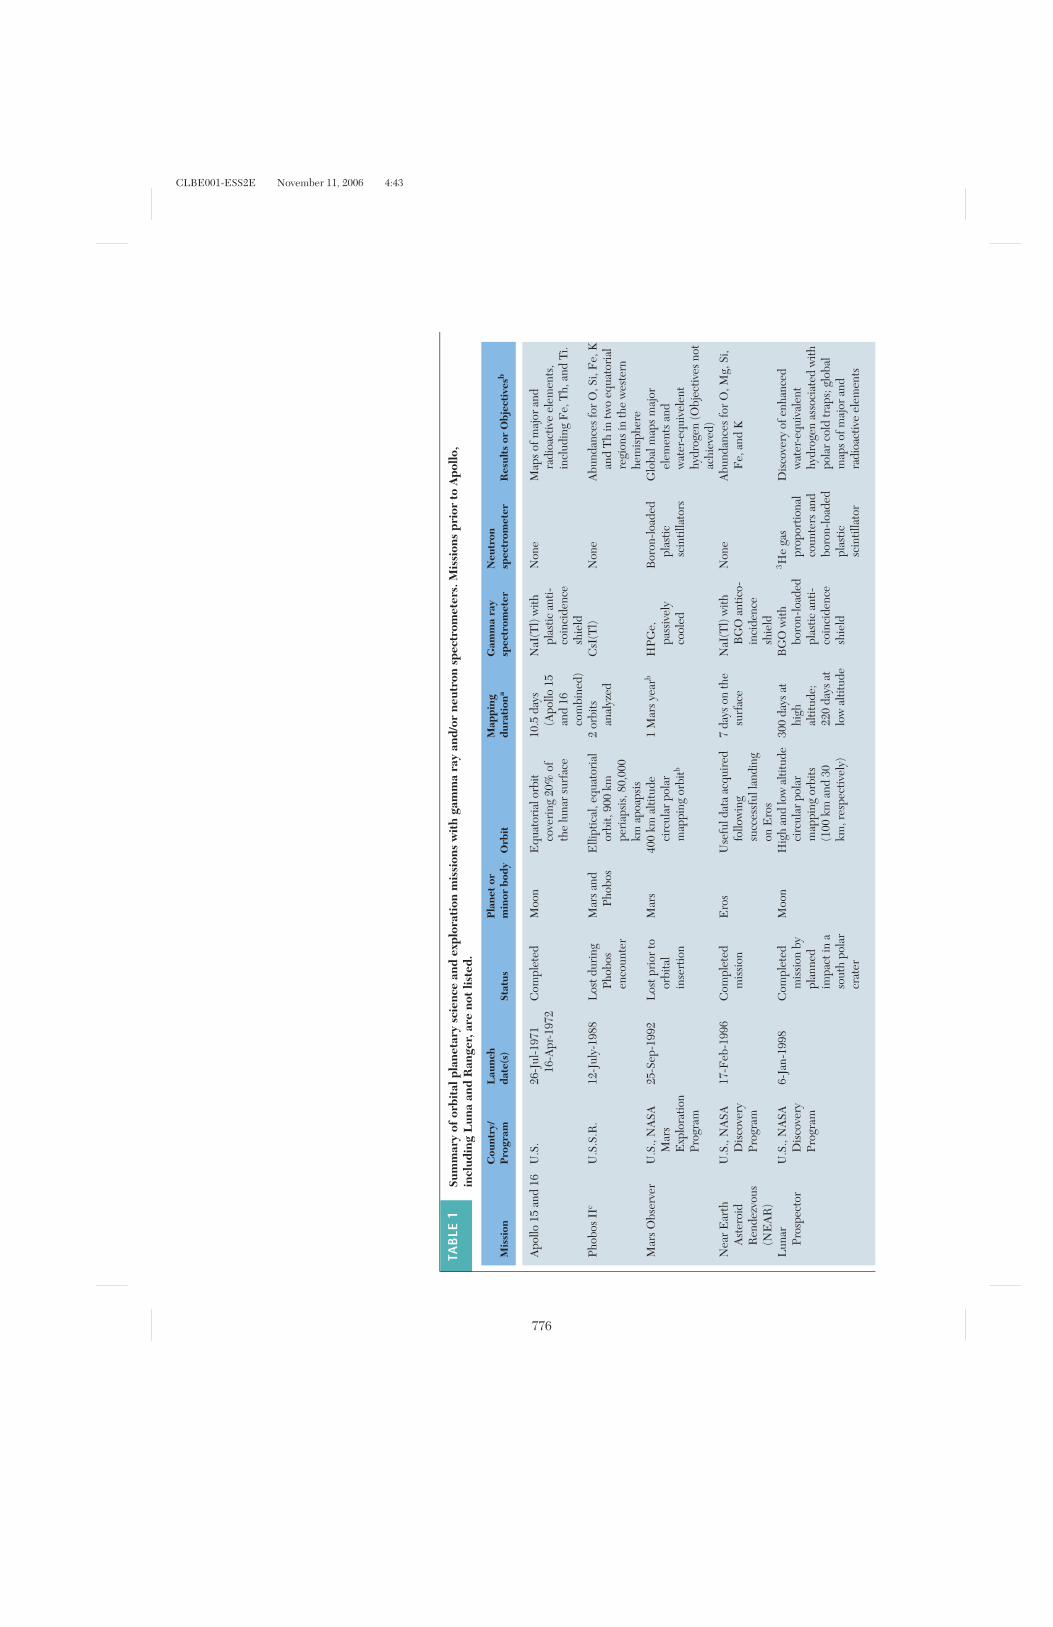
Since the dawn of space flight, nuclear spectroscopy hasbeen used for a wide variety of applications, from astro-physics to solar astronomy. Orbital planetary science mis-sions with gamma ray and/or neutron spectrometers on thepayload are listed in Table 1. While nuclear spectroscopywas used on earlier missions to the Moon, Mars, and the sur-face of Venus, the first major success was the Apollo GammaRay Experiment, which flew on the Apollo 15 and 16 mis-sions, providing global context for lunar samples. Phobos IItraveled to Mars and provided a glimpse of the regionalcomposition of the western hemisphere, which includesTharsis and Valles Marineris. Due to the small size of Erosand high orbital altitudes, the gamma ray spectrometer onNEAR provided little useful information about Eros untilthe NEAR landed on the asteroid. Once on the surface, theNEAR gamma ray spectrometer acquired data with suffi-cient precision to determine the abundance of O, Mg, Si,Fe, and K. NEAR also had an x-ray spectrometer that pro-vided complementary information about surface elementalcomposition. The first intended use of neutron spectroscopyfor global mapping was on Mars Observer, which was lostbefore reaching Mars.
Lunar Prospector was the first mission to combinegamma ray and neutron spectroscopy to provide accurate,high-precision global composition maps of a planetary body.The missions that followed Lunar Prospector, including2001 Mars Odyssey and MESSENGER, a mission to theplanet Mercury, also included neutron and gamma ray spec-trometers on the payload. Dawn, a mission to the main as-teroid belt, and Selene, a lunar mission, represent the futureof orbital planetary spectroscopy. Both are in preparationfor launch in the 2006–2007 timeframe.
5. Science
Lunar Prospector and Mars Odyssey acquired high-precision gamma ray and neutron data sets for the Moon and
CLBE001-ESS2E November 11, 2006 4:43
TA
BLE
1Su
mm
ary
ofor
bita
lpla
neta
rysc
ienc
ean
dex
plor
atio
nm
issi
ons
wit
hga
mm
ara
yan
d/or
neut
ron
spec
trom
eter
s.M
issi
ons
prio
rto
Apo
llo,
incl
udin
gL
una
and
Ran
ger,
are
not
liste
d.
Cou
ntry
/L
aunc
hP
lane
tor
Map
ping
Gam
ma
ray
Neu
tron
Mis
sion
Pro
gram
date
(s)
Stat
usm
inor
body
Orb
itdu
rati
ona
spec
trom
eter
spec
trom
eter
Res
ults
orO
bjec
tive
sb
Apo
llo15
and
16U
.S.
26-J
ul-1
971
16-A
pr-1
972
Com
plet
edM
oon
Equ
ator
ialo
rbit
cove
ring
20%
ofth
elu
nar
surf
ace
10.5
days
(Apo
llo15
and
16co
mbi
ned)
NaI
(Tl)
with
plas
tican
ti-co
inci
denc
esh
ield
Non
eM
aps
ofm
ajor
and
radi
oact
ive
elem
ents
,in
clud
ing
Fe,
Th,
and
Ti.
Phob
osII
cU
.S.S
.R.
12-J
uly-
1988
Los
tdur
ing
Phob
osen
coun
ter
Mar
san
dPh
obos
Elli
ptic
al,e
quat
oria
lor
bit,
900
kmpe
riap
sis,
80,0
00km
apoa
psis
2or
bits
anal
yzed
CsI
(Tl)
Non
eA
bund
ance
sfo
rO
,Si,
Fe,
Kan
dT
hin
two
equa
tori
alre
gion
sin
the
wes
tern
hem
isph
ere
Mar
sO
bser
ver
U.S
.,N
ASA
Mar
sE
xplo
ratio
nPr
ogra
m
25-S
ep-1
992
Los
tpri
orto
orbi
tal
inse
rtio
n
Mar
s40
0km
altit
ude
circ
ular
pola
rm
appi
ngor
bitb
1M
ars
year
bH
PGe,
pass
ivel
yco
oled
Bor
on-lo
aded
plas
ticsc
intil
lato
rs
Glo
balm
aps
maj
orel
emen
tsan
dw
ater
-equ
ivel
ent
hydr
ogen
(Obj
ectiv
esno
tac
hiev
ed)
Nea
rE
arth
Ast
eroi
dR
ende
zvou
s(N
EA
R)
U.S
.,N
ASA
Dis
cove
ryPr
ogra
m
17-F
eb-1
996
Com
plet
edm
issi
onE
ros
Use
fuld
ata
acqu
ired
follo
win
gsu
cces
sful
land
ing
onE
ros
7da
yson
the
surf
ace
NaI
(Tl)
with
BG
Oan
tico-
inci
denc
esh
ield
Non
eA
bund
ance
sfo
rO
,Mg,
Si,
Fe,
and
K
Lun
arPr
ospe
ctor
U.S
.,N
ASA
Dis
cove
ryPr
ogra
m
6-Ja
n-19
98C
ompl
eted
mis
sion
bypl
anne
dim
pact
ina
sout
hpo
lar
crat
er
Moo
nH
igh
and
low
altit
ude
circ
ular
pola
rm
appi
ngor
bits
(100
kman
d30
km,r
espe
ctiv
ely)
300
days
athi
ghal
titud
e;22
0da
ysat
low
altit
ude
BG
Ow
ithbo
ron-
load
edpl
astic
anti-
coin
cide
nce
shie
ld
3 He
gas
prop
ortio
nal
coun
ters
and
boro
n-lo
aded
plas
ticsc
intil
lato
r
Dis
cove
ryof
enha
nced
wat
er-e
quiv
alen
thy
drog
enas
soci
ated
with
pola
rco
ldtr
aps;
glob
alm
aps
ofm
ajor
and
radi
oact
ive
elem
ents
776

CLBE001-ESS2E November 11, 2006 4:43
2001
Mar
sO
dyss
eyU
.S.,
NA
SAM
ars
Exp
lora
tion
Prog
ram
7-A
pr-2
001
Com
plet
edpr
imar
ym
issi
on;
exte
nded
mis
sion
unde
rway
Mar
s40
0km
altit
ude
circ
ular
pola
rm
appi
ngor
bit
Ove
r2
Mar
sye
ars
com
plet
ed,
Ext
ende
dm
issi
onin
prog
ress
HPG
e,pa
ssiv
ely
cool
ed
Bor
on-lo
aded
plas
ticsc
intil
lato
rs(N
S);
Stilb
ene
and
3 He
tube
s(H
EN
Dd)
Dis
trib
utio
nof
wat
er-e
quiv
alen
thy
drog
enan
dhi
gh-la
titud
est
ratig
raph
y;se
ason
alva
riat
ions
inC
O2
ice
and
nonc
onde
nsab
lega
sses
;an
dgl
obal
map
sof
maj
oran
dra
dioa
ctiv
eel
emen
tsM
ESS
EN
GE
RU
.S.,
NA
SAD
isco
very
Prog
ram
3-A
ug-2
004
Cru
ise
phas
eM
ercu
ryE
llipt
ical
pola
ror
bit
with
peri
apsi
sat
200
kmal
titud
e,60
◦ Nla
titud
e,15
,000
kmap
oaps
isb
1ye
arst
artin
gin
2011
bH
PGe,
activ
ely
cool
ed
6 Li-l
oade
dgl
ass
and
boro
n-lo
aded
plas
ticsc
intil
lato
rs
Map
sof
elem
enta
lco
mpo
sitio
nin
the
nort
hern
hem
isph
ere;
sear
chfo
rpo
lar
hydr
ogen
depo
sits
Daw
nU
.S.,
NA
SAD
isco
very
Prog
ram
Sum
mer
,200
7Pe
rpar
ing
for
laun
che
Vest
aan
dC
eres
Surv
ey,h
igh,
and
low
altit
ude
circ
ular
pola
rm
appi
ngor
bits
b
6m
onth
sat
each
aste
roid
b
CdZ
nTe
and
BG
O
6 Li-l
oade
dgl
ass
and
boro
n-lo
aded
plas
ticsc
intil
lato
rs
Glo
balm
aps
ofm
ajor
and
radi
oact
ive
elem
ents
and
ice
cons
titue
nts
(Han
dC
)
Sele
neJa
pan
2007
,TB
DPr
epar
ing
for
laun
che
Moo
n10
0km
circ
ular
pola
rm
appi
ngor
bit
1ye
arH
PGe,
activ
ely
cool
edN
one
Abu
ndan
ceof
maj
oran
dra
dioa
ctiv
eel
emen
ts.
a Ref
ers
toth
etim
epe
riod
sdu
ring
whi
chga
mm
ara
yan
d/or
neut
ron
data
wer
eac
quir
ed.
bO
bjec
tives
are
liste
dfo
rM
ars
Obs
erve
r,M
ESS
EN
GE
R,D
awn,
and
Sele
ne.
c Neu
tron
and
gam
ma
ray
spec
trom
eter
sw
ere
flow
non
Phob
osI,
whi
chw
asla
unch
edon
7-Ju
ly-1
988;
how
ever
,Pho
bos
Iw
aslo
stdu
ring
the
crui
seph
ase
ofth
em
issi
on.T
heM
ars
4an
d5
mis
sion
s(U
.S.S
.R.,
1973
)flew
iden
tical
sodi
umio
dide
gam
ma
ray
spec
trom
eter
s.A
few
gam
ma
ray
spec
tra
wer
eac
quir
edby
Mar
s5
whi
lein
anel
liptic
alor
bita
roun
dM
ars
(apo
apsi
s32
,560
km,p
eria
psis
1760
km,i
nclin
atio
n35
◦to
the
equa
tor)
.dT
hehi
ghen
ergy
neut
ron
dete
ctor
(HE
ND
)was
prov
ided
byth
eR
ussi
anF
eder
atio
n.e F
utur
em
issi
ons
that
have
adva
nced
past
the
plan
ning
stag
ear
elis
ted.
777

CLBE001-ESS2E November 11, 2006 4:43
778 Encyclopedia of the Solar System
Mars, respectively. Highlights of the science carried out onthese missions are presented along with a description oftheir instrumentation. The Moon and Mars are very differ-ent, both in their origin and composition. With the possibleexception of polar water ice, the Moon is bone dry andhas no atmosphere. The lunar surface has been extensivelymodified by cratering and basaltic volcanism. Mars has atenuous atmosphere, extensive water ice deposits, and sea-sonal CO2 caps. Volcanic, aqueous, and eolian processeshave continued to shape the surface of Mars long past theprimordial formation of the crust. The differences betweenthese two bodies will provide the reader with insights intothe wealth of information provided by nuclear spectroscopyand the challenges faced in the analysis of the data. For Lu-nar Prospector, emphasis is placed on the combined analy-sis of neutron and gamma ray data to determine the abun-dance of major and trace radioactive elements. For MarsOdyssey, results from the neutron spectrometer for globalwater abundance and the seasonal caps are presented.
5.1 Lunar Prospector
Lunar Prospector was a spin-stabilized spacecraft, withthe spin axis perpendicular to the plane of the ecliptic.The instruments were deployed on booms to minimize
FIGURE 8 (a) Annotated artist’s conception of Lunar Prospector; (b) Cross sectional view of thegamma ray and fast neutron spectrometer; (c) annotated artist’s conception of 2001 Mars Odyssey;(d) engineering drawing of the Neutron Spectrometer on Odyssey cut-away to show the boronloaded plastic scintillators. A schematic diagram of the arrangement of scintillators and theirorientation relative to spacecraft motion and nadir is also shown. (Parts a and c courtesy of NASA.)
backgrounds from the spacecraft (Fig. 8a). The payloadincluded a large-volume BGO gamma ray spectrometer(GRS), which was surrounded by a boron-loaded plasticanticoincidence shield (Fig. 8b). The shield served two pur-poses: (1) to suppress the Compton continuum caused bygamma rays escaping the BGO crystal and to reject ener-getic particle events; and (2) to measure the spectrum offast neutrons from the lunar surface using the double-pulsetechnique described in Section 3.2. Sn- and Cd-covered3He gas proportional counters were used to detect and sep-arately measure thermal and epithermal neutrons. Gammaray and neutron spectroscopy data were acquired for longperiods of time (Table 1), providing full coverage of theMoon at 100- and 30-km altitude.
The data were analyzed to determine global maps of sur-face elemental composition. The resulting abundance datawere mapped on different spatial scales, depending on theprecision of the data and the altitude of the spectrometer.Results of the analysis were submitted to the NASA Plan-etary Data System and include the following data sets: theabundance of hydrogen from neutron spectroscopy (0.5◦
equal angle map); the average atomic mass from fast neu-tron spectroscopy (2◦ equal area maps); the abundanceof major oxides, including MgO, Al2O3, SiO2, CaO, TiO2,and FeO, and trace incompatible elements K, Th, and U

CLBE001-ESS2E November 11, 2006 4:43
Remote Chemical Sensing Using Nuclear Spectroscopy 779
FIGURE 9 Lunar Prospectorgamma ray spectrum for a 20◦
equal-area pixel in the westernmare is compared to the fittedspectrum and elemental spectralcomponents (see text for details).
(2◦-, 5◦-, and 20◦-equal area maps) using a combination ofgamma ray and neutron spectroscopy; and the abundanceof the rare-earth elements (Gd + Sm) from neutron spec-troscopy (0.5◦ equal angle map).
Perhaps the most significant result of Lunar Prospec-tor was the discovery of enhanced hydrogen at the polesin association with craters in permanent shadow, which arethought to be cold traps for water ice. If present, water icecould be an important resource for manned exploration.Consequently, the polar cold traps are a prime target forfuture missions. Geochemical results from the analysis ofneutron and gamma ray spectra fully reveal the dichotomyin the composition of the Moon, with a near side thatis enriched in incompatible elements and mafic mineralsand a thick far-side crust primarily consisting of plagioclasefeldspar.
Global geochemical trends observed by Lunar Prospec-tor are not significantly different from trends observed inthe sample and meteoritic data; however, there are somenotable discrepancies that point to the existence of uniquelithologies that are not well represented by the lunar sam-ple data. Interpretation and analysis of the data is ongoingwith emphasis on regional studies. For example, the impactthat formed the South Pole Aitken (SPA) basin could haveexcavated into the mantle. Analysis of the composition of
the basin floor may reveal information about the bulk com-position of the mantle and lower crust.
The analysis of major and radioactive elements was car-ried out using a combination of gamma ray and neutronspectroscopy data. A typical gamma ray spectrum is shownin Fig. 9 for a 20◦ equal-area pixel in the western mare.Two intense, well-resolved peaks, labeled in Fig. 9, wereanalyzed to determine the abundance of Fe and Th. In ad-dition, a spectral unmixing algorithm similar to those usedto analyze spectral reflectance data was developed to si-multaneously determine the abundance of all major andradioactive elements from the gamma ray spectrum.
Lunar gamma ray spectra can be modeled as a linearmixture of elemental spectral shapes. The magnitude of thespectral components must be adjusted to account for thenonlinear coupling of gamma ray production to the neutronnumber density (for neutron capture reactions) and the fluxof fast neutrons (for nonelastic reactions). Once the adjust-ment is made, a linear least squares problem can be solvedto determine elemental weight fractions. Fitted elementalspectral shapes are shown, for example, in Fig. 9.
Abundance maps for selected elements determined byLunar Prospector are shown in Fig. 10. To provide con-text for the elemental abundance maps, a map of topogra-phy determined by Clementine, superimposed on a shaded

CLBE001-ESS2E November 11, 2006 4:43
780 Encyclopedia of the Solar System
FIGURE 10 Orthographic projections of the lunar near and far sides: (a) Elevation; (b–d)abundance (weight fraction) of selected elements. The map data are superimposed on a shadedrelief image. (FeO data courtesy NASA Planetary Data System ; image courtesy United StatesGeological Survey.)
relief image, is shown in Fig. 10a. The far side includesthe feldspathic highlands and the SPA basin. The near sideconsists of major basins, including Procellarum and Im-brium, which contain mare basalts. The mare basalts arerich in Fe, with the highest concentrations occurring in
western Procellarum (Fig. 10b). The low abundance of FeOin the highlands, which are rich in plagioclase feldspar,reflects a significant lunar geochemical trend in whichmafic silicate minerals are displaced by plagioclase, which isFe-poor.

CLBE001-ESS2E November 11, 2006 4:43
Remote Chemical Sensing Using Nuclear Spectroscopy 781
FIGURE 10 (Continued )
A large portion of the western near side is enriched inradioactive elements such as Th (Fig. 10c). K, Th, and U areincompatible with major lunar minerals and were likely con-centrated in the residual melt during lunar differentiation.Consequently, their distribution on the surface and withdepth has important implications to lunar evolution. The as-sociation of high Th concentrations with the mare suggeststhat heating by radioactive elements may have significantlyinfluenced lunar thermal evolution and mare volcanism.
The distribution of TiO2 is shown in Fig. 10d as a 5◦
equal area map. The low spatial resolution of the TiO2 mapcompared to FeO and Th is a consequence of the rela-tively low intensity of the Ti gamma rays and their posi-tion in the gamma ray spectrum near strong peaks from Oand Fe (Fig. 9). The abundance of TiO2 can be used toclassify mare basalts. Strong spatial variations in the abun-dance of TiO2, for example, indicate that different sourceregions and processes were involved in creating the basalts

CLBE001-ESS2E November 11, 2006 4:43
782 Encyclopedia of the Solar System
that comprise the mare. The highest concentrations of TiO2are found in Tranquillitatis as shown in Fig. 10d; however,high concentrations are also found in western Procellarum.The abundances of Fe and Ti observed in western Procel-larum suggest that this region has a unique composition thatis not well represented by the lunar samples.
5.2 Mars Odyssey
As of this writing, 2001 Mars Odyssey is in an extendedmission having successfully completed over two Mars yearsof mapping (each Mars year is 687 days). Odyssey is ina circular polar mapping orbit around Mars at an alti-tude of approximately 400 km (Table 1). The nuclear spec-troscopy payload consists of a GRS, a neutron spectrom-eter (NS), and a Russian-supplied high energy neutrondetector (HEND). Gamma ray and neutron spectroscopydata acquired by Mars Odyssey provide constraints ongeochemistry, the water cycle, climate history, and atmo-spheric processes, including atmospheric dynamics andatmosphere-surface interactions [see Mars Atmosphere:History and Surface Interaction].
Since the discovery of abundant subsurface water-equivalent hydrogen (WEH) at high latitudes, Odyssey’sgamma ray and neutron spectrometers have continued toprovide a wealth of new information about Mars, includingthe global distribution of near-surface WEH, the elementalcomposition of the surface, seasonal variations in the com-position of the atmosphere at high latitudes, and the columnabundance of CO2 ice in the seasonal caps. This informationhas contributed to our understanding of the recent historyof Mars: The climate is driven strongly by short-term vari-ations in orbital parameters, principally the obliquity, andthe surface distribution of surface water-ice is controlled byatmosphere-surface interactions. The discovery of anoma-lously large amounts of WEH at low latitudes, where waterice is not stable, has stirred considerable debate about themineral composition of the surface and climate change.
The GRS on Odyssey is boom-mounted, passivelycooled, HPGe spectrometer, similar in design to the in-strument flown on Mars Observer (Fig. 8c). The NS is adeck-mounted instrument that consists of a boron-loadedplastic block (roughly 10 cm on a side), which has beendiagonally segmented into four prisms and read out by sep-arate photomultiplier tubes (Fig. 8d). The orientation ofthe spacecraft is constant such that one of the prisms facesnadir (P1), one faces zenith (P3), one faces in the directionof spacecraft motion (P2), and one faces opposite the space-craft motion (P4). P1 is covered with a Cd foil that preventsthermal neutrons from entering the prism. Consequently,P1 is sensitive to epithermal and fast neutrons originatingfrom the surface and atmosphere.
Neutrons with energy less than the gravitational bindingenergy of Mars, approximately 0.13 eV, corresponding to anescape speed of about 5000 m/s, travel on parabolic trajecto-
ries and return to Mars unless they decay by beta emission.The mean lifetime of a neutron is approximately 900 s. Themost probable energy for neutrons in thermal equilibriumwith the surface of Mars (for the mean martian tempera-ture of 210 K) is 0.018 eV, which corresponds to a neutronspeed of 1860 m/s. Consequently, a significant portion ofthe thermal neutron population travels on ballistic trajecto-ries and are incident on the spectrometer from above andbelow. Neutrons that leave the atmosphere with energiesless than about 0.014 eV, just below the most probable en-ergy, cannot reach the 400 km orbital altitude of Odyssey.Consequently, gravitational binding has a significant effecton the flux and energy distribution of neutrons at Odyssey’sorbital altitude, and, in contrast to the simplified discussionin Section 3.1, gravitational effects must be accounted forin models of the flux and instrument response.
To separate thermal and epithermal neutrons, the NSmakes use of the orbital speed of the spacecraft, which isapproximately 3400 m/s, the same speed as a 0.05 eV neu-tron. Neutrons below the speed of the spacecraft (most ofthe thermal neutron population) can’t catch up to P4. So,P4 is primarily sensitive to epithermal neutrons. In contrast,P2 “rams” into thermal neutrons that arrive at the orbitalaltitude ahead of the spacecraft. P2 has roughly the samesensitivity as P4 for epithermal neutrons. Consequently, thethermal flux is given by the difference between the countingrates for P2 and P4.
Thermal, epithermal, and fast neutrons are sensitive tosurface and atmospheric parameters, including the abun-dance and stratigraphy of hydrogen in the surface, the pres-ence of strong neutron absorbers such as Cl and Fe in theMartian rocks and soil, the presence of CO2 ice on the sur-face, the column abundance of the atmosphere, and the en-richment and depletion of noncondensable gasses, N2 andAr, as CO2 is cycled through the seasonal caps (Table 2). Theeffect of these parameters on the neutron counting rate canbe explored using a simple physical model of the surface andatmosphere as described in Section 2.2 (Fig. 4a). Modelsof the counting rate are then used to develop algorithms todetermine parameters from observations.
For example, the variation of thermal, epithermal, andfast neutron counting rates as a function of water abundancein a homogeneous surface is shown in Fig. 11a. Epither-mal and fast neutrons are sensitive to hydrogen (as de-scribed in Section 2.2) and their counting rates decreasemonotonically with water abundance. Both are insensitiveto the abundance of elements in the surface other thanhydrogen, as illustrated in Fig. 11a by changing the abun-dance of Cl, which is a strong thermal neutron absorber.In contrast, thermal neutrons are sensitive to variations inmajor-element composition and relatively insensitive to hy-drogen when the abundance of WEH is less than about10%. Epithermal neutrons are a good choice for determin-ing the WEH abundance because of their high counting rateand relative insensitivity to other parameters. Measured

CLBE001-ESS2E November 11, 2006 4:43
Remote Chemical Sensing Using Nuclear Spectroscopy 783
TABLE 2 Sensitivity of neutron energy ranges to Mars surface and atmospheric parameters
Major CO2-free surface Atmospheric/seasonalType Energy Range interactions parameters∗ parameters
Fast >0.2 MeV Inelastic scattering,elastic scattering
WEH abundance andstratigraphy, Averageatomic mass
Atmospheric mass, CO2 icecolumn abundance<100 g/cm2
Epithermal 0.5 eV (Cd cutoff) to0.2 MeV
Elastic scattering WEH abundance andstratigraphy
Atmospheric mass, CO2 icecolumn abundance up toabout 150 g/cm2
Thermal <0.5 eV (Maxwellianenergy distribution)
Elastic scattering,capture (absorption)
WEH abundance,Absorption by Fe, Cl, Ti.Stratigraphy of WEHand absorbers
CO2 ice column abundanceup to about 1000 g/cm2,Absorption by N2 and Ar
∗The surface in the northern or southern hemisphere during summer following the recession of the seasonal cap.
FIGURE 11 (a) Variation of thermal, epithermal, and fast neutron counting rates as a function ofwater abundance for a soil composition with low Cl abundance (black symbols). The red symbolscorrespond to a soil with higher Cl abundance, similar to the average composition of soils at thePathfinder landing site. Note that the epithermal and fast neutron counting rates are unaffectedby the change in Cl abundance. Because Cl is a strong absorber of thermal neutrons, the thermalneutron counting rate is sensitive to Cl abundance. (b) Variation of epithermal counting rate as afunction of CO2 ice column abundance covering homogeneous surfaces containing 7%, 20%, and100% water ice (mixed with dry soil). Observed counting rates can be converted directly towater-equivalent hydrogen abundance or CO2 ice column abundance using the model results inparts a and b as indicated by the arrows. The counting rate during the summer, which is a measureof the water abundance of the underlying surface, must be known in order to select the correcttrend for CO2 ice column abundance.

CLBE001-ESS2E November 11, 2006 4:43
784 Encyclopedia of the Solar System
FIGURE 12 Global map of the abundance (weight fraction) of WEH. The map gives a lower bound on theabundance of WEH. Contours for 4%, 8%, and 20% WEH are shown as dashed white lines. The black contourline corresponds to 0 km elevation. The map data are superimposed on a shaded relief image. (Elevation data andshaded relief image courtesy of the NASA Mars Orbiter Laser Altimeter Science Team.)
epithermal counting rates can be converted directly toWEH as indicated by the arrows in Fig. 11a.
A map of WEH determined from measured epithermalcounting rates is shown in Fig. 12. In order to avoid contri-butions from the seasonal CO2 ice, the northern and south-ern high latitudes only included counting rates measuredduring their respective summers. The algorithm for deter-mining WEH included corrections for minor variations inthe counting rate due to changes in the atmospheric columnabundance with topography. The map gives a lower boundon WEH. Higher WEH abundances could be present ifthe surface is stratified, for example, with a dry top layercovering a water-rich medium.
The minimum WEH abundance on Mars ranges from2% in equatorial and midlatitude regions to nearly 100% forthe north polar water-ice cap. Low abundances of WEH arefound in regions such as northern Argyre Planitia, the mid-latitude, southern highlands, Solis Planum, and the easternflanks of the Tharsis Montes. Correlations between WEHand topography suggest that some aspects of the surface dis-tribution of WEH can be explained by regional and globalweather patterns. Moderate WEH abundances (8–10%)can be found in large equatorial regions, for example, inArabia Terra. Ice stability models predict that water-ice isnot stable at equatorial latitudes on Mars under present cli-
mate conditions. Consequently, the moderate abundancesof WEH may be in the form of hydrated minerals, possiblyas magnesium sulfate hydrate. High abundances of WEHare found at high northern and southern latitudes (polewardof 60◦). A detailed analysis of neutron and gamma ray count-ing rates suggests that the high latitude surface outside ofthe residual caps consists of soil rich in water-ice coveredby a thin layer of dessicated material (soil and rocks). Thisresult is consistent with models that predict that water ice isstable at shallow depths at high latitudes. Similar terrestrialconditions are observed in the Dry Valleys of Antarctica,where ice is stable beneath a dry soil layer that provides ther-mal and diffusive isolation of the ice from the atmosphere.
Seasonal variations on Mars are driven by its obliquityrelative to the orbital plane, which is similar to that of Earth.In the polar night in the northern and southern hemi-spheres, atmospheric CO2 condenses to form ice on thesurface. Approximately 25% of the martian atmosphere iscycled into and out of the northern and southern seasonalcaps. Consequently, the seasonal caps play a major role inatmospheric circulation. The main questions about the sea-sonal caps that remain unanswered concern the local energybalance, polar atmospheric dynamics, and CO2 condensa-tion mechanisms. Seasonal parameters constrained by neu-tron spectroscopy include the column abundance of CO2

CLBE001-ESS2E November 11, 2006 4:43
Remote Chemical Sensing Using Nuclear Spectroscopy 785
FIGURE 13 (a) Orthographic projections of epithermal counting rates in northern and southernhemispheres of Mars during early northern spring and late southern winter (red lines indicatethe edge of the seasonal caps determined from data acquired from the MGS Thermal EmmissionSpectrometer). Cap edge data provided by T. Titus of the USGS Astrogeology team. (b) Epithermalcounting rate as a function of time at the north and south pole (poleward of 85◦); (c) total mass ofCO2 in the southern seasonal cap poleward of 60◦S from a general circulation model is comparedto that determined from the epithermal counting data. (General circulation model results courtesyof NASA Ames Research Center and the New Mexico State University Department of Astronomy.)
ice on the surface and the column abundance of noncon-densable gasses (N2 and Ar) in the atmosphere. For ex-ample, analyses of gamma ray and neutron spectroscopydata reveal that the southern atmosphere is strongly en-riched in N2 and Ar during cap growth. The observed en-richment may be caused by the formation of a strong polarvortex accompanying the condensation flow, which inhibitsmeridional mixing of the polar atmosphere with lowerlatitudes.
Based on simulations, the epithermal neutron count-ing rate generally increases with the column abundance ofCO2 ice on the surface; however, the trend depends on theabundance of water ice in the underlying surface as is shownin Fig. 11b. The sensitivity of epithermal neutrons to CO2
ice is higher for surfaces that contain more water ice. Athigh latitudes, the column abundance of CO2 can be deter-mined from seasonal epithermal counting rates, given thecounting rate during summer, when no CO2-ice is present.
Maps of epithermal counting rates are shown in Fig. 13a.The extent of the seasonal caps can be seen by comparingmaps of the northern and southern hemispheres during thetwo time periods shown in Fig. 13a. For example, duringlate southern winter, low counting rates are observed in thenorthern high latitudes, corresponding to the summertimeCO2 frost-free surface, which contains abundant water ice.In early northern spring, elevated epithermal counting ratesare observed in the northern hemisphere, corresponding toCO2 ice on the surface.

CLBE001-ESS2E November 11, 2006 4:43
786 Encyclopedia of the Solar System
During their respective winters, the counting rate at highlatitudes increases towards the poles, which indicates thatthe CO2 ice column abundance increases with latitude. Theobserved spatial variation is expected since the polar nightlasts longer at higher latitudes and frost has more time toaccumulate. The time variation in epithermal counting ratesfor the north and south poles (poleward of 85◦), shown inFig. 13b, reveals the cyclic behavior of the seasonal capsduring two Mars years. The total inventory of CO2 in theseasonal caps determined from epithermal counting datais similar to that predicted by general circulation models(GCMs) (for example, see Fig. 13c). The ability to mea-sure the thickness of the CO2 caps in the polar night isunique to gamma ray and neutron spectroscopy. Local icecolumn abundances determined by nuclear spectroscopycan be compared to GCM predictions, providing informa-tion needed to improve physical models of the seasonal capsand the polar energy balance.
6. Future Prospects
Given the number of orbiters, landers, and rovers targetingMars and the renewed emphasis on lunar exploration, theMoon and Mars will be the focus of planetary science foryears to come. On the Moon, neutron spectrometers may beused on rovers or incorporated into borehole logging toolsto search for and characterize water-ice deposits in polarcraters. On Mars, gamma ray and neutron spectrometersmay be included on rovers, landers, weather stations, anddrilling systems for in situ determination of composition,for example, to investigate small spatial scale variations incomposition and to look for water deep within the Martiansurface. In addition, there may be opportunities for low-altitude, high-spatial resolution measurements of selectedregions from an airplane or balloon platform. Continued ef-fort is needed to analyze and interpret data already acquiredby Lunar Prospector and Mars Odyssey and to synthesizethe information with other data sets to develop a coherentpicture of the Moon and Mars. Orbital nuclear spectroscopywill also play an important role on future solar system ex-ploration missions. For example, the MESSENGER mis-
sion to Mercury and the Dawn mission to the main asteroidbelt include gamma ray and neutron spectrometers on theirpayloads.
Bibliography
Boynton, W. V., et al. (2004). The Mars Odyssey gamma-rayspectrometer instrument suite. Space Science Rev. 110, 1–2, 37–83.
Duderstadt, J. J., and L. J. Hamilton (1967). “Nuclear ReactorAnalysis” John Wiley & Sons.
Elphic, R. C., et al. (2002). Lunar Prospector neutron spec-trometer constraints on TiO2. J. Geophys. Res. 107, E4, 5024,10.1029/2000JE001460.
Feldman, W. C., et al. (2001). Evidence for water ice near thelunar poles. J. Geophys. Res. 106, 23, 231–23, 251.
Feldman, W. C., et al. (2004). Gamma-ray, neutron, and alpha-particle spectrometers for the Lunar Prospector mission. J. Geo-phys. Res. Planets. 109, E7, p. E07S06.
Feldman, W. C., et al. (2004). Global distribution of near-surface hydrogen on Mars. J. Geophys. Res. Planets. 109, E9,p E09006.
Knoll, G. F. (1989). “Radiation detection and measurement”2nd edition, John Wiley & Sons.
Lawrence, D. J., et al. (2000). Thorium abundances on thelunar surface. J. Geophys. Res. 105(E8), 20, 307–20, 331.
Lawrence, D. J., et al. (2002). Iron abundances on the lu-nar surface as measured by the Lunar Prospector gamma-rayand neutron spectrometers. J. Geophys. Res. 107(E12), 5130,doi:10.1029/2001JE001530.
Pieters, C. M., and P. A. J. Englert, Eds. (1993). “Remote Geo-chemical Analysis: Elemental and Mineralogical Composition”Cambridge University Press.
Prettyman, T. H., et al. (2004). Composition and struc-ture of the Martian surface at high southern latitudes fromneutron spectroscopy. J. Geophys. Res. 109, p. E05001,doi:10.1029/2003JE002139.
Prettyman, T. H., et al. (2006). Elemental composition of thelunar surface: Analysis of gamma ray spectroscopy data from LunarProspector. J. Geophys. Res. 111, doi:10.1029/2005JE002656, inpress.
Reedy, R. C. (1978). Planetary gamma-ray spectroscopy. Pro-ceedings of the 9th Lunar and Planetary Science Conference, pp.2961–2984.