un-common solutions to common problemsuniversulphur.com/mespon/2015_presentations/session... ·...
TRANSCRIPT

Un-Common Solutions to
Common Problems
Presented at MESPON October, 2015, Abu Dhabi
Kuppuswamy Thiyagarajan

2 2
Case Study-1
Energy Conservation by increasing Amine strength.
MDEA is used extensively in gas plants across the world for
H2S absorption and partial CO2 slip.
Used at strengths from 40 to 45 wt%
Many tests and publications compare 50 wt% MDEA as
typical strength at usage with other type of amines.
Many gas plants are units designed for 45 wt% operation.

3 3
Description
MDEA strength can be increased by about 5 wt% say from
45 to 50 %.
Results in reduction of water in the amine.
As total MDEA content in amine remains the same, no
change to acid gas loading or specifications.

4 4
Projected Circulation reduction
Reduction in amine circulation quantified as follows: t/hr %
At 45 wt% Water 550 55
Amine 450 45
Total 1000
At 50 wt% Water 450 50
Amine 450 50
900
Reduction in 100 m3/hr
circulation

5 5
Heating Requirements*
For gas plants , typical heat requirement for AGRU regenerator is as
follows:
• 50-60% to break bond between MDEA and acid gas
• 20-25% for reflux
• 20-25% for heating amine to feed temperature.
* typical data with PHE

6 6
Projected savings
10% reduction in amine circulation and the energy costs to
heat and cool is conserved.
Further, reduction in pumping costs from atmosphere
pressure to about 70 barg.
Estimated savings on steam is about 5%. Actual savings
achieved were more!!
Power costs

7 7
Other Benefits
CO2 slip in amine absorber column of lean gas increased
Amine velocity reduction of up to 10%, erosion corrosion
reduces proportionately.
Flow induced vibration issues,if any, reduces.
Higher H2S content in acid gas to SRU expected to improve
performance. 1% rejection of CO2 in sales gas is equivalent
to 5% increase in H2S content in SRU feed.

8 8
Effects of MDEA concentration
De-Merits:
Increased MDEA concentration directionally increases
hydrocarbon solubility.
BTEX solubility increases at higher rate as MDEA strength
increases.
Wet CO2 corrosion of sweet gas ??
Merits
Increase in absorption temperature decreases HC solubility.
Hence the HC solubility effects can cancel each other to some
extent.

9 9
Case Study-2
Purpose:
Maximization of CO2 in sales gas within specifications to meet
design intent.
Reduces energy requirements due to lower CO2 absorption
Improves SRU feed quality
Probable reasons for increased CO2 absorption
Generous design margins (number of trays, weir height etc.,)
Column design for extreme case than actual operating case.
New column/unit or post TA (clean internals and pristine amine)

10 10
Design Intent
Description Unit Design Unit-A Unit-B
Amine conc % 45 44.3 44.3
CO2 in sweet gas
% 2.5 0.55 1.2
Amine loading m/m 0.45 0.48 0.45
Feed tray at 3 locations, weir height 50 mm.

11 11
Observed factors affecting CO2 absorption
Feed tray location and weir height
H2S loading
Temperature inside the column
Contact time and mixing/agitation

12 12
Amine Concentration effects
Viscosity increases, affecting the mass transfer
Circulation reduces , affecting the mixing/turbulence
Action taken and results observed
Concentration was increased by 4%
Flow decreased twice that amount
Agitation/turbulence expected to reduce

13 13
Amine Concentration effects
Before After
Amine conc % 44.4 48.8
Gas feed rate 50% design 50% design
AG loading m/m 0.54 0.49
CO2 in sweet gas % 0.57 0.8
Steam/amine Kg/m3 194 195
AG flow Base 93%

14 14
Benefits
Steam flow reduced by 5%- reduced regenerator load.
Acid gas flow reduced by 7%- increased RF residence
time and/or additional spare capacity.
Fuel gas savings in Co-firing, incinerator etc.,- Other
tangible benefits.

15 15
Case Study-3
Rich Amine control valve location- normally close to
regenerator feed inlet nozzle
To reduce flashing/H2S breakout downstream of CV
Single phase preferred due to velocity/corrosion and
vibration

16 16
Project Experience
Rule of thumb violated.
Valve placed at ground level and about 35m away from
feed nozzle.
Contractor insists it is better this way
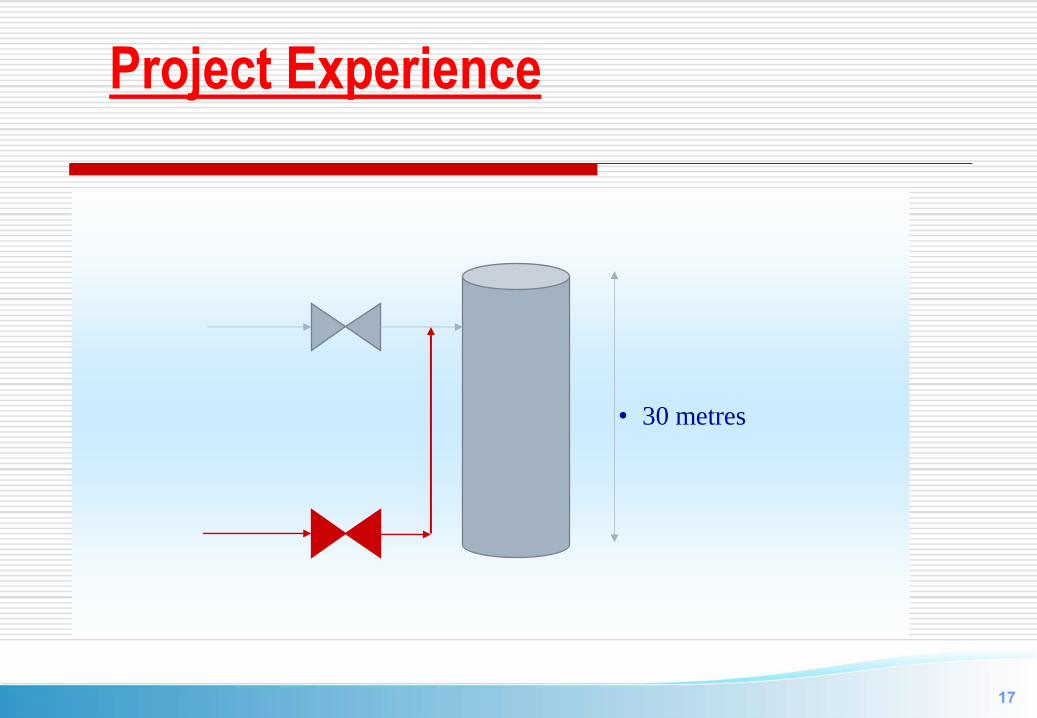
17 17
• 30 metres
Project Experience

18 18
• 2 phase flow at inlet to CV – difficult to control
• Weight of 30” control valve require extra strong support (>1000 kg)
• Bracing required anyway due to the elevation.
• Easy maintenance and accessibility
Project Experience
30 m elevation equals about 3 bar liquid column
Inlet to CV Vapour wt% Vapour Vol%
At feed elevation 1% 60%
At Ground level 0.5% <30%
19 19
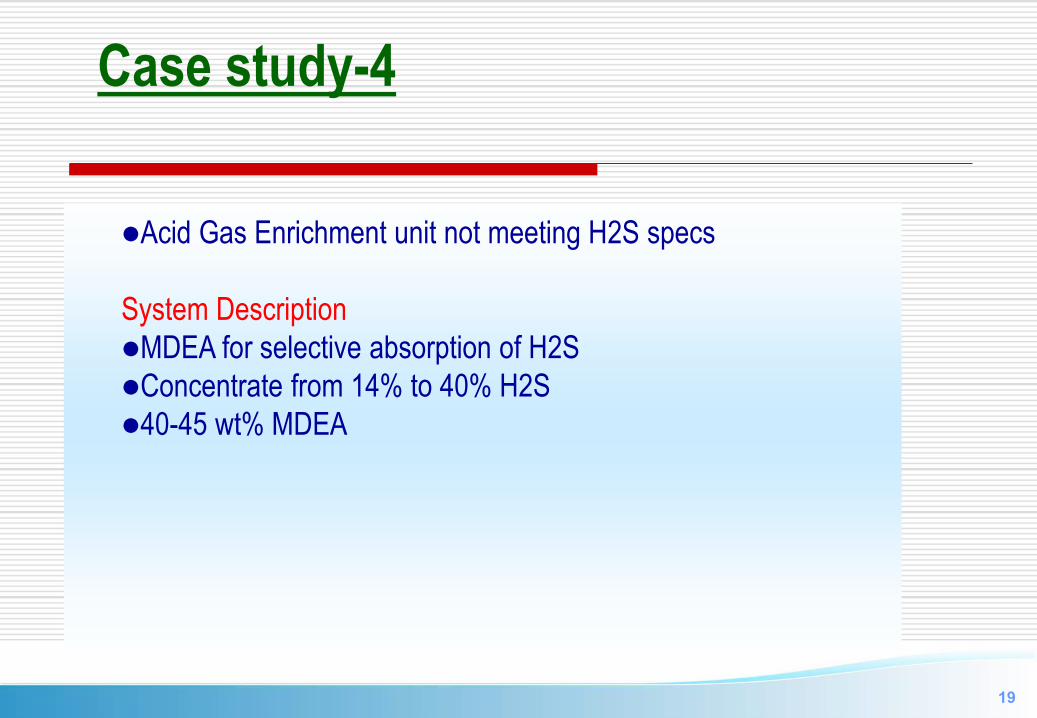
Case study-4
Acid Gas Enrichment unit not meeting H2S specs
System Description
MDEA for selective absorption of H2S
Concentrate from 14% to 40% H2S
40-45 wt% MDEA

20 20
Trouble shooting-Variables
Amine Strength
Amine circulation
Lean Amine temperature
H2S in Lean Amine
Absorber pressure
Off gas temperature

21 21
Approach Temperature

22 22
Temperature vs H2S slip

23 23
Fin fan conundrum
Design approach 9 deg c
HTRI indicates reasonable surface area
Actual approach is 20-30 deg c
Fin-fan blade angle adjusted- little improvement in
performance
Reverse calculation with HTRI indicated the clue

24 24
Fin fan conundrum-Continued
Air flow required for 20 deg approach is less than half
the design flow.
Fin fan inspection indicated fouling of fins.
Water wash cleans only top or bottom rows but other 4
rows in between are barely touched by water.
Moisture and dust storms covered inter-tube area
Very high resistance to air flow and even blade
adjustments does not yield any results.

25 25
Proposed solutions
Foam cleaning- several times until air flow improves.
Phosporic acid to improve performance.

26 26
Case Study-5
Problem- Very high SO2 content in Tail gas and severe
fluctuation in H2S:SO2 ratio.
Feed rate and composition fluctuated that started the
synchronous dance of H2S:SO2
Feed forward control for flow and composition, trim air
control valve wind up check, Air demand control in Auto.

27 27
Trend of H2S:SO2 when normal

28 28
Synchronous Dance

29 29
Probable causes
After eliminating analyzer issues, control was taken into
manual and allowed to settle after several hours.
Analyzer Time lag was ruled out and so was auto-
calibration time (2 minutes every 4 hours)
Typical case of SNAGU (Situation Normal but All
Goofed Up)

30 30
Probable causes-The Eureka moment
Paper on Analyzer BP on SRU/TGTU provided an hint.
SRU catalysts have huge micro pores where reaction
occur.
Each gram of catalyst has several hundred m2 area
When SO2 is offscale, it soaks up in the micro pores.
Gets released and/or converted when air is cut until
H2S is in excess.
Two reactor in series confounds the issue.
Left to the analyzer, it might have taken longer or never
to stabilize.

31 31
Lessons Learned
Over range the So2 and H2S to understand what is
happening.
Believe the analyzer ( sometimes!!!)
Mathematical corrections in analyzer for Sv and
COS/CS2 are applicable for normal operation and one
particular set of operating conditions.
Expect un-predictable readings when off scale
operation.
Expect SO2 soaking and take ADA controller in manual.

32 32
Thank you.
Questions ?