under pressure - images.thinkadvisor.com · broker dealer financial services corp. 235 37 49 37...
TRANSCRIPT

Though more investors than ever are saving money for retirement, independent BDs operate in a complicated
and ever-changing business environment
UNDER PRESSURE: The 2017 Broker-Dealer
Reference Guide
2017 2016 2015Number of companies included in directory: 51 67 74
Total number of representatives in directory: 59,485 77,562 77,562
Average number of reps per firm: 1,166 1,158 1,268
Number of reps added or dropped: 5,188 / 5,392 7,100 / 7,012 11,664 / 8,007
Average annual gross production per rep: $231,942 $219,531 $212,587
Average AUM per representative ($ mil.): $30.95 $26.95 $23.93
Average gross revenue per BD ($ mil.): $174.54e* $302.62 $309.42
Average fee-based revenue per BD ($mil.): $78.20e* $118.90 $115.80
For the firms participating in Investment Advisor’s annual Broker-Dealer Reference Guide, the competitive and convoluted
atmosphere they face today can be perplexing. Advisors, clients and regulators are asking more and more of them, which translates into higher expenses. Still, investors are contributing more to retirement and other accounts, and positive returns in the equity markets have been lifting balances recently.
Yet industry consolidation continues. The number of inde-pendent broker-dealers stands at around 3,900, according to Fishbowl Strategies, down from nearly 4,600 in 2010, and at least 1,000 of these firm have less than 10 registered reps. Meanwhile, the number of RIAs is expanding and is close to 12,200.
The 2017 Broker-Dealer Reference Guide reveals some
striking information. For instance, the number of reps leaving firms in this year’s survey surpassed the number joining them. Still, the average head-count at firms participating in the survey rose by
a handful from last year, reaching 1,166 per BD in 2017. Furthermore, the average level of fees and commissions per
rep, or gross production, is rising. In fact, it is close to $232,000 — a jump of 6% from 2016 and 9% from 2015. Average assets per advisor are expanding at an even more aggressive pace. This figure is close to $31 million, up about 15% from a year ago. Nonetheless, average gross revenue per IBD dropped slightly from 2015 to 2016, illustrating the fact that many firms face intense competition for their advisors, clients and business. The fee-based figure, though, improved during the same period.
* Estimate based on data from 32 BDs, with many large firms declining to provide 2017 estimates.
By JANET LEVAUX
Data compiled by LIANA ROBERTS

Company Name
BD Gross Revenues ($ Million)
BD Total Expenses ($ Million)
Fee-Based Revenues ($ Million)
Avg. Gross Dealer Con per Rep ($ Thousand)
LPL Financial LLC $3,980.0 $3,560.0 $1,290.0 $208.7
Raymond James Financial Services Inc. $1,790.0 - $855.0 $554.0
Commonwealth Financial Network $1,068.7 - $644.5 $508.5
Cambridge Investment Research $711.5 $669.0 $388.3 $244.2
Securities America $535.7 - $248.5 $234.0
Cetera Advisor Networks LLC $519.5 - $210.3 $192.0
Waddell & Reed Financial Advisors $487.4 - $224.5 $242.8
Royal Alliance Associates Inc. $466.8 - $231.5 $262.0
Kestra Financial Inc. $423.1 - $197.8 $320.4
Questar Capital Corporation $405.7 - $14.8 $152.8
MML Investors Services LLC $367.6 $361.0 $96.7 $85.4
Signator Investors Inc. $357.3 - $80.9 $160.1
Securian Financial Services Inc./CRI Securities LLC $325.6 - $100.9 $238.6
SagePoint Financial Inc. $307.6 - $102.8 $212.8
Cetera Advisors LLC $283.1 - $125.2 $175.0
FSC Securities Corp. $274.1 - $109.0 $251.2
Cetera Financial Institutions $263.0 - $25.9 $123.4
Woodbury Financial Services Inc. $253.9 - $53.6 $219.9
First Allied Securities Inc. $227.1 - $67.5 $264.3
Triad Advisors Inc. $173.0 - $88.0 $288.7
Cadaret, Grant & Co. Inc. $149.5 $149.0 $41.2 $196.0
M Holdings Securities Inc. $148.0 $9.1 $16.0 $259.9
Centaurus Financial Inc. $144.5 - $34.6 $228.6
Summit Brokerage Services Inc. $144.0 - $35.4 $248.2
Ameritas Investment Corp. $132.1 $130.9 $34.5 $108.3
Cetera Financial Specialists $128.8 - $59.7 $88.9
Independent Financial Group $122.9 - $42.0 $241.9
Securities Service Network Inc. $111.6 - $46.7 $264.0
NEXT Financial Group Inc. $107.8 $107.5 $37.0 $166.7
ProEquities Inc. $106.2 - $54.7 $117.5
Geneos Wealth Management $104.5 $103.0 $58.2 $403.0
United Planners Financial Services $97.3 $86.7 $44.8 $221.8
American Portfolios Financial Services Inc. $91.7 $90.8 $79.8 $233.8
Sigma Financial Corporation $86.6 - $31.6 $127.8
Kovack Securities Inc. $65.4 $61.4 $28.2 $176.7
The O. N. Equity Sales Co. $56.7 $55.7 $8.4 $87.6
Girard Securities Inc. $49.7 - $15.4 $219.0
The Investment Center Inc. $45.1 $44.7 $15.6 $162.0
Prospera Financial Services Inc. $44.0 $42.0 $19.0 $464.0
The Strategic Financial Alliance $43.2 $42.5 $18.4 $349.0
Parkland Securities LLC $42.3 - $10.7 $112.5
Crown Capital Securities, L.P. $41.0 - $11.0 $114.9
Harbour Investments Inc. $37.0 $36.3 $12.5 $190.0
Kalos Capital $34.5 - $6.0 $313.6
Founders Financial Securities LLC $23.2 $22.0 $16.0 $336.0
Century Securities Associates Inc. $16.9 - - $150.0
Broker Dealer Financial Services Corp. $11.6 $8.5 $5.4 $101.0
Halliday Financial $11.2 $8.3 $3.2 $278.0
Lion Street Financial LLC. $8.2 $2.2 $0.8 $126.0
Signal Securities Inc. $5.1 $5.0 $2.2 $110.0
Peak Brokerage Services $2.5 $2.5 $0.3 $210.0
The largest broker-dealers are taking on more and more tasks for their advisors, which requires that firms invest
more resources than in the past. The biggest IBD by sales is LPL Financial, with nearly $4 billion in gross revenues last year. That’s more than double the level produced by its closest rivals.
“LPL Financial is successful because we allow our advisors to focus on generating revenue by helping them eliminate, automate or outsource activities that can be time-consuming and burdensome in today’s world,” explained LPL Financial’s Andy Kalbaugh, head of national sales and consulting.
Top Broker-Dealers by 2016 BD Gross Revenue

Company Name
Overall Prod. Reps as of Dec. 31, 2016
Advisors Added in 2016
Advisors Dropped in 2016
Number of Years in Business
LPL Financial LLC 14,377 - - 49
Raymond James Financial Services Inc. 3,827 318 89 43
MML Investors Services LLC 3,737 161 401 36
Cambridge Investment Research 3,005 428 312 36
Cetera Advisor Networks LLC 2,288 121 308 33
Securities America 2,209 - - 33
Signator Investors Inc. 2,152 1032 320 49
Waddell & Reed Financial Advisors 1,780 384 421 80
Commonwealth Financial Network 1,710 96 40 38
Cetera Financial Institutions 1,684 407 559 32
Royal Alliance Associates Inc. 1,566 85 139 28
Kestra Financial Inc. 1,321 81 143 18
SagePoint Financial Inc. 1,287 187 176 47
Cetera Advisors LLC 1,261 336 155 35
Securian Financial Services Inc./CRI Securities LLC 1,214 181 200 34
Cetera Financial Specialists 1,186 31 87 35
Ameritas Investment Corp. 1,012 88 374 34
Woodbury Financial Services Inc. 1,004 84 155 107
FSC Securities Corp. 952 56 100 59
Cadaret, Grant & Co. Inc. 710 64 75 32
ProEquities Inc. 705 38 350 32
First Allied Securities Inc. 692 13 26 22
American Portfolios Financial Services Inc. 675 79 76 16
Questar Capital Corporation 651 89 93 20
The O. N. Equity Sales Co. 647 88 85 49
Centaurus Financial Inc. 640 62 55 25
NEXT Financial Group Inc. 619 21 87 18
Triad Advisors Inc. 600 52 62 19
Sigma Financial Corporation 568 37 58 34
M Holdings Securities Inc. 558 - - 17
Summit Brokerage Services Inc. 551 150 51 23
Independent Financial Group 508 0 0 14
United Planners Financial Services 430 76 11 30
Kovack Securities Inc. 385 39 69 20
Parkland Securities LLC 373 28 37 15
Crown Capital Securities, L.P. 357 23 11 18
Securities Service Network Inc. 347 43 51 34
Geneos Wealth Management 259 8 21 15
The Investment Center Inc. 238 28 29 31
Broker Dealer Financial Services Corp. 235 37 49 37
Girard Securities Inc. 200 13 26 17
Harbour Investments Inc. 198 31 20 30
Prospera Financial Services Inc. 133 16 12 35
Century Securities Associates Inc. 125 4 4 32
The Strategic Financial Alliance 125 17 27 14
Kalos Capital 110 13 8 18
Founders Financial Securities LLC 75 5 0 11
Lion Street Financial LLC. 65 19 13 4
Signal Securities Inc. 49 2 3 33
Peak Brokerage Services 44 14 3 7
Halliday Financial 41 3 1 35
LPL tops this chart, too, with nearly 14,400 affiliated advi-sors. “[Our] business model creates flexibility for our
advisors, allowing them to grow and evolve without having to change their broker-dealer partner. That has been our secret sauce for many years,” said Kalbaugh.
Other IBDs on the list aim to expand, but they don’t necessar-ily need their size and scale to match LPL’s. “We’re large enough
to provide the integrated, more sophisticated resources of our largest competitors, but within a culture that’s very relation-ship-driven,” Raymond James President Scott Curtis explained.
For Cambridge Investment Research, private ownership offers a way to “control our own destiny,” said President and CEO Amy Webber, and allows the firm to “allocate resources on innovation even in the face of significant regulatory change.”
Top Broker-Dealers by Number of Registered Reps
Company Name
Average Annual Gross Production per Advisor
Average Total AUM per Rep ($ Million)
AUM in Fee-Based Programs ($ Billion)
Excess Capital ($ Million)
Raymond James Financial Services Inc. $553,700 $78.00 $113.00 $26.80
Commonwealth Financial Network $508,250 $66.91 $61.95 $14.90
Prospera Financial Services Inc. $464,000 $48.00 $1.55 $3.64
Geneos Wealth Management $403,315 $55.00 $7.00 -
The Strategic Financial Alliance $370,000 $34.50 $1.70 $1.79
Founders Financial Securities LLC $350,000 $31.30 $0.84 $0.63
First Allied Securities Inc. $328,118 $40.99 $9.02 -
Kestra Financial Inc. $320,390 $57.23 $19.21 -
Securities Service Network Inc. $315,276 $39.31 $5.45 $5.55
Kalos Capital $313,636 $40.00 - -
Triad Advisors Inc. $288,736 $43.00 $15.20 $11.03
Halliday Financial $278,000 $42.00 $0.39 -
Royal Alliance Associates Inc. $261,968 $38.82 $26.49 $40.30
Summit Brokerage Services Inc. $261,255 $31.96 $4.13 -
M Holdings Securities Inc. $259,879 $12.19 $4.43 $1.30
American Portfolios Financial Services Inc. $254,054 $32.20 $6.84 $2.40
FSC Securities Corp. $251,209 $37.53 $12.73 $22.40
Girard Securities Inc. $248,340 $40.16 $1.72 -
Cambridge Investment Research $244,238 $26.95 $41.53 $16.26
Independent Financial Group $241,900 - $4.63 -
Securian Financial Services Inc./CRI Securities LLC $238,600 $19.03 $11.78 -
Securities America $233,976 $31.23 $26.30 $8.68
Centaurus Financial Inc. $228,624 $20.00 $2.80 $9.30
Cetera Advisor Networks LLC $227,073 $32.02 $20.45 -
United Planners Financial Services $226,385 $30.02 $5.29 $4.74
Waddell & Reed Financial Advisors $225,559 $19.52 - $52.39
Woodbury Financial Services Inc. $219,923 $31.57 $6.48 $20.60
SagePoint Financial Inc. $212,830 $30.36 $10.79 $26.00
Peak Brokerage Services $210,000 $22.00 $12.00 -
LPL Financial LLC $208,720 $35.40 $211.60 $109.83
Cetera Advisors LLC $208,036 $27.36 $12.54 -
Harbour Investments Inc. $207,000 $35.00 $1.60 $0.60
Cadaret, Grant & Co. Inc. $195,969 - $3.87 $8.80
Kovack Securities Inc. $176,708 $21.47 $3.13 $1.88
NEXT Financial Group Inc. $166,666 $23.20 $3.61 $2.90
Signator Investors Inc. $160,128 $22.30 $7.96 $8.55
Cetera Financial Institutions $156,197 $18.01 $2.47 -
Questar Capital Corporation $152,800 $17.90 $1.50 $4.38
Sigma Financial Corporation $139,818 $16.58 $3.24 -
Lion Street Financial LLC. $125,000 $53.00 $0.29 $0.32
ProEquities Inc. $117,500 - $2.90 $7.30
Ameritas Investment Corp. $116,919 $18.00 $4.09 $7.92
Crown Capital Securities, L.P. $114,917 $10.86 $1.14 $2.76
Parkland Securities LLC $112,464 $14.60 $0.97 -
Cetera Financial Specialists $108,612 $16.70 $6.37 -
Signal Securities Inc. $105,000 $18.00 $0.27 $0.27
Broker Dealer Financial Services Corp. $91,000 $0.91 $0.65 $0.27
The O. N. Equity Sales Co., $87,589 $13.81 $1.01 $2.24
MML Investors Services LLC $74,862 $19.56 $15.30 $17.58
Century Securities Associates Inc. - - - $2.00
The Investment Center Inc. - $40.00 $2.10 -
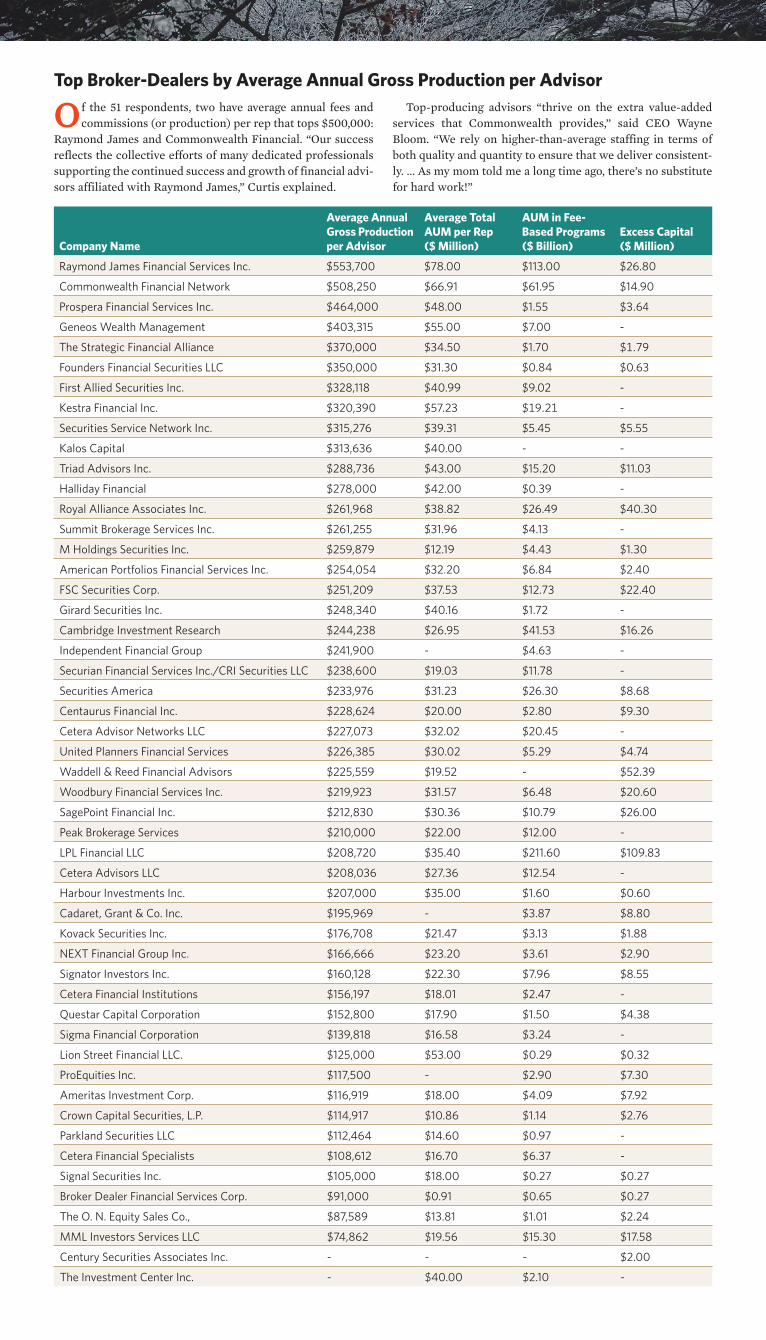
Of the 51 respondents, two have average annual fees and commissions (or production) per rep that tops $500,000:
Raymond James and Commonwealth Financial. “Our success reflects the collective efforts of many dedicated professionals supporting the continued success and growth of financial advi-sors affiliated with Raymond James,” Curtis explained.
Top-producing advisors “thrive on the extra value-added services that Commonwealth provides,” said CEO Wayne Bloom. “We rely on higher-than-average staffing in terms of both quality and quantity to ensure that we deliver consistent-ly. ... As my mom told me a long time ago, there’s no substitute for hard work!”
Top Broker-Dealers by Average Annual Gross Production per Advisor

Company NameReps With Their Own RIA
Number of CFPs in Total Rep Force
Average Years Experience per Advisor
Triad Advisors Inc. 75.8% 34.5% 20
Peak Brokerage Services 52.3% 6.8% 16
United Planners Financial Services 48.8% 23.7% 30
Royal Alliance Associates Inc. 41.3% - -
LPL Financial LLC 33.3% - 18
Securities Service Network Inc. 29.7% 33.4% 22
Kalos Capital 29.1% 13.6% 20
FSC Securities Corp. 23.7% - -
ProEquities Inc. 20.6% - -
American Portfolios Financial Services Inc. 19.4% 13.9% 18
M Holdings Securities Inc. 18.1% 14.0% -
Securities America 17.1% 29.2% -
Lion Street Financial LLC. 16.9% 12.3% 20
Independent Financial Group 15.9% 17.3% 17
Crown Capital Securities, L.P. 13.4% 21.8% 18
Cambridge Investment Research 11.9% 25.4% 19
Geneos Wealth Management 11.6% 40.5% 20
SagePoint Financial Inc. 10.6% 20.4% 20.56
Commonwealth Financial Network 10.1% 42.6% -
Halliday Financial 7.3% 24.4% 22
Broker Dealer Financial Services Corp. 7.2% 9.4% 10
Kovack Securities Inc. 6.8% 17.7% 21
The Strategic Financial Alliance 6.4% 47.2% 20
Harbour Investments Inc. 6.1% 16.2% 15
Cadaret, Grant & Co. Inc. 5.4% 17.6% -
Prospera Financial Services Inc. 5.3% 9.0% 27
Raymond James Financial Services Inc. 2.8% 23.9% 20
NEXT Financial Group Inc. 2.7% 10.3% -
The Investment Center Inc. 2.1% 10.1% 15
Signal Securities Inc. 2.0% 18.4% 21
Centaurus Financial Inc. 1.6% 37.5% 22
Kestra Financial Inc. 1.0% 21.4% 18
Signator Investors Inc. 0.2% 24.2% -
Woodbury Financial Services Inc. 0.1% 0.0% -
Ameritas Investment Corp. 0.1% 0.0% 5
Century Securities Associates Inc. 0.0% 24.0% 26
Founders Financial Securities LLC 0.0% 32.0% 20
MML Investors Services LLC 0.0% 0.0% -
Parkland Securities LLC 0.0% 7.8% 10
Questar Capital Corporation 0.0% 0.0% -
Securian Financial Services Inc./CRI Securities LLC 0.0% 18.0% -
Sigma Financial Corporation 0.0% 16.5% 10
Cetera Advisor Networks LLC 0.0% 0.0% 22
Cetera Advisors LLC 0.0% 0.0% 21
Cetera Financial Institutions 0.0% 0.0% 15
Cetera Financial Specialists 0.0% 0.0% 17
First Allied Securities Inc. 0.0% 0.0% 21
Girard Securities Inc. 0.0% 0.0% 22
The O. N. Equity Sales Co. 0.0% 17.8% -
Summit Brokerage Services Inc. 0.0% 0.0% 21
Waddell & Reed Financial Advisors 0.0% 15.2% 12
The popularity of RIAs is on the rise, which some firms are eager to support. “Triad Advisors was founded nearly
two decades ago with an exclusive focus on supporting hybrid advisors, including those with their own RIA,” said CEO Jeff Rosenthal. “This was years before the concept of being a hybrid advisor, let alone having your own RIA or hybrid RIA, was as mainstream within the industry as it is today.”
Today, growing regulatory issues favor IBDs that work with the major custodians, Rosenthal said. Triad believes its younger, more diverse advisor population benefits its growth and perfor-mance. “When you combine that with a boutique service cul-ture that also benefits from the Ladenburg Thalmann resources, you have an extremely strong value proposition,” he explained, adding that most of its management team is part of Gen X.
Top Broker-Dealers by Number of Reps With Their Own RIA
Company NameRatio of reps to home office
Total Home Office Staff
Number of Recruiters
Number of Compliance Professionals
Century Securities Associates Inc. 1.0 120 - -
Raymond James Financial Services Inc. 1.3 3,044 15 -
Halliday Financial 1.8 23 2 6
Commonwealth Financial Network 2.1 803 9 71
Prospera Financial Services Inc. 2.8 48 3 9
Kalos Capital 3.1 36 1 2
Waddell & Reed Financial Advisors 3.3 537 5 57
Summit Brokerage Services Inc. 3.5 158 - -
Parkland Securities LLC 3.6 105 4 30
Securities America 3.8 587 12 102
Broker Dealer Financial Services Corp. 3.9 60 6 7
The Strategic Financial Alliance 4.0 31 1 7
Cambridge Investment Research 4.2 712 12 47
First Allied Securities Inc. 4.4 158 - -
Founders Financial Securities LLC 4.4 17 0 4
LPL Financial LLC 4.5 3,189 67 255
Geneos Wealth Management 4.8 54 2 13
Girard Securities Inc. 5.0 40 - -
NEXT Financial Group Inc. 5.0 123 4 24
Cetera Financial Institutions 5.3 316 - -
Sigma Financial Corporation 5.4 105 4 30
Signal Securities Inc. 5.4 9 2 2
Kestra Financial Inc. 5.5 241 - 56
Peak Brokerage Services 5.5 8 1 3
FSC Securities Corp. 5.5 173 4 30
Kovack Securities Inc. 5.7 68 1 16
Securities Service Network Inc. 5.8 60 3 11
Woodbury Financial Services Inc. 5.8 173 2 30
Securian Financial Services Inc./CRI Securities LLC 6.3 194 2 31
The Investment Center Inc. 6.3 38 2 6
Cadaret, Grant & Co. Inc. 6.3 112 1 15
ProEquities Inc. 6.4 110 3 29
American Portfolios Financial Services Inc. 6.4 105 2 16
Lion Street Financial LLC. 6.5 10 2 3
SagePoint Financial Inc. 7.4 173 5 30
Centaurus Financial Inc. 7.5 85 3 18
Independent Financial Group 7.6 67 2 21
United Planners Financial Services 7.7 56 4 6
Questar Capital Corporation 7.8 83 8 15
Triad Advisors Inc. 8.0 75 4 17
Cetera Advisor Networks LLC 8.0 285 - -
Cetera Advisors LLC 8.1 155 - -
Signator Investors Inc. 8.2 261 5 48
Ameritas Investment Corp. 8.8 115 0 23
Royal Alliance Associates Inc. 9.1 173 4 30
Harbour Investments Inc. 9.9 20 13 3
Cetera Financial Specialists 12.1 98 - -
The O. N. Equity Sales Co. 13.2 49 1 12
Crown Capital Securities, L.P. 13.7 26 3 8
M Holdings Securities Inc. 16.9 33 3 12
MML Investors Services LLC 18.5 202 - -
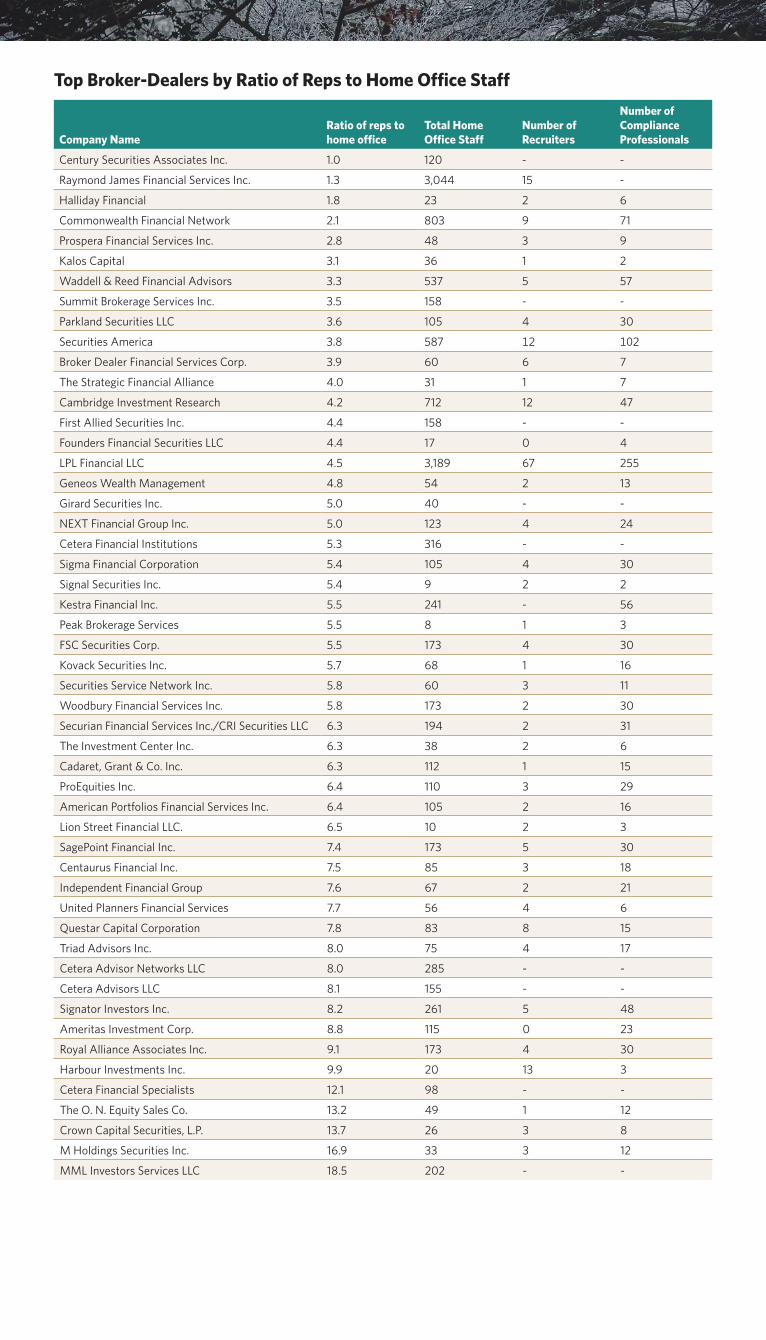
Top Broker-Dealers by Ratio of Reps to Home Office Staff