under-representation of muslims in higher education in
TRANSCRIPT

Under-representation of Muslims in Higher Education in India – Focus on
Uttar Pradesh, Bihar, West Bengal, Assam, Maharashtra and Kerala
1. Introduction
Muslims are the largest minority community in the country, constituting 13.4 per cent of the population,
are seriously lagging behind in terms of most of the human development indicators. While the
perception of deprivation is widespread among Muslims, there has been no systematic effort since
independence to analyse the condition of religious minorities in the country (Sachar Committee Report,
2006). Among the several Development indicators, Education has the top priority. The Literacy rate
among Muslims in India lies at 68.5%, whereas the national average remains at 73%. When compared
to other religions the literacy rates remains the lowest for Muslims in India. According to the All India
Survey of Higher Education (AISHE 2017-18) the representation of Muslims in higher Education is
only 5% when compared to other religious communities in India. It is an observable phenomenon that
the educational status of the Indian Muslims is very low. The status of Indian Muslims is marked with
high levels of Illiteracy, low income, high incidence of poverty, irregular employment. (T. Shazli & S.
Asma; 2015). Any country or a community’s development is measured by their educational attainment.
Education is the most vital input for the growth and prosperity of a nation. It provides strength and
resilience to enable people to respond to the changing needs of the hour. Education is the backbone of
all national endeavors. It has the power to transform human beings into human resources. We cannot
build a sustainable and prosperous nation without human resource development which mainly depends
on the health and vitality of higher education. Apart from primary and secondary education, higher
education is the main instrument for development and transformation. Higher education has the
omnipotent role of preparing leaders for different walks of life: social, political, economic, cultural,
scientific and technological. Higher education has special value in the contemporary knowledge society
which contributes both directly and indirectly to the wealth of a nation (Report to the People on
Education, 2010-11).
Relatively limited academic discussion appears to occur on this issue. Reports of the Sachar Committee
or the “post-Sachar” Committee headed by Amitabha Kundu present the picture regarding the situation
of Muslims but do not treat this question in depth. Both the reports focus on presentation of the status
but neither explores the causes of under-representation. Much greater attention has been given to school
education and related subjects pertaining to Muslim children by those who have engaged in research
pertaining to their education.
2. Review of Literature
2.1 History of Education in India
Tracing back the history of education in the Muslim community revealed interesting patterns. A study
conducted by Lerner (1978) upon the educational development in the six developing Muslim Countries
such as Afghanistan, Turkey, Lebanon, Syria, Jordan and Iran, where they exhibited positive changes
in the sphere of modern education in the twentieth century. All these countries apart from being purely
religious in their nature have shown positive acceptance towards modern education through their
revolutionary steps in the field, except for the Indian Sub-continent. The importance of education in
India can be very well understood from the numerous universities for higher education in Varanasi,
Taxila, Nalanda, etc. Education in India before the advent of Islam was considered to be the monopoly
of Brahmins. They excluded the lower class people to acquire knowledge because they thought
themselves superior. Hence it gave way to the creation of Buddhism and Jainism as a rebellion to the
above notion of superiority. The fact cannot be overlooked that the common people were always

deprived of education. Ultimately, due to the efforts of Muslim rules every citizen of the country,
whether Muslim or Hindu, man or women, rich or poor, was enshrined with the right to acquire
knowledge. It is the tradition of the prophet Muhammad. According to various tradition, he himself
prayed for knowledge as ‘‘My lord, enhance me in knowledge’’. He directed the believers ‘to seek
knowledge from the cradle to the grave, no matter if there search took them as far as china.’ It is quite
true that Muslims rulers in India, under various dynasties, patronized education and learning. It was
noted right from the very beginning, they had adopted secular policy towards education.
The history of Muslim Education can be followed back from the advent of Muslims in India. It started
when Mahmud Ghauri first established Madrasas in the north western parts of India. Followed by
Mohammad Ghaznavi, the Khiljis, Tughlagh, Sayyid, Lodhis, Suris and finally the Mughals, who
emphasised upon establishing educational institutions under their rule. The Mughals welcomed the
Europeans for commerce and showed liberal attitude towards missionary activities. There existed many
schools and Madrasas which ran smoothly through proper financial arrangement i.e., wakf, sadaqa and
zakath, which further deteriorated during the British rule. The Mughals continued to rule the country
with strength of mind until the last Mughal emperor, Bahadur Shah Zafar, who was deposed by the
British in 1857. But after Aurangzeb (A.D. 1707) the decline of the Mughal Empire had clearly set in
and finally ended in its complete collapse under the rebellions and conspiracies of high officials,
governors and courtiers.
Education under the East India Company – did not see much developments as the British rulers were
afraid of educating the natives. It was only during 1835-1854 that the company allocated special funds
to promote education in the nation especially to serve lower posts of the company like clerks, subedars,
etc, that were mainly taken up by the high caste Hindus. In the second half of the 19th C the company
established some premier educational institutions in the Presidency towns of Calcutta, Bombay and
Madras. It was the period of formation of number of colleges and Universities across the country.
However, as far as Muslim education is concerned, in British India, Warren Hasting was the first man
who took a major step and founded a madarasah also known as the Muhammadan College in Calcutta
in 1781. The madarasah was solely meant to promote and encourage the study of Arabic, Persian and
Urdu Languages. Meanwhile the work of the missionaries was largely promoted by the company. They
were however mainly concerned with the propagation of their own religion and language. Later the
activities of the missionaries were opposed by the educated natives including the Muslims. In order to
promote Indian Education, huge amount of grants were released by the govt. , the British established
the Hindu Sanskrit College in Banaras that was later extended to form the Banaras Hindu University,
with efforts from Mahanama Pandit Madan Mohan Malaviya in 1915. Numerous committees of public
instruction were appointed in Calcutta, Bombay and Madras mainly with a view to ascertaining the state
of education and to aid and advise the government to take steps to mobilize people and resources for
education. On the 7th March 1835, Lord William Bentick passed the “Bentick’s resolution” that
basically emphasised upon English Education, undermining the rich and sublime culture of the Indian
civilization. The Lamas, Moulawis and Muslim social workers in the different parts of the country
demanded the government not to discourage the native education as well as religious learning.
2.2 Attitude of Muslims towards Western Education and the Reasons behind such Attitude
The fact cannot be denied that modern education was a gift to India by the Colonial Masters. The
Muslim response towards Western education was immensely terrible, this hatred towards the British
taste and culture led to keep themselves away from the western education, which in turn led the
community to its doom. The Muslims were fond of trade and commerce rather than to seek employment

under any regime. The behaviour of the Muslims of northern and the southern part differed from each
other in many respects. Where the southern section showed positive response towards English and
Western sciences, the Muslims of northern India, to some extent even the Hindus refused to accept
them. seeing the scenario in a more political sense, after the Battles of Plassey and Buxar (1757 and
1764) the British started taking the Muslims seriously. After establishing their hegemony the British
started destroying the financial strength of Muslims. In 1793, the British passed the land Act, which
adversely affected influenced the economic condition of the Muslims. They changed the relationship
with the landlords, especially with regard to Muslims. Persian was replaced by English as a court
language in 1837. Hafiz Malik rightly remarks “their strategy was to oust the Muslims from the
profession and the position of economic and administrative control”.
According to the Education commission of 1882, enrolment of Muslims students in Modern education
system remained even less than half, with little signs of improvement in the provinces of Bombay,
Bengal and North-West. Such an indifferent attitude both from the side of the community as well as the
British led to the complete ousting of the Muslims from the civil services too. They were deliberately
excluded from the British Civil services. The higher executive posts were anyway reserved or the British
and the lower posts were mostly filled in by the Hindu high castes. As a result the Muslims were forced
to live in poor conditions. The pioneer Ulama of the time such as Shah ‘Abd ul-Aziz, Syed Isma’il
Shahid, Muhammad Ishaq, Sir Syed Ahmed Khan, etc led the movement to teach and preach Islamic
traditions and values amongst the Muslims.
2.3 Role of Muslim Intelligentsia
There was no unanimity of opinion among the Ulamas and the Muslim intelligentsia about the approach
towards education. While some scholars would raise challenges to the Iman and ikhlas so that they may
lose their religious pursuit gradually. On the contrary some other scholars such as Mirza Abu, Talib
Landani, Abdu Rahim Dahri, Luft -Ullah praised the western education. Shah Waliullah was an
educational reformer who is well known for creating a bridge between Medieval and modern Muslim
India. He went on to establish one of the great Muslim learning institutions like the Darul Uloom of
Deoband in Uttar Pradesh. The other Five well known scholars who talked about the Modern Education
over religious education were Syed Amir Ali (1849-1928), Jamat al-Din al-Afghani (1838-1897),
Namik Kemal (1840-1888), Sheikh Muhammad Abduh (1850-1905) and Sir Syed Ahmed Khan (1871-
1898).
Sir Syed and his followers were the first champions of reformist ideas in the sub-continent, he was also
the founder of the Anglo-Mohammedan Oriental College at Aligarh (which later became the Aligarh
Muslim University). The principal motivating force behind the revival of Indian Islam in the late 19th
C. Amidst his strong demand for western education, he faced serious criticism from Muslim scholars
and Ulamas for that time. He was of the view that the Muslims should embrace such of the Western
values as were healthy and morally sound. Meanwhile a religious Ulama Abd ur-Rahim Dahri released
a booklet upon the importance of English. He was of the opinion that modern knowledge cannot be
disseminated through translation. Sir Syed had an irrefutable relationship with the British, his ideas
gradually developed in the form of an educational movement. He wrote many pamphlets, organised
conferences and meetings to propagate the ideas of importance of modern education.
2.4. Muslim education in Contemporary India
The status of Muslim Education has remained some what same as the past times. Imtiaz Ahmed (1981)

discusses the prime reasons for Muslims educational backwardness right from Indian Independence. He
lists numerous reasons for the under-representation of Muslims in Education and most importantly in
higher education that is mostly assumed when talked about the status of education in the society are– i)
Preference to religious education over modern education, ii) Reluctancy due to acute psychological
complex where Muslims have surrounded themselves in shells iii) Status as a religious minority and
discriminatory attitude of the society. He also point out the reasons for the slow response of the Muslims
towards modern education as – i) the Muslims lost political power to Britishers, ii) the problems which
the Muslims feel they are facing in contemporary India can be traced back to the British era. The
arguments put forward by Ahmed regarding the poor representation are that Large masses of elite and
prosperous Muslims migrated to Pakistan in order to achieve power and opportunities. The group which
remained behind was the lower class (among the two classes of Upper and Lower), who was reluctant
in entering into modern education due to financial backwardness. He also adds that even if Education
were made wholly free, people may still be reluctant to take it because the expenditure of energy and
time. The Muslims largely are willing to enter into Education only if it opened the gates of entry into
jobs, prestige and social mobility.
This slowed down the process of formation of middle class among the Muslims. The Middle class is
mostly observed to take birth from the entry into government jobs and introduction of modern
education. A smaller size of this social strata of the Middle and the upper class in the community which
further represents the community in Higher education. Even historically the Hindu middle class was
larger than the Muslim middle class. The decline of the Middle class led the decline in economic
conditions immediately after independence. Hence they attained monopoly over certain products and
handcrafts and have still continued them as a tradition. Many of them don’t agree to give up those
traditional skills and enter into education. Whereas a majority of the community hence relied upon the
Madrasas as the last resort that provided free and flexible timings, where the students could both study
and also parallelly work to support family. India witnessed the growth of Madrasas and Masjids in the
mid-1970’s during the oil revolution when the money flowed in from the Arab world to promote
religious education (A. A. Engineer, 2001). Which have now remained as the centres of learning Arabic
and the Quran, unlike the medieval era when these madrasas were centres of higher learning that
provided religious as well as then available scientific knowledge known as ulum-i-aqliyah (intellectual
knowledge). There are some centres of Modern education such as the Aligarh Muslim University,
Jamia-Milia-Islamia, Anjuman-e-Islam, Saboo-Siddik, etc organisations that are concerned to the
promotion of higher education.
Since independence the various committees such as the Justice Rajindar Sachar Committee, Justice
Ranganath Mishra Committee, Gopal Singh report (1983), The Kundu Report, have presented a
common observation regarding the representation of Muslims in Education. A look at secondary data
reveals an interesting pattern. Literacy rates among Muslims, both for boys and girls, are at more or less
par if not higher than those of the Hindus. The proportion of those continuing in education appears to
start dropping as one compares at higher standards/age and the enrolment in Universities shows a
sharply divergent figure with Muslims falling well below 13%. All India Survey of Higher Education
(AISHE 2017-18) states that participation rate of Muslims in higher education (enrolment in
Universities etc) is 5%. Their share in technical and professional education is possibly even lower.
Gross under-representation of Muslims in education is considered very undesirable, which continues to
remain persistently low over the years.

3. Objectives
• To study the status of Literacy among the Muslims in India by states
• To study the status of attainment of higher education among the Muslims in India by
states
• To study the relevance of the factors such as Distance, Density, Population size,
Urban/Rural population for selected states of Uttar Pradesh, Bihar, West Bengal, Assam
and Kerala.
4. Data Sources
The data for the district wise secondary analysis on the under representation of Muslims in education
in India has been taken from various sources such as –
3.1 District Census Handbook (2011) - for the district wise list of number of colleges and universities per
district, separately for each state and Union Territory in India.
3.2 Rashtriya Madhyamik Shiksha Abhiyaan (RMSA) – for the list of schools per district, separately for each
state and Union Territory in India for 2013-14
3.3 Registrar General of Census of India 2011 (C-Series Table) - C-15 RELIGIOUS COMMUNITY BY AGE-
GROUP AND SEX – 2011, for all the states for the district wise data on population size of Muslims and
Total Population. The All ages data has been used for the current analysis
3.4 Data from Socio-economic and Caste Census, 2011 (Rural and Urban data)
3.5 Registrar General of Census of India 2011 (Socio-cultural Table) - C-9 EDUCATION LEVEL BY
RELIGIOUS COMMUNITY AND SEX FOR POPULATION AGE 7 AND ABOVE – 2011, for all the
states. The Literacy rates on has been computed from the table.
5. Methodology
5.1 Literacy Rate- is the total percentage of population who can read and write. The total
number of persons in a given age group, expressed as a percentage of the total population in
that age group. The formula for literacy rates for the population aged 7 and above is as
follows -
Literacy rate = 𝑁𝑢𝑚𝑏𝑒𝑟 𝑜𝑓 𝑙𝑖𝑡𝑒𝑟𝑎𝑡𝑒𝑠 (𝐴𝑔𝑒𝑑 7 𝑎𝑛𝑑 𝑎𝑏𝑜𝑣𝑒)
𝑇𝑜𝑡𝑎𝑙 𝑝𝑜𝑝𝑢𝑙𝑎𝑡𝑖𝑜𝑛 (𝐴𝑔𝑒𝑑 7 𝑎𝑛𝑑 𝑎𝑏𝑜𝑣𝑒)∗ 100
5.2 Proportion of Population attaining Higher Education by Religion (Graduate and
above) – The proportion of population attaining higher education i.e., the number of persons
in a given age group (eligible age group) for the graduate and above to, expressed as a
percentage in that age group.
5.3 T-Test of Significance – The students T-Test analysis is used to compare the Means. Two
groups are divided on the basis of Mean number of Muslims per District, “the more than
mean number of Muslims per district” and “Less than Mean number of Muslims per District”
Variables for the T-Test analysis –
• Variable 1 – Districts with More than Mean number of Muslims
• Variable 2 – Districts with less than Mean number of Muslims
Prior to the analysis of the Students T-Test of significance, the data from the Census of India,
2011 has been cleaned for the adjustment of “Age not stated” in order to avoid the problem
of distortion of results at a later stage.
For both the tables the States/UT’s with three or less than three districts are dropped as that
may not be suitable for setting up the range for the T-Test of significance analysis.

5.4 Correlation Coefficient - A correlation coefficient is a numerical measure of some type
of correlation, meaning a statistical relationship between two variables. The variables may be
two columns of a given data set of observations, often called a sample, or two components of
a multivariate random variable with a known distribution. They all assume values in the range from −1
to +1, where ±1 indicates the strongest possible agreement and 0 the strongest possible disagreement.
Correlation Coefficient is used to study the relation between the variables, Proportion of Muslims as
well as the density of educational institutions in the concerned districts.
5.5 Four-Way Table – A four way table across High and low for the Number of Muslims and number
of schools and colleges per district in the horizontal columns and vertical rows respectively for selected
7 states with high Muslims population is done. The Analysis also provides a spatial insight into the
various factors that affect the distribution of Muslims as well as educational Institutions in the states.
The four way table analysis for the selected 7 states helped in highlighting the actual condition of the
districts with high Muslim density. The table uses four categories , with two each for the Schools per
lakh Muslim Population Of the district and Muslims per lakh total population. And the two categories
each are the More than and Less than Averages in both the categories. Two separate tables for both the
Schools and college/University distribution has been constructed. The table has four quadrants-
i. High Muslims Per Lakh total population and High Number of Persons per school or colleges/
University (HH)
ii. High Muslims Per Lakh total population and Low Number of Persons per school or colleges/
University (HL)
iii. Low Muslims Per Lakh total population and High Number of Persons per school or colleges/
University (LH)
iv. Low Muslims Per Lakh total population and Low Number of Persons per school or colleges/
University (LL)
6 Analysis
6.1 Literacy Rate
Table 1.1 Shows the Illiteracy rates across all the states of India. The total Illiteracy rates remain the
highest among the group “Other Religious Persuasions”. Among the other religious minorities of
Christians, Sikhs, Buddhists and Jains, the Muslims show the highest rates of Illiteracy at 31.5%,
Whereas the Hindus have 26.7% of illiterates out of the total population. The highest rates of Illiteracy
among Hindus is in the state of Bihar and the lowest in Lakshadweep islands. Whereas among the
Muslims the highest rates of Illiteracy is in Haryana and lowest in Kerala. The highest rates of illiteracy
among Christians is in Arunachal Pradesh and lowest in Lakshadweep islands. Whereas for the
Religions Sikh, Buddhist and Jains the highest rates of illiteracy could be seen in the states of Rajasthan,
Mizoram and Arunachal Pradesh and the lowest in Lakshadweep Islands, Kerala and Chandigarh
respectively.
Table 1.2 Provides the state-wise Literacy rates for all the religious communities in India. The highest
rates of literacy can be seen for the Jain religious minority (94.9%), followed by Christians (84.5%),
Buddhists (81.3%), Sikhs (75.4%), Hindus (73.3%), Muslims (68.5%) and Other religious persuasions
(59.9%). Kerala shows the highest rates of Literacy for the religions Hindus (93.5%), Muslims (93.3%),
Christians (96.5%) and Buddhists (95.3%). Whereas Nagaland (96.1%) and Chandigarh (98.5%) show
highest rates for Sikhs and Jains respectively. Bihar (62.8%), Haryana (53.4%), Arunachal Pradesh
62.5%), Rajasthan (70.1%), and Goa (0.0%) respectively for the religions Hindu, Muslims, Christians,
Sikhs, Buddhists and Jains. Kerala tops the list with the highest literacy rates for the total population of
India, where Bihar remains at the lowest of (61.8%) rate of Literacy.

Table 1.1 State – wise distribution of Illiteracy Rate among different religious
communities in India, 2011
State/UT's Total
Religious communities
Hindus Muslims Christians Sikh Buddhists Jains
Other religions
persuasions
India 27.0 26.7 31.5 15.5 24.6 18.7 5.1 40.1
Haryana 24.4 22.9 46.6 16.1 24.6 18.3 4.1 18.8
Meghalaya 25.6 22.8 46.0 23.5 16.9 21.1 14.2 37.8
Bihar 38.2 37.2 43.7 32.3 19.5 25.3 14.6 52.8
Nagaland 20.4 20.1 42.1 19.9 3.9 20.6 7.9 36.4
Uttar Pradesh 32.3 30.3 41.2 26.4 20.6 31.4 5.9 28.9
Jammu & Kashmir 32.8 20.9 39.0 22.0 9.2 31.2 6.5 54.6
Punjab 24.2 20.0 38.1 34.0 26.4 19.6 4.7 25.4
Assam 27.8 22.3 38.1 33.0 7.7 22.7 3.9 20.7
Rajasthan 33.9 34.0 37.3 19.3 29.9 24.2 4.9 32.5
Uttarakhand 21.2 18.8 36.8 11.1 20.6 15.2 3.2 30.5
Jharkhand 33.6 32.3 33.8 25.1 7.2 19.6 6.6 43.6
Himachal Pradesh 17.2 16.9 32.5 15.8 12.2 20.8 4.8 22.8
Arunachal Pradesh 34.6 29.9 32.3 37.5 5.6 42.1 39.4 33.8
Manipur 23.1 18.0 32.2 27.4 9.3 22.2 8.5 18.4
West Bengal 23.7 20.9 31.3 24.0 10.0 18.0 6.5 38.7
Andhra Pradesh 33.0 33.9 26.4 22.2 21.9 32.3 8.1 26.6
Chandigarh 14.0 14.8 25.3 8.8 5.4 7.4 1.5 17.4
Madhya Pradesh 30.7 31.4 25.1 18.1 14.2 20.4 3.8 39.6
NCT Of Delhi 13.8 12.8 24.4 5.2 6.1 10.6 2.2 9.4
Sikkim 18.6 18.0 23.5 17.9 4.2 19.6 10.4 21.2
Mizoram 8.7 8.2 22.1 4.5 7.0 51.9 27.7 3.0
Karnataka 24.6 25.6 21.1 9.2 14.4 23.9 11.7 20.0
Odisha 27.1 26.9 20.0 35.5 10.2 21.8 7.1 45.5
Gujarat 22.0 22.5 19.2 16.1 12.7 20.1 3.0 10.4
Tripura 12.8 11.8 16.8 13.9 8.1 25.4 11.5 8.0
Maharashtra 17.7 18.2 16.4 7.7 9.1 16.8 4.7 19.0
Chhattisgarh 29.7 30.2 15.5 22.1 6.8 12.7 2.8 38.5
Goa 11.3 11.3 15.3 10.1 5.0 7.6 4.4 8.1
Daman & Diu 12.9 12.9 14.1 5.7 3.9 7.0 3.8 3.9
Dadra & Nagar Haveli 23.8 24.4 13.4 18.2 5.2 11.9 2.4 18.5
Tamil Nadu 19.9 21.2 11.8 9.9 13.2 9.9 5.5 14.0
Andaman & Nicobar
Islands
13.4
13.0 8.5 16.0 4.5 8.9 3.7 56.6
Puducherry 14.2 14.9 8.3 9.4 14.4 8.2 3.8 11.7
Lakshadweep 8.2 6.1 8.3 1.6 0.0 10.0 12.5 0.0
Kerala 6.0 6.5 6.7 3.5 4.8 4.7 2.9 13.9
Table 1.2. State – wise distribution of Literacy Rate among different religious
communities in India, 2011
State/UT's Total
Religious communities
Hindu Muslim Christian Sikh Buddhist Jain Other religions and persuasions
India 73.0 73.3 68.5 84.5 75.4 81.3 94.9 59.9
Kerala 94.0 93.5 93.3 96.5 95.2 95.3 97.1 86.1
Puducherry 85.8 85.1 91.7 90.6 85.6 91.8 96.2 88.3
Andaman & Nicobar Islands 86.6 87.0 91.5 84.0 95.5 91.1 96.3 43.4
Tamil Nadu 80.1 78.8 88.2 90.1 86.8 90.1 94.5 86.0
Dadra & Nagar Haveli 76.2 75.6 86.6 81.8 94.8 88.1 97.6 81.5
Daman & Diu 87.1 87.1 85.9 94.3 96.1 93.0 96.2 96.1
Goa 88.7 88.7 84.7 89.9 95.0 0.0 0.0 0.0
Chhattisgarh 70.3 69.8 84.5 77.9 93.2 87.3 97.2 61.5
Maharashtra 82.3 81.8 83.6 92.3 90.9 83.2 95.3 81.0
Tripura 87.2 88.2 83.2 86.1 91.9 74.6 88.5 92.0
Gujarat 78.0 77.5 80.8 83.9 87.3 79.9 97.0 89.6

Odisha 72.9 73.1 80.0 64.5 89.8 78.2 92.9 54.5
Karnataka 75.4 74.4 78.9 90.8 85.6 76.1 88.3 80.0
Mizoram 91.3 91.8 77.9 95.5 93.0 48.1 72.3 97.0
Sikkim 81.4 82.0 76.5 82.1 95.8 80.4 89.6 78.8
NCT Of Delhi 86.2 87.2 75.6 94.8 93.9 89.4 97.8 90.6
Madhya Pradesh 69.3 68.6 74.9 81.9 85.8 79.6 96.2 60.4
Chandigarh 86.0 85.2 74.7 91.2 94.6 92.6 98.5 82.6
Andhra Pradesh 67.0 66.1 73.6 77.8 78.1 67.7 91.9 73.4
West Bengal 76.3 79.1 68.7 76.0 90.0 82.0 93.5 61.3
Manipur 76.9 82.0 67.8 72.6 90.7 77.8 91.5 81.6
Arunachal Pradesh 65.4 70.1 67.7 62.5 94.4 57.9 60.6 66.2
Himachal Pradesh 82.8 83.1 67.5 84.2 87.8 79.2 95.2 77.2
Jharkhand 66.4 67.7 66.2 74.9 92.8 80.4 93.4 56.4
Uttarakhand 78.8 81.2 63.2 88.9 79.4 84.8 96.8 69.5
Rajasthan 66.1 66.0 62.7 80.7 70.1 75.8 95.1 67.5
Assam 72.2 77.7 61.9 67.0 92.3 77.3 96.1 79.3
Punjab 75.8 80.0 61.9 66.0 73.6 80.4 95.3 74.6
Jammu & Kashmir 67.2 79.1 61.0 78.0 90.8 68.8 93.5 45.4
Uttar Pradesh 67.7 69.7 58.8 73.6 79.4 68.6 94.1 71.1
Nagaland 79.6 79.9 57.9 80.1 96.1 79.4 92.1 63.6
Bihar 61.8 62.8 56.3 67.7 80.5 74.7 85.4 47.2
Meghalaya 74.4 77.2 54.0 76.5 83.1 78.9 85.8 62.2
Haryana 75.6 77.1 53.4 83.9 75.4 81.7 95.9 81.2
Lakshadweep 0.0 0.0 0.0 0.0 0.0 90.0 87.5 100.0
6.2 Proportion of Population attaining Higher Education by Religion (Graduate and
above)
Table 2 provides the data for the state-wise distribution of Graduates and Above by Religious
Population in India, 2011. The Jains in India register for the highest percentage of graduates (28.2%)
out of the total population aged 18-29 years. The lowest percentage of Graduates and Above are in the
Others group followed by the Muslims (3.3%). On the Total, the highest percentage of Graduates and
Above are in Chandigarh (20.8%), NCT of Delhi (18.7%), Puducherry (12.7%), Goa (11.2%) and
Uttarakhand (10.4%). Among the top five are mostly Union Territories or smaller states in terms of land
area and Population size. Bihar again marks the lowest Proportion of Graduates and above throughout
the country.
The highest number of Graduates and above among Hindus are in the states/UTs of NCT of Delhi
(19.6%), Chandigarh (19.5%), Puducherry (12.68%), Manipur (12.66%) and Uttarakhand (11.6%).
Surprisingly the Graduation and above rates for the Muslims in India lie only in One point decimal
values across all the states and UTs in India. The top 5 States/UTs with the more percentages of
Graduates and Above are Puducherry (8.8%), Andaman and Niccobar Islands (8.5%), Chhattisgarh
(7.7%), Lakshadweep Islands (7.6%) and Tamil Nadu (7.1%). Where the lowest percentage of
Graduates and Above among the Muslims was found in Haryana. As far as the Christians are considered
the NCT of Delhi (28.5%) shows the highest proportion of Graduates and above, followed by
Maharashtra, Chandigarh, Uttarakhand and Haryana at 22, 21.3, 19.8 and 19.5 percent graduates and
above respectively. Both Chandigarh and Lakshadweep records the highest and Lowest Proportion of
Graduate and above for the three minority communities, namely Sikhs, Buddhists and Jains. A similar
picture for the category Other Religious communities can also be seen with the highest proportion of
Graduation and above in NCT of Delhi and lowest in Lakshadweep Islands.
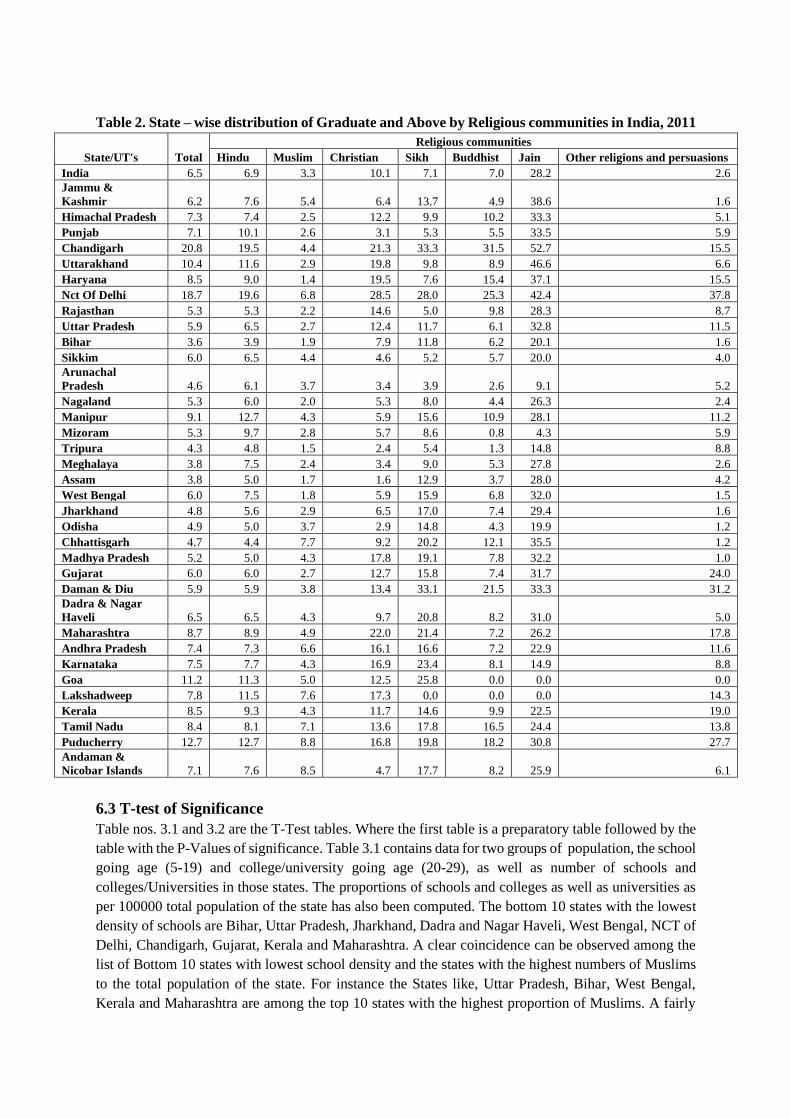
Table 2. State – wise distribution of Graduate and Above by Religious communities in India, 2011
State/UT's Total
Religious communities
Hindu Muslim Christian Sikh Buddhist Jain Other religions and persuasions
India 6.5 6.9 3.3 10.1 7.1 7.0 28.2 2.6
Jammu &
Kashmir 6.2 7.6 5.4 6.4 13.7 4.9 38.6 1.6
Himachal Pradesh 7.3 7.4 2.5 12.2 9.9 10.2 33.3 5.1
Punjab 7.1 10.1 2.6 3.1 5.3 5.5 33.5 5.9
Chandigarh 20.8 19.5 4.4 21.3 33.3 31.5 52.7 15.5
Uttarakhand 10.4 11.6 2.9 19.8 9.8 8.9 46.6 6.6
Haryana 8.5 9.0 1.4 19.5 7.6 15.4 37.1 15.5
Nct Of Delhi 18.7 19.6 6.8 28.5 28.0 25.3 42.4 37.8
Rajasthan 5.3 5.3 2.2 14.6 5.0 9.8 28.3 8.7
Uttar Pradesh 5.9 6.5 2.7 12.4 11.7 6.1 32.8 11.5
Bihar 3.6 3.9 1.9 7.9 11.8 6.2 20.1 1.6
Sikkim 6.0 6.5 4.4 4.6 5.2 5.7 20.0 4.0
Arunachal
Pradesh 4.6 6.1 3.7 3.4 3.9 2.6 9.1 5.2
Nagaland 5.3 6.0 2.0 5.3 8.0 4.4 26.3 2.4
Manipur 9.1 12.7 4.3 5.9 15.6 10.9 28.1 11.2
Mizoram 5.3 9.7 2.8 5.7 8.6 0.8 4.3 5.9
Tripura 4.3 4.8 1.5 2.4 5.4 1.3 14.8 8.8
Meghalaya 3.8 7.5 2.4 3.4 9.0 5.3 27.8 2.6
Assam 3.8 5.0 1.7 1.6 12.9 3.7 28.0 4.2
West Bengal 6.0 7.5 1.8 5.9 15.9 6.8 32.0 1.5
Jharkhand 4.8 5.6 2.9 6.5 17.0 7.4 29.4 1.6
Odisha 4.9 5.0 3.7 2.9 14.8 4.3 19.9 1.2
Chhattisgarh 4.7 4.4 7.7 9.2 20.2 12.1 35.5 1.2
Madhya Pradesh 5.2 5.0 4.3 17.8 19.1 7.8 32.2 1.0
Gujarat 6.0 6.0 2.7 12.7 15.8 7.4 31.7 24.0
Daman & Diu 5.9 5.9 3.8 13.4 33.1 21.5 33.3 31.2
Dadra & Nagar
Haveli 6.5 6.5 4.3 9.7 20.8 8.2 31.0 5.0
Maharashtra 8.7 8.9 4.9 22.0 21.4 7.2 26.2 17.8
Andhra Pradesh 7.4 7.3 6.6 16.1 16.6 7.2 22.9 11.6
Karnataka 7.5 7.7 4.3 16.9 23.4 8.1 14.9 8.8
Goa 11.2 11.3 5.0 12.5 25.8 0.0 0.0 0.0
Lakshadweep 7.8 11.5 7.6 17.3 0.0 0.0 0.0 14.3
Kerala 8.5 9.3 4.3 11.7 14.6 9.9 22.5 19.0
Tamil Nadu 8.4 8.1 7.1 13.6 17.8 16.5 24.4 13.8
Puducherry 12.7 12.7 8.8 16.8 19.8 18.2 30.8 27.7
Andaman &
Nicobar Islands 7.1 7.6 8.5 4.7 17.7 8.2 25.9 6.1
6.3 T-test of Significance
Table nos. 3.1 and 3.2 are the T-Test tables. Where the first table is a preparatory table followed by the
table with the P-Values of significance. Table 3.1 contains data for two groups of population, the school
going age (5-19) and college/university going age (20-29), as well as number of schools and
colleges/Universities in those states. The proportions of schools and colleges as well as universities as
per 100000 total population of the state has also been computed. The bottom 10 states with the lowest
density of schools are Bihar, Uttar Pradesh, Jharkhand, Dadra and Nagar Haveli, West Bengal, NCT of
Delhi, Chandigarh, Gujarat, Kerala and Maharashtra. A clear coincidence can be observed among the
list of Bottom 10 states with lowest school density and the states with the highest numbers of Muslims
to the total population of the state. For instance the States like, Uttar Pradesh, Bihar, West Bengal,
Kerala and Maharashtra are among the top 10 states with the highest proportion of Muslims. A fairly

different picture can be observed for the Density of colleges/Universities to the per 100000 total
population of the state. The bottom 10 states being Punjab, Lakshadweep Islands, Manipur, Sikkim,
Haryana, Goa, Odisha, Assam, Chandigarh and West Bengal. Here states like Assam and West Bengal
show such an coincidence.
Table 3.2 is a district-wise analysis table, which has been compiled together to obtain the state-wise
distribution of mean number of schools and colleges. As mentioned earlier the districts in each states
were classified into two categories on the basis of Mean number of Muslims in all the districts of the
state. And the two categories were namely, More than mean Muslims districts and Less than Mean
Muslim districts. And the means for these categories were compared through a t-test of Significance at
95% confidence interval for both density of Schools and colleges with the help of table 3.1. and the
hypothesis mentioned previously. While comparing the means of the number of schools in the two
groups, it was observed that the states Bihar, Gujarat, Jammu and Kashmir, Jharkhand, Madhya
Pradesh, Manipur, Meghalaya, Odisha, Uttar Pradesh and Uttarakhand show highly significant results
at alpha value (p-value) 0.05. Whereas the rest of the states also lie within the 95% C.I. the states with
values less than 0.05 indicate that the alternative hypothesis that there are lesser number of schools to
the per one lakh Muslims is true and hence it is accepted. It can also be understood that these are
comparatively younger states the more proportion of young age group people.
The Mean number of colleges to the total population for the two groups of More than and Less than
mean Muslim population of that state, also show a different picture. The mean number of colleges and
Universities mostly remains at a one decimal point for many of the states. On comparing the means
between the groups , for many states like Bihar, Chhattisgarh, Gujarat, Haryana, Jharkhand, Madhya
Pradesh and Uttar Pradesh the mean number of colleges per 1 lakh Muslim population remains less than
1 for both the groups. Whereas for states like Andhra Pradesh, Madhya Pradesh, Manipur and Rajasthan
the P-values remain highly significant with less than 0.05 alpha value. Rest of the P-values remain
within the 95% confidence interval. The states or Union Territories with 3 less than 3 districts has been
dropped from the analysis.

Table 3.1: Number of Muslims per lakh of total population by age-groups (5-19) and (20-29) and Number of Schools and Colleges/universities,
India, 2011
States/UT's
Total
Population of
the State
(Aged 5-19)
Total
Population
of the
State
(Aged 20-
29)
Number of
Muslims Per
lakh Total
Population of
the State (Aged
5-19)
Number of
Muslims Per
lakh Total
Population of
the State
(Aged 20-29)
Total
No. of
Schools
in the
State
Number of
schools per
lakh total
population of
the State (Aged
5-19)
Total No.
Of
Colleges/U
niversities
in the State
No. of
Colleges/Universities
per lakh total
population of the
State (Aged 20-29)
Andaman &
Niccobar Islands 3333743 1783188 8150.39 8759.38 109 112.32 385 21.59
Andhra Pradesh 23817000 7870823 10690.39 21045.86 22458 94.29 3245 41.23
Arunachal Pradesh 894450 553767 1725.71 1259.13 389 76.73 74 13.36
Assam 7854595 4805422 38917.39 32603.51 7657 75.73 299 6.22
Bihar 345311 214178 18148.85 16561.99 7083 18.36 60 28.01
Chandigarh 1873636 1234854 6042.71 5374.66 157 54.29 102 8.26
Chhattisgarh 24305476 12529380 1938.88 2327.18 6204 75.2 1649 13.16
Dadra & Nagar
Haveli 7780749 5248352 3729.96 4153.75 39 37.33 2101 40.03
Daman & Diu 289171 231557 8679.64 6954.67 40 64.28 42 18.14
Delhi 12383951 7378513 15783.23 13217.52 2045 42.11 737 9.99
Goa 97041 78913 10593.28 10273.36 402 121.34 4 5.07
Gujarat 711921 381548 10404.06 9959.26 10059 56.13 98 25.68
Haryana 17921864 11103422 9268.05 5981.32 7570 96.38 443 3.99
Himachal Pradesh 17059 11817 2618.66 2420.52 3643 194.43 3 25.39
Jammu & Kashmir 16818054 11833045 73407.36 63995.93 4196 103.14 3451 29.16
Jharkhand 507003 255689 16004.84 14495.84 4307 37.49 59 23.07
Karnataka 1053717 717642 15140.43 13435.55 15086 89.7 119 16.58
Kerala 104469 84277 32889.62 30827 4499 56.26 952 18.1
Lakshadweep Islands 62232 71870 99014.93 94711.49 13 76.2 1 1.39
Madhya Pradesh 1100121 537341 6774.5 7115.01 14466 59.52 185 34.43
Maharashtra 307030 227264 13281.14 12241.62 22554 72.07 62 27.28
Manipur 74577392 32421674 10234.74 8154.31 1030 115.15 736 2.27
Meghalaya 10110746 5728007 4370.88 4493.83 1322 120.17 1623 28.33
Mizoram 4068192 2249747 1276.04 1786 610 176.65 268 11.91

Nagaland 31295998 21315412 2404.68 2702.33 689 96.78 4308 20.21
Odisha 331308 263750 2467.86 2441.65 9491 76.64 16 6.07
Puducherry 11488744 5499723 6407.6 6060.67 347 113.02 707 12.86
Punjab 38578388 15797674 2273.92 2033.19 8838 113.59 86 0.54
Rajasthan 7996689 5275347 9782.32 9440.1 27681 116.16 952 18.05
Sikkim 26495005 16776900 1609.88 2134.04 224 117.34 492 2.93
Tamil Nadu 17999260 13087407 6361.74 6303.46 12282 68.24 1551 11.85
Tripura 23831001 11821485 10607.61 8661.21 984 93.38 1942 16.43
Uttar Pradesh 190906 132191 21099.53 19384.32 23602 31.65 18 13.62
Uttarakhand 4856325 3435804 16920.23 14293.86 3426 102.77 458 13.33
West Bengal 8250078 4450824 33125.69 27458.84 10015 37.8 382 8.58
Source : Census of India 2011, C-Series Table – C-15
Table 3.2: T-Test results for the districts above the mean Muslim Population of the state for Schools, Colleges and Universities, India
State/UTs
Schools Colleges
Mean no. of schools in
high Muslim density
Districts
Mean no. of Schools in
low Muslim density
Districts
P-Value
Mean no. of Colleges
in high Muslim density
Districts
Mean no. of Colleges
in low Muslim density
Districts
P-Value
Andhra Pradesh 464.62 485.01 0.29 25.01 15.39 0.02*
Arunachal Pradesh 921.00 793.43 0.18 18.40 12.97 0.36
Assam 842.40 577.27 0.12 22.74 19.92 0.39
Bihar 81.87 74.43 0.01* 0.16 0.10 0.26
Chhattisgarh 251.26 176.22 0.09 1.38 1.31 0.41
Gujarat 99.81 82.22 0.04* 1.31 1.08 0.22
Haryana 89.15 88.23 0.47 1.24 1.04 0.33
Himachal Pradesh 354.63 252.48 0.14 1.76 1.27 0.24
Jammu and
Kashmir 298.08 241.64 0.04* 1.26 1.81 0.21
Jharkhand 164.63 139.15 0.04* 1.76 0.58 0.18
Karnataka 145.01 125.95 0.06 5.31 5.98 0.16
Kerala 53.52 54.32 0.44 2.62 2.38 0.39

Madhya Pradesh 230.18 190.98 0.00* 1.76 2.72 0.03*
Maharashtra 99.66 120.44 0.05 2.78 4.47 0.14
Manipur 645.12 478.37 0.02* 5.66 17.82 0.00*
Meghalaya 1829.24 715.13 0.02* 59.20 9.07 0.08
Mizoram 1517.82 963.83 0.20 47.61 21.87 0.19
Nagaland 656.22 479.88 0.20 53.05 16.81 0.18
NCT of Delhi 38.51 35.39 0.35 49.71 0.15 0.18
Odisha 197.76 142.06 0.00* 2.54 2.37 0.43
Pudducherry 80.16 57.45 0.08 9.62 6.86 0.39
Punjab 109.48 106.57 0.46 8.73 5.12 0.11
Rajasthan 189.15 176.28 0.13 2.99 2.09 0.03*
Sikkim 257.05 214.85 0.32 3.00 0.34 0.27
Tamil nadu 89.29 85.90 0.38 2.12 1.96 0.36
Tripura 153.46 56.38 0.22 3.27 2.11 0.29
Uttar Pradesh 136.65 112.45 0.00* 0.29 0.06 0.11
Uttarakhand 394.24 142.21 0.00* 3.99 3.95 0.49
West Bengal 143.80 96.48 0.06 0.78 0.54 0.23
Andaman and
Niccobar Islands - - - - - -
Dadra And Nagar
Haveli - - - - - -
Daman And Diu - - - - - -
Goa - - - - - -
Lakshadweep - - - - - -
Source : Census of India 2011, C-Series Table – C-15.
District Census Handbook, 2011.
Note : (˟) States/UTs with ≤ 3 Districts have been dropped from the T-Test of Significance Analysis
* P < 0.05 = Significant

6.4 Correlation Coefficient analysis for states - Uttar Pradesh, Bihar, West Bengal,
Assam, Maharashtra and Kerala
On the basis of the previous analysis from methodologies 1 to 3, it could be observed the top 7 states
with the highest proportion of Muslims are Uttar Pradesh, Bihar, West Bengal, Assam, Maharashtra
and Kerala. Therefore conducting some specialised analysis on these 7 states can provide us with better
insights on our topic of interest. A correlation coefficient analysis is conducted to study the degree and
direction of relationship between the Number of Muslims and the density of schools and colleges in all
the districts of the selected states. Using the similar technique from the above t-test analysis, the districts
in each state are divided into two groups of “Districts with more than Mean number of Muslims” and
“Districts with less than Mean number of Muslims”. And the correlation coefficient between the two
groups is computed. Tables representing the Correlation Coefficients between the Mean number of
schools and colleges with the Mean density of Muslims in each district has been presented for all the 6
selected states.
Table a, shows the correlation coefficient for the two groups with the mean density of schools and
colleges in Uttar Pradesh. The Mean density of schools shows a clear negative correlation (-0.42) with
the districts with high Muslim Population and a weak positive relationship (0.01) with Districts with
less than Mean number of Muslims. Which can be understood as there are lesser number of schools in
the districts with more number of Muslims and a fairly good number of schools in districts with less
number of Muslims. And the next section of the table suggests that there are a good number of colleges
and universities in High Muslim density districts with a positive correlation (0.10) and also more
colleges and universities in low Muslim density districts with a negative correlation (-0.31).
Table a : Correlation coefficient for mean number of schools and colleges/universities to the Muslim
population of the state, Uttar Pradesh
Districts with
Mean density of Schools
(Per lakh Total
Population)
Correlation
Coefficient
Mean density of
Colleges (Per lakh
Total Population)
Correlation
Coefficient
More than Mean
number of Muslims 136.6 -0.42 0.29 0.10
Less than Mean
number of Muslims 112.5 0.01 0.06 -0.31
Table b, provides the correlation coefficient for the two groups with the mean density of schools and
colleges in West Bengal. The state shows highly negative correlation between the variables for both the
groups of more than and less than Mean, as well as for schools and Colleges/Universities. It clearly
proves there are lesser number of schools and colleges in high Muslim Density districts with (-0.3) and
(-0.06) respectively and vice versa for the districts with comparatively lower Muslim density.
Table b : Correlation coefficient for mean number of schools and colleges/universities to the Muslim
population of the state, West Bengal
Districts with
Mean density of
Schools (Per lakh
Total Population)
Correlation
Coefficient
Mean density of
Colleges (Per lakh
Total Population)
Correlation
Coefficient
More than Mean number of
Muslims 97 -0.3 0.6 -0.06
Less than Mean number of
Muslims 144 -0.54 0.8 -0.36

The relationship between the two variables for the state Bihar has been provided in the table c, where
again all the correlation coefficient values are negative for both the groups of districts more than and
less than mean. The districts more than mean show a negative correlation with the both the schools and
colleges density at -0.8 and -0.25. Which clearly states that there are lesser number of both the
educational institutions in these districts. And the results inversed for next category of less than mean.
Table c : Correlation coefficient for mean number of schools and colleges/universities to the Muslim
population of the state, Bihar
Districts with
Mean density of
Schools (Per lakh
Total Population)
Correlation
Coefficient
Mean density of
Colleges (Per lakh
Total Population)
Correlation
Coefficient
More than Mean number of
Muslims 68.7 -0.8 0.05 -0.25
Less than Mean number of Muslims 144 -0.5 0.8 -0.36
The correlation coefficient between the variables for Maharashtra shows that there is negative
correlation for both schools (-0.3) and Colleges/Universities (-0.1) for the high Muslim density districts,
indicating that there are lesser number of both these types of educational Institutions in high Muslim
density districts of Maharashtra. For the districts with lower Muslim density the schools show a negative
correlation of -0.4 and positive correlation for Colleges/Universities at 0.1 , which means there are more
number of schools and less number of Colleges/Universities in Districts with less than Mean number
of Muslims.
Table d : Correlation coefficient for mean number of schools and colleges/universities to the Muslim
population of the state, Maharashtra
Districts with
Mean density of
Schools (Per lakh
Total Population)
Correlation
Coefficient
Mean density of
Colleges (Per lakh
Total Population)
Correlation
Coefficient
More than Mean number of
Muslims 99.7 -0.3 2.78 -0.1
Less than Mean number of Muslims 120.4 -0.4 4.47 0.1
The North Eastern State of Assam has the highest number of Muslims when compared with the other 6
sister states, as well as maintains a position in the top 10 list of Muslim Majority states in India. The
correlation Table for the state show that the there is a weak positive relationship (0.03) between the
school density and High Muslim density districts, where there is a strong negative relationship (-1)
between the number of colleges/universities and the More than Districts. Which is again reverse in case
of the districts with less than Mean number of Muslims with -0.05 and 1. This indicates that there are
very less number of colleges/universities in high Muslim density districts and vice versa in Assam
Table e : Correlation coefficient for mean number of schools and colleges/universities to the Muslim
population of the state, Assam
Districts with
Mean density of
Schools (Per lakh
Total Population)
Correlation
Coefficient
Mean density of
Colleges (Per lakh
Total Population)
Correlation
Coefficient
More than Mean number of
Muslims 577.3 0.03 22.08406 -1
Less than Mean number of Muslims 842.4 -0.05 19.92349 1

The relationship between the two variables for the state Kerala has been provided in the table f, Where
all the three quadrants show negative results except the correlation coefficient for colleges/Universities
in low Muslim density districts. Districts in the more than category show negative correlation
coefficients -0.39 and -0.53 for both schools and colleges/universities. Which means that the even the
state with the high HDI rank needs more number of educational Institutions. As well as the less than
category shows there are more schools in such districts but there is a need of more number of
colleges/universities with -0.80 and 0.46 correlation coefficients respectively.
Table f : Correlation coefficient for mean number of schools and colleges/universities to the Muslim
population of the state, Kerala
Districts with
Mean density of
Schools (Per lakh
Total Population)
Correlation
Coefficient
Mean density of
Colleges (Per lakh
Total Population)
Correlation
Coefficient
More than Mean number of
Muslims 54.3 -0.39 2.3 -0.53
Less than Mean number of Muslims 53.5 -0.80 2.6 0.46
6.5 The Four-way Analysis table –
6.5.1 Uttar Pradesh
Uttar Pradesh is the most populous state in India with the highest proportion of Muslims. The land of
the alluvium situated at the widely spread Ganga river is a home to 199,581,477 people as on 1st March
2011. The state contributes 16.16% of India's population. The population density is 828 people per
square kilometre, making it one of the most densely populated states in the country. The sex ratio in
2011, at 912 women to 1000 men, was lower than the national figure of 943. The state's 2001–2011
decennial growth rate (including Uttarakhand) was 20.09%, higher than the national rate of 17.64%.As
per 2011 census, Uttar Pradesh, the most populous state in India, is home to the highest numbers of
both Hindus and Muslims. By religion, the population in 2011 was Hindus 79.73%, Muslims 19.26%,
Sikhs 0.32%, Christians 0.18%, Jains 0.11%, Buddhists 0.10%, and Others 0.30%. The literacy rate of
the state at the 2011 census was 67.7%, which was below the national average of 74%. The literacy rate
for men is 79% and for women 59%.
The Net Domestic Product of the State (2009-10) was Rs. 316905 which remains far behind the national
average of Rs. 4493743. The contribution from the Service sector remains the highest with 60.34% ,
followed by 25.01% by agriculture and the lowest by the industries 14.66% to the NSDP. The Per Capita
Net State Domestic Product (factor cost) for the state was Rs. 16181. The state’s HDI value lied at a
very low of 0.380 It becomes important to understand the main districts which lead to such poor figures
and the underlying factors.
Schools in Uttar Pradesh
The four way table for the Schools distribution in Uttar Pradesh shows highest number of districts in
the LL category. The HH means the districts where number of persons per school as well as the number
of Muslims per Lakh total Population both remain high, which indicates there are lesser number of
Schools in those districts. The most desirable being the HL and LL categories for both schools and
colleges.

Schools per lakh Muslim
Population of the Districts
Number of Persons Per School (Average in Uttar Pradesh = 835826)
More than Average District Less than Average District
Muslims
Per lakh
population
(Average
in Uttar
Pradesh =
17964)
More than
Average No.
of Muslim
Per Lakh
Population
Baghpat, Bahraich, Balarampur,
Barabanki, Bareilly, Badaun,
Gaziabad, Lucknow, Meerut,
Moradabad, Muzaffarnagar,
Sant Kabir Nagar,
Aligarh, Bijnor, Bulandshahar, Gonda, Jyotiba
Phule Nagar, Kheri, Mau, Philibit, Rampur,
Saharanpur, Shrawasti, Siddharth Nagar,
Sitapur
Less than
Average No.
of Muslim
Per Lakh
Population
Agra, Allahabad, Ballia,
Bhadoi, Chandauli, Gautam
Buddha nagar, Gorakhpur,
Raebareli, Maharajganj ,
Kanpur Nagar, Gorakhpur,
Kushinagar, Sultanpur,
Varanasi
Ambedkar Nagar, Auraiya, Azamgarh, Banda,
Chitrakoot, Deoria, Etah, Etawah, Faizabad,
Farukkhabad, Fatehpur, Firozabad, Ghazipur,
Hamirpur, Hardoi, Jalaun, Jaunpur, Jhansi,
Kannauj, Kanpur Dehat, Kansiram Nagar,
Kaushambi, Lalitpur, Mahoba, Mainpuri,
MAthura, Mirzapur, Pratapgarh, Shahjahanpur,
Sonbhadra, Unnao
These are mainly the bordering districts of Nepal with high Muslim Population lesser number of schools
in these districts, The Sex ratio also seems to be comparatively better than the whole state as the fact
concludes for the practice of Son Preference among the northern states of India. These are high
population density Districts with exceptions for Bahraich, Balarampur, Badaun and Barabanki, as well
as High Muslim Representation. Moradabad, Gaziabad, Lucknow Bareilly, Muzaffarnagar and Meerut
are major urban centres of the state where almost more than 50% of the population lives in Urban areas
as compared to the other districts in the list that very low representation in Urban areas. The lowest can
be seen in the districts of Balrampur, Sant Kabir Nagar and Bahraich. It is questionable that the districts
with high urban population too lack in the number of schools.
Background Characteristics of the Districts of the HH category-
HH category districts Population Density Sex Ratio Urban Pop. (in%) Rural pop. (in%)
Moradabad 47,72,006 1283 906 32.98 67.02
Gaziabad 46,81,645 3971 881 67.55 32.45
Lucknow 45,89,838 1816 917 66.21 33.79
Bareilly 44,48,359 1080 887 35.26 64.74
Muzaffarnagar 41,43,512 1034 889 28.75 71.25
Badaun 36,81,896 712 871 17.51 82.49
Bahraich 34,87,731 666 892 8.14 91.86
Meerut 34,43,689 1346 886 51.08 48.92
Barabanki 32,60,699 741 910 10.15 89.85
Balarampur 21,48,665 642 928 7.74 92.26
Sant Kabir Nagar 17,15,183 1042 972 7.49 92.51
Baghpat 13,03,048 986 861 21.11 78.89
The districts of the HL are mostly with the High population density districts in case of Allahabad,
Kanpur Nagar, Gorakhpur, Varanasi, Ballia and Agra. These are also the districts with high urban
population with the highest two being Kanpur Nagar and Gautam Buddha Nagar. These are also the
districts with comparatively higher proportion of Muslim population than the others in the list, that also
have the high number of persons per school that shows the status of these districts that in spite urbanised
the schools representation remains below the mark.

Background Characteristics of the Districts of the HL category-
HL category districts Population Density Sex Ratio Urban Pop. (in%) Rural pop. (in%)
Allahabad 59,54,391 1086 901 24.74 74.26
Kanpur Nagar 45,81,268 1452 862 65.83 34.87
Gorakhpur 44,40,895 1337 950 18.83 81.17
Agra 44,18,797 1093 868 35.26 64.74
Sultanpur 37,97,117 856 983 5.26 94.74
Varanasi 36,76,841 2395 913 43.44 56.56
Kushinagar 35,64,544 1227 961 4.72 95.28
Rae Bareli 34,05,559 739 943 9.04 90.96
Ballia 32,39,774 1087 937 9.39 90.61
Maharajganj 26,84,703 909 943 5.02 94.98
Chandauli 19,52,756 768 918 12.42 87.58
Gautam Buddha Nagar 16,48,115 1286 851 59.12 40.88
Sant Ravidas Nagar 15,78,213 1555 955 14.53 85.47
Colleges in Uttar Pradesh
Similarly we prepare a Four-way table for the Colleges in the districts of Uttar Pradesh with the number
of Muslims per lakh total population of the district and the No. of persons per school for each district.
A list of six districts from the HH Category was found. We find out the other background characteristics
for study the particular districts and their behaviour.
Colleges per lakh
Muslim Population
of the Districts
Number of Persons Per Colleges (Average in Uttar pradesh = 305635654)
More than Average
District Less than Average District
Muslims
Per lakh
population
(Average in Uttar
Pradesh = 17964)
More than
Average
No. of
Muslim Per
Lakh
Population
Bahraich, Barabanki,
Bijnor, Sitapur, Sant
Kabir Nagar, Rampur
Aligarh, Baghpat, Balarampur, Bareilly, Budaun,
Bulandshahar, Gaziabad, Gonda, Jyotiba Phule
Nagar, Siddharthnagar, Shrawasti, Saharanpur,
Philibit, Muzaffarnagar, Moradabad, Meerut, Mau,
Lucknow, Kheri
Less than
Average
No. of
Muslim Per
Lakh
Population
Ambedkarnagar,
Azamgarh, Ballia, Banda,
Basti, Bhadoi, Chandauli,
Deoria, Etawah, Faizabad,
Farrukhabad, Firozabad,
Shahjahanpur, Sonbhadra,
Sultanpur
Agra, Allahabad, Auriya, Chitrakoot, Etah, Fatehpur,
Gautam Buddha Nagar, Mirzapur, Gazipur,
Gorakhpur, Hamirpur, Hardoi, Varanasi, Jalaun,
Jaunpur, Jhansi, Kannauj, Unnao, Kanpur Dehat,
Kanpur Nagar, Kansiram Nagar, Pratapgarh,
Kaushambi, Kushinagar, Lalitpur, Maharajganj,
Mahoba, Mainpuri, Mathura
The districts in the HH category form very small clusters at the border of Nepal. These districts are the
not very prosperous districts. The Percentage of urban population urban is at one decimal for Bahraich
and Sant Kabir Nagar. Again Sant Kabir Nagar has the highest Population density among the all. The
sex ratios of all the districts remain high at above 850 females per 1000 males. These districts seem to
be the poorest among the HDI rankings as well.
Background Characteristics of the Districts of the HH category-
HH category
districts Population Density Sex Ratio
Urban Pop.
(in%)
Rural pop.
(in%)
Bahraich 34,87,731 666 892 8.14 91.86
Barabanki 32,60,699 741 910 10.15 89.85

Sant Kabir Nagar 17,15,183 1042 972 7.49 92.51
Bijnor 36,82,713 807 917 25.13 74.87
Sitapur 44,83,992 781 888 11.84 88.16
Rampur 23,35,819 909 987 25.2 74.8
The HL category of districts are mainly the ones clustering on the western part of the Ganga river, the
region is mostly with low density areas, among which Ambedkarnagar, Firozabad, Ballia, Azamgarh,
Bhadoi, Deoria, Faizabad with more than 1000 persons per Square Km. Azamgarh and Deoria show
good signs of sex ration above 1000 females per 1000 males. Whereas the total Proportion of urban
population lies at a very poor state of less than 35% overall. These are mostly rural districts with more
than 65% of all the districts in the list as rural population. These are the districts with More number of
Muslims per lakh total population with lesser number of colleges for the population of that district.
Background Characteristics of the Districts of the HL category-
HL category districts Population Density Sex Ratio Urban Pop. (in%) Rural pop. (in%)
Ambedkarnagar 23,97,888 1020 978 11.71 88.29
Farrukhabad 18,85,204 864 874 22.08 77.92
Firozabad 24,98,156 1038 875 33.35 66.65
Shahjahanpur 30,06,538 685 872 19.76 80.24
Sonbhadra 18,62,559 270 918 16.88 83.12
Sultanpur 37,97,117 856 983 5.26 94.74
Banda 17,99,410 408 863 15.32 84.68
Ballia 32,39,774 1087 937 9.39 90.61
Azamgarh 46,13,913 1138 1019 8.53 91.47
Basti 24,64,464 917 963 5.6 94.4
Bhadoi 15,78,213 1555 955 14.53 85.47
Chandauli 19,52,756 768 918 12.42 87.58
Deoria 31,00,946 1221 1017 10.22 89.78
Etawah 15,81,810 684 870 23.16 76.84
Faizabad 24,70,996 1056 962 13.77 86.23
The Maps on the Two Four-way tables indicating the status of Schools and colleges is also presented
to understand the clustering of the districts in the two categories of HH and HL.

6.5.2 Bihar
Bihar is the Twelfth largest state in the country with an area of 94,163 km2 (36,357 sq. mi). After the 2011
Census, Bihar was the third most populous state with total population of 104,099,452 (54,278,157 male
and 49,821,295 female). Almost 58% of Bihar's population was below 25 years age, which is the highest in
India. Most of Bihar's population belongs to Indo-Aryan-speaking ethnic groups along with few Dravidian-
speaking and Austroasiatic-speaking people mostly in Chhotanagpur Plateau (now part of Jharkhand). Bihar
has a total literacy rate of 63.82% (73.39% for males and 53.33% for females), recording a growth of 20%
in female literacy over the period of a decade. At 11.3%, Bihar has the second lowest urbanisation rate in
India. As of the 2011 census, population density surpassed 1,000 per square kilometre, making Bihar India's
most densely-populated state.
The Net domestic Product (at factor cost) (Rs crores) is 110778, which is way behind that of The NDP
of UP. The NSDP of the state sees the highest contribution from the services sector, followed by the
Agriculture and Industries, they are 74.07%, 21.30% and 4.63% respectively. The state does not have
much industries leading to its lowest representation. And apparently, Bihar is the state with the Second
highest proportion of Muslims in India. Per Capita Net State Domestic Product (factor cost) for the
State is Rs. 11558. Human Development Index Value (HDI) of the state is 0.367 at the 21 rank out of
23.
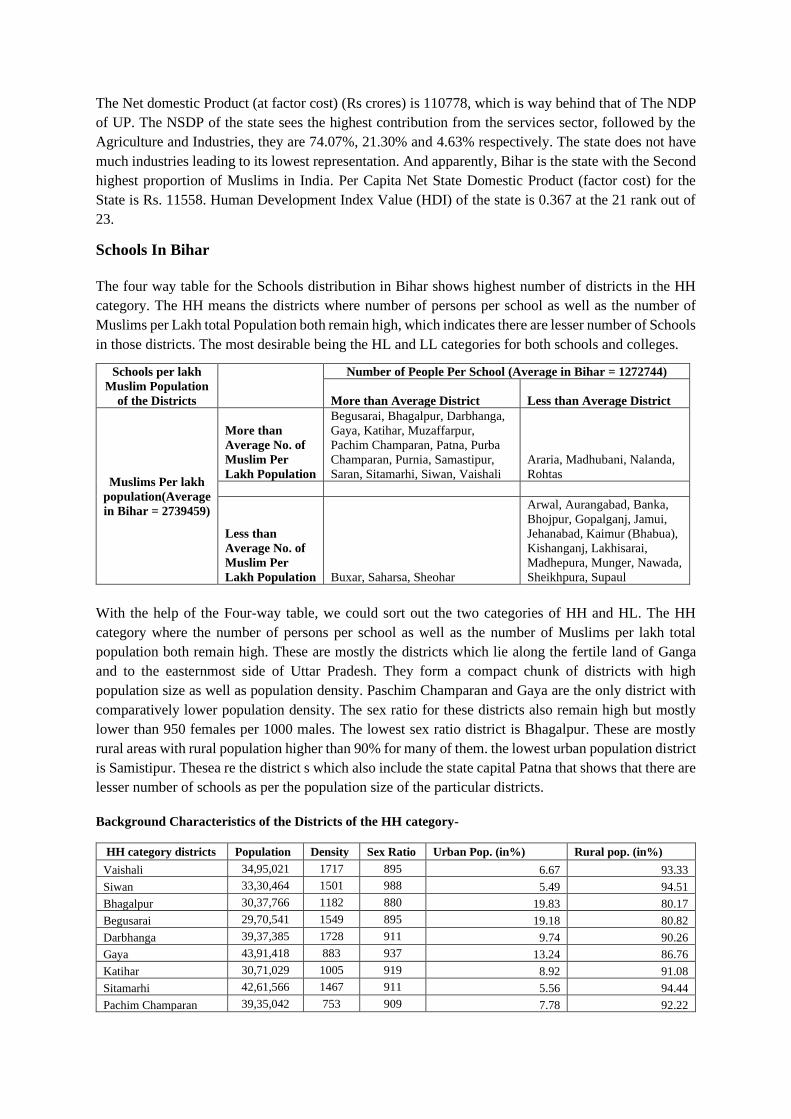
Schools In Bihar
The four way table for the Schools distribution in Bihar shows highest number of districts in the HH
category. The HH means the districts where number of persons per school as well as the number of
Muslims per Lakh total Population both remain high, which indicates there are lesser number of Schools
in those districts. The most desirable being the HL and LL categories for both schools and colleges.
Schools per lakh
Muslim Population
of the Districts
Number of People Per School (Average in Bihar = 1272744)
More than Average District Less than Average District
Muslims Per lakh
population(Average
in Bihar = 2739459)
More than
Average No. of
Muslim Per
Lakh Population
Begusarai, Bhagalpur, Darbhanga,
Gaya, Katihar, Muzaffarpur,
Pachim Champaran, Patna, Purba
Champaran, Purnia, Samastipur,
Saran, Sitamarhi, Siwan, Vaishali
Araria, Madhubani, Nalanda,
Rohtas
Less than
Average No. of
Muslim Per
Lakh Population Buxar, Saharsa, Sheohar
Arwal, Aurangabad, Banka,
Bhojpur, Gopalganj, Jamui,
Jehanabad, Kaimur (Bhabua),
Kishanganj, Lakhisarai,
Madhepura, Munger, Nawada,
Sheikhpura, Supaul
With the help of the Four-way table, we could sort out the two categories of HH and HL. The HH
category where the number of persons per school as well as the number of Muslims per lakh total
population both remain high. These are mostly the districts which lie along the fertile land of Ganga
and to the easternmost side of Uttar Pradesh. They form a compact chunk of districts with high
population size as well as population density. Paschim Champaran and Gaya are the only district with
comparatively lower population density. The sex ratio for these districts also remain high but mostly
lower than 950 females per 1000 males. The lowest sex ratio district is Bhagalpur. These are mostly
rural areas with rural population higher than 90% for many of them. the lowest urban population district
is Samistipur. Thesea re the district s which also include the state capital Patna that shows that there are
lesser number of schools as per the population size of the particular districts.
Background Characteristics of the Districts of the HH category-
HH category districts Population Density Sex Ratio Urban Pop. (in%) Rural pop. (in%)
Vaishali 34,95,021 1717 895 6.67 93.33
Siwan 33,30,464 1501 988 5.49 94.51
Bhagalpur 30,37,766 1182 880 19.83 80.17
Begusarai 29,70,541 1549 895 19.18 80.82
Darbhanga 39,37,385 1728 911 9.74 90.26
Gaya 43,91,418 883 937 13.24 86.76
Katihar 30,71,029 1005 919 8.92 91.08
Sitamarhi 42,61,566 1467 911 5.56 94.44
Pachim Champaran 39,35,042 753 909 7.78 92.22

Patna 58,38,465 1823 897 43.07 56.93
Purba Champaran 50,99,371 1285 902 9.99 90.01
Purnia 32,64,619 1011 921 10.51 89.49
Samastipur 42,61,566 1467 911 3.47 96.53
Saran 39,51,862 1496 954 8.94 91.06
The HL category is the second arear of concern for us, where the Number of Muslims per lakh
population is less but the number of persons per lakh population still remains high. These are the 3
districts with comparatively lower population size but high population density all above 1000 persons
per sq. km. the sex ratio too doesn’t perform very well, that nowhere even shows closer to 950 females
per 1000 males. These are the least urbanised districts with the urban population even less than 10%.
There are lesser number of schools which is added to the fact that the population is mainly rural that
doesn’t much fight for the rights.
Background Characteristics of the Districts of the HL category-
HL category districts Population Density Sex Ratio Urban Pop. (in%) Rural pop.
(in%)
Buxar 17,06,352 1002 922 9.64 90.36
Sheohar 6,56,246 1880 893 4.28 95.72
Saharsa 19,00,661 1127 906 8.24 91.76
Colleges in Bihar
we construct similar table for the colleges representation in Bihar with the distribution o Muslims in the
states.
Colleges per lakh
Muslim Population of
the Districts
Number of People Per Colleges (Average in Bihar = 110350)
More than
Average District Less than Average District
Muslims Per lakh
population(Average
in Bihar = 2739459)
More than Average
No. of Muslim Per
Lakh Population
Araria, Begusarai,
Gaya, Katihar,
Purnia
Bhagalpur, Madhubani, Muzaffarpur, Nalanda,
Paschim Champaran, Patna, Purba Champaran,
Rohtas, Samastipur, Saran, Sitamarhi, Siwan,
Vaishali
Less than Average
No. of Muslim Per
Lakh Population
Banka, Bhojpur,
Buxar, Jamui,
Kaimur(Bhabua),
Khagaria,
Kishanganj
Arwal, Aurangabad, Gopalganj, Jehanabad,
Madhubani, Munger, Nalanda, Nawada,
Rohtas, Sheikhpura, Sapaul
As far as colleges in the districts of Bihar is concerned, we follow the same method of studying the
number of persons per college to the population and the availability of colleges. It was observed that
the highly populated districts of Araria, Purnia, Katihar, Gaya and Begusarai fall in this category. All the
district except for Gaya are the most densely populated districts, they are also very poor sex ratio states. All the
five districts also have the proportion of population urban lower than 20%. These are the Muslim dominated states
with lesser number of colleges.
Background Characteristics of the Districts of the HH category-
HH category districts Population Density Sex Ratio Urban Pop. (in%) Rural pop. (in%)
Araria 28,11,569 993 921 6.00 94
Purnia 32,64,619 1011 921 10.51 89.49
Katihar 30,71,029 1005 919 8.92 91.08
Gaya 43,91,418 883 937 13.24 86.76
Begusarai 29,70,541 1549 895 19.18 80.82

The second category with high population size but comparatively lesser density is again the least
urbanised group with most of the values of proportion of urban population in only single decimals.
These districts do not perform very well in case of sex ratios. A majority of these districts coincide with
the HH category for schools, the district with lesser number of schools, and low sex ratio has lesser
number of students to send for higher education. This clustering can be clearly seen in the maps
depicting the four categories of the table.
Background Characteristics of the Districts of the HL category-
HL category districts Population Density Sex Ratio Urban Pop. (in%) Rural pop. (in%)
Banka 20,34,763 674 907 3.5 96.5
Bhojpur 27,28,407 1139 907 14.29 85.71
Buxar 17,06,352 1002 922 9.64 90.36
Jamui 17,60,405 568 922 8.26 91.74
Kaimur 16,26,384 488 920 4.03 95.97
Khagaria 16,66,886 1122 886 5.23 94.77
Kishanganj 16,90,400 897 950 9.53 90.47

6.5.3 Assam
Assam is a state in north eastern India, situated south of the eastern Himalayas along
the Brahmaputra and Barak River valleys. Assam covers an area of 78,438 km2 (30,285 sq mi). The
state is bordered by Bhutan and Arunachal Pradesh to the north; Nagaland and Manipur to the
east; Meghalaya, Tripura, Mizoram and Bangladesh to the south; and West Bengal to the west via
the Siliguri Corridor, a 22 kilometres (14 mi) strip of land that connects the state to the rest of India.
The Assamese economy is aided by wildlife tourism to Kaziranga National Park and Manas National
Park, which are World Heritage Sites.
The total population of Assam is 31 million (Census 2011), which contributes 2.58% of the total
population of the country. The Net domestic Product (at factor cost) (in Rs crores) is Rs. 60912. The
contribution made to the NSDP is the highest from the services sector with 61.89% followed by 24.44%
by the agriculture sector and then the lowest contribution by the Industries, 13.68%. The Per Capita Net
State Domestic Product (factor cost) is Rs. 20279. The Human Development Index Value (HDI) of the
state is 0.444 which is 16th HDI rank out of the 23.
Schools in Assam
With the help of the data taken from the census of India tables the four-way analysis table is constructed
on the basis of Muslims Per lakh Population and Number of persons Per school.
Schools per lakh Muslim
Population of the Districts
Number of People Per School (Average in Assam=186260)
More than Average District Less than Average District
Muslims Per lakh
population(Average in
Assam = 34321)
More than
Average No. of
Muslim Per
Lakh Population
Dhubri, Karimganj, Morigaon,
Nagaon,
Barpeta, Bongaigaon, Chachar,
Darrang, Goalpara, Hailakhandi,
Kamrup, Nalbari
Less than
Average No. of
Muslim Per
Lakh Population
Dibrugarh, Golaghat, Kamrup
Metropolitan, Sonitpur,
Tinsukia, Udalguri
Baska, Chirang, Dhemaji, Dima
Hasao, Jorhat, Karbi Anglong,
Kokrajhar, Lakhimpur, Sivasagar
In the HH category from the Four-way table, the district sin the HH category are Dhubri, Nagaon,
Morigaon, Karimganj. These high population areas with lower density of Persons per km. sq. the sex
ratio in these districts is comparatively higher than that of the states of Bihar and Uttar Pradesh, where
the sex ratio of all these districts lie at more than 950 females per 1000 males. These four districts are
also the low population density areas, with less than 15% of urban population in all of them and the fact
that was previously established that these are high Muslim dominated areas with higher number of
persons per 1 lakh population, which means there are lesser no. of schools in these districts.
Background Characteristics of the Districts of the HH category-
HH category districts Population Density Sex Ratio Urban Pop. (in%) Rural pop. (in%)
Dhubri 19,49,258 896 953 10.45 89.55
Nagaon 28,23,768 711 962 13.09 86.91
Morigaon 9,57,423 617 967 7.66 92.34
Karimganj 12,28,686 679 963 8.93 91.07
The second category of the districts where the districts have high population size but lower population
density (less than 500 persons per km. sq.) given Assam’s Geographical features. The sex ratio of these
districts remain fairly good, and also these are the least urbanised areas with lower proportion of urban
population, except for Kamrup Metropolitan district. They form clusters at the western and the southern

edge of the state. These districts of the state are listed for higher no. of persons per school and lesser
number of Muslims in the classification.
Background Characteristics of the Districts of the HL category-
HL category districts Population Density Sex Ratio Urban Pop. (in%) Rural pop. (in%)
Dibrugarh 13,26,335 392 961 18.38 81.62
Golaghat 10,66,888 305 964 9.16 90.84
Kamrup 15,17,542 489 949 9.38 90.62
Kamrup Metropolitan 12,53,938 1313 936 82.7 17.3
Sonitpur 19,24,110 370 956 9.04 90.96
Tinsukia 13,27,929 350 952 19.94 80.06
Udalguri 8,31,668 413 973 4.52 95.48
Colleges in Assam
Assam well known as the valley of Bramhaputra has comparatively lesser number of colleges when
compared with the national whole. The average number of Muslims Per Lakh population in Assam is
34321. The districts which came up for the HH category of the Colleges in Assam are almost similar
the HH category of schools.
Colleges per lakh
Muslim Population of
the Districts
Number of People Per Colleges (Average in Assam = 11194708)
More than Average District Less than Average District
Muslims Per lakh
population(Average in
Assam = 34321)
More than Average
No. of Muslim Per
Lakh Population
Dhubri, Goalpara, Kamrup,
Karimganj, Nagaon
Barpeta, Bongaigaon, Chachar,
Darrang, Hailakhandi, Morigaon,
nalbari
Less than Average
No. of Muslim Per
Lakh Population Lakhimpur, Udalguri
Baska, Chirang, Dhemaji, Dibrugarh,
Dima Hasao, Golaghat, Jorhat,
Kamrup Metropolitan, Karbi
Anglong, Kokrajhar, Sivasagar,
Sonitpur, Tinsukia
The districts of Dhubri, Nagaon, Karimganj are the ones with both the lowest number of schools as well
as colleges. And as far our research concerns, these are also the high Muslim Population areas. All the
districts in the list are the High population size areas with the density ranging from 489 to 896 persons
per km. sq. The sex ratio in the state remains at almost above 950 females per 1000 males. They are
also the poor representation in case of urban population. Ranging from a very low of 9.38% in Kamrup
to 13.69% in Goalpara.
Background Characteristics of the Districts of the HH category-
HH category districts Population Density Sex Ratio Urban Pop. (in%) Rural pop. (in%)
Dhubri 19,49,258 896 953 10.45 89.55
Goalpara 10,08,183 553 964 13.69 86.31
Kamrup 15,17,542 489 949 9.38 90.62
Karimganj 12,28,686 679 963 8.93 91.07
Nagaon 28,23,768 711 962 13.09 86.91
The next category has only 2 districts of Lakhimpur and Udalguri with population density lower than
500 persons per km. sq. and sex ratio above 950 females per 1000 males. They are also less urbanised
districts with less than 10% urban Population. Both these categories where there are lesser number of
colleges to the total population
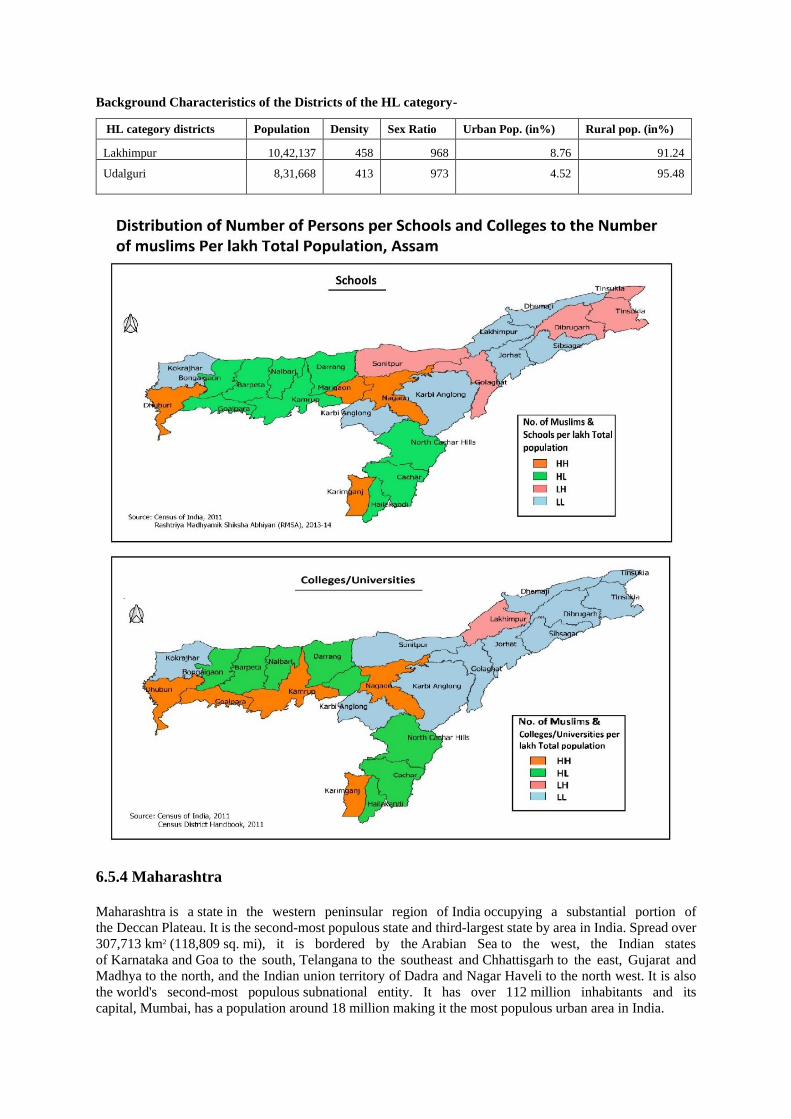
Background Characteristics of the Districts of the HL category-
HL category districts Population Density Sex Ratio Urban Pop. (in%) Rural pop. (in%)
Lakhimpur 10,42,137 458 968 8.76 91.24
Udalguri 8,31,668 413 973 4.52 95.48
6.5.4 Maharashtra
Maharashtra is a state in the western peninsular region of India occupying a substantial portion of
the Deccan Plateau. It is the second-most populous state and third-largest state by area in India. Spread over
307,713 km2 (118,809 sq. mi), it is bordered by the Arabian Sea to the west, the Indian states
of Karnataka and Goa to the south, Telangana to the southeast and Chhattisgarh to the east, Gujarat and
Madhya to the north, and the Indian union territory of Dadra and Nagar Haveli to the north west. It is also
the world's second-most populous subnational entity. It has over 112 million inhabitants and its
capital, Mumbai, has a population around 18 million making it the most populous urban area in India.

Maharashtra has a considerable proportion of Muslims in the state, The state Net domestic Product (at factor
cost) (Rs crores) was Rs. 634828 in 2009-10. The highest contributor to the NSDP is from the Service sector
is 70.44%, followed by Industrial sector by 20.99%, the lowest contributing sector is from the Agriculture
sector by 8.57%. The state is majorly urbanised with the Per Capita Net State Domestic Product (factor cost)
being Rs. 57458. The Human development index value for Maharashtra is 0.572 with HDI rank 7th out of
23.
Schools in Maharashtra
In order to study the status of school education system un the state, a Four way table analysis was
conducted following which the two categories of HH and HL were taken into account. The districts
with high Muslim concentration but lower number of schools are Pune and Nagpur. Both the districts
are known for its high urbanisation.
Schools per lakh
Muslim Population
of the Districts
Number of People Per School (Average in Maharashtra = 1089220)
More than Average District Less than Average District
Muslims Per lakh
population(Average
in Maharashtra =
10600.10 )
More than
Average No. of
Muslim Per Lakh
Population Pune, Nagpur
Ahmadnagar, Chandrapur, Dhule,
Gadchiroli, Gondiya, Holhapur,
Nandurbar, Raigarh, Sangli, Sartara,
Sindhudurg, Solapur, Wardha, Yavatmal
Less than Average
No. of Muslim Per
Lakh Population
Buldhana, Jalgaon, Mumbai,
Mumbai Suburban, Nashik,
Thane
Akola, Amravati, Aurangabad, Bid,
Hingoli, Jalna, Latur, Naded, Osmanabad,
Parbhani, Ratnagiri, Washim
Where Pune has been the capital of the Marathas since ancient times, Nagpur is known for hosting the
Winter session of the state Legislature. Both these districts with high Population size and more than
60% urban population have the density of 603 and 470 persons per km. sq. respectively for Pune and
Nagpur. The state of sex ratio for both the urban centres do not show good numbers. These two districts
with high Muslim concentration have lesser number of schools per lakh population.
Background Characteristics of the Districts of the HH category-
HH category districts Population Density Sex Ratio Urban Pop. (in%) Rural pop. (in%)
Pune 94,29,408 603 886 60.99 39.01
Nagpur 46,53,570 470 915 68.31 31.69
The HL category is the second in the table where there are lesser number of Muslims but the number
of schools remain less as per the population of the district requires. These are the districts with
comparatively lesser Muslim population in than the above category. These districts of mostly the
Vidharbha region show poor proportion in both Urban Population but comparatively higher sex ratio
than the most Urbanised districts Mumbai, Mumbai Suburban and Thane. The districts of Buldhana,
Jalgaon and Nashik show very population density below 400 persons per km. sq. there is a great need
to improve the school statistics in these districts.
Background Characteristics of the Districts of the HL category-
HL category districts Population Density Sex Ratio Urban Pop. (in%) Rural pop. (in%)
Buldhana 25,86,258 268 934 21.22 78.78
Jalgaon 42,29,917 360 925 31.74 68.26
Mumbai 30,85,411 19652 832 100 0
Mumbai Suburban 93,56,962 20980 860 100 0
Nashik 61,07,187 393 934 42.53 57.47
Thane 1,10,60,148 1157 886 76.99 23.01
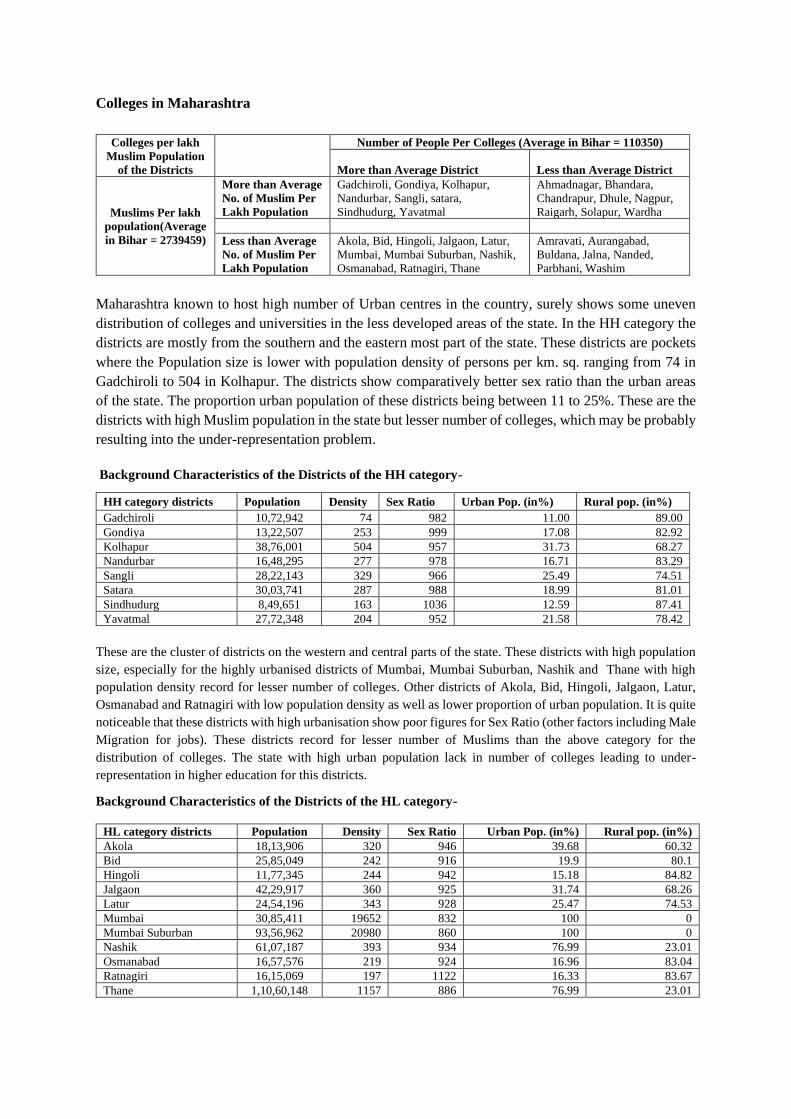
Colleges in Maharashtra
Colleges per lakh
Muslim Population
of the Districts
Number of People Per Colleges (Average in Bihar = 110350)
More than Average District Less than Average District
Muslims Per lakh
population(Average
in Bihar = 2739459)
More than Average
No. of Muslim Per
Lakh Population
Gadchiroli, Gondiya, Kolhapur,
Nandurbar, Sangli, satara,
Sindhudurg, Yavatmal
Ahmadnagar, Bhandara,
Chandrapur, Dhule, Nagpur,
Raigarh, Solapur, Wardha
Less than Average
No. of Muslim Per
Lakh Population
Akola, Bid, Hingoli, Jalgaon, Latur,
Mumbai, Mumbai Suburban, Nashik,
Osmanabad, Ratnagiri, Thane
Amravati, Aurangabad,
Buldana, Jalna, Nanded,
Parbhani, Washim
Maharashtra known to host high number of Urban centres in the country, surely shows some uneven
distribution of colleges and universities in the less developed areas of the state. In the HH category the
districts are mostly from the southern and the eastern most part of the state. These districts are pockets
where the Population size is lower with population density of persons per km. sq. ranging from 74 in
Gadchiroli to 504 in Kolhapur. The districts show comparatively better sex ratio than the urban areas
of the state. The proportion urban population of these districts being between 11 to 25%. These are the
districts with high Muslim population in the state but lesser number of colleges, which may be probably
resulting into the under-representation problem.
Background Characteristics of the Districts of the HH category-
These are the cluster of districts on the western and central parts of the state. These districts with high population
size, especially for the highly urbanised districts of Mumbai, Mumbai Suburban, Nashik and Thane with high
population density record for lesser number of colleges. Other districts of Akola, Bid, Hingoli, Jalgaon, Latur,
Osmanabad and Ratnagiri with low population density as well as lower proportion of urban population. It is quite
noticeable that these districts with high urbanisation show poor figures for Sex Ratio (other factors including Male
Migration for jobs). These districts record for lesser number of Muslims than the above category for the
distribution of colleges. The state with high urban population lack in number of colleges leading to under-
representation in higher education for this districts.
Background Characteristics of the Districts of the HL category-
HL category districts Population Density Sex Ratio Urban Pop. (in%) Rural pop. (in%)
Akola 18,13,906 320 946 39.68 60.32
Bid 25,85,049 242 916 19.9 80.1
Hingoli 11,77,345 244 942 15.18 84.82
Jalgaon 42,29,917 360 925 31.74 68.26
Latur 24,54,196 343 928 25.47 74.53
Mumbai 30,85,411 19652 832 100 0
Mumbai Suburban 93,56,962 20980 860 100 0
Nashik 61,07,187 393 934 76.99 23.01
Osmanabad 16,57,576 219 924 16.96 83.04
Ratnagiri 16,15,069 197 1122 16.33 83.67
Thane 1,10,60,148 1157 886 76.99 23.01
HH category districts Population Density Sex Ratio Urban Pop. (in%) Rural pop. (in%)
Gadchiroli 10,72,942 74 982 11.00 89.00
Gondiya 13,22,507 253 999 17.08 82.92
Kolhapur 38,76,001 504 957 31.73 68.27
Nandurbar 16,48,295 277 978 16.71 83.29
Sangli 28,22,143 329 966 25.49 74.51
Satara 30,03,741 287 988 18.99 81.01
Sindhudurg 8,49,651 163 1036 12.59 87.41
Yavatmal 27,72,348 204 952 21.58 78.42

6.5.4 West Bengal
West Bengal is a state in the eastern region of India along the Bay of Bengal. It is India's fourth-most
populous state. West Bengal is the thirteenth-largest Indian state, with an area of
88,752 km2 (34,267 sq mi). It is the second most densely populated state in India. Part of the ethno-
linguistic Bengal region of the Indian subcontinent, it borders Bangladesh in the east,
and Nepal and Bhutan in the north. It also borders the Indian states
of Odisha, Jharkhand, Bihar, Sikkim, and Assam. According to the provisional results of the 2011
national census, West Bengal is the fourth-most-populous state in India with a population of 91,347,736
(7.55% of India's population). West Bengal is religiously diverse, with regional cultural and religious
specificities. Although Hindus are the predominant community, the state has a large
minority Muslim population living majorly in rural areas of the state.

West Bengal lies in the average performing states list in case of HDI, with a value of 0.637 HDI value.
The state Net domestic Product (at factor cost) (Rs crores) was Rs.289434.18 in 2011-12, with the Per
Capita Income at constant prices (NSDP divided by Mid-year projected population) for the years 2011-
12 was Rs.32164. Overall the state has been performing fairly well when compared to the figures with
India and many other states. The highest contributor to the NSDP is the service sector with 63.61%,
followed by the Industry and agriculture by 18.75% and 17.64% respectively.
Schools in West Bengal
To study the performance of the schools and facilities available for the population of this Muslim
dominated state we conduct the four way analysis and look at the two categories of HH and HL.
Schools per lakh
Muslim Population
of the Districts
Number of People Per School (Average in West
Bengal=110350)
More than Average District Less than Average District
Number of
Muslims Per lakh
population
(Average in West
Bengal=25486.72)
More than Average
No. of Muslim Per
Lakh Population
Maldah, Kolkata, Hoogli,
Dakshin Dinajpur, Purulia
Paschim Medinipur, Jalpaiguri,
Howrah, Birbhum
Less than Average
No. of Muslim Per
Lakh Population Kochhbihar, Uttar Dinajpur
Bankura, North 24 Parganas,
Nadia, South 24 parganas,
Barddhaman, Murshidabad,
Purba Medinipur, Darjeeling
It was observed that Five districts of Maldah, Kolkata, Hoogli, Dakshin Dinajpur and Purulia fall into
the first category with more than average number of Muslims per lakh population and More than
average number of persons per school. These are high population size districts with fairly high density
of population except for Purulia. The sax ratio of these districts remains more than 950 females per
1000 males, the lowest sex ratio district in the list is Kolkata. The proportion of urban population
remains low for these districts as well. These are mainly bordering Bangladesh on the East and Bihar,
Jharkhand on its west. These districts account for According to the Census of India, the majority of
Muslims in West Bengal reside in the rural areas.
Background Characteristics of the Districts of the HH category-
HH category districts Population Density Sex Ratio Urban Pop. (in%) Rural pop. (in%)
Maldah 3988845 1069 944 13.58 86.42
Kolkata 44,96,694 24306 908 100 0
Hoogli 55,19,145 1753 961 38.57 61.43
Dakshin Dinajpur 16,76,276 755 956 14.1 85.9
Purulia 29,30,115 468 957 12.74 87.26
In the second category only two districts Koch Bihar and Uttar Dinajpur were found according to the
criteria. Both the districts show high population size. Where Koch Bihar shows population density of
832 persons per km. sq. Uttar Dinajpur has higher population density of 958 persons per km. sq. Sex
ratio of these districts are poor the given to the factor of high out migration of males. They are also the
least urbanised districts with 10.27% and 12.05% urban population.
Background Characteristics of the Districts of the HL category-
HL category districts Population Density Sex Ratio Urban Pop. (in%) Rural pop. (in%)
Koch Bihar 28,19,086 832 942 10.27 89.73
Uttar Dinajpur 30,07,134 958 939 12.05 87.95

Colleges in West Bengal
Colleges per lakh
Muslim Population
of the Districts
Number of People Per College (Average in West
Bengal=407719725)
More than Average District Less than Average District
Muslims Per lakh
population
(Average in West
Bengal=25486.72)
More than Average No.
of Muslim Per Lakh
Population
Maldah, Purulia, Dakshin
Dinajpur,
Jalpaiguri, Kolkata, Howrah,
Birbhum, Paschim Medinipur,
Hoogli
Less than Average No.
of Muslim Per Lakh
Population Kochhbihar, Uttar Dinajpur
Purba Medinipur,
Murshidabad, Bankura, North
24 Parganas, Nadia, South 24
parganas, Barddhaman,
Darjeeling
In the first category Maldah, Purulia and Dakshin Dinajpur represent the least availability of colleges.
It coincides with the HH table for the schools. It can be understood that these districts have both lesser
number of schools and colleges. This leads to the lower representation of these districts in higher
Education
Background Characteristics of the Districts of the HH category-
HH category districts Population Density Sex Ratio Urban Pop. (in%) Rural pop. (in%)
Maldah 3988845 1069 944 13.58 86.42
Purulia 29,30,115 468 957 12.74 87.26
Dakshin Dinajpur 16,76,276 755 956 14.1 85.9
In the second category again the two districts Koch Bihar and Uttar Dinajpur were seen. They are
least urbanised districts with 10.27% and 12.05% urban population. These two districts in both the
categories represent the poor state of schools and colleges.
Background Characteristics of the Districts of the HL category-
HL category districts Population Density Sex Ratio Urban Pop. (in%) Rural pop. (in%)
Koch bihar 28,19,086 832 942 10.27 89.73
Uttar Dinajpur 30,07,134 958 939 12.05 87.95
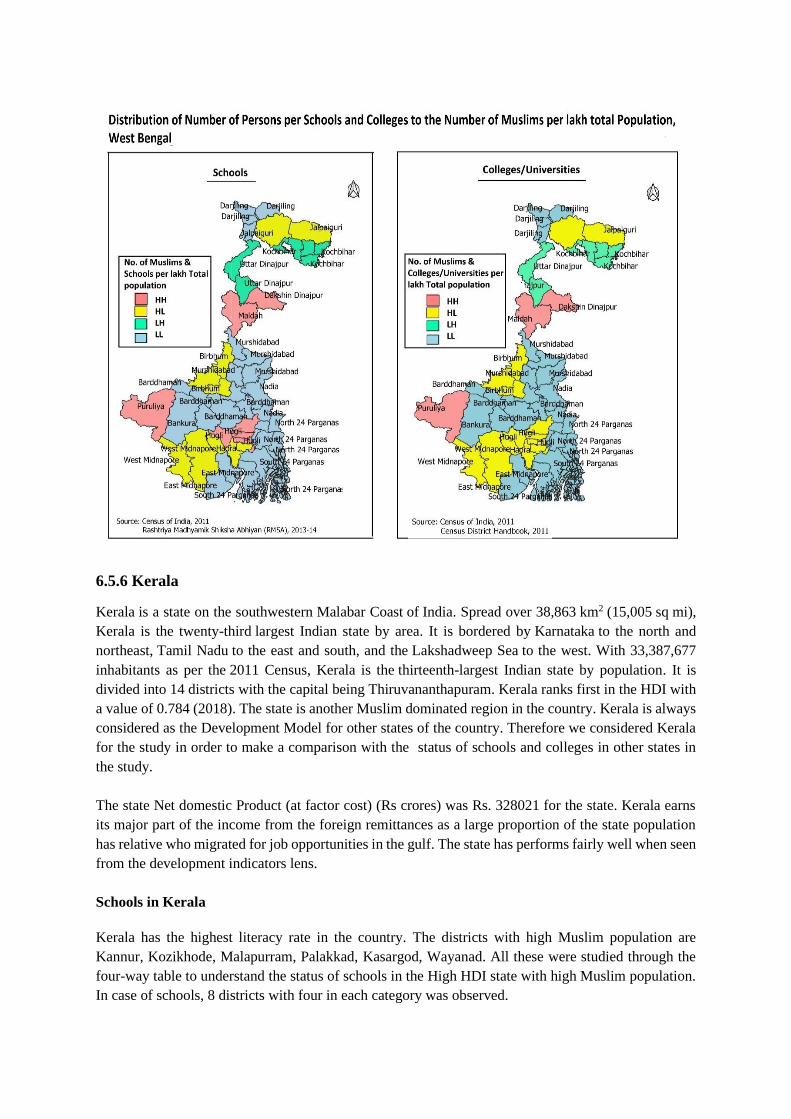
6.5.6 Kerala
Kerala is a state on the southwestern Malabar Coast of India. Spread over 38,863 km2 (15,005 sq mi),
Kerala is the twenty-third largest Indian state by area. It is bordered by Karnataka to the north and
northeast, Tamil Nadu to the east and south, and the Lakshadweep Sea to the west. With 33,387,677
inhabitants as per the 2011 Census, Kerala is the thirteenth-largest Indian state by population. It is
divided into 14 districts with the capital being Thiruvananthapuram. Kerala ranks first in the HDI with
a value of 0.784 (2018). The state is another Muslim dominated region in the country. Kerala is always
considered as the Development Model for other states of the country. Therefore we considered Kerala
for the study in order to make a comparison with the status of schools and colleges in other states in
the study.
The state Net domestic Product (at factor cost) (Rs crores) was Rs. 328021 for the state. Kerala earns
its major part of the income from the foreign remittances as a large proportion of the state population
has relative who migrated for job opportunities in the gulf. The state has performs fairly well when seen
from the development indicators lens.
Schools in Kerala
Kerala has the highest literacy rate in the country. The districts with high Muslim population are
Kannur, Kozikhode, Malapurram, Palakkad, Kasargod, Wayanad. All these were studied through the
four-way table to understand the status of schools in the High HDI state with high Muslim population.
In case of schools, 8 districts with four in each category was observed.

Schools per lakh
Muslim Population
of the Districts
Number of People Per School (Average in Kerala = 1219)
More than Average District Less than Average District
Muslims Per lakh
population(Average
in Kerala = 23462
More than
Average No. of
Muslim Per Lakh
Population
Kannur, Kozikhode, Malapurram,
Palakkad Kasargod, Wayanad
Less than Average
No. of Muslim Per
Lakh Population
Ernakulam, Kollam,
Thiruvanathapuram, Thrissur
Alappuzha, Idukki, Kottayam,
Pathanamthitta,
In the HH category the districts Kannur, Kozikhode, Malapurram, Palakkad, where the Muslims Per
lakh population is high as well as high persons per school coincide. All the background characteristics
taken into consideration show high values, sex ratio more than 1000, low population density in districts
Kannur and Palakkad and high in the other two districts of Malapurram and Kozikhode. Palakkad is the
only district with 75% rural population, whereas other districts show balanced values for both rural and
urban population. All these districts have lesser number of schools as per our analysis.
Background Characteristics of the Districts of the HH category-
HH category districts Population Density Sex Ratio Urban Pop. (in%) Rural pop. (in%)
Kannur 25,23,003 852 1136 65.04 34.96
Palakkad 28,09,934 627 1067 24.09 75.91
Malapurram 41,12,920 1157 1098 44.18 55.82
Kozikhode 30,86,293 1316 1098 67.15 32.85
In the HL category the districts Ernakulam, Kollam, Thiruvanathapuram, Thrissur. All the background
characteristics taken into consideration show high values, sex ratio more than 1000. These are
Population density districts with more than 1000 Persons per km. sq. All the districts show balanced
values for both rural and urban population. All these districts have lesser number of schools as per our
analysis.
Background Characteristics of the Districts of the HL category-
HL category districts Population Density Sex Ratio Urban Pop. (in%) Rural pop. (in%)
Ernakulam 32,82,388 1072 1027 68.07 31.93
Thrissur 31,21,200 1031 1108 67.17 32.83
Thiruvanathapuram 33,01,427 1508 1087 53.66 46.34
Kollam 26,35,375 1061 1113 45.05 54.95
Colleges in Kerala
Kerala has a fairly good number of colleges in its districts which indirectly supports the higher
representation of the state in Higher Education. Only two districts of Wayanad and Idukki can be seen
in the HH and HL categories.
Colleges per lakh
Muslim Population
of the Districts
Number of People Per Colleges (Average in Kerala = 133702440)
More than Average District Less than Average District
Muslims Per lakh
population(Average
in Kerala = 23462)
More than Average
No. of Muslim Per
Lakh Population Wayanad
Kasargod, Kozikhode,
Malapurram, Palakkad, Kannur
Less than Average
No. of Muslim Per
Lakh Population Idduki
Alappuzha, Ernakulam,
Kollam, Kottayam,
Pathanamthitta,
Thiruvananthapuram, Thrissur

In the HH category for colleges, Wayanad with comparatively lower population size and density shows
a sex ratio for 1035 females per 1000 males. Wayanad is a highly rural District with only 3.86% urban
population. This could probably be the reason for its lesser number of colleges.
Background Characteristics of the Districts of the HH category-
HH category districts Population Density Sex Ratio Urban Pop.
(in%)
Rural pop.
(in%)
Wayanad 8,17,420 384 1035 3.86 96.14
Idduki in the HL category shows similar results as the HH category. The district has comparatively
lesser Muslim population than the HH category, but lesser number of colleges than the other districts.
A picture more clearer for the understanding has been presented in the GIS maps for schools and
colleges according to Muslim population in the district is has been constructed.
Background Characteristics of the Districts of the HL category-
HL category districts Population Density Sex Ratio Urban Pop.
(in%)
Rural pop.
(in%)
Idduki 11,08,974 255 1006 4.69 95.31

7. Conclusion
The first Three tables representing the Literacy rates and proportion attained Higher education on the
basis of Religious communities from the census data provides a base for our further analysis. The tables
mostly highlight the states with lowest and highest rates of Literacy, Illiteracy and Graduate and above
across the states and Union Territories of India. These states coincide with the list of High Muslim
Density States. It also supports our Alternative Hypothesis but a stronger technique to prove our point
was he use of T-Test of significance analysis. The results of the T-Test of significance show significant
results that are in support of our argument that the Number of educational institutions per lakh of the
population for that particular district is lower than the Average Muslim Population. This can be truly
accepted for almost all the states of India, with highly significant results for the states, Jammu &
Kashmir, Assam, Kerala, West Bengal, Uttar Pradesh, Bihar, Delhi, Jharkhand, Uttarakhand and
Manipur as the top 10 states with higher proportion of Muslim Population.
States with relatively Medium proportion of Muslim population such as Andhra Pradesh, Maharashtra,
Karnataka, Gujarat, Rajasthan, Madhya Pradesh and Tamil Nadu also show significant p values unlike
the states with higher proportion of Muslim Population. Our T-Test of significance provides enough
evidences to accept our alternative hypothesis and conclude that the level of educational attainment
among the Muslim Minority across Indian states could be due to the availability of lesser number of
educational Institutions in the concerned state.
The selected six states of Uttar Pradesh, Bihar, West Bengal, Assam, Maharashtra and Kerala present a
more clearer picture when we run the correlation analysis to understand the degree and direction of
relation between the variables. The Correlation coefficients also open more ways in support of our
argument with strong negative values. It was observed that in almost all the states the districts with high
urban population the sex ratio was comparatively lower. These districts with high Muslim population
showed lesser number of schools and colleges. The spatial analysis for the states clearly revealed that
these districts with lesser number of schools and colleges form a cluster depending upon their,
economic, social and geographical expanse. The comparative analysis also showed that lesser the
number of schools and colleges in any district lower is the representation inn Education. The analysis
gathers number of evidences where we can say that the districts with high Muslim population have
lesser number of schools and colleges, which could be one prime reason for their under-representation
in Higher Education. Schools form the base of Education, and it was noticed that the districts which
showed lower number of schools also showed lower number of colleges. It seems there is a great need
of both schools and colleges/universities in these selected states.
Taking Kerala as the Development Model for comparison of other states, as Kerala being the highest in
the HDI rankings, Many indicators such as Urban Population, Density, sex ratio, etc are clear markers
of the status of Muslims in the state than the other states. Stark differences could be observed for the
states, Uttar Pradesh (highest proportion of Muslims), Bihar and Maharashtra.
Apparently, very limited academic discussion appears to occur on this issue. Reports of the Sachar
Committee or the “post-Sachar” Committee headed by Amitabha Kundu present the picture regarding
the situation of Muslims but do not treat this question in depth. Both the reports focus on presentation
of the status but neither explores the causes of under-representation. Much greater attention has been
given to school education and related subjects pertaining to Muslim children by those who have engaged
in research pertaining to their education.
There is a great need to investigate this issue which still remains untouched on a national whole, it is
important to study the how and why of the issue at all levels. Education is a fundamental right for every
individual (RTE Act). The Muslim Population of India is a minority but in order to develop and compete
with the world it is important that there should be uniform development, which can be led through
educating the population on an overall basis.
8. Limitations of the Data
The single – year age data for the religious population of India is yet to be released by the Census of
India. Hence, The two age groups (5-19) for school going and (20-29)for college going population has
been taken on an average range due to data constraints.
The category intermediate colleges has been dropped from the analysis due to lack of availability of the
data.