understanding a diverse generation - circle · understanding a diverse generation 6 youth civic...
TRANSCRIPT

1
Understanding a diverse generationYouth Civic Engagement in the United States
november 2011
Kei Kawashima-Ginsberg, CIRCLE Lead Researcherand CIRCLE staff

Understanding a diverse generation Youth Civic Engagement in the United States
CIRCLE (The Center for Information and Research on Civic
Learning and Engagement) conducts research on the civic
and political engagement of young Americans. CIRCLE is
a nonpartisan, independent, academic research center and
was founded in 2001 with a generous gift from the Pew
Charitable Trusts. CIRCLE is part of the Jonathan M. Tisch
College of Citizenship and Public Service at Tufts University:
activecitizen.tufts.edu
CirCLeJonathan M. Tisch College of Citizenship and Public Service
Lincoln Filene Hall
Tufts University
Medford, MA 02155
stay ConneCtedFind out about new research by signing up for our monthly
e-update:
civicyouth.org
FoLLow UsFacebook facebook.com/CivicyouthTwitter @Civicyouth
Understanding a diverse generation Youth Civic Engagement in the United States
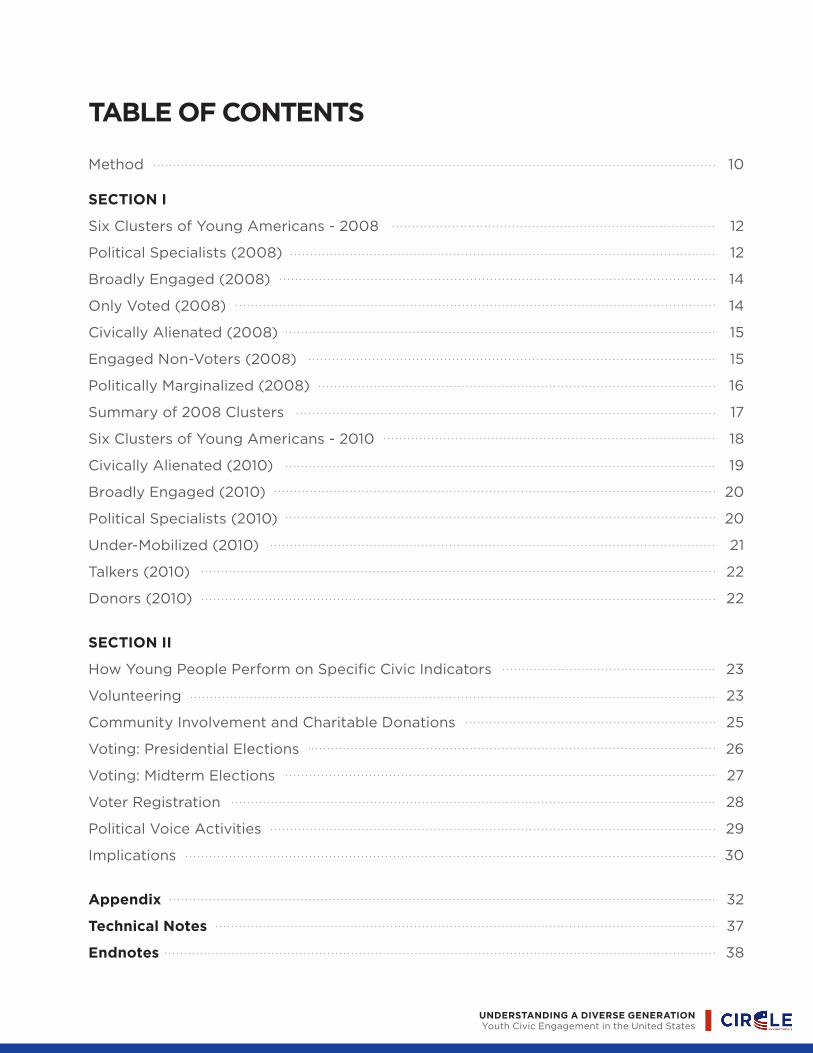
tabLe oF Contents
Method
seCtion i
Six Clusters of Young Americans - 2008
Political Specialists (2008)
Broadly Engaged (2008)
Only Voted (2008)
Civically Alienated (2008)
Engaged Non-Voters (2008)
Politically Marginalized (2008)
Summary of 2008 Clusters
Six Clusters of Young Americans - 2010
Civically Alienated (2010)
Broadly Engaged (2010)
Political Specialists (2010)
Under-Mobilized (2010)
Talkers (2010)
Donors (2010)
seCtion ii
How Young People Perform on Specific Civic Indicators
Volunteering
Community Involvement and Charitable Donations
Voting: Presidential Elections
Voting: Midterm Elections
Voter Registration
Political Voice Activities
Implications
appendix
technical notes
endnotes
10
12
12
14
14
15
15
16
17
18
19
20
20
21
22
22
23
23
25
26
27
28
29
30
32
37
38

Understanding a diverse generation Youth Civic Engagement in the United States
Figure 1: Youth Engagement Clusters, 2008
Table 1: Political Engagement and News Consumption Indicators Asked in the CPS in 2008 Only
Figure 2: Youth Engagement Clusters, 2010
Figure 3: National Volunteering Rate by Age, 2002-2010
Figure 4: Volunteering Rates among Young People by Race/Ethnicity (2010)
Figure 5: Volunteering Rates by Educational Attainment, Ages 18-to-29
Figure 6: Community Engagement and Charitable Donation by Age
Figure 7: Civic Activities by Race/Ethnicity, Age 18 to 29
Figure 8: Voter Turnout by Age in Presidential Elections, 1972-2008
Figure 9: Voter Turnout by Age in Midterm Elections, 1974-2010
Figure 10: Voter Registration in Presidential Elections 18-29, 1972-2008
Figure 11: Voter Registration 18-29 in Midterm Elections, 1974-2010
Table 2: Political Voice Activities, by Age
Appendix Table 1: Civic Engagement Indicators Included in the Model & Data Source
Appendix Table 2: 2008 Clusters Engagement by Indicators
Appendix Table 3: Cluster Break-Down By Demographic Groups (2008)
Appendix Table 4: 2010 Clusters Engagement by Indicators
Appendix Table 5: Cluster Break-Down By Demographic Groups (2010)
12
13
18
23
24
24
25
26
26
28
28
29
29
32
33
34
35
36
FigUres + tabLes
Understanding a diverse generation Youth Civic Engagement in the United States5
youth civic engagement is critical to our democracy.
Young people benefit personally by participating and
communities need their voices and their energies to
address problems. The future of our democracy depends on
each new generation developing the skills, values and habits
of participation.
In this report, CIRCLE provides an overview of young
Americans’ civic engagement: their service activities,
membership in groups and associations, discussion of
issues and political participation. Through its annual Current
Population Survey (CPS), the US Census now provides data
on these and other forms of civic engagement. Focusing on
ages 18-29, we have analyzed this national survey data and
examined the two most recent election years: 2008 and 2010.
Our analysis shows that young people should not be treated
as a uniform group. Often called the “Millennial Generation,”
this cohort is extraordinarily heterogeneous. They are the
most ethnically and racially diverse generation in American
history. Some attend world-class universities while others
attend high schools with dropout rates well above fifty
percent. Thus it is no surprise that they differ greatly in their
levels and types of civic engagement. Any generalizations
about “youth voter turnout” or “young people’s volunteering
rates” conceal crucial differences within the cohort that
anyone who hopes to engage young Americans should
understand. Some young people will vote in 2012 and some
will not. Instead of speculating about what the “youth vote”
might be, we need to understand the differences among
this diverse group so we can work to reduce the number of
disengaged youth.
exeCUtive sUmmary
Our analysis shows that
young people should not
be treated as a
UniForm groUp.
Us CensUs: CUrrent popULation sUrvey
Findings presented in this report
are based on CIRCLE’s analysis
of the U.S. Census, Current
Population Survey (CPS) data.
Volunteering estimates are from
the CPS September Volunteering
Supplement (2002-2010) and
voting and registration data
come from the CPS November
Voting/Registration Supplement,
(1972-2010). All other civic
engagement indicators, such
as access to information and
connection to others, come
from the 2008, 2009 and
2010 CPS Civic Engagement
Supplements. We used the most
recent data available. However,
some indicators (news access
and some political engagement
indicators) were only available
as pooled estimates from 2008-
2009 data.

Understanding a diverse generation Youth Civic Engagement in the United States6
To explore these differences, CIRCLE conducted a cluster
analysis of Census civic engagement data from 2008 and
2010. A statistical technique that divides a sample into distinct
profiles, our cluster analysis identified groups of youth with
different patterns and levels of civic engagement. Although
some similar groups emerged in both 2008 and 2010, our
findings from the two years differed in meaningful ways.
In 2008, the presidential election mobilized millions of young
people to vote and got many talking about political and civic
issues. Three of the six clusters that emerged in our analysis
of that year’s data reported voter turnout rates at or close
to 100%. These clusters, Broadly Engaged (19%), Political
Specialists (19%) and Only Voted (18%), differed mainly in
whether and how they were engaged beyond voting. The
rest of the youth population clustered into Civically Alienated
(16%), Politically Marginalized (13%) and Engaged Non-Voters
(14%). While largely comprised of non-voting youth, these
three clusters also differed primarily by their engagement
beyond voting. The 2008 clusters clearly reflect the
excitement around the 2008 presidential race and overall
high levels of civic - especially political - engagement among
young Americans.
To illustrate how different these clusters were, consider the
Broadly Engaged and Civically Alienated clusters. Almost
everyone in the Broadly Engaged cluster voted and many
also volunteered, worked with youth in their communities,
attended public meetings or worked with neighbors to
address community problems. Most had at least some college
education and 70.6% were White. Meanwhile, the Civically
Alienated group did not vote, volunteer, belong to any groups
or otherwise participate in local civil society. A majority held
a high school diploma or less, only ten percent were college
graduates and a majority were people of color.
A majority of the
Civically Alienated
group held a high
school diploma, only
10 perCent were CoLLege gradUates, and a majority were
people of color.

Understanding a diverse generation Youth Civic Engagement in the United States7
Policymakers and others
responsible for civic
education in schools,
CommUnities
and CommUnity
serviCe programs
shoULd FoCUs
on the severe
gaps in CiviC
partiCipation. The picture shifted in 2010, the most recent year in which
political participation was measured. Young Americans fell
into different clusters, collectively reflecting a different climate
for civic and political engagement than in 2008.
We identified a Broadly Engaged cluster (21%) and a Political
Specialists cluster (18%) which showed similar patterns of civic
engagement to the 2008 clusters with the same labels. While
these two groups were about the same size as the equivalent
clusters from 2008, the Civically Alienated cluster grew to
over one-fifth (23%) of the youth population. Additionally,
three new clusters emerged in 2010, Under-Mobilized (14%),
Talkers (13%) and Donors (11%). These new groups indicate
that a substantial proportion of young people were missing
opportunities to engage civically. Under-Mobilized youth were
registered to vote but did not cast a ballot, all members of the
Talkers cluster reported discussing political issues frequently
but did very little else, while Donors gave money to civic or
political causes but were not engaged beyond that.
Although it is unlikely that 2012 will replicate either 2008 or
2010, our cluster analysis holds important lessons for
the future:
• Reflecting underlying inequalities in social circumstances and opportunity, young people will probably divide into
groups ranging from highly alienated to deeply engaged.
Policymakers and others responsible for civic education
in schools, communities and community service programs
should focus on the severe gaps in civic participation.
Talkers
Under-Mobilized
Political Specialists
Broadly Engaged
Civically Alienated
Donors21.3%
11.3%
23.2%13.6%
17.5%
13%

Understanding a diverse generation Youth Civic Engagement in the United States8
• engaging more young americans in civic and political life
requires an awareness of how the young adult population
is segmented and the engagement of those subgroups. For
example, the Talkers cluster demonstrated interest in civic
and political issues, but many did not vote 2010. Our own
focus group research has found many disadvantaged young
adults fit this profile. Other research suggests that some
of these young people could be persuaded to vote if they
were directly asked to participate or if voting seemed more
accessible. Another important group consists of those who
voted in 2008 but did virtually nothing else in the civic or
political domain. Their interest in the 2008 election could be
leveraged to get them involved in other ways.
2008 CiviCaLLy aLienated
broadLy engaged
poLitiCaL speCiaLists
onLy voted
poLitiCaLLy marginiLized
engaged non-voters
Under-mobiLized
taLkers
donors
2010
16.1%
19%
19.3%
17.9%
13.3%
14.4%
23.2%
21.3%
17.5%
13.6%
13%
11.3%
engaging more
yoUng ameriCans
in CiviC and
poLitiCaL LiFe requires an awareness
of how the young adult
population is segmented
and the engagement of
those subgroups.
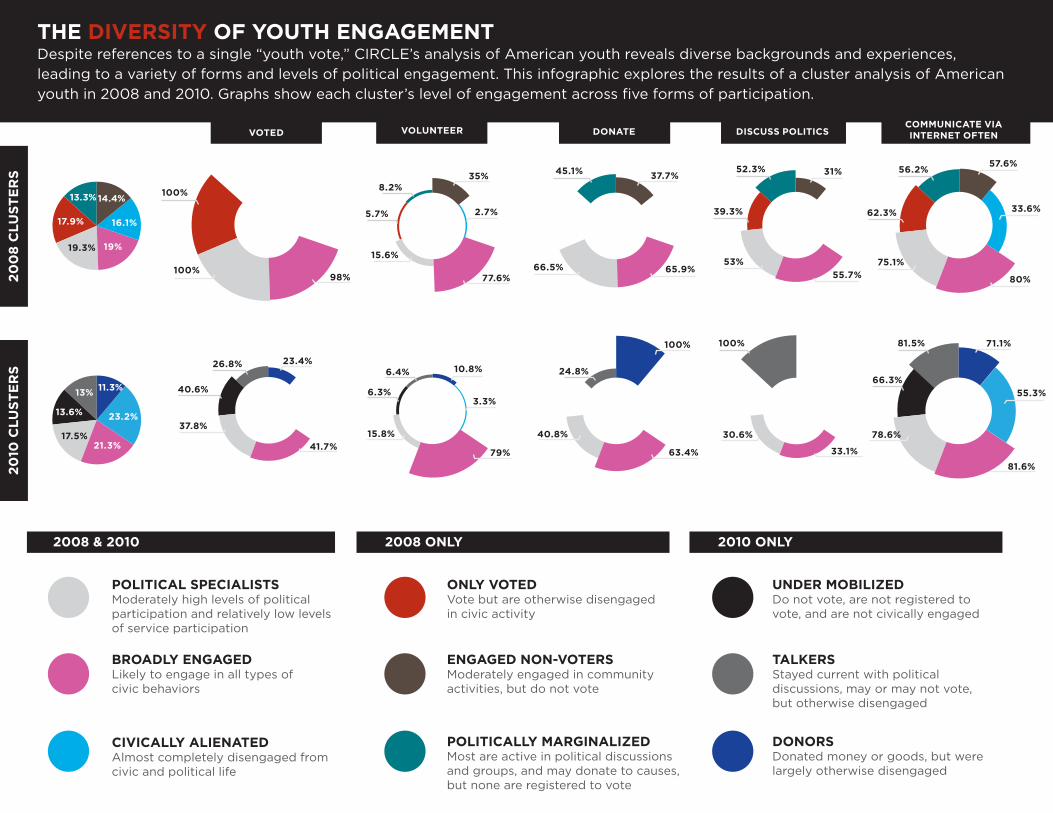
THE DIVERSITY OF YOUTH ENGAGEMENT Despite references to a single “youth vote,” CIRCLE’s analysis of American youth reveals diverse backgrounds and experiences,
leading to a variety of forms and levels of political engagement. This infographic explores the results of a cluster analysis of American
youth in 2008 and 2010. Graphs show each cluster’s level of engagement across five forms of participation.
POLITICAL SPECIALISTSModerately high levels of political participation and relatively low levels of service participation
ONLY VOTEDVote but are otherwise disengaged in civic activity
ENGAGED NON-VOTERSModerately engaged in community activities, but do not vote
POLITICALLY MARGINALIZEDMost are active in political discussions and groups, and may donate to causes, but none are registered to vote
UNDER MOBILIZEDDo not vote, are not registered to vote, and are not civically engaged
TALKERS Stayed current with political discussions, may or may not vote, but otherwise disengaged
DONORSDonated money or goods, but were largely otherwise disengaged
BROADLY ENGAGEDLikely to engage in all types of civic behaviors
CIVICALLY ALIENATEDAlmost completely disengaged from civic and political life
2008 & 2010 2008 ONLY 2010 ONLY
20
10 C
LU
ST
ER
S2
00
8 C
LU
ST
ER
S
VOTED
23.4%
11.3%
14.4%
40.6%
10.8%
100%
3.3%
63.4%79%41.7%
40.8%15.8%37.8%
6.3%
24.8%6.4%26.8%
VOLUNTEER DONATE DISCUSS POLITICSCOMMUNICATE VIA INTERNET OFTEN
2.7%
35% 37.7%
98% 77.6%65.9%100%
15.6%66.5%
100%8.2%
45.1%
5.7%
13%
13.6% 23.2%
16.1%17.9%
13.3%
19%
21.3%17.5%
19.3%
Discuss Politics" and "
56.2%
62.3%
75.1%
33.6%
80%
57.6%
30.6%
100%
33.1%
81.6%
39.3%
53%
52.3% 31%
55.7%
78.6%
66.3%
81.5%
55.3%
71.1%

Understanding a diverse generation Youth Civic Engagement in the United States10
method
We used eleven indicators of civic engagement that were
available in the Current Population Survey in both 2008 and
2010 data to identify clusters of young people who show
similar patterns of engagement. The sample consists of young
adults (18-29) who responded to the CPS survey in that year.1
The eleven indicators were:
CiviC aCtivities• Volunteering for 25 or more hours a year
• Volunteering with youth (coaching, mentoring)
• Donating money/goods worth $25 or more
• Working with neighbors to improve the community
• Being a member of an organization or association
• Serving as an officer or committee member of a group or
association
eleCtoRal aCtivities• Registering to vote
• Voting in the November election
PolitiCal voiCe aCtivities• Attending a public meeting
• Discussing social/political issues with family and friends at
least a few times a week
• Engaging in boycott/buycott and/or contact public officials
about issues in the community2
It is important to note that these are the activities that the
federal government measures through the CPS and do not
capture all possible forms of civic engagement. Other forms of

Understanding a diverse generation Youth Civic Engagement in the United States11
engagement not measured here range from taking paid jobs
that have social benefits to serving as role models for younger
siblings—just to name two examples.
To analyze this survey data we used a cluster analysis, a
statistical technique that divides a whole sample into groups
that have distinct profiles of responses across multiple
indicators. A more sophisticated method than classifying
people into groups by using a rule or criterion, a cluster
analysis uses mathematical techniques to reveal distinctive
profiles based on similar types of behavior. Rarely can each
cluster be defined by a rule, but each one has a distinctive
profile.3 For example, using a criterion-approach, one might
classify young Americans into groups of people who only
vote, who only volunteer, who do both, or who do neither.
In contrast, for example, our Broadly Engaged cluster in
2008 shows relatively high rates of participation across the
board, but members of this cluster do not all perform any
one particular civic or political act. We imposed four-, five-,
six- and seven-cluster models to the CPS data from 2008 and
2010 to find the best combination of theoretical utility, cluster
cohesion/separation and cluster compatibility between the
years. A six-cluster model provided the best overall fit based
on these criteria and is therefore presented in this report.
The clusters are not identical for 2008 and 2010, and the titles
and explanations of the clusters had to vary between the two
years. One reason for the change is a substantial shift in the
prevalence of some behaviors, namely voting, registration
and discussion of political issues. These behaviors were more
common among youth in 2008 than 2010, and the importance
of engaging in these behaviors differed significantly in 2010.
For example, approximately half of young people voted
in 2008 but only a quarter did so in 2010. While this large
difference in youth voter turnout between presidential and
midterm elections is common and expected, voting itself
related to other civic behaviors in different ways in 2008
than it did in 2010. Generally speaking, the clusters that share
the same name in 2008 and 2010 also share a common civic
engagement profile, though they may not be exactly the same.

Understanding a diverse generation Youth Civic Engagement in the United States12
six CLUsters oF yoUng ameriCans | 2008
FigUre 1yoUth engagement CLUsters, 2008
The youth voter turnout of 2008 was one of the highest
in history, and was approximately twice as high as in 2010.
Americans, including youth, were far more likely to discuss
political issues on a regular basis in 2008 than 2010. Some of
these differences are attributable to the fact that 2008 was a
presidential election year while 2010 was a midterm election
year. Notably, high investment in youth voting may have also
boosted young people’s access to opportunities for other
forms of political and community engagement, as seen in more
widespread engagement across clusters.
In 2008, young people (ages 18 to 29) split into six clusters,
each of which had a distinct profile. We labeled the groups,
in order of group size, Political Specialists (19.3%), Broadly
Engaged (19.0%), Only Voted (17.9%), Civically Alienated
(16.1%), Engaged Non-Voters (14.4%), and Politically
Marginalized (13.3%). Each group will be described in more
detail below. The good news is that the analysis shows that a
majority of young people were engaged in some way, albeit at
different levels and in different venues.
political specialists
Political Specialists, who made up 19.3% of the youth
population, were marked by moderately high levels of political
participation, especially voting, and relatively low levels of
service participation. All members of this group voted in the
November 2008 election, and 24.5% reported boycotting/
Politically Marginalized
Only Voted
Political Specialists
Broadly Engaged
Civically Alienated
Engaged Non-voters
19%
14.4%
16.1%17.9%
19.3%
13.3%
Analysis shows that a
majority oF yoUng peopLe were engaged in some way,
albeit at different levels
and in different venues.
seCtion i
19.3%

Understanding a diverse generation Youth Civic Engagement in the United States13
buycotting, and/or contacting public officials about public
issues. They were also likely to donate money (66.5%) and half
(49.5%) were involved in a group or organization. In contrast,
none of these young people reported volunteering regularly,
attending community meetings, working with neighbors or
serving on committees or boards in the community. The young
people in this cluster were highly educated, older (median age
was 25), and likely to come from higher-income households.
In 2008, the CPS asked additional questions related to political
engagement and access to news media that led us to label
the cluster as Political Specialists. Although none of this
group stated that they had attended a community meeting
in September of 2008, 10.5% said they attended a political
meeting by November 2008. Additionally, in this group,
18.3% boycotted or buycotted a product; 4.8% participated
in marches or demonstrations; and 17.9% showed support
for a candidate via donation or campaign volunteering.
Furthermore, they were avid consumers of news: 57.3%
watched TV everyday for news, 33.7% listened to the radio daily
for news, and 41.4% read a newspaper daily. The Table below
shows how clusters of young people varied in the additional
political engagement and news consumption indicators.
tabLe 1
poLitiCaL engagement and news ConsUmption indiCators asked in the Cps in 2008 onLy
six CLUsters oF yoUng ameriCans | 2008
2008Civically alienated
only voted
political specialists
broadly engaged
politically marginal-ized
engaged non-voters
all youth4
Political meeting 0.3% 2.0% 10.5% 24.2% 1.2% 5.5% 8.1%
Contact public official 0 0 10.3% 15.6% 0 7.7% 6.1%
Boycott or buycott 0 0 18.3% 22.0% 0 9.4% 9.2%
March and demonstration .4% 1.1% 4.8% 10.1% 1.1% 1.7% 3.5%
Support campaign/candidate 1.2% 5.6% 17.9% 24.9% 3.0% 7.7% 11.0%
Obtained News Daily from Newspapers 12.6% 29.8% 41.4% 42.2% 28.0% 26.9% 31.2%
Obtained News Daily from TV 40.3% 52.2% 57.3% 52.0% 54.8% 44.9% 50.6%
Obtained News Daily from the Radio 16.8% 28.0% 33.7% 35.1% 29.0% 27.0% 28.8%
Obtained News Daily from News Magazines 1.6% 5.2% 6.7% 6.5% 4.6% 3.6% 4.7%
Obtained News Daily from Blogs 5.0% 11.5% 15.7% 19.7% 12.9% 10.3% 13.0%

Understanding a diverse generation Youth Civic Engagement in the United States14
broadly engaged
Nineteen percent of young people belonged to a group
that we call Broadly Engaged in 2008. These young people
were more likely than average to engage in all types of civic
behaviors and to take on leadership roles in the community.
Unlike other clusters in 2008, this group of young people are
defined primarily by their engagement in service, community-
change and political activities, rather than by their voting and
registration rates. A majority of them (59.4%) were regular
volunteers and many worked with youth in the community
(40.5%). 62.6% were group members and 28.9% of them
served as officers or members of a committee. A substantial
minority of them (39%) worked with neighbors to fix issues in
the community and/or attended public meetings. Consistent
with their general commitment to civic matters, this group also
turned out to vote at a very high rate (98.0%). Three quarters
of them were White and more than 80% either held a college
degree or had completed some college. Slightly over one-third
of young people with a college degree fell into the Broadly
Engaged cluster (Appendix Table 3).
only voted
In 2008, we identified a group we call Only Voted whose
members voted (at a 100% rate) but were otherwise relatively
disengaged. These young people represented nearly one
fifth of all youth (17.9%), making them the third-largest group.
None of them volunteered regularly, worked with neighbors,
donated money, or took on community leadership roles. About
one third of them, however, discussed politics frequently.
Younger Americans who had some college experience but
had yet to complete a degree, and African Americans, were
overrepresented in this cluster. Notably, 30% of African
American youth were classified in the Only Voted cluster. More
than likely, this cluster included a number of young African
Americans who were specifically targeted and mobilized
to vote in the 2008 campaign or perhaps others who were
inspired to vote because of the historic nature of the election.
The youngest group of American adults (ages 18-24) were
more likely to be in the Only Voted category than any other
clusters. This suggests that the 2008 electoral campaigns may
These young people were more LikeLy than average to engage in aLL types oF CiviC behaviors
and to take on leadership
roles in the community.
six CLUsters oF yoUng ameriCans | 2008
19%
17.9%
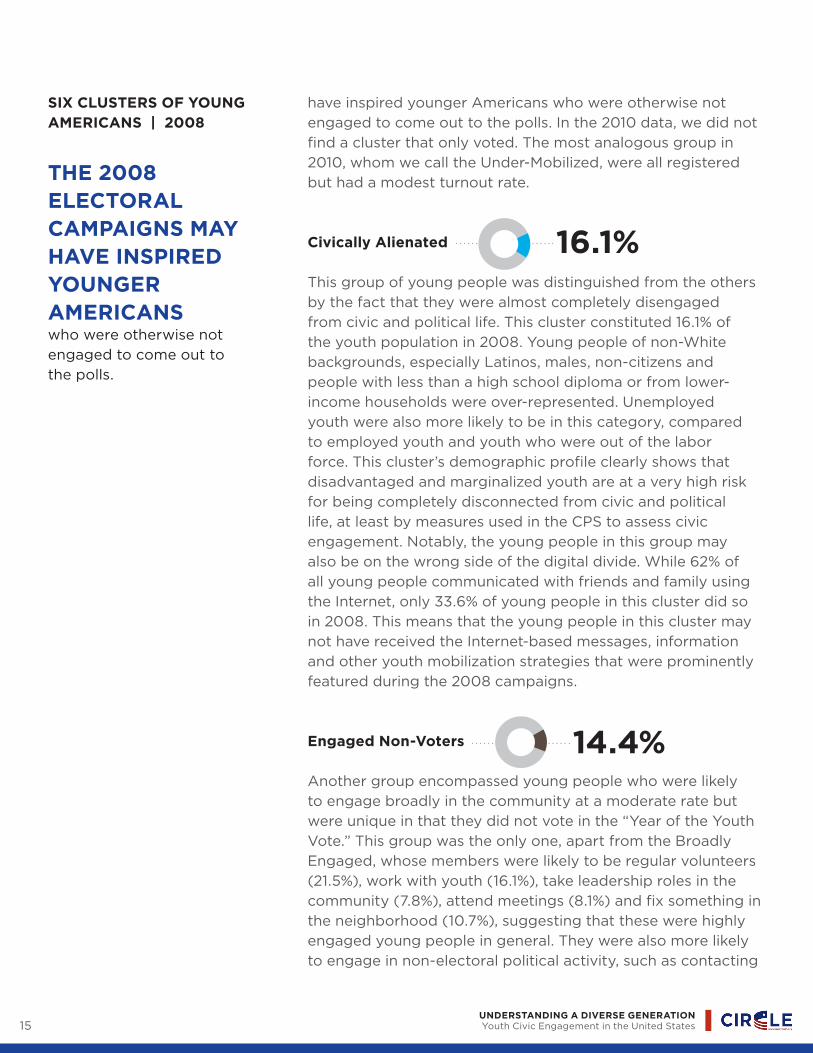
Understanding a diverse generation Youth Civic Engagement in the United States15
have inspired younger Americans who were otherwise not
engaged to come out to the polls. In the 2010 data, we did not
find a cluster that only voted. The most analogous group in
2010, whom we call the Under-Mobilized, were all registered
but had a modest turnout rate.
Civically alienated
This group of young people was distinguished from the others
by the fact that they were almost completely disengaged
from civic and political life. This cluster constituted 16.1% of
the youth population in 2008. Young people of non-White
backgrounds, especially Latinos, males, non-citizens and
people with less than a high school diploma or from lower-
income households were over-represented. Unemployed
youth were also more likely to be in this category, compared
to employed youth and youth who were out of the labor
force. This cluster’s demographic profile clearly shows that
disadvantaged and marginalized youth are at a very high risk
for being completely disconnected from civic and political
life, at least by measures used in the CPS to assess civic
engagement. Notably, the young people in this group may
also be on the wrong side of the digital divide. While 62% of
all young people communicated with friends and family using
the Internet, only 33.6% of young people in this cluster did so
in 2008. This means that the young people in this cluster may
not have received the Internet-based messages, information
and other youth mobilization strategies that were prominently
featured during the 2008 campaigns.
engaged non-voters
Another group encompassed young people who were likely
to engage broadly in the community at a moderate rate but
were unique in that they did not vote in the “Year of the Youth
Vote.” This group was the only one, apart from the Broadly
Engaged, whose members were likely to be regular volunteers
(21.5%), work with youth (16.1%), take leadership roles in the
community (7.8%), attend meetings (8.1%) and fix something in
the neighborhood (10.7%), suggesting that these were highly
engaged young people in general. They were also more likely
to engage in non-electoral political activity, such as contacting
six CLUsters oF yoUng ameriCans | 2008
the 2008 eLeCtoraL Campaigns may have inspired yoUnger ameriCans who were otherwise not
engaged to come out to
the polls.
16.1%
14.4%
Understanding a diverse generation Youth Civic Engagement in the United States16
officials or boycotting products than average. Finally, 61.9% of
them were registered to vote.
This group was likely made up of many subgroups of young
people who did not vote for a variety of reasons. We examined
reasons for not registering and not voting for citizens in this
group to understand them better. First, slightly over one-third
of this group said they did not register because they were
not interested in politics. An additional 21% said they could
not register because they did not meet the deadline. But
relatively few were unable to vote because they did not meet
the residency requirement (5%) or because they were not
citizens (9%). Among those who were registered, a notable
13% said that they did not like any candidate and 13% said they
didn’t think their votes would count. In other words, there was
a notable minority of young Americans who could have voted
but chose not to for an explicit reason. Another third or so had
conflicting schedules, had to work, or were out of town and did
not cast an absentee ballot.
politically marginalized
This group of young people represented 13.3% of young adults.
They were likely to discuss politics regularly (52.3%), somewhat
likely to belong to a group or organization in the community
(31.0%) and to donate money (45.1%), but were unique in
that none of them were registered to vote in spite of their
moderate levels of engagement. Thus, this group seemed to
show interest in current events and community engagement,
yet were almost completely disengaged in political activities,
including voting, boycotting, contacting public officials,
marches/protests, campaign support and political meetings.
This group’s demographic profile suggests that these young
people were some of the poorest, least educated, and most
diverse. Only 11.5% of this group had completed college, and
20.7% did not complete high school. 45.8% of their households
earned less than $35,000 a year and 48.7% of this group
consisted of youth of color, especially Latino youth (27.1%).
Also, 30.5% were non-US citizens. These characteristics were
quite similar to the Civically Alienated group, except that this
group was more likely to be working (6.9% unemployed) and
have children (30.8%) than the Civically Alienated group.
six CLUsters oF yoUng ameriCans | 2008
This may be a group
that...has
greater potentiaL to beCome engaged,
given opportunities,
relevance, and
incentives
13.3%
Understanding a diverse generation Youth Civic Engagement in the United States17
This may be a group that is almost equally disadvantaged
as the Civically Alienated group, yet has a greater potential
to become engaged, given opportunities, relevance, and
incentives. For example, this group of young people were the
most likely to have children. Therefore, at least for some of
them, children’s schools or youth organizations may be able to
reach out and get them involved.
sUmmary oF 2008 CLUstersOur analysis of the 2008 Census data shows that the majority
of young people were civically engaged. However, they were
active at different levels and in different venues.
Roughly one-third of young people fell either into the Broadly
Engaged cluster or the Engaged Non-Voters. These two
groups of young people were similar in that they performed
the majority of civic work (volunteered, worked with youth,
took leadership roles in the community, attended meetings,
etc.); however, they differed in their political behaviors. Nearly
100% of the Broadly Engaged cluster voted, while the Engaged
Non-Voters did not vote. Although we found that some of
these Non-Voters may have made a conscious decision not to
vote in 2008 and others missed deadlines, at least a portion
of the Engaged Non-Voters may benefit from educational
opportunities that teach about the political process and
registration requirements.
Another 30% or so of young people made up the Civically
Alienated and the Politically Marginalized clusters. These
clusters were comprised of young people from disadvantaged
backgrounds. For the most part, the voices of these young
people are being missed in the political process. The Politically
Marginalized cluster shows a greater potential to become
engaged if given relevant opportunities for engagement and
incentives. Avenues for mobilizing the Civically Alienated are
the most crucial given that these young people are completely
disengaged from civic life. One promising way to reach these
young people may be through technology and social media
as rates of Internet usage to stay connected with family and
friends were quite high even among the young people in the
Civically Alienated cluster in 2010.
Finally, four in ten young people fell into two groups (the
Political Specialists and the Only Voted clusters) whose
uniqueness came from their strictly political behaviors.
six CLUsters oF yoUng ameriCans | 2008
the majority oF yoUng peopLe were CiviCaLLy engaged. However, they were
active at different levels
and in different venues.
Understanding a diverse generation Youth Civic Engagement in the United States18
These young people may have benefited from investments in
mobilizing young voters in the 2008 election. It is worth noting
that in the 2010 data, we did not find a cluster that only voted.
The most analogous group in 2010, whom we call the Under-
Mobilized, were all registered but had a modest turnout rate.
This suggests that investment in mobilizing young voters must
be made on a consistent basis if we want to continue to hear
the political voices of our youngest citizens.
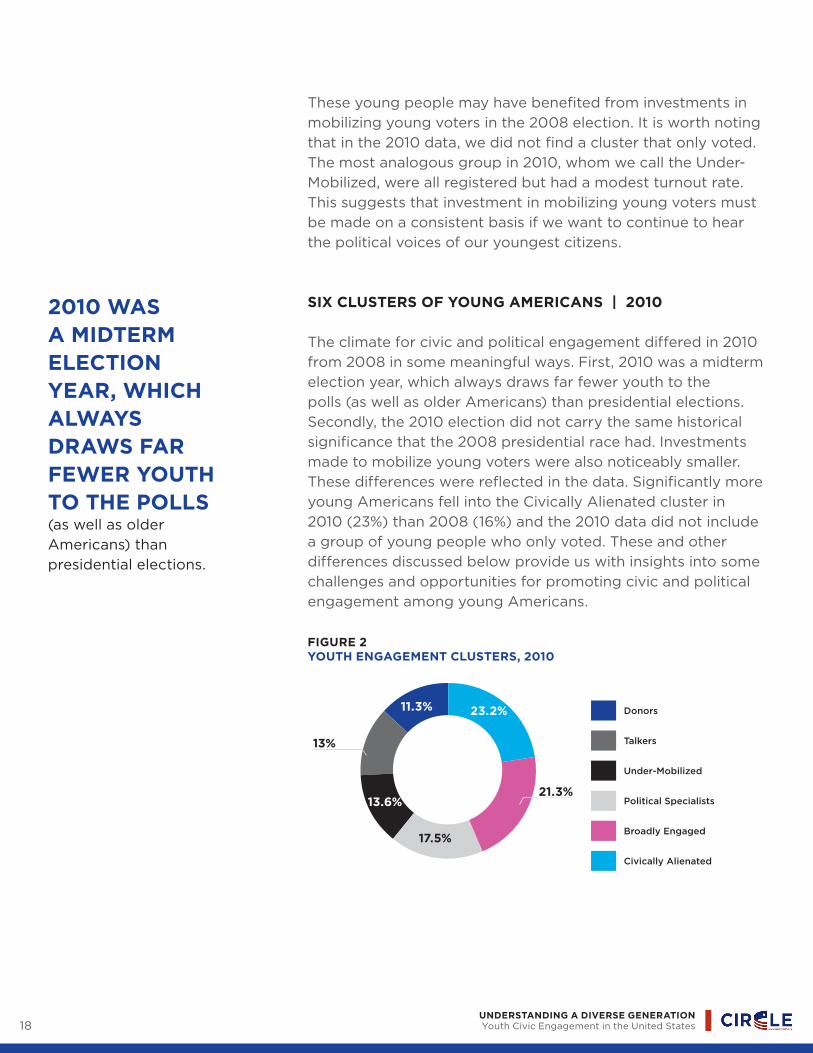
six CLUsters oF yoUng ameriCans | 2010
The climate for civic and political engagement differed in 2010
from 2008 in some meaningful ways. First, 2010 was a midterm
election year, which always draws far fewer youth to the
polls (as well as older Americans) than presidential elections.
Secondly, the 2010 election did not carry the same historical
significance that the 2008 presidential race had. Investments
made to mobilize young voters were also noticeably smaller.
These differences were reflected in the data. Significantly more
young Americans fell into the Civically Alienated cluster in
2010 (23%) than 2008 (16%) and the 2010 data did not include
a group of young people who only voted. These and other
differences discussed below provide us with insights into some
challenges and opportunities for promoting civic and political
engagement among young Americans.
FigUre 2yoUth engagement CLUsters, 2010
2010 was a midterm eLeCtion year, whiCh aLways draws Far Fewer yoUth to the poLLs
(as well as older
Americans) than
presidential elections.
Donors
Talkers
Under-Mobilized
Political Specialists
Broadly Engaged
Civically Alienated
17.5%
23.2%
21.3%
13%
13.6%
11.3%

Understanding a diverse generation Youth Civic Engagement in the United States19
Civically alienated
The largest group of young people in 2010 were those
who were Civically Alienated, or completely disengaged
using indicators measured in the CPS. These young people
represented one quarter of the population. They did not vote
in 2010, were not registered to vote, and did not volunteer
regularly. Moreover, they did not work to improve the
community, discuss politics, nor did they engage in other
political activities. Latino, non-college-educated and low-
income youth were overrepresented in this cluster. They also
tended to be younger than other groups (median age was
23). The youth in this group were relatively unlikely to use the
Internet to communicate with friends and family, compared to
members of other clusters, although 55% still did so. Overall,
the Civically Alienated cluster overwhelmingly represented
marginalized youth, many of whom likely did not have equal
access to opportunities to learn skills for civic engagement
and did not encounter many opportunities to engage civically
and politically as young adults. Latino and non-US citizen
youth were particularly notable in this group: 38.6% of young
Latinos and 52.9% of non-US citizen youth were in the Civically
Alienated cluster.
It is a concern that less educated, poor, Latino, and non-US
citizen youth are grossly overrepresented in this category
because it suggests that our communities, schools and
government may not be providing these young people
with varied and relevant opportunities for civic learning
and engagement. On the other hand, over half of them
communicated with family and friends via the Internet. The
Internet and electronic technologies might be one of the
avenues by which we may reach these young people.
In comparing this cluster in 2008 with the equivalent cluster
in 2010, two findings stand out. First, the Civically Alienated
cluster is notably larger in 2010, meaning that more young
people were completely disengaged, not even registered to
vote. Secondly, members of the Civically Alienated cluster
were less connected via the Internet with family and friends in
2008 than in 2010. These two findings reflect both a challenge
and opportunity. First, it appears that enthusiasm among
youth and investment in youth political engagement in 2008
Without sustained effort
to provide young people
with accessible and
relevant opportunities,
it may be diFFiCULt to maintain high LeveLs oF engagement among yoUth.
six CLUsters oF yoUng ameriCans | 2010
23.2%
Understanding a diverse generation Youth Civic Engagement in the United States20
was not sustained to 2010, resulting in fewer opportunities to
engage. Without sustained effort to provide young people
with accessible and relevant opportunities, it may be difficult
to maintain high levels of engagement among youth. At the
same time, young people, including Civically Alienated youth,
are now connected via the Internet with their peers and family
at higher rates than in 2008. This provides a new opening for
young people to connect with civic opportunities through
social networks and other Internet resources.
broadly engaged
The second largest group in 2010, which we termed Broadly
Engaged, represented the 21.3% who were likely to be the
young leaders in their communities. The group was defined
by their engagement in a broad range of civic activities. They
were the only young people who worked with neighbors,
attended community meetings, took leadership roles in
community organizations, and volunteered on a regular basis.
Put differently, one-fifth of the youth population undertook
a vast majority of community and volunteering work for the
entire youth population. White, college-educated, high-income
youth were overrepresented in this cluster. Almost three
quarters of young people in this group attended college and
more than 30% had completed a four-year degree. Women
were also overrepresented in this group.
political specialists
The third largest cluster represented Political Specialists
(17.5%). They were most likely to engage in non-electoral
political acts such as boycotting a product or contacting
public officials about issues in the community (34.0%) and to
belong to a group or association (80.6%). Sixty-five percent
of them were registered to vote and 37.8% voted. By contrast,
young people in this cluster did not volunteer or work with
neighbors on issues in the community (0% on both measures).
Like members of the Broadly Engaged group, young people
in the Political Specialists cluster were highly educated and
had relatively high household incomes, and White youth were
overrepresented. In contrast to the Broadly Engaged group,
this cluster included a disproportionate number of males.
six CLUsters oF yoUng ameriCans | 2010
21.3%
17.5%
“Broadly Engaged”
represented the 21% who were
LikeLy to be the yoUng Leaders in their CommUnities.

Understanding a diverse generation Youth Civic Engagement in the United States21
Though the Political Specialists clusters in 2008 and 2010
were similar enough to bear the same label, they differ slightly.
In both years, they specialized in political behaviors and
showed little to no engagement in other domains. The Political
Specialists of 2010 were more likely to engage in political
activities than their Broadly Engaged peers, while in 2008,
the Political Specialists engaged almost exclusively in political
activities but at a lower rate than the Broadly Engaged cluster.
This finding may suggest that the young people who fell
into the Political Specialists cluster may have been mobilized
specifically for the presidential campaigns that targeted young
people who would not otherwise engage in political activism,
particularly by leveraging social media. On the other hand, the
2010 Political Specialists cluster comprised a group of young
people who engage in political activities more regularly, and
independent of presidential campaigns.
Under-mobilized
The fourth group (13.6%) included young people who were
registered but relatively unmobilized to vote. This group was
also unlikely to engage in any other way, including discussing
politics with others. Within this group, 40.6% turned out to
vote in 2010. Though they turned out at a higher rate than
average, almost 60% of the registered voters in this group
did not vote. We term this group Under-Mobilized, given their
moderate turnout in comparison to their 100% registration
rate. This group of young people might comprise voters who
registered during the 2008 campaign and remained relatively
unmobilized during the 2010 elections. The most notable
feature of this group’s demographic profile is that African-
American youth were overrepresented in this group. 20.8% of
all young people who fall into this category identified as African
American (compared to about 10% in the overall sample).
We do not have definitive information about which of the
youth in the Under-Mobilized cluster were new registrants
during the 2008 election cycle. However, a cohort of people
who were 19-21 years old in 2008 and 21-23 in 2010 were the
most likely to be in the under-mobilized category in the latter
year.5 Thus, it is possible that the potential voters who were
registered and perhaps voted in 2008 did not return to vote in
2010, and otherwise remained disengaged.
six CLUsters oF yoUng ameriCans | 2010
13.6%
Potential voters who
were registered and
perhaps voted in 2008
did not retUrn to vote in 2010.
Understanding a diverse generation Youth Civic Engagement in the United States22
talkers
The fifth group included young people (13.0%) who stayed
current by discussing political issues with others but were
otherwise disengaged. A little over half of them were
registered to vote and slightly over one quarter (26.8%) turned
out to vote. We label this cluster the Talkers. Its membership
was not very different demographically from the 18-to
29-year-old cohort as a whole. However, they were more
likely to be male, slightly younger, and less likely to have their
own children. They were also very likely (81.5%) to be highly
connected to family and friends via the Internet. This cluster
might represent a group of young people who are interested
in political issues but have not had a chance to participate or
simply have not been asked to participate. Because this group
is well-connected to family and friends through social media
and the Internet, the young people in this cluster may have a
potential to be mobilized using newer Internet technologies.
donors
Finally, a small group of youth (11.3%) donated money or goods
to a cause or organization but were not likely to engage in
other ways. This group, the Donors, was similar to the Talkers
cluster in that they were very likely to engage in one way
but were not highly engaged in other ways. Like the young
people in the Talkers cluster, about half of this group were
registered to vote, and about a quarter turned out to vote.
This cluster represented older youth (median age was 25)
and accordingly, the young people in this group were more
likely to have children, to be married and working. This group
likely represented young families who had completed their
education and entered the work force. Many young adults in
this cluster may have lacked the time for other types of civic
engagement, yet they showed a willingness to help others
through donation of goods and money.
six CLUsters oF yoUng ameriCans | 2010
13%
Because this group is
well-connected to family
and friends through
social media and the
Internet, the young
people in this cluster
may have a potential to
be mobiLized Using newer internet teChnoLogies.
11.3%
Understanding a diverse generation Youth Civic Engagement in the United States23
how yoUng peopLe perForm on speCiFiC CiviC indiCators
Civic clusters provide just one way to describe how young
people are engaged in their communities. In the following
sections, we adopt a different approach, describing the
proportion and demographics of young people who engage
in specific civic behaviors, from volunteering to protesting.
Whenever possible, we describe changes over time.
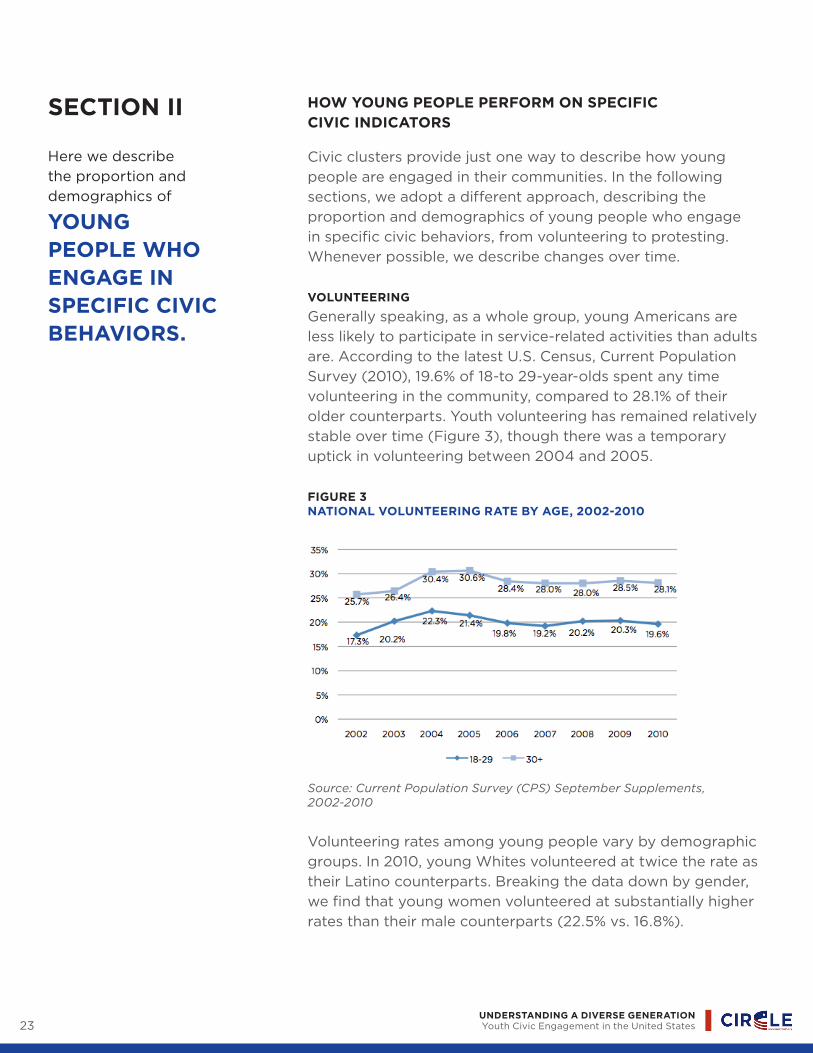
voLUnteering
Generally speaking, as a whole group, young Americans are
less likely to participate in service-related activities than adults
are. According to the latest U.S. Census, Current Population
Survey (2010), 19.6% of 18-to 29-year-olds spent any time
volunteering in the community, compared to 28.1% of their
older counterparts. Youth volunteering has remained relatively
stable over time (Figure 3), though there was a temporary
uptick in volunteering between 2004 and 2005.
FigUre 3nationaL voLUnteering rate by age, 2002-2010
Source: Current Population Survey (CPS) September Supplements, 2002-2010
Volunteering rates among young people vary by demographic
groups. In 2010, young Whites volunteered at twice the rate as
their Latino counterparts. Breaking the data down by gender,
we find that young women volunteered at substantially higher
rates than their male counterparts (22.5% vs. 16.8%).
seCtion ii
Here we describe
the proportion and
demographics of
yoUng peopLe who engage in speCiFiC CiviC behaviors.

Understanding a diverse generation Youth Civic Engagement in the United States24
FigUre 4
voLUnteering rates among yoUng peopLe by
raCe/ethniCity (2010)
Source: Current Population Survey (CPS) September Supplements, 2010
Young people with higher levels of formal education
volunteered at higher rates than those with less education.
Young people with a bachelors degree or higher were three
times more likely to volunteer than their counterparts who
have achieved less than a high school diploma.
FigUre 5
voLUnteering rates among yoUng peopLe by edUCationaL
attainment (2010)
Source: Current Population Survey (CPS) September Supplement, 2010
Understanding a diverse generation Youth Civic Engagement in the United States25
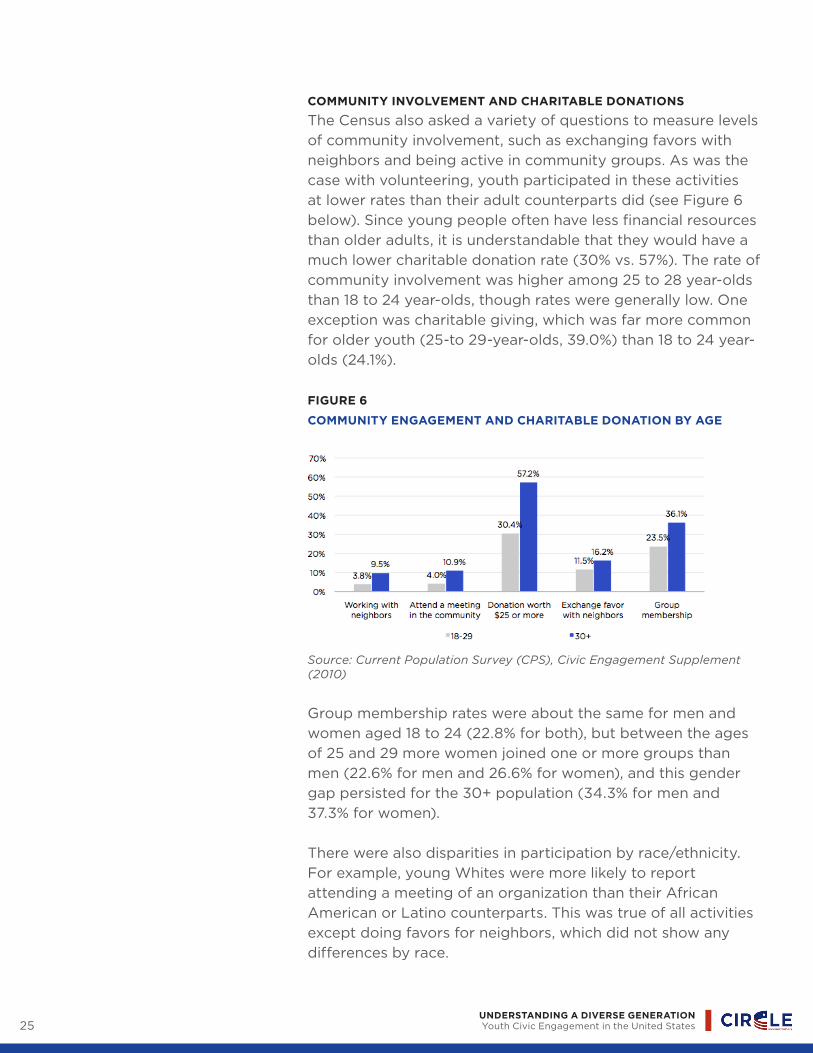
CommUnity invoLvement and CharitabLe donations
The Census also asked a variety of questions to measure levels
of community involvement, such as exchanging favors with
neighbors and being active in community groups. As was the
case with volunteering, youth participated in these activities
at lower rates than their adult counterparts did (see Figure 6
below). Since young people often have less financial resources
than older adults, it is understandable that they would have a
much lower charitable donation rate (30% vs. 57%). The rate of
community involvement was higher among 25 to 28 year-olds
than 18 to 24 year-olds, though rates were generally low. One
exception was charitable giving, which was far more common
for older youth (25-to 29-year-olds, 39.0%) than 18 to 24 year-
olds (24.1%).
FigUre 6
CommUnity engagement and CharitabLe donation by age
Source: Current Population Survey (CPS), Civic Engagement Supplement (2010)
Group membership rates were about the same for men and
women aged 18 to 24 (22.8% for both), but between the ages
of 25 and 29 more women joined one or more groups than
men (22.6% for men and 26.6% for women), and this gender
gap persisted for the 30+ population (34.3% for men and
37.3% for women).
There were also disparities in participation by race/ethnicity.
For example, young Whites were more likely to report
attending a meeting of an organization than their African
American or Latino counterparts. This was true of all activities
except doing favors for neighbors, which did not show any
differences by race.

Understanding a diverse generation Youth Civic Engagement in the United States26
FigUre 7
CiviC aCtivities by raCe/ethniCity, age 18 to 29
Source: Current Population Survey (CPS), Civic Engagement Supplement 2010
voting: presidentiaL eLeCtions
The voter turnout rate among young people in 2008 was
one of the highest recorded.6 The increase suggests that the
confluence of extensive voter outreach efforts, a close election,
and high levels of interest in the 2008 campaign all worked
to drive voter turnout among young people to levels not seen
since 1992. The increase is a continuation of the trend observed
in the 2004 and 2006 elections.7 Young voters participate at
significantly lower rates than older adults, but both registration
and turnout rose significantly between age 18 and age 29. For
example in 2008, turnout among 18 to 24 year-old citizens
was 48.5%, while the turnout among 25 to 29 year-old citizens
was 54.7%. Although young people increased their turnout
significantly between 2000 and 2008, older adults voted at
lower rates in 2008 than in 2004 and only slightly above their
2000 level.
FigUre 8
voter tUrnoUt by age in presidentiaL eLeCtions, 1972-2008
Source: Current Population Survey (CPS), November Supplements, 1972-2008 2010
the voter tUrnoUt rate among yoUng peopLe in 2008 was one oF the highest reCorded. The increase suggests
that the confluence of
extensive voter outreach
efforts, a close election,
and high levels of interest
in the 2008 campaign
all worked to drive voter
turnout among young
people to levels not seen
since 1992.

Understanding a diverse generation Youth Civic Engagement in the United States27
Although overall youth turnout was high in the 2008
presidential election, there were important differences in
turnout rates. Young African Americans posted the highest
turnout rate ever observed for any racial or ethnic group
of young Americans since the voting age was lowered to
18 in 1972. The gap in turnout by educational attainment
remained large; voter turnout of young people without college
experience was 36%, compared to a 62% rate among young
people with college experience. (About half of the young adult
population has some college experience.) There was also a
significant gender gap in turnout: young women voted at a
rate eight points above young men.
Our 2008 cluster analysis identified three groups of young
Americans in which almost everyone voted, and three other
clusters in which almost no one voted (see Appendix Table
2). Of particular interest is the Only Voted group, in which
African American youth were overrepresented. This was also
was the least affluent, least educated and youngest of the
three clusters of voters. Given that civic engagement is usually
highly correlated with education, income, and racial/ethnic
background, it is important to note that the 2008 election
inspired the types of young Americans who would have
otherwise been disengaged entirely.
voting: midterm eLeCtions
Voter turnout among young American citizens age 18 to 29
in the 2010 midterm election was 24.0%.8 Voter turnout in
midterm elections is typically half of what it is in presidential
elections. While youth turnout declined slightly (down one and
a half points) between 2006 and 2010, it remained similar to
past midterm elections and tracks a similar decline in adult
turnout.9 In general, turnout rates in midterm elections are
relatively stable. Historically, turnout estimates among 18 to
29 year-olds range between 20 and 30 percent, and turnout
among those 30 and older ranges between 50 and 60 percent
of the eligible population (see Figure 9).
In 2010, unlike in 2008, we did not identify an Only Voted
cluster that was otherwise disengaged. Instead, in 2010, the
young people who voted also tended to be civically engaged
in other ways.
yoUng aFriCan ameriCans posted the highest tUrnoUt rate ever observed
for any racial or ethnic
group of young Americans
since the voting age was
lowered to 18 in 1972.

Understanding a diverse generation Youth Civic Engagement in the United States28
FigUre 9
voter tUrnoUt by age in midterm eLeCtions, 1974-2010
Source: Current Population Survey (CPS), November Supplements, 1974-2010
voter registration
In 2000, voter registration among young people reached its
lowest level (55%) for a presidential year—the rate is often
lower in midterm years. Since then, young voters’ registration
has been higher, and the rate stayed about the same in 2004
and 2008. 61% of young people age 18 to 29 registered to vote
in the 2008 presidential election. Registration is important
because registering to vote is sometimes more difficult than
the act of voting itself.
FigUre 10
voter registration oF yoUng peopLe in presidentiaL
eLeCtions, 1972-2008
Source: Author’s tabulations from the Current Population Survey, November (Voting) Supplement, 1972-2008. *1972-1976 registration rates are computed for residents.
Registration is
important because
registering to vote is sometimes more diFFiCULt than the aCt oF voting itseLF.

29
FigUre 11
voter registration oF yoUng peopLe in midterm eLeCtions,
1974-2010
Source: Author’s tabulations from the Current Population Survey, November (Voting) Supplement, 1974-2010. *1974 registration rates are computed for residents.
poLitiCaL voiCe aCtivities
Another group of civic engagement activities involves political
voice: actions people take to express their political or social
viewpoints. In 2008, the Census measured the following
political voice activities: contacting an official, attending
a meeting with a political topic, boycotting/buycotting,
protesting/marching or demonstrating, and showing
support for a candidate by making a donation or working
on a campaign. In 2010, the Census only measured rates of
contacting an official and boycotting/buycotting. The results
are in the table below.
Youth lagged behind older adults when it came to actually
participating in political activities such as contacting public
officials, making contributions for a political cause, or making a
purchasing decision based on their own principles (boycotting
or buycotting). However, youth were slightly more likely to
participate in a march or demonstration than older adults were.
tabLe 2
poLitiCaL voiCe aCtivities, by age
Source: Author’s tabulations from the Current Population Survey, November (Voting) Supplement, 1974-2010. *1974 registration rates are computed for residents.
yoUth were sLightLy more LikeLy to partiCipate in a marCh or demonstration than
were older adults.
2008 2008 2010 2010
18-29 30+ 18-29 30+
Contact official 5.0% 11.9% 4.0% 11.6%
Attend meeting with a political topic* 7.4% 11.1% N/A N/A
Boycott or buycott 7.9% 11.5% 7.2% 10.9%
Protest, march or demonstrationa 3.7% 2.9% N/A N/A
Showed support for a candidate by mak-ing donation or working on a campaign*
11.2% 15.9% N/A N/A

Understanding a diverse generation Youth Civic Engagement in the United States30
impLiCations
Our analysis of the Census data on civic engagement
shows that young people have indeed engaged in their
communities in diverse and often specialized roles. Only a
fairly small minority (16.1% in 2008; 23.2% in 2010) have been
fundamentally disengaged on the indicators used here. Most
of their peers have contributed to American civic life in at
least one way. Some have voted, donated to charity, engaged
in frequent discussions about politics and current issues, or
engaged in multiple activities. This is an indication that there
are many ways in which youth can participate, and for the
most part, they do.
On the other hand, the Civically Alienated cluster requires
attention. In both years, it comprised disproportionate
numbers of young people who had not completed high school
or gone to college, who earned low incomes, and who may not
have had the same opportunities for civic skills acquisition and
participation as their contemporaries. Providing young people
of all backgrounds with more comprehensive civic learning and
participation opportunities continues to be a serious need.
Most of the civic activities that take time, commitment and
advanced skills were undertaken primarily by young people in
two clusters: the Broadly Engaged and the Political Specialists.
Broadly Engaged youth took on the bulk of sustained service
and community problem-solving activities accomplished by
youth, and also contributed much to political participation,
while Political Specialists were responsible for much of the
political activism. These two clusters made up approximately
one-third of the youth population.
On one hand, literally millions of young people belong to these
clusters, and we only need so many leaders. On the other,
our democracy calls for active participation by young people
who represent the diverse interests of America’s multi-cultural
youth population. The two most engaged clusters included
largely highly educated, predominantly White youth who came
from households that earn higher incomes.
Research summarized recently in Guardian of Democracy: The Civic Mission of Schools shows that opportunities to develop
civic skills, knowledge, and interests are unequally distributed,
yoUng peopLe have indeed engaged in their CommUnities in diverse and often
specialized roles.

Understanding a diverse generation Youth Civic Engagement in the United States31
being much more common for students of privileged
backgrounds and for students who are on successful
academic tracks than for their peers.10 Yet civic education in
schools and community settings can have disproportionately
positive effects on disadvantaged students. Only about half
of our young people go on to higher education, and for their
young adult peers who are outside of educational institutions,
the opportunities for civic learning are particularly scarce.
Gaps in civic opportunities for youth and young adults must
be addressed.11
For leaders, organizations, and youth who hope to boost youth
civic engagement, our analysis suggests some opportunities.
The Talkers cluster has not participated in civic life, but they
show interest in issues. They are also heavy users of the
Internet to connect to their own friends and families. Other
research finds that people who are asked to participate are
often willing to do so. Asking members of this group to vote,
volunteer, and join organizations seems especially promising,
since they have demonstrated concern about issues and are
connected to other people whom they might recruit.
The Only Voted cluster from 2008 and the Under-Mobilized
cluster in 2010 represent another opportunity. The Only
Voted cluster showed they would participate if an election
or a particular campaign moved them. On the other
hand, the existence of an Under-Mobilized cluster in 2010
showed that young people may not participate unless they
are directly asked to participate. In 2012, candidates and
political campaigns should reach out to them again. Their
demonstrated concern for public issues in 2008 also suggests
that they may be ready to be recruited into non-political forms
of civic participation.
the two most engaged CLUsters are highly educated,
predominantly White
youth who came from
households that earn
higher incomes

Understanding a diverse generation Youth Civic Engagement in the United States32
appendix
appendix tabLe 1
CiviC engagement indiCators inCLUded in the modeL and data soUrCe
indicator source response options
Volunteering for 25 or more hours a year Volunteering Yes/No
Volunteering with youth (coaching, mentoring) Volunteering Yes/No
Donating money/goods worth $25 or more Volunteering Yes/No
Working with neighbors to improve the community
Volunteering Yes/No
Attending a public meetingVolunteering Yes/No
Member of an organization or associationCivic Engagement Yes/No
Serving as an officer or committee member of a group or association
Civic Engagement Yes/No
Registered to vote Voting & Registration Yes/No
Voted in the November Election Voting & Registration Yes/No
Discussing social/political issues with family and friends at least a few times a week
Civic Engagement Yes/No
Engaging in boycott/buycott and/or contact public officials about issues in the community
Civic Engagement Yes/No

Understanding a diverse generation Youth Civic Engagement in the United States33
appendix tabLe 2
2008 CLUsters engagement by indiCators
Civically alienated (16.1%)
only voted (17.9%)
political specialists (19.3%)
broadly engaged (19.0%)
politically margin-alized (13.3%)
engaged non-voters (14.4%)
all youth13
Volunteering (any) 2.7% 5.7% 15.6% 77.6% 8.2% 35.0% 25.4%
Regular volunteering 0% 0% 0% 59.4% 0% 21.5% 14.4%
Volunteer with youth 0% 0% 0% 40.5% 0% 16.1% 10.0%
Attend public meetings 0% 0% 0% 26.7% 0% 8.1% 6.3%
Worked with neighbors 0% 0% 0% 24.7% 0% 10.7% 6.2%
Donation 0% 0% 66.5% 65.9% 45.1% 37.7% 36.8%
Discuss politics 0% 39.3% 53.0% 55.7% 52.3% 31.0% 39.3%
Registration 2008 0% 100% 100% 99.9% 0% 61.9% 65.1%
Voting 2008 0% 100% 100% 98.0% 0% 0% 55.8%
Contacted Officials 0% 0% 10.2% 15.3% 0% 7.5% 6.0%
Boycott/Buycott 0% 0% 18.3% 21.6% 0% 9.2% 9.0%
Group membership 0% 0% 49.5% 62.6% 31.0% 29.6% 29.9%
Officer or committee member
0% 0% 0% 28.9% 0% 7.8% 6.6%
Communicate via Internet often
33.6% 62.3% 75.1% 80.0% 56.2% 57.6% 62.0%

34
appendix tabLe 3
CLUster break-down by demographiC groUps (2008)
2008political specialists
broadly engaged
only votedCivically alienated
engaged non-voters
politically marginal-ized
total
All youth 19.3% 19.0% 17.9% 16.1% 14.4% 13.3% 100%
Male 18.3% 16.3% 18.4% 18.2% 14.4% 14.5% 100%
Female 20.3% 21.5% 17.3% 14.2% 14.4% 12.2% 100%
Age 18-24 16.5% 16.7% 20.9% 17.6% 14.8% 13.4% 100%
Age 25-29 22.5% 21.5% 14.5% 14.4% 14.0% 13.1% 100%
Household income less than $35k
14.1% 15.5% 17.7% 21.5% 16.3% 14.9% 100%
Household income $75K or more
28.7% 25.8% 15.1% 8.9% 12.9% 8.5% 100%
City 19.4% 20.6% 16.4% 16.6% 12.1% 14.9% 100%
Suburban 22.3% 15.2% 18.7% 15.2% 15.3% 13.4% 100%
Rural 16.6% 19.6% 16.6% 18.0% 16.6% 12.7% 100%
Less than HS 6.4% 5.6% 13.4% 36.8% 15.8% 22.0% 100%
HS diploma 14.6% 10.3% 20.3% 21.6% 16.6% 16.7% 100%
Some College 21.4% 20.4% 21.2% 10.7% 14.8% 11.4% 100%
College degree 29.2% 35.3% 11.8% 6.4% 10.1% 7.1% 100%
No College 12.2% 8.9% 18.2% 26.0% 16.4% 18.2% 100%
At least some college 24.4% 26.2% 17.6% 9.1% 13.0% 9.8% 100%
Single, never married 17.8% 17.7% 20.4% 17.1% 13.9% 13.1% 100%
Married 22.9% 22.9% 11.5% 13.6% 15.5% 13.5% 100%
No child 19.6% 19.7% 18.9% 15.8% 13.6% 12.4% 100%
Has children 18.7% 17.0% 15.0% 16.9% 16.6% 15.7% 100%
Employed 21.6% 20.9% 17.5% 13.7% 13.8% 12.5% 100%
Unemployed 15.0% 13.0% 18.6% 23.3% 16.5% 13.6% 100%
White, Non-Hispanic 21.8% 22.6% 18.2% 12.2% 15.0% 10.2% 100%
African-American, Non-Hispanic
19.9% 17.5% 29.7% 12.4% 10.0% 10.5% 100%
Asian, Non-Hispanic13 7.8% 8.7% 6.4% 34.7% 13.2% 29.2% 100%
Latino, any race 13.4% 7.5% 13.0% 29.9% 13.4% 22.6% 100%
Non-US citizen 47.5% 12.6% 39.9% 100%
US citizen 21.4% 21.0% 19.8% 12.7% 14.6% 10.5% 100%
Median age 25 24 23 23 23 24 24
*how to use this table: This table shows how each subgroup of young people with a shared demographic characteristic (e.g., male) broke down into each civic engagement cluster. The top row contains percentage break-downs for the whole youth population. In order to find out whether a specific demographic group was over- or under-represented in a cluster, a reader should compare the “all youth” percentage to the percentage that applies to a specific group. For example, 16.1% of all youth were in the Civically Alienated cluster, while 36.8% of young people with less than high school education were in that group. This comparison leads a conclusion that young people with less than a HS degree were overrepresented in the Civically Alienated category.
Understanding a diverse generation Youth Civic Engagement in the United States35
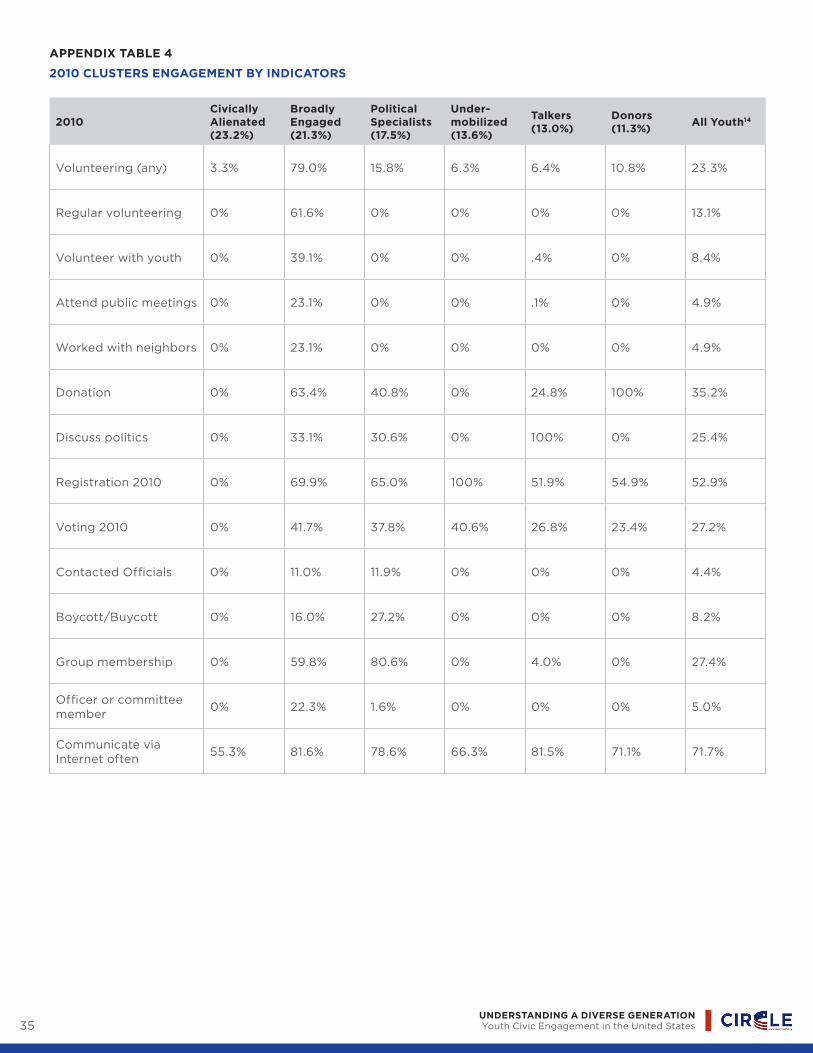
appendix tabLe 4
2010 CLUsters engagement by indiCators
2010Civically alienated (23.2%)
broadly engaged (21.3%)
political specialists (17.5%)
Under-mobilized (13.6%)
talkers (13.0%)
donors (11.3%)
all youth14
Volunteering (any) 3.3% 79.0% 15.8% 6.3% 6.4% 10.8% 23.3%
Regular volunteering 0% 61.6% 0% 0% 0% 0% 13.1%
Volunteer with youth 0% 39.1% 0% 0% .4% 0% 8.4%
Attend public meetings 0% 23.1% 0% 0% .1% 0% 4.9%
Worked with neighbors 0% 23.1% 0% 0% 0% 0% 4.9%
Donation 0% 63.4% 40.8% 0% 24.8% 100% 35.2%
Discuss politics 0% 33.1% 30.6% 0% 100% 0% 25.4%
Registration 2010 0% 69.9% 65.0% 100% 51.9% 54.9% 52.9%
Voting 2010 0% 41.7% 37.8% 40.6% 26.8% 23.4% 27.2%
Contacted Officials 0% 11.0% 11.9% 0% 0% 0% 4.4%
Boycott/Buycott 0% 16.0% 27.2% 0% 0% 0% 8.2%
Group membership 0% 59.8% 80.6% 0% 4.0% 0% 27.4%
Officer or committee member
0% 22.3% 1.6% 0% 0% 0% 5.0%
Communicate via Internet often
55.3% 81.6% 78.6% 66.3% 81.5% 71.1% 71.7%
36
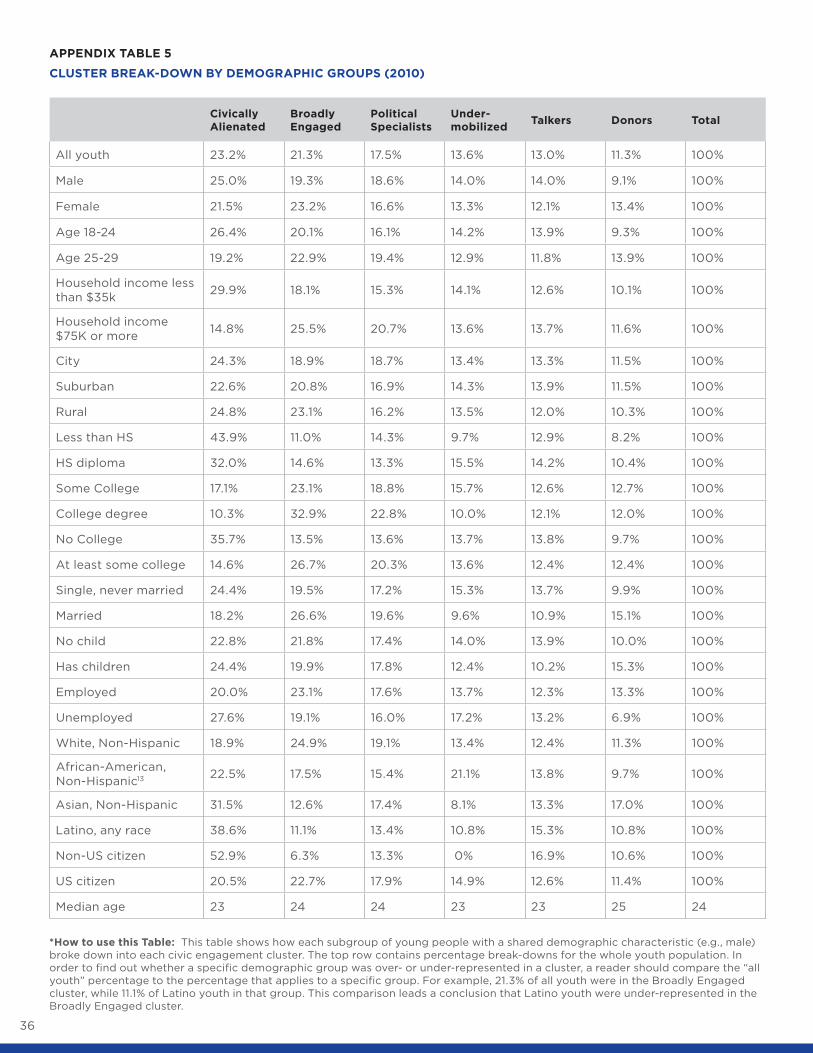
appendix tabLe 5
CLUster break-down by demographiC groUps (2010)
Civically alienated
broadly engaged
political specialists
Under- mobilized
talkers donors total
All youth 23.2% 21.3% 17.5% 13.6% 13.0% 11.3% 100%
Male 25.0% 19.3% 18.6% 14.0% 14.0% 9.1% 100%
Female 21.5% 23.2% 16.6% 13.3% 12.1% 13.4% 100%
Age 18-24 26.4% 20.1% 16.1% 14.2% 13.9% 9.3% 100%
Age 25-29 19.2% 22.9% 19.4% 12.9% 11.8% 13.9% 100%
Household income less than $35k
29.9% 18.1% 15.3% 14.1% 12.6% 10.1% 100%
Household income $75K or more
14.8% 25.5% 20.7% 13.6% 13.7% 11.6% 100%
City 24.3% 18.9% 18.7% 13.4% 13.3% 11.5% 100%
Suburban 22.6% 20.8% 16.9% 14.3% 13.9% 11.5% 100%
Rural 24.8% 23.1% 16.2% 13.5% 12.0% 10.3% 100%
Less than HS 43.9% 11.0% 14.3% 9.7% 12.9% 8.2% 100%
HS diploma 32.0% 14.6% 13.3% 15.5% 14.2% 10.4% 100%
Some College 17.1% 23.1% 18.8% 15.7% 12.6% 12.7% 100%
College degree 10.3% 32.9% 22.8% 10.0% 12.1% 12.0% 100%
No College 35.7% 13.5% 13.6% 13.7% 13.8% 9.7% 100%
At least some college 14.6% 26.7% 20.3% 13.6% 12.4% 12.4% 100%
Single, never married 24.4% 19.5% 17.2% 15.3% 13.7% 9.9% 100%
Married 18.2% 26.6% 19.6% 9.6% 10.9% 15.1% 100%
No child 22.8% 21.8% 17.4% 14.0% 13.9% 10.0% 100%
Has children 24.4% 19.9% 17.8% 12.4% 10.2% 15.3% 100%
Employed 20.0% 23.1% 17.6% 13.7% 12.3% 13.3% 100%
Unemployed 27.6% 19.1% 16.0% 17.2% 13.2% 6.9% 100%
White, Non-Hispanic 18.9% 24.9% 19.1% 13.4% 12.4% 11.3% 100%
African-American, Non-Hispanic13 22.5% 17.5% 15.4% 21.1% 13.8% 9.7% 100%
Asian, Non-Hispanic 31.5% 12.6% 17.4% 8.1% 13.3% 17.0% 100%
Latino, any race 38.6% 11.1% 13.4% 10.8% 15.3% 10.8% 100%
Non-US citizen 52.9% 6.3% 13.3% 0% 16.9% 10.6% 100%
US citizen 20.5% 22.7% 17.9% 14.9% 12.6% 11.4% 100%
Median age 23 24 24 23 23 25 24
*how to use this table: This table shows how each subgroup of young people with a shared demographic characteristic (e.g., male) broke down into each civic engagement cluster. The top row contains percentage break-downs for the whole youth population. In order to find out whether a specific demographic group was over- or under-represented in a cluster, a reader should compare the “all youth” percentage to the percentage that applies to a specific group. For example, 21.3% of all youth were in the Broadly Engaged cluster, while 11.1% of Latino youth in that group. This comparison leads a conclusion that Latino youth were under-represented in the Broadly Engaged cluster.

Understanding a diverse generation Youth Civic Engagement in the United States37
teChniCaL notes
Findings presented above are based on
CIRCLE’s analysis of the Census Current
Population Survey (CPS) data. For the
cluster analyses, the September Volunteering
Supplement and the November Voting and
Civic Engagement supplements were merged
together to create one dataset that contains
all available civic indicators. This procedure
was done for 2008 and 2010 and CIRCLE ran
two-step cluster analysis procedure in each
year’s data separately. For estimation of youth
civic engagement by individual indicators,
volunteering estimates are from the CPS
September Volunteering Supplement (2002-
2010) and voting and registration data come
from the CPS November Voting/Registration
Supplement (1972-2010), and all other civic
engagement indicators, such as access to
information and connection to others, come
from the pooled 2008-2009 and single-year
2010 CPS Civic Engagement Supplement.
There were some civic engagement indicators
that were only assessed in the 2008-2009
data collection. In order to achieve optimal
reliability and sample size, the 2008-2009
data were pooled.
There are some caveats about the data and
interpretations that readers should be aware
of. First, each cluster by no means represents a
homogeneous group of young people. Though
they are similar to each other and, as a group,
distinct from other clusters, they still vary in the
ways they engage in various behaviors and they
are also likely to vary on other measures of civic
engagement that the Census did not measure.
It is a different approach than defining a
“typology” by specific behaviors or cut-offs.
Furthermore, readers should not assume that
the same individuals are represented in 2008
and 2010 data. The Current Population Survey
collects data from about 50,000 households
annually, and the households represented in the
2010 data do not overlap with the households
that were sampled in 2008. Thus, readers should
not interpret the findings as individual change
over time. Instead, the differences between
2008 and 2010 should be interpreted as a shift
in the ways in which young people engage in
civic and political life at different times.
Understanding a diverse generation Youth Civic Engagement in the United States38
end notes
1 The September and November data for each year were merged in order to create a dataset that contains all 11
indicators coming from three different CPS supplements (Volunteering in September, Civic Engagement in November,
and Voting and Registration in November). Therefore, only the respondents who were in both the September and
November samples of each year were used in the analysis. In 2008, the total (unweighted) sample size was 8,740, and
in 2010 the sample size was 8,611.
2 Boycotting/buycotting and contacting public officials were the only two types of non-electoral political activities
that were asked in 2008 and 2010 CPS Civic Engagement Supplement. Because the prevalence of each of these
activities were quite low among young people, we set the criteria so that a young person who engaged in at least one
of these activities was considered to be politically active.
3 In several clusters, 100% of the respondents said that they had voted, but that was not the only factor used when
assigning them to a cluster. For example, in the 2008 “only voted” group 100% of respondents reported voting but
this group was also united by the fact that they responded “no” to other questions, not just by the fact that they
voted.
4 Estimates are based on a within-year longitudinal sample, which represents a group of youth who responded to both
the September and November CPS data collection in 2008. Thus the total estimates for indicators in this report are
slightly different from the published estimates from various reports.
5 Readers should note that the CPS data not longitudinal from year to year. Thus, we cannot make a direct statement
about how the same sample changed from 2008 to 2010. However, because the Current Population Survey maintains
a large and representative sample, we are able to make statements about youth population as a whole and how young
people have changed as a group between 2008 and 2010.
6 The three highest years for youth turnout were 1972 (55.4%), 1992 (52.0%) and 2008 (51.1%). For a full discussion
of the different ways voter turnout can be calculated please see “CIRCLE Working Paper 35: The Youth Voter 2004:
With a Historical Look at Youth Voting Patterns 1972-2004.” All voter turnout estimates presented in this fact sheet are
calculated for U.S. citizens only, and according to the “Census Citizen Method” described in CIRCLE Working Paper 35.
7 For more information on the level of interest among young people prior to the November 2008 election, see the
CIRCLE Fact Sheet “Quick Facts about U.S. Young Voters: The Presidential Election Year 2008”
http://www.civicyouth.org/PopUps/FS_08_quick_facts_national.pdf. See CIRCLE Fact Sheets “The Youth Vote
2004”, July 2005. http://www.civicyouth.org/PopUps/FactSheets/FS_Youth_Voting_72-04.pdf and “Youth Voter
Turnout Increases in 2006,” June 2007. http://www.civicyouth.org/youth-voter-turnout-increases-in-2006/
Understanding a diverse generation Youth Civic Engagement in the United States39
end notes
8 CIRCLE calculates turnout among eligible citizens by dividing the number of votes cast by the count of American
citizens aged 18 and over.
9 Based on the calculations using the Census Bureau’s Source and Accuracy Statement (2008), the estimated 95%
margin of error for the youth turnout estimate is +/- 0.70%. In other words, we are 95% confident that the true youth
turnout would be between 23.3% and 24.7%.
10 Campaign for the Civic Mission of Schools, CIRCLE, American Bar Association Division of Public Education, Lenore
Annenberg Institute for Civics, and National Conference on Citizenship, Guardian of Democracy: The Civic Mission of
Schools (2011) at www.civicmissionofschools.org/site/guardianofdemocracy
11 See CIRCLE’s “quick facts” page on Non-College Youth: www.civicyouth.org/quick-facts/non-college-youth/
12 Estimates are based on the longitudinal sample, which represents a group of youth who responded to both the
September and November CPS data collection in 2008. Thus the total estimates for indicators in this report are
slightly different from the published estimates from various reports.
13 In both 2008 and 2010, we observed that Asian American youth, as a whole, were most likely to fall under the
Civically Alienated cluster. However, we believe that the general label “Asian Americans” do not fully represent
the linguistic, religious, cultural and socioeconomic diversity within this group. Therefore, readers should interpret
statistics about the Asian Americans with caution.
14 Based on the longitudinal sample, which represents a group of youth who responded to both the September and
November CPS data collection in 2010. Thus the total estimates for indicators in this report are slightly different from
the published estimates from various reports.