understanding behavioural responses to tax and transfer
TRANSCRIPT

Understanding Behavioural Responsesto Tax and Transfer Changes:
A Survey of Low-Income Households
Sally Cowling*
Melbourne Institute of Applied Economic and Social ResearchThe University of Melbourne
Melbourne Institute Working Paper No. 15/98
ISSN 1328-4991ISBN 0 7325 0979 3
July 1998
*This paper is part of the project on ‘Tax Reform: Equity and Efficiency’, which issupported by the Brotherhood of St Laurence, the Committee for Economic
Development of Australia, and the Australian Research Council. I wish to thank TimGilley and Wendy Rose, for their assistance in recruiting and conducting Focus Groups,and the fourteen individuals who shared their experiences and views with us. This workhas benefited from discussions with Dr David Johnson and with members of the Social
Issues Group, Brotherhood of St Laurence. The support of the Ronald HendersonResearch Foundation and the Myer Foundation is gratefully acknowledged.
Melbourne Institute of Applied Economic and Social ResearchThe University of Melbourne
Parkville, Victoria 3052 AustraliaTelephone(03) 9344 5288
Fax (03) 9344 5630Email [email protected]
WWW Addresshttp://www.ecom.unimelb.edu.au/iaesrwww/home.html

Abstract
This paper describes a role for qualitative research in examining the behavioural
responses of low-income households to changes in personal income taxes, indirect taxes
and transfers. A series of Focus Groups were conducted to flesh out decision-making
processes with respect to labour supply and consumption. Discussions with sole parents
and couples with dependent children are reported in this paper.
Focus Group sessions explored the nature and strength of spending adjustments to past
variations in prices, and the management of situations in which expenditure exceeded
the participant’s current income. A second strand of questions focused on the interface
between the labour market and the tax and transfer systems. By identifying factors that
had influenced their participation or non-participation in the paid labour force, Focus
Group members shed light on possible labour supply responses to a change in effective
marginal tax rates.
Contents
1. Introduction .................................................................................................................1
1.1 Low-Income Groups and the Tax Reform Process ..................................................2
2. Research Methodology................................................................................................2
2.1 Data Collection Methods .........................................................................................3
2.1.1 Telephone Interviews.................................................................................................... 32.1.2 Focus Groups versus Individual Interviews.................................................................. 42.1.3 Postal Surveys............................................................................................................... 5
3. Research Questions .....................................................................................................6
3.1 Consumption Behaviour...........................................................................................7
3.2 Labour Supply Behaviour ........................................................................................9
4. Focus Group Characteristics....................................................................................11
4.1 Selection Criteria ...................................................................................................13
4.2 Group Profiles .......................................................................................................14
4.2.1 Focus Group 1: Sole Parents....................................................................................... 154.2.2 Focus Group 2: Couples with Dependent Children.................................................... 16
5. Focus Group 1: Sole Parents ....................................................................................19
5.1 Consumption Behaviour.........................................................................................19
5.1.1 Entertainment and Going Out ..................................................................................... 195.1.2 Shoes and Clothing ..................................................................................................... 205.1.3 Household Items ......................................................................................................... 205.1.4 Cigarettes .................................................................................................................... 205.1.5 Partial or Deferred Payment of Bills .......................................................................... 235.1.6 Department of Social Security Advance Payment...................................................... 235.1.7 Assistance from Welfare Agencies............................................................................. 245.1.8 Acquisition of Debt..................................................................................................... 245.1.9 Delaying Purchases and Repairs................................................................................. 245.1.10 Selling Personal Items............................................................................................... 25
5.2 Labour Supply Behaviour ......................................................................................25
5.2.1 Family Responsibilities............................................................................................... 265.2.2 Labour Market Inflexibility and Lack of Skills .......................................................... 275.2.3 The Cost and Availability of Child Care .................................................................... 27

6. Focus Group 2: Couples with Dependent Children ...............................................30
6.1 Consumption Behaviour.........................................................................................30
6.2 Labour Supply Behaviour ......................................................................................35
6.2.1 Family Responsibilities............................................................................................... 366.2.2 The Cost and Availability of Child Care .................................................................... 376.2.3 Lack of Skills, Formal Qualifications and Experience............................................... 376.2.4 Poverty Traps..............................................................................................................38
7. Group Feedback ........................................................................................................41
8. Conclusions ................................................................................................................42
Appendices .....................................................................................................................46
A.1: Questionnaire.......................................................................................................46
A.2: Household Expenses Form...................................................................................49
References ......................................................................................................................51

1
1. Introduction
Attempts to model the effects of taxation reform present an interesting conundrum.
While most analysts acknowledge that the impacts on equity and efficiency extend
beyond ‘day after’ effects, models used to evaluate these impacts have assumed no
behavioural change.
This assumption is waived in a research project being conducted by the Melbourne
Institute, the Brotherhood of St Laurence and the Committee for Economic
Development of Australia. The project incorporates reform-induced behavioural change
into a general equilibrium model of the economy. In this way, tax reform options can be
assessed and evaluated in terms of their impacts on equity and efficiency in both the
short and long run. The research reported in this paper is part of the project.
This paper describes a role for qualitative research in examining behavioural responses
to changes in personal income taxes, indirect taxes and/or transfers. The research aims
to flesh out the decision-making processes of low-income households with respect to
labour supply and consumption and to consider whether expressed preferences have
been, or can be, realised in the market. Data attained from focus groups will provide a
‘real life’ check of the behavioural assumptions and implicit elasticities used in the
distributional and general equilibrium models.
Comprehensive reform of the tax and welfare systems is likely to affect a broad
spectrum of the community and to provoke a range of behavioural adjustments. This
paper examines the labour supply and consumption responses of just two groups. It is
therefore important to outline the reasons for our interest in low-income households.
With this discussion as a prelude, the paper is structured as follows. Section 2 is
concerned with research methodology and the rationale for selecting focus groups as our
primary research method. Section 3 details our research objectives and questions.
Section 4 outlines the framework for the study and provides a demographic and socio-
economic profile of participants. Findings are reported in Sections 5 and 6, and Group

2
feedback in Section 7. Conclusions regarding the role of behavioural analysis in
assessing the equity and efficiency implications of tax reform are drawn in Section 8.
1.1 Low-Income Groups and the Tax Reform Process
In general terms, low-income households will suffer relatively more if reform-induced
prices rises are larger for goods forming a relatively large part of their total expenditure.
The overall effect on inequality will depend on the precise nature of price changes,
household expenditure patterns, and the distribution of income. Thus in order to assess
who ultimately pays any tax it is necessary to measure both price adjustments and
household responses to relative price changes.
Johnson et al (1997) showed that average indirect tax as a proportion of disposable
income is highest for the lowest income quintile. Thus a change in the tax mix, from
direct to indirect taxes, will require the measurement of, and a strategy for, the
compensation of low-income groups. It is hoped that material gathered from focus group
discussions will assist our assessment of different compensation options and provide
insights into the effectiveness of the direct tax and transfer systems in redressing adverse
distributional effects.
Johnson et al (1997) also examined the interface between the taxation system, the
transfer system and the labour market. They cited a 1994 study by Harding and Polette
(1995, pp.100-106) which found that effective marginal tax rates were highest in the low
to middle income deciles where most social security income tests operate. Orthodox
theory argues that, in the presence of high effective tax rates, the incentive to move
away from welfare and into paid work is dampened or removed. Focus group
discussions will examine the pertinence of this assumption by gathering information
about labour supply responses of low-income households in the context of a highly
targeted and means-tested welfare system.
2. Research Methodology
There are a number of methods, both quantitative and qualitative, which may be used to
collect data on likely behavioural responses to tax and/or welfare reforms. The process
3
of selecting which method, or combination of methods, was best suited to meeting the
research objectives involved a number of considerations.
In the first instance it was important to establish how collected information would be
integrated into subsequent phases of the project and the type of data, and level of detail,
required. The second phase involved an assessment of the relative ability of survey, as
against non-survey, methodologies to meet information needs. Finally, alternative
survey methods were evaluated - keeping one eye on the potential research gains of each
approach and the other on more prosaic matters of cost, probable response rates,
demands on time and resources, and access to a sampling frame.
2.1 Data Collection Methods
In the following discussion, the advantages and disadvantages associated with each
method are outlined both in general terms and in terms of meeting research objectives.
The aim is to use qualitative work - focusing on decision-making processes with respect
to labour supply and consumption - as a means to discern the behavioural responses of
low income households to changes in the tax and/or transfer systems.
2.1.1 Telephone Interviews
Telephone interviews offer savings in time and resources when compared to individual
or group interviews. However, in terms of research needs, the associated disadvantages
are significant.
Phone interviews limit the social interaction between facilitator and participant making
it relatively difficult to establish rapport and trust. This may inhibit the collection of
sensitive information assuming that participants have ready access to the requested
material. In reality, it is unlikely that details pertaining to income, government benefits,
and household expenditure can be recalled quickly and accurately without reference to
documents. In this regard, a postal survey that gives the respondent time to check
documentation and/or confirm figures is preferable to a phone interview. In addition,
mail surveys and personal interviews do not restrict the sample group to persons owning

4
telephones, although mail surveys exclude the functionally illiterate. Both restrictions
may be important given our explicit focus on low-income households.
2.1.2 Focus Groups versus Individual Interviews
Focus groups generally involve between six and ten participants who discuss a series of
issues or questions introduced by a facilitator. While it is important to delineate key
questions, in order to impart a structure and enable comparisons across groups, Taylor
(1997, p.2) argues that the number of key questions should be limited to allow time for
exploration and clarification. Discussions tend to produce a wider range of information
and interaction when group members are relatively homogenous. It is important that
participants do not feel uncomfortable or stigmatised - feelings that may arise if
participants have different socio-economic backgrounds or characteristics.
The decision to use focus groups as the primary research method is based on a number
of factors. Firstly, the strength of this approach in “...gaining qualitative information on
underlying attitudes, opinions and behaviour patterns” (Neale, 1989, p.14) is highly
commensurate with research objectives. Focus groups tend to be used as a method of
collecting data when researchers are seeking to understand why people act the way they
do. The sessions provide the opportunity to ask questions about current behaviour, with
respect to labour supply and consumption, and likely responses to alternative reform
scenarios. In contrast to postal surveys, focus groups enable the interviewer to probe
responses and gather additional details, and allow participants to offer contingent
answers to questions. While this may increase understanding of the subject at hand it
may also increase the difficulties associated with reporting and interpreting results.
It is reasonable to argue that the above advantages are attributable to interviews in
general rather than group interviews per se. However, different arrangements have
different strengths and weaknesses. Personal interviews are highly effective in terms of
building rapport and collecting sensitive information. This is particularly important
when individuals feel intimidated or nervous in a group setting, or are reluctant to
express a dissenting view. Responses given by members of the sample group are

5
independent of one another although leading questions, whether intentional or
unintentional, have the potential to bias results.
The decision to use group, rather than individual, interviews rested on two factors.
Firstly, focus groups offer a more efficient and less costly method of gathering data.
This was important in the context of a small budget and tight time frame. Secondly,
focus groups may uncover additional information by allowing members to react to, and
build upon, the responses of other participants. We recognise that this advantage may be
tempered if a group contains a dominant or highly opinionated member. The facilitator
will aim to pose value-free questions and to encourage contributions from all
participants.
2.1.3 Postal Surveys
In comparison to other survey methods, mail questionnaires can allow researchers -
armed with a high quality sample frame - to access a large and diffuse sample at a
relatively low cost. Postal surveys may also enhance the quality and accuracy of data by
allowing the respondent to complete the survey in her or his own time. This was an
important factor in deciding to use a self-completion questionnaire as an adjunct
to group interviews.
Given that we are collecting data at a household level and that information about
household expenses may require reference to bills and receipts, participants will receive
survey forms one week prior to their Focus Group. For couple households this will
provide an opportunity for consultation, as information on income is requested for each
partner. The anonymity offered by postal surveys may aid our collection of potentially
sensitive information although Bourque and Fielder (1995, p.13) note that “...more
recent studies suggest that sensitive information may be collected as effectively or with
even greater accuracy through telephone and face-to-face interviews.”
The decision to use a postal survey as a complimentary, rather than primary, research
method was made for a number of reasons. Firstly, mail surveys generally have low
response rates that may offset the quality and reliability of data. Secondly, questions
6
need to be simple, straightforward and are typically closed-ended. This stems from a
view that only the highly motivated and interested will be prepared to write sufficiently
detailed responses to a series of open-ended questions.
In the context of our survey this is a particularly important restriction. For example, we
are interested in examining whether changes in effective marginal tax rates induce
changes in labour supply. One way of exploring this issue is to ask individuals, who are
not in full-time employment, about the factors and/or barriers that have influenced their
mix of paid and unpaid work. A mail questionnaire will typically define a limited
number of factors (including the loss of government benefits and concessions) which the
respondent will then tick or rank in order of importance. If options chosen do not
capture experiences that are common or unique to the survey group then results may fail
to provide meaningful insights into ‘how’ and ‘why’ labour supply decisions, and
adjustments, are made. Bias may result if those designing questions and those providing
answers differ in terms of their socio-economic background, knowledge of the tax-
transfer system, and labour market experiences. Pilot studies, however, could be used to
assist the development of relevant questions and response categories.
While a postal survey may be a cheap and effective way of eliciting ‘what’ a respondent
did, the inability to clarify and probe responses means it is less suited to an examination
of ‘why’. Similarly, postal surveys are more amenable to asking questions about the
present than about the past or future. This is a serious limitation for researchers seeking
information on how an individual is likely to respond to hypothetical changes in prices
or income. However, by enabling us to attain information about current patterns of
consumption and work, mail questionnaires provide a context for the examination of
behavioural change.
3. Research Questions
The collection of information on behavioural responses to tax and transfer changes is
one component of a multi-stage research program. Central to this program is the use of a
general equilibrium model to assess the aggregate impacts of changes to taxes and
7
transfers. Before turning to our research questions it is important and instructive to note
what the behavioural data will not be used for.
This study is not based on a representative sample - it will not generate data that can be
generalised to some larger population and expressed in quantitative terms. The
information attained from focus groups will not be used to calculate household demand
or labour supply elasticities but it will be used to provide a ‘real life’ check on
behavioural assumptions used in the modeling process.
Both the general equilibrium and distributional models constructed for the project will
incorporate behavioural responses to tax changes. For example, the distributional model
will use price elasticities to measure the distributional effects of replacing a raft of
indirect taxes with a broad-based expenditure tax. These elasticities can then be checked
against information on consumption patterns and responses gathered through focus
group discussions and a Household Expenses Form (see Appendix A1.2). If differences
are significant, the implications of varying the model’s assumptions can be explored.
Focus group discussions will be framed around a series of questions relating to
behavioural change. Questions will explore the way in which participants have
responded to past variations in prices, transfers, and earned income. Following
consultation with social researchers at the Brotherhood of St Laurence it was felt that
extrapolation from past behaviour would provide a well-grounded assessment of the
likely response to future changes in policy. This methodology has been preferred to a
similar application of hypothetical changes to the tax and transfer system.
3.1 Consumption Behaviour
Our ability to analyse and interpret consumption responses to changes in direct or
indirect taxes will require an understanding of how low-income households manage
income, expenditure and assets, and how they respond to relative price movements.
Focus Group sessions will begin with a discussion of current consumption patterns as
recorded on the participants’ Household Expenses Form. Questions may be raised as to

8
the value of collecting this data when the 1993-94 Household Expenditure Survey Unit
Record File contains information on the household characteristics and detailed
expenditure of over 8000 Australian households. Answering such queries provides a
convenient framework for the discussion of our research objectives.
In order to examine and understand changes in consumption behaviour, following a
reform-induced change in relative prices, it is important to examine current household
expenditure. While HES data tells us that households in the bottom quintile of the
income distribution spend x per cent of their budget on Good A and y per cent on
Service B; they do not shed light on why households make these choices and the
relevance of the word ‘choice’ to spending patterns that emerge.
In trying to ascribe meaning to HES data, Focus Groups will discuss how consumption
decisions are made, and the nature of spending priorities, sacrifices and trade-offs. It is
important to consider whether traditional consumer choice theory is an appropriate
framework in which to analyse consumption decisions made by low-income groups.
Saunders (1989, pp.146-47), commenting on Trethewey’s survey of fifty low-income
households, makes the following point:
“For them, there was precious little choice in any aspect of their lives. Life was a
matter of survival in which choice had almost no role to play. Increased housing
costs, for example, did not result (at least in the short term) in a switch in
consumption towards cheaper housing but simply limited the resources available
for other goods. In other words, housing costs were not the result of any notion
of choice, but rather acted as aconstrainton other choices”.
The participants’ record of current expenditure will provide the reference point for a
second line of questions. These will be designed to explore past variations in
consumption patterns following changes to relative prices and/or disposable income.
Participants will be asked to discuss the relative importance of expenditure as an
adjustment mechanism and the nature of any changes made.

9
Our work on consumption behaviour has an additional objective - to check and augment
existing quantitative data. Calculations based on HES data produce a large gap between
reported income and expenditure for households in the bottom income quintile. An
average propensity to consume of this magnitude implies that a switch in the tax mix,
from direct to indirect taxes, will have a deleterious impact on equity. As a precursor to
understanding likely consumption responses to reform-induced price changes we need to
understand how low-income households have managed income, assets and debt. This
information may help us to assess the veracity of the HES result.
The Focus Group sessions will examine how participants have managed situations in
which current income is insufficient to meet expenditure needs and commitments.
Possible mechanisms include the use of welfare services, drawing on past savings,
borrowing from family, friends or financial institutions, rolling over existing debt,
purchasing on credit, and selling /pawning personal assets. These discussions may assist
in discerning whether low-income households have the scope to manage and plan
income and expenditure, or whether their ‘management’ context is day-to-day survival.
3.2 Labour Supply Behaviour
Assessment of the equity and efficiency impacts of taxation reform requires an
understanding of the interface between the tax and transfer systems and the labour
market. Recent Australian research1 has shown that low-income families face high
effective tax rates, both marginal and average. These results reflect interactions between
the taxation system and means testing as applied to a growing number of government
benefits, allowances and concessions.
Economists argue that high effective marginal tax rates (EMTRs) over a wide range of
income reduce the incentive to work. An extra hour of work will have a small, or even
negative, impact on disposable income. However, as Brownlee (1985, p.171) notes:
1 See Harding and Polette (1995), Ingles (1997), and Campbell and Bond (1997).

10
“...all the debates about the effects of marginal tax rates on who works and how
much they work make assumptions about the responses of behaviour to
different tax rates and about the labour market”.
Ingles (1997, p.2) has questioned whether empirical evidence is necessary to confirm the
existence of disincentive effects. He argues that, in the absence of a controlled
experiment, evidence of a behavioural response would:
“...require a careful study of actual versus hypothetical earnings patterns
amongst both affected and potentially affected families, and would raise
difficult questions of methodology and interpretation. This is not to deny the
potential value of such a study, but rather to question whether in its absence it
is reasonable to simply assume that demonstrated high EMTRs are only a
‘theoretical problem’”.
As stated earlier, a key aim of our focus groups is to flesh out the decision-making
processes of low-income households with respect to labour supply. While such a small,
qualitative study cannot produce an estimate of behavioural responses, it can offer
insights into the role of high EMTRs as a determinant of labour supply behaviour. To
this end, focus group discussions will be built around three broad questions.
Firstly, we wish to examine whether individuals and households understand how
additional private earnings will effect any government benefits, allowances or
concessions they currently receive. Department of Social Security evidence2 has shown
that unemployment beneficiaries and sole parent pensioners generally had little
knowledge of eligibility rules, withdrawal rates and the taxation system. It is thus
important to consider whether labour supply behaviour is driven by knowledge, lack of
knowledge or estimates.
2 See Puniard and Harrington (1993) and Crompton (1987).

11
Secondly, we will explore whether EMTRs were an explicit influence on current labour
supply behaviour in terms of whether or not each participant worked and the number of
hours they worked. The consideration of EMTRs will form part of a broader discussion
in which participants will be asked about the factors that determined their current labour
force status and whether such factors reflected individual choices and values or imposed
constraints. When speaking to individuals engaged in part-time or casual work we will
discuss whether their current labour supply behaviour is a fulfilled preference or the
product of barriers to full-time participation. We are also interested in discussing
whether individuals make ‘work decisions’ independently or on a family or household
basis. An examination of this decision-making process may contribute to the debate on
differences in the behavioural responses of primary and secondary income earners.
Finally, we will take a historical perspective. This will involve asking participants
whether past changes in their real disposable income induced changes in their labour
force participation. Supplementary questions will explore the source of past income
changes, and the nature of, and reasons for, subsequent variations in work patterns. Such
patterns may be indicative of the labour supply response to future changes in the tax or
transfer systems.
4. Focus Group Characteristics
This series of Focus Groups began life as a two-group pilot study. The purpose of the
study, as initially conceived, was to test and develop the structure of the interview and
the questions and material used. A second series of Groups or ‘study proper’ would
follow.
Feedback was gathered on participants’ understanding of the questions asked and
concepts used, and is discussed in Section 7. As a result of this material, some
adjustments were made to the self-completion forms. However, these changes were
peripheral and did not compromise the integrity of our findings. The ability to draw
valid comparisons between Focus Groups in both the first and second series meant it
was appropriate to accord this initial study full, rather than pilot, status.

12
Interviews with the second series of Focus Groups have now been completed. The
composition of these Groups was be determined by our research objectives, previous
research on low-income households and a range of demographic, economic and social
factors. Characteristics and results will be reported in a later paper3.
The first series of Focus Groups were drawn from Frankston, an area to the south of
Melbourne on the Mornington Peninsula. Participants were recruited from the pool of
individuals using a local, community-based welfare service. Interested persons were
given written material introducing the project and detailing what their involvement in a
Group would entail. An assurance of confidentiality was also provided. Participants did
need to fit a demographic and income profile as specified in Section 4.1. The criteria
were deliberately few in number to allow feedback to be gathered from a range of
individuals. Participants could differ in terms of their family size, the age of their
dependent children, and their labour force status.
The Groups were conducted on Monday, 17 November 1997 at the Brotherhood of St
Laurence Material Aid Service in Frankston. Sally Cowling from the Melbourne
Institute of Applied Economic and Social Research was the facilitator and Tim Gilley
from the Brotherhood of St Laurence made notes and recorded the sessions on audio
tape. The morning Group consisted of female sole parents. Couples with dependent
children formed a second Group in the afternoon. Each session ran for 90-100 minutes
and participants received a cash payment of $40 on its conclusion.
Additional data was gathered from a self-completion Questionnaire (Appendix A1) and
Household Expenses Form (Appendix A2) mailed to participants one week prior to their
Focus Group. With the individual’s permission, the completed documents were
collected at the end of the meeting. The Questionnaire enabled us to gather information
to describe or profile the Groups. The type of information collected is detailed in
Section 4.2.
3 See Cowling (1998).

13
The Household Expenses Form4 was used to provide each participant with a detailed
record of his or her current household spending. Expenditure categories were designed
to allow comparisons with broadband data from the Household Expenditure Survey. The
record was an important reference point for questions exploring variations in
consumption patterns following changes to relative prices and/or disposable income.
The use of the Household Expenses Form could be expected to produce more realistic
and accurate responses for two reasons. Firstly, in the days leading up to the interview, it
encourages participants to think about how they spend their money, narrowing
differences between perceived and actual spending patterns. Secondly, participants
could refer to the full list of expenditure categories before responding to discussion
questions. This may reduce distortions stemming from imperfect recall.
4.1 Selection Criteria
The choice of ‘Sole Parents’ and ‘Couples with Dependent Children5’ as Focus Groups
followed research on the composition of the bottom income quintile. In determining the
incidence of low income for different household types, it was important to look beyond
measures of gross income. The use of equivalence scales6, which take into account
varying costs of income units, changes the profile of the lowest quintile. The following
figures demonstrate the tendency for one-person units - with their lesser needs for food,
housing and other essentials - to be replaced in the lowest income quintile by couple and
one-parent units.
In 1995-96, almost 90% of the lowest gross income quintile were one-person units
compared to 61% using an equivalent income measure. By contrast, the proportion of
4 The Household Expenses Form draws from an expenditure diary developed by the Budget StandardsUnit (Social Policy Research Centre, University of New South Wales) as part of a project titled“Development of Indicative Budget Standards for Australia”.5 The ABS CatalogueLabour Force Australiadefines dependent children as “all persons aged under 15years, and persons aged 15-24 years who are full-time students, live with a parent, guardian or otherrelative and do not have a spouse or offspring of their own living with them” (1997c, p.69).6 Equivalent income data are taken from ABS Catalogue 6523.0Income Distribution Australia 1995-96(1997b, Table 27c) and are based on a simplified Henderson Equivalence Scale. Equivalent income iscalculated by multiplying each income unit’s disposable income by an equivalence scale. Equivalence

14
couple units in the lowest quintile rose from 10% to 30% when income was adjusted by
the Henderson scales. Among couples, the main movement into the bottom quintile was
for those aged under 45 with dependent children. This group comprised 3% of all
income units in the lowest gross income quintile compared to 13% in the lowest
Henderson equivalent quintile (ABS, 1997b, p.10). Given this high and rising incidence,
‘Couples with Dependent Children’ was chosen as a pilot group.
Two pieces of data were important in the selection of ‘Sole Parents’ as the other pilot
group. Firstly, ABS figures on income distribution for 1995-96 (1997b, p.10) showed
that the units most likely to be in the lowest Henderson equivalent income quintile were
one-parent units. Approximately 33% of all one-parent income units were in that
quintile. Secondly, the ABS publicationAustralian Social Trends(1997a, p.34) reports
that in the ten year period between 1986-1996, one-parent families as a proportion of all
families with dependent children increased from 15% to 19%. Over the same period, the
number of one-parent families in Australia increased by almost 50% from 311,800 to
467,200.
Participants in the pilot study met two generic criteria. Firstly - in order to promote
experiential discussion of possible linkages between labour supply behaviour and
effective marginal tax rates - all persons were aged between 25 and 45 years. Secondly,
all participants belonged to a ‘low income household’. As mentioned earlier, we have
defined ‘low income’ as the bottom equivalent income quintile although eligibility for a
Department of Social Security Health Care Card was regarded as a reasonable proxy for
recruitment purposes.
4.2 Group Profiles
As discussed earlier, individuals participating in the pilot study were asked to complete
a Questionnaire prior to attending their Focus Group. This proved an effective method
of collecting demographic details and potentially ‘sensitive’ information such as the
individual’s level and sources of income and their labour force status. The
scales are sets of ratios that show the relative income levels required for income units of different sizesand composition to maintain a similar standard of living.

15
Questionnaires completed by the second Group recorded data for both the participant
and her or his partner. In this way we were able to distinguish between household
income and income received by the individual.
The profiles presented in Sections 4.2.1 and 4.2.2 aim to provide a context for the
reporting and analysis of each Focus Group meeting. Profiles have been constructed
from completed Questionnaires and are thus based on the information provided by
participants.
4.2.1 Focus Group 1: Sole Parents
The Group consisted of six females, five of whom were Australian-born. A male sole
parent participated in the second Focus Group - “Couples with dependent children” -
due to his inability to attend an earlier session for Sole Parents.
Three of the participants were aged between 35 and 44 years, two were aged between 25
and 34 years and one belonged to the 20-24 years age bracket. The number of dependent
children living in each household ranged from one to six. Four of the participants each
had two children living at home. For the group as a whole, four children were aged
between 0 and 5 years, four were aged between 6 and 10 years and seven were aged
between 11 and 15 years. It should be noted that only two households had children in
the latter age group, five of whom belonged to one family.
While all of the participants completed primary school, no one in the Group had
completed secondary schooling or tertiary or trade qualifications. One individual
completed Year 11 studies and one completed Year 10. Of the remaining four
participants, two left school after Year 9 and two left after Year 7.
Four participants categorised their labour force status as “not in the labour force” and
described their main activity as “home duties and childcare”. The two individuals who
classified themselves as “unemployed” (see footnote 8) had been unemployed for 6
months and two years, respectively.

16
All participants cited a government pension or benefit as their main source of income7.
Each person received the Sole Parent Pension (SPP)8 which is subject to both an income
and assets test. Unlike the Newstart Allowance, the SPP is not subject to an activity test.
In addition, all participants received the Family Payment - the level of which depends on
the age and number of children. Once again, income and assets tests apply. Non-taxable
Department of Social Security payments are not included as income for the purpose of
income testing however maintenance payments may reduce Family Payments.
In terms of additional benefits, the three individuals who were renting from a private
landlord received Rent Assistance. The other members of the Group were renting from a
government authority (‘public housing’). All participants held a Health Care Card, two
received the Pharmaceutical Allowance, and one person received a Basic Parenting
Allowance. Reported income levels suggest that individuals were either marking their
primary government payment on the self-completion form or were not claiming all
allowances to which they were entitled.
4.2.2 Focus Group 2: Couples with Dependent Children
Eight individuals attended the second Focus Group, five of whom were married. The
other three participants were sole parents - two had been unable to attend the morning
group and one person was newly separated i.e. her marital status had changed during the
recruitment process. The mix of participants did not seem to inhibit the flow of the
discussion or the willingness of all participants to share experiences and to outline their
family structure, labour force involvement and financial circumstances. However, less
time was devoted to discussing whether couples make decisions about work jointly or
on an individual basis, than was originally planned. This was unfortunate, as we had
hoped to compare the strength of any labour market disincentive effects applying to sole
7 Centrelink (1998) provides a guide to Commonwealth Government payments for the period 20 March to30 June 1998. Information on State Government concessions for low-income earners can be found inDepartment of Human Services (1998).8 On 20 March 1998, the Sole Parent Pension and Parenting Allowance was replaced by a new ParentingPayment. This payment is available to both partnered and lone parents caring for children, thereby

17
parents with those applying to couples with dependent children. In order to elicit this
information a second group comprising couples with dependent children was included
in our second series of Focus Groups. Results will be presented in a forthcoming
working paper (see footnote 3).
The group contained five females and three males. Of the eight participants, seven were
born in Australia and one in another English speaking country. One person had a partner
from a non-English speaking background. Two couples and one sole parent were public
housing tenants while the remaining members of the Group were renting privately.
Four of the participants (one sole parent) were aged between 25 and 34 years, two (one
sole parent) were aged between 45 and 54 years, and there was one participant in each of
the 20-24 years (sole parent) and 35-44 years classifications. In terms of children, the
number of dependent children living in each household ranged from one to three. Four
of the households had two children living at home. Collectively, members of the group
had nine children aged between 0 and 5 years, three between 6 and 10 years, and three in
the 11-15 years bracket. Six of the participants had at least one child under five. One
sole parent had all three of her children less than 5 years, while one couple had both
children aged between 11 and 15 years.
The educational profile of the Group was poor. An examination of the highest level of
education achieved by participants and their partners showed that no one in this group
had completed secondary schooling and two participants (one sole parent) had a primary
school education only. Of those who attended high school, four of the participants and
all partners left school upon, or before, the completion of Year 10. The husband of one
participant had a trade qualification.
The labour force status9 of sole parents and couples participating in the Groups was also
indicative of low household incomes and dependence on government pensions/benefits.
providing assistance on the basis of parenting responsibilities rather than marital status. This change wasannounced in the 1997-98 Federal Budget.9 The following definitions are taken from ABS Labour Force, Australia, 6203.0, November 1997:

18
The two female sole parents were not in the labour force and described their main
activity as home duties and childcare. For both women, it had been 6-7 years since they
last participated in the paid workforce. The male sole parent was currently unemployed
and had been able to gain only intermittent periods of employment during the past five
years. For those Group members who were part of a couple, all had partners who were
either unemployed or not in the labour force. One participant chose not to record the
labour force status of her husband. Among the participants, two were classified as very
long-term unemployed10 with one person having their partner in the same situation. The
four participants (two sole parents) who were not in the labour force all described their
main activity as “home duties and child care”. The only employed person within the
group had part-time11 work (a paper run) for two hours per week. He had been unable to
participate in full-time work for the past eleven years due to a disability.
A government pension or benefit was the main source of income for the eight
participants and five partners surveyed. Each sole parent received the Sole Parent
Pension (see footnote 7) and Family Payment. Among married persons, two participants
and three partners received the Newstart Allowance and one participant the Disability
Support Pension. Either the husband or wife, in each of the five couples, received the
Family Payment and Parenting Allowance. One participant and one partner received the
Partner Allowance.
In terms of additional benefits, all individuals participating in the Group, and two of
their partners, were eligible for a Health Care Card. Indeed this was the primary
selection criterion for participation in the Focus Group. Two of the three couples renting
Employed- persons aged 15 or over who, during the reference week, worked for pay, profit, commission,payment in kind or without pay in a family business or had a job but were not at work.Unemployed- persons aged 15 and over who were not employed during the reference week but wereactively looking for and available for work.Not in the labour force- Persons who were not in the categories employed or unemployed as defined.They include persons who were keeping house (unpaid), voluntarily inactive, or permanently unable towork.10 Persons unemployed for a period of 104 weeks or more.11 Part-time workers are defined by the ABS as employed persons who usually worked less than 35 hoursa week and who did so during the reference week [Labour Force, Australia, 6203.0, November 1997].

19
from a private landlord received Rent Assistance and one couple received the Telephone
Allowance.
5. Focus Group 1: Sole Parents
5.1 Consumption Behaviour
The session began with a discussion about spending priorities. Participants were asked
to examine their Household Expenses Form and to identify any spending patterns: “Are
there goods and services that generally get paid for first?” Responses were rapid and
identical. The Group concurred that you “alwayspay you’re rent first” followed by the
utility bills (electricity, gas, water, and phone). Individual estimates of the proportion of
their household income absorbed by these two payments ranged from 35 to 50 per cent.
Remaining income was spent on food and education costs in the first instance. It should
not be inferred that items described as “priorities” are immune from changes in
expenditure when prices or incomes vary. We will return to this later.
The discussion of spending sacrifices and substitution effects was introduced with a
general question. It was important to consider whether the way a question was asked
influenced the way it was answered. Would a general question about the nature of
spending adjustments generate responses that were consistent with adjustment patterns
suggested by the participant’s past behaviour?
The Group was asked, “When the budget gets a bit tight, are there things that you cut
back on or cut out”? The responses are listed below with items mentioned most
frequently listed first:
5.1.1 Entertainment and Going Out
Changes took the form of a switch to low-cost activities. Examples included taking
children to the park or the beach instead of McDonalds. Two women mentioned sharing
expenses: “We take turns to hire a video and we pass it around instead of going to the
movies” (Karen).

20
5.1.2 Shoes and Clothing
As financial circumstances become more difficult individuals reduced spending and
became more reliant on op shops and ‘hand-me-downs’. “I’d be lucky to spend $100 a
year on myself. I can’t remember the last time I went out a bought a pair of shoes but I
still buy them for my kids.” (Jackie)
This response was typical. In all cases, parents reduced personal expenditure before
cutting back on goods and services purchased for their children. This ‘sacrifice
hierarchy’ was discussed in vigorous and emotional terms.
5.1.3 Household Items
Repairs to durable goods or to one’s home were delayed whenever possible.
5.1.4 Cigarettes
The three smokers in the Group “cut back on the fags” (Louise).
Participants were asked to look at the amount they currently spend on the above goods.
Expenditure on ‘Recreation’ and ‘Household Furnishings, Equipment and Services’ was
nominal with the exception of some payments for emergency repairs. This cast some
doubt on whether a distinction was drawn between items on which expenditure was
generally low and items on which spending was adjusted as financial circumstances
changed. To test this concern, and to encourage respondents to focus on past behaviour,
subsequent questions were framed in specific terms.
The Group was asked whether they had noticed any change in the prices of goods that
they buy, or would like to buy, over the last twelve months. Price rises were noted in
education, health and dental services, fruit and vegetables, and meat. The next step was
to ask participants how they had responded to these price changes taking care to discuss
their personal experiences rather than their opinions or the experiences of others.
Consumption responses relating to food were prominent. Most participants have
reduced their spending on meat, fruit and vegetables. Simone commented “If the price
21
of a big bag of potatoes goes up over $10 then I buy rice instead”. Four members of the
Group said that higher prices have meant that theyonly buy cheaper cuts of meat -
mince and sausages. Substitution between brands was not significant as participants
tended to use ‘Home’ or ‘No Name’ brands where available.
A key response to higher grocery prices was an increased emphasis on bargain hunting -
a preparedness to travel and ‘shop around’ in order to get cheaper goods. ‘Timing’ was
seen as all-important. Most members of the Group go to the butcher and the markets at
closing time on Saturday in order to get cheap meat trays and cheaper fruit and
vegetables. Participants discussed the use of informal networks to share information.
This started a debate about the cheapest place to shop in Frankston and pens and paper
came out to jot down local bargains. Two people mentioned that “when things get too
much” they buy in bulk and split purchases with friends. Two others had started to grow
their own fruit and vegetables.
Four participants mentioned that when prices increase they try to reduce their energy and
water bills so that their family will not go hungry. Strategies included imposing time
limits on showers. “My children have to have a 2 minute shower now. Once a week
they’re allowed to have 5 minutes so they can wash their hair.” (Simone) Families
would generally wear more clothes or go to bed earlier in winter to avoid using the
heater.
An area of particular concern to participants was the need to reduce their usage of
education, health and dental services following recent changes in Government policy.
Four parents, all with school-age children, argued that changes to the Education
Maintenance Allowance12 (EMA) have increased the cost of education. In order to cope
12 The Education Maintenance Allowance (EMA) is paid by the Victorian Department of Education toparents holding a Department of Social Security concession card. Prior to 1997, parents received $127 perannum per child in primary school and$254 per child in secondary school. The EMA is paid twice, earlyin the two semesters, and cuts out when the child reaches 16 years. At the start of the 1997 school year achange was made in the way the EMA is delivered. Schools now receive fifty per-cent of the payment tobe offset directly against school costs. It cannot be used for requisites used in the delivery of the schoolcurriculum, for items covered by the School Global Budget, or to offset voluntary contributions. Siemon(1997) argues that there are difficulties associated with implementing these guidelines.

22
with rising costs these parents have said “no” to some school excursions and camps and
their children are not enrolled in subjects having subject-specific fees or voluntary
levies. This was clearly an emotional adjustment that was described as a “last resort”.
“Half of the education cheque you used to get from the government goes to the school
now but I have to pay $30 on top of my part [of the EMA] as fees and that’s not
including excursions. My son had to miss out on the fifth grade camp this year. All his
grade went and he had to spend the week in fourth class. We couldn’t afford it
anymore.” (Louise)
For many in the group, up-front charges for services provided by community health
centres, along with the introduction of a $20 co-payment for dental care13, has meant
forgoing medical and dental treatment. The following quotes are illustrative.
“My daughter has to see a chiropractor once a week but it’s $38 a visit so she
just can’t go.” (Trish)
“I had a toothache for three weeks but if you don’t have $20 what do you do? I
just put up with it but I couldn’t do that if it was one of the kids.” (Simone)
“I couldn’t afford to [go to the dentist] so I just took lots of Panadol.” (Jackie)
In the course of discussing consumption behaviour, participants stressed the importance
of establishing, and sticking to, a tight budget. Many had received financial counseling
through Centrelink or non-government welfare agencies saying that weekly fluctuations
in income made it difficult to manage expenditure. For sole parents in the Group,
variations in income were generally attributed to the absence of regular, reliable
maintenance payments and the administrative arrangements for the payment of Child
13 The Commonwealth Dental Health Program, which provided free dental care for persons on low-incomes, was abolished in the 1996-97 Commonwealth Budget. The Victorian Government has sinceintroduced a $20 co-payment for dental care.

23
Support14. This was a timely point at which to introduce our next research question:
“How do low-income households adjust to unexpected expenses”? Material gathered
may assist our understanding of the high propensities to consume attributable to HES
data.
Participants were asked to describe situations in which they had faced unexpected
imposts and to discuss the mechanisms used (and those not used) to meet such expenses.
Common scenarios included the need to repair or replace large consumer durables, and
the management of repayments when “bills arrive on top of one another”. Coping
strategies were numerous and were often used in concert.
5.1.5 Partial or Deferred Payment of Bills
All participants were adept at juggling and balancing the payment of bills and the
repayment of loans. An important precept was trying to keep the amount paid each week
reasonably even. Utility bills were only paid in full after the individual had received
‘reminder’ or ‘warning’ notices. The order in which bills were paid reflected the
consequences of non-payment e.g. the disconnection of services, and the attitude of
suppliers.
5.1.6 Department of Social Security Advance Payment
In the past twelve months, five members of the Group had used a DSS Advance
Payment to help with expenses. The Payment was generally used to finance emergency
repairs to, or the replacement of, large durable goods and motor vehicles.
The Advance Payment is a lump sum amount paid from part of future DSS payments. It
takes the form of an interest free loan. Advance payments vary from $250 to $500 with
14 Child support payments received by the Australian Taxation Office Child Support Agency (CSA) aretransferred through a Trust Account to the Department of Social Security (DSS) for disbursement. TheDSS system only processes child support payments on two paydays a month, resulting in time delays andinflexible payment arrangements. The taxable income of the non-custodial parent is currently used as thebasis for the child support assessment and can change over time. Custodial parents who inadvertentlyreceive more child support than they are entitled to must repay the difference. A CommonwealthOmbudsman’s Report released in January 1998 found that by the time parents were notified ofoverpayments, the money had usually been spent making it difficult to repay the CSA. The Reportrecommended that the CSA revise its policy of intercepting the custodial parent’s tax refund to recoverdebts and, if forced to do so, negotiate a suitable amount with the parent that takes into account the oftenprecarious financial position of single parent families.

24
the size depending on how much the applicant normally gets paid. The maximum
Advance Payment will be 6 per cent of the applicant’s annual payment up to a ceiling of
$500. If 6 per cent of annual payments is less than $250 then the applicant will be
ineligible for an Advance. The Advance Payment is repaid by fortnightly deductions
from DSS payments over a period of 6 months. Deductions range from $19.30 per
fortnight for an advance of $250 to $23.10 per fortnight for an advance of $500 (DSS,
1997).
Participants were asked how they adjusted consumption behaviour during the repayment
period. Adjustments matched the pattern of ‘spending sacrifices’ detailed at the
beginning of the session.
5.1.7 Assistance from Welfare Agencies
Three individuals had received cash handouts and small interest-free loans to cope with
“crisis situations” (Lisa). The crises were described as situations in which families faced
eviction, were unable to afford food, or had been threatened with disconnection (of
electricity, water, gas, phone) if they did not respond promptly to ‘final warning
notices.’ All participants had received material assistance from welfare agencies.
5.1.8 Acquisition of Debt
The Group reported that financial institutions “won’t loan money to poor people
especially not single mums” (Lisa). Two individuals were repaying hire purchase loans,
and one had taken out a second loan: “I couldn’t keep up with the interest payments on
the first loan. They charge 26 per cent” (Simone). Borrowing from family and friends,
while done reluctantly and as a “last resort”, was quite common.
5.1.9 Delaying Purchases and Repairs
Many of the group had put off replacing or repairing broken goods, particularly white
goods, until they could save enough money or find a bargain. Bargains were generally
discovered in the local Trading Post, at Material Aid or Op shops and at garage sales.
Trish said: “My washing machine broke down and I couldn’t afford to get it fixed so I
hand washed for 6 months - washed everything in the bath tub until I could afford a new
25
[second hand] one”. Karen’s washing machine met a similar fate: “...it was going to cost
$300 to fix so I just had to wait until I got my tax back. You do the best you can.
Sometimes I had to borrow my neighbour’s machine but I felt so bad asking her”.
5.1.10 Selling Personal Items
One participant had pawned personal effects in order to quickly raise funds. “Last time I
was stuck - rather than ask my family or borrow - I grabbed a ring and got $50 for it.”
(Simone)
It is important to note that none of the participants had a pool of savings on which to
draw. Goods were frequently purchased on lay-by but only one person currently owns,
and uses, a credit card. Interest charges account for “sixty per cent” of her monthly
debts. A number of other participants had been similarly burnt: “I cut mine up. I went
over the limit and I didn’t know and I’m still [one year later] paying it off” (Jackie).
To conclude the section on consumption behaviour, the Group was asked how they were
coping with Christmas. The discussion revealed that Christmas was a highly stressful
time and that families were trying to manage by limiting the number of gifts. All were
anxious not to incur debt. Many had started Christmas Club Accounts but had
withdrawn money, often with some financial penalty, when urgent situations arose
during the year. “I started one and then two bills came in together and I didn’t have the
money so I took it out.” (Trish)
5.2 Labour Supply Behaviour
The second part of the session focussed on labour supply. To discern likely determinants
of labour supply behaviour, participants were asked to describe their current mix of paid
and unpaid work and search activity. As outlined in Section 4.2, all members of the
group were either unemployed or not in the labour force. With this information as a
backdrop, questions about behaviour were geared to the circumstances of the Group.
The following questions were asked:

26
“For those of you who are seeking paid work; are you looking for full-time, part-
time or casual work? Are there any factors or barriers that have made it difficult to
find suitable work?”
“For those of you who are not seeking paid work; are there any factors or barriers
that have deterred you from seeking paid work? What are the main reasons for your
non-participation in the labour force?”
The barriers and influences cited by participants form a complex and interdependent
structure and are described below. Unraveling and weighting factors is a difficult and
imprecise task. For the sole parents interviewed, issues relating to the care of children
and the inflexibility of the unskilled labour market emerged as key determinants of
current labour supply behaviour and form an important context in which to analyse
‘secondary’ factors.
5.2.1 Family Responsibilities
Four members of the Group would like to work part-time but had been unable to find
work that was compatible with their family responsibilities. Two of the four were
actively searching for paid work while the others were “just keeping [their] eyes open”.
‘Caring needs’ were seen as incompatible with involvement in the paid workforce. This
was a critical issue for two of the participants, one of whom had an intellectually
disabled child and the other who had children with learning difficulties.
The Group initiated a broad, and often emotional, discussion about whether paid work
was ‘worth it.’ The concept of ‘worth’ was non-monetary and focussed on the care and
attention that children miss out on when the custodial parent is employed.
“The children miss out because you don’t have the time to spend one-on-one.”
(Simone)
“I was doing voluntary work for my self esteem and then I got some part-time
work in the same field but I think it was part of my marriage breaking down. We

27
actually had less money and things change at home. The kids couldn’t cope. It
wasn’t worth it.” (Trish)
Four of the women discussed the pressures of being a sole parent and not having a
partner to share domestic responsibilities. The following statement captured the feelings
of the Group.
“It was so hard when I was working because you work all day and then come
home and do the shopping and the housework and look after the children and the
money. All men have to do is go to work.” (Jackie)
5.2.2 Labour Market Inflexibility and Lack of Skills
All of the participants had left school before turning 16 and described themselves as
unskilled. They argued that the jobs for which they could apply - waitressing / bar work,
and work in shops or factories - generally had rigid hours. In addition, many of the jobs
required night work or shift work. It was very important to all members of the Group
that they were home when their children left for, and returned from, school and that they
could stay home if their children were sick. Inflexible working arrangements meant that
this was not possible. The perceived availability of unskilled labour meant, “…if you
take time off because your kid is sick you lose your job. If you don’t have any skills they
can just replace you” (Louise). The Group was asked whether this statement reflected
personal experiences. No examples were forthcoming.
Three of the women who were seeking work said that employers were not interested in
hiring single mothers especially those with children less than 5 years. Instances of
discrimination were cited.
5.2.3 The Cost and Availability of Child Care
Part-day care was not available in the local area and the cost of long-day care was
viewed as preclusive when compared to wage rates offered. Mothers who had been
shopping around for childcare had received quotes ranging between $18 and $22 per day

28
(full-day care). Job seekers within the Group had a clear preference for part-time work
and felt that the non-availability of part-day care had deterred their search effort.
When making decisions about work, all participants compared pay rates offered with
attendant reductions in DSS benefits and concessions. An unfavourable comparison did
not, in itself, guarantee that opportunities to shift from dependence on welfare to paid
work would be knocked back. However, the Group agreed that it was a factor that they
have taken, or would need to take, into account.
“I could find work if I had to. It’s there if you look hard enough but the pay’s so
bad. Two jobs I got offered paid $8 per hour. I can barely survive now and if I’d
taken them I would have gone backwards.” (Karen)
During the last twelve months, two individuals had turned down jobs because they were
“not worth it” once the additional costs of working had been taken into account.
‘Additional costs’ included childcare, work clothes and transport.
The discussion of poverty traps revealed an important dichotomy. The loss of
allowances and concessions - most notably the Health Care Card, Rent Assistance and
State Government concessions on energy, water, sewerage, municipal rates and transport
(see footnote 7) – was much more significant in the decision-making process than any
consideration of payment thresholds and taper rates. In particular, participants expressed
deep fears about their ability to cope without a Health Care Card.
“One of my sons needed glasses and it took me six months to be able to afford
them. What would I do if I didn’t have my card?” (Simone)
The strength of these concerns necessitated a second line of questioning. Firstly, it was
important to establish whether participants were well informed about eligibility
requirements and the income, assets and activity tests applying to some benefits.
Secondly, we needed to consider the whether labour supply behaviour was effected by
this information. The following questions were asked

29
“Do you know how much you can earn in the labour market before you lose your
Health Care Card?”
“What is the maximum amount you can earn before you start to lose some of your
Sole Parent Pension?”
Participants noted that Centrelink did send this information to them but they could not
state the amount or make a “confident” guess. No one in the Group had used
Centrelink’s Financial Information Service15. Participants were asked how they attained
information relating to their benefits. Friends in receipt of the same benefit/s were the
first port of call. The majority expressed a reluctance to use government information
services arguing that it was time consuming and staff were poorly informed.
To conclude the session the Group was asked whether they had any feelings or opinions
about the mooted introduction of a goods and services tax (GST). A number of points
emerged from this discussion.
Firstly, the GST was seen as a tax that would cause an equal and universal increase in
the price of goods and services. While most participants felt that the Government would
“… probably get rid of some other taxes if they bring in a GST”, they did not understand
that the impact on price outcomes would, in part, depend on which taxes were replaced
and the extent to which indirect taxes are passed forward. This discovery caused much
consternation.
“It’s confusing. It’s hard to understand. I mean if some [prices] are going up and
some are going down you can’t work out how it will effect you. All I know is
that if it costs more to go to the shops – just to get the basics – then I’m going to
struggle, really struggle.” (Louise)
15 Centrelink offers a free and confidential Financial Information Service that can answer any questionsabout pension, allowance or benefit entitlements. For example, individuals considering employment canfind out how earnings would affect their Social Security payments.

30
Two individuals said they would be in favour of a GST if they were “properly
compensated” through the transfer system. Compensation in the form of additional
income had the following advantage.
“If you’ve got the extra dollars in your pocket then at least you can decide what
to do with it – you can choose how to spend it.” (Louise).
6. Focus Group 2: Couples with Dependent Children
6.1 Consumption Behaviour
While the nature and order of spending priorities mirrored those of the ‘Sole Parents’
Focus Group, participants seemed less sure of the proportion of weekly expenditure
devoted to rent, utilities, food and education. Estimates were expressed in general terms
-“a lot”, “a big chunk” - and further questions did not elicit specific responses. It is
important to consider whether participants found it difficult to translate dollars spent
into percentage terms. This hypothesis was tested in later Groups by asking individuals
“How much do you spend on....?” before seeking this information as a proportion of
weekly expenditure or income.
Referring to the Household Expenditure Form, participants were asked whether there
were HES broadband categories on which they didn’t spend money. Jason said “Yeah,
just a couple. NOT”! The Group enjoyed the sarcasm and found it “…ridiculous that
you could have enough money to buy all that stuff” (Jason again). In general,
participants did not spend money on “house things” (furniture, appliances, cutlery and
crockery), repairs and maintenance, superannuation, and clothing and shoes for adults.
Two participants did not spend any money on alcohol and tobacco.
In the manner of the earlier session, the Group discussed the nature of trade-offs made
following a change in financial circumstances. A clear pattern of ‘spending sacrifice’
was established which was again similar to that of the first Group. Explicit references
were made to reducing the family food bill by switching to cheaper brands and cutting

31
back on the amount of food purchased - particularly fresh fruit and vegetables and meat.
The scope for substitution was limited because most families were already using the
cheapest products available, buying day-old bread and hovering around the markets at
closing time to get “bargains!” Nicole and her husband were “pretty happy” about a
weekend purchase. “We went to the butcher just as he was closing and we got a whole
tray of BBQ steak for three bucks. It’s all in the timing.”
Buying in bulk and sharing purchases was also used as a means to reduce the shopping
bill. Elena told the following story: “My husband saw a 10 kilogram bag of onions for
$6 so we got in touch with our friends and sold them for 60 cents per kilo. This way we
helped each other and got onions for 60 cents rather than $1.49 per kilo.”
Robert drew out a pattern of sacrifice common to all couples within the Group.
“My wife and I have been married for five years and I forget what we forgo...we
don’t go out to restaurants, we can’t afford a weekend away, we don’t give each
other gifts...certainly treating ourselves is very infrequent.”
Wherever possible sacrifices were borne by adults rather than children. This was
particularly pertinent at Christmas. Cathy summed up the behaviour of the group: “You
buy the best you can for the kids and go without yourself. Adults never exchange
presents”. As with the Sole Parent Group, financial planning mechanisms such as
Christmas Clubs were ineffectual.
Group members initiated a discussion about how they cope with unavoidable or
unexpected expenses. Peter articulated the general philosophy: “Basically you do with
what you have and if you need something you cut back or go the Op Shop or Material
Aid”. Rising education costs and changes to the payment of the Education Maintenance
Allowance (see footnote 12) were widespread concerns and had induced the ‘sacrifice’
pattern described earlier. This was particularly the case in January and July - periods

32
when school fees needed to be paid and uniforms purchased. Parents raised the
importance of having their children in the ‘proper’ uniform.
“The school says they must have the correct uniform but it’s different to the one you can
get at Target and it’s double the price. And if you buy the Target one your kid looks
different and that’s not fair so you give up buying clothes for yourself to buy the right
one.” (Linda)
Other participants spoke about the financial pressure created by frequent uniform
changes (at least two, often three) in State schools. “They just change the bloody collar
or colour or something so you have to get them a new shirt.” (Cathy)
The introduction of a $20 co-payment for dental services was identified as a “big price
change”. For some members of the Group the non-provision of free dental care
(previously available to low-income persons under the Commonwealth Dental Health
Program – see footnote 13) has changed the way in which they finance dental care and
their demand for this service.
“I went to the dental hospital about two months ago. They found what was
wrong and they fixed it up. But because you’re going to be $20 out of pocket
you’ve got to think about it. I had to talk about it with my wife and work out
how we could afford it. When you’ve got a tooth problem you’ve got to attend to
it - you can’t just put it on the back burner. I’d like my family to have one check
up a year to keep our teeth in good condition but there’s no way that I can afford
to do that now.” (Robert)
“For the last four weeks my son - he’s eleven - has had a tooth ache and the
school service couldn’t tell us what was wrong. They took x-rays and still
couldn’t tell us what was wrong so then we went to the Dental Hospital. And
after going through the system, getting the x-ray and paying the $20 they said:
“Here is the problem...you’ll have to go back to your own dentist and have root

33
canal work or have the tooth extracted. It cost me all up $240. I had to get a DSS
loan.” (Peter)
To stimulate further discussion of ‘coping’ or ‘adjustment’ mechanisms the Group was
asked: “Have you experienced situations where you have been unable to pay bills or
have been hit with unexpected expenses? How did you cope”?
In addition to “doing without for as long as you can” (Nicole) and reducing expenditure
- in accordance with the hierarchy discussed earlier, most participants relied on two
stopgap provisions.
1) Partial payment or deferral of billsDuring the past twelve months, all members of the Group had either deferred the
payment of bills or had paid the amount owing in installments. This method was
generally used when bills - especially those for electricity, gas, water and telephone -
arrived simultaneously and enabled expenditure smoothing in accordance with tight
weekly budgets. Peter referred to a recent situation when his electricity and gas bills
arrived in the same week: “I paid half of each bill and requested an extension on the
remaining amount due”. Elena discussed how she deals with utility bills when she is
unable to meet the repayments: “I get the first bill then wait until the second bill arrives.
And then I phone and ask if I can pay off some of the first bill”. Six of the eight
participants found suppliers to be both helpful and flexible “…especially if you have a
good record and pay at least a bit of the bill”(Linda).
2) Advance PaymentsFive members of the Group had used a DSS Advance Payment (see footnote 15) in the
last twelve months. This was seen as preferable to borrowing from family or friends. A
number of participants had applied for loans from financial institutions and hire
purchase companies. All applications had been rejected on the grounds of insufficient
income and/or assets. Elena spoke about the difficulties she encountered when trying to
rent a house: “My husband and I are both long-term unemployed so no one would have
us. Eventually we had to lie to get a place and we are the best tenants they’ve ever had”.

34
Given the status of Advance Payments as a preferred, and frequently used, source of
funds it was important to examine concomitant adjustments. There was general
agreement among the Group that the deduction of fortnightly repayments from DSS
pensions/benefits was a “blessing”. The five individuals who had used this funding
made the following changes to their spending behaviour during the repayment (reduced
income) period.
“I had to say no to a school camp and excursion.” (Linda)
“My strategy is based on survival. If a bill comes in and it has to be paid and I
have less money than usual then I say “Oh well, it has to be paid” and things
come out of the shopping trolley…. I take out all meat except for the very
cheapest mince and I’ll go anywhere to get the cheapest. If there’s no washing
powder left then I’ll use soap and do all my washing by hand.” (Cathy)
“The car didn’t get repaired when it should and I’m seeing if a mate can fix it.”
(Jason)
“I’ve put off buying a pair of cheap, but decent, boots for eight months.”
(Robert)
“We rely even more on families and friends – we even lend their clothes. The
only things we buy for our 12-month-old baby are nappies. Everything else is
borrowed or a gift.” (Robert)
Nicole turned her attention to the period following the final repayment raising an
interesting question about symmetry versus asymmetry in consumption behaviour. “It
doesn’t matter what you get you just have to live on what you get. When I’ve finished
paying off a DSS loan then I go wild. I might buy an ice cream or go to the movies - just
spend it. And then go ‘normal’ again.” Half of the Group agreed that this statement was
a general description of their response to an increase in income.

35
In our discussion of consumption behaviour - and the methods used to bridge gaps
between income and expenditure - participants did not indicate a role for savings. This
raised the question of whether Group members had savings on which to draw. Elena and
her husband had used money “set aside for the children’s education” to purchase a
computer. The funds had been saved five years ago when both partners were employed.
Only one other person had savings available.
Participants did not use credit cards but made heavy use of lay-by for the purchase of all
non-grocery items. Most individuals had applied for at least one credit card during the
preceding twelve months however applications were generally rejected on the grounds
of insufficient income and/or assets. Cathy was the only participant to have used a credit
card in the past year. “I pay only the minimum monthly payment and half of it is
interest. I haven’t made any in-roads on the original amount. I don’t buy on credit
anymore. I stopped six months ago.”
To conclude this part of the discussion, participants were asked about their ability to
earn additional income by taking on extra work. After assuring members that all
information could be given in confidence, two of the men said they were able to increase
their income “…sometimes, when I’ve got nothing left… by fixing cars and washing
machines for our friends or friends of friends” (Jason). Money earned was not declared
for taxation purposes.
6.2 Labour Supply Behaviour
The second part of the session focused on labour supply behaviour. Material canvassed
in the first Focus Group formed a framework for discussion and additional time was
devoted to exploring differences between preferred and actual behaviour, and
independent versus interdependent decisions in ‘Couple Households’.
By way of introduction, participants were asked to describe their current labour force
status and that of their partner. Details are presented in Section 4.2.2. Follow-up
questions helped to identify discouraged workers and the under-employed. Job seekers
36
were asked whether they had a preference for full-time, part-time, or casual work. The
preferences reported below apply to a world in which barriers to labour market
participation, both personal and institutional, are removed by assumption.
Two women were actively seeking part-time work while one woman wished to
work part-time but had “given up” search activity.
Two women were not in, and did not wish to be in, the paid labour force.
Two men were actively seeking full-time work.
One man had two hours paid employment per week but would prefer to work
half time.
Having established ‘preferred options’, the Group discussed the factors, barriers and
values that had determined whether their preferences were, or were not, realised in the
labour market. Responses were strikingly similar, both in content and order, to those
offered by the ‘Sole Parents’ Focus Group.
6.2.1 Family Responsibilities
For six of the eight participants the difficulty of combining paid work with home duties
and childcare had been the most significant barrier to their participation in the labour
force. Flexible or part-time positions that accommodated the “needs of parents” were
very hard to find, especially in the unskilled labour market. Peter, a sole parent, gave
voice to these needs:
“I’d love to go out and work but a lot of work is at night times and I can’t do that
because I want to be there for my son when he comes home. I want to cook his
dinner for him. I want to be able to stay with him when he is sick”.

37
6.2.2 The Cost and Availability of Child Care
While female participation in the paid workforce may be facilitated by switching from
home care to formal childcare, this option was “not available to low-income families”
(Michelle). Three of the women had stopped looking for (part-time) work because
positions were not available in community-based centres. Other childcare options were
unaffordable: “…22 bucks each day for my two kids and I don’t even want full-day
care” (Nicole). In addition, the lack of casual care facilities made it difficult to seek
work and attend interviews. When asked about informal care arrangements involving
family or friends all agreed that this was used for “emergencies only”.
6.2.3 Lack of Skills, Formal Qualifications and Experience
“The longer you’re out of work the harder it is to get and if you haven’t got any
skills…well you’re stuffed.” (Robert)
The work history of each participant was fragmented and featured significant periods
without paid employment. For male participants these ‘gaps’ were generally due to long-
term unemployment while female participants had left the labour force to bear and raise
children. Three of the women felt that firms were reluctant to employ women with
young children. Female participants with school-age children had also found re-entering
the workforce a difficult or fruitless pursuit.
Labour market discrimination has proved a significant barrier for Peter: “I’m 40 and I’ve
been knocked back time and time again because they think I’m too old”. Peter hopes to
become self-employed and is “working on a few business opportunities”. For Gordon,
whose Disability Support Pension is not subject to an activity test, insecurity of tenure
for unskilled workers had diminished his search activity. “ The jobs don’t last long. I’ve
been hired one week and fired two weeks later. Is it really worth going off your
benefit?”
38
6.2.4 Poverty Traps
In order to explore the impact of EMTRs on labour supply behaviour the following
questions were asked: “Has anybody ever knocked back a job offer”? “If so, why?” Two
experiences were recounted.
“My husband was offered a traineeship in Hastings and he doesn’t drive. The
pay they were offering him was only $30 more than the dole but we looked at it
and by the time I drive down and drop him off and drive back and then drive
down, pick him up and drive back then it wasn’t worth it.” (Cathy)
“I went to the CES today and I was applying for a traineeship and the pay was
$350 per week. They said it was in Hawthorn and by the time I catch a train - I
don’t know how much it is but it’s probably $10 a day - or drive the car then it
costs a hell of a lot. So I won’t take it.” (Linda)
The stories stimulated a general discussion about the ‘costs of working.’ The majority
was unsure whether costs associated with transport, clothing, and wear and tear on one’s
vehicle would cause them to refuse work. However, all agreed that additional costs
would be taken into consideration: “When your budget’s really tight and you’re only
offered low pay then you have to think about it” (Jason).
The Group was asked whether there were other factors that would determine whether a
job was “worth it”. Participants used this expression frequently, and in a range of
contexts, making it important to clarify the intended meaning. A number of points
emerged from this discussion.
Firstly, the loss of DSS benefits and allowances was an explicit factor in decisions about
labour supply - at both the individual and family level. For participants with partners
work decisions were made interdependently.

39
“To think about what I would like to do would be a luxury because you’ve got
no choice but to think about what’s best for the family.” (Cathy)
Secondly, concerns were again focussed on additional allowances and concessions.
When considering the impact of private earnings on DSS entitlements, participants did
not mention the thresholds and taper rates that apply to pensions and the Newstart
Allowance. What they did mention was the loss of Rent Assistance and State
Concessions, reserving their deepest concern for coping without a Health Care Card.
“How will you pay for a prescription if one of your children gets sick”
(Michelle)
“My son’s epileptic and if I lost my Health Care Card (HCC) I couldn’t go back
to paying $19 a script like I used to. I mean if I got a job I’d only be on a low
wage.” (Elena)
Both women stressed that their feelings about paid work would change if they retained
the concessions available to HCC holders.
Nicole’s comments pertained to Rent Assistance: “I’m in a Housing Commission place
so if I was to get a job I’d probably pay the same amount as people renting privately but
I wouldn’t get RA”. Nicole was asked whether this would influence her labour supply
behaviour? “No, but if I could get a job I’d probably be better off renting privately.”
Linda offered a different perspective on ‘worth’:
“You have to remember I’m a mum too…I have to come home and take care of
our kids and give to our kids. I asked my daughter how she’d feel if I went out to
work and she was really crappy with me. I have to take that into account. If I did
work then knowing how she feels would affect me too”.

40
For two members of the Group, government policy on income support has heightened
their “need” and “determination” to get jobs. Both women have children in the 11-15
years age group and will lose their more-than-minimum Family Payment when their
children turn 16. Austudy - available to students aged 16 years or over subject to income
and assets tests - is paid directly to the student16. Elena is anxious and distressed:
“How will we cope when things change? How will we pay the rent and gas and
water? The children think the money is just for them. My son said, “it’s for my
education”. My husband and I have to get jobs by then. We have to get them
somehow or we just won’t cope”.
Given that most participants wished to attain paid employment each person was asked
“How much extra income would you need to receive each week before you were
prepared to take on paid work”? The responses given were $100 (one person), $150
(three), $200 (three) and $250 (one). Supplementary questions established that these
amounts represented the difference between income from paid work and current DSS
payments. The ‘extra’ income was regarded as compensation for additional costs
imposed by work and the loss of non-cash benefits and concessions.
Our discussion of the tax-transfer system was wide-ranging and involved, however
much of the analysis was couched in general or uncertain terms.
“If they take away the extra allowances and then they take away RA you don’t
know how much you’ll be left with.” (Michelle)
“I don’t think the basic wage is much more than what a couple can get on the
dole.” (Jason)
16 On July 1, 1998 a new Youth Allowance will replace AUSTUDY for students under 25 years of age;and the more-than-minimum Family Payment for secondary students aged 16-18 not on AUSTUDY. TheYouth Allowance will be paid directly to young people but a parental means test will apply to dependentyoung people under 21 who are not in full-time education. The AUSTUDY parental means test will beadopted for the Youth Allowance.

41
The extent to which labour supply behaviour is guided by information (as against mis-
information) about the tax-transfer system remains an important research question.
Earlier discussions about the Health Care Card (HCC) presumed a synthesis between
undertaking paid work – whether full-time, part-time or casual – and loss of the HCC.
However, with the exception of one person, Group members did not know the income
test limit that applied to the Card nor could they make a “confident guess”. Participants
readily acknowledged that Centrelink mailed out this information although most found
it “too hard to read” (Michelle). By way of contrast, three people were able to provide
full and accurate details of the thresholds and taper rates applying to the Newstart
Allowance.
To conclude the session, the Group was asked for any comments or views about a goods
and services tax (GST). In general terms, participants were worried about how a GST
would effect the poor and wanted to see “the whole package” before making an
assessment. Elena offered contingent support: “I don’t mind if they put taxes on things
as long as they put the money into schools instead of making us pay for education.”
Robert referred to the New Zealand experience “...their Government keeps increasing
the GST and that makes me very wary”.
7. Group Feedback
Feedback on the Questionnaire and Household Expenses Form was wholly positive.
Participants commented that the instructions were clear and the questions were “easy to
understand”. Most participants were able to fill out both forms in 15-20 minutes, less
than the 30 minutes we had projected. This served to allay fears that the length of the
forms would act as a deterrent to their completion.
The shorter-than-expected completion time related to the spending constraints facing
low-income groups. Most participants recorded zero expenditure for a large number of
spending categories, and income was generally derived from Department of Social
Security payments alone. There was little or no need to calculate income received from
paid work, interest, or dividends. In addition, the tight budgeting behaviour referred to
42
in discussions meant that most participants were highly cognizant of how they spent
their money.
Analysis of the completed questionnaires revealed one significant problem. When asked
to identify their labour force status (Question 1, Part B), most participants did not
understand the technical distinction between ‘unemployed’ and ‘not in the labour force’.
A number of individuals who classified themselves as unemployed also answered
Question 3, Part B: “If you are not in the labour force, how would you describe your
main activity”? The Questionnaire has been altered and now asks the individual whether
or not she/he is actively looking for work. While the discussion sessions enabled us to
discern the labour force status of all participants, for the purpose of providing the group
profiles in Section 4.2, we were not able to use data on the duration of unemployment. A
‘duration’ question was included to provide contextual information for our analysis of
labour supply behaviour.
In future Focus Groups more discussion time will be devoted to taking a recent history
of the labour force participation of each participant. Explicit attention will also be given
to labour supply issues introduced by Group members. These include under-
employment, work for cash-in-hand, and out-working.
As noted in Section 4.2.1, reported income levels suggested that individuals were either
marking their primary government payment on the self-completion form or were not
claiming all allowances to which they were entitled. There were some inconsistencies
between total income and income aggregated by source. Questionnaires to be completed
by future groups will ask the individual to tick all government pensions or benefits he or
she currently receives. With the participant’s permission we will also check
questionnaires on a one-on-one basis.
8. Conclusions
While material gathered from Focus Groups cannot be generalised to a larger
population, it does provide valuable and timely insights into the possible behavioural
43
responses of low-income groups to tax and transfer changes. Conclusions, based on
discussions with six focus groups, will be detailed in a forthcoming Working Paper
(Cowling, 1998). Some preliminary remarks are appropriate at this stage.
Focus Groups identified fruit and vegetables, meat, education, and health and dental
services, as items that had increased in price during the past twelve months. The nature
of attendant consumption adjustments made by ‘Sole Parents’ were markedly similar to
those made by ‘Couples with Dependent Children.’
For both Groups, higher food prices led to reductions in the amount of food purchased,
and limited substitutions in terms of type and brand. To moderate these adjustments
many participants shopped at markets, rather than supermarkets, and rationed their use
of energy and water. In addition, many families delayed or did not seek treatment in
response to the imposition of new charges for dental care and community health
services. The rising cost of education, and changes to the distribution of the Education
Maintenance Allowance, has led to greater dependence on welfare agencies. In some
cases, children were unable to participate in school activities or to enroll in courses
having subject-specific fees.
It is important to note that families did not adjust to changes by dissaving. The vast
majority owed money and used a variety of coping strategies when “the money ran out”
or when ‘unexpected’ expenses arose. These included the partial or deferred payment of
bills, the use of Department of Social Security Advance Payments, requesting help from
family, friends, and welfare agencies, and delaying purchases and repairs.
The task of assessing the impact of tax and welfare reforms on the labour supply of low-
income households is somewhat difficult. The story, as told by Focus Group
participants, is a complex one and attention should be drawn to the range and
interdependence of factors that influenced their mix of paid and unpaid work. These
factors included high effective marginal tax rates, costs associated with working, the
difficulty of combining work and family responsibilities, lack of jobs in the local
unskilled labour market and lack of access to affordable part-day childcare.

44
It is clear that Focus Group discussions have provided some insight into the decision-
making processes of low-income households. It is now important to consider whether
these findings have implications for the current debate on tax and welfare reform, and
the nature of the reform process. The following points can be made.
Firstly, in order to assess the equity effects of proposed reforms, policy-makers need to
look beyond short-run aggregate impacts. Analysis needs to incorporate behavioural
responses, and to examine the precise nature of price changes, household expenditure
patterns, and the distribution of income.
Secondly, debate must pay due regard to the price and income elasticities of low-income
groups with respect to their demand for essential goods and services. Focus Group
participants were noticeably sensitive to changes in the ‘price’ of food, health and dental
services, and education. Restricted access has had a deleterious impact on the wellbeing
of participants and their families.
Thirdly, reductions in the effective marginal tax rates facing low-income groups will
probably encourage some individuals to enter, or re-enter, the labour market. However,
in the absence of a holistic approach to facilitating labour force participation, incentive
effects will be muted. If the diminution of poverty traps is not accompanied by
improved access to unskilled jobs and affordable childcare, many Focus Group
members, particularly women, will remain outside the paid labour force.
Discussions also highlighted the importance of additional government allowances, most
noticeably Rent Assistance and the Health Care Card, to low-income participants. This
suggests that labour supply incentive effects stemming from a lower effective tax rate
will depend on both the amount by which rates are reduced and the means by which the
reduction is achieved.
45
Finally, the experiences of our Focus Group participants provide a cautionary note to
those engaged in the processes of taxation reform. Explaining the consumption and
labour supply behaviour of low-income groups is not the exclusive domain of consumer
choice theory. It is likely that changes in prices and/or income will elicit a behavioural
response. Whether such responses are the result of choices, or whether they are the
result of constraints imposed by institutions or by the condition of being poor, is central
to the formulation of fair and effective policy.

46
Appendices
A.1: Questionnaire
Thank you for helping us with our research project. This questionnaire has 3 parts - Part A, PartB and Part C. Please complete all questions by ticking the appropriate box.The informationwe asking for will be treated as strictly confidential. If you are unsure about how to answer aquestion we can help you before or after the focus group.
Some questions ask for information about yourself and your partner. If you have a partner,please record your details in column 1 and your partner’s details in column 2. If you are singleor a sole parent fill in column 1 only.
***Please bring your completed form to the focus group. ***
PART A
In the first part of this survey we would like to ask some questions about your household.
1. Are you female or male?
2. How would you describe your household type?
Single (person living alone)Sole ParentCouple, no childrenCouple, with children
3. What age group are you in?
Self Partner15-19 years20-24 years25-34 years35-44 years45-54 years55+ years
4. If you have children living at home, please write down the number of childrenyou have in the following age groups.
Number of children aged : 0-5 yrs ____ 6-10 yrs ____ 11-15 yrs ____ 16+ yrs ____
5. What country were you born in?
Self PartnerAustraliaOther English speaking countryNon-English speaking country

47
6. What is your highest level of education?
Self PartnerPrimary schoolSecondary school (year____ )TertiaryTrade qualifications
7. What is your housing situation?Own your homeBuying your home and paying off a mortgageRenting from a government authorityRenting from a private landlordOther ____________________
PART B
We would now like to ask some questions about your labour force status.
1. What is your current labour force status?
Self PartnerEmployed full-timeEmployed part-timeUnemployedNot actively seeking paid work
2. If you have a paid job, how many hours do you usually work each week?
Self Partner1-15 hours16-24 hours25-34 hours35-39 hours40 or more hours
If unemployed, please write down how long you have been unemployed in thecurrent period.
Self _________________Partner _________________
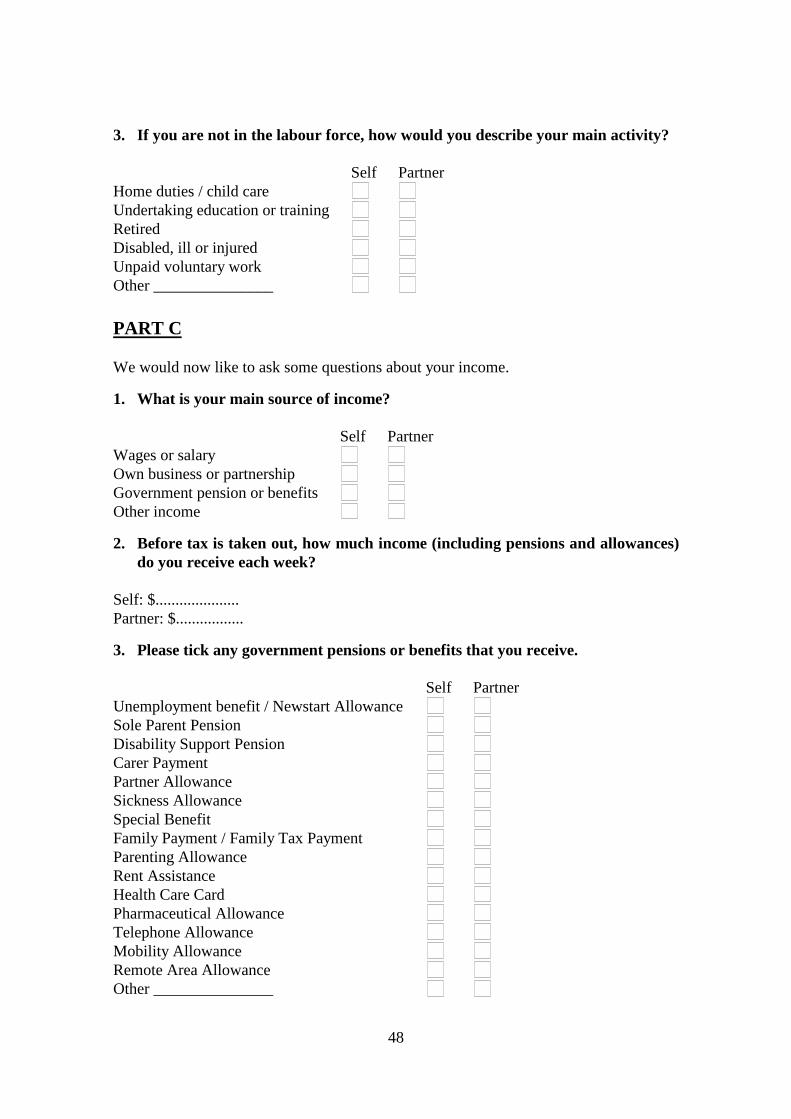
48
3. If you are not in the labour force, how would you describe your main activity?
Self PartnerHome duties / child careUndertaking education or trainingRetiredDisabled, ill or injuredUnpaid voluntary workOther _______________
PART C
We would now like to ask some questions about your income.
1. What is your main source of income?
Self PartnerWages or salaryOwn business or partnershipGovernment pension or benefitsOther income
2. Before tax is taken out, how much income (including pensions and allowances)do you receive each week?
Self: $.....................Partner: $.................
3. Please tick any government pensions or benefits that you receive.
Self PartnerUnemployment benefit / Newstart AllowanceSole Parent PensionDisability Support PensionCarer PaymentPartner AllowanceSickness AllowanceSpecial BenefitFamily Payment / Family Tax PaymentParenting AllowanceRent AssistanceHealth Care CardPharmaceutical AllowanceTelephone AllowanceMobility AllowanceRemote Area AllowanceOther _______________
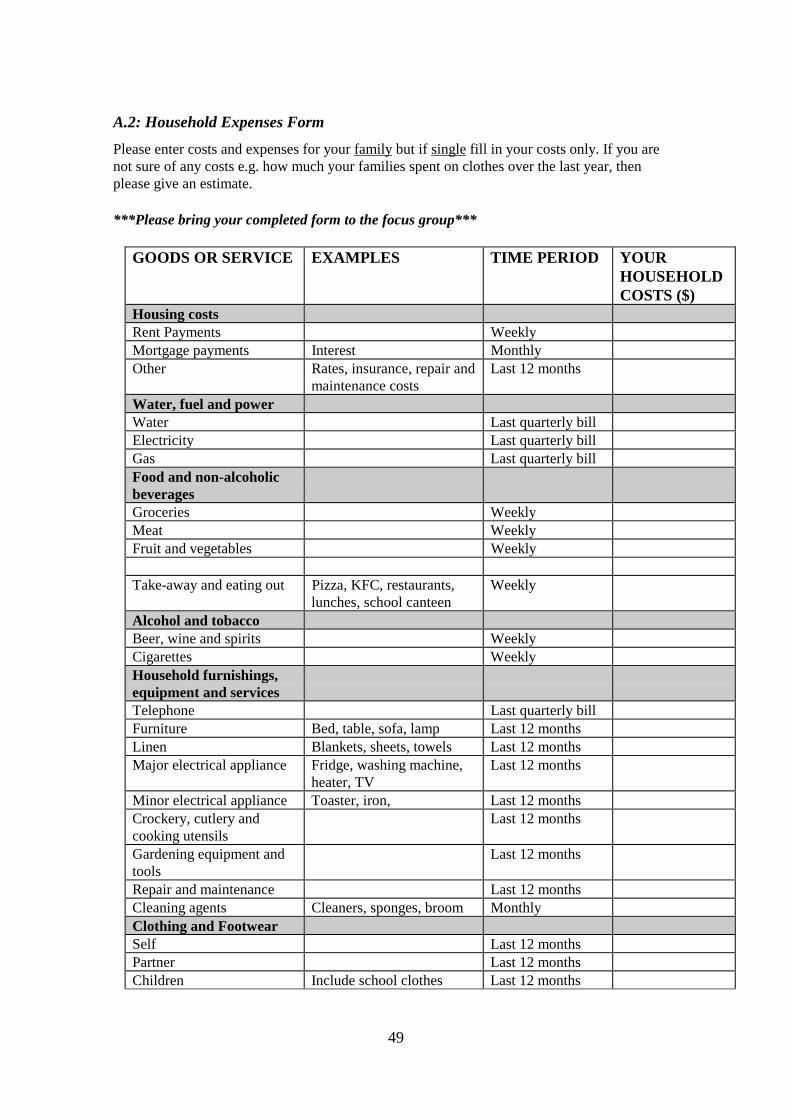
49
A.2: Household Expenses Form
Please enter costs and expenses for your family but if singlefill in your costs only. If you arenot sure of any costs e.g. how much your families spent on clothes over the last year, thenplease give an estimate.
***Please bring your completed form to the focus group***
GOODS OR SERVICE EXAMPLES TIME PERIOD YOURHOUSEHOLDCOSTS ($)
Housing costsRent Payments WeeklyMortgage payments Interest MonthlyOther Rates, insurance, repair and
maintenance costsLast 12 months
Water, fuel and powerWater Last quarterly billElectricity Last quarterly billGas Last quarterly billFood and non-alcoholicbeveragesGroceries WeeklyMeat WeeklyFruit and vegetables Weekly
Take-away and eating out Pizza, KFC, restaurants,lunches, school canteen
Weekly
Alcohol and tobaccoBeer, wine and spirits WeeklyCigarettes WeeklyHousehold furnishings,equipment and servicesTelephone Last quarterly billFurniture Bed, table, sofa, lamp Last 12 monthsLinen Blankets, sheets, towels Last 12 monthsMajor electrical appliance Fridge, washing machine,
heater, TVLast 12 months
Minor electrical appliance Toaster, iron, Last 12 monthsCrockery, cutlery andcooking utensils
Last 12 months
Gardening equipment andtools
Last 12 months
Repair and maintenance Last 12 monthsCleaning agents Cleaners, sponges, broom MonthlyClothing and FootwearSelf Last 12 monthsPartner Last 12 monthsChildren Include school clothes Last 12 months

50
Medical care and healthexpensesVisits to G.P, specialists,dentist
Last 12 months
Alternative health care Naturopath, acupuncture Last 12 monthsPharmaceutical expenses Prescriptions, medicines,
tablets, creamsMonthly
Private Health Insurance MonthlyTransportMotor vehicle - petrol WeeklyMotor vehicle - repairs andmaintenance
Latest service, tyres Last 12 months
Car insurance andregistration
Last 12 months
Bus, train , tram and taxi WeeklyRecreationSport costs Lessons, fees, equipment Weekly
Outings Movies, football, zoo MonthlyVideos, CDs, magazines WeeklyGambling Poker machines, TAB, lotto WeeklyPersonal care productsToiletries, personal care Soap, shampoo, haircuts,
toothpaste, moisturiserMonthly
Other goods and servicesChild care costs WeeklyEducation costs Fees, books, excursions Last 12 monthsFinancial institution feesand charges
Account keeping charges,charges for using ATMs orEFTPOS
Debt repayments(Do NOT include homemortgage payments)
Interest payments on loansand credit cards, repayingmoney borrowed fromfamily or friends
Monthly
Child maintenancepayments
Monthly
Other major costs New / second-hand car, Last 12 monthsIncome tax Last 12 monthsSuperannuation and lifeinsurance
Last 12 months

51
References
Australian Bureau of Statistics (1997a),Australian Social Trends 1997, Catalogue No.4102.0, Canberra.
Australian Bureau of Statistics (1997b),Income Distribution Australia 1995-96,Catalogue No. 6523.0, Canberra.
Australian Bureau of Statistics (1997c),Labour Force Australia, Catalogue No. 6204.0,Canberra.
Australian Bureau of Statistics (1996),1993-94 Household Expenditure Survey,Australia, Summary of Results, Catalogue No. 6530.0, Canberra.
Australian Bureau of Statistics (1993),An Introduction to Sample Surveys - A User’sGuide, Catalogue No. 1202.2, Canberra.
Australian Commonwealth Ombudsman (1998), “Child Support Overpayments: A caseof give and take?”Report under section 35A of the Ombudsman Act 1976, Canberra.
Bourque, L. and E. Fielder (1995),How to Conduct Self-administered and Mail Surveys,California: Sage.
Brownlee, H. (1985), “Poverty Traps”, AustralianTax Forum, vol.2, no.2, 161-172.
Campbell, H.F. and K. Bond (1997), “Effective Marginal Tax Rates in Australia”,Economic Analysis and Policy, vol.27, no.2, September, 151-158.
Centrelink (1988), “Centrelink Commonwealth Government Payment Rates – 20 Marchto 30 June 1998”, no.PR087.9801, Canberra.
Cowling, S. (1998) “Understanding Behavioural Responses to Tax and TransferChanges – A Survey of Low-income Households. Paper 2”,Melbourne Institute ofApplied Economic and Social Research Working Paper, forthcoming.
Crompton, C. (1987), “Survey of Understanding of Social Security Income Tests bySole Parent Pensioners”,Social Security Journal, Winter, 28-37.
Department of Human Services, Victoria (1988), “State Concessions – YourEntitlements”, no.1000198, Melbourne.
Department of Social Security (1997), “Money in Advance - What is an AdvancePayment”, no.PR674.9701, Canberra.
Harding, A. and J. Polette (1995), “The price of means-tested transfers: effectivemarginal tax rates in Australia in 1994”,Australian Economic Review, 3rd Quarter,100-106.

52
Ingles, D. (1997), “Low Income Traps for Working Families”, Centre for EconomicPolicy Research Discussion Paper No. 363, Australian National University.
Johnson, D., Freebairn, J., Creedy, J., Scutella, R. and Cowling, S. (1997)A Stocktake ofTaxation in Australia, Report No. 1 of Tax Reform: Equity and Efficiency, MelbourneInstitute of Applied Economic and Social Research, University of Melbourne.
Moser, S. and G. Kalton (1971),Survey Methods in Social Investigation, London:Heinemann.
Neale, J. (1989),The Use of Small Group Interviews, Department of Sociology andSocial work, Victoria University of Wellington, New Zealand.
Probert, B. and F. McDonald (1996),The Work Generation - Work and Identity in theNineties, Brotherhood of St Laurence: Melbourne.
Puniard, A. and C. Harrington (1993) “Working through the Poverty Traps: Results of aSurvey of Sole Parent Pensioners and Unemployment Beneficiaries”,Social SecurityJournal, December, 1-17.
Saunders, P. (1989), “Commentary on Trethewey” in D. Ironmonger (ed.),HouseholdWork, 146-148, Allen and Unwin: Sydney.
Siemon, D. (1997), “Half as big, twice as complex”,Brotherhood Comment, July.
Taylor, J. (1997), “Notes on undertaking focus groups”, paper presented to the FocusGroup Workshop, May 8, Brotherhood of St Laurence.