understanding key principles (& math) that link team
TRANSCRIPT
Understanding Key Principles (& Math) that Link Team Effectiveness & Staffing Plans
Lynn Hill Spragens, MBASpragens & Gualtieri-ReedConsultant to [email protected]
May 30, 2019

Join us for upcoming CAPC events➔ Upcoming Webinars:
– Billing and Coding for Advance Care Planning: How to Document Services Correctly to Reflect your Productivity
Tuesday, June 11 at 12:30pm ET– BRIEFING: Key Findings From the Latest CAPC Research on Attitudes
and Perceptions of Palliative CareThursday, July 18 at 12:30pm ET
➔ Virtual Office Hours: – Improving Team Effectiveness *today*Thursday, May 30 at 4:00pm ET– Marketing to Increase ReferralsMonday, June 10 at 12:30pm ET
Register at www.capc.org/events/
2

Understanding Key Principles (& Math) that Link Team Effectiveness & Staffing Plans
Lynn Hill Spragens, MBASpragens & Gualtieri-ReedConsultant to [email protected]
May 30, 2019

Overview➔Introduction to useful business math to
help with growth staffing plans
➔Scenario building with micro data (local) to compare to macro data (RegistryTM)
➔Principles that strengthen approaches to budgeting
4

Questions I dread…➔What is a good RVU target for palliative
care?➔How many consults should an MD see
each year?➔What is the right staffing model?➔What is the benchmark for x, y, z?
5
My answer
“It depends…”
6

Some Examples of VariationVariables Why it mattersSize & Complexity of site (s)
Consider an 80 bed well run community hospital & a 1000 bed AMC covering 5 city blocks…how long does it take to get to each new consult? Find the referring MD? For small places: Minimum critical mass = some down time
Volume of training & teaching
Fellows (net positive?), Residents (important but time consuming), complexity of systems, more handoffs, fewer full time clinical ftes, etc.
Culture Private attendings? Big hospitalist groups? +/- of ”ownership” of patients, engagement of specialists, continuity options in community, focus on FFS only
IDT within team and in site
Some places have good resources in SW, Spiritual Care, Pain, Ethics, Care Management, Administrative Support….Some teams have great IDT karma
Complexity of Team, Leadership Q
Same FTEs can = different # of people (many pieces and handoffs), Lack of smooth systems reduces effectiveness. Chaos increases burnout & reduces capacity.
7

Our Focus Today
“Know Thyself” – Leadership skills to better manage within the team, use the math to help de-mystify discussions, and to reduce chaos.➔ This helps the team make good
decisions, be self aware, and➔ Sets you up well for budgets and
planning
8

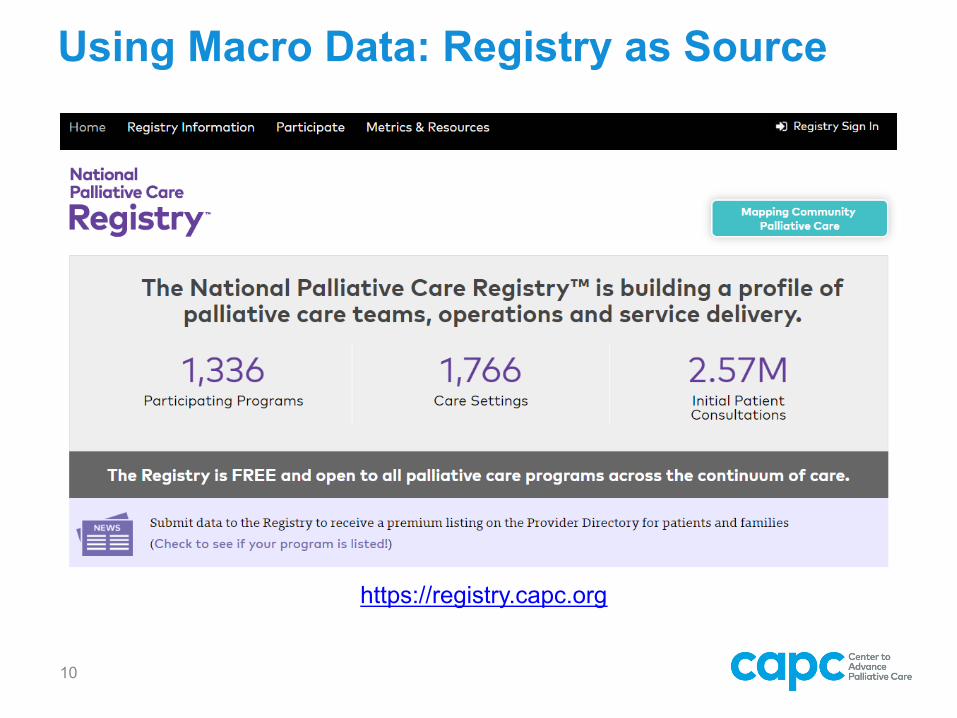
Micro & Macro Data
Macro:National Comparisons, Research results, trends
Micro:"Your place", real examples, impact with "face validity", specific focus areas, specific collaborators
9
Example: We should be able to grow by 1000 additional patients to be in top quartile nationally (Macro)…
We have identified these priority opportunities with oncology, SICU, and telemetry and will focus on them for growth (Micro)

Use this to model comparative performance Baseline vs. Budgeted (Scenarios)
11
Impact Calculator

Caution & Opportunity
➔ RegistryTM data is by definition a “lagging indicator” – it reports what programs were actually doing 1-2-3 years ago.
➔ You are hopefully evaluating “now” and projecting forward.
➔ Most programs are growing/hiring/stressed/still evolving
Thus, it is not a “benchmark” for the future!
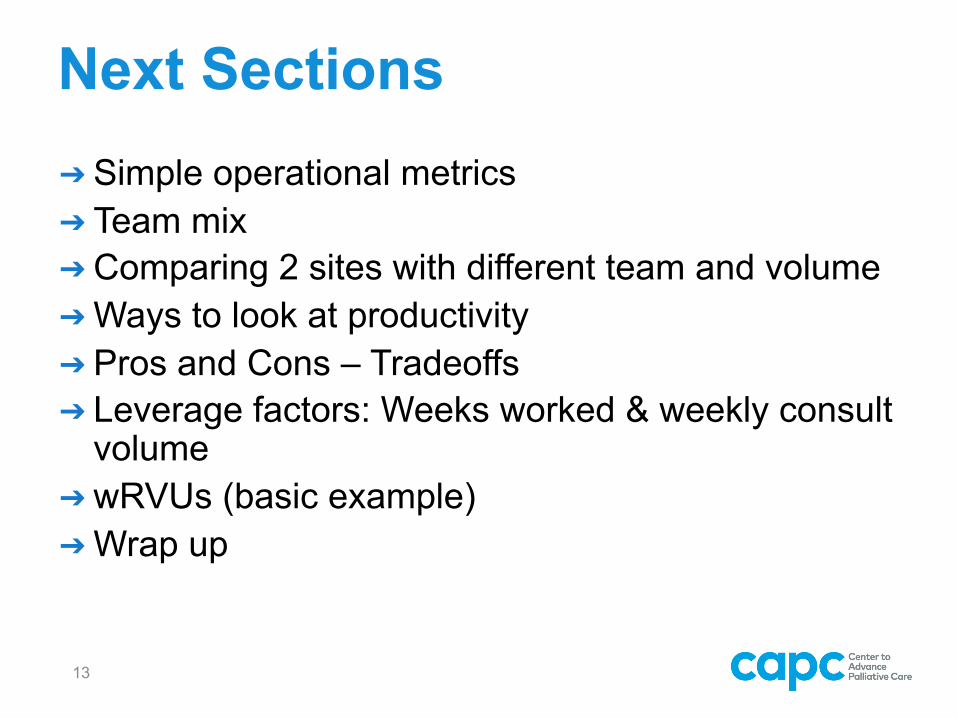
Next Sections➔Simple operational metrics➔ Team mix ➔Comparing 2 sites with different team and volume➔Ways to look at productivity➔Pros and Cons – Tradeoffs➔ Leverage factors: Weeks worked & weekly consult
volume➔wRVUs (basic example)➔Wrap up
13

Useful Measures Over TimeCosts:➔ (Direct costs – billing revenue) / Patients = cost per “episode of care” or
“per consult” – This is the cost to compare to expected benefits or savings
➔ Average cost per FTE
Effectiveness / Productivity?➔ Consults per IDT FTE ➔ Consults per MD + NP (or per MD?)➔ F/U visits (billable and non-billable)
Quality & Impact: ➔ Early, Appropriate, Timely, Thorough, ➔ New Impact through Added Capacity
14

Where is the best balance of team mix &
capacity?Example: Impact of Team Mix on Ave. Cost per FTE.
Salary rates are placeholder estimates.
Staffing Roles Est. Full Time Salary
Sal + benefits Site #1 FTE Site # 1 Total
Staff Costs Site #2 FTE Site #2 Total Staff Costs
Benefit rate 29%
Physician $220,000 $283,800 2.0 $567,600 2.5 $709,500Nurse Practitioner $105,000 $135,450 1.5 $203,175 3.0 $406,350Nurse Coordinator $85,000 $109,650 0.0 $0 1.0 $109,650LCSW / Social Work $60,000 $77,400 0.5 $38,700 3.0 $232,200Chaplain $60,000 $77,400 0.5 $38,700 2.0 $154,800Pharmacist $100,000 $129,000 0.0 $0 0.0 $0
Total Staffing FTES and Cost 4.5 $848,175 11.5 $1,612,500
Weighted Average cost per fte $188,483 $140,217
Percentage Change in Cost per FTE between 2 Scenarios -26%
Team Mix & Costs Change with Growth

2 Sites: What are the Tradeoffs?
16
Comparisons & Stats Site 1 Site 2 Change
Total Annual inpatient Admissions 30,000 30,000 =Total Inpatient Palliative Care New Patients (Consults) 1,000 2,000 ↑ 200%
Total IDT FTEs 4.5 11.5 ↑ 255%Penetration Rate (Consults/Admissions) 3.3% 6.7% ↑Penetration Rate Quartile** Q2 (below midpoint Q4 (top quartile)
IDT FTEs per 10,000 Admissions 1.5 3.8 ↑Staffing per 10,000 Quartile** Q 1 (lowest) Q4 (top quartile)
Ave. Cost per Consult (FTE cost/volume) $ 848.18 $ 806.25 ↓Est. Billing Rev per Consult* $ 340.00 $ 340.00 =Ave. Cost per Consult Net of Billing $ 508.18 $ 466.25 ↓*Assumption that Team 1 has higher % MD, but Team 2 has more f/u.
**Stats from National Palliative Care RegistryTM & CAPC Impact Calculator https://www.capc.org/impact-calculator/

RegistryTM Data: Observations?
17
0
11.4
2 2.1
3.6
5.4
7.7
0
1
2
3
4
5
6
7
8
9
MEASURE Q1 25th % Q1 Median Q2 Median Q3 Median Q4 Median Q4 75th% Q4 90th% YOUR DATA
IDT FTEs per 10,000 Admissionsby Penetration Quartiles
from 2016 National Registry (2015 data)

2018 Report on 2017 Data
18
https://registry.capc.org/wp-content/uploads/2018/07/2017_Findings_Slides.pdf

Different Views of Workload or Productivity
Consults per FTE Patterns Site 1 Site 2 Comparison
Total MD + NP FTEs 3.5 5.5Total IDT FTES 4.5 11.5Consults per MD + NP FTE 286 364 ↑Consults per IDT FTE (all) 222 174 ↓Consults per WEEK (site 2 is twice the vol) 19 38Consults per WEEK per MD + NP FTE * 5.5 7.0
*Assumes 52 weeks; actual staff available will be less given leave.
19
What are the pros & cons? Challenges?
Opportunities?

Factors Impacting Smaller TeamsPROs CONsEasier to communicate across team about patients
Talking to yourself; lack of IDT perspective
Scheduling is more simple Full coverage is much harder; GAPS in coverage; less options to adjust to very busy days or weeks
Often “split the list” – divide and conquer
Handoffs when you go off service are more disruptive
Don’t need much formality of process
Unrecognized variation across team, possibility of new team member stress
Founder/leader credibility Harder to introduce new team members for handoffs or new referrals
Easy to see everyone is busy and utilized
Lack of capacity for proactive outreach & dedicated presence, roles
20

Factors impacting Larger teamsPROs CONsMore diverse perspectives from IDT More need for formal processes, meetings,
handoffs to communicate & have efficient flow
Flexible roles & greater # = easier to make adjustments for “busy” days
Need for a coordinator or traffic control to organize the list, deploy, and check in
Scheduling coverage for 52 weeks and weekends can be more viable & consistent
It doesn’t happen by magic; need for norms, systems, team etiquette, and management
Team can cross cover with less “founder syndrome”
Still need consistency and quality of communication, process, documentation, relationship
IDT mix allows more coverage/capacity for comparable costs, recruitment may be easier
More complicated budgeting & politics (who reports where, which dollars can fund which roles)
More f/u activity is possible Non-billable activity may be invisible
21

Dilemma
➔There is not a “right” answer.
➔Consider the tradeoffs to optimally meet needs and manage within resources, or with additional resources.

Tradeoffs: Weeks Worked vs. Consults per Week
Model: SAMPLE workload for a full time MD or APN fte
Weeks on service per year 40 40 35 35
Days of service per week on service 5 5 5 5
Estimate of Ave. New Consults per WEEK on service 8 10 8 10
Estimate of Ave F/U visits per new consult 2.5 2.5 2.5 2.5
Ave. Subsequent Visits per WEEK on service 20 25 20 25
Total New Patient Consults / Year / Per Provider 320 400 280 350
Difference in Annual Total Consult Volume between weekly Average of 8 vs. 10 New 80 70
Difference between 40 week vs. 35 week models 40 50
Average New Consults / "worked day" per provider 1.6 2 1.6 2
Likely RANGE of New Consults / day 0 to 4? 1 to 6? 0 to 4? 0 to 4?
Average # of f/u visits per day per provider (5 day) 4 5 4 5
Likely RANGE of f/u per day 3 to 12? 2 to 10? 3 to 12? 3 to 12?

Question➔Under what assumptions or conditions
would people prefer to work more weeks with lower volume or fewer weeks with more volume?
➔Could this be used to help figure out weekend coverage, also?
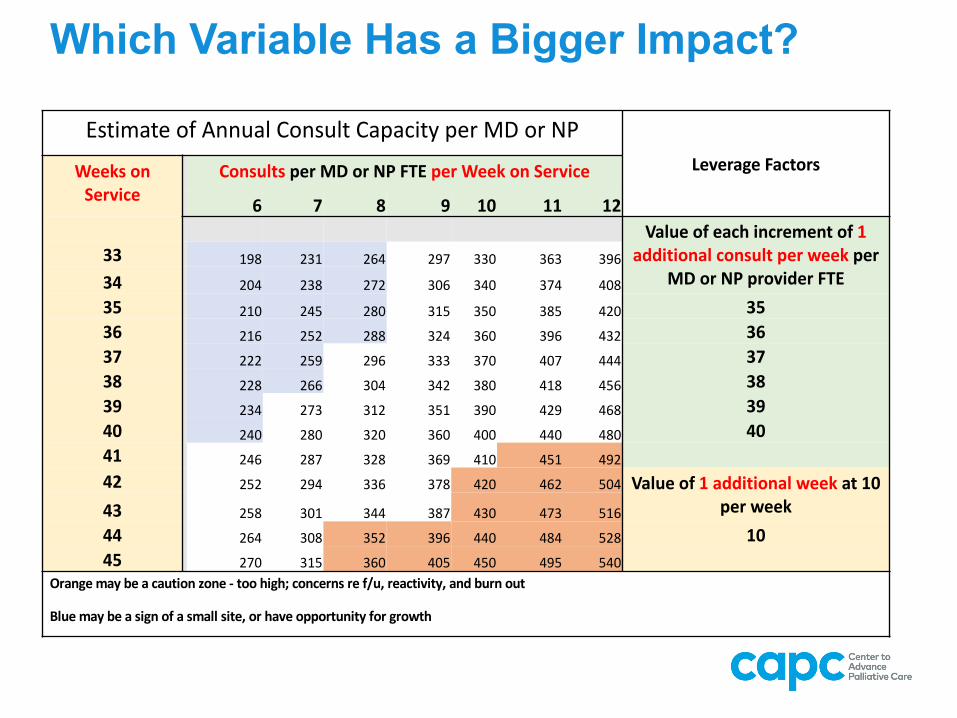
Which Variable Has a Bigger Impact?
Estimate of Annual Consult Capacity per MD or NPLeverage FactorsWeeks on
Service
Consults per MD or NP FTE per Week on Service
6 7 8 9 10 11 12
Value of each increment of 1
additional consult per week per
MD or NP provider FTE
33 198 231 264 297 330 363 39634 204 238 272 306 340 374 40835 210 245 280 315 350 385 420 35
36 216 252 288 324 360 396 432 36
37 222 259 296 333 370 407 444 37
38 228 266 304 342 380 418 456 38
39 234 273 312 351 390 429 468 39
40 240 280 320 360 400 440 480 40
41 246 287 328 369 410 451 49242 252 294 336 378 420 462 504 Value of 1 additional week at 10
per week43 258 301 344 387 430 473 51644 264 308 352 396 440 484 528 10
45 270 315 360 405 450 495 540Orange may be a caution zone - too high; concerns re f/u, reactivity, and burn out
Blue may be a sign of a small site, or have opportunity for growth
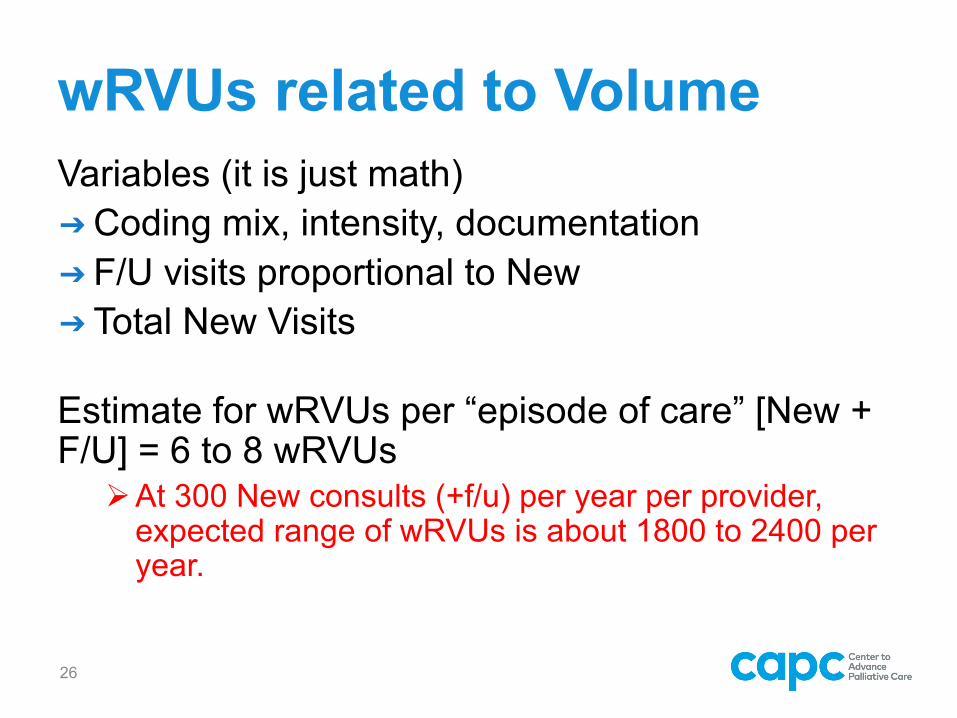
wRVUs related to VolumeVariables (it is just math)➔Coding mix, intensity, documentation➔F/U visits proportional to New➔Total New Visits
Estimate for wRVUs per “episode of care” [New + F/U] = 6 to 8 wRVUs
ØAt 300 New consults (+f/u) per year per provider, expected range of wRVUs is about 1800 to 2400 per year.
26

Different ways to Evaluate a Service or Department➔Cost Center (generates expense, not
revenue) strategy – keep it as small as possible, as long as it can do its function.
➔Profit Center (generates contribution margin) Expand as long as margin is positive or until return is less than an alternative use of capital.

Food for Thought➔If ”cost per patient served” is $300-$800
and current volume of service is at 3% of admissions,
➔What is the likelihood that more patients need palliative care?
➔Likelihood that “contribution margin” is positive (>cost)?– Would growth yield Positive Financial Result?

Cautions & Practicality➔Anchor to national reference points, but lead
with local specifics and examples– “Analysis of high risk discharges with no palliative
care involvement indicate significant need on x, y, z service or unit. Here is what we propose to do, and some simple metrics to track impact.”
– ”With proposed staffing structure, we will be able to add weekend coverage, thus expediting GOC and critical work 2-3 days earlier for patients impacting LOS and inpatient mortality.”
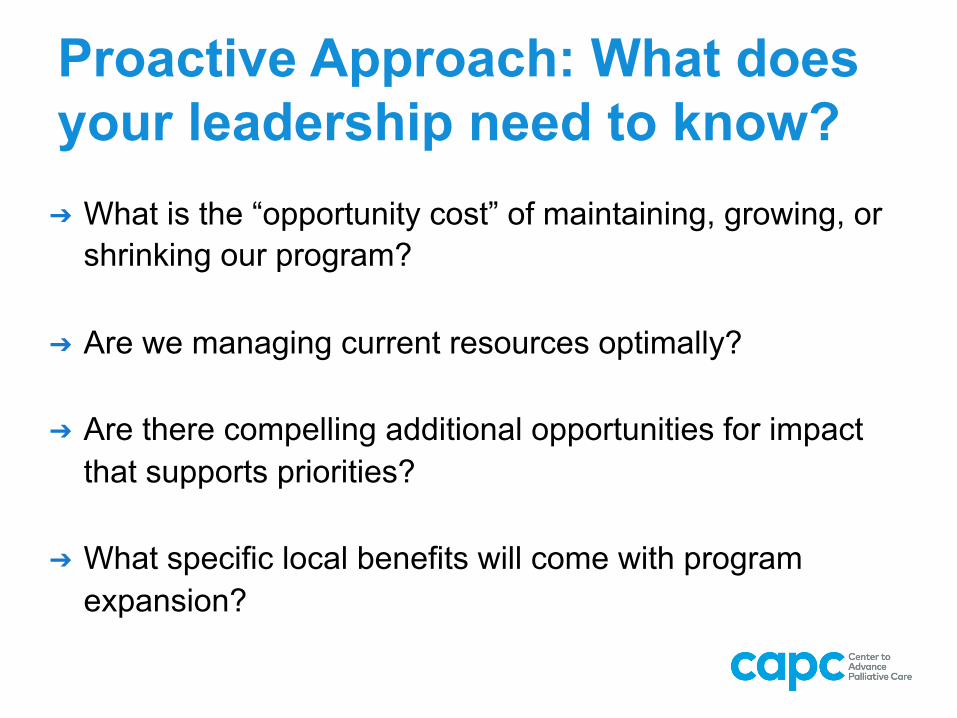
Proactive Approach: What does your leadership need to know?➔ What is the “opportunity cost” of maintaining, growing, or
shrinking our program?
➔ Are we managing current resources optimally?
➔ Are there compelling additional opportunities for impact that supports priorities?
➔ What specific local benefits will come with program expansion?

“Know Thyself” (& why your team does what it does how it does it)
➔ It demonstrates accountability
➔ It anchors your recommendations and requests
➔ It makes it easier to match offers and growth with resource requirements

Ex: Using Models for Planning
32
Example: Multi-Year Budget for Site 1
Staffing Roles
Est. Full
Time
Salary
Sal +
benefits CURRENT 2019 PROPOSED 2020 PROPOSED 2021
Benefit rate assump. 29%
Physician $220,000 $283,800 2.0 $567,600 2.0 $567,600 2.5 $709,500
Nurse Practitioner $105,000 $135,450 1.5 $203,175 2.0 $270,900 3.0 $406,350
Nurse Coordinator $85,000 $109,650 0.0 $0 1.0 $109,650 1.0 $109,650
LCSW / Social Work $60,000 $77,400 0.5 $38,700 1.0 $77,400 3.0 $232,200
Chaplain $60,000 $77,400 0.5 $38,700 1.0 $77,400 2.0 $154,800
Pharmacist $100,000 $129,000 0.0 $0 0.0 $0 0.0 $0
Total Staffing Cost 4.5 $848,175 7.0 $1,102,950 11.5 $1,612,500
Weighted Average cost per fte $188,483 $157,564 $140,217
New Patient Volume (consults) 1,000 1,300 2,000
Penetration Rate (Consults/ Admissions) 3.3% 4.3% 6.7%
IDT Staffing per 10,000 Admissions 1.5 2.3 3.8
Penetration Rate - CAPC Quartile second third top
IDT Staffing - CAPC Quartile bottom middle top
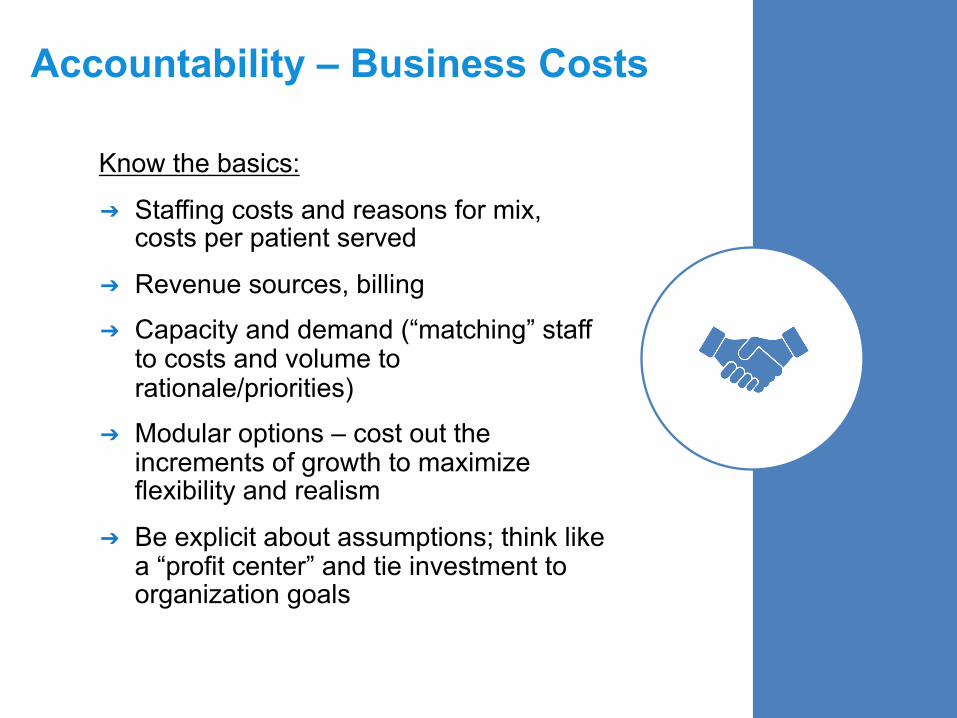
Accountability – Business Costs
Know the basics:
➔ Staffing costs and reasons for mix, costs per patient served
➔ Revenue sources, billing
➔ Capacity and demand (“matching” staff to costs and volume to rationale/priorities)
➔ Modular options – cost out the increments of growth to maximize flexibility and realism
➔ Be explicit about assumptions; think like a “profit center” and tie investment to organization goals

CAPC Tools to help you➔National Palliative Care Registry™
https://registry.capc.org(comparative data on staffing, volume, characteristics, and custom reports with your data – if you participate)
➔CAPC Impact Calculatorhttps://www.capc.org/impact-calculator/(combines budget assumptions, Registry data, and cost savings to help evaluate/plan for growth)
34

Questions?
Please type your question into the questions pane on your WebEx control panel.
