understanding particulate coating microstructure development
TRANSCRIPT

Understanding Particulate Coating Microstructure
Development
A DISSERTATION
SUBMITTED TO THE FACULTY OF THE GRADUATE SCHOOL
OF THE UNIVERSITY OF MINNESOTA
BY
Christine Cardinal Roberts
IN PARTIAL FULFILLMENT OF THE REQUIREMENTS
FOR THE DEGREE OF
DOCTOR OF PHILOSOPHY
Lorraine F. Francis, Adviser
September, 2010

© Christine Cardinal Roberts 2010
ALL RIGHTS RESERVED

i
ACKNOWLEDGEMENTS
I was fortunate to initiate this thesis research under the guidance of two advisers:
professors Lorraine Francis and L.E. Skip Scriven. Those who have worked with Skip
remember him first as a man who loved advising. He gave me an incredible amount of
attention when I was still just a neophyte, and he demanded from the very beginning that
I follow his standards of research. He taught me to learn my history and to present
clearly, starting with fundamentals. He also gave me confidence by including me in
discussions with visitors even before I knew anything and sticking up for my questions
and comments. Lorraine balanced Skip. She showed me that it was possible to question
him, and that all of his ideas were not equal. Her vote in group meeting made our
relationship a democracy, not a dictatorship. When Skip passed away, I was sad. I owe
it to Lorraine that I was not scared. In the years since, she has trusted me with the
freedom to solve numerous research problems in many interesting, sometimes untested,
ways. Through their guidance and support, I have accomplished more in these five years
than I could have ever hoped.
To join the Coatings Process Fundamentals Program is to join a family. Thank
you to my fellow researchers who helped me with experiments, data analysis, and mental
health. Special thanks go to the cryogenic microscopists: Haiyan Ge, Xiaobo Gong, Hui
Luo, and Katie Crawford, and the stress-measurer: Karan Jindal. To the computationalists
who sat through my CPFP presentations and asked questions regardless: you are great
people. I am also indebted to past CPFP graduates, too many to name, whose theses I
have studied, who have donated samples and thoughts, and who have welcomed me as a
cousin at conferences. Professor Ishi Talmon, in particular, invited me to spend a month
at the Technion Institute in Israel to study for a month. If I can pass these kindnesses
forward to those CPFP researchers of the future, I will.
I am going to miss not having a world class university stocked with friendly
experts at my fingertips. In particular, professors Satish Kumar, Ted Davis, and William
Gerberich always had an open door for me. Wieslaw Susynski and David Giles were
fantastic resources for experiment design. I am grateful to John Nelson and Jinping Dong

ii
at the Characterization Facility who patiently taught me many experimental techniques.
Special thanks go to Chris Frethem who was my authority on cryoSEM and Minnesota
outdoor adventure.
The Interfacial Partnership for Research in Interfacial and Materials Engineering
has not only brought me financial support, but also assurance that my research was
relevant to real industrial problems. I’ve been fortunate to have had the opportunity to
work with numerous industrial coatings engineers, through IPRIME and otherwise. Gary
Dombrowski of Rohm and Haas and Ray Drumright of Dow Chemical were especially
helpful with my work on hollow latex. Thanks also to Maria Nargiello and Matt Linares
of Evonik who brought the cracking of soft latex coatings to our attention.
My friends and, in particular, my roommates, Aaron Beaber, Dan Bolintineanu,
Dave Ellison, and Derek Stevens, provided moral support and constant entertainment.
Thanks, also, to everyone who spent their Saturday mornings doing homework with me.
Finally, I would like to thank my family. My parents are two engineers who tried
hard but couldn’t help but raise three more engineers. I honestly think that the endless
craft projects that they let me do on the dining room table as a child taught me more
about how to be an experimentalist than anything I learned in college. Thanks for
believing in me, and for letting me go so far away from home to follow my dreams. To
my husband, Scott Roberts, who drove me around Minneapolis on my first visit to this
department and convinced me that I would be happy here: you were right. Scott learned
very quickly, through trial by fire, when to help me work out a thought, when to distract
me, and when to just let me brood alone. He was the cheerful first proofreader of this
thesis and countless other documents and presentations. I am so thankful for all of his
input on this research, and many other things, besides.
So long, and thanks for all the coffee.

iii
ABSTRACT
How a dispersion of particulates suspended in a solvent dries into a solid coating
often is more important to the final coating quality than even its composition. Essential
properties like porosity, strength, gloss, particulate order, and concentration gradients are
all determined by the way the particles come together as the coating dries. Cryogenic
scanning electron microscopy (cryoSEM) is one of the most effective methods to directly
visualize a drying coating during film formation. Using this method, the coating is
frozen, arresting particulate motion and solidifying the sample so that it be imaged in an
SEM.
In this thesis, the microstructure development of particulate coatings was explored
with several case studies. First, the effect of drying conditions was determined on the
collapse of hollow latex particles, which are inexpensive whiteners for paint. Using
cryoSEM, it was found that collapse occurs during the last stages of drying and is most
likely to occur at high drying temperatures, humidity, and with low binder concentration.
From these results, a theoretical model was proposed for the collapse of a hollow latex
particle. CryoSEM was also used to verify a theoretical model for the particulate
concentration gradients that may develop in a coating during drying for various
evaporation, sedimentation and particulate diffusion rates. This work created a simple
drying map that will allow others to predict the character of a drying coating based on
easily calculable parameters. Finally, the effect of temperature on the coalescence and
cracking of latex coatings was explored. A new drying regime for latex coatings was
identified, where partial coalescence of particles does not prevent cracking. Silica was
shown to be an environmentally friendly additive for preventing crack formation in this
regime.

iv
TABLE OF CONTENTS
LIST OF TABLES…………………………………………………………………..vii
LIST OF FIGURES…………………………………………………………………viii
1. INTRODUCTION……………………………………………………………… 1
1.1 INTRODUCTION AND MOTIVATION …………………………….. 1
1.2 THESIS OVERVIEW …………………………………………………. 4
2. BACKGROUND ………………………………………………………………. 7
2.1 LATEX ………………………………………………………………... 7
2.2 LATEX FILM FORMATION…………………………………………. 9
2.2.1 Stage 1: Consolidation……………………………………….. 9
2.2.2 Stage II: Compaction and Deformation……………………… 13
2.2.3 Stage III: Interdiffusion……………………………………….18
3. EXPERIMENTAL METHODS…………………………………………………20
3.1 INTRODUCTION…………………………………………………….. 20
3.2 CRYOGENIC SCANNING ELECTRON MICROSCOPY………….. 21
3.2.1 Plunge Freezing Into Liquid Ethane…………………………. 22
3.2.2 High Pressure Freezing……………………………………… 25
3.3.3 Common Artifacts in CryoSEM Samples…………………….. 26
3.3 MINIMUM FILM FORMATION TEMPERATURE BAR…………… 33
3.4 CANTILEVER STRESS MEASUREMENT TECHNIQUE………….. 34
3.4.1 Background…………………………………………………... 34
3.4.2 Stress Measurement Apparatus and Procedure……………… 36
3.4.3 Weight Loss…………………………………………………... 38
3.4.4 Limitations of the Stress Measurement Technique…………... 40
4. EDGELESS COATINGS………………………………………………………. 42
4.1 INTRODUCTION AND MOTIVATION…………………………….. 42
4.2 BACKGROUND: DIP COATING CYLINDERS……………………. 44
4.3 METHOD PROCEDURE…………………………………………….. 45
4.3.1 Preconditioning……………………………………………….46
4.3.2 Dip Coating…………………………………………………... 47
4.3.3 Fracture……………………………………………………… 47
4.3.4 Preparing the Sample for Imaging…………………………... 49
4.4 RESULTS AND DISCUSSION………………………………………. 49

v
5. DRYING AND COLLAPSE OF HOLLOW LATEX…………………………..56
5.1 INTRODUCTION……………………………………………………... 56
5.2 MATERIALS AND METHODS……………………………………… 60
5.2.1 Latex Samples………………………………………………... 60
5.2.2 Cryogenic Scanning Electron Microscopy…………………... 62
5.2.3 Study of Process Variables………………………………….. 63
5.3 EXPERIMENTAL RESULTS……………………………………….. 64
5.3.1 Drying Rates of Hollow Latex………………………………...64
5.3.2 CryoSEM of Hollow Latex Drying and Collapse……………. 67
5.3.3 Effect of Drying Environment on Collapse……………………76
5.4 DISCUSSION…………………………………………………………. 80
5.4.1 Drying of a Nonporous Hollow Latex Particle………………. 80
5.4.2 Drying of a Nonporous Hollow Latex Shell with Binder……. 86
5.4.3 Drying of a Porous Hollow Latex Shell……………………… 86
5.5 CONCLUSIONS………………………………………………………. 87
A: MODEL FOR THE DRYING OF A HOLLOW LATEX PARTICLE.. 89
6. DISTRIBUTION OF SOLIDS IN PARTICULATE COATINGS……………… 91
6.1 INTRODUCTION……………………………………………………... 91
6.2 DRYING MODEL……………………………………………………... 96
6.3 METHODS…………………………………………………………….. 99
6.3.1 Numerical Solution Method…………………………………. 99
6.3.2 Experimental Methods………………………………………. 99
6.4 RESULTS AND DISCUSSION……………………………………….. 101
6.4.1 Numerical Results……………………………………………. 101
6.4.2 Experimental Results………………………………………... 108
6.5 SUMMARY……………………………………………………………. 116
7. CRACKING IN SOFT LATEX COATINGS…………………………………... 118
7.1 INTRODUCTION AND MOTIVATION……………………………... 118
7.2 METHODS AND MATERIALS……………………………………… 123
7.2.1 Materials……………………………………………………... 123
7.2.2 Cantilever Beam Stress Measurement……………………….. 123
7.2.3 Cryogenic Scanning Electron Microscopy…………………... 124
7.2.4 Crack Spacing Measurements……………………………….. 125
7.3 RESULTS AND DISCUSSION………………………………………. 125
7.3.1 Macroscopic Appearance…………………………………… 125
7.3.2 Microstructure Development………………………………... 128
7.3.3 Stress Development………………………………………….. 137
7.3.4 Cracking……………………………………………………... 140
7.4 CONCLUSIONS……………………………………………………… 144

vi
8. FUTURE DIRECTIONS: SOLUBLE BINDER AND RAMAN MICROSCOPY
8.1 INTRODUCTION……………………………………………………... 146
8.2 PRINCIPLES OF RAMAN MICROSCOPY………………………….. 149
8.3 PROOF OF CONCEPT………………………………………………... 151
8.4 CONCLUSION………………………………………………………… 154
REFERENCES……………………………………………………………………...156

vii
LIST OF TABLES
1.1 Common particulate coatings………………………………………………….. 2
5.1 Latex properties…………………………………………………………………61
5.2 Coating formulations explored………………………………………………….61
5.3 Void state as determined through particle fracture…………………………….. 72
5.4 Effect of drying conditions on collapse………………………………………... 77
6.1 Effects of experimental variables on Pe and Ns………………………………... 100
6.2 Experimentally explored coating conditions…………………………………... 108
7.1 Materials properties……………………………………………………………. 123
7.2 Do particles deform in the wet stage? …………………………………………. 137
viii
LIST OF FIGURES
1.1 Composition of a typical particulate coating................................................... 2
1.2 Illustrations of various possible microstructures for a particle (blue), polymer (red)
system, including (from left to right) segregated and ordered particles, a homogeneous
and random packing, binder migration to the top of the coating, and sedimentation of
particles to the bottom of a polymer rich coating……………………………….... 3
2.1 In the consolidation phase, particles concentrate as evaporation occurs from a flat
water-air interface…………………………………………………………………..10
2.2 CryoSEM cross section image of a drying coating containing monodisperse silica
particles in water. A consolidation front of concentrated particles is apparent at the top
surface. Pe = 125 for these drying conditions……………………………………... 11
2.3 CryoSEM image of the cross section of a drying monodisperse silica/water coating.
Silica particles have ordered in a hexagonal array…………………………………. 12
2.4 In the compaction phase, capillarity, surface tension and van der Waals forces deform
particles, decreasing the porespace between them…………………………………. 13
2.5 Stages of water distribution during film formation……………………………..14
2.6 Strongest forces on a particle in the (left) wet and (right) moist stages of drying.
Surface tension (FST) acts tangentially to the air-water interface at the water-particle-air
ring of contact. Capillary pressure (FP) acts normal to the wetted particle surface. Elastic
resistance to deformation (FE) acts at the particle-particle contact area…………… 15
2.7 Order of magnitude estimates of relevant forces acting on a 100 nm particle in both
wet and moist drying stages. The surface tension was estimated to be 50 dynes/cm. The
Young’s modulus is E. Adapted from Pekurovsky (2006)..………………………. 16
2.8 Top surface cryoSEM image of compacting latex particles. Water can be seen in the
porespace between the particles, indicating that this coating is not dry…………… 17
3.1 The liquid ethane plunging method for vitrification of partially dried samples on
silicon substrates has five main steps. A) Latex is coated onto the notched silicon
substrate B) The substrate is allowed to dry and then is plunged into liquid ethane at an
angle α = 75° to vitrify remaining water. C) Specimens are placed into a modified SEM
sample holder and fractured in a vacuum. D) Sublimation of the surface ice reveals more
latex particles. E) The samples are covered in a thin layer of platinum and imaged in the
cryoSEM…………………………………………………………………………… 23

ix
3.2 CryoSEM sample holder used for imaging coating cross sections. Samples prepared
on 5x7 mm silicon wafers are placed on edge in the positions marked in the top view
image. Set screws tighten the samples in place. After each wafer is fractured, the
fracture surface will ideally be the same height as the sample holder bed. Image courtesy
of Chris Frethem…………………………………………………………………… 24
3.3 The steps of the high pressure freezing method of vitrifying latex samples. A) Liquid
latex is loaded into the wells of two freezing hats. B) Two freezing hats are sandwiched
together and are subjected to 2,100 bars of pressure at cryogenic temperatures, vitrifying
the sample. C) The hats are broken apart using a cold knife. Surface ice is sublimed
away at -96 °C under vacuum in order to uncover more latex particles. D) The samples
are coated with platinum and imaged in an SEM with a cryogenic stage able to maintain
the sample at -196 °C………………………………………………………………. 25
3.4 CryoSEM image of a silica/water coating cross section showing evidence of ice
crystals formed due to insufficiently fast sample freezing rates…………………… 27
3.5 CryoSEM images of silica/water coating cross sections showing evidence of ice
crystals formed due to insufficiently fast sample freezing rates…………………… 27
3.6 Examples of ice contamination from room humidity on cryoSEM samples…... 28
3.7 CryoSEM image of a latex dispersion where most water has been sublimed away
leaving strands of soluble material (“junk”) visible between particles……………. 29
3.8 CryoSEM cross section image of a coating edge showing a particle consolidation
front moving from the top down and the edge in. The consolidation front is marked with
a dashed line for clarity. This image was stitched together from three separate images,
creating variations in contrast from left to right…………………………………… 30
3.9 Latex pullout appearance as compared to drying stage. Adapted from Ge
(2005)………………………………………………………………………………. 31
3.10 Water droplet that condensed onto the top surface of a latex coating before the
sample was vitrified………………………………………………………………... 32
3.11 Minimum film formation temperature bar used in this report to efficiently produce
samples at a range of temperatures. Samples are drawn down using a 0.75 μm cube
applicator onto a metal bar. A temperature gradient is maintained down the length of the
bar and 4 L/min of air is blown across the coating according to ASTM standard
D2354………………………………………………………………………………. 34
Figure 3.12 Cartoon of substrate calibration, showing the clamping of the substrate and the
micrometer hook………………………………………………………………………….. 37

x
3.13 Schematic of the relevant aspects of the stress measurement apparatus……... 38
3.14 Amount of water in a latex (x) and latex + 2 vol% silica aggregate (○) coating
applied to a cantilever versus time. The coatings were dried in the stress measurement
apparatus controlled environment chamber under a flow of nitrogen at 10 °C……. 39
4.1. The dry thickness, h, of a 90% Rohm and Haas Opaque Polymer, 10% polyvinyl
acetate binder blend on a 0.5cm outer diameter glass tube versus dip coating speed, V.
The data show a linear relationship with V2/3
, consistent with Equations 4.1 and
4.3…………………………………………………………………………………...46
4.2 Coated glass tubing and SEM stubs (top and side view). Holes drilled in the SEM
stubs are the exact size to accept the hollow tubing without disrupting the latex coating
on its outer surface…………………………………………………………………. 48
4.3 Fracture method of glass tubing. The tube is mounted in the immersed SEM stub. A
sharp pull snaps the glass, using the stub to support the sample during the fracture. Since
the top of the glass is always above the level of the liquid nitrogen, the procedure can be
done without using extra tools such as insulated tweezers or gloves……………. 50
4.4 Edge effects: cross section images of a flat glass coverslip dip coated using a 90%
hollow latex, 10% polyvinyl acetate binder latex solution. In A and C, the coating has
been reduced to a monolayer at the glass edge. B shows the same sample as in A closer
to the middle of the glass. Coating thickness varied throughout both samples. D) A
droplet of hollow latex containing no binder dried on PET. Surfactant has diffused to the
edge of the droplet, covering a monolayer of hollow spheres. Low pressures during
drying at the edge have collapsed all of the particles in this layer, and a crack has formed
due to drying stresses………………………………………………………………. 51
4.5 Cross section image of hollow latex on glass tubing. A small amount (10 wt%) of
soft polyvinyl acetate latex was added to high Tg hollow latex to form a continuous
coating on glass tubing. The coating fractured on the same plane as the glass, suggesting
that it was not subjected to large shear forces……………… ……………………... 52
4.6 Cross section of a thin coating of hollow latex with a 10 wt% polyvinyl acetate
binder on a glass tube substrate. One latex particle has partially torn open during the
fracture……………………………………………………………………………... 52
4.7 Matching halves of the same hollow tube were created by placing the glass into the
hole in B, fracturing it, inverting it and pushing it up through the hole in A. The
remaining long ends of glass protruding below the SEM stub were then snapped off. The
notched and compressive areas are very typical. In A), the compression side is raised
above the plane of the fracture, and in B), it is recessed. A latex droplet has dried in B),
spanning the entire hollow of the tubing………………………………………….. 54

xi
4.8 Matching halves of the compressive area, opposite the notch, of a second sample.
The images are chiral, displaying a recessed area in A) and a projected area in B). A thin
latex coating can be seen on the outer surface of the tube. This latex was very dilute, and
so the dry coating thickness is thinner than a typical coating made by this
method………………………………………………………………………………55
5.1: Room temperature SEM images of dry hollow latex particles. Nonporous (A and B)
and porous (C and D) particles are imaged in uncollapsed (A and C) and collapsed (B and
D) states. A small amount (5% dwb) of polyvinyl acetate binder was added for coating
mechanical strength……………………………………………………………… 60
5.2 a,b: Evaporation rate over time of hollow polymer coatings with binder at low
(~10%) relative humidity. Top: Nonporous hollow latex with polyvinyl acetate binder.
(open = 95% hollow latex; grey = 50% hollow latex; Black = 100% binder) Bottom: Dow
HS 3000 porous latex with polyvinyl acetate binder. (open = 100% hollow latex; grey =
50% hollow latex; black = 100% binder)……………………………………….. 65
5.3. Evaporation rate of a drying hollow latex coating over time in high humidity (~60%).
Vinac 884 is solid, high Tg latex. Legend: Black = Vinac 884; Open symbols =
Nonporous latex; Grey = Porous HS3000; X = Porous HS 3020………………. 66
5.4: CryoSEM image of a fractured droplet of a vitrified porous latex dispersion. The
fracture plane has passed through the particles, splitting them open to show their hollow
voids. A) Porous latex, 15 min of sublimation at −96 °C. B) Nonporous latex, 3 min
sublimation at −96 °C…………………………………………………………….. 68
5.5: CryoSEM cross section images of porous latex coatings containing 20 wt% (dwb)
latex binder. The coating was dried at room temperature in 30% relative humidity. Four
separate drying stages are identifiable (A: Consolidation, B: Binder compaction, C:
Binder coalescence, D: Void drying). Samples were sublimed for ten minutes at −96 °C
which removed the visible vitrified water. Collapsed particles are circled in D….69
5.6: Cartoon depicting the four film formation stages of hollow latex coatings to
complement Figure 5.5. Locations of hollow latex (open circles), binder (black small
circles) and water (grey) are drawn for the stages: A: consolidation, B: binder
compaction, C: binder coalescence, D: void drying……………………………….. 70
5.7: CryoSEM image of the cross section of a nonporous latex coating containing 20
solids wt% of polyvinyl acetate latex binder dried at 30% relative humidity at room
temperature. The sample underwent a short sublimation time of three min at −96 °C. Ice
completely fills the porespace of this consolidating coating. Indicated in this image are
strong, ice-filled hollow latex cores that have survived the sample preparation fracture
with little deformation………………………………………………………………71

xii
5.8. CryoSEM image of the interdiffusion stage of Nonporous 0.5 latex with 10 wt%
PVA binder. Binder has completely deformed between the particles and air has invaded
all of the way to the substrate. At the top of the coating particles have fractured open, but
near the substrate they have remained whole. This could be evidence that the bottom
particles are still filled with a core of ice. One “doodad” is found at the top of the coating
and one “spiderweb” is found at the bottom, further evidence that near the substrate
particles are still filled with water. (Sublimation: 19 min, -96 °C)………………. 74
5.9: CryoSEM image of the cross section of a nonporous latex coating containing 20 wt%
(dwb) latex binder dried at 70% relative humidity at room temperature. Particles are in
the void emptying drying stage. Collapsed particles are marked. Humidity from the
room air has contaminated the sample during its preparation, spotting each particle with
small ice crystals. The sample was sublimed for three minutes at −96 °C………… 75
5.10: Examples of top surface, room temperature SEM images of coatings containing
hollow latex. A) Nonporous latex containing 20 wt% PVA binder dried at 60°C. About
30% particles are collapsed. B) Porous latex containing 35 wt% PVA binder dried at
60°C. About 20% of the particles are considered collapsed………………………. 77
5.11 a,b: Coating top surface particle collapse percentage of (A) nonporous and (B)
porous latex with varying binder concentration and temperature. Binder concentrations
were (dwb): 0%:○ 5%:□ 10%:∆ 20%: 30%:■ 35%: 50%:●. Collapse percentages
were estimated from scanning electron microscopy images of the top surface of samples.
Each point represents a sample of over 300 particles. Relative humidity was constant at
40%........................................................................................................................ 78
5.12: Top film collapse percentage of porous and nonporous latex particles after drying
under 0.75 m/s of constant humidity air flow at room temperature. Samples contained 30
wt% (dwb) binder………………………………………………………………….. 79
5.13: Top film collapse percentage of the nonporous (0.5 μm) latex primarily studied in
this chapter and newer technology nonporous latex (0.3 μm) after drying at 40% relative
humidity on the MFFT bar. Samples contained 10 wt% (dwb) binder………….. 79
5.14. Void pressure with respect to water loss for a nonporous hollow latex particle with
shell modulus 109 Pa and 10
8 Pa (Pvoid, 1 and 2, respectively). Initial dimensions are 1 μm
in diameter and wall thickness of 0.1 μm. Shaded areas represent void pressures where
collapse is likely, ranging from Pcr as calculated from Equation 1 to 0.5·Pcr for shell
modulus 109 Pa and 10
8 Pa (Pcollapse 1 and 2, respectively). An estimate for the bubble
formation pressure is plotted (---), where the bubble radius is 45 nm…………… 81
5.15 Model for Hollow Latex Particle Collapse…………………………………… 82

xiii
5.16. Void pressure with respect to water loss for a 1 μm initial diameter hollow latex
particle of shell modulus 109 Pa and initial wall thickness 0.1 μm and 0.5 μm (Pvoid, 1 and
2, respectively). Shaded areas represent void pressures where collapse is likely, ranging
from Pcr as calculated from Equation 1 to 0.5·Pcr for wall thickness 0.1 μm and 0.5 μm
(Pcollapse 1 and 2, respectively). An estimate for the bubble formation pressure is plotted (-
--), where the bubble radius is 45 nm……………………………………………… 85
5.17: (Left) Top surface SEM image of a Porous B hollow latex coating dried at 50 °C
with no binder. This sample illustrates the large range of porosities that exist on
individual particle surfaces. (Right) 30 solids wt% polyvinyl acetate binder fills the pores
of Porous B latex dried at 33.1 °C, blocking them……………………………….. 87
6.1. Schematic diagram showing sedimentation (S), evaporation (E), diffusion (VD), and
capillary drag (VC) in the three particulate coating drying stages………………… 92
6.2 Experimentally observed sedimentation velocity for large (●) and small (○) silica
particles for varying particle concentration. Solid lines are the predicted velocity using
Equation 6.10………………………………………………………………………. 98
6.3. Monodisperse silica particles synthesized through the Stöber process, dried, and
imaged using conventional SEM…………………………………………………... 99
6.4 Particle volume fraction () profiles for various Ns and Pe with respect to the fixed
coordinate y/Ho at various dimensionless times: t = 0.05 (―), t = 0.1 (---), t = 0.2 (-.-.),
and t = 0.3 (....), t = 0.35 (―) . Initial volume fraction: o = 0.4………………... 101
6.5. Drying regime map based on dimensional coordinates: initial coating thickness Ho
(m) and evaporation rate E (m/s). The effect of initial particle volume fraction is shown
for an aqueous coating containing silica particles (R=200 nm) (Evaporation=(),
diffusion=(D) and sedimentation=(S))……………………………………………... 104
6.6. Drying regime map based on dimensional coordinates: initial coating thickness Ho
(m) and evaporation rate E (m/s). The effect of silica particle size is shown for an
aqueous dispersion with o = 0.2 (Evaporation=(), diffusion=(D) and
sedimentation=(S))…………………………………………………………………. 105
6.7. Drying regime map based on dimensionless coordinates Peclet number (Pe) and
sedimentation number (Ns). evaporation (), diffusion (D) and sedimentation (S)
dominant regions are shown for a coating with (o =0.2). Critical values are also marked
for limiting cases…………………………………………………………………….106
6.8. Effect of initial particle volume fraction on the drying regime map based on
dimensionless coordinates…………………………………………………………. 107

xiv
6.9. Drying regime map marking Pe and Ns corresponding to Figures 6.10-14. o = 0.1
(grey) and o = 0.2 (black)…………………………………………………………. 107
6.10. Cross-section cryoSEM images obtained at different time points showing
evaporation dominance. Drying conditions were log(Pe) = 2.4, log(Ns) = -1.1, o = 0.2.
Dimensionless drying times and total coating thicknesses were (A) t = 0.3, H = 190 μm;
(B) t = 0.4; H = 160 μm (C) t = 0.7 H = 70 μm. A white dash marks the edge of the
consolidation front and the suspension-air free surface is at the top of each image..110
6.11. Cross-section cryoSEM image obtained at t = 0.4 showing diffusion dominance.
Images were from different depths in the coating, as shown. Drying conditions were
log(Pe) = 0.62, log(Ns) = -1.1, o = 0.1……………………………………………. 111
6.12. Cross-section cryoSEM images obtained at different times as indicated showing
sedimentation. Drying conditions were log(Pe) = 0.25, log(Ns) = 2.3, φo = 0.1.
Sedimentation zones include a) a particle-free zone, b) initial concentration zone c) a
transition zone and d) sediment……………………………………………………. 112
6.13. Cross section cryoSEM image of a coating showing sedimentation and evaporation.
t = 3.3; Pe = 0.25; Ns = 2.1. The inset shows the volume fraction of particles as a
function of depth in the coating as estimated from the image…………………….. 113
6.14. Drying map created from the theoretical model displaying points where
evaporation (), diffusion (D) and sedimentation (S) regimes were discovered through
CryoSEM for o = 0.1 (grey) and o = 0.2 (black). Circle sizes denote the estimated
magnitude of error…………………………………………………………………..114
6.15. Cross section image of a dried coating prepared from a bimodal aqueous silica
dispersion. Top right: higher magnification image of top of coating. Bottom right:
bottom of coating…………………………………………………………………... 115
6.16 Two layer coating microstructure formation, as elucidated from the drying regime
map…………………………………………………………………………………. 116
7.1 Stages of water distribution during film formation…………………………… 119
7.2 Latex deformation stage as predicted by Russel, Wu, and Man (2008) for a
viscoelastic latex particle with polymer relaxation time τ = 2E(1-ν)/HG. Adapted with
permission from the American Chemical Society (License number
2480980431862)…………………………………………………………………… 120
7.3 Digital image of a drying cantilever under room temperature air. Letters A, B, C, D
correspond to times marked in Figure 7.4a. The cantilever is 6 mm wide.............. 126

xv
7.4 Digital image of a drying cantilever under chilled air. Letters A, B, C, D correspond
to times marked in Figure 7.4b. The cantilever is 6 mm wide…………………… 126
7.5 Top surface optical microscopy images of dried latex coatings at various drying
temperatures. True cracks and microcracks are imaged. The color of the image is an
artifact of the settings of the microscope. The coatings are optically clear………127
7.6 CryoSEM top surface images of a drying latex coating dried under 22 °C
nitrogen…………………………………………………………………………….. 129
7.7 CryoSEM cross section images of a latex coating dried under 22 °C nitrogen.
Cartoons show the inferred microstructure………………………………………… 130
7.8 CryoSEM top surface images of a latex coating dried under 10 °C
nitrogen…………………………………………………………………………….. 132
7.9 CryoSEM top surface image of water dewetting from the tops of latex particles
during drying under 10 °C nitrogen………………………………………………... 133
7.10 CryoSEM top surface image of latex particles at a crack edge near a propagating
crack tip during drying under 10 °C nitrogen. The inset shows the entire crack tip with
the location of the detailed image marked…………………………………………. 133
7.11 CryoSEM cross section images of a drying latex coating under 10 °C nitrogen.
Cartoons show the inferred microstructure………………………………………… 134
7.12 CryoSEM cross section image of a latex coating containing 4 wt% (dry weight
basis) silica aggregates drying under room temperature nitrogen flow. The coating is in
the advanced wet drying state. Silica did not influence the particle coalescence in any
noticeable way………………………………………………………………………135
7.13 Latex polymer shear modulus (G) as a function of temperature as measured on a dry
latex film by a rheometer tensile test, 1 Hz strain rate, 3 °C/min temperature
ramp………………………………………………………………………………... 136
7.14 Modes of particle-particle contact growth…………………………………… 137
7.15 Calculated stress, averaged over the entire coating, during drying at 22 °C (left) and
10 °C (right). Coatings composed of only latex (―) and latex with 2 dwb% silica (---)
are compared……………………………………………………………………….. 138
7.16 Illustration of water dewetting from the latex particles (left) and the wet stage
(right)………………………………………………………………………………. 139

xvi
7.17 Average crack spacing of 0.1 mm dry thickness latex coatings (●) and latex coatings
containing silica (○) with respect to drying temperature. Temperatures where coatings
did not crack are marked with an infinite crack spacing. A) Rhoplex EI 2000 is compared
with latex containing 4 wt% (dwb) silica. B) Rhoplex AC 337N is compared to latex
containing 6 wt% (dwb) silica……………………………………………………... 141
7.18 Average crack spacing of 0.1 mm dry thickness latex coatings (●) and latex coatings
containing 2 wt% (dwb) silica (○) with respect to the latex particle shear modulus. Grey
cartoons show the predicted state of high and low modulus particles when the cracking
occurs……………………………………………………………………………… 142
7.19 Average crack spacing of latex composite coatings containing silica dried at 10 °C.
A line of best fit (λ = 0.00012 Gcomp0.47
) is shown for Gcomp < 0.25 GPa…………. 143
8.1 CryoSEM cross section image of a drying coating containing polyvinyl alcohol,
titanium dioxide, and water. There is no contrast between the polymer and the water,
except for pullout type structures due to the sample fracture……………………… 148
8.2 Schematic of a typical confocal Raman microscope. Light excites the sample. The
elastic scattering (no energy change) is filtered from the signal. A pinhole aperture only
allows the signal that is in focus under the objective lens to reach the detector for depth
resolution…………………………………………………………………………....149
8.3 WiTec Alpha 300R confocal Raman microscope owned by the University of
Minnesota Characterization Facility. Image taken Spring, 2008………………… 150
8.4 Top surface images of dry TiO2/polyvinyl alcohol coatings. The coating on the left
was dried slowly, whereas the coating on the right was dried quickly…………….. 152
8.5 Cross section images of coatings dried slowly (left) and quickly (right) showing
binder migration that is 1-2 μm thick in the case of the fast drying coating………. 152
8.6 Raman spectra for pure TiO2 (red) and pure polyvinyl alcohol (blue)………... 153
8.7 Calibration curve for converting relative Raman peak intensities (IPVOH and ITIO2) into
concentration……………………………………………………………………….. 154
8.8 Weight fraction of polyvinyl alcohol in both fast drying and slow drying coatings
with respect to depth. SEM images of the same coatings are shown on the same scale for
reference……………………………………………………………………………. 155

1
CHAPTER 1
INTRODUCTION
1.1 INTRODUCTION AND MOTIVATION
Coatings modify surfaces. Sometimes a coating is desired for purely aesthetic
reasons such as a paint to modify the color, gloss, or reflectivity of a product. Other
coatings increase the durability of an object, such as polymer coatings applied to glass to
prevent small imperfections from propagating into cracks, or its weatherability, such as a
varnish on a deck which seals it from water damage. Coatings can provide structure,
such as porous particulate layers on paper which aid in ink absorption or porous fuel cell
electrodes which provide an environment for a multiphase chemical reaction. Coatings
can also be the source of most of an object’s functionality, like magnetic coatings in
recording media, or the e-ink technology in portable electronic book readers. Many
coatings contain either organic or inorganic particles ranging from 10 μm to 10 nm in size.
A short list of some common particulate coatings and the particles that make them
functional is given in Table 1.1.
A typical particulate coating is composed of solvent, which allows it to flow onto
the substrate, inorganic particulates, which often provide structure and functionality,

2
Table 1.1 Common particulate coatings
Coating Particles in Coating
Paper coating Clay or calcium carbonate particles, polymer latex
Magnetic recording media Iron magnetic particles
Automobile exterior paint Aluminum flakes
Fuel cells Carbon particles
Photonic crystals Monodisperse silica particles
Anti-reflective glass coatings Silica particles
Latex paint Inorganic pigment particles, polymer latex
polymer, which is often called “binder” because it binds the inorganic particles together
to create cohesive strength, and other additives that are most often used to provide
stability or the proper rheology to the dispersion (Figure 1.1). The polymer can either be
in soluble form or it can be colloidal polymer particles, termed a “latex”.
Although the composition of a particulate coating is very important, its
microstructure, or solids organization is just as critical to its function. The presence or
lack of a gradient in composition through the depth of the coating, the order of the
particles, and the porosity of the particle packing can all determine essential qualities
such as coating strength, gloss, functionality, and adhesion (Figure 1.2). For example,
paper companies struggle with what is termed “binder migration”, where the polymer
binder preferentially is located at the top of the coating (Lee 1987; Smith 1993;
Yamazaki et al. 1993; Pan, Davis, and Scriven 1995). The binder rich layer seals it from
ink adsorbtion. Additionally, Luo studied the ordering of needle-like magnetic iron
particles that must be aligned for effective magnetic recording media (Luo 2008).
Figure 1.1 Composition of a typical particulate coating

3
Figure 1.2 Illustrations of various possible microstructures for a particle (blue), polymer
(red) system, including (from left to right) segregated and ordered particles, a
homogeneous and random packing, binder migration to the top of the coating, and
sedimentation of particles to the bottom of a polymer rich coating
The coating microstructure is influenced by every step of the coating process
including the coating dispersion formulation, its deposition on the substrate, and its
drying into a solid form. In the first step, the coating dispersion must be stable. Species
may preferentially interact with one another or aggregate, which may or may not be
desirable. If the suspension is to be shipped over long distances or stored for long
periods of time it must be resistant to sedimentation, freezing, and bacteria growth.
During coating, the suspension rheology must allow deposition onto the substrate at an
economically favorable speed, and, once deposited, the coating liquid must level to a
uniform thickness. The apparatus used to coat the suspension must accommodate the
particles and not promote their aggregation. Finally, the drying process must be
energetically economical. The evaporation rate dictates the amount of time coatings
solids have to segregate, order, skin, or sediment before the solvent is gone and solids
movement is halted. If the geometry of the substrate is three dimensional the coating
liquid viscosity must increase fast enough during drying to prevent sagging or pooling.
To economically manufacture a quality coating, all three steps of the coating
process must be fully understood. Many experimental techniques exist to characterize
the suspension rheology and stability such as rheometry and dynamic light scattering.
Finite element modeling has successfully been used to optimize a wide variety of coating
methods for various suspensions. Probing the coating microstructure formation during
drying, however, is a challenge. Any characterization method must be able to sample a
specimen as it dries in realistic conditions, detect micron-scale changes in its
microstructure, and ideally be able to locate these changes in the sample in three
dimensions.

4
One of the most effective methods to track the microstructure formation is
cryogenic scanning electron microscopy (cryoSEM). With cryoSEM, the coatings are
frozen at various states in the drying process. Freezing preserves the transient state of the
coating and allows both the solvent and the coatings solids to be imaged. Furthermore,
since the samples are solidified, they can be cracked to image the cross-section of the
specimen as well as the top surface, giving a three dimensional view of the structure.
New technology scanning electron microscopes are able to resolve objects on the order of
100 nm in size and below. The University of Minnesota pioneered the use of cryoSEM
to probe the drying of coatings, beginning with fundamental studies to prove the efficacy
of the technique (Sheehan et al. 1993; Ming et al. 1995), which progressed to vivid
images of particle distributions and the air-water interface verified commonly held beliefs
about latex film formation (Ma 2002). Later studies investigated more complex ideas
such as freeze thaw stability and skinning (Ge 2005), mixtures of ceramic particles and
latex particles (Luo 2007) and the role of van der Waals forces (Gong 2005; Gong 2008).
1.2 THESIS OVERVIEW
This thesis continues the studies on the microstructure development of particulate
coatings during drying using cryoSEM. Chapters 2 and 3 give essential background
information for understanding coating film formation and the experimental methods that
were used to study this process. Chapter 5 details a cryoSEM study of the drying of
hollow latex particles. Hollow latex is a relatively inexpensive white pigment. Hollow
latex particles contain one large central void that is filled with water in the dispersion
state and air in the dry film. Light scatters from the hollow void, creating opacity.
However, when hollow latex particles are dried under certain conditions they are prone to
collapse, which reduces their effectiveness. CryoSEM was used to watch hollow latex
coatings dry in order to elucidate the film formation stage when collapse occurs. It was
discovered that these particles collapsed at the very end of film formation when the
centers of these particles were drying. It was also found that humidity, drying
temperature, and different binder concentrations all affected the amount of collapsed
particles. From this information, a model for the drying of a particle was proposed. In

5
the model, water diffusion across the hollow particle shell decreases the pressure in the
void. In response to this pressure decrease, a gas bubble may form in the center of the
void. This gas bubble is able to change its volume in response to pressure changes,
allowing the hollow latex particle to dry normally. If a gas bubble does not form in the
latex particle it will collapse.
Chapter 6 introduces and experimentally verifies a 1-D model for the solids
distribution through the depth of a particulate coating as it dries. The model includes
particle sedimentation due to gravity, random Brownian motion, and the movement of the
coating top surface due to evaporation. The effect of particle concentration on these
motions is taken into account. Results from the model predicted that parameters such as
the evaporation rate, solvent viscosity, coating thickness, particle size and particle density
can influence the solids distribution to either be evenly distributed throughout the coating
thickness, sediment towards the substrate, or accumulate at the top of the coating. The
results are summarized by two dimensionless numbers and plotted onto a drying regime
map which predicts the particle distribution for any drying conditions. This drying
regime map was verified experimentally using cryoSEM to image the drying of
monodisperse aqueous silica coatings. Although the model was strictly created for
simple monodisperse particle systems, it was experimentally shown that it could also be
used to gain insight into the drying of more complicated dispersions.
Chapter 7 investigates the effect of temperature on the drying and cracking of
latex coatings. Latex particles sinter together if dried in warm conditions above what is
termed the “minimum film formation temperature” or MFFT. Sintered coatings are
usually assumed to have high mechanical strength to resist cracking. If the latex coating
is dried below the MFFT, the higher modulus of the particles prevents sintering and the
resulting weak film usually cracks. The boundary between these two regimes was
explored using cryoSEM. An intermediate temperature regime was discovered, where
some particle deformation took place, but this deformation was not sufficient to prevent
the coating from cracking. The spacing between cracks, an indicator of the fracture
toughness of the coating, depended on the drying temperature. Cracking was found to
occur early during drying when the coating still contained considerable amounts of water.

6
Furthermore, the addition of small amounts of silica aggregates was found to increase the
fracture toughness of the film most likely by increasing its modulus.
In studying particulate coatings, an issue of proper sample preparation became
evident. Coating microstructure develops differently depending on whether a film is
dried from top to bottom or edge in. Lateral drying is often predominant in coatings of
small area, such as any samples that are produced in the laboratory. Top-down drying is
seen in coatings of large areas, such as any that are made industrially. Therefore, to
apply any findings that are discovered in a laboratory to industrial practice, it must be
justified that the phenomena that are seen apply to both top-down and edge-in drying.
Instead of continuing in this manner, a new sample preparation technique was developed
by which coatings could be applied to hollow glass cylinders. On a cylinder, there are
few edges to interfere with the drying. The edges that are present—the top and the
bottom of the cylinder—can easily be avoided. The cylinders are fractured in a
controlled manner allowing the coating cross section to be imaged. This sample
preparation practice may also be transferable to cryogenic scanning electron microscopy.
It is hoped that this sample preparation technique will be useful for preparing laboratory
samples which better approximate large scale coatings in this study and further
investigations. This technique is introduced in Chapter 4.

7
CHAPTER 2
BACKGROUND
2.1 LATEX
In order to apply a polymer onto a surface or mold it into a shape it must flow and
then solidify. Many methods exist for allowing polymer to flow, including dissolving it
in organic solvents or heating it to lower its viscosity. One of the most attractive methods
for applying a polymer coating in a user friendly way is by starting with a latex
dispersion. A latex is a colloidal suspension of polymer, usually produced through
aqueous emulsion polymerization (Grady, Kroschwitz, and Seidel 2004; Steward, Hearn,
and Wilkinson 2000a; Takamura, Kroschwitz, and Seidel 2004). Although other co-
solvents can be added to a latex dispersion, water is the traditional suspension medium.
Because of this, latex based products are environmentally friendly and relatively
inexpensive as compared to alternative products (Grady, Kroschwitz, and Seidel 2004).
Latexes are also attractive because the rheology of a latex dispersion does not depend on
the polymer composition or molecular weight but rather the solids volume fraction,
particle size and stability (Lovell and El-Aasser 1997). This allows great flexibility in the
properties of the polymers that can be coated (Lovell and El-Aasser 1997). Blends of
dissimilar latexes can also be created without regard to their compatibility in the

8
dispersion state (Mitchell Winnik and Feng 1996). These blends can then have unique
microstructures in the final dry coating.
The advantages of latexes were immediately obvious from the time that the first
commercial synthetic latex was available. The first latexes were produced and sold by
the Glidden Company in 1948 after technology developed during World War II (Scholz
1953). By 1952 it was estimated that 40 million gallons of latex were produced in the
United States (Scholz 1953). In 2000, over 15 million tons of latex dispersions were sold,
corresponding to about 4-8% of all polymer that was produced worldwide (Joseph L.
Keddie 1997; Takamura, Kroschwitz, and Seidel 2004). Consequently, latexes have a
wide range of applications such as paints, paper coatings, adhesives, carpet backing, and
binder (Grady, Kroschwitz, and Seidel 2004).
A latex is cast down on a substrate as a stable dispersion of spherical particles,
traditionally with diameters on the order of 0.1 - 1 μm. Particles are separated in the
suspension by surfactants. Surfactants are most often electrosteric in nature and can be
left over from the latex synthesis or added after its manufacture to prevent coagulation
(Wicks, Jones, and Pappas 1992). Unreacted monomer, thickeners, diluents, pH
modifiers, and biocides can also be in suspension, as well as other nonsoluble particles
such as ceramic pigments (Keddie 1997). Each component in the latex serum affects the
overall performance of the product, often through unexplained relationships with the
other ingredients.
Once a latex dispersion is spread onto a substrate the water in the coating begins
to evaporate. This begins the process known as “latex film formation” whereby a liquid
dispersion dries into a solid coating. Most commercial latex coatings contain low glass
transition temperature (Tg) particles which deform under forces that develop during film
formation, which can create a nonporous coating when finally dry. Properties such as the
polymer modulus, particle size, evaporation rate, and liquid surface tension influence
how the microstructure of the film develops during film formation. Microstructural
changes include the solids distribution through the coating thickness, the migration of
water through the porespace between particles, and the extent of particle deformation.
The quality of the final coating as well as the time and energy that is required to

9
produce it is often heavily dependent on the film formation route under which it is
formed. Therefore, it is critical to understand the latex film formation process and how to
influence it.
2.2 LATEX FILM FORMATION
It has been over fifty years since the first theories about the drying mechanisms of
latex films were proposed (Dillon, Matheson, and Bradford 1951; Arlinghaus 2004).
Since then, there have been multiple theories of how a latex dispersion dries to become a
mechanically strong nonporous film. Currently, the most accepted film formation model
was first proposed by Vanderhoff as a series of three main stages: consolidation,
compaction, and interdiffusion (Steward, Hearn, and Wilkinson 2000b; Vanderhoff 1970;
Vanderhoff and Bradford 1963). In the consolidation stage, particles concentrate due to
an evaporating liquid phase. During compaction, particles deform against each other,
reducing the void space. Interdiffusion occurs when the polymer chains migrate between
individual particles, sintering them together to form a final void free product. In this
model, it is largely capillary and surface tension forces, exerted by the water phase,
which drive particle deformation (Vanderhoff and Bradford 1963).
Although this section is written specifically about latex film formation, the drying
of coatings containing colloidal ceramic particles is very similar in many ways. Ceramic
particles are hard and do not deform under capillary forces, so the drying behavior of a
ceramic particulate coating would be analogous to that of a high glass transition
temperature latex.
2.2.1 Stage 1: Consolidation
In the consolidation stage, evaporation occurs from a flat water-air interface. As
the water escapes from the coating, the latex particles become more concentrated in
solution until they come into contact with each other, despite stabilizers (Keddie 1997).
The maximum particle packing volume fraction for unordered spherical particles is ϕ =
0.64.

10
Figure 2.1 In the consolidation phase, particles concentrate as evaporation occurs from
a flat water-air interface.
During this first stage of drying, the top surface descends towards the substrate
with a constant evaporation rate E. This rate can be measured easily by weighing the
coating as it dries. It is often reported as a velocity with units of m/s, which can be found
knowing the area over which evaporation occurs.
Within the coating below the free surface particles are free to diffuse through
random Brownian motion. The Stokes-Einstein diffusion coefficient, Do, estimates the
Brownian diffusion rate of dilute, spherical, monodisperse colloidal particles of radius R
dispersed in a liquid of viscosity viscosity μ and temperature T:
0
6
kTD
R (2.1)
The Boltzmann constant is k.
As the free air-water interface descends by evaporation, it encounters particles.
The particles can either be trapped at the free surface or can diffuse away. The
dimensionless Peclet number, Pe, was defined to describe which of these actions is more
likely to occur. It is ratio between the evaporation rate to the particle diffusion rate for a
coating of initial thickness Ho:
o
o
EHPe
D (2.2)
If Pe << 1, the particles diffuse away from the top surface quickly and the particulate
distribution through the coating thickness is approximately uniform as the coating dries.
However, if the evaporation rate is faster than the particle diffusion (Pe >> 1), then the
top surface accumulates particles as it descends in what is commonly termed a
“consolidation front”, or a concentrated layer of particles (Routh and Zimmerman 2004).
A consolidation front was captured in a cryoSEM image in Figure 2.2. The boundary
between Pe = 1 for the formation of consolidation fronts was challenged for particulate
11
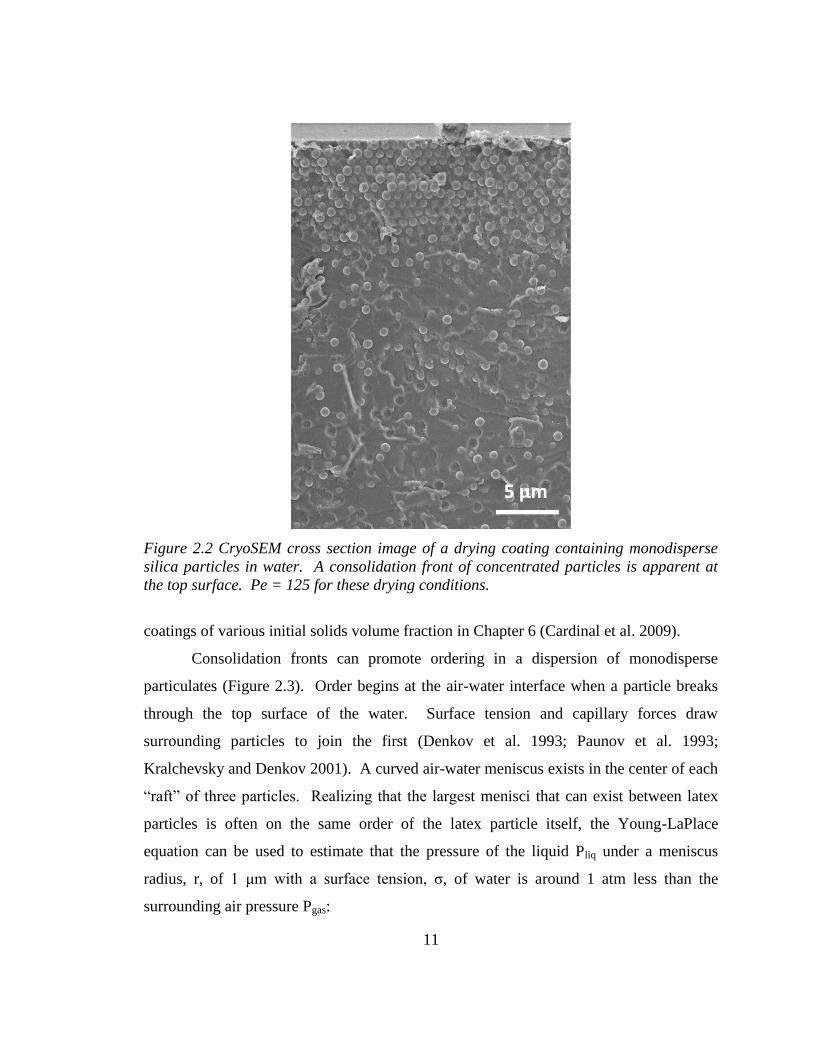
Figure 2.2 CryoSEM cross section image of a drying coating containing monodisperse
silica particles in water. A consolidation front of concentrated particles is apparent at
the top surface. Pe = 125 for these drying conditions.
coatings of various initial solids volume fraction in Chapter 6 (Cardinal et al. 2009).
Consolidation fronts can promote ordering in a dispersion of monodisperse
particulates (Figure 2.3). Order begins at the air-water interface when a particle breaks
through the top surface of the water. Surface tension and capillary forces draw
surrounding particles to join the first (Denkov et al. 1993; Paunov et al. 1993;
Kralchevsky and Denkov 2001). A curved air-water meniscus exists in the center of each
“raft” of three particles. Realizing that the largest menisci that can exist between latex
particles is often on the same order of the latex particle itself, the Young-LaPlace
equation can be used to estimate that the pressure of the liquid Pliq under a meniscus
radius, r, of 1 μm with a surface tension, σ, of water is around 1 atm less than the
surrounding air pressure Pgas:

12
Figure 2.3 CryoSEM image of the cross section of a drying monodisperse silica/water
coating. Silica particles have ordered in a hexagonal array.
r
PP gasliq2
(2.3)
The low pressure within a packing attracts more particles to join the growing crystal
(Joanicot et al. 1990). Repulsive surface charge interactions can aid in crystallization,
since this aids in particle rearrangement when a particle does not find its proper location
(Velev 2006; Gast and Russel 1998). Once particles contact, van der Waals forces keep
the crystal together.
The crystal grows three-dimensionally towards the substrate by a phenomenon
termed “convective steering.” (Brewer et al. 2008) As water evaporates from the pores
between the particles, local liquid convection exists to replenish the water at this point.
This convection brings particles from the coating bulk to sit in the pore throat, adding to
the order of the crystal (Gasperino et al. 2008).
When the latex is first cast, the index of refraction between the polymer and water
phases scatters light, making the wet coating opaque (Patel et al. 1996; Franses et al.
1983). As the porespace between individual particles shrinks to dimensions that are
smaller than the wavelength of light, the scattering will be diminished and the latex will
turn from milky white to translucent (Ma 2002; Routh et al. 2001). This is a sign that
compaction has started to occur.

13
Figure 2.4. In the compaction phase, capillarity, surface tension and van der Waals
forces deform particles, decreasing the porespace between them.
2.2.2 Stage II: Compaction and Deformation
Origins of Capillary Forces. As particles are concentrated, either throughout the entire
coating or just in a consolidation front, the dense particle packing creates a barrier for the
remaining water to escape from the coating top surface. A critical balance exists between
evaporation of water at the free surface and the replenishment of this water through
convection through the porespace (Arlinghaus 2004). When the water evaporates at the
top surface faster than it can be replenished, the air-water interface at the top surface of
the coating starts to invade into the porespace between the top layer of particles (Keddie
1997). As it does so, the air-water interface becomes curved (Figure 2.3), and, as
Equation 2.3 predicts, the liquid pressure at the top of the coating is reduced on the order
of 1 atm.
Decreasing pressures at the top of the coating will cause a pressure gradient
across the particle packing which becomes a driving force for water flow towards the top
interface, despite the substantial drag through the thin constrictions of the porespace
(Arlinghaus 2004; Pekurovsky 2006). The flow aids the drying of the entire coating by
pulling fluid towards the top interface where it can evaporate. When the viscous
resistance is balanced with the pressure driving force, convection of water to the top
surface will preserve the shape of the meniscus, despite fluid loss to evaporation. If they
are not balanced, the meniscus will descend into the porespace, decrease in radius, and
increase the capillary pressure driving force (Pan 1995; Arlinghaus 2004).
A meniscus can descend so far into the converging-diverging passageway
between two particles that the geometry cannot support the low pressure of its small
radius. It will relocate to a new spot which allows a larger radius in a quick hop called a
Haines jump (Haines 1930). Water beneath the menisci will redistribute until the fluid
pressure is equalized again in that area. Depending on the extent of the drying rate and

14
Figure 2.5 Stages of water distribution during film formation
fluid viscosity, air can invade as a uniform front which moves steadily towards the
substrate or ragged fingers of air (Pan 1995).
As air invades into the particle packing, water can be left behind as pendular rings
hanging between particles as illustrated in Figure 2.5 (Keddie, 1997). Pendular rings can
have very small radii of curvature, creating very large capillary forces (Megias-Alguacil
and Gauckler 2009). When the air-water interface exists at the top surface of the coating,
it is considered in the “wet” drying stage. After it has invaded into the particle packing, it
is considered “moist” until the pendular rings evaporate away (Figure 2.5). In the moist
drying stage, a contiguous pathway of water no longer exists for water to transport to the
top surface. Instead, the water escapes as water vapor which evaporates from the
pendular rings and then diffuses up through the particle packing (Scriven 2006).
Latex Particle Compaction. As the water pressure falls, either in pendular rings or in
the bulk water front, capillary forces, surface tension, and van der Waals forces will pull
upon the latex particles (Figure 2.6). If the modulus of the latex is low enough, the
particles will respond by deforming into the porespace (Pekurovsky 2006; Arlinghaus
2004). As the distance between particles decreases, van der Waals forces also become
responsible for deformation. In fact, Gong has shown that van der Waals forces alone
can compact a coating without any water phase present (Gong, Davis, and Scriven 2008).
Surfactants and other ions added to prevent particle aggregation in the dispersion state
may continue to resist particle-particle contact in the wet and moist states through short-

15
range electrostatic and steric forces (Vorobyova and Winnik 2001; Roulstone, Wilkinson,
and Hearn 1992). Pekurovsky (2006) estimated the orders of magnitude of the relevant
forces that act on a 100 nm particle in both the wet and moist drying stages. Her
estimates are graphically displayed in Figure 2.7.
Increasing the modulus will decrease the extent of particle deformation. Particles
with moduli that are too high will not deform at all. These latexes are said to be “hard”
or “non film forming”, and the coatings made of such particles will have low mechanical
strength and are prone to cracking. In Chapter 7 the relationships between modulus,
particle deformation, and cracking are explored.
The minimum film formation temperature (MFFT), defined as the lowest
temperature that a mechanically strong, crack free, clear film can form, is often used by
industry as an indication of particle compaction. The MFFT can be measured very easily
by drying a coating on a substrate that has a temperature gradient down its length using
the standard procedure described in Section 3.3. Often it can be correlated to the glass
transition temperature of the polymer phase (Sewell 1998; Toussaint et al. 1997).
However, the MFFT has also been shown to be a function of drying time, particle size,
crystallization, relative humidity, pH, and surfactant type and latex concentration (Sewell
1998; Hill et al. 2001; Keddie 1997; Steward, Hearn, and Wilkinson 2000b). Most of
these effects can be attributed to their influences on the latex polymer modulus.
Figure 2.6 Strongest forces on a particle in the (left) wet and (right) moist stages of
drying. Surface tension (FST) acts tangentially to the air-water interface at the water-
particle-air ring of contact. Capillary pressure (FP) acts normal to the wetted particle
surface. Elastic resistance to deformation (FE) acts at the particle-particle contact area.

16
Figure 2.7 Order of magnitude estimates of relevant forces acting on a 100 nm particle in
both wet and moist drying stages. The surface tension was estimated to be 50 dynes/cm.
The Young’s modulus is E. Adapted from Pekurovsky (2006).
Numerous researchers have attempted to derive critical conditions including
particle radius and modulus for compaction (Mason 1973; Brown 1956; Russel, Wu, and
Man 2008; Man and Russel 2008). Mason (1973) corrected Brown’s model (1956)
which balanced the force required to compress two elastic spheres with the lowest
capillary pressure that can be supported by a stable meniscus in a raft of three particles.
This force balance gave a critical latex shear modulus G of (Mason, 1973):
(2.4)
where σ is the surface tension of the liquid phase and R is the radius of the particles.
Routh and Russel created a model for predicting the stage of latex deformation
based on the particle modulus, size, polymer-water surface tension (pw), and other

17
Figure 2.8 Top surface cryoSEM image of compacting latex particles. Water can be seen
in the porespace between the particles, indicating that this coating is not dry.
coating properties (Routh and Russel 1999; Routh and Russel 2001; Russel, Wu, and
Man 2008). The model assumes linear viscoelastic particles that deform under capillary
forces, and viscous sintering driven by the reduction of polymer surface curvature in the
contact region. Van der Waals forces are neglected. They define a dimensionless
number as the ratio between the time for viscous collapse of the particle versus the
evaporation time of the entire coating:
(2.5)
There are many macroscopic indicators of compaction. As the porespace
decreases, there is an increased resistance for water to diffuse upward through the
particles to escape the film. There is also a reduced surface area at the water-air
interface for evaporation. Croll identified a falling rate period of drying due to both of
these phenomena (Croll 1986). The invading air has a different index of refraction than
the polymer phase. The contrast will scatter light, causing the translucent coating to

18
become opaque, as long as the space between the particles is larger than the wavelength
of light (Ugur, Elaissari, and Pekcan 2005). If the particles are compacted, the coating
will become transparent. Coating stress also develops under capillary forces (Perera, and
Eynde 1984), which is sometimes evident in curling, cracking, or delamination.
Mechanical strength grows with the contact points between latex particles to resist these
coatings failures (Scriven 2006).
2.2.3 Stage III: Interdiffusion
Finally, with particle-particle contact points established, individual polymer
chains are able to diffuse from one particle to another, creating even greater film strength.
Individual particles become indistinguishable, and void space is eliminated (Keddie
1997). Unlike deformation, the coalescence stage cannot occur below the Tg of the
polymer by definition (Keddie 1997).
What happens to the stabilizer that once was located on the surface of the latex is
an open question. Through staining experiments, some researchers have shown that in
early coalescence stages it has not yet diffused throughout the polymer phase and outlines
former particle boundaries, whereas other experiments show that at least some surfactant
will concentrate at the top surface of the coating (Huang 2001; Juhue et al. 1995). Some
water may also be trapped within the coating, to diffuse out over time through the
polymer phase (Vanderhoff, Bradford, and Carrington 1973). This remaining solvent
may act as a plasticizer during the drying process (Juhue and Lang 1994; Keddie and
Jones 1995).
A coalesced film, containing no porespaces large enough to scatter light, is often
transparent (Routh et al. 2001). It is unaffected by rehydration (Gong, Davis, and Scriven
2008; Huang 2001). Over time, the stresses introduced by the compaction process will
either relax through motion of the polymer chains or be released through cracking and
delamination (Hill et al. 2001).
In reality, the three film formation stages often occur simultaneously. In coatings
with high evaporation rates or with low modulus latex particles, the top of the coating
will likely consolidate faster than polymer below, creating a region of tightly packed

19
particles above a wet reservoir (Sheetz 1965). Water flux through the top layer will be
restricted, a phenomenon called “transport skinning.” (Arlinghaus 2004) If the top layer
coalesces before the latex below, a strong, nonporous film can form above a wet section.
Water must permeate this film for the coating to dry. This phenomenon is called
“mechanical skinning.” (Arlinghaus 2004)
Numerous macroscopic phenomena have been explained through understanding
the microscopic transitions that take place during film formation. Drying rates, skinning,
porosity, light scattering, and stress development have all been mentioned in this short
synopsis, and many more examples exist. A thorough understanding of coating
microstructure development has been proven many times to be an extremely valuable tool
for diagnosing problems or formulating new ideas about a given product.

20
CHAPTER 3
EXPERIMENTAL METHODS
3.1 INTRODUCTION
The final coating microstructure is influenced by every step of the coating process,
including the formulation of the initial dispersion, the deposition and spreading of the
dispersion onto the substrate, and the process by which it is dried. Many established
experimental methods exist for studying formulation properties, for example viscosity,
particle size, species concentration, and extent of reaction. Many methods also exist to
study the final microstructure, including porosity, particle orientation and arrangement,
modulus, and reflectivity. These properties develop as the coating dries, during which
the solvent concentration, coating thickness, stress and microstructure all change
drastically in a typical process. The process by which these changes occur can be
inferred from the initial and final coating properties, or they can be measured directly as
the coating is dried using the few experimental techniques that exist for studying the
properties of drying coatings.
The topic of this thesis is the development of coating microstructure as the
coating dries, which necessitates dynamic property measurements during the film
formation process. Cryogenic scanning electron microscopy (CryoSEM) and cantilever

21
stress measurement techniques were used to follow the microstructure and the coating
stress, respectively, as the film dries. The specific adaptations of these techniques to
study coating properties is discussed in this chapter. Drying coatings on a minimum film
formation bar is also introduced as a way to control drying conditions. Other, more
common experimental techniques were also used to look at initial dispersion and final
coating properties, such as dynamic light scattering (DLS), Raman microscopy, atomic
force microscopy (AFM), nanoindentation, video light microscopy, rheometry, and
dynamic scanning calorimetry (DSC). Since these techniques are more familiar to many
they are not discussed here.
3.2 CRYOGENIC SCANNING ELECTRON MICROSCOPY
Scanning electron microscopy (SEM) is an extremely powerful tool for imaging
the surfaces of objects on the order of 100 nm in size and below. In a scanning electron
microscope, a beam of electrons is focused and directed to impinge upon a specimen.
The electrons interact with the atoms of the sample and are reflected off of the specimen
and detected. Contrast is derived from both topography and atomic number. It is a
versatile technique, accepting a large variety of specimens, but it has its limitations.
Samples must withstand vacuums down to 1x10⁻⁶
Pa in the sample chamber, making it
impossible to image liquids in a conventional SEM without evaporating the sample and
fouling the microscope (Goldstein et al. 1981).
Cryogenic scanning electron microscopy, first used by biologists, is a technique
that was developed to image liquid samples in an SEM. Here, the liquid sample is
vitrified at cryogenic temperatures before it is imaged. In solid form, the sample has a
low vapor pressure and can survive the vacuum of the specimen chamber. Vitrification
also halts any dynamic processes, preserving the sample in its transient state.
Furthermore, the solid sample can be fractured to reveal the developing microstructure in
its cross section.
In order to ensure that the sample is an accurate representation of its liquid form,
the liquid is vitrified, rather than crystallized, to prevent any density changes during the
phase transformation. If the sample is mostly water, vitrification can only be

22
accomplished if the sample is brought below −100 °C in less than 0.01 seconds, or cooled
at a rate of 10,000 K·s-1
(Moor 1971). Although this complicates the sample preparation,
images can be obtained which accurately depict the state of the liquid specimen (Sutanto
et al. 2001; Prakash, Francis, and Scriven 2006; Ma, Davis, and Scriven 2005).
Dissolved species such as surfactants or cosolvents depress the freezing point of water,
aiding in vitrification (Devireddy et al. 2002).
After vitrification, the sample is fractured (if desired) to expose its cross section.
Up to a micron of the liquid phase is then allowed to sublime from the sample in order to
uncover the particles. A few nanometers of platinum are sputtered on to the surface that
will be imaged, and finally the sample is loaded into a chilled stage in the scanning
electron microscope.
CryoSEM is important to this thesis since it was the most reliable method of
imaging aqueous particulate dispersions in their native states. The aggregation of species
in wet latex paint is an example of one possible subject (Wildeson 2008; Luo, Scriven,
and Francis 2007). Coatings could also be imaged in different drying states, creating a
chronological story of microstructure development. Top-down drying fronts and
pendular rings of liquid water hanging between latex particles have been captured in this
way (Ma, Davis, and Scriven 2005). The sample preparation needed for either case was
different due to the sample thickness and substrate requirements. The two main
vitrification methods, termed plunge freezing and high pressure freezing, are described
below.
3.2.1 Plunge Freezing Into Liquid Ethane
In order to look at samples that have partially dried, the plunge-freezing technique,
illustrated in Figure 3.1, is used to prepare cryoSEM samples. This technique has been
used to show phenomena such as top-down and edge-in particle consolidation fronts,
latex particle deformation, and the location of water in a drying film (Ma, Davis, and
Scriven 2005; Luo et al. 2008; Gong, Davis, and Scriven 2008).

23
Figure 3.1 The liquid ethane plunging method for vitrification of partially dried samples
on silicon substrates has five main steps. A) Latex is coated onto the notched silicon
substrate B) The substrate is allowed to dry and then is plunged into liquid ethane at an
angle α = 75° to vitrify remaining water. C) Specimens are placed into a modified SEM
sample holder and fractured in a vacuum. D) Sublimation of the surface ice reveals more
latex particles. E) The samples are covered in a thin layer of platinum and imaged in the
cryoSEM.
Sample substrates, 5 x 7 mm silicon wafers (Ted Pella), are cleaned with a dilute
soap solution and acetone to improve the adhesion of the coating liquid. If the sample
cross section is to be examined, a score mark is made on the substrate at its midpoint for
a more predictable fracture later in the sample preparation process. Then, the coating
liquid is applied and allowed to dry until the film formation stage of interest is reached.
The sample is then vitrified.
Although liquid nitrogen is cold enough to vitrify the liquid samples, it is already
at its boiling point in an open container in the laboratory. When a sample is immersed in
nitrogen, therefore, the cryogen boils at its surface, creating an insulating gaseous layer of
nitrogen that reduces the rate of heat transfer to the sample (Severs and Shotton 1995).
Instead, the sample is plunged into an ethane slush, which is insulated by liquid nitrogen
to −196 °C. This cryogen has a large difference between its freezing (−172 °C) and
boiling temperature (−89 °C), so the amount of heat removed from the sample is
maximized before the ethane boils (Severs and Shotton 1995). Ge did extensive research
on the optimal angle for insertion of latex samples into the ethane. She found that
samples which were plunged in an angle of 75° to the horizontal produced the finest

24
Figure 3.2 CryoSEM sample holder used for imaging coating cross sections. Samples
prepared on 5x7 mm silicon wafers are placed on edge in the positions marked in the top
view image. Set screws tighten the samples in place. After each wafer is fractured, the
fracture surface will ideally be the same height as the sample holder bed. Image courtesy
of Chris Frethem.
samples. Plunging at more or less of an angle resulted in sheared samples or slow
cooling (Ge et al. 2008).
After the specimens are vitrified, they are loaded into a sample holder (Figure 3.2)
under a liquid nitrogen bath to prevent ice crystal contamination. This holder is then
transferred to an Emitech cryopreparation device. Within this machine, the silicon is
broken at the score mark made previously, exposing the cross section of the coating for
imaging. If desired, an amount of water is sublimed away at −96 °C to expose more of
the coating solids (Fukuta and Gramada 2003). The etch rate at this temperature is on the
order of 10 nm·s-1
, and a vacuum prevents recrystallization of the escaping water vapor
onto the coating surface (Echlin 1992). By careful manipulation of the temperature and
sublimation time, the degree of etching was tailored to the experiment. The fracture
surface was then coated with platinum to reduce charging in the microscope. Finally, the
sample was imaged in a Hitachi S4700 FESEM, which was equipped with a cold stage to
maintain the sample temperature near −160 °C.

25
Figure 3.3 The steps of the high pressure freezing method of vitrifying latex samples. A)
Liquid latex is loaded into the wells of two freezing hats. B) Two freezing hats are
sandwiched together and are subjected to 2100 bars of pressure at cryogenic
temperatures, vitrifying the sample. C) The hats are broken apart using a cold knife.
Surface ice is sublimed away at -96 °C under vacuum in order to uncover more latex
particles. D) The samples are coated with platinum and imaged in an SEM with a
cryogenic stage able to maintain the sample at -196 °C.
3.2.2 High Pressure Freezing
The high pressure freezing technique is primarily used to prepare samples to
examine the coating dispersion as it would exist in the completely wet state before any
drying takes place. This method can be used to uncover particle-particle interactions, for
example, that might predispose a sample to a certain microstructure (Luo, Scriven, and
Francis 2007), or particle instabilities that cause the initial suspension to be
inhomogeneous (Zhao et al. 2006).
A liquid latex droplet is placed between two brass cylindrical freezing hats, each
with a diameter of 1 mm, as shown in Figure 3.3. One hat is 200 μm deep, and the other
is 100 μm deep. They are then sandwiched together to form a 300 μm thick sample.
Such a thick sample will not cool quickly enough to produce a crystal-free specimen by
plunge freezing into a cryogen. Instead, the sample sandwich is inserted into a high
pressure freezing machine (BalTec) where it is quickly subjected to cryogenic
temperatures and 2,100 bar of pressure. At this high pressure, minima occur in the phase
diagram of water in both the melting temperature (251 K) and the supercooling
temperature (183 K) of pure water (Bachmann and Mayer 1986). This reduces its
crystallization rate substantially. Furthermore, the viscosity of water is increased to
26
approximately 1,500 cP, which decreases the crystal growth rate of the ice if crystals do
nucleate (Kiss and Staehelin 1995). Therefore, at 2,100 bar of pressure the critical
freezing rate to avoid nucleation is only 100 K·s-1
, which was easily obtained in the high
pressure freezing machine.
Once the sample was vitrified, the two freezing hats were separated with a cold
knife under a bath of liquid nitrogen to expose the interior of the sample droplet. One
half was loaded into a Gatan 626 cryostage, which maintained a low sample temperature
to prevent recrystallization of the water. In a Balzers MED 010 sputtering coater,
vitreous ice was sublimed at −96 °C under vacuum from the top layer of the fractured
surface to uncover more of the particles. Finally, the sample was sputter coated with a
thin layer of platinum to reduce charging in the microscope and the sample was inserted
into a Hitachi S900 FE SEM for imaging at −170 °C.
3.2.3 Common Artifacts in CryoSEM Samples
Artifacts are commonly seen in cryoSEM images. Some of these artifacts are
catastrophic to the sample, whereas others can be used by an experienced microscopist to
explain the image.
Poor sample freezing. Unhelpful artifacts include the crystallization of the sample
liquid due to slow freezing rates. As ice crystals form, solids are pushed to grain
boundaries. Figure 3.4 is an example of a coating that was frozen instead of vitrified,
showing telling particle-free zones where ice crystals have grown. In coatings that were
too thick to vitrify when plunged into liquid ethane, ice crystals often preferentially
formed in a direction perpendicular to the substrate. An example of this is shown in
Figure 3.5. In Figure 3.5a, striated ice crystals have caused the fracture surface to be
three dimensional. In Figure 3.5b, the fracture surface is planar but a striated structure is
evident in the silica particle distribution. To reduce the occurrence of crystallization
artifacts, it was found through experience that coating thicknesses should be kept well
below 100 μm if the plunge-freezing method is used during sample preparation.

27
Figure 3.4 CryoSEM image of a silica/water coating cross section showing evidence of
ice crystals formed due to insufficiently fast sample freezing rates
Figure 3.5 CryoSEM images of silica/water coating cross sections showing evidence of
ice crystals formed due to insufficiently fast sample freezing rates.

28
Figure 3.6 Examples of ice contamination from room humidity on cryoSEM samples.
Ice Contamination. If the sample was exposed to room air after it is frozen, water from
the room humidity condensed onto the sample and froze. An example of this is shown in
Figure 3.6a, where a slight amount of contamination decorated usually smooth latex
particles with a bumpy texture. Figure 3.6b is an image of another latex that has been
grossly contaminated. Here, so much water has frozen on the sample surface that the
particles have been completely obscured. Depending on the amount of contamination, the
temperature at which it deposited, and the material that it deposited onto, water
contamination takes many forms. In some cases, it mimics coating solids. From
experience, ice particles often had facets, were polydisperse in size, were not perfectly
spherical and were unordered whereas the coating particulates studied in this thesis were
smooth, perfectly round, often monodisperse, and often locally ordered. If there was
doubt as to whether an object was ice, the scale of the object usually provided the answer.
If its identity was still uncertain, imaging the fracture surface of the silicon substrate was
sometimes helpful; if contamination was on the coating, it would also be deposited onto
the silicon substrate which underwent the same sample preparation procedure. To avoid
ice contamination, the sample should never be exposed to the air as it is being prepared
for insertion into the microscope.

29
Figure 3.7 CryoSEM image of a latex dispersion where most water has been sublimed
away leaving strands of soluble material (“junk”) visible between particles
“Junk” After sublimation, soluble material such as surfactants, biocides, or residual
monomer left over from the latex synthesis can be left behind as strands that span the
porespace. An extreme example is shown in Figure 3.7. In previous papers, these
strands were termed “junk.” (Gong, Davis, and Scriven 2008) Junk is not an indication
of a bad sample, although it can provide some insight into the movement of the liquid
phase. For example, a high concentration of junk is sometimes seen at a coating edge,
indicating that during drying a large amount of liquid has been pulled toward the edge
due to capillary forces and has evaporated away, leaving the junk behind.
Lateral Drying. Because the size of cryoSEM samples is limited by the SEM sample
stage, samples often dry with a significant lateral character. Figure 3.8 shows a particle
consolidation front that is moving from the air-water interface down towards the substrate,
and also from the edge inwards towards the middle of the coating. Edge-in drying is
sometimes detrimental, since in most cases top down drying is of main interest to a study.
In this case, imaging the center of the sample away from the edge and limiting the
coating thickness so that the coating center dries in a top down manner before the lateral

30
Figure 3.8 CryoSEM cross section image of a coating edge showing a particle
consolidation front moving from the top down and the edge in. The consolidation front is
marked with a dashed line for clarity. This image was stitched together from three
separate images, creating variations in contrast from left to right.
drying front approaches the center is one way to avoid the effect. However, edge-in
drying can be helpful in that it produces a range of drying stages in the same sample that
can all be studied and imaged. The lateral drying front is discussed further in Section
3.4.3.
Pullouts. For unknown reasons, even though the latex particles were well below their
glass transition temperature when samples were fractured, the particles often deformed
plastically producing an artifact termed “pullouts”. Pullouts were often useful, since their
appearance was a main indicator of the drying stage of the latex coating. Ge (2006;
2005) systematically studied pullout formation and documented the many forms that
pullouts can take. Figure 3.9, which summarizes some of the common forms of pullouts
in various stages of film formation has been adapted from her work.
From the dispersion to the consolidation phase, latex particles did not contact one
another. They adhered strongly to the surrounding frozen matrix, and so when the
sample was fractured individual particles were stretched into elongated “dogbone” or
“horn like” shapes. Also in the consolidation phase, sockets where particles were
plucked from the surrounding matrix were evident.
In the compaction phase, particles flatten against each other, taking on a
hexagonal appearance. Only van der Waals forces adhere particles, along with any
residual water that may still exist in the shrinking porespace. Depending on the

31
adhesives strength, the fracture will either cause pullouts or will go around the particles at
their contact points.
In the coalescence stage, polymer chains begin to migrate between particles,
fusing them together and erasing their boundaries. Consequently, pullouts bridge
multiple particles. After coalescence is completed, the coating fractures much like a
sheet of bulk polymer. No pullouts form, although the coating will sometimes craze.
Besides the drying stage, the extent to which particles are drawn has been shown
to depend on polymer modulus, particle size, and glass transition temperature (Ge 2006;
Ge 2005).
Figure 3.9 Latex pullout appearance as compared to drying stage. Adapted from Ge
(2005).

32
Figure 3.10 Water droplet that condensed onto the top surface of a latex coating before
the sample was vitrified
Condensation. If a sample is dried at a low temperature in a low humidity sample
preparation chamber, when it is removed to the room air to vitrify it water droplets from
the warmer, more humid room air may deposit onto its top surface. Then, when the
sample is vitrified, these water droplets appear on the top surface of the sample. Figure
3.10 is a cryoSEM top surface image of a latex coating that was dried under 10 °C
nitrogen flow, removed from the cool, dry nitrogen into a humid room, and then frozen in
liquid ethane. This droplet was almost 0.5 μm in diameter. It is very easily distinguished
from frozen ice contamination that condenses onto the sample after it is vitrified which is
much smaller and foreign in shape.
To avoid condensation, the liquid ethane cryogen can be put into a dry
atmosphere, or the controlled environment vitrification system (CEVS) can be used to
plunge freeze the samples (Bellare et al. 1988; Ge et al. 2008). The CEVS has a spring
loaded plunger that quickly drops the sample from a controlled environment drying
chamber to the liquid ethane before condensation can occur.

33
3.3 MINIMUM FILM FORMATION TEMPERATURE BAR
The drying temperature of a coating affects the evaporation rate of the water from
the film as well as the modulus of elasticity of polymeric solids. A typical latex coating
has a minimum temperature below which the particles are unable to deform into a
continuous layer of solids under forces present during the drying of the coating. This
temperature is usually near, though not necessarily equal to, the glass transition
temperature of the polymer phase. When the water evaporates from a film which is
below its minimum film formation temperature (MFFT), incomplete particle coalescence
results in air voids large enough to scatter light, making the film cloudy. Cracking may
also occur. Therefore, the MFFT is defined as the lowest temperature that a transparent,
crack free film will form.
The standard ASTM test D2354 outlines a process by which the MFFT of a film
can be determined (Bailey and Baldini, 2005). The coating liquid is cast down on a flat
metal plate using a 75 μm cube applicator. A temperature gradient is maintained down
the length of the plate as the coating dries, and 4L·min-1
of dry air is blown across the
coating in a steady stream. When the film is fully dry the transition temperature between
the resulting clear, fully formed film and the opaque brittle film is declared the MFFT.
An MFFT bar (Figure 3.11) (MFFT90, Rhopoint) is a machine that has been designed to
create the ASTM standard drying conditions.
Although minimum film formation temperatures are not of specific interest in this
research, the minimum film formation temperature bar built for the MFFT test is helpful
to efficiently produce coatings at a range of temperatures at once. The MFFT
environment is also highly controlled and standardized, allowing easier experiment
replication.
Instead of coating directly on the MFFT bar as recommended in the ASTM
standard procedure, a thin sheet of PET is taped down on the metal plate. The
temperature of the PET is allowed to equalize with the bar and the coating is cast down.
Once the film is dry, the PET can be peeled from the bar and the sample saved for later
analysis.

34
Figure 3.11 Minimum film formation temperature bar used in this report to efficiently
produce samples at a range of temperatures. Samples are drawn down using a 0.75 μm
cube applicator onto a metal bar. A temperature gradient is maintained down the length
of the bar and 4 L/min of air is blown across the coating according to ASTM standard
D2354.
3.4 CANTILEVER STRESS MEASUREMENT TECHNIQUE
As discussed in Chapter 7, stresses develop during the drying of a coating,
sometimes causing failures such as cracking, delamination, or curling. During
solidification, the coating solids content, modulus and thickness all change drastically.
To measure the dynamic coating stress during drying, it is necessary to have a technique
that does not require the knowledge of these properties. Stoney (1909) first proposed a
method to measure coating stress by observing the deflection of a substrate. As stress
develops within a coating, the substrate will curl in response as long as there is perfect
adhesion between the coating and the substrate. This deflection can be measured as the
coating dries and related to the coating stress by understanding the solid mechanics of
beam bending.
3.4.1 Background
Observing the curl of thin metal electrolytically deposited coatings, Stoney made
the observation that “...the metals are deposited under tension, and if so that they should
strain the material on which they were deposited so as to bend it; and that by the amount
of this bending the tension under which they were deposited could be determined.”(1909)

35
To test this principle, Stoney derived an equation relating the radius of curvature, r, to the
average coating stress σ, by (Stoney 1909):
rc6
Et 2
(3.1)
where t and c are the substrate and coating thickness, respectively. This equation
assumes that the coating and substrate moduli, E, are similar and the coating thickness is
much less than that of the substrate.
Stoney used long, thin substrates, where the radius of curvature of the beam of
length L could be related to the displacement of the free end, d, by:
d
r2
L2
(3.2)
Combining Equations 3.3.1 and 3.3.2, gives an equation relating coating stress to the
deflection of the free end:
2
2
3
Et
cL
d (3.3)
Stoney used this method to estimate the stresses in thin nickel coatings deposited on steel
(1909).
Corcoran adapted Stoney’s method using plate theory by recognizing that the
stresses away from the edge are biaxial, and that the bending of the cantilever relaxes
some of the coating stress (Corcoran 1969). He derived the following equation for the
biaxial in-plane stress averaged through the coating thickness:
(3.4)
where Ec and Es are the Young’s modulus of the coating and the substrate, and υc and υs
are the Poisson’s ratios of the coating and the substrate, respectively. This equation
assumes uniform stress within the elastic limits of the substrate and the coating, isotropic
physical properties, and cantilever deflections are much less than the radius of curvature
of the beam. Corcoran also assumed that the neutral axis of the coated cantilever is
midway through the substrate thickness, which is accurate only when the substrate is
much thicker and stiffer than the coating. Using a finite element model to estimate the
stress in a polystyrene coating applied to a silicon cantilever, Payne observed that the

36
coating stress was well approximated by Corcoran’s equation for small coating
thicknesses (<1/3 that of the substrate) without correcting the position of the neutral axis
to account for the unequal physical properties of the modulus and the substrate (Payne
1998).
Corcoran’s equation in its full form necessitates the knowledge of dynamic
coating properties such as the modulus and Poisson’s ratio to calculate the stress relief
that is experienced due to the deformation of the cantilever. However, if the coating
modulus and thickness are much less than that of the substrate, the second term that
accounts for this stress relief can be neglected, and Equation 3.4 can be used to estimate
coating stress without knowledge of coating physical properties.
3.4.2 Stress Measurement Apparatus and Procedure
A stress measurement apparatus using the discussed cantilever deflection
principle was built in-house by Payne and adapted by Vaessen to measure the stress in
drying polymeric coatings (Payne, McCormick, and Francis 1997; Payne 1998; Francis et
al. 2002). This apparatus was designed with a coating station to reproducibly spread
liquid onto a long, thin cantilever, and a drying chamber where the substrate deflection is
measured as the coating dries in a controlled environment. The apparatus is very
adaptable to many coating and drying methods.
The substrate material can be changed in order to accommodate many different
types of coatings with a large range of expected drying stresses. The substrate modulus
should be chosen to control the signal to noise ratio of the measurement. Steel (G = 130
GPa, ν = 0.29), silicon wafers (G = 170 GPa, ν = 0.27) and glass coverslips (G = 60.1
GPa, ν = 0.23) have been used with success (Vaessen 2002). When glass coverslips are
used, they must be made reflective by sputter coating a thin layer of gold or
gold/palladium on the underside of the substrate. Typical substrate dimensions are 45
mm x 6 mm when clamped. Isopropanol or other solvents are used to clean the substrates
before clamping.
Before coating liquid was applied, each substrate is calibrated. The substrate is
placed into the sample chamber where a 1 mW HeNe laser (Model 79260,

37
Figure 3.12 Cartoon of substrate calibration, showing the clamping of the substrate and the
micrometer hook
Oriel Corporation) is reflected off of a position 15 mm from its free end. The vertical
deflection of the substrate is measured by recording the position of the reflected beam on
a photodiode (#DL-10; UDT Sensors Inc.) with a resolution of less than 1 μm. To
calibrate the substrate, a hook is placed at the free end of the cantilever and is pulled up
incrementally with a micrometer (Figure 3.12). The relationship between substrate and
deflection and photodiode output is then recorded. Although the curvature of the
substrate is different between point loading, as in this calibration routine, and distributed
loading, as in the drying of a coating, Payne (1998) showed that the deflection at a
distance of 1/3 the length of the cantilever from the free end will be the same in both
cases.
The coating liquid is spread onto the substrate in the coating station of the stress
measurement apparatus. The coating station is adaptable to use either Mayer rods or a
coating blade. The blade coater has an adaptable gap height that is controlled with a
micrometer. The substrate is pushed through the coating station using an electronic
motor with an adaptable speed, leaving a reproducible coating thickness. In Chapter 7 of
this thesis, a Mayer rod was used to produce latex coatings with final thicknesses of about
30 μm.

38
Figure 3.13 Schematic of the relevant aspects of the stress measurement apparatus
Once coated, the substrate is pulled into the drying chamber where it is solidified
as the substrate deflection is measured (Figure 3.13). Dry nitrogen is blown into the
drying chamber at a rate of 4 L/min to control the humidity. To observe the effect of
temperature on the drying of films, the nitrogen can be passed through a slurry of dry ice
in isopropanol before it is fed into the drying chamber. While the sample was drying, it
was possible to film the coating from above using a video camera (#KP-D50; Hitachi
Ltd.). After the sample was dry, the final coating thickness was measured using a
micrometer (#543-253B, #7004; Mitutoyo Corp).
3.4.3 Weight Loss
In Chapter 7, latex coatings were applied to glass cantilevers (#12-545M
coverslips, Fisher Scientific) for stress measurements. Due to the relatively low amounts
of stress that developed in these coatings, the cantilever deflection resulting from the
weight loss due to evaporation was not negligible as compared to the deflection resulting
from coating drying stresses. Since the weight loss is predictable from a measurable
drying rate, this deflection could be accounted for and subtracted from the total recorded
deflection.

39
Figure 3.14 Amount of water in a latex (x) and latex + 2 vol% silica aggregate (○)
coating applied to a cantilever versus time. The coatings were dried in the stress
measurement apparatus controlled environment chamber under a flow of nitrogen at 10
°C.
The stress measurement apparatus has the ability to measure and digitally record
weight changes in a coating that is dried under the same conditions as it would be during
a stress measurement. An analytical balance (AG 245, Mettler Toledo Inc.) is placed
above the drying chamber and a coated cantilever of length L, width w, and thickness h is
hung from a hook in the chamber. As the coating dries, its mass, m(t), is recorded in five
second intervals until it is dry (Figure 3.14). The mass loss was fairly well approximated
by a period of constant evaporation followed by a period of no weight change. To
simplify the mass loss correction, therefore, a constant evaporation rate, dependent on the
drying temperature, was assumed spanning the time from the start of the measurement
until the time that the coating was estimated to be dry (tdry). This tdry was straightforward
to estimate for each sample from the final coating thickness, the cantilever dimensions,
and the initial solids content of the dispersion. Considering the relatively small
magnitude of the total correction, inaccuracies resulting from simplifying the evaporation

40
rate in this way were estimated to be slight.
The weight change was converted into beam deflection, dwt, by (Popov 1952;
Vaessen 2002):
434
334
2
)()( LxLx
LEwh
gtmtdwt (3.5)
where g is the gravitational constant, E is the substrate modulus, and x is the distance
from the free end (in this thesis, x = 15 mm). This deflection due to weight loss was then
subtracted from the total deflection that was measured. In the data presented in Chapter
7, weight loss corrections were on average 0.02 MPa, whereas typical final drying
stresses were on the order of 0.4 MPa.
3.4.4 Limitations of the Stress Measurement Technique
Although stress measurement using Stoney’s cantilever beam method is a
powerful technique for measuring coating stress, certain assumptions must be understood
about the method that must be taken into account when interpreting data.
The largest limitation of the stress measurement technique is its assumption that
the entire sample experiences the same level of stress at any given time. However,
coatings as small as the cantilever substrates used for stress measurements often dry from
the edge-inward due to their large edge-to-center area ratios. Since the dispersion must
curve downward to meet the substrate at the sample edges, the edges must be thinner than
the coating bulk. This thinner region dries faster than the coating center. There are some
studies that also claim that the evaporation rate is faster at the edges than it is at the
coating center due to the larger surface area for evaporation and an increased volume for
the escaping water vapor to be removed from the coating (Winnik and Feng 1996;
Winnik 1997). Once drying starts at the edges, capillary forces can drive particle flow to
the perimeter, sustaining the lateral drying (Deegan et al. 1997). Routh and Russel
(1998) estimated the capillary pressure that must be present in order to drive this lateral
flow.
Because Equation 3.4 assumes that the drying stress acts uniformly over the entire
cantilever surface, stresses that develop during lateral drying cannot be accurately
41
measured using the cantilever beam method. When the stress varies over the substrate
area, Equation 3.4 calculates the average stress over the entire sample at any time. To
minimize lateral drying, the coating can be made thin and the solids content of the
coating dispersion can be increased. Jindal (2009) added a border to the cantilever, which
made the wet coating one uniform thickness all of the way to the edge. He showed that
the stress profile of a coating that dries purely from the top down is significantly different
than one that dries from the edge-in. The stress maximum is higher and is maintained for
a shorter duration when the lateral drying front is removed. However, Jindal’s border,
currently made from rope caulk, does not work for every coating system. The dispersion
must wet the border in a way that the edge does not curve and the border prevents Mayer
rods to be used to spread the dispersion evenly on the substrate. New border materials
are being explored to improve the wettability and the reproducibility of the border.
However, for the stress measurements of latex coatings presented in Chapter 7, the state
of the art in the border technique was insufficient for preventing lateral drying.
Finally, when converting cantilever deflection into stress using Equation 3.4 the
coating thickness was approximated to be constant with time and equal to the final
coating thickness. This approximation was justified by recognizing that stress does not
develop until the coating solids reach a critical packing fraction. After this critical
packing is reached, the coating thickness changes by only very small amounts in a
coating of hard particles. However, if the solids can deform such as in the case of a soft
latex, then the critical solids volume fraction when stress starts to develop (ϕ ≈ 0.64) is
significantly different than the final solids volume fraction (ϕ = 1). Vaessen (2002)
showed that this constant thickness assumption can underestimate the drying stress
especially early in the drying when the assumed thickness and the instantaneous thickness
are the most unequal. Vaessen (2002) demonstrated that a time variable coating
thickness could be estimated from weight loss data, but for soft latex coatings the effect
of particle deformation on coating thickness must also be taken into account. This effect
was ignored in calculating the coating stress.

42
CHAPTER 4
EDGELESS COATINGS
4.1 INTRODUCTION AND MOTIVATION
On industrial scales, coatings have widths on the order of meters; however, it is
impractical to experiment with samples of such scales in the laboratory. As coating sizes
shrink, edge effects have greater importance until most of the sample is affected by its
proximity to the perimeter. Such a sample dries very differently than one with a large
area. Experimental results from laboratory scale coatings, therefore, must be classified as
deriving from or free from edge effects (Juhué et al. 1995).
Edges differ from the bulk coating because they are inherently three-dimensional.
They must curve down to meet the substrate, creating a local area of higher pressure in
the liquid as predicted by Laplace’s equation. Since the coating bulk has a flat interface
at atmospheric pressure, a pressure gradient can develop that drives solvent towards the
center of the coating, creating thin edges (Radhakrishnan and Scriven 2005).
Furthermore, evaporation rates may be higher at the perimeter since solvent diffusion is
possible in the plane of the coating as well as perpendicular to it (Radhakrishnan and
Scriven 2005). This leads to lateral drying, where the edges solidify many times faster
than the center.

43
Lateral drying creates nonuniformities between the center and the perimeter of the
film and can affect even the macroscopic appearance of coatings. For example, coffee
rings on tables form when the edges of a liquid coffee droplet are pinned in place. The
thin outer perimeter of the droplet dries before the bulk, and small liquid menisci develop
there as the water begins to invade into the particle packing. In this scenario, the
curvature of the liquid causes a lower pressure to develop at the edge which can drive
flow of solvent and solids to accumulate there (Deegan et al. 1997; Maenosono et al.
1999). Particulate coatings that have dried laterally will consequently often have a thin
center. This “last spot to dry” in the center of the coating is often also non-representative
of the bulk of the sample. For example, Steward et al. have found that this location has
more time to form particulate order due to its increased drying time (Steward, Hearn, and
Wilkinson 2000).
Complex, three dimensional states of stress exist at the coating edge, as compared
to the largely two-dimensional constrained shrinkage that is experienced at the center.
Edge stress can be the source of many common unwanted defects. With no force acting
parallel to the substrate to counteract peeling forces, delamination and curl often originate
at the edge (Lei et al. 2001; Lei et al. 2002; Okubo 2002; Radhakrishnan and Scriven
2005). Lateral drying also creates gradients in solids concentration, coating modulus, and
stress that facilitate cracking. Coatings that have dried laterally often exhibit a series of
parallel cracks that run perpendicular to the drying front and open with a lower fracture
energy than is required to fracture a similar coating that is drying top-down (Pauchard et
al. 2003; Lee and Routh 2004; Tirumkudulu and Russel 2005; Jindal 2009).
If the coating is large, edges are often disregarded as anomalies. In large scale
production, if an edge cannot be controlled it is merely cut from the final product as
waste. In creating small laboratory samples, however, edges are prevalent and can dictate
the way in which an entire sample dries. This can create drastically different phenomena
that are not observed on larger scales.
A study performed on small samples which are dominated by edge effects is not
relevant for developing new coating practices on industrial scales. However, laboratory
analysis equipment often require small samples to be made. Here, it is shown that by

44
rounding the substrate into a cylindrical shape film formation edge effects can be avoided
while maintaining a sample size that is practical for examination in a scanning electron
microscope. The procedure details how to dip coat a hollow glass tube, fracture it to
expose the coating cross section, and mount it for imaging. The curvature of the cylinder
completely eliminates two of the edges, and the remaining two ends can be avoided when
choosing an area of the sample to study.
4.2 BACKGROUND: DIP COATING CYLINDERS
The curvature of the cylinders prevents use of many conventional coating
methods to create a uniform film. Dip coating, however, is adaptable to many different
coating geometries and is consequently an ideal choice for this application.
Before proceeding with any coating process, it is best to have an idea of the final
film thickness. Landau and Levich derived an estimate for the thickness of a wet film on
a flat plate pulled slowly from a bath of a Newtonian liquid (1942). During dip coating,
the viscous drag from the rising substrate pulls coating liquid upwards, but gravity causes
the liquid to drain back towards the pool. The coating liquid curves as it meets the
substrate, and the resulting low pressure in the liquid in this region also pulls liquid
downwards. These effects have been accounted for in a force balance, giving a
relationship for the prediction of the wet coating thickness, h, from the liquid viscosity, μ,
surface tension, σ, and density ρ, for a given substrate speed V (Landau and Levich 1942;
Quere 1999; Scriven 1988):
2/1
6/1
2/16/1
994.0994.0
g
VCa
g
VVh
(4.1)
This relationship is valid given that the capillary number, Ca= μV/ σ, is small.
For high capillary numbers, the film becomes thicker and gravitational forces overwhelm
surface tension, creating deviations away from Equation 4.1 (Quere 1999).
When dip coating a cylinder, the curvature of the coating liquid due to the
substrate radius causes an additional pressure effect that must be accounted for. This
curvature causes the pressure at the base of a cylinder to be even lower than that in a flat
plate. The final wet coating thickness is consequently thinner. The strength of the

45
pressure force to the gravitational force is estimated by the Bond number, given by
(Quere 1999):
2grBo (4.2)
If the Bond number is greater than unity, then gravitational forces are dominant and the
dip coating of the cylinder can be treated as a flat plate, using Equation 4.1. If the Bond
number is much less than unity, the pressure effect due to the curvature of the cylinder
radius, r, cannot be neglected and the Bretherton law should be used to predict film
thickness (Quere 1999):
3/234.1 rCah (4.3)
Quèrè reviews further corrections to these correlations due to surfactants,
intermolecular forces, and inertial effects, all of which can thicken the film past its
predicted value (Quere 1999; Shen et al. 2002). Substrate roughness was also found to
increase the wet thickness, as observed by Krechetnikov and Homsy ( 2005).
4.3 METHOD PROCEDURE
The main goal of the new technique is to produce a cylindrical coating that is
small enough for observation in a scanning electron microscope (SEM) yet is free from
edge-in drying. After drying, fracture of the substrate reveals a view of the coating cross-
section. The sample is mounted on an SEM stub and is imaged end-on.
Hollow Pyrex tubing (Wale Apparatus BS-004) was chosen as the substrate since
it is produced to strict diameter specifications with a low thermal expansion coefficient, a
must for cryo-SEM work. Glass undergoes brittle fracture at all relevant temperatures,
which is necessary if coating cross-sections are the focus. Plastic deformation of the
substrate would distort the coating, either by stretching it or by causing delamination.
Hollow tubing was chosen since it was thought to be easier to fracture than solid glass
rods. Its 4 mm diameter was also picked for easy fracture and satisfactory viewing in the
SEM.

46
Figure 4.1. The dry thickness, h, of a 90% Rohm and Haas Opaque Polymer, 10%
polyvinyl acetate binder blend on a 0.5cm outer diameter glass tube versus dip coating
speed, V. The data show a linear relationship with V2/3
, consistent with Equations 4.1
and 4.3.
Because hollow latex deforms easily when stressed, Rohm and Haas Opaque
Polymer is used as the test coating liquid. By observing fractured, stretched, or collapsed
latex particles, the quality of the sample preparation is then obvious. A few drops of
polyvinyl acetate latex (Air Products 405) was added to bind the opaque polymer since
hollow latex has a high glass transition temperature and is non-film forming at room
temperature.
4.3.1 Preconditioning
In order to produce a controlled fracture at a predetermined location, a small
notch was made in the glass at the preferred fracture point using a rectangular tungsten
blade. This notch specifies where the sample ultimately is fractured and imaged, and is
positioned accordingly. Strategies for its positioning are discussed in Section 4.3.3.

47
The tubing surface was then cleared using distilled water and warm (80°C) 10
wt% HCl solution to remove surface dirt to improve adhesion of the latex (Pulker 1984).
Sonication for 15 minutes was also effective.
4.3.2 Dip Coating
Substrates were dip coated in order to produce uniform, reproducible samples. A
substrate withdraw speed of 1 mm/s was used by default to achieve a target wet coating
thickness of about 30 μm as given by Equation 4.3. The Bond number for this
configuration is approximately 0.5, assuming the latex has roughly the density and
surface tension of pure water.
Figure 4.1 shows that the withdraw speed can be predictably adjusted to tailor the
final coating thickness. The relationship between speed and coating thickness followed
the correlations predicted by Equations 4.2 and 4.3, with thickness scaling as V2/3
.
Thicknesses were estimated from SEM images.
After coating, each sample was allowed to dry in ambient conditions. To preserve
the uniformity of the sample it was best to hang them in an upright position until they
were fully dry.
4.3.3 Fracture
Once the coatings dry on the glass tubing, the tube was fractured to reveal the
coating cross section. It was expected that the most brittle fracture was best for
maintaining the native structure, so samples were first frozen in liquid nitrogen to ensure
that all components of the latex coating were significantly below their glass transition
temperature (Severs and Shotton 1995). Freezing the sample requires excellent adhesion
between the coating and the tubing since the materials may have unequal thermal
expansion coefficients. Acceptable samples were also prepared using a room temperature
fracture.
In order for the sample to stand upright in the SEM, it must be small enough to be
inserted into the viewing chamber. The fracture surface must lie at a level that gives a
suitable range of working distances for both high magnification viewing and large depths

48
Figure 4.2 Coated glass tubing and SEM stubs (top and side view). Holes drilled in the
SEM stubs are the exact size to accept the hollow tubing without disrupting the latex
coating on its outer surface.
of field. However, breaking glass tubing by hand is extremely difficult to form lengths of
1 cm or less, especially when the fracture must be controlled, predictable, and made
without handling or scratching the outside of the tubing.
In order to overcome these difficulties, a sample holder was designed from a
cylindrical 15 mm diameter SEM stub (Ted Pella, 16324). A hole that was the same size
as the outer diameter of the glass tubing was drilled all of the way through each stub
(Figure 4.2). The tubing slid through the hole easily, yet the fit was snug so that the two
pieces were always in contact. This was important, since the stub later served as the
sample mount for the SEM, and charge will be dissipated through this contact.
The tubing was inserted into the SEM stub so that the stub top surface was level
with the notch made earlier before the tubing was coated. If the sample was frozen, the
SEM stub and tubing should not be removed from the liquid nitrogen until, if desired,
after the fracture. A generic plastic stub holder was used to hold the SEM stub steady in
the liquid nitrogen. The tubing should extend out from the liquid nitrogen (5-6 cm) so it
provides a room-temperature handle on the glass. A sharp pull of the tubing in the
direction away from the notch snapped the glass, creating a clean fracture (Figure 4.3).

49
The object of this sample preparation method was to remove edge effects, so
sampling near the bottom edge of the glass tubing was avoided. Since the holes in the
stubs spanned the entire metal stub width, it was simple to put the sample fracture
centimeters high on the glass tubing by sliding the stub higher. Any glass protruding
from the bottom of the SEM stub was broken off using exactly the same method as the
original fracture, provided that the glass has been notched in the correct fracture points
beforehand.
4.3.4 Preparing the sample for imaging
After the fracture, both holder and tubing were removed carefully from the liquid
nitrogen and allowed to warm to room temperature. Conductive carbon tape was applied
on the underside of the stub both to stop the sample from falling through the holder and
to provide extra conductive contact to dissipate charge while in the microscope. The best
images were obtained when the sample is flush with the SEM stub. If this was not
achieved during the sample preparation, tape was applied to the base to level the sample
fracture plane with the top surface of the stub. However, a controlled, premeditated
fracture did not require such adjustments. Finally, the sample and stub were sputter
coated with a thin layer of platinum just as any other nonconductive sample before
loading it into the microscope.
4.4 RESULTS AND DISCUSSION
Sample SEM micrographs of coatings prepared using this technique are shown in
Figures 4.5-8. Most often, a controlled break was formed; the latex fractured on the same
plane as the glass without crushing or deforming the particles. The hollow latex
sometimes tears open, demonstrating that the force binding the particles to themselves
and to the glass was greater than the strength of the particles. More particles were torn
open if the coating was fractured in liquid nitrogen, perhaps because the polymer binder
used to hold the hollow latex particles together had a higher modulus at lower
temperatures, making it more effective.
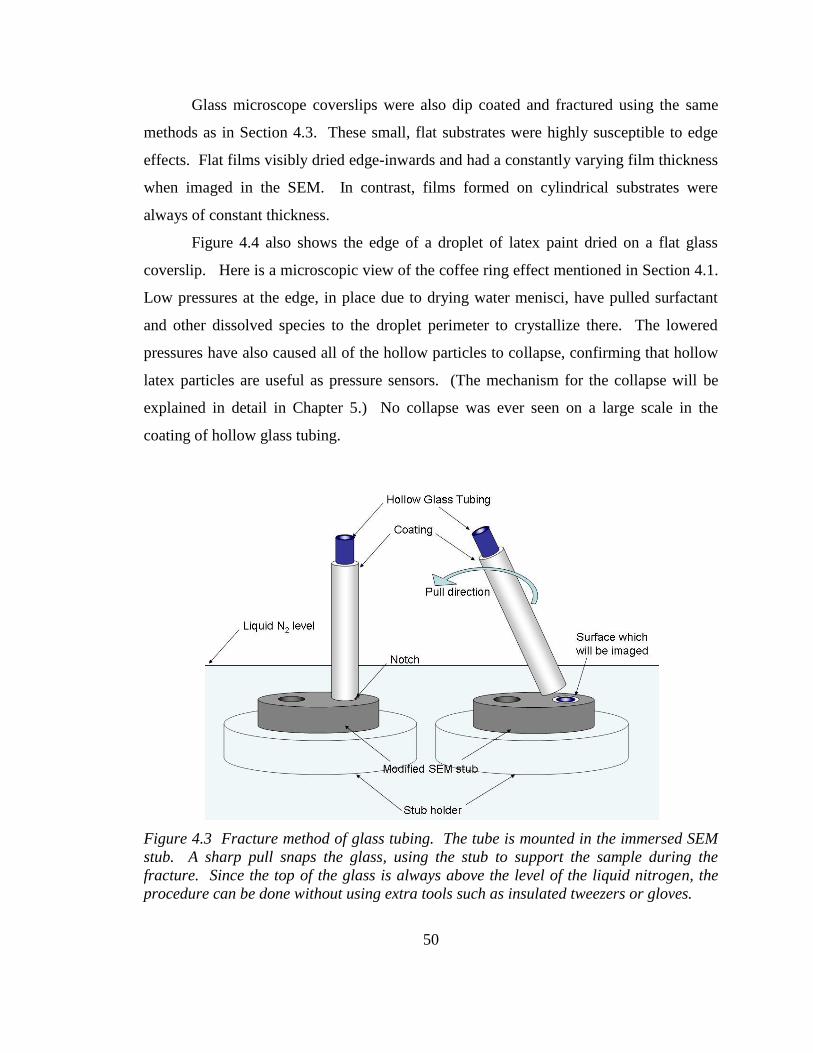
50
Glass microscope coverslips were also dip coated and fractured using the same
methods as in Section 4.3. These small, flat substrates were highly susceptible to edge
effects. Flat films visibly dried edge-inwards and had a constantly varying film thickness
when imaged in the SEM. In contrast, films formed on cylindrical substrates were
always of constant thickness.
Figure 4.4 also shows the edge of a droplet of latex paint dried on a flat glass
coverslip. Here is a microscopic view of the coffee ring effect mentioned in Section 4.1.
Low pressures at the edge, in place due to drying water menisci, have pulled surfactant
and other dissolved species to the droplet perimeter to crystallize there. The lowered
pressures have also caused all of the hollow particles to collapse, confirming that hollow
latex particles are useful as pressure sensors. (The mechanism for the collapse will be
explained in detail in Chapter 5.) No collapse was ever seen on a large scale in the
coating of hollow glass tubing.
Figure 4.3 Fracture method of glass tubing. The tube is mounted in the immersed SEM
stub. A sharp pull snaps the glass, using the stub to support the sample during the
fracture. Since the top of the glass is always above the level of the liquid nitrogen, the
procedure can be done without using extra tools such as insulated tweezers or gloves.

51
Figure 4.4 Edge effects: cross section images of a flat glass coverslip dip coated using a
90% hollow latex, 10% polyvinyl acetate binder latex solution. In A and C, the coating
has been reduced to a monolayer at the glass edge. B shows the same sample as in A
closer to the middle of the glass. Coating thickness varied throughout both samples. D)
A droplet of hollow latex containing no binder dried on PET. Surfactant has diffused to
the edge of the droplet, covering a monolayer of hollow spheres. Low pressures during
drying at the edge have collapsed all of the particles in this layer, and a crack has formed
due to drying stresses.

52
Figure 4.5 Cross section image of hollow latex on glass tubing. A small amount (10
wt%) of soft polyvinyl acetate latex was added to high Tg hollow latex to form a
continuous coating on glass tubing. The coating fractured on the same plane as the glass,
suggesting that it was not subjected to large shear forces.
Figure 4.6 Cross section of a thin coating of hollow latex with a 10 wt% polyvinyl
acetate binder on a glass tube substrate. One latex particle has partially torn open
during the fracture.
0.5μm

53
The fracture mode of hollow tubes is different from that of flat samples. The
stress on the tubing during its breakage is transferred to the coating through the adhesion
between the two. In the ideal fracture, the torque on the glass causes a purely tensile
force on the notch, prompting this crack to propagate. As the crack opens around the
cylinder, the remaining glass holding the two separating halves together experiences an
increasingly large compressive force. Delamination of the coating is sometimes seen at
the point opposite the notch, presumably due to these forces, which most likely occur
before the crack reaches this point. Though this point can experience a compressive
force, on a local scale the propagating crack always opens in a state of tension. The latex
on the compressive side is usually indistinguishable from the tensile side, though tests
with thicker coatings should be made before definite conclusions are drawn.
In reality, the stress on the tube is more complex than a pure bending motion. The
last point to break reproducibly fractures at a point, out of the plane of the notch.
Whether it is because the tubing is loose in the SEM stub or because the torque on the
glass also includes some upward force, this point signifies that the fracture is not due to
simple bending stress. This anomaly makes orientation in the SEM easier, and makes the
compressive and tensile sides of the tubing obvious.

54
Fig
ure
4.7
M
atc
hin
g h
alv
es o
f th
e sa
me
holl
ow
tube
wer
e cr
eate
d b
y pla
cing t
he
gla
ss i
nto
the
hole
in B
, fr
act
uri
ng i
t,
inve
rtin
g i
t and p
ush
ing i
t up t
hro
ugh t
he
hole
in A
. T
he
rem
ain
ing l
ong e
nds
of
gla
ss p
rotr
udin
g b
elow
the
SE
M s
tub
wer
e th
en s
napped
off
. T
he
notc
hed
and c
om
pre
ssiv
e are
as
are
ver
y ty
pic
al.
In
A),
the
com
pre
ssio
n s
ide
is r
ais
ed a
bove
the
pla
ne
of
the
fract
ure
, and i
n B
), i
t is
rec
esse
d.
A l
ate
x dro
ple
t has
dri
ed i
n B
), s
pannin
g t
he
enti
re h
oll
ow
of
the
tubin
g.

55
Fig
ure
4.8
M
atc
hin
g h
alv
es o
f th
e co
mpre
ssiv
e are
a, opposi
te t
he
notc
h, of
a s
econd s
am
ple
. T
he
images
are
chir
al,
dis
pla
ying a
rec
esse
d a
rea i
n A
) and a
pro
ject
ed a
rea i
n B
).
A t
hin
late
x co
ati
ng c
an b
e se
en o
n
the
oute
r su
rface
of
the
tube.
T
his
late
x w
as
very
dil
ute
, and s
o t
he
dry
coa
ting t
hic
knes
s is
thin
ner
than
a
typic
al
coati
ng m
ade
by
this
met
hod.
56
CHAPTER 5
DRYING AND COLLAPSE OF HOLLOW LATEX1
5.1 INTRODUCTION
Energy and material costs are rising for the multibillion dollar architectural
coatings market, yet tough competition between industry leaders prevents passing on
increasing manufacturing costs to consumers (Reisch 2006). A third to a half of the total
materials cost of a typical latex paint is titanium dioxide (TiO2), which is used to improve
the whitening and hiding power of the coating (Wildeson 2008). One of the most
promising alternatives to TiO2 pigment is hollow latex, first developed in the early 1980’s
by Rohm and Haas (Harren 1983; Kowalski, Vogel, and Blankenship 1984). It is
considerably less expensive per volume, is less prone to agglomeration, and produces a
more scrub resistant coating than TiO2 (Fasano 1987; Anwari et al. 1993; Fitzwater and
Hook 1985) Furthermore, when used in combination with TiO2, it increases the light
scattering efficiency per pound of the ceramic (Fasano 1987; Anwari et al. 1993;
Fitzwater and Hook 1985). Since its invention, hollow latex has developed into a highly
1 This chapter was published in adapted form:
C. M. Cardinal, L. F. Francis, and L. E. Scriven, “Drying and Collapse Mechanisms of Hollow
Latex”, J. Coatings Tech. Res., 2009, 6(4); 457-459.
57
profitable specialty product for its manufacturers and many paint formulators now
consider its inclusion standard within their products (McDonald and Devon 2002).
A typical hollow latex particle that is designed for use as an opacifier in paint has
an outer diameter on the order of 0.5 μm with a central void which is approximately 40%
of the volume of the entire sphere (McDonald and Devon 2002). Commercial hollow
latex is made by encapsulating a soft polymer seed latex with a hard outer shell, swelling
the core by increasing the pH of the system above the glass transition temperature (Tg) of
the outer shell, and collapsing the core at a low temperature. Below its glass transition
temperature, the hard shell cannot shrink with the inner core, creating a water filled void
in the center of each particle (McDonald and Devon 2002; Kowalski and Vogel 1990;
Kowalski, Vogel, and Blankenship 1984). In addition to the central void, some
commercial hollow latex also contains small pores punched through the outer shell
(Figure 5.1). These latexes are marketed towards gloss improvement, with
advertisements claiming that the pores allow the particles to crush easily when calendared
between rollers into smoothness. In this study, these perforated particles are referred to
as “porous” hollow latex.
Nonporous and porous hollow latex, aside from being structurally different, are
chemically different. Porous hollow latex has an acid-free hydrophilic core, whereas
nonporous hollow latex starts with a copolymer core containing monomers with a
carboxylic acid group such as methacrylic or acrylic acid (Brown, Rufe, and Haigh 2006;
Kowalski, Vogel, and Blankenship 1984; Lee et al. 1992). Patents claim that the acid
free core makes the final product less susceptible to attracting and retaining water in the
final coating, and also less prone to aggregation (Lee et al., 1992).
Hollow latex particles are also being synthesized in academic settings, primarily
for the eventual goal of species encapsulation. One of the more successful methods of
producing large particles with only one central void is a seeded polymerization method
termed the “dynamic swelling method.” Here, polydivinylbenzene chains phase separate
to the outer surface of the latex particle during synthesis, creating a shell, whereas
polystyrene separates to the middle of the particle. Toluene is used to swell and collapse
the polystyrene core (Okubo and Minami 1997). The same group has also developed the
58
“alkali/cooling” synthesis method which follows the same principles as the commercial
synthesis (Okubo, Okada, and Shiba 2003). Other researchers have developed a variety
of other synthesis methods to produce hollow particles of varying quality (Jeong et al.
2007; Pavlyuchenko et al. 2005; Tiarks, Landfester, and Antonietti 2001; Donath et al.
1998; McDonald et al. 2000). Production of successful hollow latex is not trivial. The
core and shell polymers must adhere to one another, yet their thermodynamic behavior
must be dissimiliar for phase separation and particle swelling (Sundberg and Fukuhara
2005; Sundberg et al. 1990). If the thermodynamics of the core and seed polymers are
not considered along with their interactions with the water solvent, then other undesired
latex morphologies are possible during encapsulation such as sandwiches, hemispheres,
raspberries, and confetti, as reviewed by Sundberg et al. (1990).
When a coating of hollow latex particles is first cast down onto a substrate, the
latex particle voids are filled with water. During film formation, the voids dry, leaving
air in the center of each particle (McDonald and Devon 2002). The difference in
refractive index, n, between the nanoscale air void (nair = 1.0) and the polymer shell
(nresin ≈ 1.5) results in light scattering, making the film opaque (Lee 2002a; Lee 2002b).
Furthermore, because each air void is separated from another by the particle shell walls,
scattering is a linear function of concentration (Fitzwater and Hook 1985). This is in
contrast to titanium dioxide which agglomerates at high particle concentrations, reducing
efficiency (Fitzwater and Hook 1985; Melsheimer and Hoback 1953). In most paints,
hollow latex is used in conjunction with titanium dioxide. The two opacifiers work
symbiotically, each boosting the performance of the other in ways that are not yet wholly
understood (Hislop and McGinley 1978).
In addition to its relatively low cost, opaque polymers have many other
advantages. Because they are aqueous, rather than organic solvent based, they are
relatively harmless to the environment and the body. They can be dried and redispersed
easily for addition into products such as powdered makeup. In 2006 they were marketed
as “SunSpheres”, designed to scatter light into the active ingredient of sunscreens (Reisch
2006). Because air is an excellent insulator, the dried voids are useful in managing heat
control in products such as thermal paper (Yoshida et al. 1994). When calendared, the

59
smooth, crushed particles reflect light, making paper surfaces glossy and more easily
printed on (Yoshizumi, Masumoto, and Ytokawa 1993). However, its largest use is still
to provide opacity in paints where it has stronger interactions with the binder than
titanium dioxide, producing more durable, scrub resistant coatings that have a longer
lifetime than a similar paint containing only ceramic pigments (Fasano 1987).
Although opaque polymer has been profitable commercially for more than two
decades, the individual particles are prone to buckling when dried under certain
conditions (Harren 1983). This collapse reduces the scattering efficiency of the latex
(Brown 2008). Collapse most likely occurs when the hollow latex dries, though the
fundamental aspects by which a hollow latex particle empties during the drying of a
coating are largely unknown.
This work attempts to add a new chapter to the understanding of film formation:
the drying of hollow latex voids. It begins with a cryogenic scanning electron
microscopy study of film formation that allows both the water and the drying particles to
be imaged in intermediate steps of the drying process. This allows the film formation
stage where collapse occurs to be identified and also gives an idea of the forces which
might be involved during drying. Room temperature SEM images of fully dried film top
surfaces coated under different humidity, temperatures, and with different binder
concentrations are then presented. By quantifying the collapse percentage in these top
surface images, the relevant factors that impact particle failure were identified. A
theoretical study then proposes a probable model for the drying of an individual sphere,
and demonstrates how the relevant parameters found in the experimental work can
influence collapse in this model. Throughout, the drying mechanisms of smooth walled
hollow latex is compared to the drying of porous walled hollow latex. This work is
relevant to both the academic and commercial designers of hollow latex in order to
improve the robustness of their product or also any users of opaque polymer who must
design processing and drying conditions to prevent collapse.
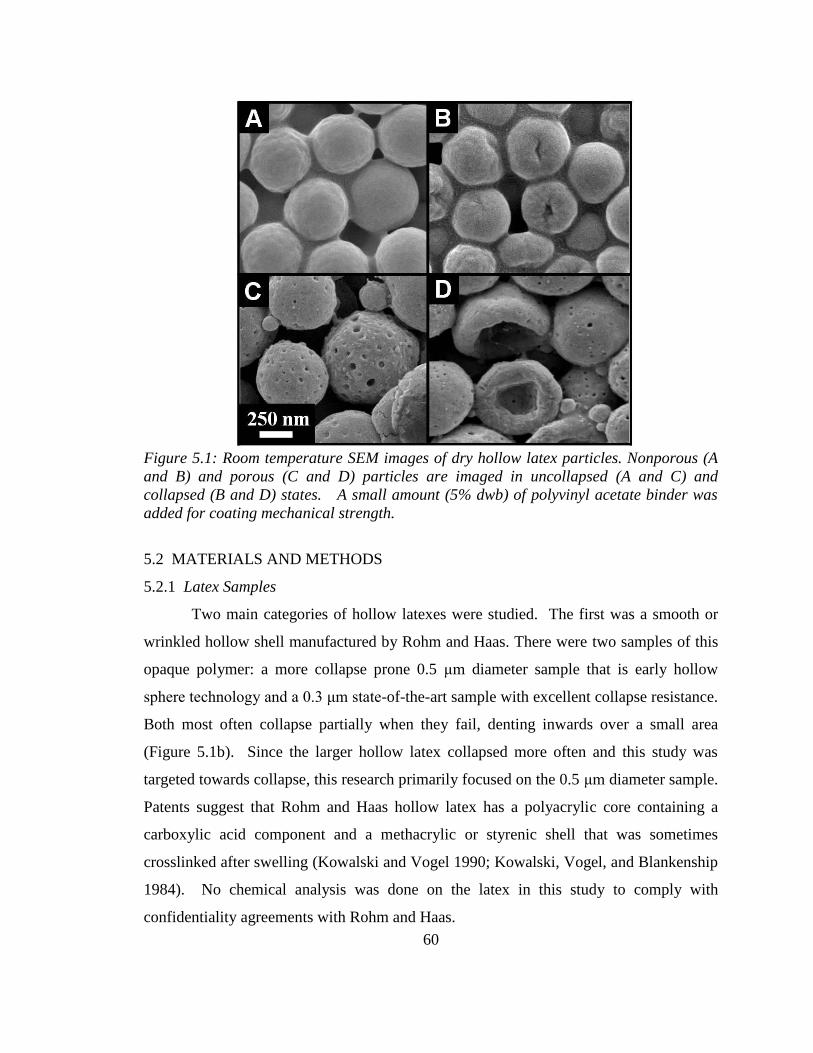
60
Figure 5.1: Room temperature SEM images of dry hollow latex particles. Nonporous (A
and B) and porous (C and D) particles are imaged in uncollapsed (A and C) and
collapsed (B and D) states. A small amount (5% dwb) of polyvinyl acetate binder was
added for coating mechanical strength.
5.2 MATERIALS AND METHODS
5.2.1 Latex Samples
Two main categories of hollow latexes were studied. The first was a smooth or
wrinkled hollow shell manufactured by Rohm and Haas. There were two samples of this
opaque polymer: a more collapse prone 0.5 μm diameter sample that is early hollow
sphere technology and a 0.3 μm state-of-the-art sample with excellent collapse resistance.
Both most often collapse partially when they fail, denting inwards over a small area
(Figure 5.1b). Since the larger hollow latex collapsed more often and this study was
targeted towards collapse, this research primarily focused on the 0.5 μm diameter sample.
Patents suggest that Rohm and Haas hollow latex has a polyacrylic core containing a
carboxylic acid component and a methacrylic or styrenic shell that was sometimes
crosslinked after swelling (Kowalski and Vogel 1990; Kowalski, Vogel, and Blankenship
1984). No chemical analysis was done on the latex in this study to comply with
confidentiality agreements with Rohm and Haas.

61
Table 5.1: Latex properties
Latexes R&H 0.5μm R&H 0.3μm HS3000 HS3020 Binder
Mean Particle Diameter (μm) 0.5 0.3 1 1 0.1
Wall Thickness / Diameter 0.15 ? 0.1 0.1 --
Surface Texture Wrinkled Smooth Porous Porous --
Dispersion Solids Content (wt %) 44 29 27 25 55
Dispersion pH 8 8 8 8 5-6
Collapse character Often Seldom Seldom Often --
Table 5.2: Coating formulations explored
Latex type HS3020 R&H 0.5μm
Effective solids concentration (vol%) 50 - 60 50 - 60
Solids concentration (wt%) 20 - 30 40 - 50
Binder Concentration (wt% dwb*) 0 - 60 5 - 30
Relative Humidity (%) 20 - 70 20 – 70
Temperature (°C) 15 – 72 15 – 72 *dwb: dry weight basis
The second main hollow latex type, produced by Dow Chemical, is also a hollow
shell but with a distribution of surface pores. In private communication with Dow, it has
been affirmed that the surface pores penetrate all of the way through the shell walls.
Patents claim that Dow hollow latex has an acid free, hydrophilic core most often made
from methyl or ethyl acrylate and a hydrophobic shell made from primarily crosslinked
polystyrene (Lee et al. 1992). Two samples of Dow latex were examined: commercially
available HS 3000 and HS 3020, newer and found to be more collapse prone. Dow
hollow latex fails completely with one side entirely turning inside-out (Figure 5.1B).
This research primarily focused on the latexes that collapsed the most, Rohm and
Haas 0.5 μm diameter latex and HS 3020. Therefore, to reduce confusion over latex
names, these samples will be referred to as “nonporous” and “porous” latexes,
respectively. Notes will be made where the other latexes are used. Note that “pores” on
the surface of the latexes are different from “hollows” or “voids” in the centers of the
particles. All five samples are hollow.
Polyvinyl acetate latex (Airflex 405, Air Products) with a particle size averaging
0.1 μm and a Tg of 7 °C was used as a binder. This binder was added to enhance the
mechanical strength of the coatings. Binder concentrations were kept much lower than is

62
typically used in commercial products to prevent obscuring the view of the hollow latex
particles.
5.2.2 Cryogenic Scanning Electron Microscopy
CryoSEM was used to characterize the sequence of events that occurs during
drying a coating containing hollow latex. First, frozen dispersions of hollow latex
without binder were imaged to determine whether collapse was present before any drying
occurred. Then, coatings containing hollow latex and binder were frozen after different
amounts of drying. These frozen specimens were imaged to follow the progression of
microstructure changes during drying. Two different techniques were used to prepare
samples for cyroSEM.
High pressure freezing: Dispersions of hollow latex without binder were frozen and
imaged using cryoSEM to view the initial states of the samples before combination with
binder. First, a sample droplet was sandwiched between two freezing hats (Type A, Ted
Pella) and vitrified under 2,100 bar of pressure for 8 ms in a Bal-Tec HPM 010 high-
pressure freezing machine. The freezing hats were fractured apart in a bath of liquid
nitrogen to expose the center of the vitrified droplet. One half was mounted in a Gatan
626 cryo stage and inserted in a Balzers 010 sputter coater for further sample preparation.
There, surface ice was sublimed from the sample at -96 °C and 2 x 10⁻⁹
bar for about 10
minutes to uncover the particles and increase surface contrast. A 10 nm platinum layer
was then sputtered onto the sample surface. The sample was then imaged in a Hitachi
S900 FESEM at -170 °C.
Plunge freezing into liquid ethane: A plunge freezing technique using liquid ethane as
a vitrification agent was used to image the film formation of a sample at intermediate
drying stages. Samples were coated onto silicon wafers (5x7 mm, Ted Pella) using a #16
Mayer rod and allowed to dry for the desired length of time. Drying times corresponding
to various film formation stages were estimated from weight loss versus time data, which
was collected previously for each latex. Once partially dry, the coatings were plunged
63
into liquid ethane at -196 °C for vitrification. Samples were then transferred to an
Emitech K-1250 cryo preparation chamber where they were fractured at -120 °C to
expose the coating cross section, sublimed at -96 °C for 3-10 minutes and sputtered with
a 2 nm layer of platinum. The samples were finally imaged in a Hitachi S4700 FESEM
at -160 °C.
5.2.3 Study of Process Variables
The collapse tendency of the porous and nonporous latex particles was tested for
varying drying temperature, relative humidity, and binder concentration. In order to
sample many drying temperatures efficiently, latex dispersions were applied on a
minimum film formation temperature gradient bar (MFFT bar) (MFFT90, Rhopoint). On
the MFFT bar samples were dried over a 40 °C temperature range under 4 L min−1
of
airflow. Temperatures between 10 °C - 60 °C were explored. The coating was deposited
on a thin layer of polyethylene terephthalate (PET) that was taped to the bar. Once dry,
approximately 1 cm2 samples were cut from the PET, mounted on SEM stubs, coated
with 20 nm of platinum, and imaged in a JEOL 6500 FESEM at room temperature. The
numbers of collapsed and not collapsed particles visible on the top surface of these
samples were then counted and recorded to find the percent collapsed at each condition.
Over 300 particles were examined for each data point. Binder concentrations ranging up
to 30 solids wt% dry weight basis (dwb) for nonporous particles and 50% dwb for porous
particles could be reproducibly examined by this method before the binder began to
obscure the collapse dimples.
To explore ambient humidities ranging from 20% - 70%, samples were applied to
a PET substrate using a #16 Mayer rod and allowed to dry in a constant humidity air flow
device under 3 L min−1
of laminar flow at room temperature. Collapsed particles were
imaged and counted as previously described.

64
5.3 EXPERIMENTAL RESULTS
5.3.1 Drying Rates of Hollow Latex
Drying rates of pure hollow latex coatings were compared to coatings containing
latex without hollows. Coatings were cast down on 40 cm2 PET film using a #16 wire
wound Mayer rod, which produces a constant wet coating thickness of 16 mils (0.41 mm).
The mass of the drying film was then measured with a scale every 15 seconds until it was
approximately constant. The evaporation rate of the drying coating was then calculated
as the numerical derivative between two time points.
Figure 5.2 displays the evaporation rate at low relative humidity of a porous and
nonporous latex coating. Drying curves closely approximate evaporation rates that are
expected for conventional latex. This drying behavior has been well explained by Croll
(Croll 1986; Keddie 1997). Initially, water evaporates from a totally immersed coating at
a high rate. The water then recedes into the layers of latex particles almost immediately
due to the high volume fraction of particles in these latex coatings. The evaporation rate
falls due to the reduced surface area available for water loss. Later the rate slows even
further as the escaping water vapor must diffuse through the porespace between the
particles before it can fully escape the coating. Finally, the drying rate becomes very
limited as isolated pendular rings of water diffuse out through the remaining porespace.
The small polyvinyl acetate binder particles dry with almost exactly the same
behavior as a coating made of almost entirely hollow latex, indicating that under these
conditions binder does not skin the drying coating and restrict evaporation. The slightly
slower evaporation rate of the binder coating in Figure 5.2 may be due to particle
deformation which slightly restricts water diffusion.
At high relative humidity, (Figure 5.3) the drying behavior of nonporous latex
shows deviations from Croll’s drying model. During the falling rate section of the
nonporous latex drying curve, the evaporation rate slows after ten minutes and then
increases again at fifteen minutes. It is assumed that this anomaly can be attributed to the
drying of the hollow voids. In fact, a back of the envelope estimation of the weight at
which the voids would start emptying corresponds almost exactly to the weight at which
the deviation occurs in Figure 5.3. It is then postulated that when the hollow latex

65
Figure 5.2 a,b: Evaporation rate over time of hollow polymer coatings with binder at
low (~10%) relative humidity. Top: Nonporous hollow latex with polyvinyl acetate
binder. (open = 95% hollow latex; grey = 50% hollow latex; Black = 100% binder)
Bottom: Dow HS 3000 porous latex with polyvinyl acetate binder. (open = 100% hollow
latex; grey = 50% hollow latex; black = 100% binder)

66
Figure 5.3. Evaporation rate of a drying hollow latex coating over time in high humidity
(~60%). Vinac 884 is solid, high Tg latex. Legend: Black = Vinac 884; Open symbols =
Nonporous latex; Grey = Porous HS3000; X = Porous HS 3020.
coating is dried slowly, the drying of the porespace and the drying of the latex particles
are distinguishable events. Evidence for this idea was also seen with cryoSEM.
The porous latex dries at a noticeably higher evaporation rate at later drying
stages than the nonporous latex or the conventional latex. It could be that the larger
particle size of this latex provides less resistance to water diffusion through the porespace.
It was difficult to distinguish any anomalous behavior in the drying curve of nonporous
latex, perhaps because the pores in the latex particles provided faster diffusion pathways
for particle drying.
These drying rate experiments are the first indication that drying behavior is
different for hollow latexes as compared to a high Tg solid latex. At high humidity, the
drying curve of nonporous latex did not fit the Croll model. Water escape from the void
centers caused deviations from the expected behavior after the falling rate drying period.
Ambient humidity affected the shape of the drying curves dramatically, and there were
marked differences between the porous and nonporous latex drying behavior. To validate

67
the ideas regarding the source of these phenomena, a cryogenic scanning electron
microscope study of the steps of film formation was undertaken.
5.3.2 CryoSEM of Hollow Latex Drying and Collapse
Cryo SEM of the various stages of film formation was important to determine the
basic sequence of events in drying a film containing both hollow particles and binder.
Using cryoSEM it was hoped that the stage of film formation in which collapse occurs
could be identified.
Before the collapse of hollow particles could be studied during the drying of a
coating, the initial state of the hollow latex, as supplied by the manufacturer, was
characterized. Each hollow latex dispersion without binder was frozen using the high
pressure freezing method and imaged.
Figure 5.4 shows cryoSEM images of both porous and nonporous hollow latex
dispersions that have been frozen, fractured, and sublimed to reveal the particles.
Sublimation removed a substantial amount of the ice in both specimens so that several
layers of particles were revealed. In the image, the interiors of some hollow particles are
exposed, indicating that the fracture plane passed through both the ice matrix and the
particles. Surface pores are visible in the porous latex. A small amount of plastic
deformation appears to have occurred during the fracture. More dramatic examples of
plastic deformation in cryoSEM images of latex have been reported in studies of
conventional high and low Tg latexes (Ma, Davis, and Scriven 2005; Haiyan et al. 2006).
Significantly, no particles were found to be collapsed in any of the samples, confirming
that any buckling must occur during drying.
The residual cores, left over from the synthesis, are visible as webs spanning the
central voids. A similar web was also imaged in dried porous hollow latex by Beach et al.
using an ion beam milling technique (Beach et al. 2005). A web-like structure or “junk”
also exists outside of the particles, as clearly visible in Figure 5.4a. These threads are
common in cryoSEM images of commercial latex and are most likely due to soluble
monomer, surfactants, biocides, or other species that have precipitated from the latex
serum during the freezing process (Gong, Davis, and Scriven 2008).

68
Figure 5.4: CryoSEM image of a fractured droplet of a vitrified porous latex dispersion.
The fracture plane has passed through the particles, splitting them open to show their
hollow voids. A) Porous latex, 15 min of sublimation at −96 °C. B) Nonporous latex, 3
min sublimation at −96 °C.
Coatings prepared from dispersions of hollow latex and 20 wt% dwb binder were
then frozen at various drying stages using the plunge-freezing method of sample
preparation. Due to the relatively small size of the substrates used for this preparation
technique, samples dried from both top-down and edge-in. By varying both the drying
time and the position on the sample cross section, a wide range of drying stages could be
captured (Luo, Scriven, and Francis 2007). Over ten minutes of sublimation was
performed on these samples to remove all visible frozen water in order to prevent
confusing it with deformed binder. SEM images in Figure 5.5 are coating cross-sections,
focusing on the near surface regions. The cartoon of Figure 5.6 summarizes the four
drying steps that were identified for both porous and nonporous latex coatings.
In Figure 5.5a, the consolidation stage is shown. Here, the fracture plane passed
through the hollow particles, fracturing them open as in Figure 5.4. The particles appear
very similar to those in the native dispersion, as is expected for a coating in an early

69
Figure 5.5: CryoSEM cross section images of porous latex coatings containing 20 wt%
(dwb) latex binder. The coating was dried at room temperature in 30% relative humidity.
Four separate drying stages are identifiable (A: Consolidation, B: Binder compaction, C:
Binder coalescence, D: Void drying). Samples were sublimed for ten minutes at −96 °C
which removed the visible vitrified water. Collapsed particles are circled in D.

70
Figure 5.6: Cartoon depicting the four film formation stages of hollow latex coatings to
complement Figure 5.5. Locations of hollow latex (open circles), binder (black small
circles) and water (grey) are drawn for the stages: A: consolidation, B: binder
compaction, C: binder coalescence, D: void drying.
drying stage. Although all water has been sublimed away, the location of the water can
be inferred from the distribution of the small, mobile binder particles that stay dispersed
within the water phase. Here, the binder is evenly distributed throughout the porespace,
signifying that in this sample the particles were submerged in most of the image.
In the consolidation stage, water evaporates from the coating, concentrating the
particles until they are in contact. In all of the samples studied, contact points were
quickly established due to the high solids concentration of the dispersions (50 – 60
effective vol%). After the maximum latex particle packing was gained, further water
evaporation required that air invade into the coating. The beginning of air invasion is
captured in Figure 3a. Fingers of air descend from the coating top surface, as marked in
the image. They appear as open, binder free pockets in the coating porespace near the top
surface (Figure 5.6a).

71
Figure 5.7: CryoSEM image of the cross section of a nonporous latex coating containing
20 solids wt% of polyvinyl acetate latex binder dried at 30% relative humidity at room
temperature. The sample underwent a short sublimation time of three min at −96 °C.
Ice completely fills the porespace of this consolidating coating. Indicated in this image
are strong, ice-filled hollow latex cores that have survived the sample preparation
fracture with little deformation.
Figure 5.7 is an analogous cross-section image of the consolidation stage in the
center of a nonporous latex coating. Less sublimation was performed on this specimen,
clearly showing that the ice phase completely submerges all of the particles. Again,
binder is distributed evenly in the water between hollow particles. Due to the irregular
fracture of this sample, plastic deformation of the particles is strongly pronounced. In
some cases, the ice-filled core is exposed, appearing as a frozen rigid sphere that resists
deformation.
Figure 5.5b shows a porous latex coating in the binder compaction phase, the
stage when the binder latex begins to deform. Air has completely invaded into the
coating, and the remaining water now hangs between particles in pendular rings (Figure
4b). The binder has moved with the water phase to the contact points between particles.

72
Table 5.3: Void state as determined through particle fracture
Interstitial Space Inside Void Particle Fracture?
Vitrified water Vitrified water Yes
Air Vitrified water No
Air Air Yes
One “binder ring” exists where a hollow latex particle has been plucked from the cross
section during the sample fracture. The binder particles remain distinct from each other
and threads of “junk” string between them, indicating that the hollow latex contact points
contained water when the sample was vitrified. The migration of the binder places it
where the larger particles are closest to each other, exactly where it is most effective for
holding the particles together. CryoSEM studies of other large, high Tg latex and small,
low Tg binder latex blends have also been studied by previous researchers (Ma, Davis,
and Scriven 2005). Pores penetrating through the hollow particle shells are faintly visible
in this image and are clearly seen at higher magnifications.
Figure 5.5c shows the interdiffusion state of the binder latex. Individual binder
particles are no longer distinct. Water surface tension and van der Waals forces have
brought them together, blurring their boundaries. The hollow latex particles, however,
remain undeformed since their high Tg shells are below their minimum film formation
temperature. There is no evidence that water exists within the porespace.
Finally, Figure 5.5d and Figure 5.8 show the last drying stage observed in hollow
latex coatings. Here, the fracture plane has opened the hollow latex particles, just as it
has in Figure 5.5a. The fragile threads of the residual core web are not apparent,
suggesting that this fine structure cannot support itself in a dry particle. It is also notable
that hollow particles fracture open during the sample preparation when they are in this
last stage, whereas they remained whole in Figures 5.5b and c. It may be that the ice
within the voids strengthened the particles when it was present, and the fracture ran
though the comparatively weaker contact points between the spheres. Conversely in this
last stage, the binder-strengthened contact points and the hollow particles are equally as
tough, and the fracture plane ran through each indiscriminately. In Figure 5.5a a similar

73
situation existed; the ice-filled particle voids and the ice-filled porespace were of equal
strength and the particles fractured open. This idea is summarized in Table 5.3.
In Figure 5.8, an image of the entire cross section of a coating, particles fractured
open at the top surface of the coating whereas those near the substrate do not. This
feature was found in many specimens. The open particles near the surface appear empty,
without the characteristic core structure of wet particles, whereas at the bottom particles
remained whole. A rare open particle near the substrate is filled with a fragile spiderweb,
suggesting that this void was still filled with water. Thus, a void emptying front was
captured, moving from the top surface of the coating downwards. This coating was
frozen one minute after it turned a flat white color, indicating that the pore space was
mostly dry. Assuming that a hollow particle void starts drying when air invades the
porespace around it, from this image it can be estimated that a hollow particle empties
completely in about 1-2 minutes. This coating was dried in about 20% relative humidity;
particle drying speeds will be affected by the local relative humidity surrounding them.
Figure 5.5d also shows the first evidence of particle collapse. Four indented
particles are circled in the figure, one on the top surface and three within the coating bulk.
The indentations do not face a specific direction, hinting that the cause of the buckling is
pressure related. Collapse is also seen in Figure 5.9 for nonporous latex. Humidity from
the air condensed and froze onto the particles in this image, but this artifact did not
obscure the telltale dimples that indicate particle collapse. The deformation of binder
particles and the fracture of one hollow particle signify that these particles are also in the
void emptying stage.
These cryoSEM results outline a clear series of events for the drying of a hollow
latex film with a low concentration of binder. The hollow latex was at first completely
submerged and filled with water with small binder particles interdispersed randomly in
the mixture. Water evaporation consolidated the solids until a maximum packing is
reached. In the compaction stage, the water level fell below the top layer of particles and
air invaded all of the way to the substrate. Binder was pushed by the remaining water
phase to congregate in pendular rings in the contact points between particles. As the

74
Fig
ure
5.8
. C
ryoSE
M i
mage
of
the
inte
rdif
fusi
on s
tage
of
Nonporo
us
0.5
late
x w
ith 1
0 w
t% P
VA
bin
der
. B
inder
ha
s
com
ple
tely
def
orm
ed b
etw
een t
he
part
icle
s and
air
has
inva
ded
all
of
the
way
to t
he
subst
rate
. A
t th
e to
p o
f th
e co
ati
ng
part
icle
s have
fra
cture
d o
pen
, but
nea
r th
e su
bst
rate
they
have
rem
ain
ed w
hole
. T
his
could
be
evid
ence
that
the
bott
om
part
icle
s are
sti
ll f
ille
d w
ith
a c
ore
of
ice.
One
“doodad”
is
found a
t th
e to
p o
f th
e co
ati
ng a
nd o
ne
“sp
ider
web
” i
s
found a
t th
e bott
om
, fu
rther
evi
den
ce t
hat
nea
r th
e su
bst
rate
part
icle
s are
sti
ll f
ille
d w
ith w
ate
r. (S
ubli
mati
on:
19 m
in,
-96 °
C)

75
Figure 5.9: CryoSEM image of the cross section of a nonporous latex coating containing
20 wt% (dwb) latex binder dried at 70% relative humidity at room temperature. Particles
are in the void emptying drying stage. Collapsed particles are marked. Humidity from
the room air has contaminated the sample during its preparation, spotting each particle
with small ice crystals. The sample was sublimed for three minutes at −96 °C.
pendular rings evaporated, capillarity and surface tension deformed the binder into the
contact points between the particles. At this point, the hollow latex no longer fractured
open during the sample preparation, which was possibly an indication that the particles
were strengthened with inner voids which were still filled with vitreous water.
As the binder reached the interdiffusion stage, hollow particles were noticed to
tear open during the sample preparation. It was assumed that these particles were weaker,
since they were no longer filled with vitreous water. Thus, the particles need air to
invade to their location in the coating before they can begin to dry. Evidence for a void-
emptying front was also seen, where it was assumed that the evaporating centers of top
layer particles saturated the dry air with water before it could invade to dry the layers
below.

76
It was in the last stages of binder interdiffusion, when the hollow particle voids
were emptying, that collapse occurred. This fact is strong indication that pressure
changes during the drying of the sphere centers are responsible for the collapse.
5.3.3 Effect of Drying Environment on Collapse
To aid in the development of a theoretical model for collapse, the effects of
drying temperature, binder concentration and relative humidity of the drying air on
collapse were explored. As a quantitative measure of particle failure under various
conditions, the percentage of collapsed particles was found on the top surface of dried
coatings as imaged by room temperature scanning electron microscopy. Since the
cryoSEM images show that collapsed particles indented in all directions, we assume that
that nearly half of the indentations faced away from the top surface of the coating and
were not recorded by this method. There is also no guarantee that the collapse exhibited
at the top surface is characteristic of the entire coating. However, there is no reason to
doubt that the top surface particles follow the same overall trends as those in the bulk
with respect to the given conditions and therefore can lend useful insights into collapse.
A typical top surface image of a coating dried on an MFFT bar is shown in Figure
5.10. Each picture contains about 300 particles, a large enough sample size that the given
area was accurately represented. Sample areas were chosen at random away from any
edges or cracks within the coating when possible. Multiple areas were imaged for each
drying condition. Particles do not buckle in any preferential direction. Rather, they
buckle most likely at a randomly placed imperfection in the sphere (Carlson, Sendelbeck,
and Hoff 1966). Particles also display polydispersity in their diameter, in dimple size,
and in surface texture.
Figure 5.11 plots the collapse behavior of nonporous and porous hollow latex for
varying binder concentration and temperature. In nonporous hollow latex, particle failure
increased from virtually nonexistent at room temperature to 35% at 60 °C. Upon adding
binder, collapse decreased at all temperatures. In addition, particles failed more under
humid conditions up to about 26% at 70% relative humidity (Figure 5.12). Conversely,

77
the collapse of porous hollow latex was virtually independent of temperature and
humidity. Binder concentration was found to increase collapse. These results are
summarized in Table 5.4.
Experiments with a newer technology nonporous hollow latex (Figure 5.13)
displayed much lower levels of collapse under the same drying conditions. This latex
had a much smaller diameter (0.3 μm) than the nonporous latex that was used for the bulk
of this chapter (0.5 μm). This latex was not further analyzed to determine whether any
other latex properties such as particle chemistry were also the same between the two
samples.
Figure 5.10: Examples of top surface, room temperature SEM images of coatings
containing hollow latex. A) Nonporous latex containing 20 wt% PVA binder dried at
60°C. About 30% particles are collapsed. B) Porous latex containing 35 wt% PVA binder
dried at 60°C. About 20% of the particles are considered collapsed.
Table 5.4 Effect of drying conditions on collapse
Nonporous Porous
Temperature ↑ No effect
Binder ↓ ↑
Humidity ↑ No effect

78
Figure 5.11 a,b: Coating top surface particle collapse percentage of (A) nonporous and
(B) porous latex with varying binder concentration and temperature. Binder
concentrations were (dwb): 0%:○ 5%:□ 10%:∆ 20%: 30%:■ 35%: 50%:●.
Collapse percentages were estimated from scanning electron microscopy images of the
top surface of samples. Each point represents a sample of over 300 particles. Relative
humidity was constant at 40%

79
Figure 5.12: Top film collapse percentage of porous and nonporous latex particles after
drying under 0.75 m/s of constant humidity air flow at room temperature. Samples
contained 30 wt% (dwb) binder.
Figure 5.13: Top film collapse percentage of the nonporous (0.5 μm) latex primarily
studied in this chapter and newer technology nonporous latex (0.3 μm) after drying at
40% relative humidity on the MFFT bar. Samples contained 10 wt% (dwb) binder.

80
5.4 DISCUSSION
CryoSEM revealed that coatings based on both porous and nonporous hollow
latex undergo consolidation, binder compaction, binder coalescence, and void emptying
steps during drying. Collapse occurs during void emptying; hence this step was targeted
for further analysis. Furthermore, since nonporous and porous hollow latexes reacted
differently to drying conditions, a separate drying model was proposed for each.
5.4.1 Drying of a nonporous hollow latex particle
For a nonporous hollow latex particle to dry, water must exit the void by diffusion
through the particle shell. At some point, gas must nucleate within and eventually fill the
void. The particle is considered dry when the liquid in the void is completely replaced by
gas.
The simplest case is the drying of a perfectly spherical nonporous latex particle
without binder. Initially, the hollow particle is filled with water that contains dissolved
nitrogen and oxygen. In the dispersion state, a chemical equilibrium of these species
exists between the contents of the void, the contents of the latex serum that surrounds the
particle, and the air above the coating. After the coating is cast and exposed to dry air the
external water outside of the hollow sphere evaporates, and a gradient in the chemical
potential of water is created across the shell wall. (See the appendix for details.) This
gradient is the driving force for the diffusion of water through the shell. The
concentration of dissolved air within the hollow remains in chemical equilibrium with the
surrounding air and no diffusion of air occurs.
The volume of water within the particle must equal the volume of the particle
void. Therefore, as the water escapes from the particle, the particle shrinks in response.
As the water exits the sphere and the void volume decreases, the rigid polystyrene shell
resists the deformation. The pressure difference (Pvoid – Pout) across the shell that is
necessary to compress a neo-Hookean hollow sphere with modulus G is (Green and
Adkins 1970; Green and Shield 1950):
74 o o o
void out
o
G b bP P
b b b
(5.1)

81
Figure 5.14. Void pressure with respect to water loss for a nonporous hollow latex
particle with shell modulus 109 Pa and 10
8 Pa (Pvoid, 1 and 2, respectively). Initial
dimensions are 1 μm in diameter and wall thickness of 0.1 μm. Shaded areas represent
void pressures where collapse is likely, ranging from Pcr as calculated from Equation 1
to 0.5·Pcr for shell modulus 109 Pa and 10
8 Pa (Pcollapse 1 and 2, respectively). An
estimate for the bubble formation pressure is plotted (---), where the bubble radius is 45
nm.
Here a and b are the inner and outer diameters of the shell, respectively and the latex
shell wall is of thickness δ. Unstressed values are marked with subscript o.
The void pressure within a 1 μm diameter hollow sphere with Young’s modulus
of 109
Pa, corresponding to pure polystyrene, and 108 Pa, a softer polymer, is plotted in
Figure 5.14 with respect to the amount of water that has diffused from the hollow.
Depending on the polymer modulus, the figure demonstrates that the void pressure can
decrease hundreds of atmospheres before the particle is 10% dry. Extremely low void
pressures may provide a driving force for the diffusion of dissolved air through the latex
shell, but since the permeability of polystyrene to nitrogen is over 1,000 times less than
its permeability to water, this effect is predicted to be insignificant (Brandrup and
Immergut 1989).

82
Figure 5.15 Model for Hollow Latex Particle Collapse
The falling internal pressure within the hollow latex particle leads to one of two
possible situations (Figure 5.15). Either the shell collapses under the load of the vacuum
or a vapor bubble nucleates within the void. If a vapor phase forms within the hollow,
further pressure decreases will increase the volume of this vapor phase rather than strain
the latex shell, reducing the chance of particle collapse.
The critical void pressure, Pcr, at which a perfect hollow sphere of outer radius b
and inner radius a, will collapse depends heavily on the shell Young’s modulus E,
Poisson’s ratio, ν, thickness, and radius (Timoshenko and Gere 1961):
2
2
2
3 1cr atm
b a EP P
b
(5.2)
This equation assumes that pressure outside of the sphere is atmospheric, Patm.
Because hollow latex particles are imperfect, Equation 5.2 cannot be used to
accurately predict the critical collapse pressure of the hollow latex. Even small

83
imperfections can cause the sphere to buckle at much higher pressures (Hutchinson 1967).
Many experiments on near perfect spheres have shown that critical bucking pressures are
50% to 86% of the predicted critical pressure because of small imperfections (Carlson,
Sendelbeck, and Hoff 1966). In fact, studies have shown that the size of the
imperfections of a hollow sphere determine when the sphere will buckle under a uniform
pressure (Hutchinson 1967). Because none of the hollow latex particles are perfectly
round or have perfectly uniform wall thicknesses, variability between imperfections may
explain why all of the hollow latex particles do not collapse under the same conditions.
Particles with larger imperfections will collapse under smaller pressure loads.
Though the critical buckling pressure cannot be explicitly defined, Equation 5.2 is
used in this study to estimate an order of magnitude of the buckling pressure and also to
identify the relevant parameters that influence buckling, mainly the shell modulus and
thickness-to-radius ratio, (b-a)/b. In Figure 5.14, a critical buckling pressure range
between 50% and 100% of PCr was found for hollow spheres with Young’s moduli of 109
Pa and 108 Pa. This figure demonstrates the large dependence of buckling pressure on
modulus, and suggests the rationale for the selection of glassy polystyrene as the main
polymer in the hollow latex shell formulation.
Predicting the critical pressure at which a vapor bubble will form, or cavitation
pressure, is also difficult. Bubble nucleation is likely heterogeneous and therefore
dependent on solution and solid state properties as well as dissolved species
concentrations within the void at any given time. These properties may also differ
between individual particles.
Some assumption must be made about the size of the vapor bubble once it forms.
The Young-Laplace equation states that there is a large thermodynamic penalty that
exists in creating the surface of a vapor bubble of small radius, rbub:
2
cavitation void
bub
P Pr
(5.3)
In fact, experiments have subjected pure water to pressures as low as −250 atm before
cavitation occurs (Caupin and Herbert 2006; Blander and Katz 1975). These experiments
are performed under pristine conditions with no preexisting bubbles that would serve as

84
nucleation sites. It can be assumed that no preexisting nucleation sites would exist within
the hollow sphere, either, and the confined geometry of the shell may serve to suppress
nucleation even further, analogous to studies done with animal cells (Harvey et al. 1944).
The first species to vaporize will be nitrogen, at a pressure as predicted by
Henry’s law:
2cavitation NP Hx (5.4)
The Henry’s law coefficient for nitrogen at 19 °C is 8.24x10⁴ atm if xN2 is the mol
fraction of nitrogen in solution (Liley 1997). A function of temperature, it is only weakly
dependant on pressure. Once a nitrogen bubble forms as a seed, water vapor and oxygen
will also vaporize, relieving the vacuum within the void.
If the critical pressure for cavitation is lower than the critical pressure for collapse,
the shell will buckle as water departs. The bubble formation pressure was estimated as
the pressure at which a bubble with a radius that is 10% of the void radius (45 nm) would
be stable in water. This pressure is compared to the shell collapse pressure in Figure 5.14.
The bubble formation pressure is encountered much before the critical collapse regime
during the drying of the more rigid polymer. If the polymer has a lower shell modulus,
however, the bubble formation pressure falls within the critical collapse region.
One way to increase the resistance to collapse is to increase the shell thickness.
The collapse and bubble formation pressures are compared in Figure 5.15 for varying
wall thickness. Decreasing the wall thickness of the latex decreases the strength of the
latex shell and brings the two critical pressures within an order of magnitude.
In reality, imperfections in the shell and the size of the bubble nucleus will
determine whether the critical collapse pressure or the bubble formation pressure is
encountered first during drying. This simple theory does demonstrate that hollow spheres
are more likely to collapse as the modulus of the polymer shell drops or the ratio of wall
thickness to particle radius decreases.

85
Figure 5.16. Void pressure with respect to water loss for a 1 μm initial diameter hollow
latex particle of shell modulus 109 Pa and initial wall thickness 0.1 μm and 0.5 μm (Pvoid,
1 and 2, respectively). Shaded areas represent void pressures where collapse is likely,
ranging from Pcr as calculated from Equation 1 to 0.5·Pcr for wall thickness 0.1 μm and
0.5 μm (Pcollapse 1 and 2, respectively). An estimate for the bubble formation pressure is
plotted (---), where the bubble radius is 45 nm.
It was found experimentally through top-surface SEM images that particles are
more likely to collapse with high drying temperature and high relative humidity (Figures
5.11, 5.12). Under these conditions the polymer modulus may be decreased, increasing
the critical collapse pressure and, consequently, failure rates. Humidity and temperature
affect the modulus of rubbery polymers much more drastically than glassy polymers.
The hollow latex in this study is reported to be predominately polystyrene, but the
molecular weight distributions, copolymers and other additives are unknown and could
impact the mechanical behavior. Furthermore, recent studies have shown that nanometer
scale polystyrene thin films may have some rubbery character (Mattsson, Forrest, and
Borjesson 2000; Keddie and Jones 1995). Hydrophilic copolymers added to the latex
shell to increase its compatibility with the core during synthesis may also increase the
susceptibility of the modulus to humidity changes. To draw further conclusions,
measurements of the moduli of hollow spheres are required (Fery, Dubreuil, and
Mohwald 2004).

86
5.4.2 Drying of a Nonporous Hollow Latex Shell with Binder
When binder is added to the hollow latex coating, particles that once acted more
like individual entities behave as a network. Binder strengthens the overall coating and
resists the deformation of the particles themselves. Binder may also restrict diffusion of
species through the shell.
In this study, binder concentrations were kept much lower than are common in
commercial paints so as to not obscure the hollow particles. Even the highest
concentrations of binder that were studied did not cover the hollow particles completely.
Therefore, the main role of the binder was to hold particles together in a network,
increasing the effective modulus of the individual hollow latex shells and preventing
collapse. The case where binder envelops the entire particle, where water escape would
be restricted significantly, was not studied. In this case, collapse behavior with binder
concentration could be different.
4.3 Drying of a Porous Hollow Latex Shell
In porous hollow latex, the dominant water escape route from the shell is through
the pores rather than diffusion through the shell wall. A pressure difference cannot
develop across the shell, since any pressure jump would cause air to invade into the void
through the pores. Thus, collapse can only occur if all of the pores in a particle are
obstructed.
When binder is added to porous latex, the binder hinders diffusion through the
pores. Larger amounts of binder increase the likelihood that the effective pores of a
given particle are blocked (Figure 5.17). Once all of the pores of a particle covered, the
particle becomes essentially nonporous and is subject to collapse. This theory is
supported by the experimental observation that increased concentrations of binder
increased collapse significantly. All particles were not affected at once because of the
wide variability in the porosity of the latex particles. Humidity and temperature did little
to affect collapse in porous latex, perhaps because the pores themselves dominate the

87
Figure 5.17: (Left) Top surface SEM image of a Porous B hollow latex coating dried at
50 °C with no binder. This sample illustrates the large range of porosities that exist on
individual particle surfaces. (Right) 30 solids wt% polyvinyl acetate binder fills the
pores of Porous B latex dried at 33.1 °C, blocking them
modulus of the shell. Porous latex is also free of acidic co-polymers in its composition,
so it is less likely than nonporous latex to be plasticized by water (Lee et al. 1992).
5.5 CONCLUSIONS
CryoSEM studies revealed the microstructure changes that occur as a latex
coating containing hollow particles dries. First, the particles consolidate and with further
evaporation air invades into the film. Once air has contacted the outside of the latex
particles, a driving force exists for water to diffuse from the center of the void, and the
void empties. Collapse occurs during this stage. High humidity, high temperature and
low binder concentrations were shown to encourage collapse in nonporous hollow latex.
Humidity and temperature had no effect on the collapse of porous latex, but increasing
binder concentrations increased collapse.
A theoretical model was proposed whereby the diffusion of water from the hollow
latex void causes the pressure within the shell to drop. The decreased pressure either
provokes particle collapse or nucleation of a bubble within the void. When all of the

88
water has diffused from the particle and it is only filled with air, the latex is considered
dry.
Results of this research lead to some recommendations for future design of hollow
particles. Particles with low polymer moduli are more likely to buckle, so copolymers
should be chosen with care for hollow latex particle shells in order that the modulus is not
affected. In formulations, binders that do not trap water near the hollow latex shell as the
coating dries should be chosen. Hollow particles can be made more collapse resistant by
increasing the shell thickness to diameter ratio. Increasing the dissolved air concentration
within the particle void may also decrease collapse.

89
APPENDIX: MODEL FOR THE DRYING OF A HOLLOW LATEX PARTICLE
Assuming that the radius of the particle, b, is assumed to be much bigger than the
shell thickness, δ, then the water flux, n , can be described by the one dimensional
Equation A.1:
24 void outwaterwater water watern b f f
(A1.1)
The permeability of water through polystyrene, water , has been measured using finite
thicknesses of polystyrene to be 1.35 x 10⁻¹⁴
m2·s
-1·Pa
-1 at room temperature (Brandrup
and Immergut 1989). This quantity describes both the solubility and diffusivity of water
in polystyrene.
Inside of the shell, the liquid water fugacity, fvoid, is approximately the water
vapor pressure, Pvap, and can be calculated by the expression:
ˆ
expwater water waterwatervoid water vap void vap
vf x P P P
RT
(A1.2)
The Poynting correction is not neglected since the pressure inside the void, Pvoid, may
change drastically with time. Residual impurities left over from the swelling of the latex
core are accounted for by the term xwater, the water molar fraction in the void. The gas
constant is R, T is the temperature and v̂ is the molar volume of water.
Outside of the shell, the liquid water fugacity, fout, is simply the partial pressure of
water vapor in the porespace. This quantity may change with time as the coating as a
whole dries.
Because the void must be completely filled by its contents at any time, the void
volume must change as water exits. A volume balance can be written where the void
volume change with time, voiddVdt
, is equal to the sum of the volume fluxes of every
species through the particle shell wall of area A:
2 2 2 2
1ˆ ˆ ˆ ˆvoid
i i water water O O N N
species
dVn v n v n v n v
A dt (A1.3)

90
where n represents the mole flow rate of a species from the shell and v̂ is the molar
volume. However, before a bubble nucleates the molar volume of dissolved oxygen and
nitrogen are negligible and can be ignored, leaving the flux of water as the sole
determinant of the void volume.
As the water exits the sphere and the void volume decreases, the rigid polystyrene
shell resists the deformation. The pressure difference (Pvoid – Pout) across the shell that is
necessary to compress a hollow sphere to a certain volume can be found using the
equation derived by Green and Shield (Green and Adkins 1970; Green and Shield 1950):
74 o o o
void out
o
G b bP P
b b b
(A1.4)
This expression assumes the latex wall of thickness δ is a neo-Hookean material with a
shear modulus G. Unstressed values are marked with subscript o. This equation also
assumes that the sphere wall is incompressible, or:
3 3 3 3
o ob a b a (A1.5)
Here a and b are the inner and outer diameters of the shell, respectively.
Equations A1.1-5 can be solved to determine that the pressure within the shell
falls over time as the water evacuates the void. However, the time dependence is not
relevant to collapse. A particle will collapse if the void collapse pressure is reached
before the bubble cavitation pressure. Therefore, the pressure change of the void with
respect to time is not explored, but rather Equation A1.4 is used to understand the
relationship between Pvoid and the deformation of the shell brought about by water loss
(Figures 5.14, 5.16).

91
CHAPTER 6
DRYING REGIME MAPS OF PARTICULATE COATINGS1
6.1 INTRODUCTION
Particulate coatings are common to a wide variety of industries. Particulate
coatings make everyday objects scratch resistant, less reflective, colorful or hydrophobic.
Though the chemistry of these coatings is important, oftentimes their microstructure is
just as influential in determining overall functionality. For example, the arrangement of
carbon particles in a fuel cell electrode determines the permeability of the coating to
reactive hydrogen and oxygen as well as the conductivity of the electrode (Li and Pickup
2003). Ordered colloidal crystal coatings are created either by slow sedimentation of
monodisperse particles (Ackerson et al. 1999; Wang, Gu, and Liang 2003) or by
evaporative assembly (Snyder et al. 2007). A porous particulate coating applied to paper
aids in ink adsorption (Chapman 1997). The required microstructure that makes these
coatings functional develops as the dispersion of particulates suspended in a liquid dries
into a solid film. Essential qualities, such as porosity, strength, gloss, adhesiveness,
1 An adapted form of this chapter has been accepted for publication.
Cardinal, CM; YD Jung, KH Ahn, LF Francis, “Drying regime maps for particulate coatings”, AIChE J.
Published online 27 Jan 2010. DOI: 10.1002/aic.12190

92
Figure 6.1. Schematic diagram showing sedimentation (S), evaporation (E), diffusion
(VD), and capillary drag (VC) in the three particulate coating drying stages
particulate order and concentration gradients, can all be tailored if the connections
between the particle distribution and the drying is understood.
The drying of a particulate coating can be broken up into three main stages. At
first, the particles are randomly distributed throughout the coating liquid. Then, in the
concentration regime, evaporation causes the coating free surface to descend towards the
substrate, concentrating the particles. Once the particles reach a maximum packing
fraction, further evaporation requires that air must invade into the porespace between the
particles. Air invasion brings capillary forces due to the curved air-water meniscus at the
top of the particle packing. This begins the capillary regime.
Models (Pan 1995; Pan, Davis, and Scriven 1995; Nowicki, Davis, and Scriven
1992) and experiments (Luo, Scriven, and Francis 2007) have been used to investigate
the capillary regime extensively, but these studies assume that the particles remain
homogeneous through the coating thickness in the concentration regime. In reality, the
relative strengths of evaporation, diffusion and sedimentation can greatly influence the
particle distribution in the concentration regime. Evaporation causes the coating free
surface to move towards the substrate with velocity E, increasing the particle
concentration in the coating over time. Particles can accumulate at the descending free
surface in what is often termed a “consolidation front” (Ma, Davis, and Scriven 2005).
Thermal Brownian diffusion of particles with velocity VD acts to eliminate concentration
gradients that develop. Finally, if the particles are denser than the surrounding medium,
they can sediment with velocity U. The balance between these three motions determines

93
whether concentration gradients develop through the coating as it dries. Concentration
gradients in a drying coating often lead to property variations through the thickness of the
final product and can also influence particle arrangement and packing. Concentration
gradients can be undesirable, but they can also be beneficial, such as in the design of
layered microstructures in coatings containing more than one type of particle.
The balance between E, VD, and U is most usefully described through
dimensionless numbers. The dimensionless Peclet number is used to describe the
importance of evaporation to diffusion in a film of initial thickness Ho (Routh and Russel
1998). It is given as:
o
o
EHPe
D (6.1)
where Do is the Stokes-Einstein diffusion coefficient, defined as:
06
kTD
R (6.2)
for a spherical particle of radius R dispersed in a liquid with viscosity μ and temperature
T. The Boltzmann constant is k. Routh and Zimmerman examined the effects of
evaporation with respect to diffusion using a 1D model (Routh and Zimmerman 2004).
When evaporation is dominant (Pe >> 1), the model predicts that consolidation fronts
form at the air-water interface and grow in thickness as the free surface descends towards
the substrate until the entire coating reaches the maximum packing fraction. When
diffusion dominates (Pe << 1), the particle concentration is predicted to remain
approximately uniform through the coating thickness as it dries. Similar models have
been adapted to include particle charge and Marangoni flows, which are common in
solvent borne coatings (Sarkar and Tirumkudulu 2009; Yiantsios and Higgins 2006).
Limited experimental methods exist to assess the concentration gradients that
develop during the active drying of coatings. The effects of varying Pe on particle
distributions in coatings have been studied experimentally using magnetic resonance
(MR) profiling, which can be used to track concentrations of water in a drying film to a
resolution of about 10 μm (Gorce et al. 2002; Ciampi et al. 2000). This technique
confirmed predictions that water concentration gradients occur in a drying film when

94
Pe>1. Specifically, MR profiling confirmed theoretical predictions that the water
concentration gradient between the consolidation front and the bulk of the film scales
with Pe1/2
(Ekanayake et al. 2007). Raman spectroscopy is another experimental
technique able to obtain concentration profiles in real time, as long as the coating is
relatively clear and the species are Raman active (Schabel, Ludwig, and Kind 2004).
Cryogenic scanning electron microscopy (cryoSEM) has also been successfully used to
image consolidation front growth in particulate coatings (Ma, Davis, and Scriven 2005).
By vitrifying the coating in liquid ethane before it is completely dry, the microstructure
of the coating can be frozen in time and imaged in a scanning electron microscope on a
temperature-controlled stage. By imaging specimens frozen after different extents of
drying, the developing microstructure can be characterized. In this way, Luo et al. (2008)
studied the effects of varying drying rate on the microstructure formation of a large
latex/small silica blend. Since these MR and cryoSEM studies were primarily focused on
predicting the particle distribution of latex coatings, the effects of sedimentation were
ignored.
The first model describing the sedimentation of particles was formulated by
Kynch, who showed that there are three main regions in a sedimenting suspension: the
sediment near the bottom, a region where the concentration equals the initial
concentration, and a particle free-zone at the top (Kynch 1952). This model has been
adapted for colloidal systems that experience diffusion (Buscall and White 1987; Davis
and Russel 1989). The strength of sedimentation is compared to diffusion using the
sedimentation Peclet number,
o osed
o
U HPe
D (6.3)
where Uo is the Stokes settling velocity of a spherical particle of density ρP in a dilute
solution of liquid with density ρL and viscosity μL, under gravitational acceleration g:
2
0
2
9
P L
L
R gU
(6.4)
Increasing the strength of diffusion (decreasing Pesed) softens the boundaries between the
three concentration regions. Various researchers have experimentally observed the
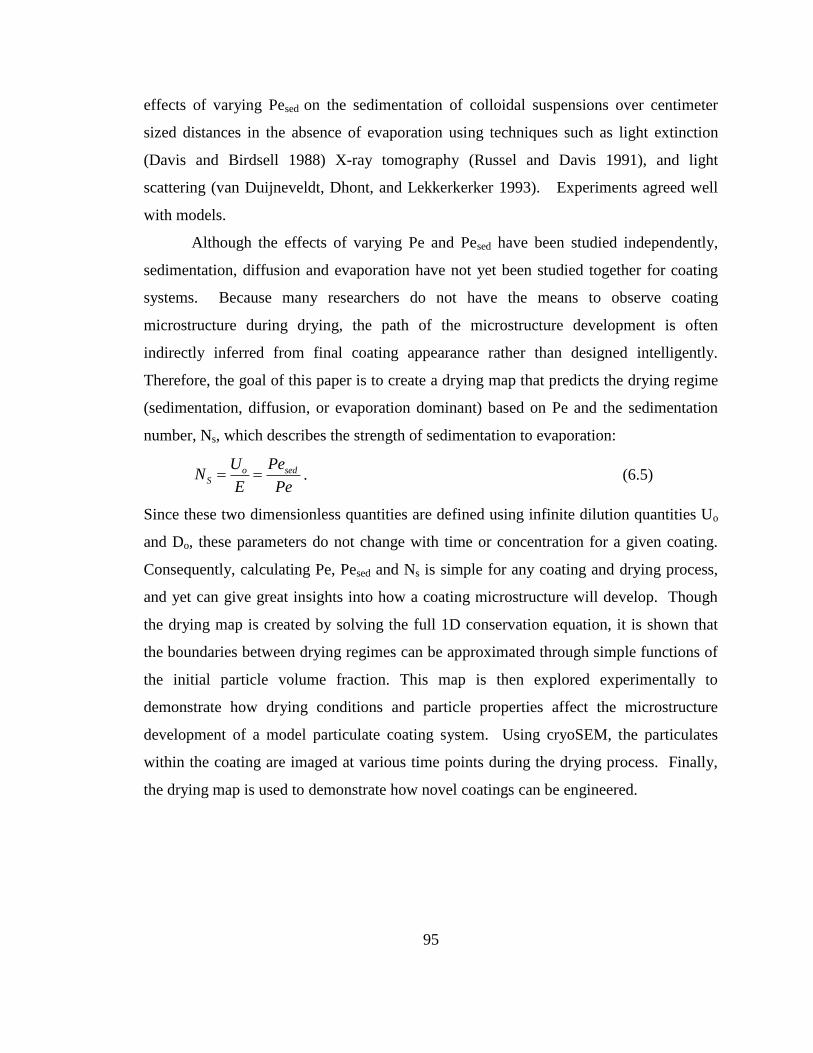
95
effects of varying Pesed on the sedimentation of colloidal suspensions over centimeter
sized distances in the absence of evaporation using techniques such as light extinction
(Davis and Birdsell 1988) X-ray tomography (Russel and Davis 1991), and light
scattering (van Duijneveldt, Dhont, and Lekkerkerker 1993). Experiments agreed well
with models.
Although the effects of varying Pe and Pesed have been studied independently,
sedimentation, diffusion and evaporation have not yet been studied together for coating
systems. Because many researchers do not have the means to observe coating
microstructure during drying, the path of the microstructure development is often
indirectly inferred from final coating appearance rather than designed intelligently.
Therefore, the goal of this paper is to create a drying map that predicts the drying regime
(sedimentation, diffusion, or evaporation dominant) based on Pe and the sedimentation
number, Ns, which describes the strength of sedimentation to evaporation:
o sedS
U PeN
E Pe . (6.5)
Since these two dimensionless quantities are defined using infinite dilution quantities Uo
and Do, these parameters do not change with time or concentration for a given coating.
Consequently, calculating Pe, Pesed and Ns is simple for any coating and drying process,
and yet can give great insights into how a coating microstructure will develop. Though
the drying map is created by solving the full 1D conservation equation, it is shown that
the boundaries between drying regimes can be approximated through simple functions of
the initial particle volume fraction. This map is then explored experimentally to
demonstrate how drying conditions and particle properties affect the microstructure
development of a model particulate coating system. Using cryoSEM, the particulates
within the coating are imaged at various time points during the drying process. Finally,
the drying map is used to demonstrate how novel coatings can be engineered.

96
6.2 DRYING MODEL
The particle volume fraction as a function of position and time within a drying
coating containing a volatile liquid and particles is obtained by solving the particle
conservation equation, adapted from Russel and coworkers (Russel, Saville, and
Schowalter 1989). When the coating thickness is small relative to its lateral dimensions,
the drying of a particulate coating is assumed to be a one dimensional process. The 1D
conservation equation describing the particle volume concentration () in a particulate
coating during the drying process, including diffusion, evaporation, and sedimentation, is
expressed as:
U Dt y y
. (6.6)
A no-flux boundary condition is applied at the substrate (y = 0). At the top surface (y =
Ho−Et) there is an effective particle flux into the coating due to evaporation:
0, 0y U Dy
(6.7)
,oy H Et U D Ey
(6.8)
where Ho is the initial coating thickness, E is the evaporation rate given in terms of free
surface velocity, D is the particle mutual diffusion coefficient and U is the particulate
sedimentation velocity.
The effects of particle concentration on D and U are described through the
sedimentation coefficient, K(), which describes hydrodynamic interactions, and the
compressibility factor, Z(), which represents the concentration dependence of the
osmotic pressure gradient for hard sphere particles. Both parameters are strong functions
of .
0 0( ) ( ) ( ) ,6
d kTD K Z D D
d R
(6.9)
2
0 0
2( ) ( ) ,
9
P LR gU K U U
. (6.10)

97
The sedimentation coefficient K() has a functional form 6.55( ) (1 )K (Russel,
Saville, and Schowalter 1989). This equation was shown experimentally to satisfactorily
represent the dependence of sedimentation speed on concentration for the model system
(Figure 6.2). The compressibility factor, Z(), takes the general form (Russel, Saville,
and Schowalter 1989; Routh and Zimmerman 2004) 1
( )( )m
Z
where m is the
maximum value of . This form of compressibility factor captures the divergence of the
diffusion coefficient near the particle maximum packing fraction due to increased particle
collisions and maintains appropriate values near the dilute limit. The maximum packing
fraction was chosen to be m = 0.64, assuming random close packing of the particles.
Both the sedimentation coefficient and the compressibility factor assume that the
particles interact as hard spheres.
The conservation equation is nondimensionalized as:
o
tt
HE
and o
yy
H . (6.11)
1
( ) ( ) ( )s
dN K K Z
Pe dt y y
(6.12)
1
0, ( ) ( ) ( ) 0s
dy N K K Z
Pe d y
(6.13)
1
1 , ( ) ( ) ( )S
dy t N K K Z
Pe d y
(6.14)
Nondimensionalization reveals the two main dimensionless variables discussed in this
report, Pe and Ns. These equations are valid up to the time when the entire coating is
packed with maximum packing m. This dimensionless time, mt , is given by:
m om
m
t
. (6.15)
A shrinking coordinate system with a dimensionless shrinking velocity of 1 was
used to fix the free surface boundary. The shrinking space and time coordinates are
defined by:

98
Figure 6.2 Experimentally observed sedimentation velocity for large (●) and small (○)
silica particles for varying particle concentration. Solid lines are the predicted velocity
using Equation 6.10
, 1
yt
t
. (6.16)
The dimensionless conservation equation and boundary conditions in the shrinking
coordinate system are:
2
1( ) ( ) ( )
1 (1 ) (1 )
SN dK K Z
Pe d
(6.17)
0, (1 ) ( ) 0S
dN Pe Z
d
(6.18)
1, ( ) (1 ) ( ) ( ) (1 )S
dN PeK K Z Pe
d
. (6.19)
Equations 6.17-19 describe the particle distribution before the liquid recedes into the
packed particles. After the liquid enters the packing, capillary effects must be taken into
account. These effects and their implications on the structure of packings of deformable
particles have been modeled by Routh and Russel (Routh and Russel 1999). Specifically,
they have created a process map that identifies conditions when a packed particle layer at
the free surface deforms into a dense skin.
0
0.02
0.04
0.06
0.08
0.1
0.12
0.14
0.16
0.18
0.2
0 0.05 0.1 0.15 0.2
Concentration (φ)
Sedim
enta
tion V
elo
city (
cm
/hr)

99
Figure 6.3. Monodisperse silica particles synthesized through the Stöber process, dried,
and imaged using conventional SEM.
6.3 METHODS
6.3.1 Numerical Solution Method
The dimensionless conservation equation in shrinking coordinates was solved
numerically using COMSOL Multiphysics 3.2. The PDE General Form Application
Mode with Direct (UMFPACK) Linear system solver was used. The model has 480
elements and a 10-5
time step size that gave sufficient accuracy for most cases. Other
settings were the default values of COMSOL. Two limiting cases of the conservation
equation were verified with known numerical solutions: the distribution of particles
during solvent evaporation from coatings (Routh and Zimmerman 2004), and an
asymptotic description of transient settling and ultrafiltration of colloidal dispersions
( Russel and Davis 1991).
6.3.2 Experimental Methods
A model system of monodisperse silica particles in water was used for an
experimental comparison to the theoretical model. Monodisperse silica particles with
diameters ranging from 200 nm to 1 μm were synthesized using the Stöber method
(Figure 6.3). (Stöber, Fink, and Bohn 1968; Bogush, Tracy, and Zukowski 1988). This
method creates monodisperse silica particles by hydrolysis of tetraethyl orthosilicate
(TEOS) in a solution of ethanol and water. The reaction is catalyzed by ammonia. By

100
Table 6.1. Effects of experimental variables on Pe and Ns
Affects Pe? Affects Ns?
Silica particle size R = 150 – 500 nm √ √
Humidity, air speed E = 1.5 – 100 μm/min √ √
Initial coating thickness Ho = 200 – 500 μm √
Initial solid concentration φo = 0.05 – 0.25
changing the relative reactant concentrations, it is well known that the size of the
particles can be controlled (Bogush, Tracy, and Zukowski 1988). To make very large
silica particles a seeded growth technique described by Zhang et al. (2003) was used.
Particles were washed after synthesis and suspended in distilled water at pH 10
with various initial volume fractions. The density of the particles was measured through
water displacement to be 1.9 g/cm3. Additionally, monodisperse silica particles of 1 μm
± 1.5% diameter (Monosphere, Merck) and density of 2.2 g/cm3 were also used.
Controlled volumes of coating suspension were spread on 5x7 mm silicon
substrates using a micropipette and samples were allowed to dry for various times in still
air or under forced air. By controlling the drying environment, the evaporation rate, E,
could be varied from 1.5 to 100 μm/min. Drying rates were determined by measuring the
coating thickness over time from cryoSEM images.
The particle distribution within the coatings was imaged using cryoSEM. After
samples had dried for various amounts of time, the coatings were plunged into liquid
ethane at −196 °C for vitrification. Samples were then transferred to an Emitech K-1250
cryo preparation chamber where they were fractured at −120 °C under liquid nitrogen to
expose the coating cross-section, sublimed at −96 °C for 5-7 minutes to reveal the
particles and sputter coated with a 2 nm layer of platinum to reduce charging in the
electron microscope. Finally, samples were imaged in a Hitachi S4700 FESEM at
−160 °C. In most cases, samples dried edge-in as well as top-down; therefore, all data
and images were taken as close to the middle of the coating as possible.

101
Figure 6.4 Particle volume fraction () profiles for various Ns and Pe with respect to the
fixed coordinate y/Ho at various dimensionless times: t = 0.05 (―), t = 0.1 (---), t =
0.2 (-.-.), and t = 0.3 (....), t = 0.35 (―) . Initial volume fraction: o = 0.4.
6.4 RESULTS AND DISCUSSION
6.4.1 Numerical Results2
Figure 6.4 shows particle concentration profiles calculated based on Equation
6.17 for Pe ranging from 0.1 to 10 and Ns ranging from 1 to 100 with o = 0.4. As the
coating dries, the coating thickness reduces and the particle volume fraction approaches
the maximum packing fraction, m = 0.64, at long drying times. At intermediate times,
the concentration profile within the coating is significantly affected by the relative
magnitudes of Ns and Pe. Two main cases are discussed here: low Ns, where the
tendency for sedimentation is small relative to evaporation and high Ns where
sedimentation overwhelms evaporation.
At low Ns, (Ns =1) where sedimentation is weak, the concentration profile through
the depth of the coating reflects the competition between evaporation and diffusion. This
2 Numerical results were produced by Yoon Dong Jung, School of Chemical and Biological Engineering,
Soul National University, Seol, Korea

102
competition is described by Pe. Increasing Pe, which corresponds to increasing
evaporation rate, coating thickness, or particle radius, increases the importance of
evaporation on particle distribution. In an evaporation dominant coating, the suspension-
air free surface descends quickly towards the substrate faster than particles can diffuse
away. Consequently, particles accumulate at the free surface in a drying front. As
evaporation proceeds, the coating thickness shrinks and the thickness of the front grows
towards the substrate until the entire coating is at the maximum packing fraction. These
results concur with previous researchers (Routh and Russel 1998). Conversely, at low Ns
and low Pe, diffusion dominates over evaporation and the particle concentration remains
homogeneous through the depth of the coating as it dries.
At high Ns, (Ns =100) where evaporation is slow, the concentration profile is
determined by a competition between sedimentation and diffusion. At high Pe, where
sedimentation is strongest, particles fall towards the substrate faster than the free-surface
descends, creating a particle-free zone near the air-suspension interface. Particles
accumulate at the substrate, and the resulting concentration slows their speed of descent
according to Equation 6.10. Also, the strength of diffusion is increased dramatically at
concentrations approaching the maximum packing fraction, reflecting the sediment
compressibility (Buscall and White 1987; Davis and Russel 1989). These two factors
create a transition region of gradually increasing concentration between the initial-
concentration zone and the sediment. This phenomenon is stronger at lower Pe, where the
diffusion coefficient and its dependence on concentration are significant. At very low Pe,
just as in the low Ns case, diffusion is strong and the particle concentration is uniform
through the coating thickness throughout the drying. These results also agree with
previous work (Buscall and White 1987).
At intermediate Ns values, sedimentation and evaporation behaviors are both
important in the drying of the coating. Particles concentrate at the top and the bottom of
the coating, while the center remains near the initial volume fraction of particles.
Increasing the strength of sedimentation (increasing Ns) at a constant Pe decreases the
rate of particle accumulation at the top surface by creating a downward flux of particles.

103
Drying regime maps – logHo vs. logE: In order to understand the effects of changing
the process conditions on the drying behavior, drying maps were created to predict
evaporation, sedimentation or diffusion dominance for a given initial coating thickness
and evaporation rate. These maps were inspired by the work of Cairncross et al on the
drying regime maps for sol-gel coatings (Cairncross, Francis, and Scriven 1996). In
Figures 6.5 and 6.6, the black lines represent the conditions where the local particle
concentration at the top or the bottom of the coating reaches 90% of the maximum
packing fraction in less than half the time required for the entire coating to reach that
concentration.
0, 0.92
mm
tt
Sediment (6.20a)
1, 0.92
mm
tt
Skin (6.20b)
When this accumulation occurs at the top of the coating, evaporation dominates and the
region of the map that borders this condition is called the “evaporation regime” and is
labeled “”. In this manuscript, top surface particle accumulation is termed a “skin”
although the influence of particle accumulation on the evaporation rate is not modeled.
Not surprisingly, evaporation tends to dominate for coatings dried at higher rates.
Particle accumulation at the base forms a “sediment”, which defines the “sedimentation”
drying regime (“S”). Sedimentation is found at increased coating thickness, where
particles have more time to sediment before the overall particle concentration reaches the
maximum packing fraction. At relatively low evaporation rates, the diffusion of particles
is the dominant motion in the coating; this region is the diffusion drying regime (“D”).
At limited conditions, the evaporation and sedimentation regions overlap, indicating that
accumulation occur at both the top and the bottom of the coating as it dries.
Figure 6.5 shows the effect of initial volume fraction in the coating dispersion.
As the initial volume fraction decreases, hydrodynamic and particle interactions decrease
and speed the sedimentation and diffusion rates. Using the current model, diffusion rates
are approximately twice as fast at =0.1 than at =0.3, meaning that higher evaporation
rates are necessary to promote skin formation in less concentrated coatings. Also,

104
decreased particle concentration corresponds to a decreased number of particles that are
accumulated at the coating surface for a given amount of evaporation. Similarly, the
boundary between sedimentation and diffusion is shifted to increase the size of the
diffusion regime at lower particle concentrations, although the overall shape of the
boundaries is retained.
Figure 6.6 compares the drying regimes for coatings containing particles of
different sizes. As particle radius increases, the sedimentation rate increases, and
sediments form before the entire coating reaches a maximum packing in thinner coatings.
As particle radius increases, the strength of diffusion decreases, so at lower evaporation
rates skins can form.
Figures 6.5 and 6.6 display data comparing individual coating systems and
provide an intuitive basis for the drying regimes. However, it would also be useful to
have a universal drying map to predict the behavior for a wide variety of coating
formulations and conditions.
Figure 6.5. Drying regime map based on dimensional coordinates: initial coating
thickness Ho (m) and evaporation rate E (m/s). The effect of initial particle volume
fraction is shown for an aqueous coating containing silica particles (R=200 nm)
(Evaporation=(), diffusion=(D) and sedimentation=(S)).

105
Figure 6.6. Drying regime map based on dimensional coordinates: initial coating
thickness Ho (m) and evaporation rate E (m/s). The effect of silica particle size is shown
for an aqueous dispersion with o = 0.2 (Evaporation=(), diffusion=(D) and
sedimentation=(S)).
Drying regime maps – log Pe vs. log Ns: To create a universal map that is applicable to
any coating system, evaporation (), sedimentation (S) and diffusion (D) dominant
regimes were found using the same method discussed previously and displayed with
respect to the two dimensionless variables: Pe, and Ns. An example of a universal map
for an initial particle volume fraction of 0.2 is shown in Figure 6.7. To find a position on
the map, one calculates Pe and Ns (Equations 6.1 and 6.5) from measurable parameters:
particle radius, R, particle density, ρP, liquid density, ρL, liquid viscosity, μ, and
evaporation rate, E.
As demonstrated with the concentration profiles in Figure 6.3, the drying behavior
can be split into two cases: high and low Ns, with a critical value of Ns (Ns,critical) that
serves as the boundary between these two regimes. At low Ns, where Ns < Ns,critical,
sedimentation is unimportant and evaporation and diffusion compete. Here, there is a
critical Peclet number (Pecritical) above which an evaporation-induced skin forms. At high
Ns, where Ns > Ns,critical, evaporation is unimportant and sedimentation and diffusion

106
Figure 6.7. Drying regime map based on dimensionless coordinates Peclet number (Pe)
and sedimentation number (Ns). evaporation (), diffusion (D) and sedimentation (S)
dominant regions are shown for a coating with (o =0.2). Critical values are also
marked for limiting cases.
compete. A critical Peclet number is defined for this region (Pesed,critical). Pesed,critical
varies with both Ns and Pe and marks the division between the diffusion dominated
regime and the sedimentation dominated regime. Interestingly, the line for Pesed,critical
changes slope at Pecritical, reflecting the increasing influence of evaporation in that region.
A small overlap of the sedimentation and evaporation regions exist where both of these
behaviors are predicted to be of consequence.
Figure 6.8 shows the effect of initial particle concentration on the drying regime
map boundaries. Similar to Figures 6.5 and 6.6, as the initial volume fraction changes the
critical values change, but the shape of drying regime map is retained. As discussed
earlier, sedimentation and diffusion regimes are larger at smaller initial volume fraction.
The effects of initial concentration on the boundaries of the drying map can be better
understood by analytically solving limiting cases described by the critical dimensionless

107
Figure 6.8. Effect of initial particle volume fraction on the drying regime map based on
dimensionless coordinates.
Figure 6.9. Drying regime map marking Pe and Ns corresponding to Figures 6.10-14. o
= 0.1 (grey) and o = 0.2 (black).

108
Table 6.2: Experimentally explored coating conditions
R (nm) φo E (μm/min) Ho (μm) ρp g/cm3 Observed regime log(Ns) log(Pe)
200 0.1 7.8 183 1.9 Evaporation -0.22 1.4
200 0.2 7.8 183 1.9 Evaporation -0.22 1.4
91 0.2 2.0 250 1.9 Evaporation -0.31 0.55
135 0.2 87 600 1.9 Evaporation -1.6 2.7
200 0.2 62 250 1.9 Evaporation -1.1 2.4
120 0.1 5.5 200 1.9 Evaporation -0.51 1.0
50 0.1 5.5 200 2.2 Diffusion -1.1 0.63
50 0.1 3.5 223 2.2 Diffusion -0.95 0.48
500 0.1 22 130 2.2 Sediment / Evap 0.25 2.1
500 0.1 22 211 2.2 Sedimentation 0.25 2.3
500 0.1 2.0 250 2.2 Sedimentation 1.3 1.3
500 0.25 6.6 500 1.9 Sedimentation 0.65 2.1
numbers. Analytical expressions can be written to demonstrate that the critical Ns
boundary is simply where the evaporation rate equals the sedimentation rate and the
critical Pesed boundary is simply where diffusion and sedimentation rates are the same
(Cardinal and Jung, Ahn, Francis 2009). Since these rates depend on particle
concentration, the boundaries between the regions must also depend on initial
concentration.
6.4.2 Experimental results
In order to demonstrate the effectiveness of the drying map to predict the
microstructure development of a drying coating, cryoSEM was used to observe the
microstructure of a model system under various drying conditions. Several conditions
were investigated, as summarized in Table 6.2. These conditions explore all three
regions of the drying map. Accumulation zones were identified and noted if there was a
noticeable concentration of particles at either the top or the bottom of the coating when
the sample was halfway dry, or as close to this time point as possible. A representative
selection of cryoSEM results are presented in Figures 6.10-14. The drying conditions for
these samples are mapped for your convenience on Figure 6.9.
High evaporation rates and larger initial coating thicknesses tended to produce
coatings that dried in the evaporation regime. CryoSEM images (Figure 6.10) show the
evolution of a drying front that is growing in a coating dried in the evaporation regime.

109
A layer of highly concentrated particles at the top of the coating grows with time, as
marked by the white bar in the image. The particle concentration below this front stays
approximately constant with time, as estimated visually from images. At the top surface
of the coating some particles are ordered. Convective steering and capillary forces at the
free surface bring the particles together in an ordered crystal (Gasperino et al. 2008).
This effect occurs because the particles are monodisperse. The crystal continues to grow
when the time scale for particulate ordering is less than the addition speed of new
particulates to the front. At t = 0.7, the coating is fully consolidated. The top few layers
of the final coating are polycrystalline with areas of close packing, whereas the bulk of
the film is disordered. Large areas of particulate order may introduce some discrepancy
within the model, which assumes a random maximum packing fraction m = 0.64 instead
of the packing fraction most commonly seen for colloidal crystals (m = 0.74). This
model would overestimate the necessary Pe to form an ordered skin and overestimate the
necessary Ns to form an ordered sediment. Since order was most often found only in
small amounts through the depth of a skin and never in a sediment, this effect is assumed
to be small in analyzing the given system.
If Pe is reduced from the evaporation regime by decreasing the drying rate or the
size of the particles, diffusion plays a larger role in determining the particle distribution.
The boundary between the skin and the bulk of the coating was less distinct in coatings
that were dried at lower Pe, near the evaporation/diffusion boundary in the drying regime
map. Finally, in the diffusion regime, the concentration of particles remains fairly
uniform with depth at any point in the drying, as shown in Figure 6.11.
In the sedimentation regime, large particles settled with a greater velocity than the
evaporation velocity of the free surface, creating a region at the top of the coating that
was depleted of particles (Figure 6.12). Below the particle-free zone was a zone of
constant particle concentration, composed of free-falling particles. Near the sediment the
transition zone is clear. As time progresses, the initial concentration zone decreases in
length and the sediment grows until it includes all of the particles. Finally, the air-water
interface recedes into the packing.

110
Figure 6.10. Cross-section cryoSEM images obtained at different time points showing
evaporation dominance. Drying conditions were log(Pe) = 2.4, log(Ns) = -1.1, o = 0.2.
Dimensionless drying times and total coating thicknesses were (A) t = 0.3, H = 190 μm;
(B) t = 0.4; H = 160 μm (C) t = 0.7 H = 70 μm. A white dash marks the edge of the
consolidation front and the suspension-air free surface is at the top of each image.

111
Figure 6.11. Cross-section cryoSEM image obtained at t = 0.4 showing diffusion
dominance. Images were from different depths in the coating, as shown. Drying
conditions were log(Pe) = 0.62, log(Ns) = -1.1, o = 0.1.

112
Figure 6.12. Cross-section cryoSEM images obtained at different times as indicated
showing sedimentation. Drying conditions were log(Pe) = 0.25, log(Ns) = 2.3, φo = 0.1.
Sedimentation zones include a) a particle-free zone, b) initial concentration zone c) a
transition zone and d) sediment.

113
Figure 6.13. Cross section cryoSEM image of a coating showing sedimentation and
evaporation. t = 3.3; Pe = 0.25; Ns = 2.1. The inset shows the volume fraction of
particles as a function of depth in the coating as estimated from the image.
In the case where the particles in the coating sediment at a speed that is slower
than the descent of the free surface, the model predicts that both a sediment and a skin
can form simultaneously. This phenomena has been captured in Figure 6.13. An ordered
particle packing appears at the top of the coating. This skin grows until it reaches the
sediment near the substrate. Exploiting this phenomenon in more complicated coating
systems may lead to inexpensive methods to produce novel coatings.
Conditions where sedimentation, diffusion and evaporation were observed
experimentally are marked on the drying map in Figure 6.14. The experimental data
match the model well, especially the delineation between diffusion and evaporation
regimes.

114
Figure 6.14. Drying map created from the theoretical model displaying points where
evaporation (), diffusion (D) and sedimentation (S) regimes were discovered through
CryoSEM for o = 0.1 (grey) and o = 0.2 (black). Circle sizes denote the estimated
magnitude of error.
The sedimentation regime was found experimentally to occur at slightly lower Ns
values than those predicted, corresponding to an underestimation of the sedimentation
speed by the model. Lateral drying also influenced the particle distributions, especially at
later drying times (Routh and Russel 1998; Deegan et al. 1997). In this work, care was
taken to minimize this effect so that results could be compared to the 1D model.
Two particle system: To demonstrate how the understanding the drying behavior can be
exploited to develop novel coatings, a two particle system was dried. A bimodal silica
dispersion containing particles of 1 μm in diameter and 200 nm in diameter was prepared
with an overall particle volume fraction of 0.2. The coating had an initial thickness of 400
μm and was dried at 5 μm/min. The final result was a coating with a top layer entirely
composed of smaller particles and a bottom layer of small particles dispersed between
large particles (Figure 6.15).
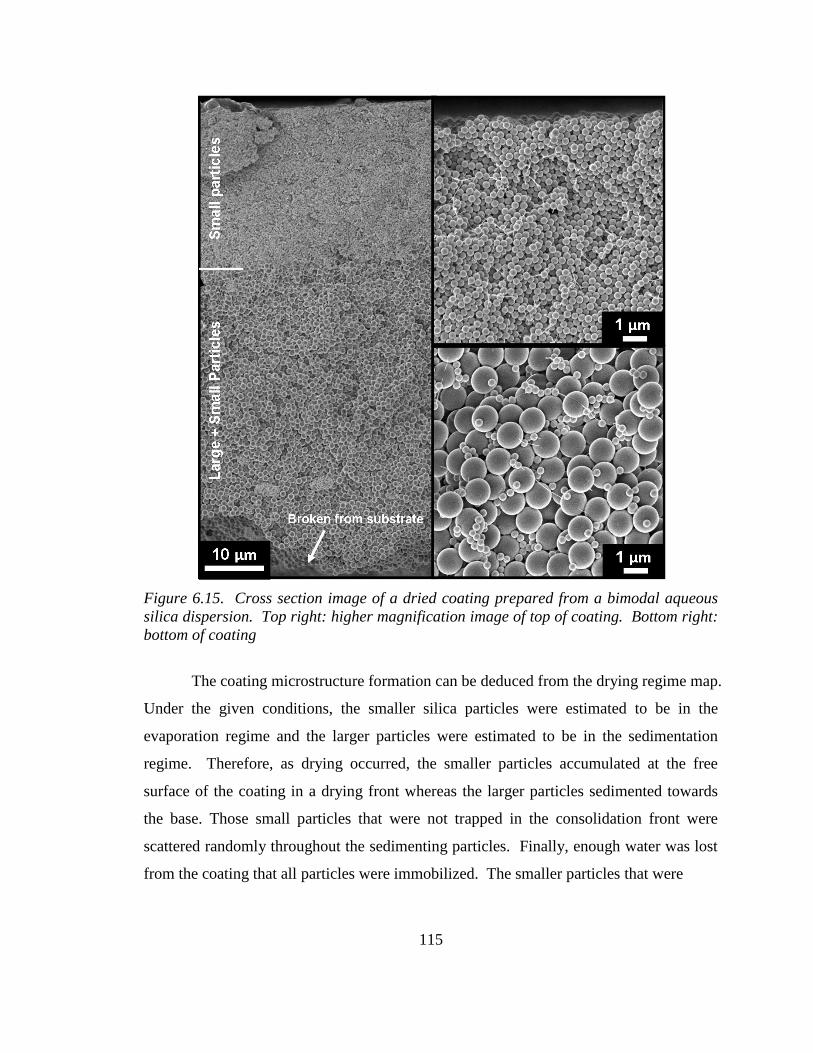
115
Figure 6.15. Cross section image of a dried coating prepared from a bimodal aqueous
silica dispersion. Top right: higher magnification image of top of coating. Bottom right:
bottom of coating
The coating microstructure formation can be deduced from the drying regime map.
Under the given conditions, the smaller silica particles were estimated to be in the
evaporation regime and the larger particles were estimated to be in the sedimentation
regime. Therefore, as drying occurred, the smaller particles accumulated at the free
surface of the coating in a drying front whereas the larger particles sedimented towards
the base. Those small particles that were not trapped in the consolidation front were
scattered randomly throughout the sedimenting particles. Finally, enough water was lost
from the coating that all particles were immobilized. The smaller particles that were

116
Figure 6.16 Two layer coating microstructure formation, as elucidated from the drying
regime map
trapped in the bottom of the coating were not small enough to move between the fully
consolidated larger particles. Otherwise, reorganization of the smaller particles could
have continued after the larger particles had reached their final packing fraction, as
observed elsewhere (Luo, Scriven, and Francis 2007). This type of coating could be a
cost effective strategy to introduce a large particle filler into a film of expensive small
particles without reducing the final quality of the product.
The application of the drying map to this example assumes that the sedimentation
coefficient and compressibility factor are the same for a two particle system as for a one
particle system. This assumption is not valid for particles that are very different in size.
Therefore, more work is required to rigorously adapt the drying map to more complicated
systems.
6.5 SUMMARY
The nonlinear 1D conservation equation with concentration dependent diffusion
and sedimentation coefficients was solved for the concentration profiles at different time
points for various drying conditions. This gave a picture of the particle distribution
before air invades into the particle packing. From this data, a drying map, which related
the observed behavior (sedimentation, diffusion or evaporation dominant) to two
dimensionless numbers, Pe and Ns, was developed. It was then demonstrated that certain
limiting cases of the drying map could be calculated analytically. CryoSEM was used as
an experimental validation of the predicted drying behavior. This method produced
visual verification of the predicted concentration profiles in the drying coating. Finally, it

117
was demonstrated that by understanding its drying behavior a novel coating could be
developed. It is hoped that this work will provide greater understanding of the drying
process of particulate coatings and that it can be used to design drying conditions to
produce desired coating microstructures.

118
CHAPTER 7
DRYING AND CRACKING OF SOFT LATEX COATINGS
7.1 INTRODUCTION AND MOTIVATION
Latex-based coating formulations are the environmentally friendly substitutes for
many traditionally solventborne polymeric coatings. Coatings such as paints, varnishes,
floor coatings, and reflective roof coatings are increasingly becoming latex-based as
environmental restrictions are placed upon the coating industry. In these latex systems,
water suspends a polymer colloid, often with other additives in the dispersion such as
ceramic particles to modify the color or hardness of the coating, dispersants, defoamers,
or pH and rheology modifiers. When this dispersion is applied to a substrate and dried,
the latex particles deform during the drying process to create a homogeneous, nonporous
coating (Keddie 1997).
A conflict exists in formulating such a dispersion because the latex modulus must
be sufficiently low so that the particles deform during drying, yet sufficiently high that
the tack resistance, dirt pickup resistance, and protective nature of the final coating are
not compromised. In many current formulations, plasticizers are added that reduce the
modulus of the latex during film formation, yet evaporate away after the coating is dried
to increase the long-term modulus of the final coating. The most common plasticizers are

119
Figure 7.1 Stages of water distribution during film formation
volatile organic compounds (VOCs), and as such are subject to increasingly harsh
environmental restrictions against their use. Understanding the factors that influence
particle coalescence is valuable for designing a latex coating without the use of
plasticizers.
Studies have shown that depending on the latex modulus and size, particle
deformation can occur at various stages of film formation. Particles initially are well
dispersed in the solution, but evaporation of the water brings them into contact. Further
evaporation causes the tops of the latex particles to break though the air-water interface,
creating curved water menisci that hang between particles (Figure 7.1). The low
capillary pressure under these curved menisci can deform soft particles during this “wet”
drying stage (Brown 1956). If the particles do not deform, further evaporation causes air
to enter even farther into the porespace, beginning the “moist” drying stage. In this stage,
water exists as pendular rings that hang between the contact points of the particles.
Eckersly and Rudin postulated that surface tension and capillary pressure can deform the
latex at this stage (Eckersley and Rudin 1990). Finally, when all of the air is gone, Gong
showed that van der Waals forces can be sufficient to deform particles (Gong, Davis, and
Scriven 2008; Gong 2008).
Numerous researchers have attempted to predict a critical latex shear modulus
(Gc) for particle deformation to occur in the wet stage. Brown (1956) balanced the force
to compress two Hertzian spheres with the estimated lowest capillary pressure that can be
supported by a stable meniscus between three latex particles (12.9 / R) to obtain:

120
Figure 7.2 Latex deformation stage as predicted by Russel, Wu, and Man (2008) for a
viscoelastic latex particle with polymer relaxation time τ = 2E(1-ν)/HG. Adapted with
permission from the American Chemical Society (License number 2480980431862).
(7.1)
where is the air-water surface tension and R is the particle radius.
Mason (1973) corrected Brown’s derivation by realizing that the capillary
pressure and the elastic response do not act over the same areas to find:
(7.2)
Routh and Russel created a model for predicting the stage of latex deformation
based on the particle modulus, size, polymer-water surface tension (pw), and other
coating properties (Routh and Russel 1999; Routh and Russel 2001; Russel, Wu, and
Man 2008). The model assumes linear viscoelastic particles that deform under capillary
forces, and viscous sintering driven by the reduction of polymer surface curvature in the
contact region. Van der Waals forces are neglected. They define a dimensionless
number as the ratio between the time for viscous collapse of the particle versus the
evaporation time of the entire coating:
(7.3)

121
where E is the evaporation rate, H is the initial coating thickness, and is the zero shear
viscosity of the polymer. Their model predicts the stage at which latex will deform based
on for various polymer relaxation times τ (Figure 7.2). Their model finds that particles
deform in the wet stage for 1 < < 100, with moist stage deformation taking place for
100 < < 104 for most values of τ.
The same capillary pressures that deform the latex particles can cause large
stresses within a drying coating. Corcoran modified Stoney’s experiment to measure the
stress development in a coating as it dries by observing the deflection that the stress
creates in a substrate (Corcoran 1969; Stoney 1909). This method was used by numerous
researchers to observe the developing stress in a latex coating (Perera, and Eynde 1984;
Petersen, Heldmann, and Johannsmann 1999; Martinez and Lewis 2002; Vaessen 2002).
Initially, there is a mild compressive stress in the coating which then develops into a large
tensile stress that is normally attributed to capillary stresses due to water menisci. The
stress then either plateaus or relaxes over time, due to water evaporation or polymer
relaxation. The origin of the initial compressive stress is disputed. Pekurovsky and
Scriven propose that it is due to the air-water surface tension pushing the particle packing
toward the substrate (Pekurovsky and Scriven 2001). K nig et al. disagree, claiming that
it is due to a springback of compressed particles after stress due to solvent flow is
released ( nig et al.).
When the particles in the coating do not coalesce, it is well established that the
drying stresses can cause cracking in the film. Cracking occurs when the energy required
to create two new surfaces is less than the elastic energy that would be released in
opening the crack (Griffith 1921). Tirumkudulu and Russel predicted that the critical
stress to required to crack a colloidal film of non-coalescing particles of shear modulus G
increases with G1/3
(Tirumkudulu and Russel 2005). This is because as the modulus of
the film decreases, the elastic energy recovered by a crack also decreases. When the film
coalesces completely into a pore-free film, Griffith crack theory for brittle materials and
Irwin’s modification for ductile materials both predict that the fracture stress increases
with G1/2
(Griffith 1921; Irwin 1957).
122
The critical fracture stress, σf, is the tensile stress necessary to propagate a crack
from a flaw. For a coating, σf, can be estimated by observing the average spacing
between cracks, λ (Thouless, Olsson, and Gupta 1992). Hu and Evans derived the
following expression for the fracture stress for a brittle coating of thickness h on a ductile
substrate with a yield stress of Y (Hu and Evans 1989):
323 h
Y
f
(7.4)
Equation 7.4 implies that if the substrate and film thickness are kept constant, an increase
in the crack spacing must be due to an increase in the critical fracture stress. The critical
fracture stress is also closely related to the materials parameter K1C, the fracture
toughness for a crack opening under tensile stress:
hK fcC 1 (7.5)
where Ωc is a constant that ranges from 1.3-1.6 depending on the properties of the
substrate (Hu and Evans 1989).
Although many studies have addressed film formation and stress development in
the two limits of particle modulus: coalescing and non-coalescing, VOC restrictions are
now necessitating a more detailed understanding of the factors that influence the
boundary between these two regimes. This boundary, termed the “minimum film
formation temperature” (MFFT), is the lowest possible temperature that a coating can be
dried to produce a coalesced, crack free film. In this research, an acrylic latex with a
modulus that highly depends on temperature was dried both just above and just below its
MFFT. Cantilever stress measurements and cryogenic scanning electron microscopy
(cryoSEM) were used to examine the stress and the microstructure of the coating as it
dried. This is the first known study of a latex film that cracks despite particle
coalescence. Furthermore, when small amounts of silica aggregates were added to the
dispersion, the cracking was reduced noticeably.
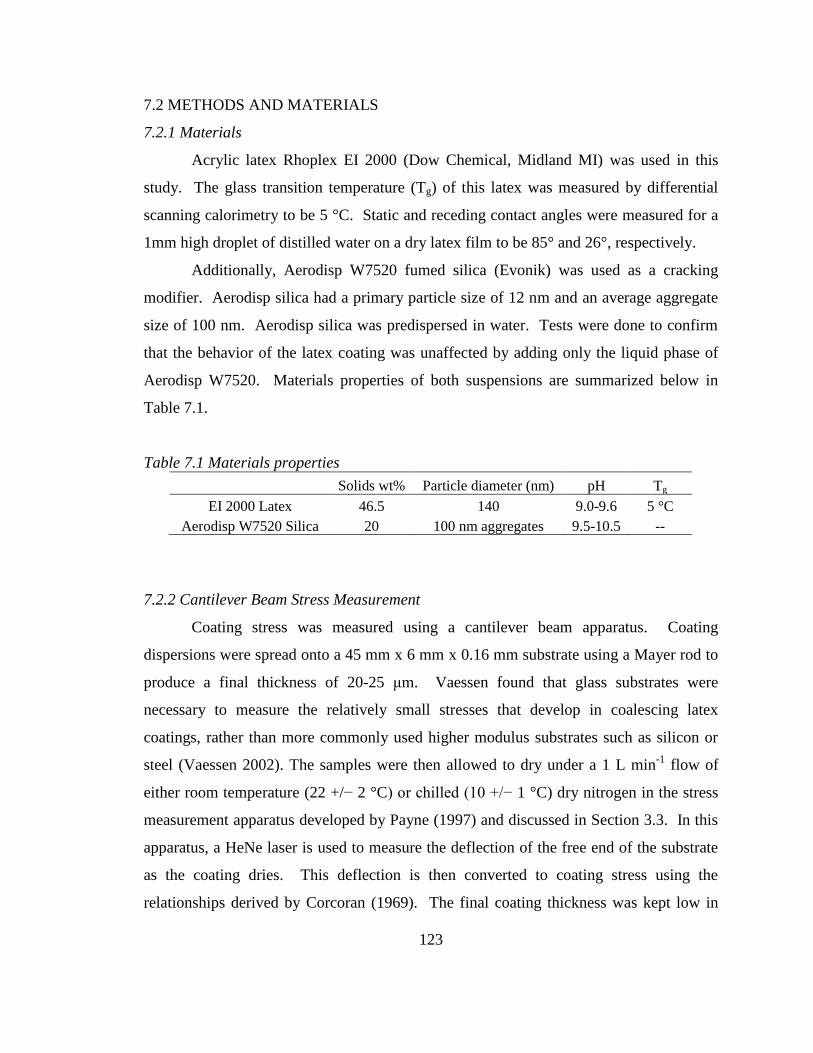
123
7.2 METHODS AND MATERIALS
7.2.1 Materials
Acrylic latex Rhoplex EI 2000 (Dow Chemical, Midland MI) was used in this
study. The glass transition temperature (Tg) of this latex was measured by differential
scanning calorimetry to be 5 °C. Static and receding contact angles were measured for a
1mm high droplet of distilled water on a dry latex film to be 85° and 26°, respectively.
Additionally, Aerodisp W7520 fumed silica (Evonik) was used as a cracking
modifier. Aerodisp silica had a primary particle size of 12 nm and an average aggregate
size of 100 nm. Aerodisp silica was predispersed in water. Tests were done to confirm
that the behavior of the latex coating was unaffected by adding only the liquid phase of
Aerodisp W7520. Materials properties of both suspensions are summarized below in
Table 7.1.
Table 7.1 Materials properties
Solids wt% Particle diameter (nm) pH Tg
EI 2000 Latex 46.5 140 9.0-9.6 5 °C
Aerodisp W7520 Silica 20 100 nm aggregates 9.5-10.5 --
7.2.2 Cantilever Beam Stress Measurement
Coating stress was measured using a cantilever beam apparatus. Coating
dispersions were spread onto a 45 mm x 6 mm x 0.16 mm substrate using a Mayer rod to
produce a final thickness of 20-25 μm. Vaessen found that glass substrates were
necessary to measure the relatively small stresses that develop in coalescing latex
coatings, rather than more commonly used higher modulus substrates such as silicon or
steel (Vaessen 2002). The samples were then allowed to dry under a 1 L min-1
flow of
either room temperature (22 +/− 2 °C) or chilled (10 +/− 1 °C) dry nitrogen in the stress
measurement apparatus developed by Payne (1997) and discussed in Section 3.3. In this
apparatus, a HeNe laser is used to measure the deflection of the free end of the substrate
as the coating dries. This deflection is then converted to coating stress using the
relationships derived by Corcoran (1969). The final coating thickness was kept low in

124
order to minimize the effects of edge-in drying and to reduce the need for neutral axis
corrections to Corcoran’s equation (Section 3.3.1). The final coating thickness was
measured by a micrometer (#543-253B, #7004; Mitutoyo Corp) averaged over the entire
coating.
Stress was corrected for weight loss following Section 3.4.3. A constant drying
rate of 6 x 10⁻⁴
g/min was assumed for drying in warm conditions and 3 x 10⁻⁴
g/min for
drying in cold conditions until 52% of the initial weight of the coating, corresponding to
the water content, had evaporated. These corrections shifted the stress an average of 0.02
MPa in total.
7.2.3 Cryogenic Scanning Electron Microscopy
CryoSEM was used to characterize the developing microstructure as the latex
coatings dried. Coatings were allowed to dry in the stress measurement apparatus under
the same airflow conditions and using the same 45 mm x 6 mm x 0.16 mm glass
substrates. After the desired amount of drying, samples were then plunge frozen into
liquid ethane at −196 °C for vitrification. Under a bath of liquid nitrogen, the samples
were loaded into a cryoSEM sample holder and the substrate was broken to expose the
coating cross section. Samples were then transferred to an Emitech K-1250 cryo
preparation chamber where they were sputtered with a 2 nm layer of platinum. The
samples were finally imaged in a Hitachi S4700 FESEM at −160 °C.
Top surface cyroSEM samples were similarly prepared, with the exception that a
5 x 7 mm silicon chip was used as the substrate and the samples were not fractured before
imaging. Top surface images were also prepared at the Technion Institute in Haifa, Israel,
on a Zeiss Ultra Plus FESEM. Although these samples were dried at room temperature
without air flow, the drying sequence of these samples was found to be similar to room
temperature drying with air flow.

125
7.2.4 Crack spacing measurements
To quantify the cracking tendency of the films at various conditions, coatings
were cast on a minimum film formation temperature bar (MFFT90, Rhopoint) to sample
a wide range of drying temperatures under 3 L/min of blowing low humidity air. The
MFFT bar was covered with a thin polyethylene terephthalate substrate to aid in the
removal and analysis from the coating as described in Section 3.2. Coatings were applied
in one inch wide strips and dried to a final film thickness of 0.1 mm.
7.3 RESULTS AND DISCUSSION
7.3.1 Macroscopic Appearance
The latex coating was dried under warm (22 +/− 2 °C) or chilled (10 +/− 1 °C)
flowing nitrogen in order to show the effect of latex modulus on the stress and
microstructure development. During film formation at both temperatures, the latex
coating changes appearance from milky to clear. Opacity is attributed to light scattering
from particles in the dispersion state. When the porespace between particles is reduced
substantially compared to the wavelength of visible light, the coating no longer scatters
light and becomes clear (Arlinghaus 2004).
Figure 7.3 shows a latex coating drying under a flow of room temperature air.
When first deposited, the coating is completely milky. The coating dries laterally, from
the edge in toward the center. After about two minutes of drying, the drying front
reaches the center of the sample (Figure 7.3c). Very few cracks are apparent in the
sample at the bottom edge, but for the most part the coating remains uncracked.
When dried under a flow of cool nitrogen, the coating also starts out with a milky
appearance and dries laterally. Coatings crack extensively, with fractures extending into
the milky region. Cracks first develop perpendicular to the drying front and then parallel
to the drying front (Figure 7.4) as described also by Allain and Limat in colloidal systems
(Allain and Limat 1995). After the coating cracks, it continues to dry to a clear film,
indicating that the particles continue to consolidate and compact until the porespace no
longer scatters light.

126
Figure 7.3 Digital image of a drying cantilever under room temperature air. Letters A,
B, C, D correspond to times marked in Figure 7.15a. The cantilever is 6 mm wide.
Figure 7.4 Digital image of a drying cantilever under chilled air. Letters A, B, C, D
correspond to times marked in Figure 7.15b. The cantilever is 6 mm wide.

127
Figure 7.5 Top surface optical microscopy images of dried latex coatings at various
drying temperatures. True cracks and microcracks are imaged. The color of the image
is an artifact of the settings of the microscope. The coatings are optically clear.
Thin 0.03 mm coatings (dry thickness) that were dried on the MFFT bar cracked
with a mudcracking pattern that went all of the way to the substrate at temperatures
between 0 °C and 9 °C. A second, finer pattern of very shallow cracks was also evident
on the top surface up to 17 °C (Figure 7.5). These “microcracks” were measured using
atomic force microscopy to be an average of 2 μm deep. Microcracks were difficult to
characterize, only affected the very top surface of the coating, and were absent from
samples dried on cantilevers. They will therefore be left out of further discussion. Figure
7.5 also compares coatings that were made from only latex with coatings that contained 4
wt% of silica aggregates in the dry coating. The silica noticeably reduced the amount of
microcracks and increased the distance between true cracks, as will be discussed in
Section 7.3.3.
Thick 0.1 mm coatings dried laterally on the MFFT bar. The samples cracked
below temperatures of 17 °C with parallel cracks that were perpendicular to the drying
front and went all of the way through the coating. It is not surprising that thicker coatings
cracked at higher temperatures than thinner coatings; the critical fracture stress needed to
open a crack is inversely proportional to the coating thickness (Equation 7.4) and lateral
cracks are known to occur at lower stresses than mudcracking (Jindal 2009).

128
7.3.2 Microstructure Development
Cryogenic scanning electron microscopy was used to probe the microstructure
development of the latex coating above and below the minimum crack temperature to
determine the role of microstructure in influencing crack behavior and stress. Both top
surface and cross section images were taken.
Figures 7.6 and 7.7 show the top surface and cross section, respectively, of a latex
coating dried under 22 °C nitrogen. Evaporation concentrates the particles and brings
them into contact with one another. The thinning water layer covering the particles
becomes unstable and dewets from the latex (Figure 7.6a). Static contact angles for water
on dry latex bulk films were measured to be 85°, confirming the appearance of the water
in Figure 7.6a that the water initially forms droplets that are concave towards the film.
Figure 7.6a also shows some areas where the water has started to invade into the particle
packing where the water curvature is less pronounced. These states are stable, since the
receding contact angle, which is the angle that water would be expected to take if the
contact line were moving due to evaporation, was measured to be about 26°. Also in
Figure 7.6a it is clear that the latex- latex contact points that are not obscured by water
have already begun to flatten against each other.
Figure 7.6b shows the degree to which the particle contact points have flattened at
the time at which the water invades into the particle packing. Some small droplets cling
between particles, but in general the porespace has completely closed. Figures 7.6c and
7.6d show the gradual flattening of the coating top surface and the reduction of particle-
particle boundaries. Not shown is the final, completely consolidated coating that
develops after a few hours of drying.
Cross section images (Figure 7.7) corroborate this story. Initially, particles are
mobile, suspended in the water (Figure 7.7a). Figure 7.7b shows that the particle contact
points well below the coating top surface flatten during the wet stage of drying. The
fracture during the sample preparation of Figure 7.7b created pullouts, or plastic
deformation of particles, indicating good adhesion at particle contacts (Ge et al. 2006).
Although water was seen filling the shrinking porespace, no pendular rings were seen to
indicate air invasion. The last image, Figure 7.7c, shows a packing of highly

129
Figure 7.6 CryoSEM top surface images of a drying latex coating dried under 22 °C
nitrogen

130
Figure 7.7 CryoSEM cross section images of a latex coating dried under 22 °C nitrogen.
Cartoons show the inferred microstructure.

131
deformed particles with almost no porespace. Pullouts bridge multiple particles,
signifying that polymer interdiffusion has begun (Ge et al. 2006). Therefore, when drying
at warm temperatures the particles deform in the wet drying stage (Figure 7.1).
Figure 7.8 shows top surface cryoSEM images of a coating drying under 10 °C
nitrogen flow. In Figure 7.8a, as in Figure 7.6a, the thinning layer of water on top of the
latex particles has become unstable, and the top surface latex particles are exposed to the
air. Another, earlier view of this drying stage is shown in Figure 7.9. Figure 7.8a also
shows much less flattening at particle-particle contact points in early stages of drying as
compared to drying at room temperature.
When drying under 10 °C nitrogen flow, cracking occurs in a state between
Figure 7.8a and b; Figure 7.10 shows a top surface image of the latex packing very near a
propagating crack tip. The coating is still clearly in the wet stage, with curved menisci
just beginning to develop between particles. Others have also hypothesized from weight
loss measurements that cracks form at the start of the wet stage, but Figure 7.10 is the
first known successful SEM visualization to support this idea (Chiu and Cima 1993; Grau
et al. 1999; Colina and Roux 2000).
After cracks develop, the coating continues to dry. Figure 7.8b shows a fully
developed wet stage with water menisci that are concave towards the air. As shown in
Figure 7.8c, particle flattening occurs by the end of the moist drying stage, but the
porespace does not close to the extent seen in warmer drying conditions. In Figure 7.8d,
the coating is completely dry, yet deformation has clearly not proceeded to the extent
seen in Figure 7.6d. Both of these images were taken after approximately ten minutes of
drying.
Cross section images of coatings dried at 10 °C show similar results as compared
to the top surface images. Figures 7.11 b-e were taken of the fracture surface of natural
cracks. Because these cracks occurred while the coating was drying and not after the
sample was frozen, there are no pullouts. The cracks propagate during the wet drying
stage before air invades into the bulk of the coating (Figure 7.11b). In contrast to drying
in warm temperatures, pendular rings can be seen in Figure 7.11c, signifying that the
porespace remains open enough that air can invade into the particle packing. In this

132
Figure 7.8 CryoSEM top surface images of a latex coating dried under 10 °C nitrogen

133
Figure 7.9 CryoSEM top surface image of water dewetting from the tops of latex
particles during drying under 10 °C nitrogen
Figure 7.10 CryoSEM top surface image of latex particles at a crack edge near a
propagating crack tip during drying under 10 °C nitrogen. The inset shows the entire
crack tip with the location of the detailed image marked.

134
Figure 7.11 CryoSEM cross section images of a drying latex coating under 10 °C
nitrogen. Cartoons show the inferred microstructure.

135
Figure 7.12 CryoSEM cross section image of a latex coating containing 4 wt% (dry
weight basis) silica aggregates drying under room temperature nitrogen flow. The
coating is in the advanced wet drying state. Silica did not influence the particle
coalescence in any noticeable way.
moist stage, the particles flatten slightly until all of the water disappears (Figure 7.11d).
Finally, van der Waals forces complete the particle deformation over time. Over 24
hours elapsed between Figures 7.11d and e.
Figure 7.12 shows a coating that contains silica aggregates. Silica was not found
to influence the particle coalescence or the evaporation rate in any way. Silica aggregates
were also found to uniformly distribute through the coating thickness.
From the cryoSEM images, it can therefore be said that the latex particles deform
almost completely in the wet stage at room temperature and deform partially in the moist
stage at 10 °C. From these observations and rheometry measurements on the dry acrylic
film (Figure 7.13), the critical shear modulus (Gc) for sintering in the wet stage can be
estimated to be between G(22 °C) = 24 MPa and G(10 °C) = 200 MPa for this latex.

136
Figure 7.13 Latex polymer shear modulus (G) as a function of temperature as measured
on a dry latex film by a rheometer tensile test, 1 Hz strain rate, 3 °C/min temperature
ramp
Critical values of Gc were calculated for this 140 nm diameter latex from
Equations 7.1-7.3, assuming a coating liquid phase surface tension of 50 dyn/cm
(Pekurovsky 2006). These values are shown in Table 7.2. Brown and Mason’s elastic
particle force balance correctly predicts that wet stage sintering occurs at warm
temperatures but not under cool air flow. For both drying temperatures Routh and
Russel’s model incorrectly predicts particle deformation in the submerged state due to
only particle-water surface tension forces. This model was derived for viscous particles
where the driving force for deformation is primarily the polymer-water surface tension.
In the model, a large negative curvature at the particle-particle contact point draws
material into the contact region. This deformation mode was termed “stretching” by
Jagota et al. (Figure 7.14) (Jagota, Argento, and Mazur 1998). No evidence of a curved
contact region is seen experimentally in Figures 7.8 c and d, where the particles are
clearly deformed yet the boundaries between the particles are still distinct. It appears that
for this latex the “zipping” mode of contact area growth (Figure 7.14), driven by van der
Waals attractive forces, is more accurate (Jagota, Argento, and Mazur 1998). Without a
polymer-water meniscus, the stretching model underestimates the force necessary to
coalesce the particles.

137
Figure 7.14 Modes of particle-particle contact growth
Table 7.2 Do particles deform in the wet stage?
Latex properties Proposed criteria for wet stage coalescence
T G (latex) Brown
G < 25 MPa
Mason
G < 190 MPa
Routh & Russel
1 < <100 CryoSEM
10 °C 200 MPa 0.7 No No submerged No
22 °C 24 MPa 0.17 Yes Yes submerged Yes
7.3.3 Stress Development
Coating stress was measured by the cantilever beam deflection technique as the
latex dried under room temperature and 10 °C nitrogen flow were compared, as well as
the stress with and without silica aggregates.
When converting cantilever deflection to coating stress, Corcoran’s equation
(Equation 3.4) assumes that the entire sample is in the same state of drying, experiencing
one state of stress. When coatings dry laterally, this is not the case. Rather, a stress
development front moves inward along with the drying front as imaged by nig et al.
(2010). Therefore, the single value of stress calculated from the cantilever deflection
does not provide information on the local stress states, which vary across the cantilever.
Nevertheless, the technique captures the progression from wet to dry and can give some
general information about how the stress develops in a coating.

138
Figure 7.15 Calculated stress, averaged over the entire coating, during drying at 22 °C
(left) and 10 °C (right). Coatings composed of only latex (―) and latex with 2 dwb%
silica (---) are compared.
Stress profiles for warm and cold drying conditions are shown in Figure 7.15.
Figure 7.15a shows the calculated stress in the coating as it dries. Initially there is a mild
compressive stress followed by a large tensile stress and a relaxation to a small residual
stress. This behavior is comparable to latex systems of “mid MFFT” reported by Yow et
al. (2010) where the drying temperature was approximately equal to the MFFT, as it is in
this study.
Pekurovsky and Scriven (2001) conjecture that the initial small compressive stress
is due to surface tension forces that act towards the substrate when averaged around the
entire air-water-particle contact line in the wet stage. Although this explanation is
plausible, cryoSEM images show another source of compressive stress in Figures 7.6a
and 7.8a. As evaporation causes the thinning layer of water to dewet from the particles,
the resulting droplet on the top of the particle packing is concave towards the substrate.
This causes a positive pressure and a compressive force within the coating until further
evaporation removes these top surface droplets (Figure 7.16).

139
Figure 7.16 Illustration of water dewetting from the latex particles (left) and the wet
stage (right)
As evaporation proceeds further, the contact line becomes unpinned and starts
moving on the surface of the particle. The receding contact angle for water on this latex
was measured to be 26°, implying that the liquid becomes concave to the air. The
resulting low capillary pressure due to air invasion into the colloidal packing is often
cited as the source of large tensile stresses (Chiu and M. J. Cima 1993). Low capillary
pressures cause particle deformation and coating shrinkage. Since the substrate cannot
shrink with the coating, this frustrated shrinkage is another source of stress (S. G. Croll
1979; S Croll 1979). After the water evaporates away, the stress relaxes to a small
residual value. In the absence of cracking and when compaction removes all pores, this
relaxation must be due to polymer chain motion in the coalesced coating.
When drying under 10 °C nitrogen flow, the latex coating reaches a tensile stress
maximum that is twice as high as it is at room temperature. This maximum is maintained
at a fixed value for some time, and then a small residual stress is reached. The coating
takes twice as long to reach this residual stress, since the evaporation rate is
approximately half as fast at colder drying temperatures. It is interesting that, even
though the coating cracks all of the way to the substrate, relieving some of the coating
stress, the cold drying tensile stress is still much higher than the warm case. It is assumed
that this cracking action is what blunts the stress peak.

140
Several possible sources exist for the higher stress maximum when drying under
10 °C nitrogen. As seen in cryoSEM images, at cold drying conditions the latex
progresses through the moist drying stage, whereas particles deform completely in the
wet stage under warm drying conditions. Capillary forces exerted by pendular rings in
the moist stage are much stronger than they are in the wet stage due to a greater air-water
surface curvature. This will cause a higher tensile stress during the moist stage. Also, at
colder temperatures the modulus of the latex particles is higher, creating a higher
modulus for the coating overall. Since the stress is directly related to the coating
modulus, Ec, and shrinkage strain, ε, Equation 7.6 predicts that, given equal shrinkage,
the stress, σ, will be higher in the cold air flow case (Francis et al. 2002):
)(1
)()( t
tEt
c
c
(7.6)
A higher modulus will additionally decrease the amount of stress relaxation. In the case
of lateral drying when relaxation occurs at the same time in the coating as tensile stress
buildup, this would increase the magnitude of the measured stress. Lastly, under lower
evaporation rates, the stress development and lateral drying fronts propagate towards the
center of the cantilever more slowly, causing more of the coating to be stressed at any
given time.
Perhaps the most insightful result of the stress measurement data is that the
addition of small amounts of silica has little effect on the overall stress profile at both
drying temperatures. However, silica does reduce the cracking at 10 °C considerably, as
will be discussed in Section 7.3.4.
7.3.4 Cracking
It is commonly known that coatings that are dried at temperatures below the Tg of
the latex are prone to cracking, whereas latexes that are dried above the latex Tg are crack
resistant. The latex in this study, however, cracks at drying temperatures above its glass
transition temperature (5 °C) where cryoSEM images confirm that coalescence occurs.
Since the crack spacing between parallel cracks is easiest to measure, the crack
spacings of thick (0.1 μm) coatings that dried laterally on an MFFT bar were used as a

141
Figure 7.17 Average crack spacing of 0.1 mm dry thickness latex coatings (●) and latex
coatings containing silica (○) with respect to drying temperature. Temperatures where
coatings did not crack are marked with an infinite crack spacing. A) Rhoplex EI 2000 is
compared with latex containing 4 wt% (dwb) silica. B) Rhoplex AC 337N is compared to
latex containing 6 wt% (dwb) silica.
quantitative measure of the critical fracture stress and coating fracture toughness. These
films cracked at drying temperatures below 17 °C. The crack spacing was found to
increase with temperature for both latex coatings and latex coatings containing 4 wt%
(dwb) silica (Figure 7.17). These data, along with Equation 7.4, imply that the critical
fracture stress of the coating increases with increasing temperature. To show that this
phenomenon is not unique to only one latex, similar crack spacing data is also shown for
another acrylic latex, Rhoplex AC 3357N (Figure 7.17b). Rhoplex 377N has a measured
Tg of 15 °C and the particle diameter was approximately 70 nm. Again, the crack spacing
increases with temperature and with the addition of silica aggregates.
To understand why temperature has a profound effect on crack behavior, the
crack spacing data were replotted with respect to polymer modulus in Figure 7.18 using
the known relationship between the polymer modulus and temperature that was displayed
previously in Figure 7.13. This log-log plot shows that between drying temperatures
ranging from 9 °C < Tdry < 17 °C there exists an exponential relationship between the

142
Figure 7.18 Average crack spacing of 0.1 mm dry thickness latex coatings (●) and latex
coatings containing 4 wt% (dwb) silica (○) with respect to the latex particle shear
modulus. Grey cartoons show the predicted state of high and low modulus particles
when the cracking occurs.
crack spacing (and therefore σf) and latex modulus. For Tdry < 9 °C, the crack spacing is
independent of latex modulus. Furthermore, below this critical temperature Tc = 9 °C,
the addition of silica measurably increases the crack spacing, whereas above Tc silica has
little effect. The temperature Tc corresponds to a critical latex modulus Gc of
approximately 0.2 GPa.
As mentioned previously, the critical fracture stress of a nonporous coating
decreases with G1/2
(Griffith 1921; Irwin 1957) and of a colloidal coating of hard
particles decreases with G1/3
(Tirumkudulu and Russel 2005). The data displayed in
Figure 7.18 suggests that the critical fracture stress of a partially coalesced coating is
proportional to G-1.9
; σf increases with decreasing G. In this study, the latex modulus not
only influences the amount energy dissipation when the crack forms, but also the degree
to which the latex particles are coalesced together when the critical fracture stress is
reached. At higher drying temperatures, the particles flatten more before cracking occurs,
decreasing the coating porosity which creates a higher coating modulus.

143
Figure 7.19 Average crack spacing of latex composite coatings containing silica dried at
10 °C. A line of best fit (λ = 0.00012 Gcomp0.47
) is shown for Gcomp < 0.25 GPa. Inset:
Macroscopic look at the cracked coating
The fracture toughness of a coating that cracks under tensile stress, K1C, is a
function of its Young’s modulus Ecoating and the fracture energy Gcoating.
KIC2 = Ecoating Gcoating (7.7)
For an elastic material, the Young’s modulus and shear modulus are related by:
E = 2G(1+ν) (7.8)
In this partially coalescing latex coating, decreasing the modulus of the latex
particles increases the extent to which the particles deform and, consequently, the fracture
energy of the coating. Decreasing the particle modulus has a complex effect on the
coating modulus, since although the particles become softer the coating porosity
decreases.
The critical modulus 0.2 GPa corresponds well with the critical modulus for wet
stage coalescence as predicted by Mason (Equation 7.2). Therefore, when the particle
modulus is above 0.2 GPa the particles do not coalesce at all in the wet stage, the coating
at this stage has little mechanical strength to resist tensile forces, and lowering the
temperature even further has no effect on the amount of cracking that is observed.

144
When small amounts of silica aggregates were added to the coating, the average
crack spacing was increased for drying temperatures below Tc. The Young’s modulus of
a polymer composite Ecomp containing a volume fraction ϕ of silica of Gsilica = 170 GPa
can be estimated by the following equation (Paul 1960):
32
32
32
1)(
latexsilicalatex
latexsilicalatex
latexcomp
EEE
EEEEE (7.9)
The dry coating modulii for samples containing silica were estimated using
Equation 7.9. The average crack spacing found in such films when dried at 10 °C with a
dry coating thickness of 0.1 mm is displayed in Figure 7.19. Although the modulus of
the composite when the coating cracks is unlikely to be equal to the dry composite
modulus, the degree of latex coalescence in each sample when fractures occur should be
constant. The relevant coating composite modulus, therefore, would be a fraction of the
dry film modulus which could be estimated if the porosity due to incomplete latex
coalescence was known.
The crack spacing increases with modulus with the relation λ = 0.00012 Gcomp0.47
up to a composite modulus of 0.25 GPa. This is consistent with Griffith crack theory
which predicts that the critical fracture stress of a material increases with G1/2
. It can then
be concluded that the silica reduces cracking in the film solely by modifying its modulus.
Above a modulus of 0.25 GPa, it is likely that the large fractal aggregates have formed a
percolated network and Equation 7.7 is no longer valid for predicting the coating
modulus.
7.4 CONCLUSIONS
As the amounts of coalescing aids permitted in latex based products are being
reduced, it is critical to understand stress development near the minimum film formation
temperature. Whereas previous studies on latex film formation have examined the drying
of noncoalescing latexes that crack and coalescing latexes that do not crack, this study
definitively shows that there is an intermediate regime where particles partially coalesce
in early drying stages and that this coalescence has an effect on the crack behavior.

145
Coupled cryoSEM and stress measurement experiments show a clear picture of
film formation above and below the MFFT. First, evaporation concentrates the particles
and the thinning film of water at the free surface becomes unstable and dewets from the
solids packing. This process, which produces an air-water interface curvature that is
concave towards the coating, could be another explanation for positive capillary stress
that was measured in stress measurements. Further drying causes this interface to be
concave towards the air, beginning the wet drying stage. In this stage, large tensile
stresses are measured. At room temperature, the particles deform significantly under this
capillary stress. At 10 °C, smaller amounts of deformation were observed, and the
relatively weak coating was subject to cracking. After further evaporation, the particles
continued to deform. At room temperature, the pore space completely closed during the
wet drying stage, whereas at 10 °C van der Waals forces closed the porespace in a dry
coating over a period of 24 hours. Therefore, although a latex may coalesce completely,
it is the amount of deformation that is present at the wet stage that is relevant to cracking.
Although traditional crack theory predicts that a higher modulus material will
have a higher fracture stress, in this case the opposite was observed. Softer latex particles
partially coalesced before the coating cracked, increasing the fracture toughness of the
wet film. The fracture toughness was found to be proportional to G-1.9
. The inclusion of
small amounts of silica aggregates also improved the fracture toughness of the film by
increasing its modulus. Since many commercial latex coatings often contain ceramic
particles, this study shows that the concentration and perhaps the aggregate dimensions of
such materials are important parameters for controlling the product fracture toughness in
a low VOC way.
To gain further insight into the relevant parameters for controlling cracking under
these near-MFFT drying conditions, a new model for latex coating fracture is necessary.
This model would require a fracture toughness and modulus that is dependent on particle
deformation. In predicting this deformation, the “zipping” sintering mode cannot be
ignored.

146
CHAPTER 8
FUTURE DIRECTIONS:
SOLUBLE BINDER AND RAMAN MICROSCOPY
8.1 INTRODUCTION
This thesis presents many examples of how cryogenic scanning electron
microscopy was combined with other experimental techniques and theoretical models to
describe the drying and microstructure development of coatings containing particles.
Although these systems are very relevant to latex based coatings such as paints and
varnishes, a very large class of coatings exists that is composed of hard particles and
soluble binder. Currently, the theoretical analysis of such coatings has been primarily
confined to the case of binder migration through a porous network of solids, for example
Pan (1995). The case of particulate distributions through the depth of a polymer-rich
coating (see Figure 1.2) is often ignored, as well as the concentration stage of any
polymer/soluble binder dispersion (see Figure 6.1). Furthermore, no known experimental
technique has successfully been employed at the University of Minnesota to follow the
distribution of soluble binder through the depth of a particulate coating as it dries.
CryoSEM is not suitable for this task, since it cannot distinguish between soluble
polymer and the solvent that it is dispersed in. Yet, soluble binder is so common in
147
coatings formulations that it cannot be ignored. Its relatively high mobility means that it
often creates microstructure challenges that must be better understood.
One potential application that would benefit from such a study is paper coatings,
where drying conditions tailored to reduce binder migration often limit the speeds of
coating lines. Paper coatings are porous coatings of large ceramic particles that are held
together by polymer binder to create an absorbent layer for ink to adhere (Chinga and
Helle 2002). Migration of the binder to the top of the coating is blamed for gloss
reduction, print quality, slow drying rates, stiffness, poor dirt resistance and delamination
of the coating from the paper (Al-Turaif and Bousfield 2005; Engstrom et al. 1991;
Yamazaki et al. 1993).
In contrast to paper coating, a limited number of applications desire a binder
gradient throughout a particulate/polymer composite coating. For example, the General
Motors fuel cell electrode is a particulate layer consisting of carbon/platinum catalyst
particulates bound by a proton conductive polymer, or ionomer. On one side of the
electrode membrane is a proton source, the proton exchange membrane (PEM), and on
the other side is an oxygen source (Passalacqua et al. 1998). Protons must be able to
conduct through contiguous pathways in the ionomer and oxygen must be able to diffuse
through pores through the membrane to meet and react (Ji et al. 2006). Oxygen
reduction occurs at the three-phase interface between the ionomer, the oxygen gas, and
the catalyst (Fleig and Maier 1997). Therefore, the ionomer concentration must be such
that it binds the catalyst particles, allows sufficient oxygen to permeate, and also provides
a pathway for protons (Li and Pickup 2003). The optimal structure is a gradient of
ionomer through the membrane, with a high ionomer content near the PEM to provide
better proton conduction and less ionomer near the oxygen source for more porespace for
gas diffusion (Xie et al. 2005).
The one particle model presented in Chapter 6 could be adapted for a one particle
system containing soluble binder. Two evolution equations would be necessary: one for
the particle distribution, and one for the binder distribution. The binder distribution
would affect the coating viscosity and consequently the relevant Peclet number for the
particles. These two coupled equations could be solved using COMSOL. Such a model

148
would be especially useful for considering the particulate distribution of coatings that
contain a significantly larger volume fraction of polymer than particles. These coatings
never reach a capillary drying regime (Figure 6.1) because at no point do the particles
reach a high enough volume fraction such that air invades and creates capillary forces.
Other researchers have created models for the converse situation for the capillary regime
where a small amount of polymer is convected through a large concentration of particles
due to capillary forces (Pan, Davis, and Scriven 1995; Nowicki, Davis, and Scriven 1992).
Experimental verification of these models cannot be done solely with cryoSEM
since cryoSEM images provide no contrast between soluble polymer and water or other
solvents (Figure 8.1). Instead, a different technique is required to track the amount of
soluble polymer through the coating thickness as the coating dries. Raman microscopy is
another promising experimental technique that can give quantitative chemical species
information through the depth of a sample.
Figure 8.1 CryoSEM cross section image of a drying coating containing polyvinyl
alcohol, titanium dioxide, and water. There is no contrast between the polymer and the
water, except for pullout type structures due to the sample fracture.
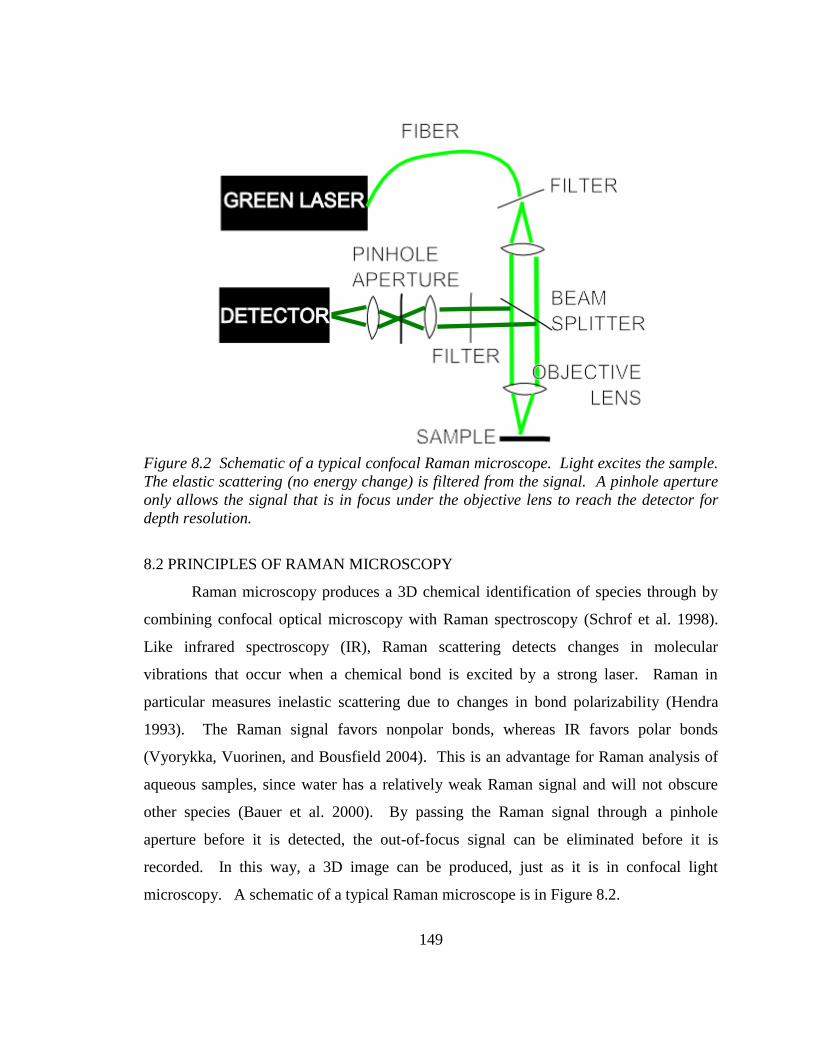
149
Figure 8.2 Schematic of a typical confocal Raman microscope. Light excites the sample.
The elastic scattering (no energy change) is filtered from the signal. A pinhole aperture
only allows the signal that is in focus under the objective lens to reach the detector for
depth resolution.
8.2 PRINCIPLES OF RAMAN MICROSCOPY
Raman microscopy produces a 3D chemical identification of species through by
combining confocal optical microscopy with Raman spectroscopy (Schrof et al. 1998).
Like infrared spectroscopy (IR), Raman scattering detects changes in molecular
vibrations that occur when a chemical bond is excited by a strong laser. Raman in
particular measures inelastic scattering due to changes in bond polarizability (Hendra
1993). The Raman signal favors nonpolar bonds, whereas IR favors polar bonds
(Vyorykka, Vuorinen, and Bousfield 2004). This is an advantage for Raman analysis of
aqueous samples, since water has a relatively weak Raman signal and will not obscure
other species (Bauer et al. 2000). By passing the Raman signal through a pinhole
aperture before it is detected, the out-of-focus signal can be eliminated before it is
recorded. In this way, a 3D image can be produced, just as it is in confocal light
microscopy. A schematic of a typical Raman microscope is in Figure 8.2.

150
Figure 8.3 WiTec Alpha 300R confocal Raman microscope owned by the University of
Minnesota Characterization Facility. Image taken Spring, 2008.
The Raman signal is relatively weak, and it has only been recently that lasers,
detectors, and filters have advanced enough that Raman microscopy is feasible for a wide
range of samples (Hendra 1969; Lyon et al. 1998). The WiTec Alpha 300R Confocal
Raman microscope owned by the University of Minnesota Characterization Facility is
pictured in Figure 8.3. This instrument is capable of 250 nm resolution in the xy plane,
and 0.5 μm resolution through the depth of a sample. A single spectrum can be obtained
in less than one second, and mappings in the xy or xz plane can take seconds or minutes,
depending on the desired size and resolution of the image. The resolution and signal
strength depend on the optical properties of the sample, the capabilities of the instrument,
the presence of reflections within the specimen, and the transparency of the sample
(Everall 2000; Marton et al. 2005; Tomba and Pastor 2007; Baia et al. 2002). Some
species cannot be imaged using Raman due to fluorescence which will obscure the
Raman signal (Råsmark et al. 2005), and samples must be transparent for depth profiling.
Raman signals for common bonds have been tabulated (Hendra 1993; Hendra 1969).
The Raman signal intensity of a species, Ii, is proportional to its concentration
within the sample. However, for a given sample and apparatus, the peak intensity also
depends its depth within the specimen. Therefore, concentration profiles are most often
reported as ratios between one species to another at the same location. The ratio of the
concentrations between one species to another should be proportional to the ratio of the
characteristic peak absorbencies (He et al. 2002; Belaroui et al. 2000; Scharfer, Schabel,
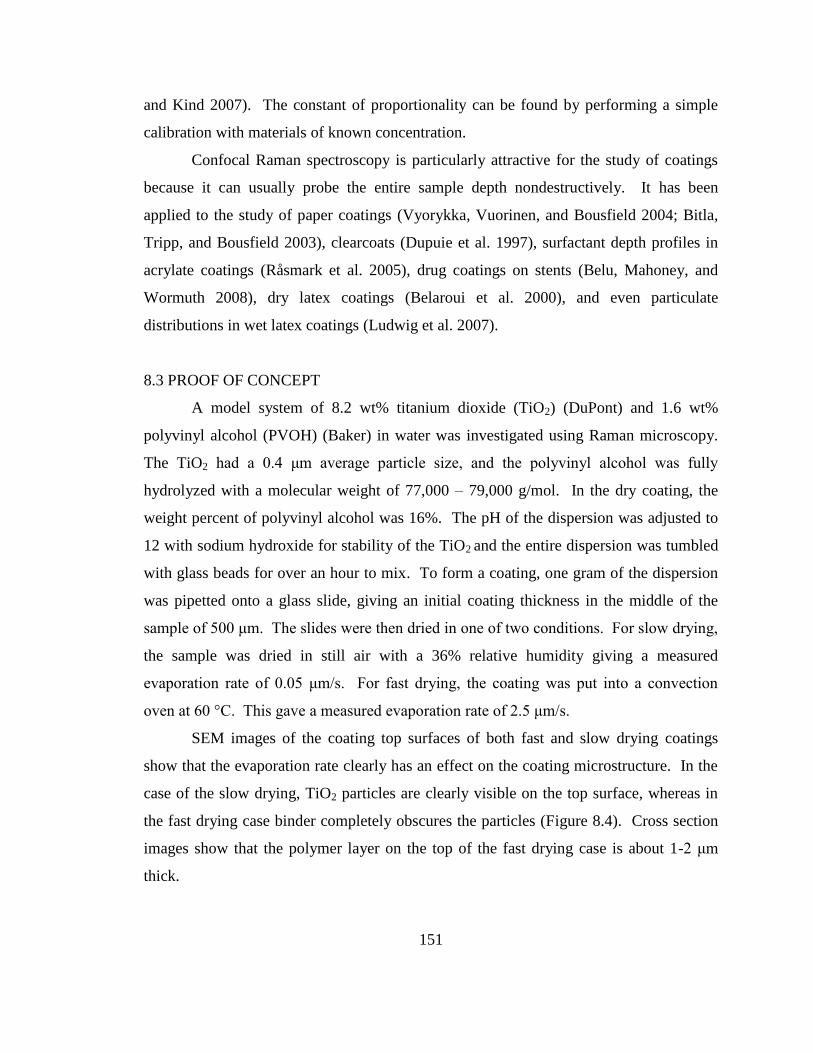
151
and Kind 2007). The constant of proportionality can be found by performing a simple
calibration with materials of known concentration.
Confocal Raman spectroscopy is particularly attractive for the study of coatings
because it can usually probe the entire sample depth nondestructively. It has been
applied to the study of paper coatings (Vyorykka, Vuorinen, and Bousfield 2004; Bitla,
Tripp, and Bousfield 2003), clearcoats (Dupuie et al. 1997), surfactant depth profiles in
acrylate coatings (Råsmark et al. 2005), drug coatings on stents (Belu, Mahoney, and
Wormuth 2008), dry latex coatings (Belaroui et al. 2000), and even particulate
distributions in wet latex coatings (Ludwig et al. 2007).
8.3 PROOF OF CONCEPT
A model system of 8.2 wt% titanium dioxide (TiO2) (DuPont) and 1.6 wt%
polyvinyl alcohol (PVOH) (Baker) in water was investigated using Raman microscopy.
The TiO2 had a 0.4 μm average particle size, and the polyvinyl alcohol was fully
hydrolyzed with a molecular weight of 77,000 – 79,000 g/mol. In the dry coating, the
weight percent of polyvinyl alcohol was 16%. The pH of the dispersion was adjusted to
12 with sodium hydroxide for stability of the TiO2 and the entire dispersion was tumbled
with glass beads for over an hour to mix. To form a coating, one gram of the dispersion
was pipetted onto a glass slide, giving an initial coating thickness in the middle of the
sample of 500 μm. The slides were then dried in one of two conditions. For slow drying,
the sample was dried in still air with a 36% relative humidity giving a measured
evaporation rate of 0.05 μm/s. For fast drying, the coating was put into a convection
oven at 60 °C. This gave a measured evaporation rate of 2.5 μm/s.
SEM images of the coating top surfaces of both fast and slow drying coatings
show that the evaporation rate clearly has an effect on the coating microstructure. In the
case of the slow drying, TiO2 particles are clearly visible on the top surface, whereas in
the fast drying case binder completely obscures the particles (Figure 8.4). Cross section
images show that the polymer layer on the top of the fast drying case is about 1-2 μm
thick.

152
Figure 8.4 Top surface images of dry TiO2/polyvinyl alcohol coatings. The coating on
the left was dried slowly, whereas the coating on the right was dried quickly.
Figure 8.5 Cross section images of coatings dried slowly (left) and quickly (right)
showing binder migration that is 1-2 μm thick in the case of the fast drying coating.

153
Characteristic Raman peaks for TiO2 and polyvinyl alcohol are shown in Figure
8.6. TiO2, like many ceramics, has characteristic peaks that have small Raman shifts,
whereas polyvinyl alcohol has one very strong peak characteristic of a C-H2 stretch near
2900 cm-1
. The weak polyvinyl alcohol OH stretch can be seen at 3470 cm-1
. If the
coating was wet, this would also be the dominant water peak. The Raman spectra of
these two species do not interfere strongly with one another, making this coating system
an ideal model. By making mixtures of known TiO2/PVOH ratios, a calibration curve
was created as shown in Figure 8.7 so that Raman data could be translated into
concentration.
Both fast drying and slow drying films were analyzed using Confocal Raman
microscopy depth profiling. One spectrum was recorded for every 0.03 μm. This was
well below the expected 1 μm depth resolution of the instrument. Only the top 15 μm of
each sample was analyzed, since the signal-to-noise ratio increased with depth. Samples
were on average 30 μm thick in total, and it was assumed that the glass slide could be
inverted and the sample imaged from the underside to provide the remaining profile.
Figure 8.8 shows the polyvinyl alcohol weight fraction that was calculated for
each confocal Raman spectrum through the depth of the two samples. The sample that
was dried slowly has a uniform polyvinyl alcohol concentration through its top half that
Figure 8.6 Raman spectra for pure TiO2 (red) and pure polyvinyl alcohol (blue).
154
Figure 8.7 Calibration curve for converting relative Raman peak intensities (IPVOH and
ITIO2) into concentration
is very close to the 16 wt% that is the weight fraction of polymer in the entire coating.
Drying the dispersion slowly therefore gave a completely homogeneous film. The
confocal Raman technique also accurately reported a 2 μm layer of pure PVOH on the
top layer of the fast drying film. However, care should be taken when reading these
results since the thickness of this layer is approximately equal to the resolution of the
instrument. For example, the gradual transition between the PVOH rich top layer and the
rest of the coating at 2-3 μm could be an artifact of the instrument’s inability to focus or it
could be a true representation of the coating concentration.
8.4 CONCLUSION
Confocal Raman microscopy would be an excellent quantitative compliment to
cryogenic scanning electron microscopy for determining the microstructure development
of coatings. CryoSEM has excellent resolution for imaging particulates through the
depth of a film, and can image liquid invasion into a particle packing, but cannot
distinguish soluble polymer from solvent. Raman microscopy could give this
information at a lower resolution. Both techniques are able to capture an actively drying
coating. Since confocal Raman microscopy is non-destructive, the same samples that are
dried under the objective lens could be frozen for cryoSEM.

155
Figure 8.8 Weight fraction of polyvinyl alcohol in both fast drying and slow drying
coatings with respect to depth. SEM images of the same coatings are shown on the same
scale for reference.

156
REFERENCES
Ackerson, B. J., S. E. Paulin, B. Johnson, W. van Megen, and S. Underwood. 1999.
Crystallization by settling in suspensions of hard spheres. Physical Review E
59(6): 6903.
Allain, C., and Limat, L. 1995. Regular patterns of cracks formed by directional drying of
a colloidal suspension. Phys. Rev. Lett. 74 (15): 2981-2984.
Al-Turaif, H. A., and D. W. Bousfield. 2005. The influence of pigment size distribution
and morphology on coating binder migration. Nord. Pulp and Paper Res. 20(3):
335-339.
Anwari, F., Carlozzo, B. J., Chokshi, K., DiLorenzo, M., Heble, M., Knauss, C.J.,
McCarthy, J., Patterson, R., Rozick, P., Slifko, P.M., Stipkovich, W., Weaver,
J.C., Wolfe, M., 1993. Changes in hiding during latex film formation part V:
Effect of opaque polymer. Journal of Coat. Tech. 65(821): 39-47.
Arlinghaus, E. G. 2004. Microflows, Pore and Matrix Evolution in Latex Coatings. PhD.
Thesis, University of Minnesota, Minneapolis.

157
Bachmann, L, and E. Mayer. 1986. Physics of water and ice: implications for
cryofixation. In Cryotechniques in Biological Electron Microscopy. Berlin:
Springer-Verlag.
Baia, L., K. Gigant, U. Posset, G. Schottner, W. Kiefer, and J. Popp. 2002. Confocal
Micro- Raman Spectroscopy: Theory and Application to a Hybrid Polymer
Coating. Applied Spectroscopy 56(4): 536-540.
Bauer, C., B. Amram, M. Agnely, D. Charmot, J.Sawatzki, N.Dupuy, and J. Huvenne.
2000. On-Line Monitoring of a Latex Emulsion Polymerization by Fiber-Optic
FT-Raman Spectroscopy. Part I: Calibration. Applied Spectroscopy 54(4): 528-
535.
Belaroui, F., Y. Grohens, H. Boyer, and Y. Holl. 2000. Depth profiling of small
molecules in dry latex films by confocal Raman spectroscopy. Polymer 41(21):
7641-7645.
Bellare, J. R., H. T. Davis, L. E. Scriven, and Y. Talmon. 1988. Controlled environment
vitrification system: An improved sample preparation technique. Journal of
Electron Microscopy Technique 10(1): 87-111.
Belu, A., C. Mahoney, and K. Wormuth. 2008. Chemical imaging of drug eluting
coatings: combining surface analysis and confocal Raman microscopy. Journal of
Controlled Release 126(2): 111-121.
Beach, E., M. Keefe, W. Heeschen, and D. Rothe. 2005. Cross-sectional analysis of
hollow latex particles by focused ion beam–scanning electron microscopy.
Polymer 46(25): 11195-11197.
Bitla, S., C. P. Tripp, and D. W. Bousfield. 2003. A Raman spectroscopic study of
migration in paper coatings. Journal of Pulp and Paper Science 29(11): 382-385.
Blander, M., and J. L. Katz. 1975. Bubble Nucleation in Liquids. AIChE Journal 21, (5):
833.

158
Bogush, G. H., M. A. Tracy, and C. F. Zukowski IV. 1988. Preparation of monodisperse
silica particles: Control of size and mass fraction. Journal of Non-Crystalline
Solids 104: 95-106.
Brandrup, J., and E. H. Immergut. Ed. 1989. Polymer Handbook. New York: John Wiley
and Sons.
Brewer, D. D., J. Allen, M. R. Miller, J.M. de Santos, S. Kumar, D.J. Norris, M.
Tsapatsis, and L. E. Scriven. 2008. Mechanistic Principles of Colloidal Crystal
Growth by Evaporation-Induced Convective Steering. Langmuir 24(23): 13683-
13693.
Brown, George L. 1956. Formation of films from polymer dispersions. Journal of
Polymer Science 22(102): 423-434..
Brown, J. T., Rufe, L., & Haigh, J. R. (2006). Method of using hollow sphere polymers
U. S. Patent Application Publication No. US 2006/0046056 A1. Washington, DC:
U.S. Patent and Trademark Office.
Brown, W. ―Hollow Latex Particles: Binders that Provide Opacity.‖ Proc. The
Waterborne Symposium: Advances in Sustainable Coatings Technology; New
Orleans, LA, January 30 2008.
Buscall, R., and L. R. White. 1987. The Consolidation of Concentrated Suspensions. J.
Chem. Soc., Faraday Trans. 83: 873-891.
Cairncross, R. A., L. F. Francis, and L. E. Scriven. 1996. Predicting drying in coatings
that react and gel: drying regime maps. AICHE Journal 42(1): 55-67.
Carlson, R. L., R. L. Sendelbeck, and N. J. Hoff. 1966. An Experimental Study of the
Buckling of a Complete Spherical Shell. (NASA Contractor Report No. 550).

159
Caupin, F., and E.Herbert. 2006. Cavitation in water: a review. Comptes Rendus
Physique, 7(9): 1000-1017.
Cardinal, C.M. and Y. D. Jung, K. H. Ahn, L. F. Francis. 2010. Drying Regime Maps for
Particulate Coatings. AICHE Journal Early View. Doi: 10.1002/aic.12190
Chapman, D. M. 1997. Coating structure effects on ink-jet print quality. Proc. TAPPI
Coating Conf. 73.
Chinga, G., and T. Helle. 2002. Structure characterization of pigment coating layer on
paper by scanning electron microscopy and image analysis. Nordic Pulp and
Paper Research 17(3): 307.
Chiu, R. C., and M. J. Cima. 1993. Drying of Granular Ceramic Films: II, Drying stress
and saturation uniformity. Journal of the American Ceramic Society 76, no. 11:
2769-2777.
Ciampi, E., U. Goerke, J. L. Keddie, and P. J. McDonald. 2000. Lateral Transport of
Water during Drying of Alkyd Emulsions. Langmuir 16(3): 1057-1065.
Colina, H., and S. Roux. 2000. Experimental model of cracking induced by drying
shrinkage. The European Physical Journal E 1 (2): 189-194.
Corcoran, E. M. 1969. Determining stresses in organic coatings using plate beam
deflection. Journal of Paint Technology 41(538): 635-640.
Croll, S.G. 1979. Effect of titania pigment on the residual strain, glass transition and
mechanical properties of a PMMA coating. Polymer 20(11): 1423-1430.
Croll, S. G. 1979. The origin of residual internal stress in solvent-cast thermoplastic
coatings. Journal of Applied Polymer Science 23(3): 847-858.

160
Croll, G. 1986. Drying of latex paint. Journal of Coatings Technology 58(734): 41-49.
Davis, K., and W. Russel. 1989. An asymptotic description of transient settling and
ultrafiltration of colloidal dispersions. Physics of Fluids A 1(1): 82.
Davis, R. H., and K. H. Birdsell. 1988. Hindered Settling of Semidilute Monodisperse
and Polydisperse Suspensions. AIChE J. 34(1): 123-129.
Deegan, R. D., O. Bakajin, T. F. Dupont, G. Huber, S. R. Nagel, and T. A. Witten. 1997.
Capillary flow as the cause of ring stains from dried liquid drops. Nature
389(6653): 827-829.
Denkov, N. D., O. D. Velev, P. A. Kralchevsky, I. B. Ivanov, H. Yoshimura, and K.
Nagayama. 1993. Two-dimensional crystallization. Nature 361 (6407): 26.
Devireddy, R. V., P. H. Leo, J. S. Lowengrub, and J.C. Bischof. 2002. Measurement and
numerical analysis of freezing in solutions enclosed in a small container.
International Journal of Heat and Mass Transfer 45(9): 1915-1931.
Dillon, R. E., L. A. Matheson, and E. B. Bradford. 1951. Sintering of synthetic latex
particles. Journal of Colloid Science 6: 108-117.
Donath, E. G. B. Sukhorukov, F. Caruso, S. A. Davis, and H.Möhwald. 1998. Novel
Hollow Polymer Shells by Colloid-Templated Assembly of Polyelectrolytes.
Angewandte Chemie International Edition 37, (16): 2201-2205.
Dupuie, J. L., W. H. Weber, D. J. Scholl, and J. L. Gerlock. 1997. Clearcoat analysis in
isolated and multi-layer paint systems by confocal Raman microscopy. Polymer
Degradation and Stability 57, (3): 339-348.
Echlin, P. 1992. Low-Temperature Microscopy and Analysis. New York: Plenum Press.

161
Eckersley, S. T., and A. Rudin. 1990. Mechanism of film formation from polymer
latexes. J. Coat. Tech. 62, (780): 89-100.
Ekanayake, P., P. Doughty, J. L. Keddie, and P. J. McDonald. 2007. Experimental tests
of scaling predictions of the spatial distribution of particles during the drying of
colloidal films. Magnetic Resonance Imaging 25(4): 557.
Engstrom, G., M. Rigdahl, J. Kline, and J. Ahlroos. 1991. Binder distribution and mass
distribution of the coating layer– Cause and consequence. TAPPI Journal
74(5):171-179.
Everall, Neil J. 2000. Confocal Raman Microscopy: Why the Depth Resolution and
Spatial Accuracy Can Be Much Worse than You Think. Applied Spectroscopy
54(10): 1515- 1520.
Fasano, David. 1987. Use of small polymeric microvoids in formulating high PVC paints.
Journal of Coatings Technology 59(752): 109.
Fleig, J., and J. Maier. 1997. The Influence of Current Constriction on the Impedence of
Polarizable Electrodes. J. Electrochem. Soc 144(11): L302-L305.
Fery, A., F. Dubreuil, and H. Mohwald. 2004. Mechanics of artificial microcapsules. New
Journal of Physics 6, (18): 1-13.
Fitzwater, S., and J. W. Hook. 1985. Dependent scattering theory; A new approach to
predicting scattering in paints. Journal of Coatings Technology 57(721): 39.
Francis, L. F., A. V. McCormick, D. M. Vaessen, and J. A. Payne. 2002. Development
and measurement of stress in polymer coatings. Journal of Materials Science 37,
(22): 4717-4731.

162
Franses, E. I., L. E. Scriven, W. G. Miller, and H. T. Davis. 1983. Interpreting the
appearance of dispersed systems: I. Model dispersions of polymer latex
microspheres. Journal of the American Oil Chemists’ Society 60 (5): 1029-1042.
Fukuta, N, and C.M. Gramada. 2003. Vapor pressure measurement of supercooled water.
Journal of the Atmospheric Sciences 60: 1871-1875.
Gasperino, D., L. Meng, D. J. Norris, and J.J. Derby. 2008. The role of fluid flow and
convective steering during the assembly of colloidal crystals. Journal of Crystal
Growth 310(1): 131-139.
Gast, A. P., and W. B. Russel. 1998. Simple Ordering in Complex Fluids. Physics Today
51(12): 24.
Ge, Haiyan. 2005. Microstructure development in latex coatings: High-resolution cryo-
scanning electron microscopy. PhD thesis, University of Minnesota, Minneapolis.
Ge, H., C. Zhao, S. Porzio, L. Zhuo, T. H. Davis, and L. E. Scriven, 2006. Fracture
behavior of colloidal polymer particles in fast-frozen suspensions viewed by cryo-
SEM. Macromolecules 39(16): 5531-5539.
Ge, H., W. J. Suszynski, H. T. Davis, and L. E. Scriven. 2008. New controlled
environment vitrification system for preparing wet samples for cryo-SEM.
Journal of Microscopy 229(1): 115-126.
Goldstein, J. I., D. E. Newbury, P. Echlin, D. C. Joy, C. Fiori, and E. Lifshin. 1981.
Scanning Electron Microscopy and X-Ray Microanalysis. New York: Plenum
Press.
Gong, X.. 2005. On Physics of Latex Film Formation. Ms. Thesis, University of
Minnesota, Minneapolis.

163
Gong, X., H. Ted Davis, and L. Scriven. 2008. Role of van der Waals force in latex film
formation. Journal of Coatings Technology and Research 5(3): 271-283.
Gong, X. 2008. Cryo-SEM study of nanostructure development of latex dispersions and
block copolymer solutions. PhD thesis, University of Minnesota, Minneapolis.
Gorce, J -P, D. Bovey, P. J. McDonald, P. Palasz, D. Taylor, and J. L. Keddie. 2002.
Vertical water distribution during the drying of polymer films cast from aqueous
emulsions. The European Physical Journal E, 8(4): 421-429.
Grady, Michael C., J. I Kroschwitz, and Arza Seidel. 2004. Latex technology. In J. I.
Kroschwitz, & A. Seidel (Eds.), Kirk-othmer encyclopedia of chemical
technology (5th ed.). Hoboken, NJ.: John Wiley & Sons.
Green, A. E., and J. E. Adkins. 1970. Large Elastic Deformations. Oxford: Clarendon
Press.
Green, A.E., and R.T. Shield. 1950. Finite elastic deformation of incompressible isotropic
bodies. Proceedings of the Royal Society of London. Series A,202(1070): 407-419.
Griffith, A. A. 1921. The Phenomena of Rupture and Flow in Solids. Phil. Trans. R. Soc.
Lond. A. 221: 163-198.
Haines, W. B. 1930. Studies in the physical properties of solids IV: The hysteresis effect
in capillary properties, and the modes of moisture distribution associated
therewith. J. Agric. Sci. 20: 97-116.
Harren, R. E. 1983. Elements of a successful research project: The development of an
opaque polymer. Journal of Coatings Technology 55(707): 79.

164
Harvey, E. Newton, D. K. Barnes, W. D. McElroy, A. H. Whiteley, D. C. Pease, and K.
W. Cooper. 1944. Bubble formation in animals. I. Physical factors. Journal of
Cellular and Comparative Physiology 24(1): 1-22.
He, P., S. Bitla, D. Bousfield, and C. P. Tripp. 2002. Raman Spectroscopic Analysis of
Paper Coatings. Applied Spectroscopy 56: 1115-1121.
Hendra, P.J. 1969. Raman spectra of polymers. Adv. Polymer Sci. 6: 151-169.
Hendra, P.J. 1993. The Raman spectra of polymers. Chichester ; New York: John Wiley
& Sons.
Hill, A. J., M. R. Tant, R. L. McGill, P. P. Shang, R. R. Stockl, D. L. Murray, and J. D.
Cloyd. 2001. Free volume distribution during consolidation and coalescence of
latex films. Journal of Coatings Technology 73(913): 115-124.
Hislop, R. W., and P. L. McGinley. 1978. Microvoid coatings: Pigmented, vesiculated
beads in flat latex paints. Coatings Technology 642: 69.
Hu, M.S., and A.G. Evans. 1989. The cracking and decohesion of thin films on ductile
substrates. Acta Metallurgica 37(3): 917-925.
Huang, Z. 2001. Continuous coatings from particulate xuspensions: Polymer powder and
latex coatings. PhD. Thesis, University of Minnesota, Minneapolis..
Hutchinson, J. W. 1967. Imperfection Sensitivity of Externally Pressurized Spherical
Shells. Journal of Applied Mechanics 34: 49-55.
Irwin, G. 1957. Analysis of stresses and strains near the end of a crack traversing a plate.
J. Appl. Mech. 24: 361-364.
Jagota, A., C. Argento, and S. Mazur. 1998. Growth of adhesive contacts for Maxwell
viscoelastic spheres. Journal of Applied Physics 83(1): 250.
165
Jeong, U., S. H. Im, P. H. C. Camargo, J. H. Kim, and Y. Xia. 2007. Microscale Fish
Bowls: A New Class of Latex Particles with Hollow Interiors and Engineered
Porous Structures in Their Surfaces. Langmuir. 23 (22): 10968-10975
Ji, C., W. Gu, B. Litteer, M. Scozzafava, and H. Gasteiger. 2006. Electrode design for
PEM fuel cell. Prepr. Pap.-Am. Chem. Soc., Div. Fuel Chem. 51(2): 999507
Jindal, Karan. 2009. Stress development in particulate, nano-composite and polymeric
coatings. PhD. thesis, University of Minnesota, Minneapolis.
Joanicot, M., K. Wong, J. Maquet, Y. Chevalier, C. Pichot, C. Graillat, P. Lindner, L.
Rios, and B. Cabane. 1990. Ordering of latex particles during film formation.
Progress in Colloid & Polymer Science 81: 175-183.
Juhué, D., Y. Wang, J. Lang, O. Leung, M. C. Goh, and M. A. Winnik. 1995. Surfactant
exudation in the presence of a coalescing aid in latex films studied by atomic
force microscopy. Journal of Polymer Science B: 33(7): 1123-1133.
Juhué, D., and J. Lang. 1994. Latex film surface morphology studied by atomic force
microscopy: effect of a non-ionic surfactant postadded to latex dispersion.
Colloids and Surfaces A 87(3): 177-185.
Keddie, J. L., and R. A. L. Jones. 1995. Depression of the glass transition temperature in
ultra-thin, grafted polystyrene films. Mat. Res. Soc. Symp. Proc. 366: 183-189.
Keddie, Joseph L. 1997. Film formation of latex. Materials Science & Engineering: R:
Reports 21, (3): 101-170.
Kiss, J.Z., and L.A. Staehelin. 1995. High Pressure Freezing. In Rapid freezing, freeze
fracture, and deep etching. Severs, NJ: Wiley-Liss.

166
nig, A.M., E. Bourgeat-Lami, V. Mellon, K. von der Ehe, A. F. Routh, and D.
Johannsmann. (2010) Dilational Lateral Stress in Drying Latex Films. Langmuir
26,(6): 3815- 3820.
Kowalski, A., & Vogel, M. 1985. European Patent Specification: 0 022 633. Lemington
Spa, England: European patent office.
Kowalski, A., Vogel, M., & Blankenship, R. M. 1984. Sequential heteropolymer
dispersion and a particulate material obtainable therefrom, useful in coating
compositions as a thickening and/or opacifying agent. U.S. Patent No. 4,427,836.
Washington, DC: U.S. Patent and Trademark Office.
Kowalski, A., and M. Vogel. 1990. Multi-stage opacifying polymer particles containing
non-polymeric acid absorbed therein. Vol. 382612. US Patent No. 4,970,241.
Washington, DC: US Patent and Trademark Office.
Kowalski, A., Vogel, M., & Blankenship, R. 1983. US Patent No. 4,427,836.
Washington, DC: US Patent and Trademark Office.
Kralchevsky, P. A., and N. D. Denkov. 2001. Capillary forces and structuring in layers of
colloid particles. Current Opinion in Colloid & Interface Science 6(4): 383-401.
Krechetnikov, R., and G. M. Homsy. 2005. Experimental study of substrate roughness
and surfactant effects on the Landau-Levich law. Physics of Fluids 17(10):
102108.
Kynch, G. J. 1952. A theory of sedimentation. Trans. Faraday Soc. 48: 166.
Landau, L. D., and B. Levich. 1942. Dragging of a liquid by a moving plate. Acta
Physicochimica U.R.S.S 18: 42-54.

167
Lee, D. I., M. R. Mulders, D. J. Nicholson, and A. N. Leadbetter. 1992. Process of
making hollow polymer latex particles. U.S. Patent No. 5,517,084 Washington,
D.C.: U.S. Patent and Trademark Office.
Lee, Do Ik. 2002a. The structure of model coatings: Latex-bound plastic pigment
coatings. Progress in Organic Coatings 45(4): 341-358.
Lee, D.I. 2002b. The critical pigment volume concentration concept for paper coatings: I.
Model coating systems using plastic pigments and latex binders for paper coating
applications. Journal of Korea Technical Association of the Pulp and Paper
Industry 34(5): 1-17.
Lee, D I. 1987. Controlling coating gloss through control of the shrinkage during
structure consolidation In , 86. TAPPI Notes. Houston, TX, USA: TAPPI Press,
Atlanta, GA, USA.
Lee, W P, and A. F. Routh. 2004. Why Do Drying Films Crack? Langmuir 20(23): 9885-
9888.
Lei, H., L. F. Francis, W. W. Gerberich, and L. E. Scriven. 2002. Stress development in
drying coatings after solidification. AICHE Journal 48(3): 437-451.
Lei, H., J. A. Payne, A. V. McCormick, L. F. Francis, W. W. Gerberich, and L. E.
Scriven. 2001. Stress development in drying coatings. Journal of Applied Polymer
Science 81(4): 1000-1013.
Li, G., and P. G. Pickup. 2003. Ionic conductivity of PEMFC electrodes. J. Electrochem.
Soc 150(11):C745-C752.
Lovell, P.A., and M. S. El-Aasser. 1997. Emulsion Polymerization and Emulsion
Polymers. Chichester; New York: John Wiley & Sons.

168
Luo, H. 2007. Microstructure development in particulate composite coatings by cryo-
SEM. PhD. Thesis, University of Minnesota, Minneapolis.
Luo, H., L. E. Scriven, and L. F. Francis. 2007. Cryo-SEM studies of latex/ceramic
nanoparticle coating microstructure development. Journal of Colloid and
Interface Science 316, (2): 500-509.
Luo, H., C. M. Cardinal, L. E. Scriven, and L. F. Francis. 2008. Ceramic Nanoparticle/
Monodisperse Latex Coatings. Langmuir 24, (10): 5552-5561.
Ludwig, I., W. Schabel, M. Kind, J.-C. Castaing, and P. Ferlin. 2007. Drying and film
formation of industrial waterborne latices. AIChE Journal 53(3): 549-560.
Lyon, L. A., C. D. Keating, A. P. Fox, B. E. Baker, L. He, S. R. Nicewarner, S. P.
Mulvaney, and M. J. Natan. 1998. Raman Spectroscopy. Analytical Chemistry
70(12): 341-362.
Ma, Y. 2002. High-Resolution Cryo-Scanning Electron Microscopy of Latex Film
Formation. PhD thesis, University of Minnesota, Minneapolis.
Ma, Y., H. T. Davis, and L. E. Scriven. 2005. Microstructure development in drying latex
coatings. Progress in Organic Coatings 52, (1): 46-62.
Maenosono, S., C. D. Dushkin, S. Saita, and Y. Yamaguchi. 1999. Growth of a
semiconductor nanoparticle ring during the drying of a suspension droplet.
Langmuir 15(4): 957-965.
Man, W., and W. B. Russel. 2008. Direct Measurements of Critical Stresses and Cracking
in Thin Films of Colloid Dispersions. Physical Review Letters 100 (19): 198302-
198304.

169
Martinez, C. J., and J.A. Lewis. 2002. Shape Evolution and Stress Development during
Latex−Silica Film Formation. Langmuir 18(12): 4689-4698.
Marton, B., L. G.J. van der Ven, C. Otto, N. Uzunbajakava, M. A. Hempenius, and G.
J.Vancso. 2005. A depth-resolved look at the network development in alkyd
coatings by confocal Raman microspectroscopy. Polymer 46 (25): 11330-11339.
Mason, G. 1973. Formation of films from lattices: a theoretical treatment. British
Polymer Journal 5(2): 101-108.
Mattsson, J., J. A. Forrest, and L. Borjesson. 2000. Quantifying glass transition behavior
in ultrathin free-standing polymer films. Phys Rev E. 62(4): 5187-5200.
McDonald, C. J., and M. J. Devon. 2002. Hollow latex particles: synthesis and
applications. Advances in Colloid and Interface Science 99(3): 181-213.
McDonald, C. J., K. J. Bouck, A. B. Chaput, and C. J. Stevens. 2000. Emulsion
polymerization of voided particles by encapsulation of a nonsolvent.
Macromolecules 33(5): 1593-1605.
Megias-Alguacil, D, and L. J. Gauckler. 2009. Capillary forces between two solid spheres
linked by a concave liquid bridge: Regions of existance and forces mapping.
AICHE J. 55, (5): 1103-1109.
Melsheimer, L.A., and W. H. Hoback. 1953. Pigmentation of Latex Paints. Industrial &
Engineering Chemistry 45, (4): 717-725.
Ming, Yaqiang, H. T. Davis, L. E. Scriven, and K. Takamura. 1995. Microstructure
evolution in latex coatings. Tappi Journal 78(11): 151.
Moor, H. 1971. Recent Progress in the Freeze-Etching Technique. Philosophical
Transactions of the Royal Society of London B. 261(837): 121-131.
170
Nowicki, S. C., H. T. Davis, and L. E. Scriven. 1992. Microscopic determination of
transport parameters in drying porous media. Drying Technology 10(4): 925-946.
Okubo, M., and H. Minami. 1997. Formation mechanism of micron-sized monodispersed
polymer particles having a hollow structure. Colloid & Polymer Science 275 (10):
992-997.
Okubo, Masayoshi, Masahiro Okada, and Kenjin Shiba. 2003. Preparation of multihollow
polymer particles by the alkali/cooling method under partial neutralization
conditions. Macromolecular Symposia 195: 115-122.
Okubo, Tsuneo. 2002. Dissipative structures formed in the course of drying the colloidal
crystals of monodispersed polystyrene spheres on a cover glass. Colloid and
Polymer Science 280: 1001-1008.
Pan, Xiangyang. 1995. Liquid Distribution and Binder Migration in Drying Coatings.
PhD thesis, University of Minnesota, Minneapolis.
Pan, S. X., H. T. Davis, and L. E. Scriven. 1995. Modeling moisture distribution and
binder migration in drying paper coatings. Tappi Journal 78(8): 127.
Passalacqua, E., F. Lufrano, G. Squadrito, A. Patti, and L. Giorgi. 1998. Influence of the
structure in low-Pt loading electrodes for polymer electrolyte fuel cells.
Electrochimica Acta 43(24): 3665-3673.
Patel, Abhijit A., J. Feng, M. A. Winnik, G. J. Vancso, and C. B. D. McBain. 1996.
Characterization of latex blend films by atomic force microscopy. Polymer 37, no.
25: 5577-5582.
Paul, B. 1960. Prediction of elastic constants of multiphase materials. Trans. Am. Inst.
Min. Engrs 218: 36-41.
171
Paunov, V. N., P. A. Kralchevsky, N. D. Denkov, and K. Nagayama. 1993. Lateral
Capillary Forces between Floating Submillimeter Particles. Journal of Colloid
and Interface Science 157, (1): 100-112.
Pavlyuchenko, V. N., O. V. Sorochinskaya, O. N. Primachenko, and S. S. Ivanchev.
2005. Submicron sized hollow polymer particles: Preparation and properties.
Macromolecular Symposia 226: 213-226.
Payne, J. A., A. V. McCormick, and L. F. Francis. 1997. In situ stress measurement
apparatus for liquid applied coatings. Review of Scientific Instruments 68(12):
4564-4568.
Payne, Jason A. 1998. Stress Evolution in Solidifying Coatings PhD thesis, University of
Minnesota, Minneapolis.
Pekurovsky, L. A., and L. E. Scriven. 2001. On capillary forces and stress in drying latex
coating. ACS Symposium Series 790: 27-40.
Pekurovsky, L. A. 2006. Capillary forces and stress development in drying latex coating.
PhD thesis, University of Minnesota, Minneapolis.
Perera,, D.Y., and D. V. Eynde. 1984. Effect of pigmentation on internal stress in latex
coatings. Journal of Coatings Technology 56, (717): 47-53.
Petersen, C., C. Heldmann, and D. Johannsmann. 1999. Internal Stresses during Film
Formation of Polymer Latices. Langmuir 15(22): 7745-7751.
Popov, E. P. 1952. Mechanics of Materials. Englewood Cliffs, NJ: Prentice Hall.
Prakash, S. S., L. F. Francis, and L. E. Scriven. 2006. Microstructure evolution in dry cast
cellulose acetate membranes by cryo-SEM. J. Mem. Sci 283: 328-338.

172
Pauchard, L., M. Adda-Bedia, C. Allain, and Y. Couder. 2003. Morphologies resulting
from the directional propagation of fractures. Physical Review E 67(2): 027103.
Pulker, Hans K. 1984. Coatings on Glass. New York, NY: Elsevier.
Quere, David. 1999. Fluid coating on a fiber. Annual Review of Fluid Mechanics 31: 347-
384.
Radhakrishnan, H., and L. E. Scriven. 2005. Edge Effects On Flow and Stress in Drying
Coatings. 5th GRACM International Congress on Computational Mechanics. June
29.
Råsmark, P. J., M. Andersson, J. Lindgren, and C. Elvingson. 2005. Differences in
Binding of a Cationic Surfactant to Cross-Linked Sodium Poly(Acrylate) and
Sodium Poly(Styrene Sulfonate) Studied by Raman Spectroscopy. Langmuir
21(7): 2761-2765.
Reisch, M. S. 2006. Paints and Coatings. Chem. Eng. News 84(42):13-16.
Roulstone, B. J., M. C. Wilkinson, and J. Hearn. 1992. Studies on polymer latex films: II.
Effect of surfactants on the water vapour permeability of polymer latex films.
Polymer International 27(1): 43-50.
Routh, A. F., and W. B. Russel. 1998. Horizontal drying fronts during solvent
evaporation from latex films. AICHE Journal 44(9): 2088-2098.
Routh, A. F., W. B. Russel, J. Tang, and M. S. El-Aasser. 2001. Process model for latex
film formation: Optical clarity fronts. Journal of Coatings Technology 73:41-48.
Routh, A.F., and W. B. Zimmerman. 2004. Distribution of particles during solvent
evaporation from films. Chemical Engineering Science 59(14): 2961-2968.
173
Routh, A.F., W.B. Russel. 1999. A Process Model for Latex Film Formation: Limiting
Regimes for Individual Driving Forces. Langmuir 15(22): 7762-7773
Routh, A.F., W.B. Russel 2001. Deformation Mechanisms during Latex Film Formation:
Experimental Evidence. Industrial & Engineering Chemistry Research 40(20):
4302-4308.
Russel, W., Saville, and Schowalter. 1989 Colloidal Dispersions. Cambridge University
Press, Cambridge.
Russel, W. B., and K. E. Davis. 1991. Settling suspensions of colloidal silica:
Observations and X-ray measurements. J. Chem. Soc. Faraday Trans. 87(3): 411-
424.
Russel, W. B., N. Wu, and W. Man. 2008. Generalized Hertzian Model for the
Deformation and Cracking of Colloidal Packings Saturated with Liquid.
Langmuir 24,(5): 1721-1730.
Sarkar, A., and M. S. Tirumkudulu. 2009. Consolidation of Charged Colloids during
Drying. Langmuir 25, (9): 4945-4953.
Schabel, W., I. Ludwig, and M. Kind. 2004. Measurements of Concentration Profiles in
Polymeric Solvent Coatings by Means of an Inverse Confocal Micro Raman
Spectrometer—Initial Results. Drying Technology 22(1): 285-294.
Scharfer, P., W. Schabel, and M. Kind. 2007. Mass transport measurements in
membranes by means of in situ Raman spectroscopy--First results of methanol
and water profiles in fuel cell membranes. Journal of Membrane Science 303(1):
37-42.
Scholz, H. A. 1953. History of Water-Thinned Paints. Industrial & Engineering
Chemistry 45,(4): 709-711.

174
Schrof, W., J. Klingler, W. Heckmann, and D. Horn. 1998. Confocal fluorescence and
Raman microscopy in industrial research. Colloid & Polymer Science 276(7):
577-588.
Scriven, L. E. 1988. Physics and applications of dip coating and spin coating. Mat. Res.
Soc. Proc. 121: 718-728.
Scriven, L. E. 2006. CHEN 8104 Coating Process Fundamentals course notes.
Severs, N. J., and D. M. Shotton. 1995. Rapid Freezing, Freeze Fracture, and Deep
Etching. New York: Wiley-Liss.
Sewell, G. 1998. Importance and measurement of minimum film-forming temperature.
Pigment and Resin Technology 27(3): 173-174.
Sheehan, J. G., K. Takamura, H. T. Davis, and L. E. Scriven. 1993. Microstructure
development in particulate coatings examined with high-resolution cryogenic
scanning electron microscopy. TAPPI Journal 76(3): 737-742.
Sheetz, D. P. 1965. Formation of films by drying of latex. Journal of Applied Polymer
Science 9, (11): 3759-3773.
Shen, Amy Q., B. Gleason, G.H. McKinley, and H.A. Stone. 2002. Fiber coating with
surfactant solutions. Physics of Fluids 14, (11): 4055-4068.
Smith, C.P. 1993. Control of binder migration in nonwoven web bonding. TAPPI Journal
76, (1):183-186.
Snyder, M. A., J. A. Lee, T. M. Davis, L. E. Scriven, and M. Tsapatsis. 2007. Silica
Nanoparticle Crystals and Ordered Coatings Using Lys-Sil and a Novel Coating
Device. Langmuir 23, (20): 9924-9928.

175
Steward, P. A., J. Hearn, and M. C. Wilkinson. 2000. An overview of polymer latex film
formation and properties. Advances in Colloid and Interface Science 86,(3): 195-
267.
Stöber, W., A. Fink, and E. Bohn. 1968. Controlled growth of monodisperse silica spheres
in the micron size range. Journal of Colloid and Interface Science 26, (1):62-69.
Stoney, G. G. 1909. The Tension of Metallic Films Deposited by Electrolysis.
Proceedings of the Royal Society of London. Series A, 82(553): 172-175.
Sundberg, D., and D. Fukuhara. 2005. Latex produced with carboxylic acid comonomer
for waterborne coatings: Particle morphology variations with changing pH. JCT
Research 2(7):509-516.
Sundberg, D. C., A. P. Casassa, J. Pantazopoulos, and M. R. Muscato. 1990. Morphology
development of polymeric microparticles in aqueous dispersions. I.
Thermodynamic considerations. Journal of Applied Polymer Science 41: 1425-
1442.
Sutanto, E, Y Ma, H. T. Davis, and L. E. Scriven. 2001. Cryogenic scanning electron
microscopy of early stages of film formation in drying latex coatings. ACS
Symposium Series 790: 174-192.
Takamura, K., J. I Kroschwitz, and A. Seidel. 2004. Polymer Colloids. In . 5th ed. Kirk
Othmer Encyclopedia of Chemical Technology. Hoboken, NJ.: Wiley-
Interscience.
Thouless, M. D., E. Olsson, and A. Gupta. 1992. Cracking of brittle films on elastic
substrates. Acta Metallurgica et Materialia 40(6): 1287-1292.

176
Tirumkudulu, M. S., and W. B. Russel. 2005. Cracking in Drying Latex Films. Langmuir
21(11): 4938-4948.
Tiarks, F., K. Landfester, and M. Antonietti. 2001. Preparation of Polymeric
Nanocapsules by Miniemulsion Polymerization. Langmuir 17(3): 908-918.
Timoshenko, S. P., and J. M. Gere. 1961. Theory of Elastic Stability. New York:
McGraw-Hill.
Tomba, P., and J. Pastor. 2007. Confocal Raman microspectroscopy with dry objectives :
A depth profiling study on polymer films. Vibrational spectroscopy 44(1): 62-68.
Toussaint, A., M. De Wilde, F. Molenaar, and J. Mulvihill. 1997. Calculation of Tg and
MFFT depression due to added coalescing agents. Progress in Organic Coatings
30(3): 179-184.
Ugur, S., A. Elaissari, and O. Pekcan. 2005. Film formation from nano-sized polystyrene
latex particles. Polymers for Advanced Technologies 16(5): 405-412.
Vaessen, D. M. 2002. Stress and Structure Development in Polymeric Coatings. PhD
Thesis, University of Minnesota, Minneapolis.
Vanderhoff, J. W. 1970. Mechanism of film formation of latices. British Polymer Journal
2: 161-173.
Vanderhoff, J. W., and E. B. Bradford. 1963. Mechanism of film formation of latices.
TAPPI Journal 46(4): 215-221.
Vanderhoff, J. W., E. B. Bradford, and W. K. Carrington. 1973. Transport of water
through latex films. Journal of Polymer Science, Polymer Symposia, no. 41: 155-
174.

177
van Duijneveldt, J. S, J.K. G. Dhont, and H.N. W. Lekkerkerker. 1993. Expansion and
crystallization of a sediment of charged colloidal spheres. Journal of Chemical
Physics 99(9): 6941.
Velev, O. D. 2006. Materials science. Self-assembly of unusual nanoparticle crystals.
Science 312 (5772): 376-377.
Von Karman, T. H., & Tsien, H. (1939). The buckling of spherical shells by external
pressure. Journal of the Aeronautical Sciences, 7(2), 43-50.
Vorobyova, O., and M. A. Winnik. 2001. Morphology of Poly(2-ethylhexyl
methacrylate): Poly(butyl methacrylate) Latex Blend Films. Macromolecules
34(7): 2298-2314.
Vyorykka, J., T. Vuorinen, and D. W. Bousfield. 2004. Confocal raman microscopy: A
non distructive method to analyze depth profiles of coated and printed papers.
Nordic Pulp and Paper Research 19(2):218-224.
Wang, W., B. Gu, and W Hamilton, L. Liang. 2003. Fabrication of Two- and Three-
Dimensional Silica Nanocolloidal Particle Arrays. J. Phys. Chem. B 107:3400-
3404.
Wicks, Zeno W. Jr, Frank N. Jones, and S. Peter Pappas. 1992. Organic Coatings. New
York: John Wiley & Sons.
Wildeson, J. S., Smith, A. Gong, X., Davis, H.T., Scriven, L.E.. 2008. Understanding and
improvement of TiO2 Efficiency in Waterborne Paints through Latex Design. JCT
CoatingsTech. 5 (2): 32–39.
Winnik, M, and J Feng. 1996. Latex blends: an approach to zero VOC coatings. Journal
of Coatings Technology 68: 39-50.

178
Winnik, M. A. 1997. Latex film formation. Current Opinion in Colloid and Interface
Science 2(2): 192-199.
Xie, Z., T. Navessin, K. Shi, R. Chow, Q. Wang, D. Song, B. Andreaus, M. Eikerling, Z.
Liu, and S. Holdcraft. 2005. Functionally graded cathode catalyst layers for
polymer electrolyte fuel cells. J. Electrochem. Soc. 152(6): A1171-A1179.
Yamazaki, K., T. Nishioka, Y. Hattori, and K. Fujita. 1993. Print mottle effect of binder
migration and latex film formation during coating consolidation. TAPPI Journal
76(5): 79-84.
Yiantsios, S.G., and B.G. Higgins. 2006. Marangoni flows during drying of colloidal
films. Physics of Fluids 18(8): 082103-11.
Yoshida, Y., Matsukawa, M., Kuroyama, Y., & Shimada, T. 1994. Paper suitable for ink
fusion transfer type thermal printer and copiers, and a manufacturing method
thereof. Japanese Patent: 5320898.
Yoshizumi, Z., Y. Masumoto, and T. Ytokawa. 1993. Lightweight coated paper for
gravure printing with fewer missing dots. Japanese Patent: 05125695.
Yow, H N, I Beristain, M Goikoetxea, M J Barandiaran, and A F Routh. Evolving
Stresses in Latex Films as a Function of Temperature. Langmuir 26(9):6335-
6342.
Zhang, J.H., P. Zhan, W.Y. Wang, and N.B. Ming. 2003. Preparation of monodisperse
silica particles with controllable size and shape. J Mater Res 18(3): 649-653.
Zhao, C.L., K. Roschmann, J. Leuninger, R. Dersch, X. Gong, H. T. Davis, and L. E.
Scriven. 2006. New insights into the freeze-thaw stability of polymer latexes.
International Waterborne, High Solids, and Powder Coatings Symposium New
Orleans, LA, USA, February 22.