understanding social–ecological systems using loop analysis
TRANSCRIPT

39
Understanding SocialndashEcological Systems using Loop AnalysisMarco Scotti1GEOMAR Helmholtz Centre for Ocean Research Kiel Germany
Daniel Filipe da Silva Pereira2
GEOMAR Helmholtz Centre for Ocean Research Kiel Germany
Antonio BodiniDepartment of Chemistry Life Sciences and Environmental Sustainability University of Parma Italy
AbstractThe sustainable management of socialndashecological systems (SESs) requires that we understand the complex structure of relationships and feedbacks among ecosystem components and socioeconomic entities Therefore the construction and analysis of models integrating ecological and human actors is crucial for describing the functioning of SESs and qualitative modeling represents an ideal tool since it allows studying dependencies among variables of diverse types In particular the qualitative technique of loop analysis yields predictions about how a systemrsquos variables respond to stress factors Different interaction types scarce information about functional relationships among variables and uncertainties in the values of the parameters are the rule rather than exceptions when studying SESs Accordingly loop analysis seems to be perfectly suitable to investigate them Here we introduce the key aspects of loop analysis discuss its applications to SESs and suggest it enables making the first steps toward the integration of the three dimensions of sustainability
Keywords complex systems networks qualitative modeling socialndashecological systems sustainability
IntroductionHuman societies and their well-being depend on the provision of goods and services from ecosystems (Haines-Young amp Potschin 2010) Healthy ecosystems respond to human needs by maintaining structure and functioning over time (Costanza amp Mageau 1999) and the conservation of biodiversity is crucial for preserving
1 Corresponding author marcoscotgmailcom2 Daniel Felipe da Silva Pereira conducted this study at the Department of Chemistry Life Sciences and Environmental Sustainability University of Parma Italy
Human Ecology Review Volume 26 Number 2 2020
40
stability and productivity of natural systems (Stachowicz et al 2002 Worm et al 2006) However biodiversity is declining worldwide a trend that raises concerns on the sustainable supply of goods and services from ecosystems (Lotze et al 2006) The increasing level of human-induced impacts (eg overexploitation of resources introduction of alien species into native environments chemical pollution nutrient enrichment and climate change) threatens biodiversity in both aquatic and terrestrial systems and calls for the formulation of effective conservation practices Ecological changes are often associated with social and economic transformations that in turn reflect their effects back on ecological functions and processes Discovering and bringing to light these interdependencies requires a shift in focus from a ldquowithin-domain approachrdquo to a global strategy in which the ecosystem as unit of investigation is part of a larger system that embeds socioeconomic dynamics (Hilborn 2007) Long et al (2015) identified 15 key principles for implementing ecosystem-based management (EBM) Among these principles they included the modeling of interconnections between ecological social and governance systems which implies that socialndashecological systems (SESs) are networks and that EBM implementation can benefit from the application of the methodologies that network analysis offers
The network perspective requires that the interactions that link variables belonging to the human and ecological domains are concurrently taken into account so that the SES as a whole becomes the unit of management The challenge is the identification of relationships at different hierarchical levels which occur at various spatial and temporal scales To facilitate integration Ostrom (2009) proposed a classificatory framework that describes the four essential dimensions of SESs resource users governance system resource units and resource system The relationships among these four dimensions occur at various geographical and temporal scales within the rules defined by the SESrsquos ecological social economic and political settings The choice of the suitable scales and the proper identification of the variables that constitute the SES and their connections are essential to assess under what conditions sustainability can be enhanced Moreover the concept of sustainability is multidimensional and the spatial heterogeneity of SES variables can cause a mismatch between objectives that belong to either the social or ecological domain This complexity is exemplified by the study of small-scale fisheries in the Mexican state of Baja California Sur which showed the lack of association between different dimensions of sustainability (Leslie et al 2015) Policies for the sustainable use of ecosystem goods and services require policy-makers to take into account the set of interactions linking ecological resilience (ie the adaptive capacity to withstand recurrent perturbations) to the society the economy and the governance rules (Hughes et al 2005) The integration of these dimensions is challenging and this difficulty is inflated by the adoption of strictly sectoral approaches Most studies on the social dimension of resources and environmental management focus on social dynamics and treat the ecosystem as a black box in parallel the ecological approach
Understanding SocialndashEcological Systems using Loop Analysis
41
to sustainability considers the social aspects only at the boundaries of the natural system (Binder et al 2013 Folke 2006 Partelow et al 2019) The balanced integration of social and ecological variables within the same modeling scheme is often precluded by two factors (1) there are difficulties in the identification of the most important interactions linking the variables and (2) the mathematical form of interactions is often unknown Qualitative modeling represents a possible solution to these difficulties In particular loop analysis (Levins 1968 1974) through its simple application requirements (ie describing the presence of links and their signs) can be used to consider the interactions among variables across different domains
Loop analysis was developed to model the equilibrium levels of a system when growth rates of specific variables are altered by environmental variability Loop analysis requires that only the sign of the relationship between the variables is specifiedmdashthat is whether a variable positively or negatively affects another one This simplicity overcomes the lack of quantitative information and simplifies the semantic conversion of the concepts related to the processes in which variables take part when belonging to different domains Most of the works on SESs published so far have focused on ecosystems and considered the human component a source of external perturbations For example Bodini et al (2018) showed how overfishing affected the internal dynamics of the Black Sea but did not consider how socioeconomic drivers inflated overfishing Applications of loop analysis to SESs are gaining ground (Dambacher et al 2007 Martone et al 2017) Here we show the potential of loop analysis for the integrative modeling of SESs First we introduce the methodological aspects behind the tool Second we discuss merits and limitations of loop analysis in studying the dynamical behavior of SESs Then we compare loop analysis with other qualitative methods that can be applied to SESs Finally we present ideas of possible developments that could favor the diffusion of loop analysis in the context of SESs
Loop analysis Methodological aspectsLoop analysis is a qualitative technique for modeling complex systems as signed directed graphs Interactions are depicted as either positive or negative effects but their strength is not specified (Figure 1A) Positive interactions are illustrated by arrow-headed links while negative interactions are visualized with circle-headed links Any signed digraph has a matrix counterpart (interaction matrix) in which positive (arrowheads) and negative (circle heads) interactions are represented by the coefficients +1 and minus1 respectively Zeroes in the matrix stand for null direct relationships between any two variables (Figure 1B) The elements along the main diagonal of the interaction matrix are self-effects on the variables and correspond to self-links in the graph (ie an arrowhead or circle-head link connecting a variable
Human Ecology Review Volume 26 Number 2 2020
42
to itself ) Loop analysis allows predictions on how the variables will respond to press perturbations that target specific variables Press perturbations are forces that modify parameters in the rate of change of the variables (Bender et al 1984) such as environmental warming that enhances the reproductive rate of jellyfish or ecolabels that increase the rate at which the income of fishing cooperatives is produced There are as many targets of press perturbations as the number of variables in the system (ie any variable can represent the entry point for press perturbations) The effect of press perturbations can be predicted by analyzing the structural properties of the graph (Levins 1974 1975)
Figure 1 Signed directed graph describing (A) the Black Sea food web and (B) the corresponding matrix of interactionsNote In the graph positive interactions are denoted with arrow-headed links while negative interactions are visualized with circle-headed links Names of all variables (ie nodes in the graph) are below the matrix of interactions Loop analysis results for the Black Sea in the period 1960ndash1989 are summarized in the table of predictions (C) Additive and multiplicative rules are considered for predictions (the example here refers to a theoretical system with three variables) (D)Source Bodini et al (2018)
Understanding SocialndashEcological Systems using Loop Analysis
43
The links in signed digraphs carry a direction (eg where the arrow and the circle point to) By following this direction one can identify paths so that variables that stand far apart from one another in the system can be functionally connected With reference to Figure 1A nutrients (N) are connected to demersal fish (DF) by several paths one of which is NrarrEPrarrEZrarrPFrarrDF Paths are the routes along which effects of press perturbations travel through the system Each path carries an effect that is either positive or negative depending on the product of the signs of the links that compose the path
Next there is feedback which can be negative or positive The former is a process in which an initial change in a variable is reflected back so that its original value is restored A negative feedback for example occurs in agriculture when an increased agricultural yield reduces prices investments are cut so that yield is reduced A positive feedback occurs when an initial change gives rise to a chain of events that amplify the original change For instance during the civil war in Colombia the level of violence displaced people from their land and this contributed to further increases in the level of violence Since the feedback is a ldquoreturn effectrdquo it originates when variables are linked by closed paths (ie circuits or loops) and its sign is negative or positive depending on the product of the signs of the links that form the loop (see Puccia amp Levins 1985 for a rigorous method for computing the feedback sign) For example in Figure 1D the arrow from A to B and the circle-head link from B to A form a closed path or loop with negative feedback because the product of the two links is negative There can be circuits of different length depending on the number of variables linked together in a closed path With these definitions we can express conceptually the algorithm of loop analysis (Puccia amp Levins 1985) The sensitivity of a variable to a press perturbation depends on (1) whether the perturbation increases (+ sign) or decreases (minus sign) the rate of change of the variable through which it enters the system (2) the sign of the path connecting the variable targeted by the press perturbation to the effect variable (the variable one wants to predict the response of ) (3) the sign of the feedback of the subsystem that remains when all variables on the path are ideally removed from the system (this is called complementary feedback) and (4) the overall feedbackmdashthat is the feedback of the circuits that connect all the variables in the system The algorithm can be summarized in the following formula
partx j
partc =sum
partf ipartc times p jiik times Fnk
Fn
(k) (comp)
in which [partfipartc] expresses whether the rate of change of the target variable xi increases or decreases because of the changing parameter c [pji
(k)] is the pathway from the target to the response variable [Fnminusk
(comp)] is the complementary feedback and [Fn] is the overall feedback Summation (sumik) occurs along all paths from the target
Human Ecology Review Volume 26 Number 2 2020
44
variable xi to the effect variable xj The complementary feedback can be envisioned as a reflecting barrier if it is negative and strong the more an impact is reflected back to the effect variable If it is positive then the effect variable changes in the opposite direction from the sign of the path The overall feedback the denominator of the formula measures the resistance of the whole system to change The responses predicted can be positive (+ increase) negative (minus decrease) or null (0 no change) and are summarized in the table of predictions (Figure 1C) The convention is that effects generated by positive perturbations (those increasing the rate of change of the target variables) on row variables can be read along the columns Consequences of negative perturbations are obtained by reversing the signs of the predictions Consider a positive press perturbation ([partfipartc] gt 0) on node A in Figure 1D If the focus is on the consequences that the press perturbation has on node B then the path is the positive link from A to B and the complementary subsystem is node C alone this latter variable does not form any circuit and the complementary feedback is null (ie equal to 0) The overall feedback is the feedback produced by the circuit that connects all the variables in the system (see Puccia amp Levins 1985 for further details) In the digraph of Figure 1D there is one single circuit that starts and ends with node A and connects all variables This circuit includes one positive and two negative interactions ArarrCndashBndashA its sign is the product of one positive and two negative links and thus it is positive
In graphs with many variables and interactions the number of paths between variables often increases which leads to several ambiguous predictions (ie the positive paths counteract negative paths so that a clear sign of the direction of change cannot be identified) To deal with such ambiguities a simulation approach can be adopted based on a random assignment of strength to each and every link coefficient To make simulations possible the signed digraph is transformed in a matrix using +1 to represent positive (arrowhead) links and minus1 to indicate negative (circle-head) links During simulations the coefficient intensities are taken from a uniform distribution in the interval (01] This means that the +1 and minus1 values in the matrix are substituted by randomly assigned values between 10-6 (the lower boundary equal to 0 is not included) and 1 while the sign is maintained Not all the matrices obtained can be used to compute the predictions but only those that satisfy criteria for stability (see Logofet 1993 for stability conditions matrices must satisfy) According to Bender et al (1984) the net effect that press perturbations targeting the row variable xi have on the column variable xj are expressed by the elements of the inverse of the matrix that is obtained from the signed digraph (for details see Levins 1975) After n simulations an overall table of predictions is constructed by combining the z matrices that are stable and allow matrix inversion For each stable matrix assembled using simulated interaction strengths unambiguous responses in the table of predictions are generated (ie the signs are certain) The overall table of predictions is composed of symbols that depend on the percentages of signs from the various simulation runs Hence if the same entry in the tables of predictions
Understanding SocialndashEcological Systems using Loop Analysis
45
from all z (stable) matrices yields the same sign (+ or minus) then the expected direction of change is unambiguous However during simulations there are cases for which divergent predictions are recorded (ie depending on the random arrangement of interaction strengths the same element in the table of predictions can show either positive or negative sign) The conversion of the outcomes from each simulation run to symbols in the overall table of predictions depends on the percentages of positive (+) and negative (minus) signs The rules to move from simulations results to the overall table of predictions are summarized in Table 1
Table 1 Rules to convert differences between percentages of signs obtained with simulations (ldquo of +rdquo ndash ldquo of ndashrdquo) into predictions (ie signs in the overall table of predictions)
ldquo of +rdquo ndash ldquo of ndashrdquo Corresponding sign in the table[minus100 minus50] minus(minus50 -20) minus (tendency to minus)[minus20 20] 0(20 50) + (tendency to +)[50 100] +0 = 100 0
Notes Round brackets indicate that the extremes are excluded 0 is not a real zero meaning no changes in the biomassabundance of variables but represents neutral results due to relatively balanced amounts of negative and positive effects When after the complete set of simulations there are entries for which the absence of any effect was always recorded then the symbol in the overall table of predictions is 0 indicating proper absence of effect (see the last row of the table 0 = 100)Source Authorsrsquo summary
Merits and limitations of loop analysis to model SESsLoop analysis is particularly suitable to investigate SESs First interconnections extend beyond the single domains of ecology economy and society to create complex networks For instance after the Nile perch invaded Lake Victoria a dramatic restructuring of the ecological community took place which in turn cascaded into deep societal and economic changes (Downing et al 2014) To disentangle drivers and dynamics of change in such a complex scenario Downing and coworkers designed an eco-social qualitative model that traced connections across disciplinary boundaries Second loop analysis educates intuition to cope with complexity Often complex systems defy our predictions and effects of policies or management interventions are at best ineffective if not damaging (Levins 1995) Failure of policies depends on the feedbacks that are produced by the linkages between the variables and that remain hidden to our comprehension if complexity does not become our central intellectual issue Cinner (2011)
Human Ecology Review Volume 26 Number 2 2020
46
in discussing problems of reef fishery emphasizes that the feedback between social and ecological variables may create socialndashecological traps (eg situations when feedbacks between social and ecological systems lead toward an undesirable state that may be difficult or impossible to reverse) It is extremely interesting to explore these phenomena by loop analysis which by disentangling feedback loops helps make the arcane obvious This capability however cannot be fully exploited if the feedback structure of the systems is not adequately represented and the relationships between the variables remain mostly unidirectional the potential may instead emerge when social and environmental variables are incorporated in a unique model (Dambacher et al 2007) Third loop analysis proposes a rigorous approach to diagnosis Diagnostic approaches are more often requested in the analysis of SESs to causally understand the multiple outcomes that can arise from the interaction of different system attributes (Kittinger et al 2013) The table of predictions the main outcome of loop analysis allows the disentangling of causative mechanisms by linking correlation patterns sources of change and network structure (Bodini amp Clerici 2016 Bodini et al 2018) For any entry point of press perturbation (any row in the table of predictions see Figure 1C) variables are predicted to change so that correlation patterns among them emerge By comparing such patterns with observed changes in the level of the variables one can identify which component is affected by external drivers and find the cause and effect mechanisms responsible for those changes due to the linkage structure Fourth loop analysis incorporates external drivers as inputs to the rate of change of the variables External drivers both social and biophysical have been described as playing an important role in SES dynamics (Kittinger et al 2013) For example in Baja California (Mexico) climate-driven hypoxia caused an excess mortality in marine species with limited mobility resulting in declines of stocks targeted by small-scale local fisheries which in turn caused small-scale fishers to switch fishing effort toward less-affected species (Micheli et al 2012) Such effect was explored in a scenario analysis using loop analysis which predicted large-scale consequences of this external driver (Martone et al 2017) Fifth the intuitive visualization of the entities and the interactions among them is suitable for accommodating the general framework proposed by Ostrom (2009) for analyzing the sustainability of SESs Each node in the digraph can be one of the four elements (ie core subsystems governance system resource users resource system and resource units) and either positive or negative links can visualize their direct relationships So far the main focus has been dedicated to the visualization of ecological variables and interactions and the inclusion of socialndasheconomic aspects has been treated as external to the system (Carey et al 2014 Espinoza-Tenorio et al 2013 Reum et al 2015) Finally the simple graphical format that constitutes the input for the loop analysis facilitates the participation of all stakeholders to model construction Although most of the current applications adopted a top-down approach to embed management strategies in models (ie literature data were consulted to define the interactions) the study of Espinoza-
Understanding SocialndashEcological Systems using Loop Analysis
47
Tenorio et al (2013) presents a valid alternative In that work both quantitative and qualitative information regarding the biological and social aspects of fisheries dynamics and management were retrieved using structured interviews with fishers participatory research key informant interviews and workshops
Limitations of the methodology should be taken into account Some limitations have already been discussed (Justus 2006) and here we focus on those that matter with the use of loop analysis in studying SESs First there can be difficulties in defining the timing of changing conditions and that of system response to impacts SESs are resilient and cope with continuous exposure to press perturbations according to adaptive dynamics principles (Folke 2006 Hughes et al 2005) The exact moment at which the system responds to a press perturbation cannot be detected with precision and the contribution of concomitant perturbations may further confound this detection Second the variables of SESs (eg resources and their users) can show asynchronous behavior and heterogeneous geographical distribution (Leslie et al 2015) Their optimization does not necessarily occur at the same temporal and spatial scale an aspect that might remain overlooked when constructing graphs The uneven geographical distribution of the actors might be addressed by including in the models different variables for the same type of user (eg various nodes that indicate the fishers and their interactions in different regions) Third there can be issues in the identification of the variables exposed to press perturbations (ie impacts of overfishing vs climate change) For example while marketing solutions (eg the introduction of ecolabels) can be easily targeted to specific user groups (eg the members of fishing cooperatives see Martone et al 2017) climate change (eg warmer winters) may affect many components of the ecological system with different time of response One possible solution is prioritizing as press perturbation targets the most responsive biological variables (eg jellyfish have faster blooming rates than expected from the body size see Nival amp Gorsky 2001) Finally loop analysis is problematic for assessing nonlinear relationships Nonlinearity can emerge by combining the impacts of pathways of different lengths Longer pathways have lower intensity than shorter ones since the interaction strengths randomly assigned during the simulations are in the interval (01] (ie the intensity of each pathway is obtained by multiplying the strength of its constitutive links that have upper bound equal to 1) To avoid penalizing the impact of longer pathways simulations could be carried out by constraining the lower limit from which interaction strengths are randomly drawn during simulations (ie by setting the lower limits of some ldquostrongrdquo interactions closer to 1) As an alternative one could include nonlinear functions to model those specific interactions that play crucial roles for the dynamics of the SES (eg by relying on previous literature data or results from specific experiments and surveys)
Human Ecology Review Volume 26 Number 2 2020
48
Comparison of loop analysis with other qualitative methods for SESsSESs form complex networks of linkages and loop analysis is designed to qualitatively predict how variables that are embedded in SESs respond to policies and management interventions (eg introduction of new regulations for the exploitation of resources market-based incentives and adoption of new marketing solutions Carey et al 2014 Dambacher et al 2007 Levin et al 2009) A limited number of applications to investigate complex SES have made use of loop analysis but the interest toward the method has taken little ground in the context of fisheries (Anthony et al 2013 Carey et al 2014 Dambacher et al 2015 Espinoza-Tenorio et al 2013 Martone et al 2017) These applications highlight that loop analysis has some potential that extends beyond its limitations For example predictions are about the equilibrium level of the variables (Justus 2006) but real systems are generally not at the equilibrium However previous studies have offered evidence that predictions from loop analysis apply successfully to changes in average values of the variables (Bodini 2000) Average values should be long term and Bodini et al (2018) showed that averages taken over either 5 or 10 years can be used to grasp variable responses to press perturbations The appropriate time scale for taking averages however very much depends on the system under investigation
Other qualitative modeling approaches can be used to study SESs Fuzzy cognitive maps (FCMs) is one of these It makes the magnitude of links explicit through a semi-quantification of the relationships that link variables (Kok 2009 Oumlzesmi amp Oumlzesmi 2004) The semi-quantification of the links may resolve the ambiguities typical of loop analysis about the net effect generated by the combination of contrasting pathways Also FCMs can make predictions about multiple simultaneous perturbations Both the state of the variables (ldquoconceptsrdquo in the technical language of FCMs) and the strength of the links (edges between the concepts) are quantified by assigning standardized values in the range [01] for states and [-11] for links Although these are relative values (ie each of them is assigned in relation to the others) some criteria for the quantification must be identified These criteria must be supported by some knowledge about the level of the variables and interactions in the system and in particular the use of FCMs seems appropriate when the estimates of variable state and link strength are the outcomes of either a combination of multiple FCMs from individual stakeholders or a set of values defined through participatory workshops The quantification of variables and interactions requires a certain level of knowledge about the system and it automatically selects the working groups among stakeholders that possess some previous understanding of the system under investigation It follows that FCMs cannot be public reproducible and intelligible in the way that loop analysis is Kok (2009) posits that vague or complex concepts such as ldquoconsumer behaviorrdquo must not be taken into account when applying FCMs
Understanding SocialndashEcological Systems using Loop Analysis
49
because guessing about their magnitude is inherently difficult On the other hand loop analysis allows including ldquoawarenessrdquo in a malaria model (Yasuoka et al 2014) ldquoenvironmental attractivenessrdquo in a tourism model (Bodini et al 2000) and the ldquorole of the unionsrdquo in a model on diabetes (Lewontin amp Levins 2007) In these aspects it seems that FCMs share one limitation with quantitative models the tendency to exclude from the analysis factors that are difficult or impossible to measure no matter if they play a role in the dynamics of the system The connections among the variables in FCMs are designed on the basis of fuzzy conditional statements (ldquoif hellip thenrdquo) that are of the type ldquoif the level of variable A is high that of variable B is lowrdquo Thus connections are deduced from correlations between the variables derived from observing the system (Stylios amp Groumpos 1999) However Levins and Puccia (1988) point out that patterns of correlation depend on the network structure and the entry point of the perturbation For example any two variables may show positive correlation in response to a specific press perturbation but opposite correlation (or no correlation) in response to other press perturbations It follows that defining interactions between variables on the basis of their correlations may be misleading In loop analysis perturbations are variations in parameters that govern the rate of change of variables For example a pollutant triggering an increase in the mortality rate of a population FCMs instead consider the changes in the level of the variables as perturbations To predict say the impacts of a pollutant that affects a population FCMs consider the reduced abundance induced by the pollutant as the initial event (ie the perturbation) on the logical assumption that a toxin by increasing the mortality of a species automatically reduces its abundance Thus the initial event is deduced from a more or less plausible linear sequence of steps This series of events overlooks the fact that the response of the target population to the increased mortality is also mediated by the network of interactions with the other variables and that accordingly often does not follow commonsense linear expectations Such assumption leads to the circular argument that FCMs predict the effects given a cause that is in turn an effect that FCMs should predict On the other hand we can be confident that the pollutant increases the mortality rate of the target population which is the initial event in loop analysis Loop analysis considers the role of the environmental variability in changing the parameters that govern the growth rates of the variables and does not interpret it solely as the cause of variable fluctuations like FCMs do
Causal loop diagrams (CLDs Hanspach et al 2014 Tenza et al 2017) and Bayesian belief networks (BBNs Borsuk et al 2004 Pollino et al 2007) have also been applied for analyzing SESs CLDs make predictions by logically reconstructing the chains of causes and effects between variables on the basis of link polarities (eg the signs of the directed links ie the effects of one variable over the other) Predicting the behavior of complex networks by identifying the feedback effects using link polarity (ie the effect associated to the link positive or negative) is difficult and can lead to misleading interpretations (Lane 2008 Richardson 1997)
Human Ecology Review Volume 26 Number 2 2020
50
Most problems originate from polarities Consider for example the case in which the level of violence displaces people from rural areas and forces them to move to the cities (Colombia is a paradigmatic example see Ibaacutentildeez amp Veacutelez 2008) The causal connections are that level of violence increases the migration rate (positive link) which in turn increases the population level in the city (positive link) Therefore the expected trend is the higher the level of violence the greater the increase of urban population However if the level of violence gets lower the migration rate is reduced but this does not reduce the population in the city as it continues to increase unless an opposite migratory flux occurs Hence the articulation of causal pathways gets difficult because variables can be both standing stocks and rates of change (Sweeney amp Sterman 2007) Similarly specifying the relevant conditional probabilities as required by BBNs can be a laborious and time-consuming process (Marcot et al 2001 Ticehurst et al 2007) Moreover to include feedback mechanisms via cyclic network structures requires dynamic time-explicit BBNs which depend on extensive parameterization Similar to FCMs combining BBNs with loop analysis has great potential for improving predictions and model validation (Anthony et al 2013 Melbourne-Thomas et al 2012 Raoux et al 2018) However it must be emphasized that these applications of BBNs are based on the signs derived from the analysis of the loop models As such their outcomes are contingent on the assumptions and limitations of signed diagraph models
Central for the understanding of the complex causality in SESs is our ability to individuate what the relevant components of the SESs are and diagram their relationships The nature of the linkages among these components determines the spreading of the effects through the system and the overall composition of the linkages generates the feedbacks that amplify or buffer such effects There is no recipe for modeling development but great effort must be devoted to assimilation of facts observations and hypotheses Increasing the reliability of predictions can be possible by designing alternative graphs This iterative procedure allows addressing uncertainty about the system structure and determining which differences matter Robust outcomes may be the effect of a core structure common to all models upon which few links added or removed cannot change radically the predictions The core structure represents the fundamental backbone composed of more certain variables and interactions Disagreements among stakeholders scientists or managers do not limit the application of loop analysis rather they offer the opportunity to involve stakeholders in a participatory model construction (Anthony et al 2013) where different types of system knowledge can be used to determine variables and links that may be important to examine further (Stier et al 2017) The adoption of such a comprehensive system-wide approach aims to formulate management strategies that reconcile ecological integrity and intergenerational equity key dimensions of the sustainable development paradigm
Understanding SocialndashEcological Systems using Loop Analysis
51
Possible developments for the application of loop analysis to SESsMaking predictions is difficult especially when we face the uncertainty associated with new unknown events changing dynamics and lack of quantitative data This is the case for example with climate change which produces completely new phenomena and dynamics In such context an adaptive management that allows for continually assessing new evidence has been called for We believe that in the new scenarios we are facing the method of loop analysis can be helpful It has the necessary adaptability to be used in changing contexts When in doubt about critical linkages and dynamic features alternative models can be developed to find out which differences matter and to reach robust conclusions It is also flexible as it allows including and discarding variables easily and above all it permits working with variables and links that are not readily measurable even though their effects are crucial However its suitability to investigate SESs can be improved in several ways The intricacy of the feedbacks can be better resolved if a specific tool for pathways analysis is developed Returning the total number of pathways and their strength between any pair of variables can show how single pathways contribute to specific effects and which ones are more important in mediating the press perturbations The question of link strength deserves attention We specified in the methodological aspects section that link strength is randomly assigned to interaction links during simulations But this does not contradict the qualitative nature of the method it only serves to assign certainty to paths and feedbacks in order to get unambiguous predictions which remain qualitative in nature as only the direction of change for the variables is predicted Pathway anatomy would help selecting those causal chains that mostly affect system dynamics Other relevant features that would improve the suitability of loop analysis for modeling SESs include (1) considering multiple simultaneous press perturbations and (2) delimiting upper and lower limits for the strength of interactions The first point is related to the fact that SESs are often exposed to different types of disturbances whose interplay gives rise to net cumulative responses that would be useful to disentangle (eg through the identification of the specific causative chains) Considering multiple press perturbations would greatly contribute to building up an effective diagnostic approach (Kittinger et al 2013) For example by loop analysis Bodini et al (2018) diagnosed that multiple press perturbations not only overfishing of small and medium pelagic species were responsible for the restructuring of the Black Sea community during the period 1960ndash1989 Moreover socioeconomic drivers amplify the impacts that are triggered by natural processes for instance both hypoxia and fisheries management affected abalone stock in the Baja California SES (Martone et al 2017) The second line of development is conceived to extend loop analysis in a semi-quantitative direction So far the simulations are performed by randomly sampling interaction strength in the uniform interval (01] There are however cases when some interactions are known
Human Ecology Review Volume 26 Number 2 2020
52
to be either strong or weak in such cases varying the strength of these linkages in the whole interval (01] does not make sense However it is difficult to translate fuzzy concepts such as strong and weak into numbers so that boundaries for the links can be set In this respect sensitivity analysis may help Either the upper (ie 1) or the lower (ie 10-6) limit of the link magnitude could be iteratively changed so that actual boundaries for certain linkages can be identified through a consistency assessment of the outcomes produced For example performing the sensitivity analysis for the strength of specific interactions might help modeling competitive advantages in the ecological domain (eg Noctiluca scintillans vs zooplankton in the Black Sea Bodini et al 2018) and power or information asymmetries between socioeconomic actors (Bousquet et al 2015) Therefore exploring alternative scenarios by constraining the strength of some interactions would be of great benefit for modeling SESs It should also be noticed that a uniform distribution is considered by default for randomly sampling the strength but it could be substituted by either normal or skewed (eg Poisson) distributions
Concluding remarksThe central issue in the study of SESs is to understand interdependencies that cross the boundaries of the classical domains in which scientific and operational knowledge have been settled Contributions in this respect are expected from tools that allow reconstructing the causal chains that give rise to such interdependencies and that involve variables or components of different nature For such reconstruction to be effective tools must overcome the barriers that make communication between domains difficult (1) the simpler the language used to describe the phenomena and the interactions the better it is (2) a lower level of technicality in the algorithms facilitates understanding the outcomes and (3) flexibility widens the range of applicability to different contexts Loop analysis shares most of these features (1) by classifying the interactions in only two categories positive and negative it facilitates creating connections between variables that differ dramatically in physical form (2) the ease by which a model can be constructed as a graph allows keeping up with rapidly changing conditions (ie variables andor links disappear and others become important) (3) the algorithm for predictions refers directly to structural features of the graph and can be visualized thus making the outcomes easier to understand and (4) it is also characterized by a wide applicability (often the question of interest is not a particular system but a whole class of systems with some similarity of structure) Furthermore loop analysis emphasizes the understanding of mechanisms which is a prime objective when an intellectual and operative framework is taking shape as in the case of SESs
Understanding SocialndashEcological Systems using Loop Analysis
53
ReferencesAnthony K R Dambacher J M Walshe T amp Beeden R (2013) A framework for
understanding cumulative impacts supporting environmental decisions and informing resilience-based management of the Great Barrier Reef World Heritage Area Australian Institute of Marine Science CSIRO NERP Decisions Hub University of Melbourne and Great Barrier Reef Marine Park Authority hdlhandlenet110172850
Bender E A Case T J amp Gilpin M E (1984) Perturbation experiments in community ecology Theory and practice Ecology 65(1) 1ndash13 doiorg1023071939452
Binder C R Hinkel J Bots P W G amp Pahl-Wostl C (2013) Comparison of frameworks for analyzing socialndashecological systems Ecology and Society 18(4) Article 26 doiorg 105751es-05551-180426
Bodini A (2000) Reconstructing trophic interactions as a tool for understanding and managing ecosystems Application to a shallow eutrophic lake Canadian Journal of Fisheries and Aquatic Sciences 57(10) 1999ndash2009 doiorg101139f00-153
Bodini A amp Clerici N (2016) Vegetation herbivores and fires in savanna ecosystems A network perspective Ecological Complexity 28 36ndash46 doiorg101016jecocom 201610001
Bodini A Ricci A amp Viaroli P (2000) A multimethodological approach for the sustainable management of perifluvial wetlands of the Po River (Italy) Environmental Management 26(1) 59ndash72 doiorg101007s002670010071
Bodini A Rocchi M amp Scotti M (2018) Insights into the ecology of the Black Sea through the qualitative loop analysis of the community structure Limnology and Oceanography 63(2) 968ndash984 doiorg101002lno10713
Borsuk M E Stow C A amp Reckhow K H (2004) A Bayesian network of eutrophication models for synthesis prediction and uncertainty analysis Ecological Modelling 173(2ndash3) 219ndash239 doiorg101016jecolmodel200308020
Bousquet F Anderies M Antona M Bassett T Benjaminsen T Bonato O hellip Vassal J-M (2015) Socio-ecological theories and empirical research Comparing socialndashecological schools of thoughts in action [Research report] CIRAD-GREEN halarchives-ouvertesfrhal-01130178
Carey M P Levin P S Townsend H Minello T J Sutton G R Francis T B hellip Ruckelshaus M (2014) Characterizing coastal foodwebs with qualitative links to bridge the gap between the theory and the practice of ecosystem-based management ICES Journal of Marine Science 71(3) 713ndash724 doiorg101093icesjmsfst012
Cinner J E (2011) Socialndashecological traps in reef fisheries Global Environmental Change 21(3) 835ndash839 doiorg101016jgloenvcha201104012
Human Ecology Review Volume 26 Number 2 2020
54
Costanza R amp Mageau M (1999) What is a healthy ecosystem Aquatic Ecology 33(1) 105ndash115 doiorg101023A1009930313242
Dambacher J M Brewer D T Dennis D M Macintyre M amp Foale S (2007) Qualitative modelling of gold mine impacts on Lihir Islandrsquos socioeconomic system and reef-edge fish community Environmental Science amp Technology 41(2) 555ndash562 doiorg 101021es0610333
Dambacher J M Rothlisberg P C amp Loneragan N R (2015) Qualitative mathematical models to support ecosystem‐based management of Australiarsquos Northern Prawn Fishery Ecological Applications 25(1) 278ndash298 doiorg10189013-20301
Downing A S van Nes E H Balirwa J S Beuving J J Bwathondi P O J Chapman L J hellip Mooij W M (2014) Coupled human and natural system dynamics as key to the sustainability of Lake Victoriarsquos ecosystem services Ecology and Society 19(4) Article 31 doiorg105751es-06965-190431
Espinoza-Tenorio A Wolff M Espejel I amp Montantildeo-Moctezuma G (2013) Using traditional ecological knowledge to improve holistic fisheries management Transdisciplinary modeling of a lagoon ecosystem of Southern Mexico Ecology and Society 18(2) Article 6 doiorg105751es-05369-180206
Folke C (2006) Resilience The emergence of a perspective for socialndashecological systems analyses Global Environmental Change 16(3) 253ndash267 doiorg101016jgloenvcha 200604002
Haines-Young R amp Potschin M (2010) The links between biodiversity ecosystem services and human well-being In D G Raffaelli amp C L Frid (Eds) Ecosystem ecology A new synthesis (pp 110ndash139) Cambridge University Press doiorg101017cbo978051175 0458007
Hanspach J Hartel T Milcu A I Mikulcak F Dorresteijn I Loos J hellip Fischer J (2014) A holistic approach to studying socialndashecological systems and its application to southern Transylvania Ecology and Society 19(4) Article 32 doiorg105751es-06915-190432
Hilborn R (2007) Defining success in fisheries and conflicts in objectives Marine Policy 31(2) 153ndash158 doiorg101016jmarpol200605014
Hughes T P Bellwood D R Folke C Steneck R S amp Wilson J (2005) New paradigms for supporting the resilience of marine ecosystems Trends in Ecology amp Evolution 20(7) 380ndash386 doiorg101016jtree200503022
Ibaacutentildeez A M amp Veacutelez C E (2008) Civil conflict and forced migration The micro determinants and welfare losses of displacement in Colombia World Development 36(4) 659ndash676 doiorg101016jworlddev200704013
Justus J (2006) Loop analysis and qualitative modeling Limitations and merits Biology and Philosophy 21(5) 647ndash666 doiorg101007s10539-006-9050-x
Understanding SocialndashEcological Systems using Loop Analysis
55
Kittinger J N Finkbeiner E M Ban N C Broad K Carr M H Cinner J E hellip Crowder L B (2013) Emerging frontiers in social-ecological systems research for sustainability of small-scale fisheries Current Opinion on Environmental Sustainability 5(3ndash4) 352ndash357 doiorg101016jcosust201306008
Kok K (2009) The potential of fuzzy cognitive maps for semi-quantitative scenario development with an example from Brazil Global Environmental Change 19(1) 122ndash133 doiorg101016jgloenvcha200808003
Lane D C (2008) The emergence and use of diagramming in system dynamics A critical account Systems Research and Behavioral Science 25(1) 3ndash23 doiorg101002sres826
Leslie H M Basurto X Nenadovic M Sievanen L Cavanaugh K C Cota-Nieto J J hellip Aburto-Oropeza O (2015) Operationalizing the social-ecological systems framework to assess sustainability Proceedings of the National Academy of Sciences of the USA 112(19) 5979ndash5984 doiorg101073pnas1414640112
Levin P S Fogarty M J Murawski S A amp Fluharty D (2009) Integrated ecosystem assessments Developing the scientific basis for ecosystem-based management of the ocean PLoS Biology 7(1) e1000014 doiorg101371journalpbio1000014
Levins R (1968) Evolution in changing environments Some theoretical explorations Princeton University Press
Levins R (1974) Discussion paper The qualitative analysis of partially specified systems Annals of the New York Academy of Sciences 231(1) 123ndash138 doiorg101111 j1749-66321974tb20562x
Levins R (1975) Evolution in communities near equilibrium In M L Cody and J M Diamond (Eds) Ecology and evolution of communities (pp 16ndash50) Harvard University Press
Levins R (1995) Preparing for uncertainty Ecosystem Health 1(1) 47ndash57
Levins R amp Puccia C J (1988) The controlling factor in biological communities Coenoses 3(3) 149ndash154 wwwjstororgstable43460977
Lewontin R C amp Levins R (2007) Educating the intuition to cope with complexity In R C Lewontin amp R Levins (Eds) Biology under the influence Dialectical essays on ecology agriculture and health (pp 183ndash198) Monthly Review Press
Logofet D (1993) Matrices and graphs Stability problems in mathematical ecology CRC Press
Long R D Charles A amp Stephenson R L (2015) Key principles of marine ecosystem-based management Marine Policy 57 53ndash60 doiorg101016jmarpol201501013
Lotze H K Lenihan H S Bourque B J Bradbury R H Cooke R G Kay M C hellip Jackson J B (2006) Depletion degradation and recovery potential of estuaries and coastal seas Science 312(5781) 1806ndash1809 doiorg101126science1128035
Human Ecology Review Volume 26 Number 2 2020
56
Marcot B G Holthausen R S Raphael M G Rowland M M amp Wisdom M J (2001) Using Bayesian belief networks to evaluate fish and wildlife population viability under land management alternatives from an environmental impact statement Forest Ecology and Management 153(1ndash3) 29ndash42 doiorg101016s0378-1127(01)00452-2
Martone R G Bodini A amp Micheli F (2017) Identifying potential consequences of natural perturbations and management decisions on a coastal fishery socialndashecological system using qualitative loop analysis Ecology and Society 22(1) Article 34 doiorg 105751 es-08825-220134
Melbourne-Thomas J Wotherspoon S Raymond B amp Constable A (2012) Comprehensive evaluation of model uncertainty in qualitative network analyses Ecological Monographs 82(4) 505ndash519 doiorg10189012-02071
Micheli F Saenz-Arroyo A Greenley A Vazquez L Espinoza Montes J A Rossetto M amp De Leo G A (2012) Evidence that marine reserves enhance resilience to climatic impacts PLoS ONE 7 e40832 doiorg101371journalpone0040832
Nival P amp Gorsky G (2001) Conditions for blooming of pelagic species In CIESM Workshop Monographs No 14mdashGelatinous zooplankton outbreaks Theory and practice (pp 23ndash27) Commission Internationale pour lrsquoExploration Scientifique de la Meacutediterraneacutee (CIESM [Mediterranean Science Commission])
Ostrom E (2009) A general framework for analyzing sustainability of social-ecological systems Science 325(5939) 419ndash422 doiorg101126science1172133
Oumlzesmi U amp Oumlzesmi S L (2004) Ecological models based on peoplersquos knowledge A multi-step fuzzy cognitive mapping approach Ecological Modelling 176(1ndash2) 43ndash64 doiorg101016jecolmodel200310027
Partelow S Fujitani M Soundararajan V amp Schluumlter A (2019) Transforming the social-ecological systems framework into a knowledge exchange and deliberation tool for comanagement Ecology and Society 24(1) Article 15 doiorg105751es-10724-240115
Pollino C A Woodberry O Nicholson A Korb K amp Hart B T (2007) Parameterisation and evaluation of a Bayesian network for use in an ecological risk assessment Environmental Modelling amp Software 22(8) 1140ndash1152 doiorg101016jenvsoft200603006
Puccia C J amp Levins R (1985) Qualitative modeling of complex systems An introduction to loop analysis and time averaging Harvard University Press
Raoux A Dambacher J M Pezy J P Mazeacute C Dauvin J C amp Niquil N (2018) Assessing cumulative sociondashecological impacts of offshore wind farm development in the Bay of Seine (English Channel) Marine Policy 89 11ndash20 doiorg101016jmarpol 201712007
Reum J C McDonald P S Ferriss B E Farrell D M Harvey C J amp Levin P S (2015) Qualitative network models in support of ecosystem approaches to bivalve aquaculture ICES Journal of Marine Science 72(8) 2278ndash2288 doiorg101093icesjms fsv119
Understanding SocialndashEcological Systems using Loop Analysis
57
Richardson G P (1997) Problems in causal loop diagrams revisited System Dynamics Review 13(3) 247ndash252 doiorg101002(sici)1099-1727(199723)133lt247aid-sdr 128gt 30co2-9
Stachowicz J J Fried H Osman R W amp Whitlatch R B (2002) Biodiversity invasion resistance and marine ecosystem function Reconciling pattern and process Ecology 83(9) 2575ndash2590 doiorg1018900012-9658(2002)083[2575birame]20co2
Stier A C Samhouri J F Gray S Martone R G Mach M E Halpern B S hellip Levin P S (2017) Integrating expert perceptions into food web conservation and management Conservation Letters 10(1) 67ndash76 doiorg101111conl12245
Stylios C D amp Groumpos P P (1999) A soft computing approach for modelling the supervisor of manufacturing systems Journal of Intelligent and Robotic Systems 26(3ndash4) 389ndash403 doiorg101023A1008165916707
Sweeney L B amp Sterman J (2007) Thinking about systems Student and teacher conceptions of natural and social systems System Dynamics Review 23(2ndash3) 285ndash311 doiorg101002sdr366
Tenza A Peacuterez I Martiacutenez-Fernaacutendez J amp Gimeacutenez A (2017) Understanding the decline and resilience loss of a long-lived social-ecological system Insights from system dynamics Ecology and Society 22(2) Article 15 doiorg105751es-09176-220215
Ticehurst J L Newham L T Rissik D Letcher R A amp Jakeman A J (2007) A Bayesian network approach for assessing the sustainability of coastal lakes in New South Wales Australia Environmental Modelling amp Software 22(8) 1129ndash1139 doiorg101016 jenvsoft 200603003
Worm B Barbier E B Beaumont N Duffy J E Folke C Halpern B S hellip Watson R (2006) Impacts of biodiversity loss on ocean ecosystem services Science 314(5800) 787ndash790 doiorg101126science1132294
Yasuoka J Jimba M amp Levins R (2014) Application of loop analysis for evaluation of malaria control interventions Malaria Journal 13 Article 140 doiorg1011861475-2875-13-140
This text is taken from Human Ecology Review Volume 26 Number 2 2020 published by ANU Press The Australian National University Canberra Australia
doiorg1022459HER2602202003

Human Ecology Review Volume 26 Number 2 2020
40
stability and productivity of natural systems (Stachowicz et al 2002 Worm et al 2006) However biodiversity is declining worldwide a trend that raises concerns on the sustainable supply of goods and services from ecosystems (Lotze et al 2006) The increasing level of human-induced impacts (eg overexploitation of resources introduction of alien species into native environments chemical pollution nutrient enrichment and climate change) threatens biodiversity in both aquatic and terrestrial systems and calls for the formulation of effective conservation practices Ecological changes are often associated with social and economic transformations that in turn reflect their effects back on ecological functions and processes Discovering and bringing to light these interdependencies requires a shift in focus from a ldquowithin-domain approachrdquo to a global strategy in which the ecosystem as unit of investigation is part of a larger system that embeds socioeconomic dynamics (Hilborn 2007) Long et al (2015) identified 15 key principles for implementing ecosystem-based management (EBM) Among these principles they included the modeling of interconnections between ecological social and governance systems which implies that socialndashecological systems (SESs) are networks and that EBM implementation can benefit from the application of the methodologies that network analysis offers
The network perspective requires that the interactions that link variables belonging to the human and ecological domains are concurrently taken into account so that the SES as a whole becomes the unit of management The challenge is the identification of relationships at different hierarchical levels which occur at various spatial and temporal scales To facilitate integration Ostrom (2009) proposed a classificatory framework that describes the four essential dimensions of SESs resource users governance system resource units and resource system The relationships among these four dimensions occur at various geographical and temporal scales within the rules defined by the SESrsquos ecological social economic and political settings The choice of the suitable scales and the proper identification of the variables that constitute the SES and their connections are essential to assess under what conditions sustainability can be enhanced Moreover the concept of sustainability is multidimensional and the spatial heterogeneity of SES variables can cause a mismatch between objectives that belong to either the social or ecological domain This complexity is exemplified by the study of small-scale fisheries in the Mexican state of Baja California Sur which showed the lack of association between different dimensions of sustainability (Leslie et al 2015) Policies for the sustainable use of ecosystem goods and services require policy-makers to take into account the set of interactions linking ecological resilience (ie the adaptive capacity to withstand recurrent perturbations) to the society the economy and the governance rules (Hughes et al 2005) The integration of these dimensions is challenging and this difficulty is inflated by the adoption of strictly sectoral approaches Most studies on the social dimension of resources and environmental management focus on social dynamics and treat the ecosystem as a black box in parallel the ecological approach
Understanding SocialndashEcological Systems using Loop Analysis
41
to sustainability considers the social aspects only at the boundaries of the natural system (Binder et al 2013 Folke 2006 Partelow et al 2019) The balanced integration of social and ecological variables within the same modeling scheme is often precluded by two factors (1) there are difficulties in the identification of the most important interactions linking the variables and (2) the mathematical form of interactions is often unknown Qualitative modeling represents a possible solution to these difficulties In particular loop analysis (Levins 1968 1974) through its simple application requirements (ie describing the presence of links and their signs) can be used to consider the interactions among variables across different domains
Loop analysis was developed to model the equilibrium levels of a system when growth rates of specific variables are altered by environmental variability Loop analysis requires that only the sign of the relationship between the variables is specifiedmdashthat is whether a variable positively or negatively affects another one This simplicity overcomes the lack of quantitative information and simplifies the semantic conversion of the concepts related to the processes in which variables take part when belonging to different domains Most of the works on SESs published so far have focused on ecosystems and considered the human component a source of external perturbations For example Bodini et al (2018) showed how overfishing affected the internal dynamics of the Black Sea but did not consider how socioeconomic drivers inflated overfishing Applications of loop analysis to SESs are gaining ground (Dambacher et al 2007 Martone et al 2017) Here we show the potential of loop analysis for the integrative modeling of SESs First we introduce the methodological aspects behind the tool Second we discuss merits and limitations of loop analysis in studying the dynamical behavior of SESs Then we compare loop analysis with other qualitative methods that can be applied to SESs Finally we present ideas of possible developments that could favor the diffusion of loop analysis in the context of SESs
Loop analysis Methodological aspectsLoop analysis is a qualitative technique for modeling complex systems as signed directed graphs Interactions are depicted as either positive or negative effects but their strength is not specified (Figure 1A) Positive interactions are illustrated by arrow-headed links while negative interactions are visualized with circle-headed links Any signed digraph has a matrix counterpart (interaction matrix) in which positive (arrowheads) and negative (circle heads) interactions are represented by the coefficients +1 and minus1 respectively Zeroes in the matrix stand for null direct relationships between any two variables (Figure 1B) The elements along the main diagonal of the interaction matrix are self-effects on the variables and correspond to self-links in the graph (ie an arrowhead or circle-head link connecting a variable
Human Ecology Review Volume 26 Number 2 2020
42
to itself ) Loop analysis allows predictions on how the variables will respond to press perturbations that target specific variables Press perturbations are forces that modify parameters in the rate of change of the variables (Bender et al 1984) such as environmental warming that enhances the reproductive rate of jellyfish or ecolabels that increase the rate at which the income of fishing cooperatives is produced There are as many targets of press perturbations as the number of variables in the system (ie any variable can represent the entry point for press perturbations) The effect of press perturbations can be predicted by analyzing the structural properties of the graph (Levins 1974 1975)
Figure 1 Signed directed graph describing (A) the Black Sea food web and (B) the corresponding matrix of interactionsNote In the graph positive interactions are denoted with arrow-headed links while negative interactions are visualized with circle-headed links Names of all variables (ie nodes in the graph) are below the matrix of interactions Loop analysis results for the Black Sea in the period 1960ndash1989 are summarized in the table of predictions (C) Additive and multiplicative rules are considered for predictions (the example here refers to a theoretical system with three variables) (D)Source Bodini et al (2018)
Understanding SocialndashEcological Systems using Loop Analysis
43
The links in signed digraphs carry a direction (eg where the arrow and the circle point to) By following this direction one can identify paths so that variables that stand far apart from one another in the system can be functionally connected With reference to Figure 1A nutrients (N) are connected to demersal fish (DF) by several paths one of which is NrarrEPrarrEZrarrPFrarrDF Paths are the routes along which effects of press perturbations travel through the system Each path carries an effect that is either positive or negative depending on the product of the signs of the links that compose the path
Next there is feedback which can be negative or positive The former is a process in which an initial change in a variable is reflected back so that its original value is restored A negative feedback for example occurs in agriculture when an increased agricultural yield reduces prices investments are cut so that yield is reduced A positive feedback occurs when an initial change gives rise to a chain of events that amplify the original change For instance during the civil war in Colombia the level of violence displaced people from their land and this contributed to further increases in the level of violence Since the feedback is a ldquoreturn effectrdquo it originates when variables are linked by closed paths (ie circuits or loops) and its sign is negative or positive depending on the product of the signs of the links that form the loop (see Puccia amp Levins 1985 for a rigorous method for computing the feedback sign) For example in Figure 1D the arrow from A to B and the circle-head link from B to A form a closed path or loop with negative feedback because the product of the two links is negative There can be circuits of different length depending on the number of variables linked together in a closed path With these definitions we can express conceptually the algorithm of loop analysis (Puccia amp Levins 1985) The sensitivity of a variable to a press perturbation depends on (1) whether the perturbation increases (+ sign) or decreases (minus sign) the rate of change of the variable through which it enters the system (2) the sign of the path connecting the variable targeted by the press perturbation to the effect variable (the variable one wants to predict the response of ) (3) the sign of the feedback of the subsystem that remains when all variables on the path are ideally removed from the system (this is called complementary feedback) and (4) the overall feedbackmdashthat is the feedback of the circuits that connect all the variables in the system The algorithm can be summarized in the following formula
partx j
partc =sum
partf ipartc times p jiik times Fnk
Fn
(k) (comp)
in which [partfipartc] expresses whether the rate of change of the target variable xi increases or decreases because of the changing parameter c [pji
(k)] is the pathway from the target to the response variable [Fnminusk
(comp)] is the complementary feedback and [Fn] is the overall feedback Summation (sumik) occurs along all paths from the target
Human Ecology Review Volume 26 Number 2 2020
44
variable xi to the effect variable xj The complementary feedback can be envisioned as a reflecting barrier if it is negative and strong the more an impact is reflected back to the effect variable If it is positive then the effect variable changes in the opposite direction from the sign of the path The overall feedback the denominator of the formula measures the resistance of the whole system to change The responses predicted can be positive (+ increase) negative (minus decrease) or null (0 no change) and are summarized in the table of predictions (Figure 1C) The convention is that effects generated by positive perturbations (those increasing the rate of change of the target variables) on row variables can be read along the columns Consequences of negative perturbations are obtained by reversing the signs of the predictions Consider a positive press perturbation ([partfipartc] gt 0) on node A in Figure 1D If the focus is on the consequences that the press perturbation has on node B then the path is the positive link from A to B and the complementary subsystem is node C alone this latter variable does not form any circuit and the complementary feedback is null (ie equal to 0) The overall feedback is the feedback produced by the circuit that connects all the variables in the system (see Puccia amp Levins 1985 for further details) In the digraph of Figure 1D there is one single circuit that starts and ends with node A and connects all variables This circuit includes one positive and two negative interactions ArarrCndashBndashA its sign is the product of one positive and two negative links and thus it is positive
In graphs with many variables and interactions the number of paths between variables often increases which leads to several ambiguous predictions (ie the positive paths counteract negative paths so that a clear sign of the direction of change cannot be identified) To deal with such ambiguities a simulation approach can be adopted based on a random assignment of strength to each and every link coefficient To make simulations possible the signed digraph is transformed in a matrix using +1 to represent positive (arrowhead) links and minus1 to indicate negative (circle-head) links During simulations the coefficient intensities are taken from a uniform distribution in the interval (01] This means that the +1 and minus1 values in the matrix are substituted by randomly assigned values between 10-6 (the lower boundary equal to 0 is not included) and 1 while the sign is maintained Not all the matrices obtained can be used to compute the predictions but only those that satisfy criteria for stability (see Logofet 1993 for stability conditions matrices must satisfy) According to Bender et al (1984) the net effect that press perturbations targeting the row variable xi have on the column variable xj are expressed by the elements of the inverse of the matrix that is obtained from the signed digraph (for details see Levins 1975) After n simulations an overall table of predictions is constructed by combining the z matrices that are stable and allow matrix inversion For each stable matrix assembled using simulated interaction strengths unambiguous responses in the table of predictions are generated (ie the signs are certain) The overall table of predictions is composed of symbols that depend on the percentages of signs from the various simulation runs Hence if the same entry in the tables of predictions
Understanding SocialndashEcological Systems using Loop Analysis
45
from all z (stable) matrices yields the same sign (+ or minus) then the expected direction of change is unambiguous However during simulations there are cases for which divergent predictions are recorded (ie depending on the random arrangement of interaction strengths the same element in the table of predictions can show either positive or negative sign) The conversion of the outcomes from each simulation run to symbols in the overall table of predictions depends on the percentages of positive (+) and negative (minus) signs The rules to move from simulations results to the overall table of predictions are summarized in Table 1
Table 1 Rules to convert differences between percentages of signs obtained with simulations (ldquo of +rdquo ndash ldquo of ndashrdquo) into predictions (ie signs in the overall table of predictions)
ldquo of +rdquo ndash ldquo of ndashrdquo Corresponding sign in the table[minus100 minus50] minus(minus50 -20) minus (tendency to minus)[minus20 20] 0(20 50) + (tendency to +)[50 100] +0 = 100 0
Notes Round brackets indicate that the extremes are excluded 0 is not a real zero meaning no changes in the biomassabundance of variables but represents neutral results due to relatively balanced amounts of negative and positive effects When after the complete set of simulations there are entries for which the absence of any effect was always recorded then the symbol in the overall table of predictions is 0 indicating proper absence of effect (see the last row of the table 0 = 100)Source Authorsrsquo summary
Merits and limitations of loop analysis to model SESsLoop analysis is particularly suitable to investigate SESs First interconnections extend beyond the single domains of ecology economy and society to create complex networks For instance after the Nile perch invaded Lake Victoria a dramatic restructuring of the ecological community took place which in turn cascaded into deep societal and economic changes (Downing et al 2014) To disentangle drivers and dynamics of change in such a complex scenario Downing and coworkers designed an eco-social qualitative model that traced connections across disciplinary boundaries Second loop analysis educates intuition to cope with complexity Often complex systems defy our predictions and effects of policies or management interventions are at best ineffective if not damaging (Levins 1995) Failure of policies depends on the feedbacks that are produced by the linkages between the variables and that remain hidden to our comprehension if complexity does not become our central intellectual issue Cinner (2011)
Human Ecology Review Volume 26 Number 2 2020
46
in discussing problems of reef fishery emphasizes that the feedback between social and ecological variables may create socialndashecological traps (eg situations when feedbacks between social and ecological systems lead toward an undesirable state that may be difficult or impossible to reverse) It is extremely interesting to explore these phenomena by loop analysis which by disentangling feedback loops helps make the arcane obvious This capability however cannot be fully exploited if the feedback structure of the systems is not adequately represented and the relationships between the variables remain mostly unidirectional the potential may instead emerge when social and environmental variables are incorporated in a unique model (Dambacher et al 2007) Third loop analysis proposes a rigorous approach to diagnosis Diagnostic approaches are more often requested in the analysis of SESs to causally understand the multiple outcomes that can arise from the interaction of different system attributes (Kittinger et al 2013) The table of predictions the main outcome of loop analysis allows the disentangling of causative mechanisms by linking correlation patterns sources of change and network structure (Bodini amp Clerici 2016 Bodini et al 2018) For any entry point of press perturbation (any row in the table of predictions see Figure 1C) variables are predicted to change so that correlation patterns among them emerge By comparing such patterns with observed changes in the level of the variables one can identify which component is affected by external drivers and find the cause and effect mechanisms responsible for those changes due to the linkage structure Fourth loop analysis incorporates external drivers as inputs to the rate of change of the variables External drivers both social and biophysical have been described as playing an important role in SES dynamics (Kittinger et al 2013) For example in Baja California (Mexico) climate-driven hypoxia caused an excess mortality in marine species with limited mobility resulting in declines of stocks targeted by small-scale local fisheries which in turn caused small-scale fishers to switch fishing effort toward less-affected species (Micheli et al 2012) Such effect was explored in a scenario analysis using loop analysis which predicted large-scale consequences of this external driver (Martone et al 2017) Fifth the intuitive visualization of the entities and the interactions among them is suitable for accommodating the general framework proposed by Ostrom (2009) for analyzing the sustainability of SESs Each node in the digraph can be one of the four elements (ie core subsystems governance system resource users resource system and resource units) and either positive or negative links can visualize their direct relationships So far the main focus has been dedicated to the visualization of ecological variables and interactions and the inclusion of socialndasheconomic aspects has been treated as external to the system (Carey et al 2014 Espinoza-Tenorio et al 2013 Reum et al 2015) Finally the simple graphical format that constitutes the input for the loop analysis facilitates the participation of all stakeholders to model construction Although most of the current applications adopted a top-down approach to embed management strategies in models (ie literature data were consulted to define the interactions) the study of Espinoza-
Understanding SocialndashEcological Systems using Loop Analysis
47
Tenorio et al (2013) presents a valid alternative In that work both quantitative and qualitative information regarding the biological and social aspects of fisheries dynamics and management were retrieved using structured interviews with fishers participatory research key informant interviews and workshops
Limitations of the methodology should be taken into account Some limitations have already been discussed (Justus 2006) and here we focus on those that matter with the use of loop analysis in studying SESs First there can be difficulties in defining the timing of changing conditions and that of system response to impacts SESs are resilient and cope with continuous exposure to press perturbations according to adaptive dynamics principles (Folke 2006 Hughes et al 2005) The exact moment at which the system responds to a press perturbation cannot be detected with precision and the contribution of concomitant perturbations may further confound this detection Second the variables of SESs (eg resources and their users) can show asynchronous behavior and heterogeneous geographical distribution (Leslie et al 2015) Their optimization does not necessarily occur at the same temporal and spatial scale an aspect that might remain overlooked when constructing graphs The uneven geographical distribution of the actors might be addressed by including in the models different variables for the same type of user (eg various nodes that indicate the fishers and their interactions in different regions) Third there can be issues in the identification of the variables exposed to press perturbations (ie impacts of overfishing vs climate change) For example while marketing solutions (eg the introduction of ecolabels) can be easily targeted to specific user groups (eg the members of fishing cooperatives see Martone et al 2017) climate change (eg warmer winters) may affect many components of the ecological system with different time of response One possible solution is prioritizing as press perturbation targets the most responsive biological variables (eg jellyfish have faster blooming rates than expected from the body size see Nival amp Gorsky 2001) Finally loop analysis is problematic for assessing nonlinear relationships Nonlinearity can emerge by combining the impacts of pathways of different lengths Longer pathways have lower intensity than shorter ones since the interaction strengths randomly assigned during the simulations are in the interval (01] (ie the intensity of each pathway is obtained by multiplying the strength of its constitutive links that have upper bound equal to 1) To avoid penalizing the impact of longer pathways simulations could be carried out by constraining the lower limit from which interaction strengths are randomly drawn during simulations (ie by setting the lower limits of some ldquostrongrdquo interactions closer to 1) As an alternative one could include nonlinear functions to model those specific interactions that play crucial roles for the dynamics of the SES (eg by relying on previous literature data or results from specific experiments and surveys)
Human Ecology Review Volume 26 Number 2 2020
48
Comparison of loop analysis with other qualitative methods for SESsSESs form complex networks of linkages and loop analysis is designed to qualitatively predict how variables that are embedded in SESs respond to policies and management interventions (eg introduction of new regulations for the exploitation of resources market-based incentives and adoption of new marketing solutions Carey et al 2014 Dambacher et al 2007 Levin et al 2009) A limited number of applications to investigate complex SES have made use of loop analysis but the interest toward the method has taken little ground in the context of fisheries (Anthony et al 2013 Carey et al 2014 Dambacher et al 2015 Espinoza-Tenorio et al 2013 Martone et al 2017) These applications highlight that loop analysis has some potential that extends beyond its limitations For example predictions are about the equilibrium level of the variables (Justus 2006) but real systems are generally not at the equilibrium However previous studies have offered evidence that predictions from loop analysis apply successfully to changes in average values of the variables (Bodini 2000) Average values should be long term and Bodini et al (2018) showed that averages taken over either 5 or 10 years can be used to grasp variable responses to press perturbations The appropriate time scale for taking averages however very much depends on the system under investigation
Other qualitative modeling approaches can be used to study SESs Fuzzy cognitive maps (FCMs) is one of these It makes the magnitude of links explicit through a semi-quantification of the relationships that link variables (Kok 2009 Oumlzesmi amp Oumlzesmi 2004) The semi-quantification of the links may resolve the ambiguities typical of loop analysis about the net effect generated by the combination of contrasting pathways Also FCMs can make predictions about multiple simultaneous perturbations Both the state of the variables (ldquoconceptsrdquo in the technical language of FCMs) and the strength of the links (edges between the concepts) are quantified by assigning standardized values in the range [01] for states and [-11] for links Although these are relative values (ie each of them is assigned in relation to the others) some criteria for the quantification must be identified These criteria must be supported by some knowledge about the level of the variables and interactions in the system and in particular the use of FCMs seems appropriate when the estimates of variable state and link strength are the outcomes of either a combination of multiple FCMs from individual stakeholders or a set of values defined through participatory workshops The quantification of variables and interactions requires a certain level of knowledge about the system and it automatically selects the working groups among stakeholders that possess some previous understanding of the system under investigation It follows that FCMs cannot be public reproducible and intelligible in the way that loop analysis is Kok (2009) posits that vague or complex concepts such as ldquoconsumer behaviorrdquo must not be taken into account when applying FCMs
Understanding SocialndashEcological Systems using Loop Analysis
49
because guessing about their magnitude is inherently difficult On the other hand loop analysis allows including ldquoawarenessrdquo in a malaria model (Yasuoka et al 2014) ldquoenvironmental attractivenessrdquo in a tourism model (Bodini et al 2000) and the ldquorole of the unionsrdquo in a model on diabetes (Lewontin amp Levins 2007) In these aspects it seems that FCMs share one limitation with quantitative models the tendency to exclude from the analysis factors that are difficult or impossible to measure no matter if they play a role in the dynamics of the system The connections among the variables in FCMs are designed on the basis of fuzzy conditional statements (ldquoif hellip thenrdquo) that are of the type ldquoif the level of variable A is high that of variable B is lowrdquo Thus connections are deduced from correlations between the variables derived from observing the system (Stylios amp Groumpos 1999) However Levins and Puccia (1988) point out that patterns of correlation depend on the network structure and the entry point of the perturbation For example any two variables may show positive correlation in response to a specific press perturbation but opposite correlation (or no correlation) in response to other press perturbations It follows that defining interactions between variables on the basis of their correlations may be misleading In loop analysis perturbations are variations in parameters that govern the rate of change of variables For example a pollutant triggering an increase in the mortality rate of a population FCMs instead consider the changes in the level of the variables as perturbations To predict say the impacts of a pollutant that affects a population FCMs consider the reduced abundance induced by the pollutant as the initial event (ie the perturbation) on the logical assumption that a toxin by increasing the mortality of a species automatically reduces its abundance Thus the initial event is deduced from a more or less plausible linear sequence of steps This series of events overlooks the fact that the response of the target population to the increased mortality is also mediated by the network of interactions with the other variables and that accordingly often does not follow commonsense linear expectations Such assumption leads to the circular argument that FCMs predict the effects given a cause that is in turn an effect that FCMs should predict On the other hand we can be confident that the pollutant increases the mortality rate of the target population which is the initial event in loop analysis Loop analysis considers the role of the environmental variability in changing the parameters that govern the growth rates of the variables and does not interpret it solely as the cause of variable fluctuations like FCMs do
Causal loop diagrams (CLDs Hanspach et al 2014 Tenza et al 2017) and Bayesian belief networks (BBNs Borsuk et al 2004 Pollino et al 2007) have also been applied for analyzing SESs CLDs make predictions by logically reconstructing the chains of causes and effects between variables on the basis of link polarities (eg the signs of the directed links ie the effects of one variable over the other) Predicting the behavior of complex networks by identifying the feedback effects using link polarity (ie the effect associated to the link positive or negative) is difficult and can lead to misleading interpretations (Lane 2008 Richardson 1997)
Human Ecology Review Volume 26 Number 2 2020
50
Most problems originate from polarities Consider for example the case in which the level of violence displaces people from rural areas and forces them to move to the cities (Colombia is a paradigmatic example see Ibaacutentildeez amp Veacutelez 2008) The causal connections are that level of violence increases the migration rate (positive link) which in turn increases the population level in the city (positive link) Therefore the expected trend is the higher the level of violence the greater the increase of urban population However if the level of violence gets lower the migration rate is reduced but this does not reduce the population in the city as it continues to increase unless an opposite migratory flux occurs Hence the articulation of causal pathways gets difficult because variables can be both standing stocks and rates of change (Sweeney amp Sterman 2007) Similarly specifying the relevant conditional probabilities as required by BBNs can be a laborious and time-consuming process (Marcot et al 2001 Ticehurst et al 2007) Moreover to include feedback mechanisms via cyclic network structures requires dynamic time-explicit BBNs which depend on extensive parameterization Similar to FCMs combining BBNs with loop analysis has great potential for improving predictions and model validation (Anthony et al 2013 Melbourne-Thomas et al 2012 Raoux et al 2018) However it must be emphasized that these applications of BBNs are based on the signs derived from the analysis of the loop models As such their outcomes are contingent on the assumptions and limitations of signed diagraph models
Central for the understanding of the complex causality in SESs is our ability to individuate what the relevant components of the SESs are and diagram their relationships The nature of the linkages among these components determines the spreading of the effects through the system and the overall composition of the linkages generates the feedbacks that amplify or buffer such effects There is no recipe for modeling development but great effort must be devoted to assimilation of facts observations and hypotheses Increasing the reliability of predictions can be possible by designing alternative graphs This iterative procedure allows addressing uncertainty about the system structure and determining which differences matter Robust outcomes may be the effect of a core structure common to all models upon which few links added or removed cannot change radically the predictions The core structure represents the fundamental backbone composed of more certain variables and interactions Disagreements among stakeholders scientists or managers do not limit the application of loop analysis rather they offer the opportunity to involve stakeholders in a participatory model construction (Anthony et al 2013) where different types of system knowledge can be used to determine variables and links that may be important to examine further (Stier et al 2017) The adoption of such a comprehensive system-wide approach aims to formulate management strategies that reconcile ecological integrity and intergenerational equity key dimensions of the sustainable development paradigm
Understanding SocialndashEcological Systems using Loop Analysis
51
Possible developments for the application of loop analysis to SESsMaking predictions is difficult especially when we face the uncertainty associated with new unknown events changing dynamics and lack of quantitative data This is the case for example with climate change which produces completely new phenomena and dynamics In such context an adaptive management that allows for continually assessing new evidence has been called for We believe that in the new scenarios we are facing the method of loop analysis can be helpful It has the necessary adaptability to be used in changing contexts When in doubt about critical linkages and dynamic features alternative models can be developed to find out which differences matter and to reach robust conclusions It is also flexible as it allows including and discarding variables easily and above all it permits working with variables and links that are not readily measurable even though their effects are crucial However its suitability to investigate SESs can be improved in several ways The intricacy of the feedbacks can be better resolved if a specific tool for pathways analysis is developed Returning the total number of pathways and their strength between any pair of variables can show how single pathways contribute to specific effects and which ones are more important in mediating the press perturbations The question of link strength deserves attention We specified in the methodological aspects section that link strength is randomly assigned to interaction links during simulations But this does not contradict the qualitative nature of the method it only serves to assign certainty to paths and feedbacks in order to get unambiguous predictions which remain qualitative in nature as only the direction of change for the variables is predicted Pathway anatomy would help selecting those causal chains that mostly affect system dynamics Other relevant features that would improve the suitability of loop analysis for modeling SESs include (1) considering multiple simultaneous press perturbations and (2) delimiting upper and lower limits for the strength of interactions The first point is related to the fact that SESs are often exposed to different types of disturbances whose interplay gives rise to net cumulative responses that would be useful to disentangle (eg through the identification of the specific causative chains) Considering multiple press perturbations would greatly contribute to building up an effective diagnostic approach (Kittinger et al 2013) For example by loop analysis Bodini et al (2018) diagnosed that multiple press perturbations not only overfishing of small and medium pelagic species were responsible for the restructuring of the Black Sea community during the period 1960ndash1989 Moreover socioeconomic drivers amplify the impacts that are triggered by natural processes for instance both hypoxia and fisheries management affected abalone stock in the Baja California SES (Martone et al 2017) The second line of development is conceived to extend loop analysis in a semi-quantitative direction So far the simulations are performed by randomly sampling interaction strength in the uniform interval (01] There are however cases when some interactions are known
Human Ecology Review Volume 26 Number 2 2020
52
to be either strong or weak in such cases varying the strength of these linkages in the whole interval (01] does not make sense However it is difficult to translate fuzzy concepts such as strong and weak into numbers so that boundaries for the links can be set In this respect sensitivity analysis may help Either the upper (ie 1) or the lower (ie 10-6) limit of the link magnitude could be iteratively changed so that actual boundaries for certain linkages can be identified through a consistency assessment of the outcomes produced For example performing the sensitivity analysis for the strength of specific interactions might help modeling competitive advantages in the ecological domain (eg Noctiluca scintillans vs zooplankton in the Black Sea Bodini et al 2018) and power or information asymmetries between socioeconomic actors (Bousquet et al 2015) Therefore exploring alternative scenarios by constraining the strength of some interactions would be of great benefit for modeling SESs It should also be noticed that a uniform distribution is considered by default for randomly sampling the strength but it could be substituted by either normal or skewed (eg Poisson) distributions
Concluding remarksThe central issue in the study of SESs is to understand interdependencies that cross the boundaries of the classical domains in which scientific and operational knowledge have been settled Contributions in this respect are expected from tools that allow reconstructing the causal chains that give rise to such interdependencies and that involve variables or components of different nature For such reconstruction to be effective tools must overcome the barriers that make communication between domains difficult (1) the simpler the language used to describe the phenomena and the interactions the better it is (2) a lower level of technicality in the algorithms facilitates understanding the outcomes and (3) flexibility widens the range of applicability to different contexts Loop analysis shares most of these features (1) by classifying the interactions in only two categories positive and negative it facilitates creating connections between variables that differ dramatically in physical form (2) the ease by which a model can be constructed as a graph allows keeping up with rapidly changing conditions (ie variables andor links disappear and others become important) (3) the algorithm for predictions refers directly to structural features of the graph and can be visualized thus making the outcomes easier to understand and (4) it is also characterized by a wide applicability (often the question of interest is not a particular system but a whole class of systems with some similarity of structure) Furthermore loop analysis emphasizes the understanding of mechanisms which is a prime objective when an intellectual and operative framework is taking shape as in the case of SESs
Understanding SocialndashEcological Systems using Loop Analysis
53
ReferencesAnthony K R Dambacher J M Walshe T amp Beeden R (2013) A framework for
understanding cumulative impacts supporting environmental decisions and informing resilience-based management of the Great Barrier Reef World Heritage Area Australian Institute of Marine Science CSIRO NERP Decisions Hub University of Melbourne and Great Barrier Reef Marine Park Authority hdlhandlenet110172850
Bender E A Case T J amp Gilpin M E (1984) Perturbation experiments in community ecology Theory and practice Ecology 65(1) 1ndash13 doiorg1023071939452
Binder C R Hinkel J Bots P W G amp Pahl-Wostl C (2013) Comparison of frameworks for analyzing socialndashecological systems Ecology and Society 18(4) Article 26 doiorg 105751es-05551-180426
Bodini A (2000) Reconstructing trophic interactions as a tool for understanding and managing ecosystems Application to a shallow eutrophic lake Canadian Journal of Fisheries and Aquatic Sciences 57(10) 1999ndash2009 doiorg101139f00-153
Bodini A amp Clerici N (2016) Vegetation herbivores and fires in savanna ecosystems A network perspective Ecological Complexity 28 36ndash46 doiorg101016jecocom 201610001
Bodini A Ricci A amp Viaroli P (2000) A multimethodological approach for the sustainable management of perifluvial wetlands of the Po River (Italy) Environmental Management 26(1) 59ndash72 doiorg101007s002670010071
Bodini A Rocchi M amp Scotti M (2018) Insights into the ecology of the Black Sea through the qualitative loop analysis of the community structure Limnology and Oceanography 63(2) 968ndash984 doiorg101002lno10713
Borsuk M E Stow C A amp Reckhow K H (2004) A Bayesian network of eutrophication models for synthesis prediction and uncertainty analysis Ecological Modelling 173(2ndash3) 219ndash239 doiorg101016jecolmodel200308020
Bousquet F Anderies M Antona M Bassett T Benjaminsen T Bonato O hellip Vassal J-M (2015) Socio-ecological theories and empirical research Comparing socialndashecological schools of thoughts in action [Research report] CIRAD-GREEN halarchives-ouvertesfrhal-01130178
Carey M P Levin P S Townsend H Minello T J Sutton G R Francis T B hellip Ruckelshaus M (2014) Characterizing coastal foodwebs with qualitative links to bridge the gap between the theory and the practice of ecosystem-based management ICES Journal of Marine Science 71(3) 713ndash724 doiorg101093icesjmsfst012
Cinner J E (2011) Socialndashecological traps in reef fisheries Global Environmental Change 21(3) 835ndash839 doiorg101016jgloenvcha201104012
Human Ecology Review Volume 26 Number 2 2020
54
Costanza R amp Mageau M (1999) What is a healthy ecosystem Aquatic Ecology 33(1) 105ndash115 doiorg101023A1009930313242
Dambacher J M Brewer D T Dennis D M Macintyre M amp Foale S (2007) Qualitative modelling of gold mine impacts on Lihir Islandrsquos socioeconomic system and reef-edge fish community Environmental Science amp Technology 41(2) 555ndash562 doiorg 101021es0610333
Dambacher J M Rothlisberg P C amp Loneragan N R (2015) Qualitative mathematical models to support ecosystem‐based management of Australiarsquos Northern Prawn Fishery Ecological Applications 25(1) 278ndash298 doiorg10189013-20301
Downing A S van Nes E H Balirwa J S Beuving J J Bwathondi P O J Chapman L J hellip Mooij W M (2014) Coupled human and natural system dynamics as key to the sustainability of Lake Victoriarsquos ecosystem services Ecology and Society 19(4) Article 31 doiorg105751es-06965-190431
Espinoza-Tenorio A Wolff M Espejel I amp Montantildeo-Moctezuma G (2013) Using traditional ecological knowledge to improve holistic fisheries management Transdisciplinary modeling of a lagoon ecosystem of Southern Mexico Ecology and Society 18(2) Article 6 doiorg105751es-05369-180206
Folke C (2006) Resilience The emergence of a perspective for socialndashecological systems analyses Global Environmental Change 16(3) 253ndash267 doiorg101016jgloenvcha 200604002
Haines-Young R amp Potschin M (2010) The links between biodiversity ecosystem services and human well-being In D G Raffaelli amp C L Frid (Eds) Ecosystem ecology A new synthesis (pp 110ndash139) Cambridge University Press doiorg101017cbo978051175 0458007
Hanspach J Hartel T Milcu A I Mikulcak F Dorresteijn I Loos J hellip Fischer J (2014) A holistic approach to studying socialndashecological systems and its application to southern Transylvania Ecology and Society 19(4) Article 32 doiorg105751es-06915-190432
Hilborn R (2007) Defining success in fisheries and conflicts in objectives Marine Policy 31(2) 153ndash158 doiorg101016jmarpol200605014
Hughes T P Bellwood D R Folke C Steneck R S amp Wilson J (2005) New paradigms for supporting the resilience of marine ecosystems Trends in Ecology amp Evolution 20(7) 380ndash386 doiorg101016jtree200503022
Ibaacutentildeez A M amp Veacutelez C E (2008) Civil conflict and forced migration The micro determinants and welfare losses of displacement in Colombia World Development 36(4) 659ndash676 doiorg101016jworlddev200704013
Justus J (2006) Loop analysis and qualitative modeling Limitations and merits Biology and Philosophy 21(5) 647ndash666 doiorg101007s10539-006-9050-x
Understanding SocialndashEcological Systems using Loop Analysis
55
Kittinger J N Finkbeiner E M Ban N C Broad K Carr M H Cinner J E hellip Crowder L B (2013) Emerging frontiers in social-ecological systems research for sustainability of small-scale fisheries Current Opinion on Environmental Sustainability 5(3ndash4) 352ndash357 doiorg101016jcosust201306008
Kok K (2009) The potential of fuzzy cognitive maps for semi-quantitative scenario development with an example from Brazil Global Environmental Change 19(1) 122ndash133 doiorg101016jgloenvcha200808003
Lane D C (2008) The emergence and use of diagramming in system dynamics A critical account Systems Research and Behavioral Science 25(1) 3ndash23 doiorg101002sres826
Leslie H M Basurto X Nenadovic M Sievanen L Cavanaugh K C Cota-Nieto J J hellip Aburto-Oropeza O (2015) Operationalizing the social-ecological systems framework to assess sustainability Proceedings of the National Academy of Sciences of the USA 112(19) 5979ndash5984 doiorg101073pnas1414640112
Levin P S Fogarty M J Murawski S A amp Fluharty D (2009) Integrated ecosystem assessments Developing the scientific basis for ecosystem-based management of the ocean PLoS Biology 7(1) e1000014 doiorg101371journalpbio1000014
Levins R (1968) Evolution in changing environments Some theoretical explorations Princeton University Press
Levins R (1974) Discussion paper The qualitative analysis of partially specified systems Annals of the New York Academy of Sciences 231(1) 123ndash138 doiorg101111 j1749-66321974tb20562x
Levins R (1975) Evolution in communities near equilibrium In M L Cody and J M Diamond (Eds) Ecology and evolution of communities (pp 16ndash50) Harvard University Press
Levins R (1995) Preparing for uncertainty Ecosystem Health 1(1) 47ndash57
Levins R amp Puccia C J (1988) The controlling factor in biological communities Coenoses 3(3) 149ndash154 wwwjstororgstable43460977
Lewontin R C amp Levins R (2007) Educating the intuition to cope with complexity In R C Lewontin amp R Levins (Eds) Biology under the influence Dialectical essays on ecology agriculture and health (pp 183ndash198) Monthly Review Press
Logofet D (1993) Matrices and graphs Stability problems in mathematical ecology CRC Press
Long R D Charles A amp Stephenson R L (2015) Key principles of marine ecosystem-based management Marine Policy 57 53ndash60 doiorg101016jmarpol201501013
Lotze H K Lenihan H S Bourque B J Bradbury R H Cooke R G Kay M C hellip Jackson J B (2006) Depletion degradation and recovery potential of estuaries and coastal seas Science 312(5781) 1806ndash1809 doiorg101126science1128035
Human Ecology Review Volume 26 Number 2 2020
56
Marcot B G Holthausen R S Raphael M G Rowland M M amp Wisdom M J (2001) Using Bayesian belief networks to evaluate fish and wildlife population viability under land management alternatives from an environmental impact statement Forest Ecology and Management 153(1ndash3) 29ndash42 doiorg101016s0378-1127(01)00452-2
Martone R G Bodini A amp Micheli F (2017) Identifying potential consequences of natural perturbations and management decisions on a coastal fishery socialndashecological system using qualitative loop analysis Ecology and Society 22(1) Article 34 doiorg 105751 es-08825-220134
Melbourne-Thomas J Wotherspoon S Raymond B amp Constable A (2012) Comprehensive evaluation of model uncertainty in qualitative network analyses Ecological Monographs 82(4) 505ndash519 doiorg10189012-02071
Micheli F Saenz-Arroyo A Greenley A Vazquez L Espinoza Montes J A Rossetto M amp De Leo G A (2012) Evidence that marine reserves enhance resilience to climatic impacts PLoS ONE 7 e40832 doiorg101371journalpone0040832
Nival P amp Gorsky G (2001) Conditions for blooming of pelagic species In CIESM Workshop Monographs No 14mdashGelatinous zooplankton outbreaks Theory and practice (pp 23ndash27) Commission Internationale pour lrsquoExploration Scientifique de la Meacutediterraneacutee (CIESM [Mediterranean Science Commission])
Ostrom E (2009) A general framework for analyzing sustainability of social-ecological systems Science 325(5939) 419ndash422 doiorg101126science1172133
Oumlzesmi U amp Oumlzesmi S L (2004) Ecological models based on peoplersquos knowledge A multi-step fuzzy cognitive mapping approach Ecological Modelling 176(1ndash2) 43ndash64 doiorg101016jecolmodel200310027
Partelow S Fujitani M Soundararajan V amp Schluumlter A (2019) Transforming the social-ecological systems framework into a knowledge exchange and deliberation tool for comanagement Ecology and Society 24(1) Article 15 doiorg105751es-10724-240115
Pollino C A Woodberry O Nicholson A Korb K amp Hart B T (2007) Parameterisation and evaluation of a Bayesian network for use in an ecological risk assessment Environmental Modelling amp Software 22(8) 1140ndash1152 doiorg101016jenvsoft200603006
Puccia C J amp Levins R (1985) Qualitative modeling of complex systems An introduction to loop analysis and time averaging Harvard University Press
Raoux A Dambacher J M Pezy J P Mazeacute C Dauvin J C amp Niquil N (2018) Assessing cumulative sociondashecological impacts of offshore wind farm development in the Bay of Seine (English Channel) Marine Policy 89 11ndash20 doiorg101016jmarpol 201712007
Reum J C McDonald P S Ferriss B E Farrell D M Harvey C J amp Levin P S (2015) Qualitative network models in support of ecosystem approaches to bivalve aquaculture ICES Journal of Marine Science 72(8) 2278ndash2288 doiorg101093icesjms fsv119
Understanding SocialndashEcological Systems using Loop Analysis
57
Richardson G P (1997) Problems in causal loop diagrams revisited System Dynamics Review 13(3) 247ndash252 doiorg101002(sici)1099-1727(199723)133lt247aid-sdr 128gt 30co2-9
Stachowicz J J Fried H Osman R W amp Whitlatch R B (2002) Biodiversity invasion resistance and marine ecosystem function Reconciling pattern and process Ecology 83(9) 2575ndash2590 doiorg1018900012-9658(2002)083[2575birame]20co2
Stier A C Samhouri J F Gray S Martone R G Mach M E Halpern B S hellip Levin P S (2017) Integrating expert perceptions into food web conservation and management Conservation Letters 10(1) 67ndash76 doiorg101111conl12245
Stylios C D amp Groumpos P P (1999) A soft computing approach for modelling the supervisor of manufacturing systems Journal of Intelligent and Robotic Systems 26(3ndash4) 389ndash403 doiorg101023A1008165916707
Sweeney L B amp Sterman J (2007) Thinking about systems Student and teacher conceptions of natural and social systems System Dynamics Review 23(2ndash3) 285ndash311 doiorg101002sdr366
Tenza A Peacuterez I Martiacutenez-Fernaacutendez J amp Gimeacutenez A (2017) Understanding the decline and resilience loss of a long-lived social-ecological system Insights from system dynamics Ecology and Society 22(2) Article 15 doiorg105751es-09176-220215
Ticehurst J L Newham L T Rissik D Letcher R A amp Jakeman A J (2007) A Bayesian network approach for assessing the sustainability of coastal lakes in New South Wales Australia Environmental Modelling amp Software 22(8) 1129ndash1139 doiorg101016 jenvsoft 200603003
Worm B Barbier E B Beaumont N Duffy J E Folke C Halpern B S hellip Watson R (2006) Impacts of biodiversity loss on ocean ecosystem services Science 314(5800) 787ndash790 doiorg101126science1132294
Yasuoka J Jimba M amp Levins R (2014) Application of loop analysis for evaluation of malaria control interventions Malaria Journal 13 Article 140 doiorg1011861475-2875-13-140
This text is taken from Human Ecology Review Volume 26 Number 2 2020 published by ANU Press The Australian National University Canberra Australia
doiorg1022459HER2602202003
Understanding SocialndashEcological Systems using Loop Analysis
41
to sustainability considers the social aspects only at the boundaries of the natural system (Binder et al 2013 Folke 2006 Partelow et al 2019) The balanced integration of social and ecological variables within the same modeling scheme is often precluded by two factors (1) there are difficulties in the identification of the most important interactions linking the variables and (2) the mathematical form of interactions is often unknown Qualitative modeling represents a possible solution to these difficulties In particular loop analysis (Levins 1968 1974) through its simple application requirements (ie describing the presence of links and their signs) can be used to consider the interactions among variables across different domains
Loop analysis was developed to model the equilibrium levels of a system when growth rates of specific variables are altered by environmental variability Loop analysis requires that only the sign of the relationship between the variables is specifiedmdashthat is whether a variable positively or negatively affects another one This simplicity overcomes the lack of quantitative information and simplifies the semantic conversion of the concepts related to the processes in which variables take part when belonging to different domains Most of the works on SESs published so far have focused on ecosystems and considered the human component a source of external perturbations For example Bodini et al (2018) showed how overfishing affected the internal dynamics of the Black Sea but did not consider how socioeconomic drivers inflated overfishing Applications of loop analysis to SESs are gaining ground (Dambacher et al 2007 Martone et al 2017) Here we show the potential of loop analysis for the integrative modeling of SESs First we introduce the methodological aspects behind the tool Second we discuss merits and limitations of loop analysis in studying the dynamical behavior of SESs Then we compare loop analysis with other qualitative methods that can be applied to SESs Finally we present ideas of possible developments that could favor the diffusion of loop analysis in the context of SESs
Loop analysis Methodological aspectsLoop analysis is a qualitative technique for modeling complex systems as signed directed graphs Interactions are depicted as either positive or negative effects but their strength is not specified (Figure 1A) Positive interactions are illustrated by arrow-headed links while negative interactions are visualized with circle-headed links Any signed digraph has a matrix counterpart (interaction matrix) in which positive (arrowheads) and negative (circle heads) interactions are represented by the coefficients +1 and minus1 respectively Zeroes in the matrix stand for null direct relationships between any two variables (Figure 1B) The elements along the main diagonal of the interaction matrix are self-effects on the variables and correspond to self-links in the graph (ie an arrowhead or circle-head link connecting a variable
Human Ecology Review Volume 26 Number 2 2020
42
to itself ) Loop analysis allows predictions on how the variables will respond to press perturbations that target specific variables Press perturbations are forces that modify parameters in the rate of change of the variables (Bender et al 1984) such as environmental warming that enhances the reproductive rate of jellyfish or ecolabels that increase the rate at which the income of fishing cooperatives is produced There are as many targets of press perturbations as the number of variables in the system (ie any variable can represent the entry point for press perturbations) The effect of press perturbations can be predicted by analyzing the structural properties of the graph (Levins 1974 1975)
Figure 1 Signed directed graph describing (A) the Black Sea food web and (B) the corresponding matrix of interactionsNote In the graph positive interactions are denoted with arrow-headed links while negative interactions are visualized with circle-headed links Names of all variables (ie nodes in the graph) are below the matrix of interactions Loop analysis results for the Black Sea in the period 1960ndash1989 are summarized in the table of predictions (C) Additive and multiplicative rules are considered for predictions (the example here refers to a theoretical system with three variables) (D)Source Bodini et al (2018)
Understanding SocialndashEcological Systems using Loop Analysis
43
The links in signed digraphs carry a direction (eg where the arrow and the circle point to) By following this direction one can identify paths so that variables that stand far apart from one another in the system can be functionally connected With reference to Figure 1A nutrients (N) are connected to demersal fish (DF) by several paths one of which is NrarrEPrarrEZrarrPFrarrDF Paths are the routes along which effects of press perturbations travel through the system Each path carries an effect that is either positive or negative depending on the product of the signs of the links that compose the path
Next there is feedback which can be negative or positive The former is a process in which an initial change in a variable is reflected back so that its original value is restored A negative feedback for example occurs in agriculture when an increased agricultural yield reduces prices investments are cut so that yield is reduced A positive feedback occurs when an initial change gives rise to a chain of events that amplify the original change For instance during the civil war in Colombia the level of violence displaced people from their land and this contributed to further increases in the level of violence Since the feedback is a ldquoreturn effectrdquo it originates when variables are linked by closed paths (ie circuits or loops) and its sign is negative or positive depending on the product of the signs of the links that form the loop (see Puccia amp Levins 1985 for a rigorous method for computing the feedback sign) For example in Figure 1D the arrow from A to B and the circle-head link from B to A form a closed path or loop with negative feedback because the product of the two links is negative There can be circuits of different length depending on the number of variables linked together in a closed path With these definitions we can express conceptually the algorithm of loop analysis (Puccia amp Levins 1985) The sensitivity of a variable to a press perturbation depends on (1) whether the perturbation increases (+ sign) or decreases (minus sign) the rate of change of the variable through which it enters the system (2) the sign of the path connecting the variable targeted by the press perturbation to the effect variable (the variable one wants to predict the response of ) (3) the sign of the feedback of the subsystem that remains when all variables on the path are ideally removed from the system (this is called complementary feedback) and (4) the overall feedbackmdashthat is the feedback of the circuits that connect all the variables in the system The algorithm can be summarized in the following formula
partx j
partc =sum
partf ipartc times p jiik times Fnk
Fn
(k) (comp)
in which [partfipartc] expresses whether the rate of change of the target variable xi increases or decreases because of the changing parameter c [pji
(k)] is the pathway from the target to the response variable [Fnminusk
(comp)] is the complementary feedback and [Fn] is the overall feedback Summation (sumik) occurs along all paths from the target
Human Ecology Review Volume 26 Number 2 2020
44
variable xi to the effect variable xj The complementary feedback can be envisioned as a reflecting barrier if it is negative and strong the more an impact is reflected back to the effect variable If it is positive then the effect variable changes in the opposite direction from the sign of the path The overall feedback the denominator of the formula measures the resistance of the whole system to change The responses predicted can be positive (+ increase) negative (minus decrease) or null (0 no change) and are summarized in the table of predictions (Figure 1C) The convention is that effects generated by positive perturbations (those increasing the rate of change of the target variables) on row variables can be read along the columns Consequences of negative perturbations are obtained by reversing the signs of the predictions Consider a positive press perturbation ([partfipartc] gt 0) on node A in Figure 1D If the focus is on the consequences that the press perturbation has on node B then the path is the positive link from A to B and the complementary subsystem is node C alone this latter variable does not form any circuit and the complementary feedback is null (ie equal to 0) The overall feedback is the feedback produced by the circuit that connects all the variables in the system (see Puccia amp Levins 1985 for further details) In the digraph of Figure 1D there is one single circuit that starts and ends with node A and connects all variables This circuit includes one positive and two negative interactions ArarrCndashBndashA its sign is the product of one positive and two negative links and thus it is positive
In graphs with many variables and interactions the number of paths between variables often increases which leads to several ambiguous predictions (ie the positive paths counteract negative paths so that a clear sign of the direction of change cannot be identified) To deal with such ambiguities a simulation approach can be adopted based on a random assignment of strength to each and every link coefficient To make simulations possible the signed digraph is transformed in a matrix using +1 to represent positive (arrowhead) links and minus1 to indicate negative (circle-head) links During simulations the coefficient intensities are taken from a uniform distribution in the interval (01] This means that the +1 and minus1 values in the matrix are substituted by randomly assigned values between 10-6 (the lower boundary equal to 0 is not included) and 1 while the sign is maintained Not all the matrices obtained can be used to compute the predictions but only those that satisfy criteria for stability (see Logofet 1993 for stability conditions matrices must satisfy) According to Bender et al (1984) the net effect that press perturbations targeting the row variable xi have on the column variable xj are expressed by the elements of the inverse of the matrix that is obtained from the signed digraph (for details see Levins 1975) After n simulations an overall table of predictions is constructed by combining the z matrices that are stable and allow matrix inversion For each stable matrix assembled using simulated interaction strengths unambiguous responses in the table of predictions are generated (ie the signs are certain) The overall table of predictions is composed of symbols that depend on the percentages of signs from the various simulation runs Hence if the same entry in the tables of predictions
Understanding SocialndashEcological Systems using Loop Analysis
45
from all z (stable) matrices yields the same sign (+ or minus) then the expected direction of change is unambiguous However during simulations there are cases for which divergent predictions are recorded (ie depending on the random arrangement of interaction strengths the same element in the table of predictions can show either positive or negative sign) The conversion of the outcomes from each simulation run to symbols in the overall table of predictions depends on the percentages of positive (+) and negative (minus) signs The rules to move from simulations results to the overall table of predictions are summarized in Table 1
Table 1 Rules to convert differences between percentages of signs obtained with simulations (ldquo of +rdquo ndash ldquo of ndashrdquo) into predictions (ie signs in the overall table of predictions)
ldquo of +rdquo ndash ldquo of ndashrdquo Corresponding sign in the table[minus100 minus50] minus(minus50 -20) minus (tendency to minus)[minus20 20] 0(20 50) + (tendency to +)[50 100] +0 = 100 0
Notes Round brackets indicate that the extremes are excluded 0 is not a real zero meaning no changes in the biomassabundance of variables but represents neutral results due to relatively balanced amounts of negative and positive effects When after the complete set of simulations there are entries for which the absence of any effect was always recorded then the symbol in the overall table of predictions is 0 indicating proper absence of effect (see the last row of the table 0 = 100)Source Authorsrsquo summary
Merits and limitations of loop analysis to model SESsLoop analysis is particularly suitable to investigate SESs First interconnections extend beyond the single domains of ecology economy and society to create complex networks For instance after the Nile perch invaded Lake Victoria a dramatic restructuring of the ecological community took place which in turn cascaded into deep societal and economic changes (Downing et al 2014) To disentangle drivers and dynamics of change in such a complex scenario Downing and coworkers designed an eco-social qualitative model that traced connections across disciplinary boundaries Second loop analysis educates intuition to cope with complexity Often complex systems defy our predictions and effects of policies or management interventions are at best ineffective if not damaging (Levins 1995) Failure of policies depends on the feedbacks that are produced by the linkages between the variables and that remain hidden to our comprehension if complexity does not become our central intellectual issue Cinner (2011)
Human Ecology Review Volume 26 Number 2 2020
46
in discussing problems of reef fishery emphasizes that the feedback between social and ecological variables may create socialndashecological traps (eg situations when feedbacks between social and ecological systems lead toward an undesirable state that may be difficult or impossible to reverse) It is extremely interesting to explore these phenomena by loop analysis which by disentangling feedback loops helps make the arcane obvious This capability however cannot be fully exploited if the feedback structure of the systems is not adequately represented and the relationships between the variables remain mostly unidirectional the potential may instead emerge when social and environmental variables are incorporated in a unique model (Dambacher et al 2007) Third loop analysis proposes a rigorous approach to diagnosis Diagnostic approaches are more often requested in the analysis of SESs to causally understand the multiple outcomes that can arise from the interaction of different system attributes (Kittinger et al 2013) The table of predictions the main outcome of loop analysis allows the disentangling of causative mechanisms by linking correlation patterns sources of change and network structure (Bodini amp Clerici 2016 Bodini et al 2018) For any entry point of press perturbation (any row in the table of predictions see Figure 1C) variables are predicted to change so that correlation patterns among them emerge By comparing such patterns with observed changes in the level of the variables one can identify which component is affected by external drivers and find the cause and effect mechanisms responsible for those changes due to the linkage structure Fourth loop analysis incorporates external drivers as inputs to the rate of change of the variables External drivers both social and biophysical have been described as playing an important role in SES dynamics (Kittinger et al 2013) For example in Baja California (Mexico) climate-driven hypoxia caused an excess mortality in marine species with limited mobility resulting in declines of stocks targeted by small-scale local fisheries which in turn caused small-scale fishers to switch fishing effort toward less-affected species (Micheli et al 2012) Such effect was explored in a scenario analysis using loop analysis which predicted large-scale consequences of this external driver (Martone et al 2017) Fifth the intuitive visualization of the entities and the interactions among them is suitable for accommodating the general framework proposed by Ostrom (2009) for analyzing the sustainability of SESs Each node in the digraph can be one of the four elements (ie core subsystems governance system resource users resource system and resource units) and either positive or negative links can visualize their direct relationships So far the main focus has been dedicated to the visualization of ecological variables and interactions and the inclusion of socialndasheconomic aspects has been treated as external to the system (Carey et al 2014 Espinoza-Tenorio et al 2013 Reum et al 2015) Finally the simple graphical format that constitutes the input for the loop analysis facilitates the participation of all stakeholders to model construction Although most of the current applications adopted a top-down approach to embed management strategies in models (ie literature data were consulted to define the interactions) the study of Espinoza-
Understanding SocialndashEcological Systems using Loop Analysis
47
Tenorio et al (2013) presents a valid alternative In that work both quantitative and qualitative information regarding the biological and social aspects of fisheries dynamics and management were retrieved using structured interviews with fishers participatory research key informant interviews and workshops
Limitations of the methodology should be taken into account Some limitations have already been discussed (Justus 2006) and here we focus on those that matter with the use of loop analysis in studying SESs First there can be difficulties in defining the timing of changing conditions and that of system response to impacts SESs are resilient and cope with continuous exposure to press perturbations according to adaptive dynamics principles (Folke 2006 Hughes et al 2005) The exact moment at which the system responds to a press perturbation cannot be detected with precision and the contribution of concomitant perturbations may further confound this detection Second the variables of SESs (eg resources and their users) can show asynchronous behavior and heterogeneous geographical distribution (Leslie et al 2015) Their optimization does not necessarily occur at the same temporal and spatial scale an aspect that might remain overlooked when constructing graphs The uneven geographical distribution of the actors might be addressed by including in the models different variables for the same type of user (eg various nodes that indicate the fishers and their interactions in different regions) Third there can be issues in the identification of the variables exposed to press perturbations (ie impacts of overfishing vs climate change) For example while marketing solutions (eg the introduction of ecolabels) can be easily targeted to specific user groups (eg the members of fishing cooperatives see Martone et al 2017) climate change (eg warmer winters) may affect many components of the ecological system with different time of response One possible solution is prioritizing as press perturbation targets the most responsive biological variables (eg jellyfish have faster blooming rates than expected from the body size see Nival amp Gorsky 2001) Finally loop analysis is problematic for assessing nonlinear relationships Nonlinearity can emerge by combining the impacts of pathways of different lengths Longer pathways have lower intensity than shorter ones since the interaction strengths randomly assigned during the simulations are in the interval (01] (ie the intensity of each pathway is obtained by multiplying the strength of its constitutive links that have upper bound equal to 1) To avoid penalizing the impact of longer pathways simulations could be carried out by constraining the lower limit from which interaction strengths are randomly drawn during simulations (ie by setting the lower limits of some ldquostrongrdquo interactions closer to 1) As an alternative one could include nonlinear functions to model those specific interactions that play crucial roles for the dynamics of the SES (eg by relying on previous literature data or results from specific experiments and surveys)
Human Ecology Review Volume 26 Number 2 2020
48
Comparison of loop analysis with other qualitative methods for SESsSESs form complex networks of linkages and loop analysis is designed to qualitatively predict how variables that are embedded in SESs respond to policies and management interventions (eg introduction of new regulations for the exploitation of resources market-based incentives and adoption of new marketing solutions Carey et al 2014 Dambacher et al 2007 Levin et al 2009) A limited number of applications to investigate complex SES have made use of loop analysis but the interest toward the method has taken little ground in the context of fisheries (Anthony et al 2013 Carey et al 2014 Dambacher et al 2015 Espinoza-Tenorio et al 2013 Martone et al 2017) These applications highlight that loop analysis has some potential that extends beyond its limitations For example predictions are about the equilibrium level of the variables (Justus 2006) but real systems are generally not at the equilibrium However previous studies have offered evidence that predictions from loop analysis apply successfully to changes in average values of the variables (Bodini 2000) Average values should be long term and Bodini et al (2018) showed that averages taken over either 5 or 10 years can be used to grasp variable responses to press perturbations The appropriate time scale for taking averages however very much depends on the system under investigation
Other qualitative modeling approaches can be used to study SESs Fuzzy cognitive maps (FCMs) is one of these It makes the magnitude of links explicit through a semi-quantification of the relationships that link variables (Kok 2009 Oumlzesmi amp Oumlzesmi 2004) The semi-quantification of the links may resolve the ambiguities typical of loop analysis about the net effect generated by the combination of contrasting pathways Also FCMs can make predictions about multiple simultaneous perturbations Both the state of the variables (ldquoconceptsrdquo in the technical language of FCMs) and the strength of the links (edges between the concepts) are quantified by assigning standardized values in the range [01] for states and [-11] for links Although these are relative values (ie each of them is assigned in relation to the others) some criteria for the quantification must be identified These criteria must be supported by some knowledge about the level of the variables and interactions in the system and in particular the use of FCMs seems appropriate when the estimates of variable state and link strength are the outcomes of either a combination of multiple FCMs from individual stakeholders or a set of values defined through participatory workshops The quantification of variables and interactions requires a certain level of knowledge about the system and it automatically selects the working groups among stakeholders that possess some previous understanding of the system under investigation It follows that FCMs cannot be public reproducible and intelligible in the way that loop analysis is Kok (2009) posits that vague or complex concepts such as ldquoconsumer behaviorrdquo must not be taken into account when applying FCMs
Understanding SocialndashEcological Systems using Loop Analysis
49
because guessing about their magnitude is inherently difficult On the other hand loop analysis allows including ldquoawarenessrdquo in a malaria model (Yasuoka et al 2014) ldquoenvironmental attractivenessrdquo in a tourism model (Bodini et al 2000) and the ldquorole of the unionsrdquo in a model on diabetes (Lewontin amp Levins 2007) In these aspects it seems that FCMs share one limitation with quantitative models the tendency to exclude from the analysis factors that are difficult or impossible to measure no matter if they play a role in the dynamics of the system The connections among the variables in FCMs are designed on the basis of fuzzy conditional statements (ldquoif hellip thenrdquo) that are of the type ldquoif the level of variable A is high that of variable B is lowrdquo Thus connections are deduced from correlations between the variables derived from observing the system (Stylios amp Groumpos 1999) However Levins and Puccia (1988) point out that patterns of correlation depend on the network structure and the entry point of the perturbation For example any two variables may show positive correlation in response to a specific press perturbation but opposite correlation (or no correlation) in response to other press perturbations It follows that defining interactions between variables on the basis of their correlations may be misleading In loop analysis perturbations are variations in parameters that govern the rate of change of variables For example a pollutant triggering an increase in the mortality rate of a population FCMs instead consider the changes in the level of the variables as perturbations To predict say the impacts of a pollutant that affects a population FCMs consider the reduced abundance induced by the pollutant as the initial event (ie the perturbation) on the logical assumption that a toxin by increasing the mortality of a species automatically reduces its abundance Thus the initial event is deduced from a more or less plausible linear sequence of steps This series of events overlooks the fact that the response of the target population to the increased mortality is also mediated by the network of interactions with the other variables and that accordingly often does not follow commonsense linear expectations Such assumption leads to the circular argument that FCMs predict the effects given a cause that is in turn an effect that FCMs should predict On the other hand we can be confident that the pollutant increases the mortality rate of the target population which is the initial event in loop analysis Loop analysis considers the role of the environmental variability in changing the parameters that govern the growth rates of the variables and does not interpret it solely as the cause of variable fluctuations like FCMs do
Causal loop diagrams (CLDs Hanspach et al 2014 Tenza et al 2017) and Bayesian belief networks (BBNs Borsuk et al 2004 Pollino et al 2007) have also been applied for analyzing SESs CLDs make predictions by logically reconstructing the chains of causes and effects between variables on the basis of link polarities (eg the signs of the directed links ie the effects of one variable over the other) Predicting the behavior of complex networks by identifying the feedback effects using link polarity (ie the effect associated to the link positive or negative) is difficult and can lead to misleading interpretations (Lane 2008 Richardson 1997)
Human Ecology Review Volume 26 Number 2 2020
50
Most problems originate from polarities Consider for example the case in which the level of violence displaces people from rural areas and forces them to move to the cities (Colombia is a paradigmatic example see Ibaacutentildeez amp Veacutelez 2008) The causal connections are that level of violence increases the migration rate (positive link) which in turn increases the population level in the city (positive link) Therefore the expected trend is the higher the level of violence the greater the increase of urban population However if the level of violence gets lower the migration rate is reduced but this does not reduce the population in the city as it continues to increase unless an opposite migratory flux occurs Hence the articulation of causal pathways gets difficult because variables can be both standing stocks and rates of change (Sweeney amp Sterman 2007) Similarly specifying the relevant conditional probabilities as required by BBNs can be a laborious and time-consuming process (Marcot et al 2001 Ticehurst et al 2007) Moreover to include feedback mechanisms via cyclic network structures requires dynamic time-explicit BBNs which depend on extensive parameterization Similar to FCMs combining BBNs with loop analysis has great potential for improving predictions and model validation (Anthony et al 2013 Melbourne-Thomas et al 2012 Raoux et al 2018) However it must be emphasized that these applications of BBNs are based on the signs derived from the analysis of the loop models As such their outcomes are contingent on the assumptions and limitations of signed diagraph models
Central for the understanding of the complex causality in SESs is our ability to individuate what the relevant components of the SESs are and diagram their relationships The nature of the linkages among these components determines the spreading of the effects through the system and the overall composition of the linkages generates the feedbacks that amplify or buffer such effects There is no recipe for modeling development but great effort must be devoted to assimilation of facts observations and hypotheses Increasing the reliability of predictions can be possible by designing alternative graphs This iterative procedure allows addressing uncertainty about the system structure and determining which differences matter Robust outcomes may be the effect of a core structure common to all models upon which few links added or removed cannot change radically the predictions The core structure represents the fundamental backbone composed of more certain variables and interactions Disagreements among stakeholders scientists or managers do not limit the application of loop analysis rather they offer the opportunity to involve stakeholders in a participatory model construction (Anthony et al 2013) where different types of system knowledge can be used to determine variables and links that may be important to examine further (Stier et al 2017) The adoption of such a comprehensive system-wide approach aims to formulate management strategies that reconcile ecological integrity and intergenerational equity key dimensions of the sustainable development paradigm
Understanding SocialndashEcological Systems using Loop Analysis
51
Possible developments for the application of loop analysis to SESsMaking predictions is difficult especially when we face the uncertainty associated with new unknown events changing dynamics and lack of quantitative data This is the case for example with climate change which produces completely new phenomena and dynamics In such context an adaptive management that allows for continually assessing new evidence has been called for We believe that in the new scenarios we are facing the method of loop analysis can be helpful It has the necessary adaptability to be used in changing contexts When in doubt about critical linkages and dynamic features alternative models can be developed to find out which differences matter and to reach robust conclusions It is also flexible as it allows including and discarding variables easily and above all it permits working with variables and links that are not readily measurable even though their effects are crucial However its suitability to investigate SESs can be improved in several ways The intricacy of the feedbacks can be better resolved if a specific tool for pathways analysis is developed Returning the total number of pathways and their strength between any pair of variables can show how single pathways contribute to specific effects and which ones are more important in mediating the press perturbations The question of link strength deserves attention We specified in the methodological aspects section that link strength is randomly assigned to interaction links during simulations But this does not contradict the qualitative nature of the method it only serves to assign certainty to paths and feedbacks in order to get unambiguous predictions which remain qualitative in nature as only the direction of change for the variables is predicted Pathway anatomy would help selecting those causal chains that mostly affect system dynamics Other relevant features that would improve the suitability of loop analysis for modeling SESs include (1) considering multiple simultaneous press perturbations and (2) delimiting upper and lower limits for the strength of interactions The first point is related to the fact that SESs are often exposed to different types of disturbances whose interplay gives rise to net cumulative responses that would be useful to disentangle (eg through the identification of the specific causative chains) Considering multiple press perturbations would greatly contribute to building up an effective diagnostic approach (Kittinger et al 2013) For example by loop analysis Bodini et al (2018) diagnosed that multiple press perturbations not only overfishing of small and medium pelagic species were responsible for the restructuring of the Black Sea community during the period 1960ndash1989 Moreover socioeconomic drivers amplify the impacts that are triggered by natural processes for instance both hypoxia and fisheries management affected abalone stock in the Baja California SES (Martone et al 2017) The second line of development is conceived to extend loop analysis in a semi-quantitative direction So far the simulations are performed by randomly sampling interaction strength in the uniform interval (01] There are however cases when some interactions are known
Human Ecology Review Volume 26 Number 2 2020
52
to be either strong or weak in such cases varying the strength of these linkages in the whole interval (01] does not make sense However it is difficult to translate fuzzy concepts such as strong and weak into numbers so that boundaries for the links can be set In this respect sensitivity analysis may help Either the upper (ie 1) or the lower (ie 10-6) limit of the link magnitude could be iteratively changed so that actual boundaries for certain linkages can be identified through a consistency assessment of the outcomes produced For example performing the sensitivity analysis for the strength of specific interactions might help modeling competitive advantages in the ecological domain (eg Noctiluca scintillans vs zooplankton in the Black Sea Bodini et al 2018) and power or information asymmetries between socioeconomic actors (Bousquet et al 2015) Therefore exploring alternative scenarios by constraining the strength of some interactions would be of great benefit for modeling SESs It should also be noticed that a uniform distribution is considered by default for randomly sampling the strength but it could be substituted by either normal or skewed (eg Poisson) distributions
Concluding remarksThe central issue in the study of SESs is to understand interdependencies that cross the boundaries of the classical domains in which scientific and operational knowledge have been settled Contributions in this respect are expected from tools that allow reconstructing the causal chains that give rise to such interdependencies and that involve variables or components of different nature For such reconstruction to be effective tools must overcome the barriers that make communication between domains difficult (1) the simpler the language used to describe the phenomena and the interactions the better it is (2) a lower level of technicality in the algorithms facilitates understanding the outcomes and (3) flexibility widens the range of applicability to different contexts Loop analysis shares most of these features (1) by classifying the interactions in only two categories positive and negative it facilitates creating connections between variables that differ dramatically in physical form (2) the ease by which a model can be constructed as a graph allows keeping up with rapidly changing conditions (ie variables andor links disappear and others become important) (3) the algorithm for predictions refers directly to structural features of the graph and can be visualized thus making the outcomes easier to understand and (4) it is also characterized by a wide applicability (often the question of interest is not a particular system but a whole class of systems with some similarity of structure) Furthermore loop analysis emphasizes the understanding of mechanisms which is a prime objective when an intellectual and operative framework is taking shape as in the case of SESs
Understanding SocialndashEcological Systems using Loop Analysis
53
ReferencesAnthony K R Dambacher J M Walshe T amp Beeden R (2013) A framework for
understanding cumulative impacts supporting environmental decisions and informing resilience-based management of the Great Barrier Reef World Heritage Area Australian Institute of Marine Science CSIRO NERP Decisions Hub University of Melbourne and Great Barrier Reef Marine Park Authority hdlhandlenet110172850
Bender E A Case T J amp Gilpin M E (1984) Perturbation experiments in community ecology Theory and practice Ecology 65(1) 1ndash13 doiorg1023071939452
Binder C R Hinkel J Bots P W G amp Pahl-Wostl C (2013) Comparison of frameworks for analyzing socialndashecological systems Ecology and Society 18(4) Article 26 doiorg 105751es-05551-180426
Bodini A (2000) Reconstructing trophic interactions as a tool for understanding and managing ecosystems Application to a shallow eutrophic lake Canadian Journal of Fisheries and Aquatic Sciences 57(10) 1999ndash2009 doiorg101139f00-153
Bodini A amp Clerici N (2016) Vegetation herbivores and fires in savanna ecosystems A network perspective Ecological Complexity 28 36ndash46 doiorg101016jecocom 201610001
Bodini A Ricci A amp Viaroli P (2000) A multimethodological approach for the sustainable management of perifluvial wetlands of the Po River (Italy) Environmental Management 26(1) 59ndash72 doiorg101007s002670010071
Bodini A Rocchi M amp Scotti M (2018) Insights into the ecology of the Black Sea through the qualitative loop analysis of the community structure Limnology and Oceanography 63(2) 968ndash984 doiorg101002lno10713
Borsuk M E Stow C A amp Reckhow K H (2004) A Bayesian network of eutrophication models for synthesis prediction and uncertainty analysis Ecological Modelling 173(2ndash3) 219ndash239 doiorg101016jecolmodel200308020
Bousquet F Anderies M Antona M Bassett T Benjaminsen T Bonato O hellip Vassal J-M (2015) Socio-ecological theories and empirical research Comparing socialndashecological schools of thoughts in action [Research report] CIRAD-GREEN halarchives-ouvertesfrhal-01130178
Carey M P Levin P S Townsend H Minello T J Sutton G R Francis T B hellip Ruckelshaus M (2014) Characterizing coastal foodwebs with qualitative links to bridge the gap between the theory and the practice of ecosystem-based management ICES Journal of Marine Science 71(3) 713ndash724 doiorg101093icesjmsfst012
Cinner J E (2011) Socialndashecological traps in reef fisheries Global Environmental Change 21(3) 835ndash839 doiorg101016jgloenvcha201104012
Human Ecology Review Volume 26 Number 2 2020
54
Costanza R amp Mageau M (1999) What is a healthy ecosystem Aquatic Ecology 33(1) 105ndash115 doiorg101023A1009930313242
Dambacher J M Brewer D T Dennis D M Macintyre M amp Foale S (2007) Qualitative modelling of gold mine impacts on Lihir Islandrsquos socioeconomic system and reef-edge fish community Environmental Science amp Technology 41(2) 555ndash562 doiorg 101021es0610333
Dambacher J M Rothlisberg P C amp Loneragan N R (2015) Qualitative mathematical models to support ecosystem‐based management of Australiarsquos Northern Prawn Fishery Ecological Applications 25(1) 278ndash298 doiorg10189013-20301
Downing A S van Nes E H Balirwa J S Beuving J J Bwathondi P O J Chapman L J hellip Mooij W M (2014) Coupled human and natural system dynamics as key to the sustainability of Lake Victoriarsquos ecosystem services Ecology and Society 19(4) Article 31 doiorg105751es-06965-190431
Espinoza-Tenorio A Wolff M Espejel I amp Montantildeo-Moctezuma G (2013) Using traditional ecological knowledge to improve holistic fisheries management Transdisciplinary modeling of a lagoon ecosystem of Southern Mexico Ecology and Society 18(2) Article 6 doiorg105751es-05369-180206
Folke C (2006) Resilience The emergence of a perspective for socialndashecological systems analyses Global Environmental Change 16(3) 253ndash267 doiorg101016jgloenvcha 200604002
Haines-Young R amp Potschin M (2010) The links between biodiversity ecosystem services and human well-being In D G Raffaelli amp C L Frid (Eds) Ecosystem ecology A new synthesis (pp 110ndash139) Cambridge University Press doiorg101017cbo978051175 0458007
Hanspach J Hartel T Milcu A I Mikulcak F Dorresteijn I Loos J hellip Fischer J (2014) A holistic approach to studying socialndashecological systems and its application to southern Transylvania Ecology and Society 19(4) Article 32 doiorg105751es-06915-190432
Hilborn R (2007) Defining success in fisheries and conflicts in objectives Marine Policy 31(2) 153ndash158 doiorg101016jmarpol200605014
Hughes T P Bellwood D R Folke C Steneck R S amp Wilson J (2005) New paradigms for supporting the resilience of marine ecosystems Trends in Ecology amp Evolution 20(7) 380ndash386 doiorg101016jtree200503022
Ibaacutentildeez A M amp Veacutelez C E (2008) Civil conflict and forced migration The micro determinants and welfare losses of displacement in Colombia World Development 36(4) 659ndash676 doiorg101016jworlddev200704013
Justus J (2006) Loop analysis and qualitative modeling Limitations and merits Biology and Philosophy 21(5) 647ndash666 doiorg101007s10539-006-9050-x
Understanding SocialndashEcological Systems using Loop Analysis
55
Kittinger J N Finkbeiner E M Ban N C Broad K Carr M H Cinner J E hellip Crowder L B (2013) Emerging frontiers in social-ecological systems research for sustainability of small-scale fisheries Current Opinion on Environmental Sustainability 5(3ndash4) 352ndash357 doiorg101016jcosust201306008
Kok K (2009) The potential of fuzzy cognitive maps for semi-quantitative scenario development with an example from Brazil Global Environmental Change 19(1) 122ndash133 doiorg101016jgloenvcha200808003
Lane D C (2008) The emergence and use of diagramming in system dynamics A critical account Systems Research and Behavioral Science 25(1) 3ndash23 doiorg101002sres826
Leslie H M Basurto X Nenadovic M Sievanen L Cavanaugh K C Cota-Nieto J J hellip Aburto-Oropeza O (2015) Operationalizing the social-ecological systems framework to assess sustainability Proceedings of the National Academy of Sciences of the USA 112(19) 5979ndash5984 doiorg101073pnas1414640112
Levin P S Fogarty M J Murawski S A amp Fluharty D (2009) Integrated ecosystem assessments Developing the scientific basis for ecosystem-based management of the ocean PLoS Biology 7(1) e1000014 doiorg101371journalpbio1000014
Levins R (1968) Evolution in changing environments Some theoretical explorations Princeton University Press
Levins R (1974) Discussion paper The qualitative analysis of partially specified systems Annals of the New York Academy of Sciences 231(1) 123ndash138 doiorg101111 j1749-66321974tb20562x
Levins R (1975) Evolution in communities near equilibrium In M L Cody and J M Diamond (Eds) Ecology and evolution of communities (pp 16ndash50) Harvard University Press
Levins R (1995) Preparing for uncertainty Ecosystem Health 1(1) 47ndash57
Levins R amp Puccia C J (1988) The controlling factor in biological communities Coenoses 3(3) 149ndash154 wwwjstororgstable43460977
Lewontin R C amp Levins R (2007) Educating the intuition to cope with complexity In R C Lewontin amp R Levins (Eds) Biology under the influence Dialectical essays on ecology agriculture and health (pp 183ndash198) Monthly Review Press
Logofet D (1993) Matrices and graphs Stability problems in mathematical ecology CRC Press
Long R D Charles A amp Stephenson R L (2015) Key principles of marine ecosystem-based management Marine Policy 57 53ndash60 doiorg101016jmarpol201501013
Lotze H K Lenihan H S Bourque B J Bradbury R H Cooke R G Kay M C hellip Jackson J B (2006) Depletion degradation and recovery potential of estuaries and coastal seas Science 312(5781) 1806ndash1809 doiorg101126science1128035
Human Ecology Review Volume 26 Number 2 2020
56
Marcot B G Holthausen R S Raphael M G Rowland M M amp Wisdom M J (2001) Using Bayesian belief networks to evaluate fish and wildlife population viability under land management alternatives from an environmental impact statement Forest Ecology and Management 153(1ndash3) 29ndash42 doiorg101016s0378-1127(01)00452-2
Martone R G Bodini A amp Micheli F (2017) Identifying potential consequences of natural perturbations and management decisions on a coastal fishery socialndashecological system using qualitative loop analysis Ecology and Society 22(1) Article 34 doiorg 105751 es-08825-220134
Melbourne-Thomas J Wotherspoon S Raymond B amp Constable A (2012) Comprehensive evaluation of model uncertainty in qualitative network analyses Ecological Monographs 82(4) 505ndash519 doiorg10189012-02071
Micheli F Saenz-Arroyo A Greenley A Vazquez L Espinoza Montes J A Rossetto M amp De Leo G A (2012) Evidence that marine reserves enhance resilience to climatic impacts PLoS ONE 7 e40832 doiorg101371journalpone0040832
Nival P amp Gorsky G (2001) Conditions for blooming of pelagic species In CIESM Workshop Monographs No 14mdashGelatinous zooplankton outbreaks Theory and practice (pp 23ndash27) Commission Internationale pour lrsquoExploration Scientifique de la Meacutediterraneacutee (CIESM [Mediterranean Science Commission])
Ostrom E (2009) A general framework for analyzing sustainability of social-ecological systems Science 325(5939) 419ndash422 doiorg101126science1172133
Oumlzesmi U amp Oumlzesmi S L (2004) Ecological models based on peoplersquos knowledge A multi-step fuzzy cognitive mapping approach Ecological Modelling 176(1ndash2) 43ndash64 doiorg101016jecolmodel200310027
Partelow S Fujitani M Soundararajan V amp Schluumlter A (2019) Transforming the social-ecological systems framework into a knowledge exchange and deliberation tool for comanagement Ecology and Society 24(1) Article 15 doiorg105751es-10724-240115
Pollino C A Woodberry O Nicholson A Korb K amp Hart B T (2007) Parameterisation and evaluation of a Bayesian network for use in an ecological risk assessment Environmental Modelling amp Software 22(8) 1140ndash1152 doiorg101016jenvsoft200603006
Puccia C J amp Levins R (1985) Qualitative modeling of complex systems An introduction to loop analysis and time averaging Harvard University Press
Raoux A Dambacher J M Pezy J P Mazeacute C Dauvin J C amp Niquil N (2018) Assessing cumulative sociondashecological impacts of offshore wind farm development in the Bay of Seine (English Channel) Marine Policy 89 11ndash20 doiorg101016jmarpol 201712007
Reum J C McDonald P S Ferriss B E Farrell D M Harvey C J amp Levin P S (2015) Qualitative network models in support of ecosystem approaches to bivalve aquaculture ICES Journal of Marine Science 72(8) 2278ndash2288 doiorg101093icesjms fsv119
Understanding SocialndashEcological Systems using Loop Analysis
57
Richardson G P (1997) Problems in causal loop diagrams revisited System Dynamics Review 13(3) 247ndash252 doiorg101002(sici)1099-1727(199723)133lt247aid-sdr 128gt 30co2-9
Stachowicz J J Fried H Osman R W amp Whitlatch R B (2002) Biodiversity invasion resistance and marine ecosystem function Reconciling pattern and process Ecology 83(9) 2575ndash2590 doiorg1018900012-9658(2002)083[2575birame]20co2
Stier A C Samhouri J F Gray S Martone R G Mach M E Halpern B S hellip Levin P S (2017) Integrating expert perceptions into food web conservation and management Conservation Letters 10(1) 67ndash76 doiorg101111conl12245
Stylios C D amp Groumpos P P (1999) A soft computing approach for modelling the supervisor of manufacturing systems Journal of Intelligent and Robotic Systems 26(3ndash4) 389ndash403 doiorg101023A1008165916707
Sweeney L B amp Sterman J (2007) Thinking about systems Student and teacher conceptions of natural and social systems System Dynamics Review 23(2ndash3) 285ndash311 doiorg101002sdr366
Tenza A Peacuterez I Martiacutenez-Fernaacutendez J amp Gimeacutenez A (2017) Understanding the decline and resilience loss of a long-lived social-ecological system Insights from system dynamics Ecology and Society 22(2) Article 15 doiorg105751es-09176-220215
Ticehurst J L Newham L T Rissik D Letcher R A amp Jakeman A J (2007) A Bayesian network approach for assessing the sustainability of coastal lakes in New South Wales Australia Environmental Modelling amp Software 22(8) 1129ndash1139 doiorg101016 jenvsoft 200603003
Worm B Barbier E B Beaumont N Duffy J E Folke C Halpern B S hellip Watson R (2006) Impacts of biodiversity loss on ocean ecosystem services Science 314(5800) 787ndash790 doiorg101126science1132294
Yasuoka J Jimba M amp Levins R (2014) Application of loop analysis for evaluation of malaria control interventions Malaria Journal 13 Article 140 doiorg1011861475-2875-13-140
This text is taken from Human Ecology Review Volume 26 Number 2 2020 published by ANU Press The Australian National University Canberra Australia
doiorg1022459HER2602202003

Human Ecology Review Volume 26 Number 2 2020
42
to itself ) Loop analysis allows predictions on how the variables will respond to press perturbations that target specific variables Press perturbations are forces that modify parameters in the rate of change of the variables (Bender et al 1984) such as environmental warming that enhances the reproductive rate of jellyfish or ecolabels that increase the rate at which the income of fishing cooperatives is produced There are as many targets of press perturbations as the number of variables in the system (ie any variable can represent the entry point for press perturbations) The effect of press perturbations can be predicted by analyzing the structural properties of the graph (Levins 1974 1975)
Figure 1 Signed directed graph describing (A) the Black Sea food web and (B) the corresponding matrix of interactionsNote In the graph positive interactions are denoted with arrow-headed links while negative interactions are visualized with circle-headed links Names of all variables (ie nodes in the graph) are below the matrix of interactions Loop analysis results for the Black Sea in the period 1960ndash1989 are summarized in the table of predictions (C) Additive and multiplicative rules are considered for predictions (the example here refers to a theoretical system with three variables) (D)Source Bodini et al (2018)
Understanding SocialndashEcological Systems using Loop Analysis
43
The links in signed digraphs carry a direction (eg where the arrow and the circle point to) By following this direction one can identify paths so that variables that stand far apart from one another in the system can be functionally connected With reference to Figure 1A nutrients (N) are connected to demersal fish (DF) by several paths one of which is NrarrEPrarrEZrarrPFrarrDF Paths are the routes along which effects of press perturbations travel through the system Each path carries an effect that is either positive or negative depending on the product of the signs of the links that compose the path
Next there is feedback which can be negative or positive The former is a process in which an initial change in a variable is reflected back so that its original value is restored A negative feedback for example occurs in agriculture when an increased agricultural yield reduces prices investments are cut so that yield is reduced A positive feedback occurs when an initial change gives rise to a chain of events that amplify the original change For instance during the civil war in Colombia the level of violence displaced people from their land and this contributed to further increases in the level of violence Since the feedback is a ldquoreturn effectrdquo it originates when variables are linked by closed paths (ie circuits or loops) and its sign is negative or positive depending on the product of the signs of the links that form the loop (see Puccia amp Levins 1985 for a rigorous method for computing the feedback sign) For example in Figure 1D the arrow from A to B and the circle-head link from B to A form a closed path or loop with negative feedback because the product of the two links is negative There can be circuits of different length depending on the number of variables linked together in a closed path With these definitions we can express conceptually the algorithm of loop analysis (Puccia amp Levins 1985) The sensitivity of a variable to a press perturbation depends on (1) whether the perturbation increases (+ sign) or decreases (minus sign) the rate of change of the variable through which it enters the system (2) the sign of the path connecting the variable targeted by the press perturbation to the effect variable (the variable one wants to predict the response of ) (3) the sign of the feedback of the subsystem that remains when all variables on the path are ideally removed from the system (this is called complementary feedback) and (4) the overall feedbackmdashthat is the feedback of the circuits that connect all the variables in the system The algorithm can be summarized in the following formula
partx j
partc =sum
partf ipartc times p jiik times Fnk
Fn
(k) (comp)
in which [partfipartc] expresses whether the rate of change of the target variable xi increases or decreases because of the changing parameter c [pji
(k)] is the pathway from the target to the response variable [Fnminusk
(comp)] is the complementary feedback and [Fn] is the overall feedback Summation (sumik) occurs along all paths from the target
Human Ecology Review Volume 26 Number 2 2020
44
variable xi to the effect variable xj The complementary feedback can be envisioned as a reflecting barrier if it is negative and strong the more an impact is reflected back to the effect variable If it is positive then the effect variable changes in the opposite direction from the sign of the path The overall feedback the denominator of the formula measures the resistance of the whole system to change The responses predicted can be positive (+ increase) negative (minus decrease) or null (0 no change) and are summarized in the table of predictions (Figure 1C) The convention is that effects generated by positive perturbations (those increasing the rate of change of the target variables) on row variables can be read along the columns Consequences of negative perturbations are obtained by reversing the signs of the predictions Consider a positive press perturbation ([partfipartc] gt 0) on node A in Figure 1D If the focus is on the consequences that the press perturbation has on node B then the path is the positive link from A to B and the complementary subsystem is node C alone this latter variable does not form any circuit and the complementary feedback is null (ie equal to 0) The overall feedback is the feedback produced by the circuit that connects all the variables in the system (see Puccia amp Levins 1985 for further details) In the digraph of Figure 1D there is one single circuit that starts and ends with node A and connects all variables This circuit includes one positive and two negative interactions ArarrCndashBndashA its sign is the product of one positive and two negative links and thus it is positive
In graphs with many variables and interactions the number of paths between variables often increases which leads to several ambiguous predictions (ie the positive paths counteract negative paths so that a clear sign of the direction of change cannot be identified) To deal with such ambiguities a simulation approach can be adopted based on a random assignment of strength to each and every link coefficient To make simulations possible the signed digraph is transformed in a matrix using +1 to represent positive (arrowhead) links and minus1 to indicate negative (circle-head) links During simulations the coefficient intensities are taken from a uniform distribution in the interval (01] This means that the +1 and minus1 values in the matrix are substituted by randomly assigned values between 10-6 (the lower boundary equal to 0 is not included) and 1 while the sign is maintained Not all the matrices obtained can be used to compute the predictions but only those that satisfy criteria for stability (see Logofet 1993 for stability conditions matrices must satisfy) According to Bender et al (1984) the net effect that press perturbations targeting the row variable xi have on the column variable xj are expressed by the elements of the inverse of the matrix that is obtained from the signed digraph (for details see Levins 1975) After n simulations an overall table of predictions is constructed by combining the z matrices that are stable and allow matrix inversion For each stable matrix assembled using simulated interaction strengths unambiguous responses in the table of predictions are generated (ie the signs are certain) The overall table of predictions is composed of symbols that depend on the percentages of signs from the various simulation runs Hence if the same entry in the tables of predictions
Understanding SocialndashEcological Systems using Loop Analysis
45
from all z (stable) matrices yields the same sign (+ or minus) then the expected direction of change is unambiguous However during simulations there are cases for which divergent predictions are recorded (ie depending on the random arrangement of interaction strengths the same element in the table of predictions can show either positive or negative sign) The conversion of the outcomes from each simulation run to symbols in the overall table of predictions depends on the percentages of positive (+) and negative (minus) signs The rules to move from simulations results to the overall table of predictions are summarized in Table 1
Table 1 Rules to convert differences between percentages of signs obtained with simulations (ldquo of +rdquo ndash ldquo of ndashrdquo) into predictions (ie signs in the overall table of predictions)
ldquo of +rdquo ndash ldquo of ndashrdquo Corresponding sign in the table[minus100 minus50] minus(minus50 -20) minus (tendency to minus)[minus20 20] 0(20 50) + (tendency to +)[50 100] +0 = 100 0
Notes Round brackets indicate that the extremes are excluded 0 is not a real zero meaning no changes in the biomassabundance of variables but represents neutral results due to relatively balanced amounts of negative and positive effects When after the complete set of simulations there are entries for which the absence of any effect was always recorded then the symbol in the overall table of predictions is 0 indicating proper absence of effect (see the last row of the table 0 = 100)Source Authorsrsquo summary
Merits and limitations of loop analysis to model SESsLoop analysis is particularly suitable to investigate SESs First interconnections extend beyond the single domains of ecology economy and society to create complex networks For instance after the Nile perch invaded Lake Victoria a dramatic restructuring of the ecological community took place which in turn cascaded into deep societal and economic changes (Downing et al 2014) To disentangle drivers and dynamics of change in such a complex scenario Downing and coworkers designed an eco-social qualitative model that traced connections across disciplinary boundaries Second loop analysis educates intuition to cope with complexity Often complex systems defy our predictions and effects of policies or management interventions are at best ineffective if not damaging (Levins 1995) Failure of policies depends on the feedbacks that are produced by the linkages between the variables and that remain hidden to our comprehension if complexity does not become our central intellectual issue Cinner (2011)
Human Ecology Review Volume 26 Number 2 2020
46
in discussing problems of reef fishery emphasizes that the feedback between social and ecological variables may create socialndashecological traps (eg situations when feedbacks between social and ecological systems lead toward an undesirable state that may be difficult or impossible to reverse) It is extremely interesting to explore these phenomena by loop analysis which by disentangling feedback loops helps make the arcane obvious This capability however cannot be fully exploited if the feedback structure of the systems is not adequately represented and the relationships between the variables remain mostly unidirectional the potential may instead emerge when social and environmental variables are incorporated in a unique model (Dambacher et al 2007) Third loop analysis proposes a rigorous approach to diagnosis Diagnostic approaches are more often requested in the analysis of SESs to causally understand the multiple outcomes that can arise from the interaction of different system attributes (Kittinger et al 2013) The table of predictions the main outcome of loop analysis allows the disentangling of causative mechanisms by linking correlation patterns sources of change and network structure (Bodini amp Clerici 2016 Bodini et al 2018) For any entry point of press perturbation (any row in the table of predictions see Figure 1C) variables are predicted to change so that correlation patterns among them emerge By comparing such patterns with observed changes in the level of the variables one can identify which component is affected by external drivers and find the cause and effect mechanisms responsible for those changes due to the linkage structure Fourth loop analysis incorporates external drivers as inputs to the rate of change of the variables External drivers both social and biophysical have been described as playing an important role in SES dynamics (Kittinger et al 2013) For example in Baja California (Mexico) climate-driven hypoxia caused an excess mortality in marine species with limited mobility resulting in declines of stocks targeted by small-scale local fisheries which in turn caused small-scale fishers to switch fishing effort toward less-affected species (Micheli et al 2012) Such effect was explored in a scenario analysis using loop analysis which predicted large-scale consequences of this external driver (Martone et al 2017) Fifth the intuitive visualization of the entities and the interactions among them is suitable for accommodating the general framework proposed by Ostrom (2009) for analyzing the sustainability of SESs Each node in the digraph can be one of the four elements (ie core subsystems governance system resource users resource system and resource units) and either positive or negative links can visualize their direct relationships So far the main focus has been dedicated to the visualization of ecological variables and interactions and the inclusion of socialndasheconomic aspects has been treated as external to the system (Carey et al 2014 Espinoza-Tenorio et al 2013 Reum et al 2015) Finally the simple graphical format that constitutes the input for the loop analysis facilitates the participation of all stakeholders to model construction Although most of the current applications adopted a top-down approach to embed management strategies in models (ie literature data were consulted to define the interactions) the study of Espinoza-
Understanding SocialndashEcological Systems using Loop Analysis
47
Tenorio et al (2013) presents a valid alternative In that work both quantitative and qualitative information regarding the biological and social aspects of fisheries dynamics and management were retrieved using structured interviews with fishers participatory research key informant interviews and workshops
Limitations of the methodology should be taken into account Some limitations have already been discussed (Justus 2006) and here we focus on those that matter with the use of loop analysis in studying SESs First there can be difficulties in defining the timing of changing conditions and that of system response to impacts SESs are resilient and cope with continuous exposure to press perturbations according to adaptive dynamics principles (Folke 2006 Hughes et al 2005) The exact moment at which the system responds to a press perturbation cannot be detected with precision and the contribution of concomitant perturbations may further confound this detection Second the variables of SESs (eg resources and their users) can show asynchronous behavior and heterogeneous geographical distribution (Leslie et al 2015) Their optimization does not necessarily occur at the same temporal and spatial scale an aspect that might remain overlooked when constructing graphs The uneven geographical distribution of the actors might be addressed by including in the models different variables for the same type of user (eg various nodes that indicate the fishers and their interactions in different regions) Third there can be issues in the identification of the variables exposed to press perturbations (ie impacts of overfishing vs climate change) For example while marketing solutions (eg the introduction of ecolabels) can be easily targeted to specific user groups (eg the members of fishing cooperatives see Martone et al 2017) climate change (eg warmer winters) may affect many components of the ecological system with different time of response One possible solution is prioritizing as press perturbation targets the most responsive biological variables (eg jellyfish have faster blooming rates than expected from the body size see Nival amp Gorsky 2001) Finally loop analysis is problematic for assessing nonlinear relationships Nonlinearity can emerge by combining the impacts of pathways of different lengths Longer pathways have lower intensity than shorter ones since the interaction strengths randomly assigned during the simulations are in the interval (01] (ie the intensity of each pathway is obtained by multiplying the strength of its constitutive links that have upper bound equal to 1) To avoid penalizing the impact of longer pathways simulations could be carried out by constraining the lower limit from which interaction strengths are randomly drawn during simulations (ie by setting the lower limits of some ldquostrongrdquo interactions closer to 1) As an alternative one could include nonlinear functions to model those specific interactions that play crucial roles for the dynamics of the SES (eg by relying on previous literature data or results from specific experiments and surveys)
Human Ecology Review Volume 26 Number 2 2020
48
Comparison of loop analysis with other qualitative methods for SESsSESs form complex networks of linkages and loop analysis is designed to qualitatively predict how variables that are embedded in SESs respond to policies and management interventions (eg introduction of new regulations for the exploitation of resources market-based incentives and adoption of new marketing solutions Carey et al 2014 Dambacher et al 2007 Levin et al 2009) A limited number of applications to investigate complex SES have made use of loop analysis but the interest toward the method has taken little ground in the context of fisheries (Anthony et al 2013 Carey et al 2014 Dambacher et al 2015 Espinoza-Tenorio et al 2013 Martone et al 2017) These applications highlight that loop analysis has some potential that extends beyond its limitations For example predictions are about the equilibrium level of the variables (Justus 2006) but real systems are generally not at the equilibrium However previous studies have offered evidence that predictions from loop analysis apply successfully to changes in average values of the variables (Bodini 2000) Average values should be long term and Bodini et al (2018) showed that averages taken over either 5 or 10 years can be used to grasp variable responses to press perturbations The appropriate time scale for taking averages however very much depends on the system under investigation
Other qualitative modeling approaches can be used to study SESs Fuzzy cognitive maps (FCMs) is one of these It makes the magnitude of links explicit through a semi-quantification of the relationships that link variables (Kok 2009 Oumlzesmi amp Oumlzesmi 2004) The semi-quantification of the links may resolve the ambiguities typical of loop analysis about the net effect generated by the combination of contrasting pathways Also FCMs can make predictions about multiple simultaneous perturbations Both the state of the variables (ldquoconceptsrdquo in the technical language of FCMs) and the strength of the links (edges between the concepts) are quantified by assigning standardized values in the range [01] for states and [-11] for links Although these are relative values (ie each of them is assigned in relation to the others) some criteria for the quantification must be identified These criteria must be supported by some knowledge about the level of the variables and interactions in the system and in particular the use of FCMs seems appropriate when the estimates of variable state and link strength are the outcomes of either a combination of multiple FCMs from individual stakeholders or a set of values defined through participatory workshops The quantification of variables and interactions requires a certain level of knowledge about the system and it automatically selects the working groups among stakeholders that possess some previous understanding of the system under investigation It follows that FCMs cannot be public reproducible and intelligible in the way that loop analysis is Kok (2009) posits that vague or complex concepts such as ldquoconsumer behaviorrdquo must not be taken into account when applying FCMs
Understanding SocialndashEcological Systems using Loop Analysis
49
because guessing about their magnitude is inherently difficult On the other hand loop analysis allows including ldquoawarenessrdquo in a malaria model (Yasuoka et al 2014) ldquoenvironmental attractivenessrdquo in a tourism model (Bodini et al 2000) and the ldquorole of the unionsrdquo in a model on diabetes (Lewontin amp Levins 2007) In these aspects it seems that FCMs share one limitation with quantitative models the tendency to exclude from the analysis factors that are difficult or impossible to measure no matter if they play a role in the dynamics of the system The connections among the variables in FCMs are designed on the basis of fuzzy conditional statements (ldquoif hellip thenrdquo) that are of the type ldquoif the level of variable A is high that of variable B is lowrdquo Thus connections are deduced from correlations between the variables derived from observing the system (Stylios amp Groumpos 1999) However Levins and Puccia (1988) point out that patterns of correlation depend on the network structure and the entry point of the perturbation For example any two variables may show positive correlation in response to a specific press perturbation but opposite correlation (or no correlation) in response to other press perturbations It follows that defining interactions between variables on the basis of their correlations may be misleading In loop analysis perturbations are variations in parameters that govern the rate of change of variables For example a pollutant triggering an increase in the mortality rate of a population FCMs instead consider the changes in the level of the variables as perturbations To predict say the impacts of a pollutant that affects a population FCMs consider the reduced abundance induced by the pollutant as the initial event (ie the perturbation) on the logical assumption that a toxin by increasing the mortality of a species automatically reduces its abundance Thus the initial event is deduced from a more or less plausible linear sequence of steps This series of events overlooks the fact that the response of the target population to the increased mortality is also mediated by the network of interactions with the other variables and that accordingly often does not follow commonsense linear expectations Such assumption leads to the circular argument that FCMs predict the effects given a cause that is in turn an effect that FCMs should predict On the other hand we can be confident that the pollutant increases the mortality rate of the target population which is the initial event in loop analysis Loop analysis considers the role of the environmental variability in changing the parameters that govern the growth rates of the variables and does not interpret it solely as the cause of variable fluctuations like FCMs do
Causal loop diagrams (CLDs Hanspach et al 2014 Tenza et al 2017) and Bayesian belief networks (BBNs Borsuk et al 2004 Pollino et al 2007) have also been applied for analyzing SESs CLDs make predictions by logically reconstructing the chains of causes and effects between variables on the basis of link polarities (eg the signs of the directed links ie the effects of one variable over the other) Predicting the behavior of complex networks by identifying the feedback effects using link polarity (ie the effect associated to the link positive or negative) is difficult and can lead to misleading interpretations (Lane 2008 Richardson 1997)
Human Ecology Review Volume 26 Number 2 2020
50
Most problems originate from polarities Consider for example the case in which the level of violence displaces people from rural areas and forces them to move to the cities (Colombia is a paradigmatic example see Ibaacutentildeez amp Veacutelez 2008) The causal connections are that level of violence increases the migration rate (positive link) which in turn increases the population level in the city (positive link) Therefore the expected trend is the higher the level of violence the greater the increase of urban population However if the level of violence gets lower the migration rate is reduced but this does not reduce the population in the city as it continues to increase unless an opposite migratory flux occurs Hence the articulation of causal pathways gets difficult because variables can be both standing stocks and rates of change (Sweeney amp Sterman 2007) Similarly specifying the relevant conditional probabilities as required by BBNs can be a laborious and time-consuming process (Marcot et al 2001 Ticehurst et al 2007) Moreover to include feedback mechanisms via cyclic network structures requires dynamic time-explicit BBNs which depend on extensive parameterization Similar to FCMs combining BBNs with loop analysis has great potential for improving predictions and model validation (Anthony et al 2013 Melbourne-Thomas et al 2012 Raoux et al 2018) However it must be emphasized that these applications of BBNs are based on the signs derived from the analysis of the loop models As such their outcomes are contingent on the assumptions and limitations of signed diagraph models
Central for the understanding of the complex causality in SESs is our ability to individuate what the relevant components of the SESs are and diagram their relationships The nature of the linkages among these components determines the spreading of the effects through the system and the overall composition of the linkages generates the feedbacks that amplify or buffer such effects There is no recipe for modeling development but great effort must be devoted to assimilation of facts observations and hypotheses Increasing the reliability of predictions can be possible by designing alternative graphs This iterative procedure allows addressing uncertainty about the system structure and determining which differences matter Robust outcomes may be the effect of a core structure common to all models upon which few links added or removed cannot change radically the predictions The core structure represents the fundamental backbone composed of more certain variables and interactions Disagreements among stakeholders scientists or managers do not limit the application of loop analysis rather they offer the opportunity to involve stakeholders in a participatory model construction (Anthony et al 2013) where different types of system knowledge can be used to determine variables and links that may be important to examine further (Stier et al 2017) The adoption of such a comprehensive system-wide approach aims to formulate management strategies that reconcile ecological integrity and intergenerational equity key dimensions of the sustainable development paradigm
Understanding SocialndashEcological Systems using Loop Analysis
51
Possible developments for the application of loop analysis to SESsMaking predictions is difficult especially when we face the uncertainty associated with new unknown events changing dynamics and lack of quantitative data This is the case for example with climate change which produces completely new phenomena and dynamics In such context an adaptive management that allows for continually assessing new evidence has been called for We believe that in the new scenarios we are facing the method of loop analysis can be helpful It has the necessary adaptability to be used in changing contexts When in doubt about critical linkages and dynamic features alternative models can be developed to find out which differences matter and to reach robust conclusions It is also flexible as it allows including and discarding variables easily and above all it permits working with variables and links that are not readily measurable even though their effects are crucial However its suitability to investigate SESs can be improved in several ways The intricacy of the feedbacks can be better resolved if a specific tool for pathways analysis is developed Returning the total number of pathways and their strength between any pair of variables can show how single pathways contribute to specific effects and which ones are more important in mediating the press perturbations The question of link strength deserves attention We specified in the methodological aspects section that link strength is randomly assigned to interaction links during simulations But this does not contradict the qualitative nature of the method it only serves to assign certainty to paths and feedbacks in order to get unambiguous predictions which remain qualitative in nature as only the direction of change for the variables is predicted Pathway anatomy would help selecting those causal chains that mostly affect system dynamics Other relevant features that would improve the suitability of loop analysis for modeling SESs include (1) considering multiple simultaneous press perturbations and (2) delimiting upper and lower limits for the strength of interactions The first point is related to the fact that SESs are often exposed to different types of disturbances whose interplay gives rise to net cumulative responses that would be useful to disentangle (eg through the identification of the specific causative chains) Considering multiple press perturbations would greatly contribute to building up an effective diagnostic approach (Kittinger et al 2013) For example by loop analysis Bodini et al (2018) diagnosed that multiple press perturbations not only overfishing of small and medium pelagic species were responsible for the restructuring of the Black Sea community during the period 1960ndash1989 Moreover socioeconomic drivers amplify the impacts that are triggered by natural processes for instance both hypoxia and fisheries management affected abalone stock in the Baja California SES (Martone et al 2017) The second line of development is conceived to extend loop analysis in a semi-quantitative direction So far the simulations are performed by randomly sampling interaction strength in the uniform interval (01] There are however cases when some interactions are known
Human Ecology Review Volume 26 Number 2 2020
52
to be either strong or weak in such cases varying the strength of these linkages in the whole interval (01] does not make sense However it is difficult to translate fuzzy concepts such as strong and weak into numbers so that boundaries for the links can be set In this respect sensitivity analysis may help Either the upper (ie 1) or the lower (ie 10-6) limit of the link magnitude could be iteratively changed so that actual boundaries for certain linkages can be identified through a consistency assessment of the outcomes produced For example performing the sensitivity analysis for the strength of specific interactions might help modeling competitive advantages in the ecological domain (eg Noctiluca scintillans vs zooplankton in the Black Sea Bodini et al 2018) and power or information asymmetries between socioeconomic actors (Bousquet et al 2015) Therefore exploring alternative scenarios by constraining the strength of some interactions would be of great benefit for modeling SESs It should also be noticed that a uniform distribution is considered by default for randomly sampling the strength but it could be substituted by either normal or skewed (eg Poisson) distributions
Concluding remarksThe central issue in the study of SESs is to understand interdependencies that cross the boundaries of the classical domains in which scientific and operational knowledge have been settled Contributions in this respect are expected from tools that allow reconstructing the causal chains that give rise to such interdependencies and that involve variables or components of different nature For such reconstruction to be effective tools must overcome the barriers that make communication between domains difficult (1) the simpler the language used to describe the phenomena and the interactions the better it is (2) a lower level of technicality in the algorithms facilitates understanding the outcomes and (3) flexibility widens the range of applicability to different contexts Loop analysis shares most of these features (1) by classifying the interactions in only two categories positive and negative it facilitates creating connections between variables that differ dramatically in physical form (2) the ease by which a model can be constructed as a graph allows keeping up with rapidly changing conditions (ie variables andor links disappear and others become important) (3) the algorithm for predictions refers directly to structural features of the graph and can be visualized thus making the outcomes easier to understand and (4) it is also characterized by a wide applicability (often the question of interest is not a particular system but a whole class of systems with some similarity of structure) Furthermore loop analysis emphasizes the understanding of mechanisms which is a prime objective when an intellectual and operative framework is taking shape as in the case of SESs
Understanding SocialndashEcological Systems using Loop Analysis
53
ReferencesAnthony K R Dambacher J M Walshe T amp Beeden R (2013) A framework for
understanding cumulative impacts supporting environmental decisions and informing resilience-based management of the Great Barrier Reef World Heritage Area Australian Institute of Marine Science CSIRO NERP Decisions Hub University of Melbourne and Great Barrier Reef Marine Park Authority hdlhandlenet110172850
Bender E A Case T J amp Gilpin M E (1984) Perturbation experiments in community ecology Theory and practice Ecology 65(1) 1ndash13 doiorg1023071939452
Binder C R Hinkel J Bots P W G amp Pahl-Wostl C (2013) Comparison of frameworks for analyzing socialndashecological systems Ecology and Society 18(4) Article 26 doiorg 105751es-05551-180426
Bodini A (2000) Reconstructing trophic interactions as a tool for understanding and managing ecosystems Application to a shallow eutrophic lake Canadian Journal of Fisheries and Aquatic Sciences 57(10) 1999ndash2009 doiorg101139f00-153
Bodini A amp Clerici N (2016) Vegetation herbivores and fires in savanna ecosystems A network perspective Ecological Complexity 28 36ndash46 doiorg101016jecocom 201610001
Bodini A Ricci A amp Viaroli P (2000) A multimethodological approach for the sustainable management of perifluvial wetlands of the Po River (Italy) Environmental Management 26(1) 59ndash72 doiorg101007s002670010071
Bodini A Rocchi M amp Scotti M (2018) Insights into the ecology of the Black Sea through the qualitative loop analysis of the community structure Limnology and Oceanography 63(2) 968ndash984 doiorg101002lno10713
Borsuk M E Stow C A amp Reckhow K H (2004) A Bayesian network of eutrophication models for synthesis prediction and uncertainty analysis Ecological Modelling 173(2ndash3) 219ndash239 doiorg101016jecolmodel200308020
Bousquet F Anderies M Antona M Bassett T Benjaminsen T Bonato O hellip Vassal J-M (2015) Socio-ecological theories and empirical research Comparing socialndashecological schools of thoughts in action [Research report] CIRAD-GREEN halarchives-ouvertesfrhal-01130178
Carey M P Levin P S Townsend H Minello T J Sutton G R Francis T B hellip Ruckelshaus M (2014) Characterizing coastal foodwebs with qualitative links to bridge the gap between the theory and the practice of ecosystem-based management ICES Journal of Marine Science 71(3) 713ndash724 doiorg101093icesjmsfst012
Cinner J E (2011) Socialndashecological traps in reef fisheries Global Environmental Change 21(3) 835ndash839 doiorg101016jgloenvcha201104012
Human Ecology Review Volume 26 Number 2 2020
54
Costanza R amp Mageau M (1999) What is a healthy ecosystem Aquatic Ecology 33(1) 105ndash115 doiorg101023A1009930313242
Dambacher J M Brewer D T Dennis D M Macintyre M amp Foale S (2007) Qualitative modelling of gold mine impacts on Lihir Islandrsquos socioeconomic system and reef-edge fish community Environmental Science amp Technology 41(2) 555ndash562 doiorg 101021es0610333
Dambacher J M Rothlisberg P C amp Loneragan N R (2015) Qualitative mathematical models to support ecosystem‐based management of Australiarsquos Northern Prawn Fishery Ecological Applications 25(1) 278ndash298 doiorg10189013-20301
Downing A S van Nes E H Balirwa J S Beuving J J Bwathondi P O J Chapman L J hellip Mooij W M (2014) Coupled human and natural system dynamics as key to the sustainability of Lake Victoriarsquos ecosystem services Ecology and Society 19(4) Article 31 doiorg105751es-06965-190431
Espinoza-Tenorio A Wolff M Espejel I amp Montantildeo-Moctezuma G (2013) Using traditional ecological knowledge to improve holistic fisheries management Transdisciplinary modeling of a lagoon ecosystem of Southern Mexico Ecology and Society 18(2) Article 6 doiorg105751es-05369-180206
Folke C (2006) Resilience The emergence of a perspective for socialndashecological systems analyses Global Environmental Change 16(3) 253ndash267 doiorg101016jgloenvcha 200604002
Haines-Young R amp Potschin M (2010) The links between biodiversity ecosystem services and human well-being In D G Raffaelli amp C L Frid (Eds) Ecosystem ecology A new synthesis (pp 110ndash139) Cambridge University Press doiorg101017cbo978051175 0458007
Hanspach J Hartel T Milcu A I Mikulcak F Dorresteijn I Loos J hellip Fischer J (2014) A holistic approach to studying socialndashecological systems and its application to southern Transylvania Ecology and Society 19(4) Article 32 doiorg105751es-06915-190432
Hilborn R (2007) Defining success in fisheries and conflicts in objectives Marine Policy 31(2) 153ndash158 doiorg101016jmarpol200605014
Hughes T P Bellwood D R Folke C Steneck R S amp Wilson J (2005) New paradigms for supporting the resilience of marine ecosystems Trends in Ecology amp Evolution 20(7) 380ndash386 doiorg101016jtree200503022
Ibaacutentildeez A M amp Veacutelez C E (2008) Civil conflict and forced migration The micro determinants and welfare losses of displacement in Colombia World Development 36(4) 659ndash676 doiorg101016jworlddev200704013
Justus J (2006) Loop analysis and qualitative modeling Limitations and merits Biology and Philosophy 21(5) 647ndash666 doiorg101007s10539-006-9050-x
Understanding SocialndashEcological Systems using Loop Analysis
55
Kittinger J N Finkbeiner E M Ban N C Broad K Carr M H Cinner J E hellip Crowder L B (2013) Emerging frontiers in social-ecological systems research for sustainability of small-scale fisheries Current Opinion on Environmental Sustainability 5(3ndash4) 352ndash357 doiorg101016jcosust201306008
Kok K (2009) The potential of fuzzy cognitive maps for semi-quantitative scenario development with an example from Brazil Global Environmental Change 19(1) 122ndash133 doiorg101016jgloenvcha200808003
Lane D C (2008) The emergence and use of diagramming in system dynamics A critical account Systems Research and Behavioral Science 25(1) 3ndash23 doiorg101002sres826
Leslie H M Basurto X Nenadovic M Sievanen L Cavanaugh K C Cota-Nieto J J hellip Aburto-Oropeza O (2015) Operationalizing the social-ecological systems framework to assess sustainability Proceedings of the National Academy of Sciences of the USA 112(19) 5979ndash5984 doiorg101073pnas1414640112
Levin P S Fogarty M J Murawski S A amp Fluharty D (2009) Integrated ecosystem assessments Developing the scientific basis for ecosystem-based management of the ocean PLoS Biology 7(1) e1000014 doiorg101371journalpbio1000014
Levins R (1968) Evolution in changing environments Some theoretical explorations Princeton University Press
Levins R (1974) Discussion paper The qualitative analysis of partially specified systems Annals of the New York Academy of Sciences 231(1) 123ndash138 doiorg101111 j1749-66321974tb20562x
Levins R (1975) Evolution in communities near equilibrium In M L Cody and J M Diamond (Eds) Ecology and evolution of communities (pp 16ndash50) Harvard University Press
Levins R (1995) Preparing for uncertainty Ecosystem Health 1(1) 47ndash57
Levins R amp Puccia C J (1988) The controlling factor in biological communities Coenoses 3(3) 149ndash154 wwwjstororgstable43460977
Lewontin R C amp Levins R (2007) Educating the intuition to cope with complexity In R C Lewontin amp R Levins (Eds) Biology under the influence Dialectical essays on ecology agriculture and health (pp 183ndash198) Monthly Review Press
Logofet D (1993) Matrices and graphs Stability problems in mathematical ecology CRC Press
Long R D Charles A amp Stephenson R L (2015) Key principles of marine ecosystem-based management Marine Policy 57 53ndash60 doiorg101016jmarpol201501013
Lotze H K Lenihan H S Bourque B J Bradbury R H Cooke R G Kay M C hellip Jackson J B (2006) Depletion degradation and recovery potential of estuaries and coastal seas Science 312(5781) 1806ndash1809 doiorg101126science1128035
Human Ecology Review Volume 26 Number 2 2020
56
Marcot B G Holthausen R S Raphael M G Rowland M M amp Wisdom M J (2001) Using Bayesian belief networks to evaluate fish and wildlife population viability under land management alternatives from an environmental impact statement Forest Ecology and Management 153(1ndash3) 29ndash42 doiorg101016s0378-1127(01)00452-2
Martone R G Bodini A amp Micheli F (2017) Identifying potential consequences of natural perturbations and management decisions on a coastal fishery socialndashecological system using qualitative loop analysis Ecology and Society 22(1) Article 34 doiorg 105751 es-08825-220134
Melbourne-Thomas J Wotherspoon S Raymond B amp Constable A (2012) Comprehensive evaluation of model uncertainty in qualitative network analyses Ecological Monographs 82(4) 505ndash519 doiorg10189012-02071
Micheli F Saenz-Arroyo A Greenley A Vazquez L Espinoza Montes J A Rossetto M amp De Leo G A (2012) Evidence that marine reserves enhance resilience to climatic impacts PLoS ONE 7 e40832 doiorg101371journalpone0040832
Nival P amp Gorsky G (2001) Conditions for blooming of pelagic species In CIESM Workshop Monographs No 14mdashGelatinous zooplankton outbreaks Theory and practice (pp 23ndash27) Commission Internationale pour lrsquoExploration Scientifique de la Meacutediterraneacutee (CIESM [Mediterranean Science Commission])
Ostrom E (2009) A general framework for analyzing sustainability of social-ecological systems Science 325(5939) 419ndash422 doiorg101126science1172133
Oumlzesmi U amp Oumlzesmi S L (2004) Ecological models based on peoplersquos knowledge A multi-step fuzzy cognitive mapping approach Ecological Modelling 176(1ndash2) 43ndash64 doiorg101016jecolmodel200310027
Partelow S Fujitani M Soundararajan V amp Schluumlter A (2019) Transforming the social-ecological systems framework into a knowledge exchange and deliberation tool for comanagement Ecology and Society 24(1) Article 15 doiorg105751es-10724-240115
Pollino C A Woodberry O Nicholson A Korb K amp Hart B T (2007) Parameterisation and evaluation of a Bayesian network for use in an ecological risk assessment Environmental Modelling amp Software 22(8) 1140ndash1152 doiorg101016jenvsoft200603006
Puccia C J amp Levins R (1985) Qualitative modeling of complex systems An introduction to loop analysis and time averaging Harvard University Press
Raoux A Dambacher J M Pezy J P Mazeacute C Dauvin J C amp Niquil N (2018) Assessing cumulative sociondashecological impacts of offshore wind farm development in the Bay of Seine (English Channel) Marine Policy 89 11ndash20 doiorg101016jmarpol 201712007
Reum J C McDonald P S Ferriss B E Farrell D M Harvey C J amp Levin P S (2015) Qualitative network models in support of ecosystem approaches to bivalve aquaculture ICES Journal of Marine Science 72(8) 2278ndash2288 doiorg101093icesjms fsv119
Understanding SocialndashEcological Systems using Loop Analysis
57
Richardson G P (1997) Problems in causal loop diagrams revisited System Dynamics Review 13(3) 247ndash252 doiorg101002(sici)1099-1727(199723)133lt247aid-sdr 128gt 30co2-9
Stachowicz J J Fried H Osman R W amp Whitlatch R B (2002) Biodiversity invasion resistance and marine ecosystem function Reconciling pattern and process Ecology 83(9) 2575ndash2590 doiorg1018900012-9658(2002)083[2575birame]20co2
Stier A C Samhouri J F Gray S Martone R G Mach M E Halpern B S hellip Levin P S (2017) Integrating expert perceptions into food web conservation and management Conservation Letters 10(1) 67ndash76 doiorg101111conl12245
Stylios C D amp Groumpos P P (1999) A soft computing approach for modelling the supervisor of manufacturing systems Journal of Intelligent and Robotic Systems 26(3ndash4) 389ndash403 doiorg101023A1008165916707
Sweeney L B amp Sterman J (2007) Thinking about systems Student and teacher conceptions of natural and social systems System Dynamics Review 23(2ndash3) 285ndash311 doiorg101002sdr366
Tenza A Peacuterez I Martiacutenez-Fernaacutendez J amp Gimeacutenez A (2017) Understanding the decline and resilience loss of a long-lived social-ecological system Insights from system dynamics Ecology and Society 22(2) Article 15 doiorg105751es-09176-220215
Ticehurst J L Newham L T Rissik D Letcher R A amp Jakeman A J (2007) A Bayesian network approach for assessing the sustainability of coastal lakes in New South Wales Australia Environmental Modelling amp Software 22(8) 1129ndash1139 doiorg101016 jenvsoft 200603003
Worm B Barbier E B Beaumont N Duffy J E Folke C Halpern B S hellip Watson R (2006) Impacts of biodiversity loss on ocean ecosystem services Science 314(5800) 787ndash790 doiorg101126science1132294
Yasuoka J Jimba M amp Levins R (2014) Application of loop analysis for evaluation of malaria control interventions Malaria Journal 13 Article 140 doiorg1011861475-2875-13-140
This text is taken from Human Ecology Review Volume 26 Number 2 2020 published by ANU Press The Australian National University Canberra Australia
doiorg1022459HER2602202003
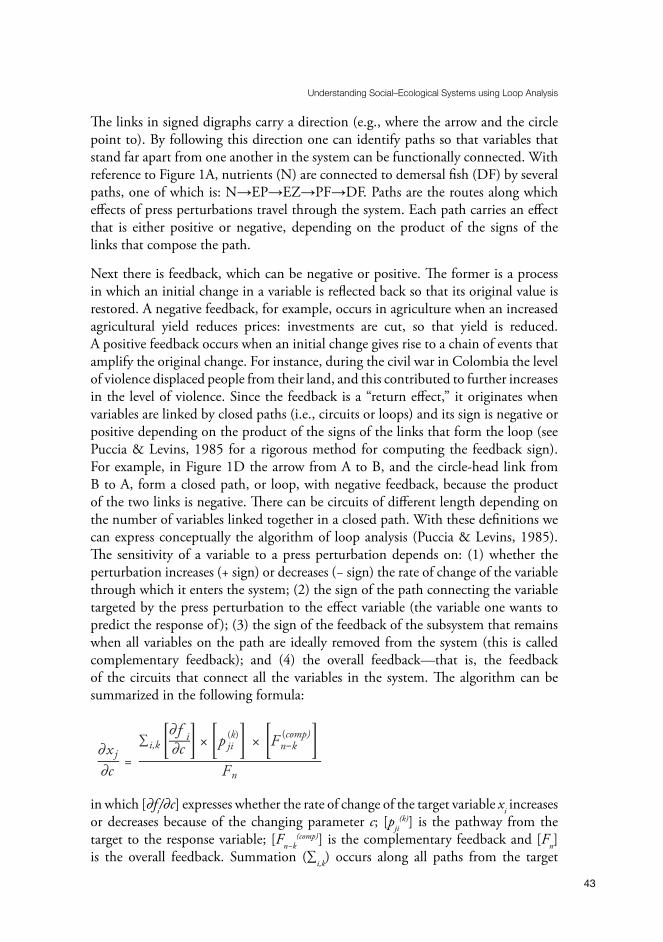
Understanding SocialndashEcological Systems using Loop Analysis
43
The links in signed digraphs carry a direction (eg where the arrow and the circle point to) By following this direction one can identify paths so that variables that stand far apart from one another in the system can be functionally connected With reference to Figure 1A nutrients (N) are connected to demersal fish (DF) by several paths one of which is NrarrEPrarrEZrarrPFrarrDF Paths are the routes along which effects of press perturbations travel through the system Each path carries an effect that is either positive or negative depending on the product of the signs of the links that compose the path
Next there is feedback which can be negative or positive The former is a process in which an initial change in a variable is reflected back so that its original value is restored A negative feedback for example occurs in agriculture when an increased agricultural yield reduces prices investments are cut so that yield is reduced A positive feedback occurs when an initial change gives rise to a chain of events that amplify the original change For instance during the civil war in Colombia the level of violence displaced people from their land and this contributed to further increases in the level of violence Since the feedback is a ldquoreturn effectrdquo it originates when variables are linked by closed paths (ie circuits or loops) and its sign is negative or positive depending on the product of the signs of the links that form the loop (see Puccia amp Levins 1985 for a rigorous method for computing the feedback sign) For example in Figure 1D the arrow from A to B and the circle-head link from B to A form a closed path or loop with negative feedback because the product of the two links is negative There can be circuits of different length depending on the number of variables linked together in a closed path With these definitions we can express conceptually the algorithm of loop analysis (Puccia amp Levins 1985) The sensitivity of a variable to a press perturbation depends on (1) whether the perturbation increases (+ sign) or decreases (minus sign) the rate of change of the variable through which it enters the system (2) the sign of the path connecting the variable targeted by the press perturbation to the effect variable (the variable one wants to predict the response of ) (3) the sign of the feedback of the subsystem that remains when all variables on the path are ideally removed from the system (this is called complementary feedback) and (4) the overall feedbackmdashthat is the feedback of the circuits that connect all the variables in the system The algorithm can be summarized in the following formula
partx j
partc =sum
partf ipartc times p jiik times Fnk
Fn
(k) (comp)
in which [partfipartc] expresses whether the rate of change of the target variable xi increases or decreases because of the changing parameter c [pji
(k)] is the pathway from the target to the response variable [Fnminusk
(comp)] is the complementary feedback and [Fn] is the overall feedback Summation (sumik) occurs along all paths from the target
Human Ecology Review Volume 26 Number 2 2020
44
variable xi to the effect variable xj The complementary feedback can be envisioned as a reflecting barrier if it is negative and strong the more an impact is reflected back to the effect variable If it is positive then the effect variable changes in the opposite direction from the sign of the path The overall feedback the denominator of the formula measures the resistance of the whole system to change The responses predicted can be positive (+ increase) negative (minus decrease) or null (0 no change) and are summarized in the table of predictions (Figure 1C) The convention is that effects generated by positive perturbations (those increasing the rate of change of the target variables) on row variables can be read along the columns Consequences of negative perturbations are obtained by reversing the signs of the predictions Consider a positive press perturbation ([partfipartc] gt 0) on node A in Figure 1D If the focus is on the consequences that the press perturbation has on node B then the path is the positive link from A to B and the complementary subsystem is node C alone this latter variable does not form any circuit and the complementary feedback is null (ie equal to 0) The overall feedback is the feedback produced by the circuit that connects all the variables in the system (see Puccia amp Levins 1985 for further details) In the digraph of Figure 1D there is one single circuit that starts and ends with node A and connects all variables This circuit includes one positive and two negative interactions ArarrCndashBndashA its sign is the product of one positive and two negative links and thus it is positive
In graphs with many variables and interactions the number of paths between variables often increases which leads to several ambiguous predictions (ie the positive paths counteract negative paths so that a clear sign of the direction of change cannot be identified) To deal with such ambiguities a simulation approach can be adopted based on a random assignment of strength to each and every link coefficient To make simulations possible the signed digraph is transformed in a matrix using +1 to represent positive (arrowhead) links and minus1 to indicate negative (circle-head) links During simulations the coefficient intensities are taken from a uniform distribution in the interval (01] This means that the +1 and minus1 values in the matrix are substituted by randomly assigned values between 10-6 (the lower boundary equal to 0 is not included) and 1 while the sign is maintained Not all the matrices obtained can be used to compute the predictions but only those that satisfy criteria for stability (see Logofet 1993 for stability conditions matrices must satisfy) According to Bender et al (1984) the net effect that press perturbations targeting the row variable xi have on the column variable xj are expressed by the elements of the inverse of the matrix that is obtained from the signed digraph (for details see Levins 1975) After n simulations an overall table of predictions is constructed by combining the z matrices that are stable and allow matrix inversion For each stable matrix assembled using simulated interaction strengths unambiguous responses in the table of predictions are generated (ie the signs are certain) The overall table of predictions is composed of symbols that depend on the percentages of signs from the various simulation runs Hence if the same entry in the tables of predictions
Understanding SocialndashEcological Systems using Loop Analysis
45
from all z (stable) matrices yields the same sign (+ or minus) then the expected direction of change is unambiguous However during simulations there are cases for which divergent predictions are recorded (ie depending on the random arrangement of interaction strengths the same element in the table of predictions can show either positive or negative sign) The conversion of the outcomes from each simulation run to symbols in the overall table of predictions depends on the percentages of positive (+) and negative (minus) signs The rules to move from simulations results to the overall table of predictions are summarized in Table 1
Table 1 Rules to convert differences between percentages of signs obtained with simulations (ldquo of +rdquo ndash ldquo of ndashrdquo) into predictions (ie signs in the overall table of predictions)
ldquo of +rdquo ndash ldquo of ndashrdquo Corresponding sign in the table[minus100 minus50] minus(minus50 -20) minus (tendency to minus)[minus20 20] 0(20 50) + (tendency to +)[50 100] +0 = 100 0
Notes Round brackets indicate that the extremes are excluded 0 is not a real zero meaning no changes in the biomassabundance of variables but represents neutral results due to relatively balanced amounts of negative and positive effects When after the complete set of simulations there are entries for which the absence of any effect was always recorded then the symbol in the overall table of predictions is 0 indicating proper absence of effect (see the last row of the table 0 = 100)Source Authorsrsquo summary
Merits and limitations of loop analysis to model SESsLoop analysis is particularly suitable to investigate SESs First interconnections extend beyond the single domains of ecology economy and society to create complex networks For instance after the Nile perch invaded Lake Victoria a dramatic restructuring of the ecological community took place which in turn cascaded into deep societal and economic changes (Downing et al 2014) To disentangle drivers and dynamics of change in such a complex scenario Downing and coworkers designed an eco-social qualitative model that traced connections across disciplinary boundaries Second loop analysis educates intuition to cope with complexity Often complex systems defy our predictions and effects of policies or management interventions are at best ineffective if not damaging (Levins 1995) Failure of policies depends on the feedbacks that are produced by the linkages between the variables and that remain hidden to our comprehension if complexity does not become our central intellectual issue Cinner (2011)
Human Ecology Review Volume 26 Number 2 2020
46
in discussing problems of reef fishery emphasizes that the feedback between social and ecological variables may create socialndashecological traps (eg situations when feedbacks between social and ecological systems lead toward an undesirable state that may be difficult or impossible to reverse) It is extremely interesting to explore these phenomena by loop analysis which by disentangling feedback loops helps make the arcane obvious This capability however cannot be fully exploited if the feedback structure of the systems is not adequately represented and the relationships between the variables remain mostly unidirectional the potential may instead emerge when social and environmental variables are incorporated in a unique model (Dambacher et al 2007) Third loop analysis proposes a rigorous approach to diagnosis Diagnostic approaches are more often requested in the analysis of SESs to causally understand the multiple outcomes that can arise from the interaction of different system attributes (Kittinger et al 2013) The table of predictions the main outcome of loop analysis allows the disentangling of causative mechanisms by linking correlation patterns sources of change and network structure (Bodini amp Clerici 2016 Bodini et al 2018) For any entry point of press perturbation (any row in the table of predictions see Figure 1C) variables are predicted to change so that correlation patterns among them emerge By comparing such patterns with observed changes in the level of the variables one can identify which component is affected by external drivers and find the cause and effect mechanisms responsible for those changes due to the linkage structure Fourth loop analysis incorporates external drivers as inputs to the rate of change of the variables External drivers both social and biophysical have been described as playing an important role in SES dynamics (Kittinger et al 2013) For example in Baja California (Mexico) climate-driven hypoxia caused an excess mortality in marine species with limited mobility resulting in declines of stocks targeted by small-scale local fisheries which in turn caused small-scale fishers to switch fishing effort toward less-affected species (Micheli et al 2012) Such effect was explored in a scenario analysis using loop analysis which predicted large-scale consequences of this external driver (Martone et al 2017) Fifth the intuitive visualization of the entities and the interactions among them is suitable for accommodating the general framework proposed by Ostrom (2009) for analyzing the sustainability of SESs Each node in the digraph can be one of the four elements (ie core subsystems governance system resource users resource system and resource units) and either positive or negative links can visualize their direct relationships So far the main focus has been dedicated to the visualization of ecological variables and interactions and the inclusion of socialndasheconomic aspects has been treated as external to the system (Carey et al 2014 Espinoza-Tenorio et al 2013 Reum et al 2015) Finally the simple graphical format that constitutes the input for the loop analysis facilitates the participation of all stakeholders to model construction Although most of the current applications adopted a top-down approach to embed management strategies in models (ie literature data were consulted to define the interactions) the study of Espinoza-
Understanding SocialndashEcological Systems using Loop Analysis
47
Tenorio et al (2013) presents a valid alternative In that work both quantitative and qualitative information regarding the biological and social aspects of fisheries dynamics and management were retrieved using structured interviews with fishers participatory research key informant interviews and workshops
Limitations of the methodology should be taken into account Some limitations have already been discussed (Justus 2006) and here we focus on those that matter with the use of loop analysis in studying SESs First there can be difficulties in defining the timing of changing conditions and that of system response to impacts SESs are resilient and cope with continuous exposure to press perturbations according to adaptive dynamics principles (Folke 2006 Hughes et al 2005) The exact moment at which the system responds to a press perturbation cannot be detected with precision and the contribution of concomitant perturbations may further confound this detection Second the variables of SESs (eg resources and their users) can show asynchronous behavior and heterogeneous geographical distribution (Leslie et al 2015) Their optimization does not necessarily occur at the same temporal and spatial scale an aspect that might remain overlooked when constructing graphs The uneven geographical distribution of the actors might be addressed by including in the models different variables for the same type of user (eg various nodes that indicate the fishers and their interactions in different regions) Third there can be issues in the identification of the variables exposed to press perturbations (ie impacts of overfishing vs climate change) For example while marketing solutions (eg the introduction of ecolabels) can be easily targeted to specific user groups (eg the members of fishing cooperatives see Martone et al 2017) climate change (eg warmer winters) may affect many components of the ecological system with different time of response One possible solution is prioritizing as press perturbation targets the most responsive biological variables (eg jellyfish have faster blooming rates than expected from the body size see Nival amp Gorsky 2001) Finally loop analysis is problematic for assessing nonlinear relationships Nonlinearity can emerge by combining the impacts of pathways of different lengths Longer pathways have lower intensity than shorter ones since the interaction strengths randomly assigned during the simulations are in the interval (01] (ie the intensity of each pathway is obtained by multiplying the strength of its constitutive links that have upper bound equal to 1) To avoid penalizing the impact of longer pathways simulations could be carried out by constraining the lower limit from which interaction strengths are randomly drawn during simulations (ie by setting the lower limits of some ldquostrongrdquo interactions closer to 1) As an alternative one could include nonlinear functions to model those specific interactions that play crucial roles for the dynamics of the SES (eg by relying on previous literature data or results from specific experiments and surveys)
Human Ecology Review Volume 26 Number 2 2020
48
Comparison of loop analysis with other qualitative methods for SESsSESs form complex networks of linkages and loop analysis is designed to qualitatively predict how variables that are embedded in SESs respond to policies and management interventions (eg introduction of new regulations for the exploitation of resources market-based incentives and adoption of new marketing solutions Carey et al 2014 Dambacher et al 2007 Levin et al 2009) A limited number of applications to investigate complex SES have made use of loop analysis but the interest toward the method has taken little ground in the context of fisheries (Anthony et al 2013 Carey et al 2014 Dambacher et al 2015 Espinoza-Tenorio et al 2013 Martone et al 2017) These applications highlight that loop analysis has some potential that extends beyond its limitations For example predictions are about the equilibrium level of the variables (Justus 2006) but real systems are generally not at the equilibrium However previous studies have offered evidence that predictions from loop analysis apply successfully to changes in average values of the variables (Bodini 2000) Average values should be long term and Bodini et al (2018) showed that averages taken over either 5 or 10 years can be used to grasp variable responses to press perturbations The appropriate time scale for taking averages however very much depends on the system under investigation
Other qualitative modeling approaches can be used to study SESs Fuzzy cognitive maps (FCMs) is one of these It makes the magnitude of links explicit through a semi-quantification of the relationships that link variables (Kok 2009 Oumlzesmi amp Oumlzesmi 2004) The semi-quantification of the links may resolve the ambiguities typical of loop analysis about the net effect generated by the combination of contrasting pathways Also FCMs can make predictions about multiple simultaneous perturbations Both the state of the variables (ldquoconceptsrdquo in the technical language of FCMs) and the strength of the links (edges between the concepts) are quantified by assigning standardized values in the range [01] for states and [-11] for links Although these are relative values (ie each of them is assigned in relation to the others) some criteria for the quantification must be identified These criteria must be supported by some knowledge about the level of the variables and interactions in the system and in particular the use of FCMs seems appropriate when the estimates of variable state and link strength are the outcomes of either a combination of multiple FCMs from individual stakeholders or a set of values defined through participatory workshops The quantification of variables and interactions requires a certain level of knowledge about the system and it automatically selects the working groups among stakeholders that possess some previous understanding of the system under investigation It follows that FCMs cannot be public reproducible and intelligible in the way that loop analysis is Kok (2009) posits that vague or complex concepts such as ldquoconsumer behaviorrdquo must not be taken into account when applying FCMs
Understanding SocialndashEcological Systems using Loop Analysis
49
because guessing about their magnitude is inherently difficult On the other hand loop analysis allows including ldquoawarenessrdquo in a malaria model (Yasuoka et al 2014) ldquoenvironmental attractivenessrdquo in a tourism model (Bodini et al 2000) and the ldquorole of the unionsrdquo in a model on diabetes (Lewontin amp Levins 2007) In these aspects it seems that FCMs share one limitation with quantitative models the tendency to exclude from the analysis factors that are difficult or impossible to measure no matter if they play a role in the dynamics of the system The connections among the variables in FCMs are designed on the basis of fuzzy conditional statements (ldquoif hellip thenrdquo) that are of the type ldquoif the level of variable A is high that of variable B is lowrdquo Thus connections are deduced from correlations between the variables derived from observing the system (Stylios amp Groumpos 1999) However Levins and Puccia (1988) point out that patterns of correlation depend on the network structure and the entry point of the perturbation For example any two variables may show positive correlation in response to a specific press perturbation but opposite correlation (or no correlation) in response to other press perturbations It follows that defining interactions between variables on the basis of their correlations may be misleading In loop analysis perturbations are variations in parameters that govern the rate of change of variables For example a pollutant triggering an increase in the mortality rate of a population FCMs instead consider the changes in the level of the variables as perturbations To predict say the impacts of a pollutant that affects a population FCMs consider the reduced abundance induced by the pollutant as the initial event (ie the perturbation) on the logical assumption that a toxin by increasing the mortality of a species automatically reduces its abundance Thus the initial event is deduced from a more or less plausible linear sequence of steps This series of events overlooks the fact that the response of the target population to the increased mortality is also mediated by the network of interactions with the other variables and that accordingly often does not follow commonsense linear expectations Such assumption leads to the circular argument that FCMs predict the effects given a cause that is in turn an effect that FCMs should predict On the other hand we can be confident that the pollutant increases the mortality rate of the target population which is the initial event in loop analysis Loop analysis considers the role of the environmental variability in changing the parameters that govern the growth rates of the variables and does not interpret it solely as the cause of variable fluctuations like FCMs do
Causal loop diagrams (CLDs Hanspach et al 2014 Tenza et al 2017) and Bayesian belief networks (BBNs Borsuk et al 2004 Pollino et al 2007) have also been applied for analyzing SESs CLDs make predictions by logically reconstructing the chains of causes and effects between variables on the basis of link polarities (eg the signs of the directed links ie the effects of one variable over the other) Predicting the behavior of complex networks by identifying the feedback effects using link polarity (ie the effect associated to the link positive or negative) is difficult and can lead to misleading interpretations (Lane 2008 Richardson 1997)
Human Ecology Review Volume 26 Number 2 2020
50
Most problems originate from polarities Consider for example the case in which the level of violence displaces people from rural areas and forces them to move to the cities (Colombia is a paradigmatic example see Ibaacutentildeez amp Veacutelez 2008) The causal connections are that level of violence increases the migration rate (positive link) which in turn increases the population level in the city (positive link) Therefore the expected trend is the higher the level of violence the greater the increase of urban population However if the level of violence gets lower the migration rate is reduced but this does not reduce the population in the city as it continues to increase unless an opposite migratory flux occurs Hence the articulation of causal pathways gets difficult because variables can be both standing stocks and rates of change (Sweeney amp Sterman 2007) Similarly specifying the relevant conditional probabilities as required by BBNs can be a laborious and time-consuming process (Marcot et al 2001 Ticehurst et al 2007) Moreover to include feedback mechanisms via cyclic network structures requires dynamic time-explicit BBNs which depend on extensive parameterization Similar to FCMs combining BBNs with loop analysis has great potential for improving predictions and model validation (Anthony et al 2013 Melbourne-Thomas et al 2012 Raoux et al 2018) However it must be emphasized that these applications of BBNs are based on the signs derived from the analysis of the loop models As such their outcomes are contingent on the assumptions and limitations of signed diagraph models
Central for the understanding of the complex causality in SESs is our ability to individuate what the relevant components of the SESs are and diagram their relationships The nature of the linkages among these components determines the spreading of the effects through the system and the overall composition of the linkages generates the feedbacks that amplify or buffer such effects There is no recipe for modeling development but great effort must be devoted to assimilation of facts observations and hypotheses Increasing the reliability of predictions can be possible by designing alternative graphs This iterative procedure allows addressing uncertainty about the system structure and determining which differences matter Robust outcomes may be the effect of a core structure common to all models upon which few links added or removed cannot change radically the predictions The core structure represents the fundamental backbone composed of more certain variables and interactions Disagreements among stakeholders scientists or managers do not limit the application of loop analysis rather they offer the opportunity to involve stakeholders in a participatory model construction (Anthony et al 2013) where different types of system knowledge can be used to determine variables and links that may be important to examine further (Stier et al 2017) The adoption of such a comprehensive system-wide approach aims to formulate management strategies that reconcile ecological integrity and intergenerational equity key dimensions of the sustainable development paradigm
Understanding SocialndashEcological Systems using Loop Analysis
51
Possible developments for the application of loop analysis to SESsMaking predictions is difficult especially when we face the uncertainty associated with new unknown events changing dynamics and lack of quantitative data This is the case for example with climate change which produces completely new phenomena and dynamics In such context an adaptive management that allows for continually assessing new evidence has been called for We believe that in the new scenarios we are facing the method of loop analysis can be helpful It has the necessary adaptability to be used in changing contexts When in doubt about critical linkages and dynamic features alternative models can be developed to find out which differences matter and to reach robust conclusions It is also flexible as it allows including and discarding variables easily and above all it permits working with variables and links that are not readily measurable even though their effects are crucial However its suitability to investigate SESs can be improved in several ways The intricacy of the feedbacks can be better resolved if a specific tool for pathways analysis is developed Returning the total number of pathways and their strength between any pair of variables can show how single pathways contribute to specific effects and which ones are more important in mediating the press perturbations The question of link strength deserves attention We specified in the methodological aspects section that link strength is randomly assigned to interaction links during simulations But this does not contradict the qualitative nature of the method it only serves to assign certainty to paths and feedbacks in order to get unambiguous predictions which remain qualitative in nature as only the direction of change for the variables is predicted Pathway anatomy would help selecting those causal chains that mostly affect system dynamics Other relevant features that would improve the suitability of loop analysis for modeling SESs include (1) considering multiple simultaneous press perturbations and (2) delimiting upper and lower limits for the strength of interactions The first point is related to the fact that SESs are often exposed to different types of disturbances whose interplay gives rise to net cumulative responses that would be useful to disentangle (eg through the identification of the specific causative chains) Considering multiple press perturbations would greatly contribute to building up an effective diagnostic approach (Kittinger et al 2013) For example by loop analysis Bodini et al (2018) diagnosed that multiple press perturbations not only overfishing of small and medium pelagic species were responsible for the restructuring of the Black Sea community during the period 1960ndash1989 Moreover socioeconomic drivers amplify the impacts that are triggered by natural processes for instance both hypoxia and fisheries management affected abalone stock in the Baja California SES (Martone et al 2017) The second line of development is conceived to extend loop analysis in a semi-quantitative direction So far the simulations are performed by randomly sampling interaction strength in the uniform interval (01] There are however cases when some interactions are known
Human Ecology Review Volume 26 Number 2 2020
52
to be either strong or weak in such cases varying the strength of these linkages in the whole interval (01] does not make sense However it is difficult to translate fuzzy concepts such as strong and weak into numbers so that boundaries for the links can be set In this respect sensitivity analysis may help Either the upper (ie 1) or the lower (ie 10-6) limit of the link magnitude could be iteratively changed so that actual boundaries for certain linkages can be identified through a consistency assessment of the outcomes produced For example performing the sensitivity analysis for the strength of specific interactions might help modeling competitive advantages in the ecological domain (eg Noctiluca scintillans vs zooplankton in the Black Sea Bodini et al 2018) and power or information asymmetries between socioeconomic actors (Bousquet et al 2015) Therefore exploring alternative scenarios by constraining the strength of some interactions would be of great benefit for modeling SESs It should also be noticed that a uniform distribution is considered by default for randomly sampling the strength but it could be substituted by either normal or skewed (eg Poisson) distributions
Concluding remarksThe central issue in the study of SESs is to understand interdependencies that cross the boundaries of the classical domains in which scientific and operational knowledge have been settled Contributions in this respect are expected from tools that allow reconstructing the causal chains that give rise to such interdependencies and that involve variables or components of different nature For such reconstruction to be effective tools must overcome the barriers that make communication between domains difficult (1) the simpler the language used to describe the phenomena and the interactions the better it is (2) a lower level of technicality in the algorithms facilitates understanding the outcomes and (3) flexibility widens the range of applicability to different contexts Loop analysis shares most of these features (1) by classifying the interactions in only two categories positive and negative it facilitates creating connections between variables that differ dramatically in physical form (2) the ease by which a model can be constructed as a graph allows keeping up with rapidly changing conditions (ie variables andor links disappear and others become important) (3) the algorithm for predictions refers directly to structural features of the graph and can be visualized thus making the outcomes easier to understand and (4) it is also characterized by a wide applicability (often the question of interest is not a particular system but a whole class of systems with some similarity of structure) Furthermore loop analysis emphasizes the understanding of mechanisms which is a prime objective when an intellectual and operative framework is taking shape as in the case of SESs
Understanding SocialndashEcological Systems using Loop Analysis
53
ReferencesAnthony K R Dambacher J M Walshe T amp Beeden R (2013) A framework for
understanding cumulative impacts supporting environmental decisions and informing resilience-based management of the Great Barrier Reef World Heritage Area Australian Institute of Marine Science CSIRO NERP Decisions Hub University of Melbourne and Great Barrier Reef Marine Park Authority hdlhandlenet110172850
Bender E A Case T J amp Gilpin M E (1984) Perturbation experiments in community ecology Theory and practice Ecology 65(1) 1ndash13 doiorg1023071939452
Binder C R Hinkel J Bots P W G amp Pahl-Wostl C (2013) Comparison of frameworks for analyzing socialndashecological systems Ecology and Society 18(4) Article 26 doiorg 105751es-05551-180426
Bodini A (2000) Reconstructing trophic interactions as a tool for understanding and managing ecosystems Application to a shallow eutrophic lake Canadian Journal of Fisheries and Aquatic Sciences 57(10) 1999ndash2009 doiorg101139f00-153
Bodini A amp Clerici N (2016) Vegetation herbivores and fires in savanna ecosystems A network perspective Ecological Complexity 28 36ndash46 doiorg101016jecocom 201610001
Bodini A Ricci A amp Viaroli P (2000) A multimethodological approach for the sustainable management of perifluvial wetlands of the Po River (Italy) Environmental Management 26(1) 59ndash72 doiorg101007s002670010071
Bodini A Rocchi M amp Scotti M (2018) Insights into the ecology of the Black Sea through the qualitative loop analysis of the community structure Limnology and Oceanography 63(2) 968ndash984 doiorg101002lno10713
Borsuk M E Stow C A amp Reckhow K H (2004) A Bayesian network of eutrophication models for synthesis prediction and uncertainty analysis Ecological Modelling 173(2ndash3) 219ndash239 doiorg101016jecolmodel200308020
Bousquet F Anderies M Antona M Bassett T Benjaminsen T Bonato O hellip Vassal J-M (2015) Socio-ecological theories and empirical research Comparing socialndashecological schools of thoughts in action [Research report] CIRAD-GREEN halarchives-ouvertesfrhal-01130178
Carey M P Levin P S Townsend H Minello T J Sutton G R Francis T B hellip Ruckelshaus M (2014) Characterizing coastal foodwebs with qualitative links to bridge the gap between the theory and the practice of ecosystem-based management ICES Journal of Marine Science 71(3) 713ndash724 doiorg101093icesjmsfst012
Cinner J E (2011) Socialndashecological traps in reef fisheries Global Environmental Change 21(3) 835ndash839 doiorg101016jgloenvcha201104012
Human Ecology Review Volume 26 Number 2 2020
54
Costanza R amp Mageau M (1999) What is a healthy ecosystem Aquatic Ecology 33(1) 105ndash115 doiorg101023A1009930313242
Dambacher J M Brewer D T Dennis D M Macintyre M amp Foale S (2007) Qualitative modelling of gold mine impacts on Lihir Islandrsquos socioeconomic system and reef-edge fish community Environmental Science amp Technology 41(2) 555ndash562 doiorg 101021es0610333
Dambacher J M Rothlisberg P C amp Loneragan N R (2015) Qualitative mathematical models to support ecosystem‐based management of Australiarsquos Northern Prawn Fishery Ecological Applications 25(1) 278ndash298 doiorg10189013-20301
Downing A S van Nes E H Balirwa J S Beuving J J Bwathondi P O J Chapman L J hellip Mooij W M (2014) Coupled human and natural system dynamics as key to the sustainability of Lake Victoriarsquos ecosystem services Ecology and Society 19(4) Article 31 doiorg105751es-06965-190431
Espinoza-Tenorio A Wolff M Espejel I amp Montantildeo-Moctezuma G (2013) Using traditional ecological knowledge to improve holistic fisheries management Transdisciplinary modeling of a lagoon ecosystem of Southern Mexico Ecology and Society 18(2) Article 6 doiorg105751es-05369-180206
Folke C (2006) Resilience The emergence of a perspective for socialndashecological systems analyses Global Environmental Change 16(3) 253ndash267 doiorg101016jgloenvcha 200604002
Haines-Young R amp Potschin M (2010) The links between biodiversity ecosystem services and human well-being In D G Raffaelli amp C L Frid (Eds) Ecosystem ecology A new synthesis (pp 110ndash139) Cambridge University Press doiorg101017cbo978051175 0458007
Hanspach J Hartel T Milcu A I Mikulcak F Dorresteijn I Loos J hellip Fischer J (2014) A holistic approach to studying socialndashecological systems and its application to southern Transylvania Ecology and Society 19(4) Article 32 doiorg105751es-06915-190432
Hilborn R (2007) Defining success in fisheries and conflicts in objectives Marine Policy 31(2) 153ndash158 doiorg101016jmarpol200605014
Hughes T P Bellwood D R Folke C Steneck R S amp Wilson J (2005) New paradigms for supporting the resilience of marine ecosystems Trends in Ecology amp Evolution 20(7) 380ndash386 doiorg101016jtree200503022
Ibaacutentildeez A M amp Veacutelez C E (2008) Civil conflict and forced migration The micro determinants and welfare losses of displacement in Colombia World Development 36(4) 659ndash676 doiorg101016jworlddev200704013
Justus J (2006) Loop analysis and qualitative modeling Limitations and merits Biology and Philosophy 21(5) 647ndash666 doiorg101007s10539-006-9050-x
Understanding SocialndashEcological Systems using Loop Analysis
55
Kittinger J N Finkbeiner E M Ban N C Broad K Carr M H Cinner J E hellip Crowder L B (2013) Emerging frontiers in social-ecological systems research for sustainability of small-scale fisheries Current Opinion on Environmental Sustainability 5(3ndash4) 352ndash357 doiorg101016jcosust201306008
Kok K (2009) The potential of fuzzy cognitive maps for semi-quantitative scenario development with an example from Brazil Global Environmental Change 19(1) 122ndash133 doiorg101016jgloenvcha200808003
Lane D C (2008) The emergence and use of diagramming in system dynamics A critical account Systems Research and Behavioral Science 25(1) 3ndash23 doiorg101002sres826
Leslie H M Basurto X Nenadovic M Sievanen L Cavanaugh K C Cota-Nieto J J hellip Aburto-Oropeza O (2015) Operationalizing the social-ecological systems framework to assess sustainability Proceedings of the National Academy of Sciences of the USA 112(19) 5979ndash5984 doiorg101073pnas1414640112
Levin P S Fogarty M J Murawski S A amp Fluharty D (2009) Integrated ecosystem assessments Developing the scientific basis for ecosystem-based management of the ocean PLoS Biology 7(1) e1000014 doiorg101371journalpbio1000014
Levins R (1968) Evolution in changing environments Some theoretical explorations Princeton University Press
Levins R (1974) Discussion paper The qualitative analysis of partially specified systems Annals of the New York Academy of Sciences 231(1) 123ndash138 doiorg101111 j1749-66321974tb20562x
Levins R (1975) Evolution in communities near equilibrium In M L Cody and J M Diamond (Eds) Ecology and evolution of communities (pp 16ndash50) Harvard University Press
Levins R (1995) Preparing for uncertainty Ecosystem Health 1(1) 47ndash57
Levins R amp Puccia C J (1988) The controlling factor in biological communities Coenoses 3(3) 149ndash154 wwwjstororgstable43460977
Lewontin R C amp Levins R (2007) Educating the intuition to cope with complexity In R C Lewontin amp R Levins (Eds) Biology under the influence Dialectical essays on ecology agriculture and health (pp 183ndash198) Monthly Review Press
Logofet D (1993) Matrices and graphs Stability problems in mathematical ecology CRC Press
Long R D Charles A amp Stephenson R L (2015) Key principles of marine ecosystem-based management Marine Policy 57 53ndash60 doiorg101016jmarpol201501013
Lotze H K Lenihan H S Bourque B J Bradbury R H Cooke R G Kay M C hellip Jackson J B (2006) Depletion degradation and recovery potential of estuaries and coastal seas Science 312(5781) 1806ndash1809 doiorg101126science1128035
Human Ecology Review Volume 26 Number 2 2020
56
Marcot B G Holthausen R S Raphael M G Rowland M M amp Wisdom M J (2001) Using Bayesian belief networks to evaluate fish and wildlife population viability under land management alternatives from an environmental impact statement Forest Ecology and Management 153(1ndash3) 29ndash42 doiorg101016s0378-1127(01)00452-2
Martone R G Bodini A amp Micheli F (2017) Identifying potential consequences of natural perturbations and management decisions on a coastal fishery socialndashecological system using qualitative loop analysis Ecology and Society 22(1) Article 34 doiorg 105751 es-08825-220134
Melbourne-Thomas J Wotherspoon S Raymond B amp Constable A (2012) Comprehensive evaluation of model uncertainty in qualitative network analyses Ecological Monographs 82(4) 505ndash519 doiorg10189012-02071
Micheli F Saenz-Arroyo A Greenley A Vazquez L Espinoza Montes J A Rossetto M amp De Leo G A (2012) Evidence that marine reserves enhance resilience to climatic impacts PLoS ONE 7 e40832 doiorg101371journalpone0040832
Nival P amp Gorsky G (2001) Conditions for blooming of pelagic species In CIESM Workshop Monographs No 14mdashGelatinous zooplankton outbreaks Theory and practice (pp 23ndash27) Commission Internationale pour lrsquoExploration Scientifique de la Meacutediterraneacutee (CIESM [Mediterranean Science Commission])
Ostrom E (2009) A general framework for analyzing sustainability of social-ecological systems Science 325(5939) 419ndash422 doiorg101126science1172133
Oumlzesmi U amp Oumlzesmi S L (2004) Ecological models based on peoplersquos knowledge A multi-step fuzzy cognitive mapping approach Ecological Modelling 176(1ndash2) 43ndash64 doiorg101016jecolmodel200310027
Partelow S Fujitani M Soundararajan V amp Schluumlter A (2019) Transforming the social-ecological systems framework into a knowledge exchange and deliberation tool for comanagement Ecology and Society 24(1) Article 15 doiorg105751es-10724-240115
Pollino C A Woodberry O Nicholson A Korb K amp Hart B T (2007) Parameterisation and evaluation of a Bayesian network for use in an ecological risk assessment Environmental Modelling amp Software 22(8) 1140ndash1152 doiorg101016jenvsoft200603006
Puccia C J amp Levins R (1985) Qualitative modeling of complex systems An introduction to loop analysis and time averaging Harvard University Press
Raoux A Dambacher J M Pezy J P Mazeacute C Dauvin J C amp Niquil N (2018) Assessing cumulative sociondashecological impacts of offshore wind farm development in the Bay of Seine (English Channel) Marine Policy 89 11ndash20 doiorg101016jmarpol 201712007
Reum J C McDonald P S Ferriss B E Farrell D M Harvey C J amp Levin P S (2015) Qualitative network models in support of ecosystem approaches to bivalve aquaculture ICES Journal of Marine Science 72(8) 2278ndash2288 doiorg101093icesjms fsv119
Understanding SocialndashEcological Systems using Loop Analysis
57
Richardson G P (1997) Problems in causal loop diagrams revisited System Dynamics Review 13(3) 247ndash252 doiorg101002(sici)1099-1727(199723)133lt247aid-sdr 128gt 30co2-9
Stachowicz J J Fried H Osman R W amp Whitlatch R B (2002) Biodiversity invasion resistance and marine ecosystem function Reconciling pattern and process Ecology 83(9) 2575ndash2590 doiorg1018900012-9658(2002)083[2575birame]20co2
Stier A C Samhouri J F Gray S Martone R G Mach M E Halpern B S hellip Levin P S (2017) Integrating expert perceptions into food web conservation and management Conservation Letters 10(1) 67ndash76 doiorg101111conl12245
Stylios C D amp Groumpos P P (1999) A soft computing approach for modelling the supervisor of manufacturing systems Journal of Intelligent and Robotic Systems 26(3ndash4) 389ndash403 doiorg101023A1008165916707
Sweeney L B amp Sterman J (2007) Thinking about systems Student and teacher conceptions of natural and social systems System Dynamics Review 23(2ndash3) 285ndash311 doiorg101002sdr366
Tenza A Peacuterez I Martiacutenez-Fernaacutendez J amp Gimeacutenez A (2017) Understanding the decline and resilience loss of a long-lived social-ecological system Insights from system dynamics Ecology and Society 22(2) Article 15 doiorg105751es-09176-220215
Ticehurst J L Newham L T Rissik D Letcher R A amp Jakeman A J (2007) A Bayesian network approach for assessing the sustainability of coastal lakes in New South Wales Australia Environmental Modelling amp Software 22(8) 1129ndash1139 doiorg101016 jenvsoft 200603003
Worm B Barbier E B Beaumont N Duffy J E Folke C Halpern B S hellip Watson R (2006) Impacts of biodiversity loss on ocean ecosystem services Science 314(5800) 787ndash790 doiorg101126science1132294
Yasuoka J Jimba M amp Levins R (2014) Application of loop analysis for evaluation of malaria control interventions Malaria Journal 13 Article 140 doiorg1011861475-2875-13-140
This text is taken from Human Ecology Review Volume 26 Number 2 2020 published by ANU Press The Australian National University Canberra Australia
doiorg1022459HER2602202003

Human Ecology Review Volume 26 Number 2 2020
44
variable xi to the effect variable xj The complementary feedback can be envisioned as a reflecting barrier if it is negative and strong the more an impact is reflected back to the effect variable If it is positive then the effect variable changes in the opposite direction from the sign of the path The overall feedback the denominator of the formula measures the resistance of the whole system to change The responses predicted can be positive (+ increase) negative (minus decrease) or null (0 no change) and are summarized in the table of predictions (Figure 1C) The convention is that effects generated by positive perturbations (those increasing the rate of change of the target variables) on row variables can be read along the columns Consequences of negative perturbations are obtained by reversing the signs of the predictions Consider a positive press perturbation ([partfipartc] gt 0) on node A in Figure 1D If the focus is on the consequences that the press perturbation has on node B then the path is the positive link from A to B and the complementary subsystem is node C alone this latter variable does not form any circuit and the complementary feedback is null (ie equal to 0) The overall feedback is the feedback produced by the circuit that connects all the variables in the system (see Puccia amp Levins 1985 for further details) In the digraph of Figure 1D there is one single circuit that starts and ends with node A and connects all variables This circuit includes one positive and two negative interactions ArarrCndashBndashA its sign is the product of one positive and two negative links and thus it is positive
In graphs with many variables and interactions the number of paths between variables often increases which leads to several ambiguous predictions (ie the positive paths counteract negative paths so that a clear sign of the direction of change cannot be identified) To deal with such ambiguities a simulation approach can be adopted based on a random assignment of strength to each and every link coefficient To make simulations possible the signed digraph is transformed in a matrix using +1 to represent positive (arrowhead) links and minus1 to indicate negative (circle-head) links During simulations the coefficient intensities are taken from a uniform distribution in the interval (01] This means that the +1 and minus1 values in the matrix are substituted by randomly assigned values between 10-6 (the lower boundary equal to 0 is not included) and 1 while the sign is maintained Not all the matrices obtained can be used to compute the predictions but only those that satisfy criteria for stability (see Logofet 1993 for stability conditions matrices must satisfy) According to Bender et al (1984) the net effect that press perturbations targeting the row variable xi have on the column variable xj are expressed by the elements of the inverse of the matrix that is obtained from the signed digraph (for details see Levins 1975) After n simulations an overall table of predictions is constructed by combining the z matrices that are stable and allow matrix inversion For each stable matrix assembled using simulated interaction strengths unambiguous responses in the table of predictions are generated (ie the signs are certain) The overall table of predictions is composed of symbols that depend on the percentages of signs from the various simulation runs Hence if the same entry in the tables of predictions
Understanding SocialndashEcological Systems using Loop Analysis
45
from all z (stable) matrices yields the same sign (+ or minus) then the expected direction of change is unambiguous However during simulations there are cases for which divergent predictions are recorded (ie depending on the random arrangement of interaction strengths the same element in the table of predictions can show either positive or negative sign) The conversion of the outcomes from each simulation run to symbols in the overall table of predictions depends on the percentages of positive (+) and negative (minus) signs The rules to move from simulations results to the overall table of predictions are summarized in Table 1
Table 1 Rules to convert differences between percentages of signs obtained with simulations (ldquo of +rdquo ndash ldquo of ndashrdquo) into predictions (ie signs in the overall table of predictions)
ldquo of +rdquo ndash ldquo of ndashrdquo Corresponding sign in the table[minus100 minus50] minus(minus50 -20) minus (tendency to minus)[minus20 20] 0(20 50) + (tendency to +)[50 100] +0 = 100 0
Notes Round brackets indicate that the extremes are excluded 0 is not a real zero meaning no changes in the biomassabundance of variables but represents neutral results due to relatively balanced amounts of negative and positive effects When after the complete set of simulations there are entries for which the absence of any effect was always recorded then the symbol in the overall table of predictions is 0 indicating proper absence of effect (see the last row of the table 0 = 100)Source Authorsrsquo summary
Merits and limitations of loop analysis to model SESsLoop analysis is particularly suitable to investigate SESs First interconnections extend beyond the single domains of ecology economy and society to create complex networks For instance after the Nile perch invaded Lake Victoria a dramatic restructuring of the ecological community took place which in turn cascaded into deep societal and economic changes (Downing et al 2014) To disentangle drivers and dynamics of change in such a complex scenario Downing and coworkers designed an eco-social qualitative model that traced connections across disciplinary boundaries Second loop analysis educates intuition to cope with complexity Often complex systems defy our predictions and effects of policies or management interventions are at best ineffective if not damaging (Levins 1995) Failure of policies depends on the feedbacks that are produced by the linkages between the variables and that remain hidden to our comprehension if complexity does not become our central intellectual issue Cinner (2011)
Human Ecology Review Volume 26 Number 2 2020
46
in discussing problems of reef fishery emphasizes that the feedback between social and ecological variables may create socialndashecological traps (eg situations when feedbacks between social and ecological systems lead toward an undesirable state that may be difficult or impossible to reverse) It is extremely interesting to explore these phenomena by loop analysis which by disentangling feedback loops helps make the arcane obvious This capability however cannot be fully exploited if the feedback structure of the systems is not adequately represented and the relationships between the variables remain mostly unidirectional the potential may instead emerge when social and environmental variables are incorporated in a unique model (Dambacher et al 2007) Third loop analysis proposes a rigorous approach to diagnosis Diagnostic approaches are more often requested in the analysis of SESs to causally understand the multiple outcomes that can arise from the interaction of different system attributes (Kittinger et al 2013) The table of predictions the main outcome of loop analysis allows the disentangling of causative mechanisms by linking correlation patterns sources of change and network structure (Bodini amp Clerici 2016 Bodini et al 2018) For any entry point of press perturbation (any row in the table of predictions see Figure 1C) variables are predicted to change so that correlation patterns among them emerge By comparing such patterns with observed changes in the level of the variables one can identify which component is affected by external drivers and find the cause and effect mechanisms responsible for those changes due to the linkage structure Fourth loop analysis incorporates external drivers as inputs to the rate of change of the variables External drivers both social and biophysical have been described as playing an important role in SES dynamics (Kittinger et al 2013) For example in Baja California (Mexico) climate-driven hypoxia caused an excess mortality in marine species with limited mobility resulting in declines of stocks targeted by small-scale local fisheries which in turn caused small-scale fishers to switch fishing effort toward less-affected species (Micheli et al 2012) Such effect was explored in a scenario analysis using loop analysis which predicted large-scale consequences of this external driver (Martone et al 2017) Fifth the intuitive visualization of the entities and the interactions among them is suitable for accommodating the general framework proposed by Ostrom (2009) for analyzing the sustainability of SESs Each node in the digraph can be one of the four elements (ie core subsystems governance system resource users resource system and resource units) and either positive or negative links can visualize their direct relationships So far the main focus has been dedicated to the visualization of ecological variables and interactions and the inclusion of socialndasheconomic aspects has been treated as external to the system (Carey et al 2014 Espinoza-Tenorio et al 2013 Reum et al 2015) Finally the simple graphical format that constitutes the input for the loop analysis facilitates the participation of all stakeholders to model construction Although most of the current applications adopted a top-down approach to embed management strategies in models (ie literature data were consulted to define the interactions) the study of Espinoza-
Understanding SocialndashEcological Systems using Loop Analysis
47
Tenorio et al (2013) presents a valid alternative In that work both quantitative and qualitative information regarding the biological and social aspects of fisheries dynamics and management were retrieved using structured interviews with fishers participatory research key informant interviews and workshops
Limitations of the methodology should be taken into account Some limitations have already been discussed (Justus 2006) and here we focus on those that matter with the use of loop analysis in studying SESs First there can be difficulties in defining the timing of changing conditions and that of system response to impacts SESs are resilient and cope with continuous exposure to press perturbations according to adaptive dynamics principles (Folke 2006 Hughes et al 2005) The exact moment at which the system responds to a press perturbation cannot be detected with precision and the contribution of concomitant perturbations may further confound this detection Second the variables of SESs (eg resources and their users) can show asynchronous behavior and heterogeneous geographical distribution (Leslie et al 2015) Their optimization does not necessarily occur at the same temporal and spatial scale an aspect that might remain overlooked when constructing graphs The uneven geographical distribution of the actors might be addressed by including in the models different variables for the same type of user (eg various nodes that indicate the fishers and their interactions in different regions) Third there can be issues in the identification of the variables exposed to press perturbations (ie impacts of overfishing vs climate change) For example while marketing solutions (eg the introduction of ecolabels) can be easily targeted to specific user groups (eg the members of fishing cooperatives see Martone et al 2017) climate change (eg warmer winters) may affect many components of the ecological system with different time of response One possible solution is prioritizing as press perturbation targets the most responsive biological variables (eg jellyfish have faster blooming rates than expected from the body size see Nival amp Gorsky 2001) Finally loop analysis is problematic for assessing nonlinear relationships Nonlinearity can emerge by combining the impacts of pathways of different lengths Longer pathways have lower intensity than shorter ones since the interaction strengths randomly assigned during the simulations are in the interval (01] (ie the intensity of each pathway is obtained by multiplying the strength of its constitutive links that have upper bound equal to 1) To avoid penalizing the impact of longer pathways simulations could be carried out by constraining the lower limit from which interaction strengths are randomly drawn during simulations (ie by setting the lower limits of some ldquostrongrdquo interactions closer to 1) As an alternative one could include nonlinear functions to model those specific interactions that play crucial roles for the dynamics of the SES (eg by relying on previous literature data or results from specific experiments and surveys)
Human Ecology Review Volume 26 Number 2 2020
48
Comparison of loop analysis with other qualitative methods for SESsSESs form complex networks of linkages and loop analysis is designed to qualitatively predict how variables that are embedded in SESs respond to policies and management interventions (eg introduction of new regulations for the exploitation of resources market-based incentives and adoption of new marketing solutions Carey et al 2014 Dambacher et al 2007 Levin et al 2009) A limited number of applications to investigate complex SES have made use of loop analysis but the interest toward the method has taken little ground in the context of fisheries (Anthony et al 2013 Carey et al 2014 Dambacher et al 2015 Espinoza-Tenorio et al 2013 Martone et al 2017) These applications highlight that loop analysis has some potential that extends beyond its limitations For example predictions are about the equilibrium level of the variables (Justus 2006) but real systems are generally not at the equilibrium However previous studies have offered evidence that predictions from loop analysis apply successfully to changes in average values of the variables (Bodini 2000) Average values should be long term and Bodini et al (2018) showed that averages taken over either 5 or 10 years can be used to grasp variable responses to press perturbations The appropriate time scale for taking averages however very much depends on the system under investigation
Other qualitative modeling approaches can be used to study SESs Fuzzy cognitive maps (FCMs) is one of these It makes the magnitude of links explicit through a semi-quantification of the relationships that link variables (Kok 2009 Oumlzesmi amp Oumlzesmi 2004) The semi-quantification of the links may resolve the ambiguities typical of loop analysis about the net effect generated by the combination of contrasting pathways Also FCMs can make predictions about multiple simultaneous perturbations Both the state of the variables (ldquoconceptsrdquo in the technical language of FCMs) and the strength of the links (edges between the concepts) are quantified by assigning standardized values in the range [01] for states and [-11] for links Although these are relative values (ie each of them is assigned in relation to the others) some criteria for the quantification must be identified These criteria must be supported by some knowledge about the level of the variables and interactions in the system and in particular the use of FCMs seems appropriate when the estimates of variable state and link strength are the outcomes of either a combination of multiple FCMs from individual stakeholders or a set of values defined through participatory workshops The quantification of variables and interactions requires a certain level of knowledge about the system and it automatically selects the working groups among stakeholders that possess some previous understanding of the system under investigation It follows that FCMs cannot be public reproducible and intelligible in the way that loop analysis is Kok (2009) posits that vague or complex concepts such as ldquoconsumer behaviorrdquo must not be taken into account when applying FCMs
Understanding SocialndashEcological Systems using Loop Analysis
49
because guessing about their magnitude is inherently difficult On the other hand loop analysis allows including ldquoawarenessrdquo in a malaria model (Yasuoka et al 2014) ldquoenvironmental attractivenessrdquo in a tourism model (Bodini et al 2000) and the ldquorole of the unionsrdquo in a model on diabetes (Lewontin amp Levins 2007) In these aspects it seems that FCMs share one limitation with quantitative models the tendency to exclude from the analysis factors that are difficult or impossible to measure no matter if they play a role in the dynamics of the system The connections among the variables in FCMs are designed on the basis of fuzzy conditional statements (ldquoif hellip thenrdquo) that are of the type ldquoif the level of variable A is high that of variable B is lowrdquo Thus connections are deduced from correlations between the variables derived from observing the system (Stylios amp Groumpos 1999) However Levins and Puccia (1988) point out that patterns of correlation depend on the network structure and the entry point of the perturbation For example any two variables may show positive correlation in response to a specific press perturbation but opposite correlation (or no correlation) in response to other press perturbations It follows that defining interactions between variables on the basis of their correlations may be misleading In loop analysis perturbations are variations in parameters that govern the rate of change of variables For example a pollutant triggering an increase in the mortality rate of a population FCMs instead consider the changes in the level of the variables as perturbations To predict say the impacts of a pollutant that affects a population FCMs consider the reduced abundance induced by the pollutant as the initial event (ie the perturbation) on the logical assumption that a toxin by increasing the mortality of a species automatically reduces its abundance Thus the initial event is deduced from a more or less plausible linear sequence of steps This series of events overlooks the fact that the response of the target population to the increased mortality is also mediated by the network of interactions with the other variables and that accordingly often does not follow commonsense linear expectations Such assumption leads to the circular argument that FCMs predict the effects given a cause that is in turn an effect that FCMs should predict On the other hand we can be confident that the pollutant increases the mortality rate of the target population which is the initial event in loop analysis Loop analysis considers the role of the environmental variability in changing the parameters that govern the growth rates of the variables and does not interpret it solely as the cause of variable fluctuations like FCMs do
Causal loop diagrams (CLDs Hanspach et al 2014 Tenza et al 2017) and Bayesian belief networks (BBNs Borsuk et al 2004 Pollino et al 2007) have also been applied for analyzing SESs CLDs make predictions by logically reconstructing the chains of causes and effects between variables on the basis of link polarities (eg the signs of the directed links ie the effects of one variable over the other) Predicting the behavior of complex networks by identifying the feedback effects using link polarity (ie the effect associated to the link positive or negative) is difficult and can lead to misleading interpretations (Lane 2008 Richardson 1997)
Human Ecology Review Volume 26 Number 2 2020
50
Most problems originate from polarities Consider for example the case in which the level of violence displaces people from rural areas and forces them to move to the cities (Colombia is a paradigmatic example see Ibaacutentildeez amp Veacutelez 2008) The causal connections are that level of violence increases the migration rate (positive link) which in turn increases the population level in the city (positive link) Therefore the expected trend is the higher the level of violence the greater the increase of urban population However if the level of violence gets lower the migration rate is reduced but this does not reduce the population in the city as it continues to increase unless an opposite migratory flux occurs Hence the articulation of causal pathways gets difficult because variables can be both standing stocks and rates of change (Sweeney amp Sterman 2007) Similarly specifying the relevant conditional probabilities as required by BBNs can be a laborious and time-consuming process (Marcot et al 2001 Ticehurst et al 2007) Moreover to include feedback mechanisms via cyclic network structures requires dynamic time-explicit BBNs which depend on extensive parameterization Similar to FCMs combining BBNs with loop analysis has great potential for improving predictions and model validation (Anthony et al 2013 Melbourne-Thomas et al 2012 Raoux et al 2018) However it must be emphasized that these applications of BBNs are based on the signs derived from the analysis of the loop models As such their outcomes are contingent on the assumptions and limitations of signed diagraph models
Central for the understanding of the complex causality in SESs is our ability to individuate what the relevant components of the SESs are and diagram their relationships The nature of the linkages among these components determines the spreading of the effects through the system and the overall composition of the linkages generates the feedbacks that amplify or buffer such effects There is no recipe for modeling development but great effort must be devoted to assimilation of facts observations and hypotheses Increasing the reliability of predictions can be possible by designing alternative graphs This iterative procedure allows addressing uncertainty about the system structure and determining which differences matter Robust outcomes may be the effect of a core structure common to all models upon which few links added or removed cannot change radically the predictions The core structure represents the fundamental backbone composed of more certain variables and interactions Disagreements among stakeholders scientists or managers do not limit the application of loop analysis rather they offer the opportunity to involve stakeholders in a participatory model construction (Anthony et al 2013) where different types of system knowledge can be used to determine variables and links that may be important to examine further (Stier et al 2017) The adoption of such a comprehensive system-wide approach aims to formulate management strategies that reconcile ecological integrity and intergenerational equity key dimensions of the sustainable development paradigm
Understanding SocialndashEcological Systems using Loop Analysis
51
Possible developments for the application of loop analysis to SESsMaking predictions is difficult especially when we face the uncertainty associated with new unknown events changing dynamics and lack of quantitative data This is the case for example with climate change which produces completely new phenomena and dynamics In such context an adaptive management that allows for continually assessing new evidence has been called for We believe that in the new scenarios we are facing the method of loop analysis can be helpful It has the necessary adaptability to be used in changing contexts When in doubt about critical linkages and dynamic features alternative models can be developed to find out which differences matter and to reach robust conclusions It is also flexible as it allows including and discarding variables easily and above all it permits working with variables and links that are not readily measurable even though their effects are crucial However its suitability to investigate SESs can be improved in several ways The intricacy of the feedbacks can be better resolved if a specific tool for pathways analysis is developed Returning the total number of pathways and their strength between any pair of variables can show how single pathways contribute to specific effects and which ones are more important in mediating the press perturbations The question of link strength deserves attention We specified in the methodological aspects section that link strength is randomly assigned to interaction links during simulations But this does not contradict the qualitative nature of the method it only serves to assign certainty to paths and feedbacks in order to get unambiguous predictions which remain qualitative in nature as only the direction of change for the variables is predicted Pathway anatomy would help selecting those causal chains that mostly affect system dynamics Other relevant features that would improve the suitability of loop analysis for modeling SESs include (1) considering multiple simultaneous press perturbations and (2) delimiting upper and lower limits for the strength of interactions The first point is related to the fact that SESs are often exposed to different types of disturbances whose interplay gives rise to net cumulative responses that would be useful to disentangle (eg through the identification of the specific causative chains) Considering multiple press perturbations would greatly contribute to building up an effective diagnostic approach (Kittinger et al 2013) For example by loop analysis Bodini et al (2018) diagnosed that multiple press perturbations not only overfishing of small and medium pelagic species were responsible for the restructuring of the Black Sea community during the period 1960ndash1989 Moreover socioeconomic drivers amplify the impacts that are triggered by natural processes for instance both hypoxia and fisheries management affected abalone stock in the Baja California SES (Martone et al 2017) The second line of development is conceived to extend loop analysis in a semi-quantitative direction So far the simulations are performed by randomly sampling interaction strength in the uniform interval (01] There are however cases when some interactions are known
Human Ecology Review Volume 26 Number 2 2020
52
to be either strong or weak in such cases varying the strength of these linkages in the whole interval (01] does not make sense However it is difficult to translate fuzzy concepts such as strong and weak into numbers so that boundaries for the links can be set In this respect sensitivity analysis may help Either the upper (ie 1) or the lower (ie 10-6) limit of the link magnitude could be iteratively changed so that actual boundaries for certain linkages can be identified through a consistency assessment of the outcomes produced For example performing the sensitivity analysis for the strength of specific interactions might help modeling competitive advantages in the ecological domain (eg Noctiluca scintillans vs zooplankton in the Black Sea Bodini et al 2018) and power or information asymmetries between socioeconomic actors (Bousquet et al 2015) Therefore exploring alternative scenarios by constraining the strength of some interactions would be of great benefit for modeling SESs It should also be noticed that a uniform distribution is considered by default for randomly sampling the strength but it could be substituted by either normal or skewed (eg Poisson) distributions
Concluding remarksThe central issue in the study of SESs is to understand interdependencies that cross the boundaries of the classical domains in which scientific and operational knowledge have been settled Contributions in this respect are expected from tools that allow reconstructing the causal chains that give rise to such interdependencies and that involve variables or components of different nature For such reconstruction to be effective tools must overcome the barriers that make communication between domains difficult (1) the simpler the language used to describe the phenomena and the interactions the better it is (2) a lower level of technicality in the algorithms facilitates understanding the outcomes and (3) flexibility widens the range of applicability to different contexts Loop analysis shares most of these features (1) by classifying the interactions in only two categories positive and negative it facilitates creating connections between variables that differ dramatically in physical form (2) the ease by which a model can be constructed as a graph allows keeping up with rapidly changing conditions (ie variables andor links disappear and others become important) (3) the algorithm for predictions refers directly to structural features of the graph and can be visualized thus making the outcomes easier to understand and (4) it is also characterized by a wide applicability (often the question of interest is not a particular system but a whole class of systems with some similarity of structure) Furthermore loop analysis emphasizes the understanding of mechanisms which is a prime objective when an intellectual and operative framework is taking shape as in the case of SESs
Understanding SocialndashEcological Systems using Loop Analysis
53
ReferencesAnthony K R Dambacher J M Walshe T amp Beeden R (2013) A framework for
understanding cumulative impacts supporting environmental decisions and informing resilience-based management of the Great Barrier Reef World Heritage Area Australian Institute of Marine Science CSIRO NERP Decisions Hub University of Melbourne and Great Barrier Reef Marine Park Authority hdlhandlenet110172850
Bender E A Case T J amp Gilpin M E (1984) Perturbation experiments in community ecology Theory and practice Ecology 65(1) 1ndash13 doiorg1023071939452
Binder C R Hinkel J Bots P W G amp Pahl-Wostl C (2013) Comparison of frameworks for analyzing socialndashecological systems Ecology and Society 18(4) Article 26 doiorg 105751es-05551-180426
Bodini A (2000) Reconstructing trophic interactions as a tool for understanding and managing ecosystems Application to a shallow eutrophic lake Canadian Journal of Fisheries and Aquatic Sciences 57(10) 1999ndash2009 doiorg101139f00-153
Bodini A amp Clerici N (2016) Vegetation herbivores and fires in savanna ecosystems A network perspective Ecological Complexity 28 36ndash46 doiorg101016jecocom 201610001
Bodini A Ricci A amp Viaroli P (2000) A multimethodological approach for the sustainable management of perifluvial wetlands of the Po River (Italy) Environmental Management 26(1) 59ndash72 doiorg101007s002670010071
Bodini A Rocchi M amp Scotti M (2018) Insights into the ecology of the Black Sea through the qualitative loop analysis of the community structure Limnology and Oceanography 63(2) 968ndash984 doiorg101002lno10713
Borsuk M E Stow C A amp Reckhow K H (2004) A Bayesian network of eutrophication models for synthesis prediction and uncertainty analysis Ecological Modelling 173(2ndash3) 219ndash239 doiorg101016jecolmodel200308020
Bousquet F Anderies M Antona M Bassett T Benjaminsen T Bonato O hellip Vassal J-M (2015) Socio-ecological theories and empirical research Comparing socialndashecological schools of thoughts in action [Research report] CIRAD-GREEN halarchives-ouvertesfrhal-01130178
Carey M P Levin P S Townsend H Minello T J Sutton G R Francis T B hellip Ruckelshaus M (2014) Characterizing coastal foodwebs with qualitative links to bridge the gap between the theory and the practice of ecosystem-based management ICES Journal of Marine Science 71(3) 713ndash724 doiorg101093icesjmsfst012
Cinner J E (2011) Socialndashecological traps in reef fisheries Global Environmental Change 21(3) 835ndash839 doiorg101016jgloenvcha201104012
Human Ecology Review Volume 26 Number 2 2020
54
Costanza R amp Mageau M (1999) What is a healthy ecosystem Aquatic Ecology 33(1) 105ndash115 doiorg101023A1009930313242
Dambacher J M Brewer D T Dennis D M Macintyre M amp Foale S (2007) Qualitative modelling of gold mine impacts on Lihir Islandrsquos socioeconomic system and reef-edge fish community Environmental Science amp Technology 41(2) 555ndash562 doiorg 101021es0610333
Dambacher J M Rothlisberg P C amp Loneragan N R (2015) Qualitative mathematical models to support ecosystem‐based management of Australiarsquos Northern Prawn Fishery Ecological Applications 25(1) 278ndash298 doiorg10189013-20301
Downing A S van Nes E H Balirwa J S Beuving J J Bwathondi P O J Chapman L J hellip Mooij W M (2014) Coupled human and natural system dynamics as key to the sustainability of Lake Victoriarsquos ecosystem services Ecology and Society 19(4) Article 31 doiorg105751es-06965-190431
Espinoza-Tenorio A Wolff M Espejel I amp Montantildeo-Moctezuma G (2013) Using traditional ecological knowledge to improve holistic fisheries management Transdisciplinary modeling of a lagoon ecosystem of Southern Mexico Ecology and Society 18(2) Article 6 doiorg105751es-05369-180206
Folke C (2006) Resilience The emergence of a perspective for socialndashecological systems analyses Global Environmental Change 16(3) 253ndash267 doiorg101016jgloenvcha 200604002
Haines-Young R amp Potschin M (2010) The links between biodiversity ecosystem services and human well-being In D G Raffaelli amp C L Frid (Eds) Ecosystem ecology A new synthesis (pp 110ndash139) Cambridge University Press doiorg101017cbo978051175 0458007
Hanspach J Hartel T Milcu A I Mikulcak F Dorresteijn I Loos J hellip Fischer J (2014) A holistic approach to studying socialndashecological systems and its application to southern Transylvania Ecology and Society 19(4) Article 32 doiorg105751es-06915-190432
Hilborn R (2007) Defining success in fisheries and conflicts in objectives Marine Policy 31(2) 153ndash158 doiorg101016jmarpol200605014
Hughes T P Bellwood D R Folke C Steneck R S amp Wilson J (2005) New paradigms for supporting the resilience of marine ecosystems Trends in Ecology amp Evolution 20(7) 380ndash386 doiorg101016jtree200503022
Ibaacutentildeez A M amp Veacutelez C E (2008) Civil conflict and forced migration The micro determinants and welfare losses of displacement in Colombia World Development 36(4) 659ndash676 doiorg101016jworlddev200704013
Justus J (2006) Loop analysis and qualitative modeling Limitations and merits Biology and Philosophy 21(5) 647ndash666 doiorg101007s10539-006-9050-x
Understanding SocialndashEcological Systems using Loop Analysis
55
Kittinger J N Finkbeiner E M Ban N C Broad K Carr M H Cinner J E hellip Crowder L B (2013) Emerging frontiers in social-ecological systems research for sustainability of small-scale fisheries Current Opinion on Environmental Sustainability 5(3ndash4) 352ndash357 doiorg101016jcosust201306008
Kok K (2009) The potential of fuzzy cognitive maps for semi-quantitative scenario development with an example from Brazil Global Environmental Change 19(1) 122ndash133 doiorg101016jgloenvcha200808003
Lane D C (2008) The emergence and use of diagramming in system dynamics A critical account Systems Research and Behavioral Science 25(1) 3ndash23 doiorg101002sres826
Leslie H M Basurto X Nenadovic M Sievanen L Cavanaugh K C Cota-Nieto J J hellip Aburto-Oropeza O (2015) Operationalizing the social-ecological systems framework to assess sustainability Proceedings of the National Academy of Sciences of the USA 112(19) 5979ndash5984 doiorg101073pnas1414640112
Levin P S Fogarty M J Murawski S A amp Fluharty D (2009) Integrated ecosystem assessments Developing the scientific basis for ecosystem-based management of the ocean PLoS Biology 7(1) e1000014 doiorg101371journalpbio1000014
Levins R (1968) Evolution in changing environments Some theoretical explorations Princeton University Press
Levins R (1974) Discussion paper The qualitative analysis of partially specified systems Annals of the New York Academy of Sciences 231(1) 123ndash138 doiorg101111 j1749-66321974tb20562x
Levins R (1975) Evolution in communities near equilibrium In M L Cody and J M Diamond (Eds) Ecology and evolution of communities (pp 16ndash50) Harvard University Press
Levins R (1995) Preparing for uncertainty Ecosystem Health 1(1) 47ndash57
Levins R amp Puccia C J (1988) The controlling factor in biological communities Coenoses 3(3) 149ndash154 wwwjstororgstable43460977
Lewontin R C amp Levins R (2007) Educating the intuition to cope with complexity In R C Lewontin amp R Levins (Eds) Biology under the influence Dialectical essays on ecology agriculture and health (pp 183ndash198) Monthly Review Press
Logofet D (1993) Matrices and graphs Stability problems in mathematical ecology CRC Press
Long R D Charles A amp Stephenson R L (2015) Key principles of marine ecosystem-based management Marine Policy 57 53ndash60 doiorg101016jmarpol201501013
Lotze H K Lenihan H S Bourque B J Bradbury R H Cooke R G Kay M C hellip Jackson J B (2006) Depletion degradation and recovery potential of estuaries and coastal seas Science 312(5781) 1806ndash1809 doiorg101126science1128035
Human Ecology Review Volume 26 Number 2 2020
56
Marcot B G Holthausen R S Raphael M G Rowland M M amp Wisdom M J (2001) Using Bayesian belief networks to evaluate fish and wildlife population viability under land management alternatives from an environmental impact statement Forest Ecology and Management 153(1ndash3) 29ndash42 doiorg101016s0378-1127(01)00452-2
Martone R G Bodini A amp Micheli F (2017) Identifying potential consequences of natural perturbations and management decisions on a coastal fishery socialndashecological system using qualitative loop analysis Ecology and Society 22(1) Article 34 doiorg 105751 es-08825-220134
Melbourne-Thomas J Wotherspoon S Raymond B amp Constable A (2012) Comprehensive evaluation of model uncertainty in qualitative network analyses Ecological Monographs 82(4) 505ndash519 doiorg10189012-02071
Micheli F Saenz-Arroyo A Greenley A Vazquez L Espinoza Montes J A Rossetto M amp De Leo G A (2012) Evidence that marine reserves enhance resilience to climatic impacts PLoS ONE 7 e40832 doiorg101371journalpone0040832
Nival P amp Gorsky G (2001) Conditions for blooming of pelagic species In CIESM Workshop Monographs No 14mdashGelatinous zooplankton outbreaks Theory and practice (pp 23ndash27) Commission Internationale pour lrsquoExploration Scientifique de la Meacutediterraneacutee (CIESM [Mediterranean Science Commission])
Ostrom E (2009) A general framework for analyzing sustainability of social-ecological systems Science 325(5939) 419ndash422 doiorg101126science1172133
Oumlzesmi U amp Oumlzesmi S L (2004) Ecological models based on peoplersquos knowledge A multi-step fuzzy cognitive mapping approach Ecological Modelling 176(1ndash2) 43ndash64 doiorg101016jecolmodel200310027
Partelow S Fujitani M Soundararajan V amp Schluumlter A (2019) Transforming the social-ecological systems framework into a knowledge exchange and deliberation tool for comanagement Ecology and Society 24(1) Article 15 doiorg105751es-10724-240115
Pollino C A Woodberry O Nicholson A Korb K amp Hart B T (2007) Parameterisation and evaluation of a Bayesian network for use in an ecological risk assessment Environmental Modelling amp Software 22(8) 1140ndash1152 doiorg101016jenvsoft200603006
Puccia C J amp Levins R (1985) Qualitative modeling of complex systems An introduction to loop analysis and time averaging Harvard University Press
Raoux A Dambacher J M Pezy J P Mazeacute C Dauvin J C amp Niquil N (2018) Assessing cumulative sociondashecological impacts of offshore wind farm development in the Bay of Seine (English Channel) Marine Policy 89 11ndash20 doiorg101016jmarpol 201712007
Reum J C McDonald P S Ferriss B E Farrell D M Harvey C J amp Levin P S (2015) Qualitative network models in support of ecosystem approaches to bivalve aquaculture ICES Journal of Marine Science 72(8) 2278ndash2288 doiorg101093icesjms fsv119
Understanding SocialndashEcological Systems using Loop Analysis
57
Richardson G P (1997) Problems in causal loop diagrams revisited System Dynamics Review 13(3) 247ndash252 doiorg101002(sici)1099-1727(199723)133lt247aid-sdr 128gt 30co2-9
Stachowicz J J Fried H Osman R W amp Whitlatch R B (2002) Biodiversity invasion resistance and marine ecosystem function Reconciling pattern and process Ecology 83(9) 2575ndash2590 doiorg1018900012-9658(2002)083[2575birame]20co2
Stier A C Samhouri J F Gray S Martone R G Mach M E Halpern B S hellip Levin P S (2017) Integrating expert perceptions into food web conservation and management Conservation Letters 10(1) 67ndash76 doiorg101111conl12245
Stylios C D amp Groumpos P P (1999) A soft computing approach for modelling the supervisor of manufacturing systems Journal of Intelligent and Robotic Systems 26(3ndash4) 389ndash403 doiorg101023A1008165916707
Sweeney L B amp Sterman J (2007) Thinking about systems Student and teacher conceptions of natural and social systems System Dynamics Review 23(2ndash3) 285ndash311 doiorg101002sdr366
Tenza A Peacuterez I Martiacutenez-Fernaacutendez J amp Gimeacutenez A (2017) Understanding the decline and resilience loss of a long-lived social-ecological system Insights from system dynamics Ecology and Society 22(2) Article 15 doiorg105751es-09176-220215
Ticehurst J L Newham L T Rissik D Letcher R A amp Jakeman A J (2007) A Bayesian network approach for assessing the sustainability of coastal lakes in New South Wales Australia Environmental Modelling amp Software 22(8) 1129ndash1139 doiorg101016 jenvsoft 200603003
Worm B Barbier E B Beaumont N Duffy J E Folke C Halpern B S hellip Watson R (2006) Impacts of biodiversity loss on ocean ecosystem services Science 314(5800) 787ndash790 doiorg101126science1132294
Yasuoka J Jimba M amp Levins R (2014) Application of loop analysis for evaluation of malaria control interventions Malaria Journal 13 Article 140 doiorg1011861475-2875-13-140
This text is taken from Human Ecology Review Volume 26 Number 2 2020 published by ANU Press The Australian National University Canberra Australia
doiorg1022459HER2602202003
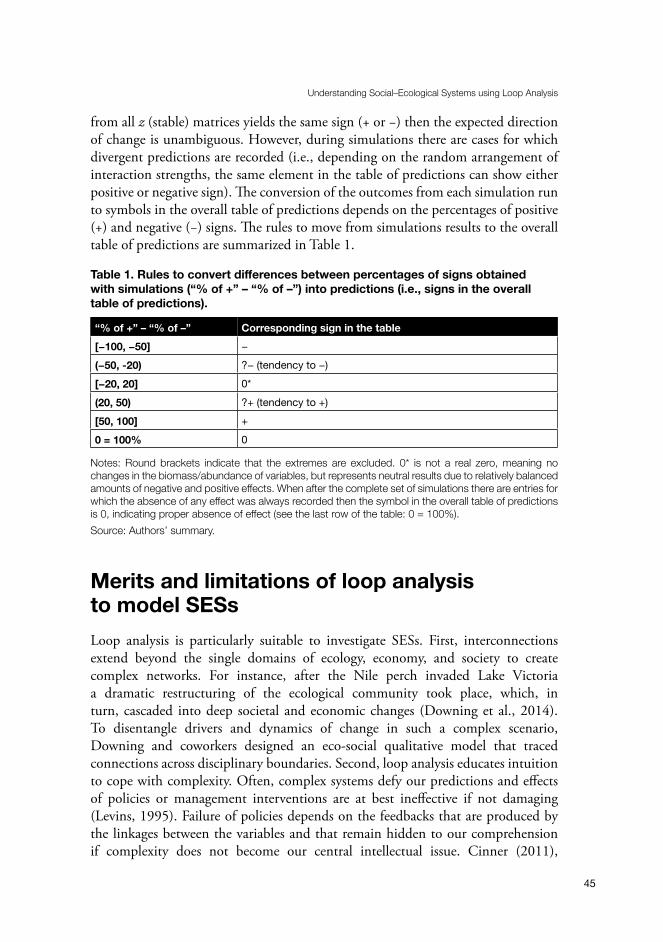
Understanding SocialndashEcological Systems using Loop Analysis
45
from all z (stable) matrices yields the same sign (+ or minus) then the expected direction of change is unambiguous However during simulations there are cases for which divergent predictions are recorded (ie depending on the random arrangement of interaction strengths the same element in the table of predictions can show either positive or negative sign) The conversion of the outcomes from each simulation run to symbols in the overall table of predictions depends on the percentages of positive (+) and negative (minus) signs The rules to move from simulations results to the overall table of predictions are summarized in Table 1
Table 1 Rules to convert differences between percentages of signs obtained with simulations (ldquo of +rdquo ndash ldquo of ndashrdquo) into predictions (ie signs in the overall table of predictions)
ldquo of +rdquo ndash ldquo of ndashrdquo Corresponding sign in the table[minus100 minus50] minus(minus50 -20) minus (tendency to minus)[minus20 20] 0(20 50) + (tendency to +)[50 100] +0 = 100 0
Notes Round brackets indicate that the extremes are excluded 0 is not a real zero meaning no changes in the biomassabundance of variables but represents neutral results due to relatively balanced amounts of negative and positive effects When after the complete set of simulations there are entries for which the absence of any effect was always recorded then the symbol in the overall table of predictions is 0 indicating proper absence of effect (see the last row of the table 0 = 100)Source Authorsrsquo summary
Merits and limitations of loop analysis to model SESsLoop analysis is particularly suitable to investigate SESs First interconnections extend beyond the single domains of ecology economy and society to create complex networks For instance after the Nile perch invaded Lake Victoria a dramatic restructuring of the ecological community took place which in turn cascaded into deep societal and economic changes (Downing et al 2014) To disentangle drivers and dynamics of change in such a complex scenario Downing and coworkers designed an eco-social qualitative model that traced connections across disciplinary boundaries Second loop analysis educates intuition to cope with complexity Often complex systems defy our predictions and effects of policies or management interventions are at best ineffective if not damaging (Levins 1995) Failure of policies depends on the feedbacks that are produced by the linkages between the variables and that remain hidden to our comprehension if complexity does not become our central intellectual issue Cinner (2011)
Human Ecology Review Volume 26 Number 2 2020
46
in discussing problems of reef fishery emphasizes that the feedback between social and ecological variables may create socialndashecological traps (eg situations when feedbacks between social and ecological systems lead toward an undesirable state that may be difficult or impossible to reverse) It is extremely interesting to explore these phenomena by loop analysis which by disentangling feedback loops helps make the arcane obvious This capability however cannot be fully exploited if the feedback structure of the systems is not adequately represented and the relationships between the variables remain mostly unidirectional the potential may instead emerge when social and environmental variables are incorporated in a unique model (Dambacher et al 2007) Third loop analysis proposes a rigorous approach to diagnosis Diagnostic approaches are more often requested in the analysis of SESs to causally understand the multiple outcomes that can arise from the interaction of different system attributes (Kittinger et al 2013) The table of predictions the main outcome of loop analysis allows the disentangling of causative mechanisms by linking correlation patterns sources of change and network structure (Bodini amp Clerici 2016 Bodini et al 2018) For any entry point of press perturbation (any row in the table of predictions see Figure 1C) variables are predicted to change so that correlation patterns among them emerge By comparing such patterns with observed changes in the level of the variables one can identify which component is affected by external drivers and find the cause and effect mechanisms responsible for those changes due to the linkage structure Fourth loop analysis incorporates external drivers as inputs to the rate of change of the variables External drivers both social and biophysical have been described as playing an important role in SES dynamics (Kittinger et al 2013) For example in Baja California (Mexico) climate-driven hypoxia caused an excess mortality in marine species with limited mobility resulting in declines of stocks targeted by small-scale local fisheries which in turn caused small-scale fishers to switch fishing effort toward less-affected species (Micheli et al 2012) Such effect was explored in a scenario analysis using loop analysis which predicted large-scale consequences of this external driver (Martone et al 2017) Fifth the intuitive visualization of the entities and the interactions among them is suitable for accommodating the general framework proposed by Ostrom (2009) for analyzing the sustainability of SESs Each node in the digraph can be one of the four elements (ie core subsystems governance system resource users resource system and resource units) and either positive or negative links can visualize their direct relationships So far the main focus has been dedicated to the visualization of ecological variables and interactions and the inclusion of socialndasheconomic aspects has been treated as external to the system (Carey et al 2014 Espinoza-Tenorio et al 2013 Reum et al 2015) Finally the simple graphical format that constitutes the input for the loop analysis facilitates the participation of all stakeholders to model construction Although most of the current applications adopted a top-down approach to embed management strategies in models (ie literature data were consulted to define the interactions) the study of Espinoza-
Understanding SocialndashEcological Systems using Loop Analysis
47
Tenorio et al (2013) presents a valid alternative In that work both quantitative and qualitative information regarding the biological and social aspects of fisheries dynamics and management were retrieved using structured interviews with fishers participatory research key informant interviews and workshops
Limitations of the methodology should be taken into account Some limitations have already been discussed (Justus 2006) and here we focus on those that matter with the use of loop analysis in studying SESs First there can be difficulties in defining the timing of changing conditions and that of system response to impacts SESs are resilient and cope with continuous exposure to press perturbations according to adaptive dynamics principles (Folke 2006 Hughes et al 2005) The exact moment at which the system responds to a press perturbation cannot be detected with precision and the contribution of concomitant perturbations may further confound this detection Second the variables of SESs (eg resources and their users) can show asynchronous behavior and heterogeneous geographical distribution (Leslie et al 2015) Their optimization does not necessarily occur at the same temporal and spatial scale an aspect that might remain overlooked when constructing graphs The uneven geographical distribution of the actors might be addressed by including in the models different variables for the same type of user (eg various nodes that indicate the fishers and their interactions in different regions) Third there can be issues in the identification of the variables exposed to press perturbations (ie impacts of overfishing vs climate change) For example while marketing solutions (eg the introduction of ecolabels) can be easily targeted to specific user groups (eg the members of fishing cooperatives see Martone et al 2017) climate change (eg warmer winters) may affect many components of the ecological system with different time of response One possible solution is prioritizing as press perturbation targets the most responsive biological variables (eg jellyfish have faster blooming rates than expected from the body size see Nival amp Gorsky 2001) Finally loop analysis is problematic for assessing nonlinear relationships Nonlinearity can emerge by combining the impacts of pathways of different lengths Longer pathways have lower intensity than shorter ones since the interaction strengths randomly assigned during the simulations are in the interval (01] (ie the intensity of each pathway is obtained by multiplying the strength of its constitutive links that have upper bound equal to 1) To avoid penalizing the impact of longer pathways simulations could be carried out by constraining the lower limit from which interaction strengths are randomly drawn during simulations (ie by setting the lower limits of some ldquostrongrdquo interactions closer to 1) As an alternative one could include nonlinear functions to model those specific interactions that play crucial roles for the dynamics of the SES (eg by relying on previous literature data or results from specific experiments and surveys)
Human Ecology Review Volume 26 Number 2 2020
48
Comparison of loop analysis with other qualitative methods for SESsSESs form complex networks of linkages and loop analysis is designed to qualitatively predict how variables that are embedded in SESs respond to policies and management interventions (eg introduction of new regulations for the exploitation of resources market-based incentives and adoption of new marketing solutions Carey et al 2014 Dambacher et al 2007 Levin et al 2009) A limited number of applications to investigate complex SES have made use of loop analysis but the interest toward the method has taken little ground in the context of fisheries (Anthony et al 2013 Carey et al 2014 Dambacher et al 2015 Espinoza-Tenorio et al 2013 Martone et al 2017) These applications highlight that loop analysis has some potential that extends beyond its limitations For example predictions are about the equilibrium level of the variables (Justus 2006) but real systems are generally not at the equilibrium However previous studies have offered evidence that predictions from loop analysis apply successfully to changes in average values of the variables (Bodini 2000) Average values should be long term and Bodini et al (2018) showed that averages taken over either 5 or 10 years can be used to grasp variable responses to press perturbations The appropriate time scale for taking averages however very much depends on the system under investigation
Other qualitative modeling approaches can be used to study SESs Fuzzy cognitive maps (FCMs) is one of these It makes the magnitude of links explicit through a semi-quantification of the relationships that link variables (Kok 2009 Oumlzesmi amp Oumlzesmi 2004) The semi-quantification of the links may resolve the ambiguities typical of loop analysis about the net effect generated by the combination of contrasting pathways Also FCMs can make predictions about multiple simultaneous perturbations Both the state of the variables (ldquoconceptsrdquo in the technical language of FCMs) and the strength of the links (edges between the concepts) are quantified by assigning standardized values in the range [01] for states and [-11] for links Although these are relative values (ie each of them is assigned in relation to the others) some criteria for the quantification must be identified These criteria must be supported by some knowledge about the level of the variables and interactions in the system and in particular the use of FCMs seems appropriate when the estimates of variable state and link strength are the outcomes of either a combination of multiple FCMs from individual stakeholders or a set of values defined through participatory workshops The quantification of variables and interactions requires a certain level of knowledge about the system and it automatically selects the working groups among stakeholders that possess some previous understanding of the system under investigation It follows that FCMs cannot be public reproducible and intelligible in the way that loop analysis is Kok (2009) posits that vague or complex concepts such as ldquoconsumer behaviorrdquo must not be taken into account when applying FCMs
Understanding SocialndashEcological Systems using Loop Analysis
49
because guessing about their magnitude is inherently difficult On the other hand loop analysis allows including ldquoawarenessrdquo in a malaria model (Yasuoka et al 2014) ldquoenvironmental attractivenessrdquo in a tourism model (Bodini et al 2000) and the ldquorole of the unionsrdquo in a model on diabetes (Lewontin amp Levins 2007) In these aspects it seems that FCMs share one limitation with quantitative models the tendency to exclude from the analysis factors that are difficult or impossible to measure no matter if they play a role in the dynamics of the system The connections among the variables in FCMs are designed on the basis of fuzzy conditional statements (ldquoif hellip thenrdquo) that are of the type ldquoif the level of variable A is high that of variable B is lowrdquo Thus connections are deduced from correlations between the variables derived from observing the system (Stylios amp Groumpos 1999) However Levins and Puccia (1988) point out that patterns of correlation depend on the network structure and the entry point of the perturbation For example any two variables may show positive correlation in response to a specific press perturbation but opposite correlation (or no correlation) in response to other press perturbations It follows that defining interactions between variables on the basis of their correlations may be misleading In loop analysis perturbations are variations in parameters that govern the rate of change of variables For example a pollutant triggering an increase in the mortality rate of a population FCMs instead consider the changes in the level of the variables as perturbations To predict say the impacts of a pollutant that affects a population FCMs consider the reduced abundance induced by the pollutant as the initial event (ie the perturbation) on the logical assumption that a toxin by increasing the mortality of a species automatically reduces its abundance Thus the initial event is deduced from a more or less plausible linear sequence of steps This series of events overlooks the fact that the response of the target population to the increased mortality is also mediated by the network of interactions with the other variables and that accordingly often does not follow commonsense linear expectations Such assumption leads to the circular argument that FCMs predict the effects given a cause that is in turn an effect that FCMs should predict On the other hand we can be confident that the pollutant increases the mortality rate of the target population which is the initial event in loop analysis Loop analysis considers the role of the environmental variability in changing the parameters that govern the growth rates of the variables and does not interpret it solely as the cause of variable fluctuations like FCMs do
Causal loop diagrams (CLDs Hanspach et al 2014 Tenza et al 2017) and Bayesian belief networks (BBNs Borsuk et al 2004 Pollino et al 2007) have also been applied for analyzing SESs CLDs make predictions by logically reconstructing the chains of causes and effects between variables on the basis of link polarities (eg the signs of the directed links ie the effects of one variable over the other) Predicting the behavior of complex networks by identifying the feedback effects using link polarity (ie the effect associated to the link positive or negative) is difficult and can lead to misleading interpretations (Lane 2008 Richardson 1997)
Human Ecology Review Volume 26 Number 2 2020
50
Most problems originate from polarities Consider for example the case in which the level of violence displaces people from rural areas and forces them to move to the cities (Colombia is a paradigmatic example see Ibaacutentildeez amp Veacutelez 2008) The causal connections are that level of violence increases the migration rate (positive link) which in turn increases the population level in the city (positive link) Therefore the expected trend is the higher the level of violence the greater the increase of urban population However if the level of violence gets lower the migration rate is reduced but this does not reduce the population in the city as it continues to increase unless an opposite migratory flux occurs Hence the articulation of causal pathways gets difficult because variables can be both standing stocks and rates of change (Sweeney amp Sterman 2007) Similarly specifying the relevant conditional probabilities as required by BBNs can be a laborious and time-consuming process (Marcot et al 2001 Ticehurst et al 2007) Moreover to include feedback mechanisms via cyclic network structures requires dynamic time-explicit BBNs which depend on extensive parameterization Similar to FCMs combining BBNs with loop analysis has great potential for improving predictions and model validation (Anthony et al 2013 Melbourne-Thomas et al 2012 Raoux et al 2018) However it must be emphasized that these applications of BBNs are based on the signs derived from the analysis of the loop models As such their outcomes are contingent on the assumptions and limitations of signed diagraph models
Central for the understanding of the complex causality in SESs is our ability to individuate what the relevant components of the SESs are and diagram their relationships The nature of the linkages among these components determines the spreading of the effects through the system and the overall composition of the linkages generates the feedbacks that amplify or buffer such effects There is no recipe for modeling development but great effort must be devoted to assimilation of facts observations and hypotheses Increasing the reliability of predictions can be possible by designing alternative graphs This iterative procedure allows addressing uncertainty about the system structure and determining which differences matter Robust outcomes may be the effect of a core structure common to all models upon which few links added or removed cannot change radically the predictions The core structure represents the fundamental backbone composed of more certain variables and interactions Disagreements among stakeholders scientists or managers do not limit the application of loop analysis rather they offer the opportunity to involve stakeholders in a participatory model construction (Anthony et al 2013) where different types of system knowledge can be used to determine variables and links that may be important to examine further (Stier et al 2017) The adoption of such a comprehensive system-wide approach aims to formulate management strategies that reconcile ecological integrity and intergenerational equity key dimensions of the sustainable development paradigm
Understanding SocialndashEcological Systems using Loop Analysis
51
Possible developments for the application of loop analysis to SESsMaking predictions is difficult especially when we face the uncertainty associated with new unknown events changing dynamics and lack of quantitative data This is the case for example with climate change which produces completely new phenomena and dynamics In such context an adaptive management that allows for continually assessing new evidence has been called for We believe that in the new scenarios we are facing the method of loop analysis can be helpful It has the necessary adaptability to be used in changing contexts When in doubt about critical linkages and dynamic features alternative models can be developed to find out which differences matter and to reach robust conclusions It is also flexible as it allows including and discarding variables easily and above all it permits working with variables and links that are not readily measurable even though their effects are crucial However its suitability to investigate SESs can be improved in several ways The intricacy of the feedbacks can be better resolved if a specific tool for pathways analysis is developed Returning the total number of pathways and their strength between any pair of variables can show how single pathways contribute to specific effects and which ones are more important in mediating the press perturbations The question of link strength deserves attention We specified in the methodological aspects section that link strength is randomly assigned to interaction links during simulations But this does not contradict the qualitative nature of the method it only serves to assign certainty to paths and feedbacks in order to get unambiguous predictions which remain qualitative in nature as only the direction of change for the variables is predicted Pathway anatomy would help selecting those causal chains that mostly affect system dynamics Other relevant features that would improve the suitability of loop analysis for modeling SESs include (1) considering multiple simultaneous press perturbations and (2) delimiting upper and lower limits for the strength of interactions The first point is related to the fact that SESs are often exposed to different types of disturbances whose interplay gives rise to net cumulative responses that would be useful to disentangle (eg through the identification of the specific causative chains) Considering multiple press perturbations would greatly contribute to building up an effective diagnostic approach (Kittinger et al 2013) For example by loop analysis Bodini et al (2018) diagnosed that multiple press perturbations not only overfishing of small and medium pelagic species were responsible for the restructuring of the Black Sea community during the period 1960ndash1989 Moreover socioeconomic drivers amplify the impacts that are triggered by natural processes for instance both hypoxia and fisheries management affected abalone stock in the Baja California SES (Martone et al 2017) The second line of development is conceived to extend loop analysis in a semi-quantitative direction So far the simulations are performed by randomly sampling interaction strength in the uniform interval (01] There are however cases when some interactions are known
Human Ecology Review Volume 26 Number 2 2020
52
to be either strong or weak in such cases varying the strength of these linkages in the whole interval (01] does not make sense However it is difficult to translate fuzzy concepts such as strong and weak into numbers so that boundaries for the links can be set In this respect sensitivity analysis may help Either the upper (ie 1) or the lower (ie 10-6) limit of the link magnitude could be iteratively changed so that actual boundaries for certain linkages can be identified through a consistency assessment of the outcomes produced For example performing the sensitivity analysis for the strength of specific interactions might help modeling competitive advantages in the ecological domain (eg Noctiluca scintillans vs zooplankton in the Black Sea Bodini et al 2018) and power or information asymmetries between socioeconomic actors (Bousquet et al 2015) Therefore exploring alternative scenarios by constraining the strength of some interactions would be of great benefit for modeling SESs It should also be noticed that a uniform distribution is considered by default for randomly sampling the strength but it could be substituted by either normal or skewed (eg Poisson) distributions
Concluding remarksThe central issue in the study of SESs is to understand interdependencies that cross the boundaries of the classical domains in which scientific and operational knowledge have been settled Contributions in this respect are expected from tools that allow reconstructing the causal chains that give rise to such interdependencies and that involve variables or components of different nature For such reconstruction to be effective tools must overcome the barriers that make communication between domains difficult (1) the simpler the language used to describe the phenomena and the interactions the better it is (2) a lower level of technicality in the algorithms facilitates understanding the outcomes and (3) flexibility widens the range of applicability to different contexts Loop analysis shares most of these features (1) by classifying the interactions in only two categories positive and negative it facilitates creating connections between variables that differ dramatically in physical form (2) the ease by which a model can be constructed as a graph allows keeping up with rapidly changing conditions (ie variables andor links disappear and others become important) (3) the algorithm for predictions refers directly to structural features of the graph and can be visualized thus making the outcomes easier to understand and (4) it is also characterized by a wide applicability (often the question of interest is not a particular system but a whole class of systems with some similarity of structure) Furthermore loop analysis emphasizes the understanding of mechanisms which is a prime objective when an intellectual and operative framework is taking shape as in the case of SESs
Understanding SocialndashEcological Systems using Loop Analysis
53
ReferencesAnthony K R Dambacher J M Walshe T amp Beeden R (2013) A framework for
understanding cumulative impacts supporting environmental decisions and informing resilience-based management of the Great Barrier Reef World Heritage Area Australian Institute of Marine Science CSIRO NERP Decisions Hub University of Melbourne and Great Barrier Reef Marine Park Authority hdlhandlenet110172850
Bender E A Case T J amp Gilpin M E (1984) Perturbation experiments in community ecology Theory and practice Ecology 65(1) 1ndash13 doiorg1023071939452
Binder C R Hinkel J Bots P W G amp Pahl-Wostl C (2013) Comparison of frameworks for analyzing socialndashecological systems Ecology and Society 18(4) Article 26 doiorg 105751es-05551-180426
Bodini A (2000) Reconstructing trophic interactions as a tool for understanding and managing ecosystems Application to a shallow eutrophic lake Canadian Journal of Fisheries and Aquatic Sciences 57(10) 1999ndash2009 doiorg101139f00-153
Bodini A amp Clerici N (2016) Vegetation herbivores and fires in savanna ecosystems A network perspective Ecological Complexity 28 36ndash46 doiorg101016jecocom 201610001
Bodini A Ricci A amp Viaroli P (2000) A multimethodological approach for the sustainable management of perifluvial wetlands of the Po River (Italy) Environmental Management 26(1) 59ndash72 doiorg101007s002670010071
Bodini A Rocchi M amp Scotti M (2018) Insights into the ecology of the Black Sea through the qualitative loop analysis of the community structure Limnology and Oceanography 63(2) 968ndash984 doiorg101002lno10713
Borsuk M E Stow C A amp Reckhow K H (2004) A Bayesian network of eutrophication models for synthesis prediction and uncertainty analysis Ecological Modelling 173(2ndash3) 219ndash239 doiorg101016jecolmodel200308020
Bousquet F Anderies M Antona M Bassett T Benjaminsen T Bonato O hellip Vassal J-M (2015) Socio-ecological theories and empirical research Comparing socialndashecological schools of thoughts in action [Research report] CIRAD-GREEN halarchives-ouvertesfrhal-01130178
Carey M P Levin P S Townsend H Minello T J Sutton G R Francis T B hellip Ruckelshaus M (2014) Characterizing coastal foodwebs with qualitative links to bridge the gap between the theory and the practice of ecosystem-based management ICES Journal of Marine Science 71(3) 713ndash724 doiorg101093icesjmsfst012
Cinner J E (2011) Socialndashecological traps in reef fisheries Global Environmental Change 21(3) 835ndash839 doiorg101016jgloenvcha201104012
Human Ecology Review Volume 26 Number 2 2020
54
Costanza R amp Mageau M (1999) What is a healthy ecosystem Aquatic Ecology 33(1) 105ndash115 doiorg101023A1009930313242
Dambacher J M Brewer D T Dennis D M Macintyre M amp Foale S (2007) Qualitative modelling of gold mine impacts on Lihir Islandrsquos socioeconomic system and reef-edge fish community Environmental Science amp Technology 41(2) 555ndash562 doiorg 101021es0610333
Dambacher J M Rothlisberg P C amp Loneragan N R (2015) Qualitative mathematical models to support ecosystem‐based management of Australiarsquos Northern Prawn Fishery Ecological Applications 25(1) 278ndash298 doiorg10189013-20301
Downing A S van Nes E H Balirwa J S Beuving J J Bwathondi P O J Chapman L J hellip Mooij W M (2014) Coupled human and natural system dynamics as key to the sustainability of Lake Victoriarsquos ecosystem services Ecology and Society 19(4) Article 31 doiorg105751es-06965-190431
Espinoza-Tenorio A Wolff M Espejel I amp Montantildeo-Moctezuma G (2013) Using traditional ecological knowledge to improve holistic fisheries management Transdisciplinary modeling of a lagoon ecosystem of Southern Mexico Ecology and Society 18(2) Article 6 doiorg105751es-05369-180206
Folke C (2006) Resilience The emergence of a perspective for socialndashecological systems analyses Global Environmental Change 16(3) 253ndash267 doiorg101016jgloenvcha 200604002
Haines-Young R amp Potschin M (2010) The links between biodiversity ecosystem services and human well-being In D G Raffaelli amp C L Frid (Eds) Ecosystem ecology A new synthesis (pp 110ndash139) Cambridge University Press doiorg101017cbo978051175 0458007
Hanspach J Hartel T Milcu A I Mikulcak F Dorresteijn I Loos J hellip Fischer J (2014) A holistic approach to studying socialndashecological systems and its application to southern Transylvania Ecology and Society 19(4) Article 32 doiorg105751es-06915-190432
Hilborn R (2007) Defining success in fisheries and conflicts in objectives Marine Policy 31(2) 153ndash158 doiorg101016jmarpol200605014
Hughes T P Bellwood D R Folke C Steneck R S amp Wilson J (2005) New paradigms for supporting the resilience of marine ecosystems Trends in Ecology amp Evolution 20(7) 380ndash386 doiorg101016jtree200503022
Ibaacutentildeez A M amp Veacutelez C E (2008) Civil conflict and forced migration The micro determinants and welfare losses of displacement in Colombia World Development 36(4) 659ndash676 doiorg101016jworlddev200704013
Justus J (2006) Loop analysis and qualitative modeling Limitations and merits Biology and Philosophy 21(5) 647ndash666 doiorg101007s10539-006-9050-x
Understanding SocialndashEcological Systems using Loop Analysis
55
Kittinger J N Finkbeiner E M Ban N C Broad K Carr M H Cinner J E hellip Crowder L B (2013) Emerging frontiers in social-ecological systems research for sustainability of small-scale fisheries Current Opinion on Environmental Sustainability 5(3ndash4) 352ndash357 doiorg101016jcosust201306008
Kok K (2009) The potential of fuzzy cognitive maps for semi-quantitative scenario development with an example from Brazil Global Environmental Change 19(1) 122ndash133 doiorg101016jgloenvcha200808003
Lane D C (2008) The emergence and use of diagramming in system dynamics A critical account Systems Research and Behavioral Science 25(1) 3ndash23 doiorg101002sres826
Leslie H M Basurto X Nenadovic M Sievanen L Cavanaugh K C Cota-Nieto J J hellip Aburto-Oropeza O (2015) Operationalizing the social-ecological systems framework to assess sustainability Proceedings of the National Academy of Sciences of the USA 112(19) 5979ndash5984 doiorg101073pnas1414640112
Levin P S Fogarty M J Murawski S A amp Fluharty D (2009) Integrated ecosystem assessments Developing the scientific basis for ecosystem-based management of the ocean PLoS Biology 7(1) e1000014 doiorg101371journalpbio1000014
Levins R (1968) Evolution in changing environments Some theoretical explorations Princeton University Press
Levins R (1974) Discussion paper The qualitative analysis of partially specified systems Annals of the New York Academy of Sciences 231(1) 123ndash138 doiorg101111 j1749-66321974tb20562x
Levins R (1975) Evolution in communities near equilibrium In M L Cody and J M Diamond (Eds) Ecology and evolution of communities (pp 16ndash50) Harvard University Press
Levins R (1995) Preparing for uncertainty Ecosystem Health 1(1) 47ndash57
Levins R amp Puccia C J (1988) The controlling factor in biological communities Coenoses 3(3) 149ndash154 wwwjstororgstable43460977
Lewontin R C amp Levins R (2007) Educating the intuition to cope with complexity In R C Lewontin amp R Levins (Eds) Biology under the influence Dialectical essays on ecology agriculture and health (pp 183ndash198) Monthly Review Press
Logofet D (1993) Matrices and graphs Stability problems in mathematical ecology CRC Press
Long R D Charles A amp Stephenson R L (2015) Key principles of marine ecosystem-based management Marine Policy 57 53ndash60 doiorg101016jmarpol201501013
Lotze H K Lenihan H S Bourque B J Bradbury R H Cooke R G Kay M C hellip Jackson J B (2006) Depletion degradation and recovery potential of estuaries and coastal seas Science 312(5781) 1806ndash1809 doiorg101126science1128035
Human Ecology Review Volume 26 Number 2 2020
56
Marcot B G Holthausen R S Raphael M G Rowland M M amp Wisdom M J (2001) Using Bayesian belief networks to evaluate fish and wildlife population viability under land management alternatives from an environmental impact statement Forest Ecology and Management 153(1ndash3) 29ndash42 doiorg101016s0378-1127(01)00452-2
Martone R G Bodini A amp Micheli F (2017) Identifying potential consequences of natural perturbations and management decisions on a coastal fishery socialndashecological system using qualitative loop analysis Ecology and Society 22(1) Article 34 doiorg 105751 es-08825-220134
Melbourne-Thomas J Wotherspoon S Raymond B amp Constable A (2012) Comprehensive evaluation of model uncertainty in qualitative network analyses Ecological Monographs 82(4) 505ndash519 doiorg10189012-02071
Micheli F Saenz-Arroyo A Greenley A Vazquez L Espinoza Montes J A Rossetto M amp De Leo G A (2012) Evidence that marine reserves enhance resilience to climatic impacts PLoS ONE 7 e40832 doiorg101371journalpone0040832
Nival P amp Gorsky G (2001) Conditions for blooming of pelagic species In CIESM Workshop Monographs No 14mdashGelatinous zooplankton outbreaks Theory and practice (pp 23ndash27) Commission Internationale pour lrsquoExploration Scientifique de la Meacutediterraneacutee (CIESM [Mediterranean Science Commission])
Ostrom E (2009) A general framework for analyzing sustainability of social-ecological systems Science 325(5939) 419ndash422 doiorg101126science1172133
Oumlzesmi U amp Oumlzesmi S L (2004) Ecological models based on peoplersquos knowledge A multi-step fuzzy cognitive mapping approach Ecological Modelling 176(1ndash2) 43ndash64 doiorg101016jecolmodel200310027
Partelow S Fujitani M Soundararajan V amp Schluumlter A (2019) Transforming the social-ecological systems framework into a knowledge exchange and deliberation tool for comanagement Ecology and Society 24(1) Article 15 doiorg105751es-10724-240115
Pollino C A Woodberry O Nicholson A Korb K amp Hart B T (2007) Parameterisation and evaluation of a Bayesian network for use in an ecological risk assessment Environmental Modelling amp Software 22(8) 1140ndash1152 doiorg101016jenvsoft200603006
Puccia C J amp Levins R (1985) Qualitative modeling of complex systems An introduction to loop analysis and time averaging Harvard University Press
Raoux A Dambacher J M Pezy J P Mazeacute C Dauvin J C amp Niquil N (2018) Assessing cumulative sociondashecological impacts of offshore wind farm development in the Bay of Seine (English Channel) Marine Policy 89 11ndash20 doiorg101016jmarpol 201712007
Reum J C McDonald P S Ferriss B E Farrell D M Harvey C J amp Levin P S (2015) Qualitative network models in support of ecosystem approaches to bivalve aquaculture ICES Journal of Marine Science 72(8) 2278ndash2288 doiorg101093icesjms fsv119
Understanding SocialndashEcological Systems using Loop Analysis
57
Richardson G P (1997) Problems in causal loop diagrams revisited System Dynamics Review 13(3) 247ndash252 doiorg101002(sici)1099-1727(199723)133lt247aid-sdr 128gt 30co2-9
Stachowicz J J Fried H Osman R W amp Whitlatch R B (2002) Biodiversity invasion resistance and marine ecosystem function Reconciling pattern and process Ecology 83(9) 2575ndash2590 doiorg1018900012-9658(2002)083[2575birame]20co2
Stier A C Samhouri J F Gray S Martone R G Mach M E Halpern B S hellip Levin P S (2017) Integrating expert perceptions into food web conservation and management Conservation Letters 10(1) 67ndash76 doiorg101111conl12245
Stylios C D amp Groumpos P P (1999) A soft computing approach for modelling the supervisor of manufacturing systems Journal of Intelligent and Robotic Systems 26(3ndash4) 389ndash403 doiorg101023A1008165916707
Sweeney L B amp Sterman J (2007) Thinking about systems Student and teacher conceptions of natural and social systems System Dynamics Review 23(2ndash3) 285ndash311 doiorg101002sdr366
Tenza A Peacuterez I Martiacutenez-Fernaacutendez J amp Gimeacutenez A (2017) Understanding the decline and resilience loss of a long-lived social-ecological system Insights from system dynamics Ecology and Society 22(2) Article 15 doiorg105751es-09176-220215
Ticehurst J L Newham L T Rissik D Letcher R A amp Jakeman A J (2007) A Bayesian network approach for assessing the sustainability of coastal lakes in New South Wales Australia Environmental Modelling amp Software 22(8) 1129ndash1139 doiorg101016 jenvsoft 200603003
Worm B Barbier E B Beaumont N Duffy J E Folke C Halpern B S hellip Watson R (2006) Impacts of biodiversity loss on ocean ecosystem services Science 314(5800) 787ndash790 doiorg101126science1132294
Yasuoka J Jimba M amp Levins R (2014) Application of loop analysis for evaluation of malaria control interventions Malaria Journal 13 Article 140 doiorg1011861475-2875-13-140
This text is taken from Human Ecology Review Volume 26 Number 2 2020 published by ANU Press The Australian National University Canberra Australia
doiorg1022459HER2602202003

Human Ecology Review Volume 26 Number 2 2020
46
in discussing problems of reef fishery emphasizes that the feedback between social and ecological variables may create socialndashecological traps (eg situations when feedbacks between social and ecological systems lead toward an undesirable state that may be difficult or impossible to reverse) It is extremely interesting to explore these phenomena by loop analysis which by disentangling feedback loops helps make the arcane obvious This capability however cannot be fully exploited if the feedback structure of the systems is not adequately represented and the relationships between the variables remain mostly unidirectional the potential may instead emerge when social and environmental variables are incorporated in a unique model (Dambacher et al 2007) Third loop analysis proposes a rigorous approach to diagnosis Diagnostic approaches are more often requested in the analysis of SESs to causally understand the multiple outcomes that can arise from the interaction of different system attributes (Kittinger et al 2013) The table of predictions the main outcome of loop analysis allows the disentangling of causative mechanisms by linking correlation patterns sources of change and network structure (Bodini amp Clerici 2016 Bodini et al 2018) For any entry point of press perturbation (any row in the table of predictions see Figure 1C) variables are predicted to change so that correlation patterns among them emerge By comparing such patterns with observed changes in the level of the variables one can identify which component is affected by external drivers and find the cause and effect mechanisms responsible for those changes due to the linkage structure Fourth loop analysis incorporates external drivers as inputs to the rate of change of the variables External drivers both social and biophysical have been described as playing an important role in SES dynamics (Kittinger et al 2013) For example in Baja California (Mexico) climate-driven hypoxia caused an excess mortality in marine species with limited mobility resulting in declines of stocks targeted by small-scale local fisheries which in turn caused small-scale fishers to switch fishing effort toward less-affected species (Micheli et al 2012) Such effect was explored in a scenario analysis using loop analysis which predicted large-scale consequences of this external driver (Martone et al 2017) Fifth the intuitive visualization of the entities and the interactions among them is suitable for accommodating the general framework proposed by Ostrom (2009) for analyzing the sustainability of SESs Each node in the digraph can be one of the four elements (ie core subsystems governance system resource users resource system and resource units) and either positive or negative links can visualize their direct relationships So far the main focus has been dedicated to the visualization of ecological variables and interactions and the inclusion of socialndasheconomic aspects has been treated as external to the system (Carey et al 2014 Espinoza-Tenorio et al 2013 Reum et al 2015) Finally the simple graphical format that constitutes the input for the loop analysis facilitates the participation of all stakeholders to model construction Although most of the current applications adopted a top-down approach to embed management strategies in models (ie literature data were consulted to define the interactions) the study of Espinoza-
Understanding SocialndashEcological Systems using Loop Analysis
47
Tenorio et al (2013) presents a valid alternative In that work both quantitative and qualitative information regarding the biological and social aspects of fisheries dynamics and management were retrieved using structured interviews with fishers participatory research key informant interviews and workshops
Limitations of the methodology should be taken into account Some limitations have already been discussed (Justus 2006) and here we focus on those that matter with the use of loop analysis in studying SESs First there can be difficulties in defining the timing of changing conditions and that of system response to impacts SESs are resilient and cope with continuous exposure to press perturbations according to adaptive dynamics principles (Folke 2006 Hughes et al 2005) The exact moment at which the system responds to a press perturbation cannot be detected with precision and the contribution of concomitant perturbations may further confound this detection Second the variables of SESs (eg resources and their users) can show asynchronous behavior and heterogeneous geographical distribution (Leslie et al 2015) Their optimization does not necessarily occur at the same temporal and spatial scale an aspect that might remain overlooked when constructing graphs The uneven geographical distribution of the actors might be addressed by including in the models different variables for the same type of user (eg various nodes that indicate the fishers and their interactions in different regions) Third there can be issues in the identification of the variables exposed to press perturbations (ie impacts of overfishing vs climate change) For example while marketing solutions (eg the introduction of ecolabels) can be easily targeted to specific user groups (eg the members of fishing cooperatives see Martone et al 2017) climate change (eg warmer winters) may affect many components of the ecological system with different time of response One possible solution is prioritizing as press perturbation targets the most responsive biological variables (eg jellyfish have faster blooming rates than expected from the body size see Nival amp Gorsky 2001) Finally loop analysis is problematic for assessing nonlinear relationships Nonlinearity can emerge by combining the impacts of pathways of different lengths Longer pathways have lower intensity than shorter ones since the interaction strengths randomly assigned during the simulations are in the interval (01] (ie the intensity of each pathway is obtained by multiplying the strength of its constitutive links that have upper bound equal to 1) To avoid penalizing the impact of longer pathways simulations could be carried out by constraining the lower limit from which interaction strengths are randomly drawn during simulations (ie by setting the lower limits of some ldquostrongrdquo interactions closer to 1) As an alternative one could include nonlinear functions to model those specific interactions that play crucial roles for the dynamics of the SES (eg by relying on previous literature data or results from specific experiments and surveys)
Human Ecology Review Volume 26 Number 2 2020
48
Comparison of loop analysis with other qualitative methods for SESsSESs form complex networks of linkages and loop analysis is designed to qualitatively predict how variables that are embedded in SESs respond to policies and management interventions (eg introduction of new regulations for the exploitation of resources market-based incentives and adoption of new marketing solutions Carey et al 2014 Dambacher et al 2007 Levin et al 2009) A limited number of applications to investigate complex SES have made use of loop analysis but the interest toward the method has taken little ground in the context of fisheries (Anthony et al 2013 Carey et al 2014 Dambacher et al 2015 Espinoza-Tenorio et al 2013 Martone et al 2017) These applications highlight that loop analysis has some potential that extends beyond its limitations For example predictions are about the equilibrium level of the variables (Justus 2006) but real systems are generally not at the equilibrium However previous studies have offered evidence that predictions from loop analysis apply successfully to changes in average values of the variables (Bodini 2000) Average values should be long term and Bodini et al (2018) showed that averages taken over either 5 or 10 years can be used to grasp variable responses to press perturbations The appropriate time scale for taking averages however very much depends on the system under investigation
Other qualitative modeling approaches can be used to study SESs Fuzzy cognitive maps (FCMs) is one of these It makes the magnitude of links explicit through a semi-quantification of the relationships that link variables (Kok 2009 Oumlzesmi amp Oumlzesmi 2004) The semi-quantification of the links may resolve the ambiguities typical of loop analysis about the net effect generated by the combination of contrasting pathways Also FCMs can make predictions about multiple simultaneous perturbations Both the state of the variables (ldquoconceptsrdquo in the technical language of FCMs) and the strength of the links (edges between the concepts) are quantified by assigning standardized values in the range [01] for states and [-11] for links Although these are relative values (ie each of them is assigned in relation to the others) some criteria for the quantification must be identified These criteria must be supported by some knowledge about the level of the variables and interactions in the system and in particular the use of FCMs seems appropriate when the estimates of variable state and link strength are the outcomes of either a combination of multiple FCMs from individual stakeholders or a set of values defined through participatory workshops The quantification of variables and interactions requires a certain level of knowledge about the system and it automatically selects the working groups among stakeholders that possess some previous understanding of the system under investigation It follows that FCMs cannot be public reproducible and intelligible in the way that loop analysis is Kok (2009) posits that vague or complex concepts such as ldquoconsumer behaviorrdquo must not be taken into account when applying FCMs
Understanding SocialndashEcological Systems using Loop Analysis
49
because guessing about their magnitude is inherently difficult On the other hand loop analysis allows including ldquoawarenessrdquo in a malaria model (Yasuoka et al 2014) ldquoenvironmental attractivenessrdquo in a tourism model (Bodini et al 2000) and the ldquorole of the unionsrdquo in a model on diabetes (Lewontin amp Levins 2007) In these aspects it seems that FCMs share one limitation with quantitative models the tendency to exclude from the analysis factors that are difficult or impossible to measure no matter if they play a role in the dynamics of the system The connections among the variables in FCMs are designed on the basis of fuzzy conditional statements (ldquoif hellip thenrdquo) that are of the type ldquoif the level of variable A is high that of variable B is lowrdquo Thus connections are deduced from correlations between the variables derived from observing the system (Stylios amp Groumpos 1999) However Levins and Puccia (1988) point out that patterns of correlation depend on the network structure and the entry point of the perturbation For example any two variables may show positive correlation in response to a specific press perturbation but opposite correlation (or no correlation) in response to other press perturbations It follows that defining interactions between variables on the basis of their correlations may be misleading In loop analysis perturbations are variations in parameters that govern the rate of change of variables For example a pollutant triggering an increase in the mortality rate of a population FCMs instead consider the changes in the level of the variables as perturbations To predict say the impacts of a pollutant that affects a population FCMs consider the reduced abundance induced by the pollutant as the initial event (ie the perturbation) on the logical assumption that a toxin by increasing the mortality of a species automatically reduces its abundance Thus the initial event is deduced from a more or less plausible linear sequence of steps This series of events overlooks the fact that the response of the target population to the increased mortality is also mediated by the network of interactions with the other variables and that accordingly often does not follow commonsense linear expectations Such assumption leads to the circular argument that FCMs predict the effects given a cause that is in turn an effect that FCMs should predict On the other hand we can be confident that the pollutant increases the mortality rate of the target population which is the initial event in loop analysis Loop analysis considers the role of the environmental variability in changing the parameters that govern the growth rates of the variables and does not interpret it solely as the cause of variable fluctuations like FCMs do
Causal loop diagrams (CLDs Hanspach et al 2014 Tenza et al 2017) and Bayesian belief networks (BBNs Borsuk et al 2004 Pollino et al 2007) have also been applied for analyzing SESs CLDs make predictions by logically reconstructing the chains of causes and effects between variables on the basis of link polarities (eg the signs of the directed links ie the effects of one variable over the other) Predicting the behavior of complex networks by identifying the feedback effects using link polarity (ie the effect associated to the link positive or negative) is difficult and can lead to misleading interpretations (Lane 2008 Richardson 1997)
Human Ecology Review Volume 26 Number 2 2020
50
Most problems originate from polarities Consider for example the case in which the level of violence displaces people from rural areas and forces them to move to the cities (Colombia is a paradigmatic example see Ibaacutentildeez amp Veacutelez 2008) The causal connections are that level of violence increases the migration rate (positive link) which in turn increases the population level in the city (positive link) Therefore the expected trend is the higher the level of violence the greater the increase of urban population However if the level of violence gets lower the migration rate is reduced but this does not reduce the population in the city as it continues to increase unless an opposite migratory flux occurs Hence the articulation of causal pathways gets difficult because variables can be both standing stocks and rates of change (Sweeney amp Sterman 2007) Similarly specifying the relevant conditional probabilities as required by BBNs can be a laborious and time-consuming process (Marcot et al 2001 Ticehurst et al 2007) Moreover to include feedback mechanisms via cyclic network structures requires dynamic time-explicit BBNs which depend on extensive parameterization Similar to FCMs combining BBNs with loop analysis has great potential for improving predictions and model validation (Anthony et al 2013 Melbourne-Thomas et al 2012 Raoux et al 2018) However it must be emphasized that these applications of BBNs are based on the signs derived from the analysis of the loop models As such their outcomes are contingent on the assumptions and limitations of signed diagraph models
Central for the understanding of the complex causality in SESs is our ability to individuate what the relevant components of the SESs are and diagram their relationships The nature of the linkages among these components determines the spreading of the effects through the system and the overall composition of the linkages generates the feedbacks that amplify or buffer such effects There is no recipe for modeling development but great effort must be devoted to assimilation of facts observations and hypotheses Increasing the reliability of predictions can be possible by designing alternative graphs This iterative procedure allows addressing uncertainty about the system structure and determining which differences matter Robust outcomes may be the effect of a core structure common to all models upon which few links added or removed cannot change radically the predictions The core structure represents the fundamental backbone composed of more certain variables and interactions Disagreements among stakeholders scientists or managers do not limit the application of loop analysis rather they offer the opportunity to involve stakeholders in a participatory model construction (Anthony et al 2013) where different types of system knowledge can be used to determine variables and links that may be important to examine further (Stier et al 2017) The adoption of such a comprehensive system-wide approach aims to formulate management strategies that reconcile ecological integrity and intergenerational equity key dimensions of the sustainable development paradigm
Understanding SocialndashEcological Systems using Loop Analysis
51
Possible developments for the application of loop analysis to SESsMaking predictions is difficult especially when we face the uncertainty associated with new unknown events changing dynamics and lack of quantitative data This is the case for example with climate change which produces completely new phenomena and dynamics In such context an adaptive management that allows for continually assessing new evidence has been called for We believe that in the new scenarios we are facing the method of loop analysis can be helpful It has the necessary adaptability to be used in changing contexts When in doubt about critical linkages and dynamic features alternative models can be developed to find out which differences matter and to reach robust conclusions It is also flexible as it allows including and discarding variables easily and above all it permits working with variables and links that are not readily measurable even though their effects are crucial However its suitability to investigate SESs can be improved in several ways The intricacy of the feedbacks can be better resolved if a specific tool for pathways analysis is developed Returning the total number of pathways and their strength between any pair of variables can show how single pathways contribute to specific effects and which ones are more important in mediating the press perturbations The question of link strength deserves attention We specified in the methodological aspects section that link strength is randomly assigned to interaction links during simulations But this does not contradict the qualitative nature of the method it only serves to assign certainty to paths and feedbacks in order to get unambiguous predictions which remain qualitative in nature as only the direction of change for the variables is predicted Pathway anatomy would help selecting those causal chains that mostly affect system dynamics Other relevant features that would improve the suitability of loop analysis for modeling SESs include (1) considering multiple simultaneous press perturbations and (2) delimiting upper and lower limits for the strength of interactions The first point is related to the fact that SESs are often exposed to different types of disturbances whose interplay gives rise to net cumulative responses that would be useful to disentangle (eg through the identification of the specific causative chains) Considering multiple press perturbations would greatly contribute to building up an effective diagnostic approach (Kittinger et al 2013) For example by loop analysis Bodini et al (2018) diagnosed that multiple press perturbations not only overfishing of small and medium pelagic species were responsible for the restructuring of the Black Sea community during the period 1960ndash1989 Moreover socioeconomic drivers amplify the impacts that are triggered by natural processes for instance both hypoxia and fisheries management affected abalone stock in the Baja California SES (Martone et al 2017) The second line of development is conceived to extend loop analysis in a semi-quantitative direction So far the simulations are performed by randomly sampling interaction strength in the uniform interval (01] There are however cases when some interactions are known
Human Ecology Review Volume 26 Number 2 2020
52
to be either strong or weak in such cases varying the strength of these linkages in the whole interval (01] does not make sense However it is difficult to translate fuzzy concepts such as strong and weak into numbers so that boundaries for the links can be set In this respect sensitivity analysis may help Either the upper (ie 1) or the lower (ie 10-6) limit of the link magnitude could be iteratively changed so that actual boundaries for certain linkages can be identified through a consistency assessment of the outcomes produced For example performing the sensitivity analysis for the strength of specific interactions might help modeling competitive advantages in the ecological domain (eg Noctiluca scintillans vs zooplankton in the Black Sea Bodini et al 2018) and power or information asymmetries between socioeconomic actors (Bousquet et al 2015) Therefore exploring alternative scenarios by constraining the strength of some interactions would be of great benefit for modeling SESs It should also be noticed that a uniform distribution is considered by default for randomly sampling the strength but it could be substituted by either normal or skewed (eg Poisson) distributions
Concluding remarksThe central issue in the study of SESs is to understand interdependencies that cross the boundaries of the classical domains in which scientific and operational knowledge have been settled Contributions in this respect are expected from tools that allow reconstructing the causal chains that give rise to such interdependencies and that involve variables or components of different nature For such reconstruction to be effective tools must overcome the barriers that make communication between domains difficult (1) the simpler the language used to describe the phenomena and the interactions the better it is (2) a lower level of technicality in the algorithms facilitates understanding the outcomes and (3) flexibility widens the range of applicability to different contexts Loop analysis shares most of these features (1) by classifying the interactions in only two categories positive and negative it facilitates creating connections between variables that differ dramatically in physical form (2) the ease by which a model can be constructed as a graph allows keeping up with rapidly changing conditions (ie variables andor links disappear and others become important) (3) the algorithm for predictions refers directly to structural features of the graph and can be visualized thus making the outcomes easier to understand and (4) it is also characterized by a wide applicability (often the question of interest is not a particular system but a whole class of systems with some similarity of structure) Furthermore loop analysis emphasizes the understanding of mechanisms which is a prime objective when an intellectual and operative framework is taking shape as in the case of SESs
Understanding SocialndashEcological Systems using Loop Analysis
53
ReferencesAnthony K R Dambacher J M Walshe T amp Beeden R (2013) A framework for
understanding cumulative impacts supporting environmental decisions and informing resilience-based management of the Great Barrier Reef World Heritage Area Australian Institute of Marine Science CSIRO NERP Decisions Hub University of Melbourne and Great Barrier Reef Marine Park Authority hdlhandlenet110172850
Bender E A Case T J amp Gilpin M E (1984) Perturbation experiments in community ecology Theory and practice Ecology 65(1) 1ndash13 doiorg1023071939452
Binder C R Hinkel J Bots P W G amp Pahl-Wostl C (2013) Comparison of frameworks for analyzing socialndashecological systems Ecology and Society 18(4) Article 26 doiorg 105751es-05551-180426
Bodini A (2000) Reconstructing trophic interactions as a tool for understanding and managing ecosystems Application to a shallow eutrophic lake Canadian Journal of Fisheries and Aquatic Sciences 57(10) 1999ndash2009 doiorg101139f00-153
Bodini A amp Clerici N (2016) Vegetation herbivores and fires in savanna ecosystems A network perspective Ecological Complexity 28 36ndash46 doiorg101016jecocom 201610001
Bodini A Ricci A amp Viaroli P (2000) A multimethodological approach for the sustainable management of perifluvial wetlands of the Po River (Italy) Environmental Management 26(1) 59ndash72 doiorg101007s002670010071
Bodini A Rocchi M amp Scotti M (2018) Insights into the ecology of the Black Sea through the qualitative loop analysis of the community structure Limnology and Oceanography 63(2) 968ndash984 doiorg101002lno10713
Borsuk M E Stow C A amp Reckhow K H (2004) A Bayesian network of eutrophication models for synthesis prediction and uncertainty analysis Ecological Modelling 173(2ndash3) 219ndash239 doiorg101016jecolmodel200308020
Bousquet F Anderies M Antona M Bassett T Benjaminsen T Bonato O hellip Vassal J-M (2015) Socio-ecological theories and empirical research Comparing socialndashecological schools of thoughts in action [Research report] CIRAD-GREEN halarchives-ouvertesfrhal-01130178
Carey M P Levin P S Townsend H Minello T J Sutton G R Francis T B hellip Ruckelshaus M (2014) Characterizing coastal foodwebs with qualitative links to bridge the gap between the theory and the practice of ecosystem-based management ICES Journal of Marine Science 71(3) 713ndash724 doiorg101093icesjmsfst012
Cinner J E (2011) Socialndashecological traps in reef fisheries Global Environmental Change 21(3) 835ndash839 doiorg101016jgloenvcha201104012
Human Ecology Review Volume 26 Number 2 2020
54
Costanza R amp Mageau M (1999) What is a healthy ecosystem Aquatic Ecology 33(1) 105ndash115 doiorg101023A1009930313242
Dambacher J M Brewer D T Dennis D M Macintyre M amp Foale S (2007) Qualitative modelling of gold mine impacts on Lihir Islandrsquos socioeconomic system and reef-edge fish community Environmental Science amp Technology 41(2) 555ndash562 doiorg 101021es0610333
Dambacher J M Rothlisberg P C amp Loneragan N R (2015) Qualitative mathematical models to support ecosystem‐based management of Australiarsquos Northern Prawn Fishery Ecological Applications 25(1) 278ndash298 doiorg10189013-20301
Downing A S van Nes E H Balirwa J S Beuving J J Bwathondi P O J Chapman L J hellip Mooij W M (2014) Coupled human and natural system dynamics as key to the sustainability of Lake Victoriarsquos ecosystem services Ecology and Society 19(4) Article 31 doiorg105751es-06965-190431
Espinoza-Tenorio A Wolff M Espejel I amp Montantildeo-Moctezuma G (2013) Using traditional ecological knowledge to improve holistic fisheries management Transdisciplinary modeling of a lagoon ecosystem of Southern Mexico Ecology and Society 18(2) Article 6 doiorg105751es-05369-180206
Folke C (2006) Resilience The emergence of a perspective for socialndashecological systems analyses Global Environmental Change 16(3) 253ndash267 doiorg101016jgloenvcha 200604002
Haines-Young R amp Potschin M (2010) The links between biodiversity ecosystem services and human well-being In D G Raffaelli amp C L Frid (Eds) Ecosystem ecology A new synthesis (pp 110ndash139) Cambridge University Press doiorg101017cbo978051175 0458007
Hanspach J Hartel T Milcu A I Mikulcak F Dorresteijn I Loos J hellip Fischer J (2014) A holistic approach to studying socialndashecological systems and its application to southern Transylvania Ecology and Society 19(4) Article 32 doiorg105751es-06915-190432
Hilborn R (2007) Defining success in fisheries and conflicts in objectives Marine Policy 31(2) 153ndash158 doiorg101016jmarpol200605014
Hughes T P Bellwood D R Folke C Steneck R S amp Wilson J (2005) New paradigms for supporting the resilience of marine ecosystems Trends in Ecology amp Evolution 20(7) 380ndash386 doiorg101016jtree200503022
Ibaacutentildeez A M amp Veacutelez C E (2008) Civil conflict and forced migration The micro determinants and welfare losses of displacement in Colombia World Development 36(4) 659ndash676 doiorg101016jworlddev200704013
Justus J (2006) Loop analysis and qualitative modeling Limitations and merits Biology and Philosophy 21(5) 647ndash666 doiorg101007s10539-006-9050-x
Understanding SocialndashEcological Systems using Loop Analysis
55
Kittinger J N Finkbeiner E M Ban N C Broad K Carr M H Cinner J E hellip Crowder L B (2013) Emerging frontiers in social-ecological systems research for sustainability of small-scale fisheries Current Opinion on Environmental Sustainability 5(3ndash4) 352ndash357 doiorg101016jcosust201306008
Kok K (2009) The potential of fuzzy cognitive maps for semi-quantitative scenario development with an example from Brazil Global Environmental Change 19(1) 122ndash133 doiorg101016jgloenvcha200808003
Lane D C (2008) The emergence and use of diagramming in system dynamics A critical account Systems Research and Behavioral Science 25(1) 3ndash23 doiorg101002sres826
Leslie H M Basurto X Nenadovic M Sievanen L Cavanaugh K C Cota-Nieto J J hellip Aburto-Oropeza O (2015) Operationalizing the social-ecological systems framework to assess sustainability Proceedings of the National Academy of Sciences of the USA 112(19) 5979ndash5984 doiorg101073pnas1414640112
Levin P S Fogarty M J Murawski S A amp Fluharty D (2009) Integrated ecosystem assessments Developing the scientific basis for ecosystem-based management of the ocean PLoS Biology 7(1) e1000014 doiorg101371journalpbio1000014
Levins R (1968) Evolution in changing environments Some theoretical explorations Princeton University Press
Levins R (1974) Discussion paper The qualitative analysis of partially specified systems Annals of the New York Academy of Sciences 231(1) 123ndash138 doiorg101111 j1749-66321974tb20562x
Levins R (1975) Evolution in communities near equilibrium In M L Cody and J M Diamond (Eds) Ecology and evolution of communities (pp 16ndash50) Harvard University Press
Levins R (1995) Preparing for uncertainty Ecosystem Health 1(1) 47ndash57
Levins R amp Puccia C J (1988) The controlling factor in biological communities Coenoses 3(3) 149ndash154 wwwjstororgstable43460977
Lewontin R C amp Levins R (2007) Educating the intuition to cope with complexity In R C Lewontin amp R Levins (Eds) Biology under the influence Dialectical essays on ecology agriculture and health (pp 183ndash198) Monthly Review Press
Logofet D (1993) Matrices and graphs Stability problems in mathematical ecology CRC Press
Long R D Charles A amp Stephenson R L (2015) Key principles of marine ecosystem-based management Marine Policy 57 53ndash60 doiorg101016jmarpol201501013
Lotze H K Lenihan H S Bourque B J Bradbury R H Cooke R G Kay M C hellip Jackson J B (2006) Depletion degradation and recovery potential of estuaries and coastal seas Science 312(5781) 1806ndash1809 doiorg101126science1128035
Human Ecology Review Volume 26 Number 2 2020
56
Marcot B G Holthausen R S Raphael M G Rowland M M amp Wisdom M J (2001) Using Bayesian belief networks to evaluate fish and wildlife population viability under land management alternatives from an environmental impact statement Forest Ecology and Management 153(1ndash3) 29ndash42 doiorg101016s0378-1127(01)00452-2
Martone R G Bodini A amp Micheli F (2017) Identifying potential consequences of natural perturbations and management decisions on a coastal fishery socialndashecological system using qualitative loop analysis Ecology and Society 22(1) Article 34 doiorg 105751 es-08825-220134
Melbourne-Thomas J Wotherspoon S Raymond B amp Constable A (2012) Comprehensive evaluation of model uncertainty in qualitative network analyses Ecological Monographs 82(4) 505ndash519 doiorg10189012-02071
Micheli F Saenz-Arroyo A Greenley A Vazquez L Espinoza Montes J A Rossetto M amp De Leo G A (2012) Evidence that marine reserves enhance resilience to climatic impacts PLoS ONE 7 e40832 doiorg101371journalpone0040832
Nival P amp Gorsky G (2001) Conditions for blooming of pelagic species In CIESM Workshop Monographs No 14mdashGelatinous zooplankton outbreaks Theory and practice (pp 23ndash27) Commission Internationale pour lrsquoExploration Scientifique de la Meacutediterraneacutee (CIESM [Mediterranean Science Commission])
Ostrom E (2009) A general framework for analyzing sustainability of social-ecological systems Science 325(5939) 419ndash422 doiorg101126science1172133
Oumlzesmi U amp Oumlzesmi S L (2004) Ecological models based on peoplersquos knowledge A multi-step fuzzy cognitive mapping approach Ecological Modelling 176(1ndash2) 43ndash64 doiorg101016jecolmodel200310027
Partelow S Fujitani M Soundararajan V amp Schluumlter A (2019) Transforming the social-ecological systems framework into a knowledge exchange and deliberation tool for comanagement Ecology and Society 24(1) Article 15 doiorg105751es-10724-240115
Pollino C A Woodberry O Nicholson A Korb K amp Hart B T (2007) Parameterisation and evaluation of a Bayesian network for use in an ecological risk assessment Environmental Modelling amp Software 22(8) 1140ndash1152 doiorg101016jenvsoft200603006
Puccia C J amp Levins R (1985) Qualitative modeling of complex systems An introduction to loop analysis and time averaging Harvard University Press
Raoux A Dambacher J M Pezy J P Mazeacute C Dauvin J C amp Niquil N (2018) Assessing cumulative sociondashecological impacts of offshore wind farm development in the Bay of Seine (English Channel) Marine Policy 89 11ndash20 doiorg101016jmarpol 201712007
Reum J C McDonald P S Ferriss B E Farrell D M Harvey C J amp Levin P S (2015) Qualitative network models in support of ecosystem approaches to bivalve aquaculture ICES Journal of Marine Science 72(8) 2278ndash2288 doiorg101093icesjms fsv119
Understanding SocialndashEcological Systems using Loop Analysis
57
Richardson G P (1997) Problems in causal loop diagrams revisited System Dynamics Review 13(3) 247ndash252 doiorg101002(sici)1099-1727(199723)133lt247aid-sdr 128gt 30co2-9
Stachowicz J J Fried H Osman R W amp Whitlatch R B (2002) Biodiversity invasion resistance and marine ecosystem function Reconciling pattern and process Ecology 83(9) 2575ndash2590 doiorg1018900012-9658(2002)083[2575birame]20co2
Stier A C Samhouri J F Gray S Martone R G Mach M E Halpern B S hellip Levin P S (2017) Integrating expert perceptions into food web conservation and management Conservation Letters 10(1) 67ndash76 doiorg101111conl12245
Stylios C D amp Groumpos P P (1999) A soft computing approach for modelling the supervisor of manufacturing systems Journal of Intelligent and Robotic Systems 26(3ndash4) 389ndash403 doiorg101023A1008165916707
Sweeney L B amp Sterman J (2007) Thinking about systems Student and teacher conceptions of natural and social systems System Dynamics Review 23(2ndash3) 285ndash311 doiorg101002sdr366
Tenza A Peacuterez I Martiacutenez-Fernaacutendez J amp Gimeacutenez A (2017) Understanding the decline and resilience loss of a long-lived social-ecological system Insights from system dynamics Ecology and Society 22(2) Article 15 doiorg105751es-09176-220215
Ticehurst J L Newham L T Rissik D Letcher R A amp Jakeman A J (2007) A Bayesian network approach for assessing the sustainability of coastal lakes in New South Wales Australia Environmental Modelling amp Software 22(8) 1129ndash1139 doiorg101016 jenvsoft 200603003
Worm B Barbier E B Beaumont N Duffy J E Folke C Halpern B S hellip Watson R (2006) Impacts of biodiversity loss on ocean ecosystem services Science 314(5800) 787ndash790 doiorg101126science1132294
Yasuoka J Jimba M amp Levins R (2014) Application of loop analysis for evaluation of malaria control interventions Malaria Journal 13 Article 140 doiorg1011861475-2875-13-140
This text is taken from Human Ecology Review Volume 26 Number 2 2020 published by ANU Press The Australian National University Canberra Australia
doiorg1022459HER2602202003

Understanding SocialndashEcological Systems using Loop Analysis
47
Tenorio et al (2013) presents a valid alternative In that work both quantitative and qualitative information regarding the biological and social aspects of fisheries dynamics and management were retrieved using structured interviews with fishers participatory research key informant interviews and workshops
Limitations of the methodology should be taken into account Some limitations have already been discussed (Justus 2006) and here we focus on those that matter with the use of loop analysis in studying SESs First there can be difficulties in defining the timing of changing conditions and that of system response to impacts SESs are resilient and cope with continuous exposure to press perturbations according to adaptive dynamics principles (Folke 2006 Hughes et al 2005) The exact moment at which the system responds to a press perturbation cannot be detected with precision and the contribution of concomitant perturbations may further confound this detection Second the variables of SESs (eg resources and their users) can show asynchronous behavior and heterogeneous geographical distribution (Leslie et al 2015) Their optimization does not necessarily occur at the same temporal and spatial scale an aspect that might remain overlooked when constructing graphs The uneven geographical distribution of the actors might be addressed by including in the models different variables for the same type of user (eg various nodes that indicate the fishers and their interactions in different regions) Third there can be issues in the identification of the variables exposed to press perturbations (ie impacts of overfishing vs climate change) For example while marketing solutions (eg the introduction of ecolabels) can be easily targeted to specific user groups (eg the members of fishing cooperatives see Martone et al 2017) climate change (eg warmer winters) may affect many components of the ecological system with different time of response One possible solution is prioritizing as press perturbation targets the most responsive biological variables (eg jellyfish have faster blooming rates than expected from the body size see Nival amp Gorsky 2001) Finally loop analysis is problematic for assessing nonlinear relationships Nonlinearity can emerge by combining the impacts of pathways of different lengths Longer pathways have lower intensity than shorter ones since the interaction strengths randomly assigned during the simulations are in the interval (01] (ie the intensity of each pathway is obtained by multiplying the strength of its constitutive links that have upper bound equal to 1) To avoid penalizing the impact of longer pathways simulations could be carried out by constraining the lower limit from which interaction strengths are randomly drawn during simulations (ie by setting the lower limits of some ldquostrongrdquo interactions closer to 1) As an alternative one could include nonlinear functions to model those specific interactions that play crucial roles for the dynamics of the SES (eg by relying on previous literature data or results from specific experiments and surveys)
Human Ecology Review Volume 26 Number 2 2020
48
Comparison of loop analysis with other qualitative methods for SESsSESs form complex networks of linkages and loop analysis is designed to qualitatively predict how variables that are embedded in SESs respond to policies and management interventions (eg introduction of new regulations for the exploitation of resources market-based incentives and adoption of new marketing solutions Carey et al 2014 Dambacher et al 2007 Levin et al 2009) A limited number of applications to investigate complex SES have made use of loop analysis but the interest toward the method has taken little ground in the context of fisheries (Anthony et al 2013 Carey et al 2014 Dambacher et al 2015 Espinoza-Tenorio et al 2013 Martone et al 2017) These applications highlight that loop analysis has some potential that extends beyond its limitations For example predictions are about the equilibrium level of the variables (Justus 2006) but real systems are generally not at the equilibrium However previous studies have offered evidence that predictions from loop analysis apply successfully to changes in average values of the variables (Bodini 2000) Average values should be long term and Bodini et al (2018) showed that averages taken over either 5 or 10 years can be used to grasp variable responses to press perturbations The appropriate time scale for taking averages however very much depends on the system under investigation
Other qualitative modeling approaches can be used to study SESs Fuzzy cognitive maps (FCMs) is one of these It makes the magnitude of links explicit through a semi-quantification of the relationships that link variables (Kok 2009 Oumlzesmi amp Oumlzesmi 2004) The semi-quantification of the links may resolve the ambiguities typical of loop analysis about the net effect generated by the combination of contrasting pathways Also FCMs can make predictions about multiple simultaneous perturbations Both the state of the variables (ldquoconceptsrdquo in the technical language of FCMs) and the strength of the links (edges between the concepts) are quantified by assigning standardized values in the range [01] for states and [-11] for links Although these are relative values (ie each of them is assigned in relation to the others) some criteria for the quantification must be identified These criteria must be supported by some knowledge about the level of the variables and interactions in the system and in particular the use of FCMs seems appropriate when the estimates of variable state and link strength are the outcomes of either a combination of multiple FCMs from individual stakeholders or a set of values defined through participatory workshops The quantification of variables and interactions requires a certain level of knowledge about the system and it automatically selects the working groups among stakeholders that possess some previous understanding of the system under investigation It follows that FCMs cannot be public reproducible and intelligible in the way that loop analysis is Kok (2009) posits that vague or complex concepts such as ldquoconsumer behaviorrdquo must not be taken into account when applying FCMs
Understanding SocialndashEcological Systems using Loop Analysis
49
because guessing about their magnitude is inherently difficult On the other hand loop analysis allows including ldquoawarenessrdquo in a malaria model (Yasuoka et al 2014) ldquoenvironmental attractivenessrdquo in a tourism model (Bodini et al 2000) and the ldquorole of the unionsrdquo in a model on diabetes (Lewontin amp Levins 2007) In these aspects it seems that FCMs share one limitation with quantitative models the tendency to exclude from the analysis factors that are difficult or impossible to measure no matter if they play a role in the dynamics of the system The connections among the variables in FCMs are designed on the basis of fuzzy conditional statements (ldquoif hellip thenrdquo) that are of the type ldquoif the level of variable A is high that of variable B is lowrdquo Thus connections are deduced from correlations between the variables derived from observing the system (Stylios amp Groumpos 1999) However Levins and Puccia (1988) point out that patterns of correlation depend on the network structure and the entry point of the perturbation For example any two variables may show positive correlation in response to a specific press perturbation but opposite correlation (or no correlation) in response to other press perturbations It follows that defining interactions between variables on the basis of their correlations may be misleading In loop analysis perturbations are variations in parameters that govern the rate of change of variables For example a pollutant triggering an increase in the mortality rate of a population FCMs instead consider the changes in the level of the variables as perturbations To predict say the impacts of a pollutant that affects a population FCMs consider the reduced abundance induced by the pollutant as the initial event (ie the perturbation) on the logical assumption that a toxin by increasing the mortality of a species automatically reduces its abundance Thus the initial event is deduced from a more or less plausible linear sequence of steps This series of events overlooks the fact that the response of the target population to the increased mortality is also mediated by the network of interactions with the other variables and that accordingly often does not follow commonsense linear expectations Such assumption leads to the circular argument that FCMs predict the effects given a cause that is in turn an effect that FCMs should predict On the other hand we can be confident that the pollutant increases the mortality rate of the target population which is the initial event in loop analysis Loop analysis considers the role of the environmental variability in changing the parameters that govern the growth rates of the variables and does not interpret it solely as the cause of variable fluctuations like FCMs do
Causal loop diagrams (CLDs Hanspach et al 2014 Tenza et al 2017) and Bayesian belief networks (BBNs Borsuk et al 2004 Pollino et al 2007) have also been applied for analyzing SESs CLDs make predictions by logically reconstructing the chains of causes and effects between variables on the basis of link polarities (eg the signs of the directed links ie the effects of one variable over the other) Predicting the behavior of complex networks by identifying the feedback effects using link polarity (ie the effect associated to the link positive or negative) is difficult and can lead to misleading interpretations (Lane 2008 Richardson 1997)
Human Ecology Review Volume 26 Number 2 2020
50
Most problems originate from polarities Consider for example the case in which the level of violence displaces people from rural areas and forces them to move to the cities (Colombia is a paradigmatic example see Ibaacutentildeez amp Veacutelez 2008) The causal connections are that level of violence increases the migration rate (positive link) which in turn increases the population level in the city (positive link) Therefore the expected trend is the higher the level of violence the greater the increase of urban population However if the level of violence gets lower the migration rate is reduced but this does not reduce the population in the city as it continues to increase unless an opposite migratory flux occurs Hence the articulation of causal pathways gets difficult because variables can be both standing stocks and rates of change (Sweeney amp Sterman 2007) Similarly specifying the relevant conditional probabilities as required by BBNs can be a laborious and time-consuming process (Marcot et al 2001 Ticehurst et al 2007) Moreover to include feedback mechanisms via cyclic network structures requires dynamic time-explicit BBNs which depend on extensive parameterization Similar to FCMs combining BBNs with loop analysis has great potential for improving predictions and model validation (Anthony et al 2013 Melbourne-Thomas et al 2012 Raoux et al 2018) However it must be emphasized that these applications of BBNs are based on the signs derived from the analysis of the loop models As such their outcomes are contingent on the assumptions and limitations of signed diagraph models
Central for the understanding of the complex causality in SESs is our ability to individuate what the relevant components of the SESs are and diagram their relationships The nature of the linkages among these components determines the spreading of the effects through the system and the overall composition of the linkages generates the feedbacks that amplify or buffer such effects There is no recipe for modeling development but great effort must be devoted to assimilation of facts observations and hypotheses Increasing the reliability of predictions can be possible by designing alternative graphs This iterative procedure allows addressing uncertainty about the system structure and determining which differences matter Robust outcomes may be the effect of a core structure common to all models upon which few links added or removed cannot change radically the predictions The core structure represents the fundamental backbone composed of more certain variables and interactions Disagreements among stakeholders scientists or managers do not limit the application of loop analysis rather they offer the opportunity to involve stakeholders in a participatory model construction (Anthony et al 2013) where different types of system knowledge can be used to determine variables and links that may be important to examine further (Stier et al 2017) The adoption of such a comprehensive system-wide approach aims to formulate management strategies that reconcile ecological integrity and intergenerational equity key dimensions of the sustainable development paradigm
Understanding SocialndashEcological Systems using Loop Analysis
51
Possible developments for the application of loop analysis to SESsMaking predictions is difficult especially when we face the uncertainty associated with new unknown events changing dynamics and lack of quantitative data This is the case for example with climate change which produces completely new phenomena and dynamics In such context an adaptive management that allows for continually assessing new evidence has been called for We believe that in the new scenarios we are facing the method of loop analysis can be helpful It has the necessary adaptability to be used in changing contexts When in doubt about critical linkages and dynamic features alternative models can be developed to find out which differences matter and to reach robust conclusions It is also flexible as it allows including and discarding variables easily and above all it permits working with variables and links that are not readily measurable even though their effects are crucial However its suitability to investigate SESs can be improved in several ways The intricacy of the feedbacks can be better resolved if a specific tool for pathways analysis is developed Returning the total number of pathways and their strength between any pair of variables can show how single pathways contribute to specific effects and which ones are more important in mediating the press perturbations The question of link strength deserves attention We specified in the methodological aspects section that link strength is randomly assigned to interaction links during simulations But this does not contradict the qualitative nature of the method it only serves to assign certainty to paths and feedbacks in order to get unambiguous predictions which remain qualitative in nature as only the direction of change for the variables is predicted Pathway anatomy would help selecting those causal chains that mostly affect system dynamics Other relevant features that would improve the suitability of loop analysis for modeling SESs include (1) considering multiple simultaneous press perturbations and (2) delimiting upper and lower limits for the strength of interactions The first point is related to the fact that SESs are often exposed to different types of disturbances whose interplay gives rise to net cumulative responses that would be useful to disentangle (eg through the identification of the specific causative chains) Considering multiple press perturbations would greatly contribute to building up an effective diagnostic approach (Kittinger et al 2013) For example by loop analysis Bodini et al (2018) diagnosed that multiple press perturbations not only overfishing of small and medium pelagic species were responsible for the restructuring of the Black Sea community during the period 1960ndash1989 Moreover socioeconomic drivers amplify the impacts that are triggered by natural processes for instance both hypoxia and fisheries management affected abalone stock in the Baja California SES (Martone et al 2017) The second line of development is conceived to extend loop analysis in a semi-quantitative direction So far the simulations are performed by randomly sampling interaction strength in the uniform interval (01] There are however cases when some interactions are known
Human Ecology Review Volume 26 Number 2 2020
52
to be either strong or weak in such cases varying the strength of these linkages in the whole interval (01] does not make sense However it is difficult to translate fuzzy concepts such as strong and weak into numbers so that boundaries for the links can be set In this respect sensitivity analysis may help Either the upper (ie 1) or the lower (ie 10-6) limit of the link magnitude could be iteratively changed so that actual boundaries for certain linkages can be identified through a consistency assessment of the outcomes produced For example performing the sensitivity analysis for the strength of specific interactions might help modeling competitive advantages in the ecological domain (eg Noctiluca scintillans vs zooplankton in the Black Sea Bodini et al 2018) and power or information asymmetries between socioeconomic actors (Bousquet et al 2015) Therefore exploring alternative scenarios by constraining the strength of some interactions would be of great benefit for modeling SESs It should also be noticed that a uniform distribution is considered by default for randomly sampling the strength but it could be substituted by either normal or skewed (eg Poisson) distributions
Concluding remarksThe central issue in the study of SESs is to understand interdependencies that cross the boundaries of the classical domains in which scientific and operational knowledge have been settled Contributions in this respect are expected from tools that allow reconstructing the causal chains that give rise to such interdependencies and that involve variables or components of different nature For such reconstruction to be effective tools must overcome the barriers that make communication between domains difficult (1) the simpler the language used to describe the phenomena and the interactions the better it is (2) a lower level of technicality in the algorithms facilitates understanding the outcomes and (3) flexibility widens the range of applicability to different contexts Loop analysis shares most of these features (1) by classifying the interactions in only two categories positive and negative it facilitates creating connections between variables that differ dramatically in physical form (2) the ease by which a model can be constructed as a graph allows keeping up with rapidly changing conditions (ie variables andor links disappear and others become important) (3) the algorithm for predictions refers directly to structural features of the graph and can be visualized thus making the outcomes easier to understand and (4) it is also characterized by a wide applicability (often the question of interest is not a particular system but a whole class of systems with some similarity of structure) Furthermore loop analysis emphasizes the understanding of mechanisms which is a prime objective when an intellectual and operative framework is taking shape as in the case of SESs
Understanding SocialndashEcological Systems using Loop Analysis
53
ReferencesAnthony K R Dambacher J M Walshe T amp Beeden R (2013) A framework for
understanding cumulative impacts supporting environmental decisions and informing resilience-based management of the Great Barrier Reef World Heritage Area Australian Institute of Marine Science CSIRO NERP Decisions Hub University of Melbourne and Great Barrier Reef Marine Park Authority hdlhandlenet110172850
Bender E A Case T J amp Gilpin M E (1984) Perturbation experiments in community ecology Theory and practice Ecology 65(1) 1ndash13 doiorg1023071939452
Binder C R Hinkel J Bots P W G amp Pahl-Wostl C (2013) Comparison of frameworks for analyzing socialndashecological systems Ecology and Society 18(4) Article 26 doiorg 105751es-05551-180426
Bodini A (2000) Reconstructing trophic interactions as a tool for understanding and managing ecosystems Application to a shallow eutrophic lake Canadian Journal of Fisheries and Aquatic Sciences 57(10) 1999ndash2009 doiorg101139f00-153
Bodini A amp Clerici N (2016) Vegetation herbivores and fires in savanna ecosystems A network perspective Ecological Complexity 28 36ndash46 doiorg101016jecocom 201610001
Bodini A Ricci A amp Viaroli P (2000) A multimethodological approach for the sustainable management of perifluvial wetlands of the Po River (Italy) Environmental Management 26(1) 59ndash72 doiorg101007s002670010071
Bodini A Rocchi M amp Scotti M (2018) Insights into the ecology of the Black Sea through the qualitative loop analysis of the community structure Limnology and Oceanography 63(2) 968ndash984 doiorg101002lno10713
Borsuk M E Stow C A amp Reckhow K H (2004) A Bayesian network of eutrophication models for synthesis prediction and uncertainty analysis Ecological Modelling 173(2ndash3) 219ndash239 doiorg101016jecolmodel200308020
Bousquet F Anderies M Antona M Bassett T Benjaminsen T Bonato O hellip Vassal J-M (2015) Socio-ecological theories and empirical research Comparing socialndashecological schools of thoughts in action [Research report] CIRAD-GREEN halarchives-ouvertesfrhal-01130178
Carey M P Levin P S Townsend H Minello T J Sutton G R Francis T B hellip Ruckelshaus M (2014) Characterizing coastal foodwebs with qualitative links to bridge the gap between the theory and the practice of ecosystem-based management ICES Journal of Marine Science 71(3) 713ndash724 doiorg101093icesjmsfst012
Cinner J E (2011) Socialndashecological traps in reef fisheries Global Environmental Change 21(3) 835ndash839 doiorg101016jgloenvcha201104012
Human Ecology Review Volume 26 Number 2 2020
54
Costanza R amp Mageau M (1999) What is a healthy ecosystem Aquatic Ecology 33(1) 105ndash115 doiorg101023A1009930313242
Dambacher J M Brewer D T Dennis D M Macintyre M amp Foale S (2007) Qualitative modelling of gold mine impacts on Lihir Islandrsquos socioeconomic system and reef-edge fish community Environmental Science amp Technology 41(2) 555ndash562 doiorg 101021es0610333
Dambacher J M Rothlisberg P C amp Loneragan N R (2015) Qualitative mathematical models to support ecosystem‐based management of Australiarsquos Northern Prawn Fishery Ecological Applications 25(1) 278ndash298 doiorg10189013-20301
Downing A S van Nes E H Balirwa J S Beuving J J Bwathondi P O J Chapman L J hellip Mooij W M (2014) Coupled human and natural system dynamics as key to the sustainability of Lake Victoriarsquos ecosystem services Ecology and Society 19(4) Article 31 doiorg105751es-06965-190431
Espinoza-Tenorio A Wolff M Espejel I amp Montantildeo-Moctezuma G (2013) Using traditional ecological knowledge to improve holistic fisheries management Transdisciplinary modeling of a lagoon ecosystem of Southern Mexico Ecology and Society 18(2) Article 6 doiorg105751es-05369-180206
Folke C (2006) Resilience The emergence of a perspective for socialndashecological systems analyses Global Environmental Change 16(3) 253ndash267 doiorg101016jgloenvcha 200604002
Haines-Young R amp Potschin M (2010) The links between biodiversity ecosystem services and human well-being In D G Raffaelli amp C L Frid (Eds) Ecosystem ecology A new synthesis (pp 110ndash139) Cambridge University Press doiorg101017cbo978051175 0458007
Hanspach J Hartel T Milcu A I Mikulcak F Dorresteijn I Loos J hellip Fischer J (2014) A holistic approach to studying socialndashecological systems and its application to southern Transylvania Ecology and Society 19(4) Article 32 doiorg105751es-06915-190432
Hilborn R (2007) Defining success in fisheries and conflicts in objectives Marine Policy 31(2) 153ndash158 doiorg101016jmarpol200605014
Hughes T P Bellwood D R Folke C Steneck R S amp Wilson J (2005) New paradigms for supporting the resilience of marine ecosystems Trends in Ecology amp Evolution 20(7) 380ndash386 doiorg101016jtree200503022
Ibaacutentildeez A M amp Veacutelez C E (2008) Civil conflict and forced migration The micro determinants and welfare losses of displacement in Colombia World Development 36(4) 659ndash676 doiorg101016jworlddev200704013
Justus J (2006) Loop analysis and qualitative modeling Limitations and merits Biology and Philosophy 21(5) 647ndash666 doiorg101007s10539-006-9050-x
Understanding SocialndashEcological Systems using Loop Analysis
55
Kittinger J N Finkbeiner E M Ban N C Broad K Carr M H Cinner J E hellip Crowder L B (2013) Emerging frontiers in social-ecological systems research for sustainability of small-scale fisheries Current Opinion on Environmental Sustainability 5(3ndash4) 352ndash357 doiorg101016jcosust201306008
Kok K (2009) The potential of fuzzy cognitive maps for semi-quantitative scenario development with an example from Brazil Global Environmental Change 19(1) 122ndash133 doiorg101016jgloenvcha200808003
Lane D C (2008) The emergence and use of diagramming in system dynamics A critical account Systems Research and Behavioral Science 25(1) 3ndash23 doiorg101002sres826
Leslie H M Basurto X Nenadovic M Sievanen L Cavanaugh K C Cota-Nieto J J hellip Aburto-Oropeza O (2015) Operationalizing the social-ecological systems framework to assess sustainability Proceedings of the National Academy of Sciences of the USA 112(19) 5979ndash5984 doiorg101073pnas1414640112
Levin P S Fogarty M J Murawski S A amp Fluharty D (2009) Integrated ecosystem assessments Developing the scientific basis for ecosystem-based management of the ocean PLoS Biology 7(1) e1000014 doiorg101371journalpbio1000014
Levins R (1968) Evolution in changing environments Some theoretical explorations Princeton University Press
Levins R (1974) Discussion paper The qualitative analysis of partially specified systems Annals of the New York Academy of Sciences 231(1) 123ndash138 doiorg101111 j1749-66321974tb20562x
Levins R (1975) Evolution in communities near equilibrium In M L Cody and J M Diamond (Eds) Ecology and evolution of communities (pp 16ndash50) Harvard University Press
Levins R (1995) Preparing for uncertainty Ecosystem Health 1(1) 47ndash57
Levins R amp Puccia C J (1988) The controlling factor in biological communities Coenoses 3(3) 149ndash154 wwwjstororgstable43460977
Lewontin R C amp Levins R (2007) Educating the intuition to cope with complexity In R C Lewontin amp R Levins (Eds) Biology under the influence Dialectical essays on ecology agriculture and health (pp 183ndash198) Monthly Review Press
Logofet D (1993) Matrices and graphs Stability problems in mathematical ecology CRC Press
Long R D Charles A amp Stephenson R L (2015) Key principles of marine ecosystem-based management Marine Policy 57 53ndash60 doiorg101016jmarpol201501013
Lotze H K Lenihan H S Bourque B J Bradbury R H Cooke R G Kay M C hellip Jackson J B (2006) Depletion degradation and recovery potential of estuaries and coastal seas Science 312(5781) 1806ndash1809 doiorg101126science1128035
Human Ecology Review Volume 26 Number 2 2020
56
Marcot B G Holthausen R S Raphael M G Rowland M M amp Wisdom M J (2001) Using Bayesian belief networks to evaluate fish and wildlife population viability under land management alternatives from an environmental impact statement Forest Ecology and Management 153(1ndash3) 29ndash42 doiorg101016s0378-1127(01)00452-2
Martone R G Bodini A amp Micheli F (2017) Identifying potential consequences of natural perturbations and management decisions on a coastal fishery socialndashecological system using qualitative loop analysis Ecology and Society 22(1) Article 34 doiorg 105751 es-08825-220134
Melbourne-Thomas J Wotherspoon S Raymond B amp Constable A (2012) Comprehensive evaluation of model uncertainty in qualitative network analyses Ecological Monographs 82(4) 505ndash519 doiorg10189012-02071
Micheli F Saenz-Arroyo A Greenley A Vazquez L Espinoza Montes J A Rossetto M amp De Leo G A (2012) Evidence that marine reserves enhance resilience to climatic impacts PLoS ONE 7 e40832 doiorg101371journalpone0040832
Nival P amp Gorsky G (2001) Conditions for blooming of pelagic species In CIESM Workshop Monographs No 14mdashGelatinous zooplankton outbreaks Theory and practice (pp 23ndash27) Commission Internationale pour lrsquoExploration Scientifique de la Meacutediterraneacutee (CIESM [Mediterranean Science Commission])
Ostrom E (2009) A general framework for analyzing sustainability of social-ecological systems Science 325(5939) 419ndash422 doiorg101126science1172133
Oumlzesmi U amp Oumlzesmi S L (2004) Ecological models based on peoplersquos knowledge A multi-step fuzzy cognitive mapping approach Ecological Modelling 176(1ndash2) 43ndash64 doiorg101016jecolmodel200310027
Partelow S Fujitani M Soundararajan V amp Schluumlter A (2019) Transforming the social-ecological systems framework into a knowledge exchange and deliberation tool for comanagement Ecology and Society 24(1) Article 15 doiorg105751es-10724-240115
Pollino C A Woodberry O Nicholson A Korb K amp Hart B T (2007) Parameterisation and evaluation of a Bayesian network for use in an ecological risk assessment Environmental Modelling amp Software 22(8) 1140ndash1152 doiorg101016jenvsoft200603006
Puccia C J amp Levins R (1985) Qualitative modeling of complex systems An introduction to loop analysis and time averaging Harvard University Press
Raoux A Dambacher J M Pezy J P Mazeacute C Dauvin J C amp Niquil N (2018) Assessing cumulative sociondashecological impacts of offshore wind farm development in the Bay of Seine (English Channel) Marine Policy 89 11ndash20 doiorg101016jmarpol 201712007
Reum J C McDonald P S Ferriss B E Farrell D M Harvey C J amp Levin P S (2015) Qualitative network models in support of ecosystem approaches to bivalve aquaculture ICES Journal of Marine Science 72(8) 2278ndash2288 doiorg101093icesjms fsv119
Understanding SocialndashEcological Systems using Loop Analysis
57
Richardson G P (1997) Problems in causal loop diagrams revisited System Dynamics Review 13(3) 247ndash252 doiorg101002(sici)1099-1727(199723)133lt247aid-sdr 128gt 30co2-9
Stachowicz J J Fried H Osman R W amp Whitlatch R B (2002) Biodiversity invasion resistance and marine ecosystem function Reconciling pattern and process Ecology 83(9) 2575ndash2590 doiorg1018900012-9658(2002)083[2575birame]20co2
Stier A C Samhouri J F Gray S Martone R G Mach M E Halpern B S hellip Levin P S (2017) Integrating expert perceptions into food web conservation and management Conservation Letters 10(1) 67ndash76 doiorg101111conl12245
Stylios C D amp Groumpos P P (1999) A soft computing approach for modelling the supervisor of manufacturing systems Journal of Intelligent and Robotic Systems 26(3ndash4) 389ndash403 doiorg101023A1008165916707
Sweeney L B amp Sterman J (2007) Thinking about systems Student and teacher conceptions of natural and social systems System Dynamics Review 23(2ndash3) 285ndash311 doiorg101002sdr366
Tenza A Peacuterez I Martiacutenez-Fernaacutendez J amp Gimeacutenez A (2017) Understanding the decline and resilience loss of a long-lived social-ecological system Insights from system dynamics Ecology and Society 22(2) Article 15 doiorg105751es-09176-220215
Ticehurst J L Newham L T Rissik D Letcher R A amp Jakeman A J (2007) A Bayesian network approach for assessing the sustainability of coastal lakes in New South Wales Australia Environmental Modelling amp Software 22(8) 1129ndash1139 doiorg101016 jenvsoft 200603003
Worm B Barbier E B Beaumont N Duffy J E Folke C Halpern B S hellip Watson R (2006) Impacts of biodiversity loss on ocean ecosystem services Science 314(5800) 787ndash790 doiorg101126science1132294
Yasuoka J Jimba M amp Levins R (2014) Application of loop analysis for evaluation of malaria control interventions Malaria Journal 13 Article 140 doiorg1011861475-2875-13-140
This text is taken from Human Ecology Review Volume 26 Number 2 2020 published by ANU Press The Australian National University Canberra Australia
doiorg1022459HER2602202003

Human Ecology Review Volume 26 Number 2 2020
48
Comparison of loop analysis with other qualitative methods for SESsSESs form complex networks of linkages and loop analysis is designed to qualitatively predict how variables that are embedded in SESs respond to policies and management interventions (eg introduction of new regulations for the exploitation of resources market-based incentives and adoption of new marketing solutions Carey et al 2014 Dambacher et al 2007 Levin et al 2009) A limited number of applications to investigate complex SES have made use of loop analysis but the interest toward the method has taken little ground in the context of fisheries (Anthony et al 2013 Carey et al 2014 Dambacher et al 2015 Espinoza-Tenorio et al 2013 Martone et al 2017) These applications highlight that loop analysis has some potential that extends beyond its limitations For example predictions are about the equilibrium level of the variables (Justus 2006) but real systems are generally not at the equilibrium However previous studies have offered evidence that predictions from loop analysis apply successfully to changes in average values of the variables (Bodini 2000) Average values should be long term and Bodini et al (2018) showed that averages taken over either 5 or 10 years can be used to grasp variable responses to press perturbations The appropriate time scale for taking averages however very much depends on the system under investigation
Other qualitative modeling approaches can be used to study SESs Fuzzy cognitive maps (FCMs) is one of these It makes the magnitude of links explicit through a semi-quantification of the relationships that link variables (Kok 2009 Oumlzesmi amp Oumlzesmi 2004) The semi-quantification of the links may resolve the ambiguities typical of loop analysis about the net effect generated by the combination of contrasting pathways Also FCMs can make predictions about multiple simultaneous perturbations Both the state of the variables (ldquoconceptsrdquo in the technical language of FCMs) and the strength of the links (edges between the concepts) are quantified by assigning standardized values in the range [01] for states and [-11] for links Although these are relative values (ie each of them is assigned in relation to the others) some criteria for the quantification must be identified These criteria must be supported by some knowledge about the level of the variables and interactions in the system and in particular the use of FCMs seems appropriate when the estimates of variable state and link strength are the outcomes of either a combination of multiple FCMs from individual stakeholders or a set of values defined through participatory workshops The quantification of variables and interactions requires a certain level of knowledge about the system and it automatically selects the working groups among stakeholders that possess some previous understanding of the system under investigation It follows that FCMs cannot be public reproducible and intelligible in the way that loop analysis is Kok (2009) posits that vague or complex concepts such as ldquoconsumer behaviorrdquo must not be taken into account when applying FCMs
Understanding SocialndashEcological Systems using Loop Analysis
49
because guessing about their magnitude is inherently difficult On the other hand loop analysis allows including ldquoawarenessrdquo in a malaria model (Yasuoka et al 2014) ldquoenvironmental attractivenessrdquo in a tourism model (Bodini et al 2000) and the ldquorole of the unionsrdquo in a model on diabetes (Lewontin amp Levins 2007) In these aspects it seems that FCMs share one limitation with quantitative models the tendency to exclude from the analysis factors that are difficult or impossible to measure no matter if they play a role in the dynamics of the system The connections among the variables in FCMs are designed on the basis of fuzzy conditional statements (ldquoif hellip thenrdquo) that are of the type ldquoif the level of variable A is high that of variable B is lowrdquo Thus connections are deduced from correlations between the variables derived from observing the system (Stylios amp Groumpos 1999) However Levins and Puccia (1988) point out that patterns of correlation depend on the network structure and the entry point of the perturbation For example any two variables may show positive correlation in response to a specific press perturbation but opposite correlation (or no correlation) in response to other press perturbations It follows that defining interactions between variables on the basis of their correlations may be misleading In loop analysis perturbations are variations in parameters that govern the rate of change of variables For example a pollutant triggering an increase in the mortality rate of a population FCMs instead consider the changes in the level of the variables as perturbations To predict say the impacts of a pollutant that affects a population FCMs consider the reduced abundance induced by the pollutant as the initial event (ie the perturbation) on the logical assumption that a toxin by increasing the mortality of a species automatically reduces its abundance Thus the initial event is deduced from a more or less plausible linear sequence of steps This series of events overlooks the fact that the response of the target population to the increased mortality is also mediated by the network of interactions with the other variables and that accordingly often does not follow commonsense linear expectations Such assumption leads to the circular argument that FCMs predict the effects given a cause that is in turn an effect that FCMs should predict On the other hand we can be confident that the pollutant increases the mortality rate of the target population which is the initial event in loop analysis Loop analysis considers the role of the environmental variability in changing the parameters that govern the growth rates of the variables and does not interpret it solely as the cause of variable fluctuations like FCMs do
Causal loop diagrams (CLDs Hanspach et al 2014 Tenza et al 2017) and Bayesian belief networks (BBNs Borsuk et al 2004 Pollino et al 2007) have also been applied for analyzing SESs CLDs make predictions by logically reconstructing the chains of causes and effects between variables on the basis of link polarities (eg the signs of the directed links ie the effects of one variable over the other) Predicting the behavior of complex networks by identifying the feedback effects using link polarity (ie the effect associated to the link positive or negative) is difficult and can lead to misleading interpretations (Lane 2008 Richardson 1997)
Human Ecology Review Volume 26 Number 2 2020
50
Most problems originate from polarities Consider for example the case in which the level of violence displaces people from rural areas and forces them to move to the cities (Colombia is a paradigmatic example see Ibaacutentildeez amp Veacutelez 2008) The causal connections are that level of violence increases the migration rate (positive link) which in turn increases the population level in the city (positive link) Therefore the expected trend is the higher the level of violence the greater the increase of urban population However if the level of violence gets lower the migration rate is reduced but this does not reduce the population in the city as it continues to increase unless an opposite migratory flux occurs Hence the articulation of causal pathways gets difficult because variables can be both standing stocks and rates of change (Sweeney amp Sterman 2007) Similarly specifying the relevant conditional probabilities as required by BBNs can be a laborious and time-consuming process (Marcot et al 2001 Ticehurst et al 2007) Moreover to include feedback mechanisms via cyclic network structures requires dynamic time-explicit BBNs which depend on extensive parameterization Similar to FCMs combining BBNs with loop analysis has great potential for improving predictions and model validation (Anthony et al 2013 Melbourne-Thomas et al 2012 Raoux et al 2018) However it must be emphasized that these applications of BBNs are based on the signs derived from the analysis of the loop models As such their outcomes are contingent on the assumptions and limitations of signed diagraph models
Central for the understanding of the complex causality in SESs is our ability to individuate what the relevant components of the SESs are and diagram their relationships The nature of the linkages among these components determines the spreading of the effects through the system and the overall composition of the linkages generates the feedbacks that amplify or buffer such effects There is no recipe for modeling development but great effort must be devoted to assimilation of facts observations and hypotheses Increasing the reliability of predictions can be possible by designing alternative graphs This iterative procedure allows addressing uncertainty about the system structure and determining which differences matter Robust outcomes may be the effect of a core structure common to all models upon which few links added or removed cannot change radically the predictions The core structure represents the fundamental backbone composed of more certain variables and interactions Disagreements among stakeholders scientists or managers do not limit the application of loop analysis rather they offer the opportunity to involve stakeholders in a participatory model construction (Anthony et al 2013) where different types of system knowledge can be used to determine variables and links that may be important to examine further (Stier et al 2017) The adoption of such a comprehensive system-wide approach aims to formulate management strategies that reconcile ecological integrity and intergenerational equity key dimensions of the sustainable development paradigm
Understanding SocialndashEcological Systems using Loop Analysis
51
Possible developments for the application of loop analysis to SESsMaking predictions is difficult especially when we face the uncertainty associated with new unknown events changing dynamics and lack of quantitative data This is the case for example with climate change which produces completely new phenomena and dynamics In such context an adaptive management that allows for continually assessing new evidence has been called for We believe that in the new scenarios we are facing the method of loop analysis can be helpful It has the necessary adaptability to be used in changing contexts When in doubt about critical linkages and dynamic features alternative models can be developed to find out which differences matter and to reach robust conclusions It is also flexible as it allows including and discarding variables easily and above all it permits working with variables and links that are not readily measurable even though their effects are crucial However its suitability to investigate SESs can be improved in several ways The intricacy of the feedbacks can be better resolved if a specific tool for pathways analysis is developed Returning the total number of pathways and their strength between any pair of variables can show how single pathways contribute to specific effects and which ones are more important in mediating the press perturbations The question of link strength deserves attention We specified in the methodological aspects section that link strength is randomly assigned to interaction links during simulations But this does not contradict the qualitative nature of the method it only serves to assign certainty to paths and feedbacks in order to get unambiguous predictions which remain qualitative in nature as only the direction of change for the variables is predicted Pathway anatomy would help selecting those causal chains that mostly affect system dynamics Other relevant features that would improve the suitability of loop analysis for modeling SESs include (1) considering multiple simultaneous press perturbations and (2) delimiting upper and lower limits for the strength of interactions The first point is related to the fact that SESs are often exposed to different types of disturbances whose interplay gives rise to net cumulative responses that would be useful to disentangle (eg through the identification of the specific causative chains) Considering multiple press perturbations would greatly contribute to building up an effective diagnostic approach (Kittinger et al 2013) For example by loop analysis Bodini et al (2018) diagnosed that multiple press perturbations not only overfishing of small and medium pelagic species were responsible for the restructuring of the Black Sea community during the period 1960ndash1989 Moreover socioeconomic drivers amplify the impacts that are triggered by natural processes for instance both hypoxia and fisheries management affected abalone stock in the Baja California SES (Martone et al 2017) The second line of development is conceived to extend loop analysis in a semi-quantitative direction So far the simulations are performed by randomly sampling interaction strength in the uniform interval (01] There are however cases when some interactions are known
Human Ecology Review Volume 26 Number 2 2020
52
to be either strong or weak in such cases varying the strength of these linkages in the whole interval (01] does not make sense However it is difficult to translate fuzzy concepts such as strong and weak into numbers so that boundaries for the links can be set In this respect sensitivity analysis may help Either the upper (ie 1) or the lower (ie 10-6) limit of the link magnitude could be iteratively changed so that actual boundaries for certain linkages can be identified through a consistency assessment of the outcomes produced For example performing the sensitivity analysis for the strength of specific interactions might help modeling competitive advantages in the ecological domain (eg Noctiluca scintillans vs zooplankton in the Black Sea Bodini et al 2018) and power or information asymmetries between socioeconomic actors (Bousquet et al 2015) Therefore exploring alternative scenarios by constraining the strength of some interactions would be of great benefit for modeling SESs It should also be noticed that a uniform distribution is considered by default for randomly sampling the strength but it could be substituted by either normal or skewed (eg Poisson) distributions
Concluding remarksThe central issue in the study of SESs is to understand interdependencies that cross the boundaries of the classical domains in which scientific and operational knowledge have been settled Contributions in this respect are expected from tools that allow reconstructing the causal chains that give rise to such interdependencies and that involve variables or components of different nature For such reconstruction to be effective tools must overcome the barriers that make communication between domains difficult (1) the simpler the language used to describe the phenomena and the interactions the better it is (2) a lower level of technicality in the algorithms facilitates understanding the outcomes and (3) flexibility widens the range of applicability to different contexts Loop analysis shares most of these features (1) by classifying the interactions in only two categories positive and negative it facilitates creating connections between variables that differ dramatically in physical form (2) the ease by which a model can be constructed as a graph allows keeping up with rapidly changing conditions (ie variables andor links disappear and others become important) (3) the algorithm for predictions refers directly to structural features of the graph and can be visualized thus making the outcomes easier to understand and (4) it is also characterized by a wide applicability (often the question of interest is not a particular system but a whole class of systems with some similarity of structure) Furthermore loop analysis emphasizes the understanding of mechanisms which is a prime objective when an intellectual and operative framework is taking shape as in the case of SESs
Understanding SocialndashEcological Systems using Loop Analysis
53
ReferencesAnthony K R Dambacher J M Walshe T amp Beeden R (2013) A framework for
understanding cumulative impacts supporting environmental decisions and informing resilience-based management of the Great Barrier Reef World Heritage Area Australian Institute of Marine Science CSIRO NERP Decisions Hub University of Melbourne and Great Barrier Reef Marine Park Authority hdlhandlenet110172850
Bender E A Case T J amp Gilpin M E (1984) Perturbation experiments in community ecology Theory and practice Ecology 65(1) 1ndash13 doiorg1023071939452
Binder C R Hinkel J Bots P W G amp Pahl-Wostl C (2013) Comparison of frameworks for analyzing socialndashecological systems Ecology and Society 18(4) Article 26 doiorg 105751es-05551-180426
Bodini A (2000) Reconstructing trophic interactions as a tool for understanding and managing ecosystems Application to a shallow eutrophic lake Canadian Journal of Fisheries and Aquatic Sciences 57(10) 1999ndash2009 doiorg101139f00-153
Bodini A amp Clerici N (2016) Vegetation herbivores and fires in savanna ecosystems A network perspective Ecological Complexity 28 36ndash46 doiorg101016jecocom 201610001
Bodini A Ricci A amp Viaroli P (2000) A multimethodological approach for the sustainable management of perifluvial wetlands of the Po River (Italy) Environmental Management 26(1) 59ndash72 doiorg101007s002670010071
Bodini A Rocchi M amp Scotti M (2018) Insights into the ecology of the Black Sea through the qualitative loop analysis of the community structure Limnology and Oceanography 63(2) 968ndash984 doiorg101002lno10713
Borsuk M E Stow C A amp Reckhow K H (2004) A Bayesian network of eutrophication models for synthesis prediction and uncertainty analysis Ecological Modelling 173(2ndash3) 219ndash239 doiorg101016jecolmodel200308020
Bousquet F Anderies M Antona M Bassett T Benjaminsen T Bonato O hellip Vassal J-M (2015) Socio-ecological theories and empirical research Comparing socialndashecological schools of thoughts in action [Research report] CIRAD-GREEN halarchives-ouvertesfrhal-01130178
Carey M P Levin P S Townsend H Minello T J Sutton G R Francis T B hellip Ruckelshaus M (2014) Characterizing coastal foodwebs with qualitative links to bridge the gap between the theory and the practice of ecosystem-based management ICES Journal of Marine Science 71(3) 713ndash724 doiorg101093icesjmsfst012
Cinner J E (2011) Socialndashecological traps in reef fisheries Global Environmental Change 21(3) 835ndash839 doiorg101016jgloenvcha201104012
Human Ecology Review Volume 26 Number 2 2020
54
Costanza R amp Mageau M (1999) What is a healthy ecosystem Aquatic Ecology 33(1) 105ndash115 doiorg101023A1009930313242
Dambacher J M Brewer D T Dennis D M Macintyre M amp Foale S (2007) Qualitative modelling of gold mine impacts on Lihir Islandrsquos socioeconomic system and reef-edge fish community Environmental Science amp Technology 41(2) 555ndash562 doiorg 101021es0610333
Dambacher J M Rothlisberg P C amp Loneragan N R (2015) Qualitative mathematical models to support ecosystem‐based management of Australiarsquos Northern Prawn Fishery Ecological Applications 25(1) 278ndash298 doiorg10189013-20301
Downing A S van Nes E H Balirwa J S Beuving J J Bwathondi P O J Chapman L J hellip Mooij W M (2014) Coupled human and natural system dynamics as key to the sustainability of Lake Victoriarsquos ecosystem services Ecology and Society 19(4) Article 31 doiorg105751es-06965-190431
Espinoza-Tenorio A Wolff M Espejel I amp Montantildeo-Moctezuma G (2013) Using traditional ecological knowledge to improve holistic fisheries management Transdisciplinary modeling of a lagoon ecosystem of Southern Mexico Ecology and Society 18(2) Article 6 doiorg105751es-05369-180206
Folke C (2006) Resilience The emergence of a perspective for socialndashecological systems analyses Global Environmental Change 16(3) 253ndash267 doiorg101016jgloenvcha 200604002
Haines-Young R amp Potschin M (2010) The links between biodiversity ecosystem services and human well-being In D G Raffaelli amp C L Frid (Eds) Ecosystem ecology A new synthesis (pp 110ndash139) Cambridge University Press doiorg101017cbo978051175 0458007
Hanspach J Hartel T Milcu A I Mikulcak F Dorresteijn I Loos J hellip Fischer J (2014) A holistic approach to studying socialndashecological systems and its application to southern Transylvania Ecology and Society 19(4) Article 32 doiorg105751es-06915-190432
Hilborn R (2007) Defining success in fisheries and conflicts in objectives Marine Policy 31(2) 153ndash158 doiorg101016jmarpol200605014
Hughes T P Bellwood D R Folke C Steneck R S amp Wilson J (2005) New paradigms for supporting the resilience of marine ecosystems Trends in Ecology amp Evolution 20(7) 380ndash386 doiorg101016jtree200503022
Ibaacutentildeez A M amp Veacutelez C E (2008) Civil conflict and forced migration The micro determinants and welfare losses of displacement in Colombia World Development 36(4) 659ndash676 doiorg101016jworlddev200704013
Justus J (2006) Loop analysis and qualitative modeling Limitations and merits Biology and Philosophy 21(5) 647ndash666 doiorg101007s10539-006-9050-x
Understanding SocialndashEcological Systems using Loop Analysis
55
Kittinger J N Finkbeiner E M Ban N C Broad K Carr M H Cinner J E hellip Crowder L B (2013) Emerging frontiers in social-ecological systems research for sustainability of small-scale fisheries Current Opinion on Environmental Sustainability 5(3ndash4) 352ndash357 doiorg101016jcosust201306008
Kok K (2009) The potential of fuzzy cognitive maps for semi-quantitative scenario development with an example from Brazil Global Environmental Change 19(1) 122ndash133 doiorg101016jgloenvcha200808003
Lane D C (2008) The emergence and use of diagramming in system dynamics A critical account Systems Research and Behavioral Science 25(1) 3ndash23 doiorg101002sres826
Leslie H M Basurto X Nenadovic M Sievanen L Cavanaugh K C Cota-Nieto J J hellip Aburto-Oropeza O (2015) Operationalizing the social-ecological systems framework to assess sustainability Proceedings of the National Academy of Sciences of the USA 112(19) 5979ndash5984 doiorg101073pnas1414640112
Levin P S Fogarty M J Murawski S A amp Fluharty D (2009) Integrated ecosystem assessments Developing the scientific basis for ecosystem-based management of the ocean PLoS Biology 7(1) e1000014 doiorg101371journalpbio1000014
Levins R (1968) Evolution in changing environments Some theoretical explorations Princeton University Press
Levins R (1974) Discussion paper The qualitative analysis of partially specified systems Annals of the New York Academy of Sciences 231(1) 123ndash138 doiorg101111 j1749-66321974tb20562x
Levins R (1975) Evolution in communities near equilibrium In M L Cody and J M Diamond (Eds) Ecology and evolution of communities (pp 16ndash50) Harvard University Press
Levins R (1995) Preparing for uncertainty Ecosystem Health 1(1) 47ndash57
Levins R amp Puccia C J (1988) The controlling factor in biological communities Coenoses 3(3) 149ndash154 wwwjstororgstable43460977
Lewontin R C amp Levins R (2007) Educating the intuition to cope with complexity In R C Lewontin amp R Levins (Eds) Biology under the influence Dialectical essays on ecology agriculture and health (pp 183ndash198) Monthly Review Press
Logofet D (1993) Matrices and graphs Stability problems in mathematical ecology CRC Press
Long R D Charles A amp Stephenson R L (2015) Key principles of marine ecosystem-based management Marine Policy 57 53ndash60 doiorg101016jmarpol201501013
Lotze H K Lenihan H S Bourque B J Bradbury R H Cooke R G Kay M C hellip Jackson J B (2006) Depletion degradation and recovery potential of estuaries and coastal seas Science 312(5781) 1806ndash1809 doiorg101126science1128035
Human Ecology Review Volume 26 Number 2 2020
56
Marcot B G Holthausen R S Raphael M G Rowland M M amp Wisdom M J (2001) Using Bayesian belief networks to evaluate fish and wildlife population viability under land management alternatives from an environmental impact statement Forest Ecology and Management 153(1ndash3) 29ndash42 doiorg101016s0378-1127(01)00452-2
Martone R G Bodini A amp Micheli F (2017) Identifying potential consequences of natural perturbations and management decisions on a coastal fishery socialndashecological system using qualitative loop analysis Ecology and Society 22(1) Article 34 doiorg 105751 es-08825-220134
Melbourne-Thomas J Wotherspoon S Raymond B amp Constable A (2012) Comprehensive evaluation of model uncertainty in qualitative network analyses Ecological Monographs 82(4) 505ndash519 doiorg10189012-02071
Micheli F Saenz-Arroyo A Greenley A Vazquez L Espinoza Montes J A Rossetto M amp De Leo G A (2012) Evidence that marine reserves enhance resilience to climatic impacts PLoS ONE 7 e40832 doiorg101371journalpone0040832
Nival P amp Gorsky G (2001) Conditions for blooming of pelagic species In CIESM Workshop Monographs No 14mdashGelatinous zooplankton outbreaks Theory and practice (pp 23ndash27) Commission Internationale pour lrsquoExploration Scientifique de la Meacutediterraneacutee (CIESM [Mediterranean Science Commission])
Ostrom E (2009) A general framework for analyzing sustainability of social-ecological systems Science 325(5939) 419ndash422 doiorg101126science1172133
Oumlzesmi U amp Oumlzesmi S L (2004) Ecological models based on peoplersquos knowledge A multi-step fuzzy cognitive mapping approach Ecological Modelling 176(1ndash2) 43ndash64 doiorg101016jecolmodel200310027
Partelow S Fujitani M Soundararajan V amp Schluumlter A (2019) Transforming the social-ecological systems framework into a knowledge exchange and deliberation tool for comanagement Ecology and Society 24(1) Article 15 doiorg105751es-10724-240115
Pollino C A Woodberry O Nicholson A Korb K amp Hart B T (2007) Parameterisation and evaluation of a Bayesian network for use in an ecological risk assessment Environmental Modelling amp Software 22(8) 1140ndash1152 doiorg101016jenvsoft200603006
Puccia C J amp Levins R (1985) Qualitative modeling of complex systems An introduction to loop analysis and time averaging Harvard University Press
Raoux A Dambacher J M Pezy J P Mazeacute C Dauvin J C amp Niquil N (2018) Assessing cumulative sociondashecological impacts of offshore wind farm development in the Bay of Seine (English Channel) Marine Policy 89 11ndash20 doiorg101016jmarpol 201712007
Reum J C McDonald P S Ferriss B E Farrell D M Harvey C J amp Levin P S (2015) Qualitative network models in support of ecosystem approaches to bivalve aquaculture ICES Journal of Marine Science 72(8) 2278ndash2288 doiorg101093icesjms fsv119
Understanding SocialndashEcological Systems using Loop Analysis
57
Richardson G P (1997) Problems in causal loop diagrams revisited System Dynamics Review 13(3) 247ndash252 doiorg101002(sici)1099-1727(199723)133lt247aid-sdr 128gt 30co2-9
Stachowicz J J Fried H Osman R W amp Whitlatch R B (2002) Biodiversity invasion resistance and marine ecosystem function Reconciling pattern and process Ecology 83(9) 2575ndash2590 doiorg1018900012-9658(2002)083[2575birame]20co2
Stier A C Samhouri J F Gray S Martone R G Mach M E Halpern B S hellip Levin P S (2017) Integrating expert perceptions into food web conservation and management Conservation Letters 10(1) 67ndash76 doiorg101111conl12245
Stylios C D amp Groumpos P P (1999) A soft computing approach for modelling the supervisor of manufacturing systems Journal of Intelligent and Robotic Systems 26(3ndash4) 389ndash403 doiorg101023A1008165916707
Sweeney L B amp Sterman J (2007) Thinking about systems Student and teacher conceptions of natural and social systems System Dynamics Review 23(2ndash3) 285ndash311 doiorg101002sdr366
Tenza A Peacuterez I Martiacutenez-Fernaacutendez J amp Gimeacutenez A (2017) Understanding the decline and resilience loss of a long-lived social-ecological system Insights from system dynamics Ecology and Society 22(2) Article 15 doiorg105751es-09176-220215
Ticehurst J L Newham L T Rissik D Letcher R A amp Jakeman A J (2007) A Bayesian network approach for assessing the sustainability of coastal lakes in New South Wales Australia Environmental Modelling amp Software 22(8) 1129ndash1139 doiorg101016 jenvsoft 200603003
Worm B Barbier E B Beaumont N Duffy J E Folke C Halpern B S hellip Watson R (2006) Impacts of biodiversity loss on ocean ecosystem services Science 314(5800) 787ndash790 doiorg101126science1132294
Yasuoka J Jimba M amp Levins R (2014) Application of loop analysis for evaluation of malaria control interventions Malaria Journal 13 Article 140 doiorg1011861475-2875-13-140
This text is taken from Human Ecology Review Volume 26 Number 2 2020 published by ANU Press The Australian National University Canberra Australia
doiorg1022459HER2602202003

Understanding SocialndashEcological Systems using Loop Analysis
49
because guessing about their magnitude is inherently difficult On the other hand loop analysis allows including ldquoawarenessrdquo in a malaria model (Yasuoka et al 2014) ldquoenvironmental attractivenessrdquo in a tourism model (Bodini et al 2000) and the ldquorole of the unionsrdquo in a model on diabetes (Lewontin amp Levins 2007) In these aspects it seems that FCMs share one limitation with quantitative models the tendency to exclude from the analysis factors that are difficult or impossible to measure no matter if they play a role in the dynamics of the system The connections among the variables in FCMs are designed on the basis of fuzzy conditional statements (ldquoif hellip thenrdquo) that are of the type ldquoif the level of variable A is high that of variable B is lowrdquo Thus connections are deduced from correlations between the variables derived from observing the system (Stylios amp Groumpos 1999) However Levins and Puccia (1988) point out that patterns of correlation depend on the network structure and the entry point of the perturbation For example any two variables may show positive correlation in response to a specific press perturbation but opposite correlation (or no correlation) in response to other press perturbations It follows that defining interactions between variables on the basis of their correlations may be misleading In loop analysis perturbations are variations in parameters that govern the rate of change of variables For example a pollutant triggering an increase in the mortality rate of a population FCMs instead consider the changes in the level of the variables as perturbations To predict say the impacts of a pollutant that affects a population FCMs consider the reduced abundance induced by the pollutant as the initial event (ie the perturbation) on the logical assumption that a toxin by increasing the mortality of a species automatically reduces its abundance Thus the initial event is deduced from a more or less plausible linear sequence of steps This series of events overlooks the fact that the response of the target population to the increased mortality is also mediated by the network of interactions with the other variables and that accordingly often does not follow commonsense linear expectations Such assumption leads to the circular argument that FCMs predict the effects given a cause that is in turn an effect that FCMs should predict On the other hand we can be confident that the pollutant increases the mortality rate of the target population which is the initial event in loop analysis Loop analysis considers the role of the environmental variability in changing the parameters that govern the growth rates of the variables and does not interpret it solely as the cause of variable fluctuations like FCMs do
Causal loop diagrams (CLDs Hanspach et al 2014 Tenza et al 2017) and Bayesian belief networks (BBNs Borsuk et al 2004 Pollino et al 2007) have also been applied for analyzing SESs CLDs make predictions by logically reconstructing the chains of causes and effects between variables on the basis of link polarities (eg the signs of the directed links ie the effects of one variable over the other) Predicting the behavior of complex networks by identifying the feedback effects using link polarity (ie the effect associated to the link positive or negative) is difficult and can lead to misleading interpretations (Lane 2008 Richardson 1997)
Human Ecology Review Volume 26 Number 2 2020
50
Most problems originate from polarities Consider for example the case in which the level of violence displaces people from rural areas and forces them to move to the cities (Colombia is a paradigmatic example see Ibaacutentildeez amp Veacutelez 2008) The causal connections are that level of violence increases the migration rate (positive link) which in turn increases the population level in the city (positive link) Therefore the expected trend is the higher the level of violence the greater the increase of urban population However if the level of violence gets lower the migration rate is reduced but this does not reduce the population in the city as it continues to increase unless an opposite migratory flux occurs Hence the articulation of causal pathways gets difficult because variables can be both standing stocks and rates of change (Sweeney amp Sterman 2007) Similarly specifying the relevant conditional probabilities as required by BBNs can be a laborious and time-consuming process (Marcot et al 2001 Ticehurst et al 2007) Moreover to include feedback mechanisms via cyclic network structures requires dynamic time-explicit BBNs which depend on extensive parameterization Similar to FCMs combining BBNs with loop analysis has great potential for improving predictions and model validation (Anthony et al 2013 Melbourne-Thomas et al 2012 Raoux et al 2018) However it must be emphasized that these applications of BBNs are based on the signs derived from the analysis of the loop models As such their outcomes are contingent on the assumptions and limitations of signed diagraph models
Central for the understanding of the complex causality in SESs is our ability to individuate what the relevant components of the SESs are and diagram their relationships The nature of the linkages among these components determines the spreading of the effects through the system and the overall composition of the linkages generates the feedbacks that amplify or buffer such effects There is no recipe for modeling development but great effort must be devoted to assimilation of facts observations and hypotheses Increasing the reliability of predictions can be possible by designing alternative graphs This iterative procedure allows addressing uncertainty about the system structure and determining which differences matter Robust outcomes may be the effect of a core structure common to all models upon which few links added or removed cannot change radically the predictions The core structure represents the fundamental backbone composed of more certain variables and interactions Disagreements among stakeholders scientists or managers do not limit the application of loop analysis rather they offer the opportunity to involve stakeholders in a participatory model construction (Anthony et al 2013) where different types of system knowledge can be used to determine variables and links that may be important to examine further (Stier et al 2017) The adoption of such a comprehensive system-wide approach aims to formulate management strategies that reconcile ecological integrity and intergenerational equity key dimensions of the sustainable development paradigm
Understanding SocialndashEcological Systems using Loop Analysis
51
Possible developments for the application of loop analysis to SESsMaking predictions is difficult especially when we face the uncertainty associated with new unknown events changing dynamics and lack of quantitative data This is the case for example with climate change which produces completely new phenomena and dynamics In such context an adaptive management that allows for continually assessing new evidence has been called for We believe that in the new scenarios we are facing the method of loop analysis can be helpful It has the necessary adaptability to be used in changing contexts When in doubt about critical linkages and dynamic features alternative models can be developed to find out which differences matter and to reach robust conclusions It is also flexible as it allows including and discarding variables easily and above all it permits working with variables and links that are not readily measurable even though their effects are crucial However its suitability to investigate SESs can be improved in several ways The intricacy of the feedbacks can be better resolved if a specific tool for pathways analysis is developed Returning the total number of pathways and their strength between any pair of variables can show how single pathways contribute to specific effects and which ones are more important in mediating the press perturbations The question of link strength deserves attention We specified in the methodological aspects section that link strength is randomly assigned to interaction links during simulations But this does not contradict the qualitative nature of the method it only serves to assign certainty to paths and feedbacks in order to get unambiguous predictions which remain qualitative in nature as only the direction of change for the variables is predicted Pathway anatomy would help selecting those causal chains that mostly affect system dynamics Other relevant features that would improve the suitability of loop analysis for modeling SESs include (1) considering multiple simultaneous press perturbations and (2) delimiting upper and lower limits for the strength of interactions The first point is related to the fact that SESs are often exposed to different types of disturbances whose interplay gives rise to net cumulative responses that would be useful to disentangle (eg through the identification of the specific causative chains) Considering multiple press perturbations would greatly contribute to building up an effective diagnostic approach (Kittinger et al 2013) For example by loop analysis Bodini et al (2018) diagnosed that multiple press perturbations not only overfishing of small and medium pelagic species were responsible for the restructuring of the Black Sea community during the period 1960ndash1989 Moreover socioeconomic drivers amplify the impacts that are triggered by natural processes for instance both hypoxia and fisheries management affected abalone stock in the Baja California SES (Martone et al 2017) The second line of development is conceived to extend loop analysis in a semi-quantitative direction So far the simulations are performed by randomly sampling interaction strength in the uniform interval (01] There are however cases when some interactions are known
Human Ecology Review Volume 26 Number 2 2020
52
to be either strong or weak in such cases varying the strength of these linkages in the whole interval (01] does not make sense However it is difficult to translate fuzzy concepts such as strong and weak into numbers so that boundaries for the links can be set In this respect sensitivity analysis may help Either the upper (ie 1) or the lower (ie 10-6) limit of the link magnitude could be iteratively changed so that actual boundaries for certain linkages can be identified through a consistency assessment of the outcomes produced For example performing the sensitivity analysis for the strength of specific interactions might help modeling competitive advantages in the ecological domain (eg Noctiluca scintillans vs zooplankton in the Black Sea Bodini et al 2018) and power or information asymmetries between socioeconomic actors (Bousquet et al 2015) Therefore exploring alternative scenarios by constraining the strength of some interactions would be of great benefit for modeling SESs It should also be noticed that a uniform distribution is considered by default for randomly sampling the strength but it could be substituted by either normal or skewed (eg Poisson) distributions
Concluding remarksThe central issue in the study of SESs is to understand interdependencies that cross the boundaries of the classical domains in which scientific and operational knowledge have been settled Contributions in this respect are expected from tools that allow reconstructing the causal chains that give rise to such interdependencies and that involve variables or components of different nature For such reconstruction to be effective tools must overcome the barriers that make communication between domains difficult (1) the simpler the language used to describe the phenomena and the interactions the better it is (2) a lower level of technicality in the algorithms facilitates understanding the outcomes and (3) flexibility widens the range of applicability to different contexts Loop analysis shares most of these features (1) by classifying the interactions in only two categories positive and negative it facilitates creating connections between variables that differ dramatically in physical form (2) the ease by which a model can be constructed as a graph allows keeping up with rapidly changing conditions (ie variables andor links disappear and others become important) (3) the algorithm for predictions refers directly to structural features of the graph and can be visualized thus making the outcomes easier to understand and (4) it is also characterized by a wide applicability (often the question of interest is not a particular system but a whole class of systems with some similarity of structure) Furthermore loop analysis emphasizes the understanding of mechanisms which is a prime objective when an intellectual and operative framework is taking shape as in the case of SESs
Understanding SocialndashEcological Systems using Loop Analysis
53
ReferencesAnthony K R Dambacher J M Walshe T amp Beeden R (2013) A framework for
understanding cumulative impacts supporting environmental decisions and informing resilience-based management of the Great Barrier Reef World Heritage Area Australian Institute of Marine Science CSIRO NERP Decisions Hub University of Melbourne and Great Barrier Reef Marine Park Authority hdlhandlenet110172850
Bender E A Case T J amp Gilpin M E (1984) Perturbation experiments in community ecology Theory and practice Ecology 65(1) 1ndash13 doiorg1023071939452
Binder C R Hinkel J Bots P W G amp Pahl-Wostl C (2013) Comparison of frameworks for analyzing socialndashecological systems Ecology and Society 18(4) Article 26 doiorg 105751es-05551-180426
Bodini A (2000) Reconstructing trophic interactions as a tool for understanding and managing ecosystems Application to a shallow eutrophic lake Canadian Journal of Fisheries and Aquatic Sciences 57(10) 1999ndash2009 doiorg101139f00-153
Bodini A amp Clerici N (2016) Vegetation herbivores and fires in savanna ecosystems A network perspective Ecological Complexity 28 36ndash46 doiorg101016jecocom 201610001
Bodini A Ricci A amp Viaroli P (2000) A multimethodological approach for the sustainable management of perifluvial wetlands of the Po River (Italy) Environmental Management 26(1) 59ndash72 doiorg101007s002670010071
Bodini A Rocchi M amp Scotti M (2018) Insights into the ecology of the Black Sea through the qualitative loop analysis of the community structure Limnology and Oceanography 63(2) 968ndash984 doiorg101002lno10713
Borsuk M E Stow C A amp Reckhow K H (2004) A Bayesian network of eutrophication models for synthesis prediction and uncertainty analysis Ecological Modelling 173(2ndash3) 219ndash239 doiorg101016jecolmodel200308020
Bousquet F Anderies M Antona M Bassett T Benjaminsen T Bonato O hellip Vassal J-M (2015) Socio-ecological theories and empirical research Comparing socialndashecological schools of thoughts in action [Research report] CIRAD-GREEN halarchives-ouvertesfrhal-01130178
Carey M P Levin P S Townsend H Minello T J Sutton G R Francis T B hellip Ruckelshaus M (2014) Characterizing coastal foodwebs with qualitative links to bridge the gap between the theory and the practice of ecosystem-based management ICES Journal of Marine Science 71(3) 713ndash724 doiorg101093icesjmsfst012
Cinner J E (2011) Socialndashecological traps in reef fisheries Global Environmental Change 21(3) 835ndash839 doiorg101016jgloenvcha201104012
Human Ecology Review Volume 26 Number 2 2020
54
Costanza R amp Mageau M (1999) What is a healthy ecosystem Aquatic Ecology 33(1) 105ndash115 doiorg101023A1009930313242
Dambacher J M Brewer D T Dennis D M Macintyre M amp Foale S (2007) Qualitative modelling of gold mine impacts on Lihir Islandrsquos socioeconomic system and reef-edge fish community Environmental Science amp Technology 41(2) 555ndash562 doiorg 101021es0610333
Dambacher J M Rothlisberg P C amp Loneragan N R (2015) Qualitative mathematical models to support ecosystem‐based management of Australiarsquos Northern Prawn Fishery Ecological Applications 25(1) 278ndash298 doiorg10189013-20301
Downing A S van Nes E H Balirwa J S Beuving J J Bwathondi P O J Chapman L J hellip Mooij W M (2014) Coupled human and natural system dynamics as key to the sustainability of Lake Victoriarsquos ecosystem services Ecology and Society 19(4) Article 31 doiorg105751es-06965-190431
Espinoza-Tenorio A Wolff M Espejel I amp Montantildeo-Moctezuma G (2013) Using traditional ecological knowledge to improve holistic fisheries management Transdisciplinary modeling of a lagoon ecosystem of Southern Mexico Ecology and Society 18(2) Article 6 doiorg105751es-05369-180206
Folke C (2006) Resilience The emergence of a perspective for socialndashecological systems analyses Global Environmental Change 16(3) 253ndash267 doiorg101016jgloenvcha 200604002
Haines-Young R amp Potschin M (2010) The links between biodiversity ecosystem services and human well-being In D G Raffaelli amp C L Frid (Eds) Ecosystem ecology A new synthesis (pp 110ndash139) Cambridge University Press doiorg101017cbo978051175 0458007
Hanspach J Hartel T Milcu A I Mikulcak F Dorresteijn I Loos J hellip Fischer J (2014) A holistic approach to studying socialndashecological systems and its application to southern Transylvania Ecology and Society 19(4) Article 32 doiorg105751es-06915-190432
Hilborn R (2007) Defining success in fisheries and conflicts in objectives Marine Policy 31(2) 153ndash158 doiorg101016jmarpol200605014
Hughes T P Bellwood D R Folke C Steneck R S amp Wilson J (2005) New paradigms for supporting the resilience of marine ecosystems Trends in Ecology amp Evolution 20(7) 380ndash386 doiorg101016jtree200503022
Ibaacutentildeez A M amp Veacutelez C E (2008) Civil conflict and forced migration The micro determinants and welfare losses of displacement in Colombia World Development 36(4) 659ndash676 doiorg101016jworlddev200704013
Justus J (2006) Loop analysis and qualitative modeling Limitations and merits Biology and Philosophy 21(5) 647ndash666 doiorg101007s10539-006-9050-x
Understanding SocialndashEcological Systems using Loop Analysis
55
Kittinger J N Finkbeiner E M Ban N C Broad K Carr M H Cinner J E hellip Crowder L B (2013) Emerging frontiers in social-ecological systems research for sustainability of small-scale fisheries Current Opinion on Environmental Sustainability 5(3ndash4) 352ndash357 doiorg101016jcosust201306008
Kok K (2009) The potential of fuzzy cognitive maps for semi-quantitative scenario development with an example from Brazil Global Environmental Change 19(1) 122ndash133 doiorg101016jgloenvcha200808003
Lane D C (2008) The emergence and use of diagramming in system dynamics A critical account Systems Research and Behavioral Science 25(1) 3ndash23 doiorg101002sres826
Leslie H M Basurto X Nenadovic M Sievanen L Cavanaugh K C Cota-Nieto J J hellip Aburto-Oropeza O (2015) Operationalizing the social-ecological systems framework to assess sustainability Proceedings of the National Academy of Sciences of the USA 112(19) 5979ndash5984 doiorg101073pnas1414640112
Levin P S Fogarty M J Murawski S A amp Fluharty D (2009) Integrated ecosystem assessments Developing the scientific basis for ecosystem-based management of the ocean PLoS Biology 7(1) e1000014 doiorg101371journalpbio1000014
Levins R (1968) Evolution in changing environments Some theoretical explorations Princeton University Press
Levins R (1974) Discussion paper The qualitative analysis of partially specified systems Annals of the New York Academy of Sciences 231(1) 123ndash138 doiorg101111 j1749-66321974tb20562x
Levins R (1975) Evolution in communities near equilibrium In M L Cody and J M Diamond (Eds) Ecology and evolution of communities (pp 16ndash50) Harvard University Press
Levins R (1995) Preparing for uncertainty Ecosystem Health 1(1) 47ndash57
Levins R amp Puccia C J (1988) The controlling factor in biological communities Coenoses 3(3) 149ndash154 wwwjstororgstable43460977
Lewontin R C amp Levins R (2007) Educating the intuition to cope with complexity In R C Lewontin amp R Levins (Eds) Biology under the influence Dialectical essays on ecology agriculture and health (pp 183ndash198) Monthly Review Press
Logofet D (1993) Matrices and graphs Stability problems in mathematical ecology CRC Press
Long R D Charles A amp Stephenson R L (2015) Key principles of marine ecosystem-based management Marine Policy 57 53ndash60 doiorg101016jmarpol201501013
Lotze H K Lenihan H S Bourque B J Bradbury R H Cooke R G Kay M C hellip Jackson J B (2006) Depletion degradation and recovery potential of estuaries and coastal seas Science 312(5781) 1806ndash1809 doiorg101126science1128035
Human Ecology Review Volume 26 Number 2 2020
56
Marcot B G Holthausen R S Raphael M G Rowland M M amp Wisdom M J (2001) Using Bayesian belief networks to evaluate fish and wildlife population viability under land management alternatives from an environmental impact statement Forest Ecology and Management 153(1ndash3) 29ndash42 doiorg101016s0378-1127(01)00452-2
Martone R G Bodini A amp Micheli F (2017) Identifying potential consequences of natural perturbations and management decisions on a coastal fishery socialndashecological system using qualitative loop analysis Ecology and Society 22(1) Article 34 doiorg 105751 es-08825-220134
Melbourne-Thomas J Wotherspoon S Raymond B amp Constable A (2012) Comprehensive evaluation of model uncertainty in qualitative network analyses Ecological Monographs 82(4) 505ndash519 doiorg10189012-02071
Micheli F Saenz-Arroyo A Greenley A Vazquez L Espinoza Montes J A Rossetto M amp De Leo G A (2012) Evidence that marine reserves enhance resilience to climatic impacts PLoS ONE 7 e40832 doiorg101371journalpone0040832
Nival P amp Gorsky G (2001) Conditions for blooming of pelagic species In CIESM Workshop Monographs No 14mdashGelatinous zooplankton outbreaks Theory and practice (pp 23ndash27) Commission Internationale pour lrsquoExploration Scientifique de la Meacutediterraneacutee (CIESM [Mediterranean Science Commission])
Ostrom E (2009) A general framework for analyzing sustainability of social-ecological systems Science 325(5939) 419ndash422 doiorg101126science1172133
Oumlzesmi U amp Oumlzesmi S L (2004) Ecological models based on peoplersquos knowledge A multi-step fuzzy cognitive mapping approach Ecological Modelling 176(1ndash2) 43ndash64 doiorg101016jecolmodel200310027
Partelow S Fujitani M Soundararajan V amp Schluumlter A (2019) Transforming the social-ecological systems framework into a knowledge exchange and deliberation tool for comanagement Ecology and Society 24(1) Article 15 doiorg105751es-10724-240115
Pollino C A Woodberry O Nicholson A Korb K amp Hart B T (2007) Parameterisation and evaluation of a Bayesian network for use in an ecological risk assessment Environmental Modelling amp Software 22(8) 1140ndash1152 doiorg101016jenvsoft200603006
Puccia C J amp Levins R (1985) Qualitative modeling of complex systems An introduction to loop analysis and time averaging Harvard University Press
Raoux A Dambacher J M Pezy J P Mazeacute C Dauvin J C amp Niquil N (2018) Assessing cumulative sociondashecological impacts of offshore wind farm development in the Bay of Seine (English Channel) Marine Policy 89 11ndash20 doiorg101016jmarpol 201712007
Reum J C McDonald P S Ferriss B E Farrell D M Harvey C J amp Levin P S (2015) Qualitative network models in support of ecosystem approaches to bivalve aquaculture ICES Journal of Marine Science 72(8) 2278ndash2288 doiorg101093icesjms fsv119
Understanding SocialndashEcological Systems using Loop Analysis
57
Richardson G P (1997) Problems in causal loop diagrams revisited System Dynamics Review 13(3) 247ndash252 doiorg101002(sici)1099-1727(199723)133lt247aid-sdr 128gt 30co2-9
Stachowicz J J Fried H Osman R W amp Whitlatch R B (2002) Biodiversity invasion resistance and marine ecosystem function Reconciling pattern and process Ecology 83(9) 2575ndash2590 doiorg1018900012-9658(2002)083[2575birame]20co2
Stier A C Samhouri J F Gray S Martone R G Mach M E Halpern B S hellip Levin P S (2017) Integrating expert perceptions into food web conservation and management Conservation Letters 10(1) 67ndash76 doiorg101111conl12245
Stylios C D amp Groumpos P P (1999) A soft computing approach for modelling the supervisor of manufacturing systems Journal of Intelligent and Robotic Systems 26(3ndash4) 389ndash403 doiorg101023A1008165916707
Sweeney L B amp Sterman J (2007) Thinking about systems Student and teacher conceptions of natural and social systems System Dynamics Review 23(2ndash3) 285ndash311 doiorg101002sdr366
Tenza A Peacuterez I Martiacutenez-Fernaacutendez J amp Gimeacutenez A (2017) Understanding the decline and resilience loss of a long-lived social-ecological system Insights from system dynamics Ecology and Society 22(2) Article 15 doiorg105751es-09176-220215
Ticehurst J L Newham L T Rissik D Letcher R A amp Jakeman A J (2007) A Bayesian network approach for assessing the sustainability of coastal lakes in New South Wales Australia Environmental Modelling amp Software 22(8) 1129ndash1139 doiorg101016 jenvsoft 200603003
Worm B Barbier E B Beaumont N Duffy J E Folke C Halpern B S hellip Watson R (2006) Impacts of biodiversity loss on ocean ecosystem services Science 314(5800) 787ndash790 doiorg101126science1132294
Yasuoka J Jimba M amp Levins R (2014) Application of loop analysis for evaluation of malaria control interventions Malaria Journal 13 Article 140 doiorg1011861475-2875-13-140
This text is taken from Human Ecology Review Volume 26 Number 2 2020 published by ANU Press The Australian National University Canberra Australia
doiorg1022459HER2602202003

Human Ecology Review Volume 26 Number 2 2020
50
Most problems originate from polarities Consider for example the case in which the level of violence displaces people from rural areas and forces them to move to the cities (Colombia is a paradigmatic example see Ibaacutentildeez amp Veacutelez 2008) The causal connections are that level of violence increases the migration rate (positive link) which in turn increases the population level in the city (positive link) Therefore the expected trend is the higher the level of violence the greater the increase of urban population However if the level of violence gets lower the migration rate is reduced but this does not reduce the population in the city as it continues to increase unless an opposite migratory flux occurs Hence the articulation of causal pathways gets difficult because variables can be both standing stocks and rates of change (Sweeney amp Sterman 2007) Similarly specifying the relevant conditional probabilities as required by BBNs can be a laborious and time-consuming process (Marcot et al 2001 Ticehurst et al 2007) Moreover to include feedback mechanisms via cyclic network structures requires dynamic time-explicit BBNs which depend on extensive parameterization Similar to FCMs combining BBNs with loop analysis has great potential for improving predictions and model validation (Anthony et al 2013 Melbourne-Thomas et al 2012 Raoux et al 2018) However it must be emphasized that these applications of BBNs are based on the signs derived from the analysis of the loop models As such their outcomes are contingent on the assumptions and limitations of signed diagraph models
Central for the understanding of the complex causality in SESs is our ability to individuate what the relevant components of the SESs are and diagram their relationships The nature of the linkages among these components determines the spreading of the effects through the system and the overall composition of the linkages generates the feedbacks that amplify or buffer such effects There is no recipe for modeling development but great effort must be devoted to assimilation of facts observations and hypotheses Increasing the reliability of predictions can be possible by designing alternative graphs This iterative procedure allows addressing uncertainty about the system structure and determining which differences matter Robust outcomes may be the effect of a core structure common to all models upon which few links added or removed cannot change radically the predictions The core structure represents the fundamental backbone composed of more certain variables and interactions Disagreements among stakeholders scientists or managers do not limit the application of loop analysis rather they offer the opportunity to involve stakeholders in a participatory model construction (Anthony et al 2013) where different types of system knowledge can be used to determine variables and links that may be important to examine further (Stier et al 2017) The adoption of such a comprehensive system-wide approach aims to formulate management strategies that reconcile ecological integrity and intergenerational equity key dimensions of the sustainable development paradigm
Understanding SocialndashEcological Systems using Loop Analysis
51
Possible developments for the application of loop analysis to SESsMaking predictions is difficult especially when we face the uncertainty associated with new unknown events changing dynamics and lack of quantitative data This is the case for example with climate change which produces completely new phenomena and dynamics In such context an adaptive management that allows for continually assessing new evidence has been called for We believe that in the new scenarios we are facing the method of loop analysis can be helpful It has the necessary adaptability to be used in changing contexts When in doubt about critical linkages and dynamic features alternative models can be developed to find out which differences matter and to reach robust conclusions It is also flexible as it allows including and discarding variables easily and above all it permits working with variables and links that are not readily measurable even though their effects are crucial However its suitability to investigate SESs can be improved in several ways The intricacy of the feedbacks can be better resolved if a specific tool for pathways analysis is developed Returning the total number of pathways and their strength between any pair of variables can show how single pathways contribute to specific effects and which ones are more important in mediating the press perturbations The question of link strength deserves attention We specified in the methodological aspects section that link strength is randomly assigned to interaction links during simulations But this does not contradict the qualitative nature of the method it only serves to assign certainty to paths and feedbacks in order to get unambiguous predictions which remain qualitative in nature as only the direction of change for the variables is predicted Pathway anatomy would help selecting those causal chains that mostly affect system dynamics Other relevant features that would improve the suitability of loop analysis for modeling SESs include (1) considering multiple simultaneous press perturbations and (2) delimiting upper and lower limits for the strength of interactions The first point is related to the fact that SESs are often exposed to different types of disturbances whose interplay gives rise to net cumulative responses that would be useful to disentangle (eg through the identification of the specific causative chains) Considering multiple press perturbations would greatly contribute to building up an effective diagnostic approach (Kittinger et al 2013) For example by loop analysis Bodini et al (2018) diagnosed that multiple press perturbations not only overfishing of small and medium pelagic species were responsible for the restructuring of the Black Sea community during the period 1960ndash1989 Moreover socioeconomic drivers amplify the impacts that are triggered by natural processes for instance both hypoxia and fisheries management affected abalone stock in the Baja California SES (Martone et al 2017) The second line of development is conceived to extend loop analysis in a semi-quantitative direction So far the simulations are performed by randomly sampling interaction strength in the uniform interval (01] There are however cases when some interactions are known
Human Ecology Review Volume 26 Number 2 2020
52
to be either strong or weak in such cases varying the strength of these linkages in the whole interval (01] does not make sense However it is difficult to translate fuzzy concepts such as strong and weak into numbers so that boundaries for the links can be set In this respect sensitivity analysis may help Either the upper (ie 1) or the lower (ie 10-6) limit of the link magnitude could be iteratively changed so that actual boundaries for certain linkages can be identified through a consistency assessment of the outcomes produced For example performing the sensitivity analysis for the strength of specific interactions might help modeling competitive advantages in the ecological domain (eg Noctiluca scintillans vs zooplankton in the Black Sea Bodini et al 2018) and power or information asymmetries between socioeconomic actors (Bousquet et al 2015) Therefore exploring alternative scenarios by constraining the strength of some interactions would be of great benefit for modeling SESs It should also be noticed that a uniform distribution is considered by default for randomly sampling the strength but it could be substituted by either normal or skewed (eg Poisson) distributions
Concluding remarksThe central issue in the study of SESs is to understand interdependencies that cross the boundaries of the classical domains in which scientific and operational knowledge have been settled Contributions in this respect are expected from tools that allow reconstructing the causal chains that give rise to such interdependencies and that involve variables or components of different nature For such reconstruction to be effective tools must overcome the barriers that make communication between domains difficult (1) the simpler the language used to describe the phenomena and the interactions the better it is (2) a lower level of technicality in the algorithms facilitates understanding the outcomes and (3) flexibility widens the range of applicability to different contexts Loop analysis shares most of these features (1) by classifying the interactions in only two categories positive and negative it facilitates creating connections between variables that differ dramatically in physical form (2) the ease by which a model can be constructed as a graph allows keeping up with rapidly changing conditions (ie variables andor links disappear and others become important) (3) the algorithm for predictions refers directly to structural features of the graph and can be visualized thus making the outcomes easier to understand and (4) it is also characterized by a wide applicability (often the question of interest is not a particular system but a whole class of systems with some similarity of structure) Furthermore loop analysis emphasizes the understanding of mechanisms which is a prime objective when an intellectual and operative framework is taking shape as in the case of SESs
Understanding SocialndashEcological Systems using Loop Analysis
53
ReferencesAnthony K R Dambacher J M Walshe T amp Beeden R (2013) A framework for
understanding cumulative impacts supporting environmental decisions and informing resilience-based management of the Great Barrier Reef World Heritage Area Australian Institute of Marine Science CSIRO NERP Decisions Hub University of Melbourne and Great Barrier Reef Marine Park Authority hdlhandlenet110172850
Bender E A Case T J amp Gilpin M E (1984) Perturbation experiments in community ecology Theory and practice Ecology 65(1) 1ndash13 doiorg1023071939452
Binder C R Hinkel J Bots P W G amp Pahl-Wostl C (2013) Comparison of frameworks for analyzing socialndashecological systems Ecology and Society 18(4) Article 26 doiorg 105751es-05551-180426
Bodini A (2000) Reconstructing trophic interactions as a tool for understanding and managing ecosystems Application to a shallow eutrophic lake Canadian Journal of Fisheries and Aquatic Sciences 57(10) 1999ndash2009 doiorg101139f00-153
Bodini A amp Clerici N (2016) Vegetation herbivores and fires in savanna ecosystems A network perspective Ecological Complexity 28 36ndash46 doiorg101016jecocom 201610001
Bodini A Ricci A amp Viaroli P (2000) A multimethodological approach for the sustainable management of perifluvial wetlands of the Po River (Italy) Environmental Management 26(1) 59ndash72 doiorg101007s002670010071
Bodini A Rocchi M amp Scotti M (2018) Insights into the ecology of the Black Sea through the qualitative loop analysis of the community structure Limnology and Oceanography 63(2) 968ndash984 doiorg101002lno10713
Borsuk M E Stow C A amp Reckhow K H (2004) A Bayesian network of eutrophication models for synthesis prediction and uncertainty analysis Ecological Modelling 173(2ndash3) 219ndash239 doiorg101016jecolmodel200308020
Bousquet F Anderies M Antona M Bassett T Benjaminsen T Bonato O hellip Vassal J-M (2015) Socio-ecological theories and empirical research Comparing socialndashecological schools of thoughts in action [Research report] CIRAD-GREEN halarchives-ouvertesfrhal-01130178
Carey M P Levin P S Townsend H Minello T J Sutton G R Francis T B hellip Ruckelshaus M (2014) Characterizing coastal foodwebs with qualitative links to bridge the gap between the theory and the practice of ecosystem-based management ICES Journal of Marine Science 71(3) 713ndash724 doiorg101093icesjmsfst012
Cinner J E (2011) Socialndashecological traps in reef fisheries Global Environmental Change 21(3) 835ndash839 doiorg101016jgloenvcha201104012
Human Ecology Review Volume 26 Number 2 2020
54
Costanza R amp Mageau M (1999) What is a healthy ecosystem Aquatic Ecology 33(1) 105ndash115 doiorg101023A1009930313242
Dambacher J M Brewer D T Dennis D M Macintyre M amp Foale S (2007) Qualitative modelling of gold mine impacts on Lihir Islandrsquos socioeconomic system and reef-edge fish community Environmental Science amp Technology 41(2) 555ndash562 doiorg 101021es0610333
Dambacher J M Rothlisberg P C amp Loneragan N R (2015) Qualitative mathematical models to support ecosystem‐based management of Australiarsquos Northern Prawn Fishery Ecological Applications 25(1) 278ndash298 doiorg10189013-20301
Downing A S van Nes E H Balirwa J S Beuving J J Bwathondi P O J Chapman L J hellip Mooij W M (2014) Coupled human and natural system dynamics as key to the sustainability of Lake Victoriarsquos ecosystem services Ecology and Society 19(4) Article 31 doiorg105751es-06965-190431
Espinoza-Tenorio A Wolff M Espejel I amp Montantildeo-Moctezuma G (2013) Using traditional ecological knowledge to improve holistic fisheries management Transdisciplinary modeling of a lagoon ecosystem of Southern Mexico Ecology and Society 18(2) Article 6 doiorg105751es-05369-180206
Folke C (2006) Resilience The emergence of a perspective for socialndashecological systems analyses Global Environmental Change 16(3) 253ndash267 doiorg101016jgloenvcha 200604002
Haines-Young R amp Potschin M (2010) The links between biodiversity ecosystem services and human well-being In D G Raffaelli amp C L Frid (Eds) Ecosystem ecology A new synthesis (pp 110ndash139) Cambridge University Press doiorg101017cbo978051175 0458007
Hanspach J Hartel T Milcu A I Mikulcak F Dorresteijn I Loos J hellip Fischer J (2014) A holistic approach to studying socialndashecological systems and its application to southern Transylvania Ecology and Society 19(4) Article 32 doiorg105751es-06915-190432
Hilborn R (2007) Defining success in fisheries and conflicts in objectives Marine Policy 31(2) 153ndash158 doiorg101016jmarpol200605014
Hughes T P Bellwood D R Folke C Steneck R S amp Wilson J (2005) New paradigms for supporting the resilience of marine ecosystems Trends in Ecology amp Evolution 20(7) 380ndash386 doiorg101016jtree200503022
Ibaacutentildeez A M amp Veacutelez C E (2008) Civil conflict and forced migration The micro determinants and welfare losses of displacement in Colombia World Development 36(4) 659ndash676 doiorg101016jworlddev200704013
Justus J (2006) Loop analysis and qualitative modeling Limitations and merits Biology and Philosophy 21(5) 647ndash666 doiorg101007s10539-006-9050-x
Understanding SocialndashEcological Systems using Loop Analysis
55
Kittinger J N Finkbeiner E M Ban N C Broad K Carr M H Cinner J E hellip Crowder L B (2013) Emerging frontiers in social-ecological systems research for sustainability of small-scale fisheries Current Opinion on Environmental Sustainability 5(3ndash4) 352ndash357 doiorg101016jcosust201306008
Kok K (2009) The potential of fuzzy cognitive maps for semi-quantitative scenario development with an example from Brazil Global Environmental Change 19(1) 122ndash133 doiorg101016jgloenvcha200808003
Lane D C (2008) The emergence and use of diagramming in system dynamics A critical account Systems Research and Behavioral Science 25(1) 3ndash23 doiorg101002sres826
Leslie H M Basurto X Nenadovic M Sievanen L Cavanaugh K C Cota-Nieto J J hellip Aburto-Oropeza O (2015) Operationalizing the social-ecological systems framework to assess sustainability Proceedings of the National Academy of Sciences of the USA 112(19) 5979ndash5984 doiorg101073pnas1414640112
Levin P S Fogarty M J Murawski S A amp Fluharty D (2009) Integrated ecosystem assessments Developing the scientific basis for ecosystem-based management of the ocean PLoS Biology 7(1) e1000014 doiorg101371journalpbio1000014
Levins R (1968) Evolution in changing environments Some theoretical explorations Princeton University Press
Levins R (1974) Discussion paper The qualitative analysis of partially specified systems Annals of the New York Academy of Sciences 231(1) 123ndash138 doiorg101111 j1749-66321974tb20562x
Levins R (1975) Evolution in communities near equilibrium In M L Cody and J M Diamond (Eds) Ecology and evolution of communities (pp 16ndash50) Harvard University Press
Levins R (1995) Preparing for uncertainty Ecosystem Health 1(1) 47ndash57
Levins R amp Puccia C J (1988) The controlling factor in biological communities Coenoses 3(3) 149ndash154 wwwjstororgstable43460977
Lewontin R C amp Levins R (2007) Educating the intuition to cope with complexity In R C Lewontin amp R Levins (Eds) Biology under the influence Dialectical essays on ecology agriculture and health (pp 183ndash198) Monthly Review Press
Logofet D (1993) Matrices and graphs Stability problems in mathematical ecology CRC Press
Long R D Charles A amp Stephenson R L (2015) Key principles of marine ecosystem-based management Marine Policy 57 53ndash60 doiorg101016jmarpol201501013
Lotze H K Lenihan H S Bourque B J Bradbury R H Cooke R G Kay M C hellip Jackson J B (2006) Depletion degradation and recovery potential of estuaries and coastal seas Science 312(5781) 1806ndash1809 doiorg101126science1128035
Human Ecology Review Volume 26 Number 2 2020
56
Marcot B G Holthausen R S Raphael M G Rowland M M amp Wisdom M J (2001) Using Bayesian belief networks to evaluate fish and wildlife population viability under land management alternatives from an environmental impact statement Forest Ecology and Management 153(1ndash3) 29ndash42 doiorg101016s0378-1127(01)00452-2
Martone R G Bodini A amp Micheli F (2017) Identifying potential consequences of natural perturbations and management decisions on a coastal fishery socialndashecological system using qualitative loop analysis Ecology and Society 22(1) Article 34 doiorg 105751 es-08825-220134
Melbourne-Thomas J Wotherspoon S Raymond B amp Constable A (2012) Comprehensive evaluation of model uncertainty in qualitative network analyses Ecological Monographs 82(4) 505ndash519 doiorg10189012-02071
Micheli F Saenz-Arroyo A Greenley A Vazquez L Espinoza Montes J A Rossetto M amp De Leo G A (2012) Evidence that marine reserves enhance resilience to climatic impacts PLoS ONE 7 e40832 doiorg101371journalpone0040832
Nival P amp Gorsky G (2001) Conditions for blooming of pelagic species In CIESM Workshop Monographs No 14mdashGelatinous zooplankton outbreaks Theory and practice (pp 23ndash27) Commission Internationale pour lrsquoExploration Scientifique de la Meacutediterraneacutee (CIESM [Mediterranean Science Commission])
Ostrom E (2009) A general framework for analyzing sustainability of social-ecological systems Science 325(5939) 419ndash422 doiorg101126science1172133
Oumlzesmi U amp Oumlzesmi S L (2004) Ecological models based on peoplersquos knowledge A multi-step fuzzy cognitive mapping approach Ecological Modelling 176(1ndash2) 43ndash64 doiorg101016jecolmodel200310027
Partelow S Fujitani M Soundararajan V amp Schluumlter A (2019) Transforming the social-ecological systems framework into a knowledge exchange and deliberation tool for comanagement Ecology and Society 24(1) Article 15 doiorg105751es-10724-240115
Pollino C A Woodberry O Nicholson A Korb K amp Hart B T (2007) Parameterisation and evaluation of a Bayesian network for use in an ecological risk assessment Environmental Modelling amp Software 22(8) 1140ndash1152 doiorg101016jenvsoft200603006
Puccia C J amp Levins R (1985) Qualitative modeling of complex systems An introduction to loop analysis and time averaging Harvard University Press
Raoux A Dambacher J M Pezy J P Mazeacute C Dauvin J C amp Niquil N (2018) Assessing cumulative sociondashecological impacts of offshore wind farm development in the Bay of Seine (English Channel) Marine Policy 89 11ndash20 doiorg101016jmarpol 201712007
Reum J C McDonald P S Ferriss B E Farrell D M Harvey C J amp Levin P S (2015) Qualitative network models in support of ecosystem approaches to bivalve aquaculture ICES Journal of Marine Science 72(8) 2278ndash2288 doiorg101093icesjms fsv119
Understanding SocialndashEcological Systems using Loop Analysis
57
Richardson G P (1997) Problems in causal loop diagrams revisited System Dynamics Review 13(3) 247ndash252 doiorg101002(sici)1099-1727(199723)133lt247aid-sdr 128gt 30co2-9
Stachowicz J J Fried H Osman R W amp Whitlatch R B (2002) Biodiversity invasion resistance and marine ecosystem function Reconciling pattern and process Ecology 83(9) 2575ndash2590 doiorg1018900012-9658(2002)083[2575birame]20co2
Stier A C Samhouri J F Gray S Martone R G Mach M E Halpern B S hellip Levin P S (2017) Integrating expert perceptions into food web conservation and management Conservation Letters 10(1) 67ndash76 doiorg101111conl12245
Stylios C D amp Groumpos P P (1999) A soft computing approach for modelling the supervisor of manufacturing systems Journal of Intelligent and Robotic Systems 26(3ndash4) 389ndash403 doiorg101023A1008165916707
Sweeney L B amp Sterman J (2007) Thinking about systems Student and teacher conceptions of natural and social systems System Dynamics Review 23(2ndash3) 285ndash311 doiorg101002sdr366
Tenza A Peacuterez I Martiacutenez-Fernaacutendez J amp Gimeacutenez A (2017) Understanding the decline and resilience loss of a long-lived social-ecological system Insights from system dynamics Ecology and Society 22(2) Article 15 doiorg105751es-09176-220215
Ticehurst J L Newham L T Rissik D Letcher R A amp Jakeman A J (2007) A Bayesian network approach for assessing the sustainability of coastal lakes in New South Wales Australia Environmental Modelling amp Software 22(8) 1129ndash1139 doiorg101016 jenvsoft 200603003
Worm B Barbier E B Beaumont N Duffy J E Folke C Halpern B S hellip Watson R (2006) Impacts of biodiversity loss on ocean ecosystem services Science 314(5800) 787ndash790 doiorg101126science1132294
Yasuoka J Jimba M amp Levins R (2014) Application of loop analysis for evaluation of malaria control interventions Malaria Journal 13 Article 140 doiorg1011861475-2875-13-140
This text is taken from Human Ecology Review Volume 26 Number 2 2020 published by ANU Press The Australian National University Canberra Australia
doiorg1022459HER2602202003

Understanding SocialndashEcological Systems using Loop Analysis
51
Possible developments for the application of loop analysis to SESsMaking predictions is difficult especially when we face the uncertainty associated with new unknown events changing dynamics and lack of quantitative data This is the case for example with climate change which produces completely new phenomena and dynamics In such context an adaptive management that allows for continually assessing new evidence has been called for We believe that in the new scenarios we are facing the method of loop analysis can be helpful It has the necessary adaptability to be used in changing contexts When in doubt about critical linkages and dynamic features alternative models can be developed to find out which differences matter and to reach robust conclusions It is also flexible as it allows including and discarding variables easily and above all it permits working with variables and links that are not readily measurable even though their effects are crucial However its suitability to investigate SESs can be improved in several ways The intricacy of the feedbacks can be better resolved if a specific tool for pathways analysis is developed Returning the total number of pathways and their strength between any pair of variables can show how single pathways contribute to specific effects and which ones are more important in mediating the press perturbations The question of link strength deserves attention We specified in the methodological aspects section that link strength is randomly assigned to interaction links during simulations But this does not contradict the qualitative nature of the method it only serves to assign certainty to paths and feedbacks in order to get unambiguous predictions which remain qualitative in nature as only the direction of change for the variables is predicted Pathway anatomy would help selecting those causal chains that mostly affect system dynamics Other relevant features that would improve the suitability of loop analysis for modeling SESs include (1) considering multiple simultaneous press perturbations and (2) delimiting upper and lower limits for the strength of interactions The first point is related to the fact that SESs are often exposed to different types of disturbances whose interplay gives rise to net cumulative responses that would be useful to disentangle (eg through the identification of the specific causative chains) Considering multiple press perturbations would greatly contribute to building up an effective diagnostic approach (Kittinger et al 2013) For example by loop analysis Bodini et al (2018) diagnosed that multiple press perturbations not only overfishing of small and medium pelagic species were responsible for the restructuring of the Black Sea community during the period 1960ndash1989 Moreover socioeconomic drivers amplify the impacts that are triggered by natural processes for instance both hypoxia and fisheries management affected abalone stock in the Baja California SES (Martone et al 2017) The second line of development is conceived to extend loop analysis in a semi-quantitative direction So far the simulations are performed by randomly sampling interaction strength in the uniform interval (01] There are however cases when some interactions are known
Human Ecology Review Volume 26 Number 2 2020
52
to be either strong or weak in such cases varying the strength of these linkages in the whole interval (01] does not make sense However it is difficult to translate fuzzy concepts such as strong and weak into numbers so that boundaries for the links can be set In this respect sensitivity analysis may help Either the upper (ie 1) or the lower (ie 10-6) limit of the link magnitude could be iteratively changed so that actual boundaries for certain linkages can be identified through a consistency assessment of the outcomes produced For example performing the sensitivity analysis for the strength of specific interactions might help modeling competitive advantages in the ecological domain (eg Noctiluca scintillans vs zooplankton in the Black Sea Bodini et al 2018) and power or information asymmetries between socioeconomic actors (Bousquet et al 2015) Therefore exploring alternative scenarios by constraining the strength of some interactions would be of great benefit for modeling SESs It should also be noticed that a uniform distribution is considered by default for randomly sampling the strength but it could be substituted by either normal or skewed (eg Poisson) distributions
Concluding remarksThe central issue in the study of SESs is to understand interdependencies that cross the boundaries of the classical domains in which scientific and operational knowledge have been settled Contributions in this respect are expected from tools that allow reconstructing the causal chains that give rise to such interdependencies and that involve variables or components of different nature For such reconstruction to be effective tools must overcome the barriers that make communication between domains difficult (1) the simpler the language used to describe the phenomena and the interactions the better it is (2) a lower level of technicality in the algorithms facilitates understanding the outcomes and (3) flexibility widens the range of applicability to different contexts Loop analysis shares most of these features (1) by classifying the interactions in only two categories positive and negative it facilitates creating connections between variables that differ dramatically in physical form (2) the ease by which a model can be constructed as a graph allows keeping up with rapidly changing conditions (ie variables andor links disappear and others become important) (3) the algorithm for predictions refers directly to structural features of the graph and can be visualized thus making the outcomes easier to understand and (4) it is also characterized by a wide applicability (often the question of interest is not a particular system but a whole class of systems with some similarity of structure) Furthermore loop analysis emphasizes the understanding of mechanisms which is a prime objective when an intellectual and operative framework is taking shape as in the case of SESs
Understanding SocialndashEcological Systems using Loop Analysis
53
ReferencesAnthony K R Dambacher J M Walshe T amp Beeden R (2013) A framework for
understanding cumulative impacts supporting environmental decisions and informing resilience-based management of the Great Barrier Reef World Heritage Area Australian Institute of Marine Science CSIRO NERP Decisions Hub University of Melbourne and Great Barrier Reef Marine Park Authority hdlhandlenet110172850
Bender E A Case T J amp Gilpin M E (1984) Perturbation experiments in community ecology Theory and practice Ecology 65(1) 1ndash13 doiorg1023071939452
Binder C R Hinkel J Bots P W G amp Pahl-Wostl C (2013) Comparison of frameworks for analyzing socialndashecological systems Ecology and Society 18(4) Article 26 doiorg 105751es-05551-180426
Bodini A (2000) Reconstructing trophic interactions as a tool for understanding and managing ecosystems Application to a shallow eutrophic lake Canadian Journal of Fisheries and Aquatic Sciences 57(10) 1999ndash2009 doiorg101139f00-153
Bodini A amp Clerici N (2016) Vegetation herbivores and fires in savanna ecosystems A network perspective Ecological Complexity 28 36ndash46 doiorg101016jecocom 201610001
Bodini A Ricci A amp Viaroli P (2000) A multimethodological approach for the sustainable management of perifluvial wetlands of the Po River (Italy) Environmental Management 26(1) 59ndash72 doiorg101007s002670010071
Bodini A Rocchi M amp Scotti M (2018) Insights into the ecology of the Black Sea through the qualitative loop analysis of the community structure Limnology and Oceanography 63(2) 968ndash984 doiorg101002lno10713
Borsuk M E Stow C A amp Reckhow K H (2004) A Bayesian network of eutrophication models for synthesis prediction and uncertainty analysis Ecological Modelling 173(2ndash3) 219ndash239 doiorg101016jecolmodel200308020
Bousquet F Anderies M Antona M Bassett T Benjaminsen T Bonato O hellip Vassal J-M (2015) Socio-ecological theories and empirical research Comparing socialndashecological schools of thoughts in action [Research report] CIRAD-GREEN halarchives-ouvertesfrhal-01130178
Carey M P Levin P S Townsend H Minello T J Sutton G R Francis T B hellip Ruckelshaus M (2014) Characterizing coastal foodwebs with qualitative links to bridge the gap between the theory and the practice of ecosystem-based management ICES Journal of Marine Science 71(3) 713ndash724 doiorg101093icesjmsfst012
Cinner J E (2011) Socialndashecological traps in reef fisheries Global Environmental Change 21(3) 835ndash839 doiorg101016jgloenvcha201104012
Human Ecology Review Volume 26 Number 2 2020
54
Costanza R amp Mageau M (1999) What is a healthy ecosystem Aquatic Ecology 33(1) 105ndash115 doiorg101023A1009930313242
Dambacher J M Brewer D T Dennis D M Macintyre M amp Foale S (2007) Qualitative modelling of gold mine impacts on Lihir Islandrsquos socioeconomic system and reef-edge fish community Environmental Science amp Technology 41(2) 555ndash562 doiorg 101021es0610333
Dambacher J M Rothlisberg P C amp Loneragan N R (2015) Qualitative mathematical models to support ecosystem‐based management of Australiarsquos Northern Prawn Fishery Ecological Applications 25(1) 278ndash298 doiorg10189013-20301
Downing A S van Nes E H Balirwa J S Beuving J J Bwathondi P O J Chapman L J hellip Mooij W M (2014) Coupled human and natural system dynamics as key to the sustainability of Lake Victoriarsquos ecosystem services Ecology and Society 19(4) Article 31 doiorg105751es-06965-190431
Espinoza-Tenorio A Wolff M Espejel I amp Montantildeo-Moctezuma G (2013) Using traditional ecological knowledge to improve holistic fisheries management Transdisciplinary modeling of a lagoon ecosystem of Southern Mexico Ecology and Society 18(2) Article 6 doiorg105751es-05369-180206
Folke C (2006) Resilience The emergence of a perspective for socialndashecological systems analyses Global Environmental Change 16(3) 253ndash267 doiorg101016jgloenvcha 200604002
Haines-Young R amp Potschin M (2010) The links between biodiversity ecosystem services and human well-being In D G Raffaelli amp C L Frid (Eds) Ecosystem ecology A new synthesis (pp 110ndash139) Cambridge University Press doiorg101017cbo978051175 0458007
Hanspach J Hartel T Milcu A I Mikulcak F Dorresteijn I Loos J hellip Fischer J (2014) A holistic approach to studying socialndashecological systems and its application to southern Transylvania Ecology and Society 19(4) Article 32 doiorg105751es-06915-190432
Hilborn R (2007) Defining success in fisheries and conflicts in objectives Marine Policy 31(2) 153ndash158 doiorg101016jmarpol200605014
Hughes T P Bellwood D R Folke C Steneck R S amp Wilson J (2005) New paradigms for supporting the resilience of marine ecosystems Trends in Ecology amp Evolution 20(7) 380ndash386 doiorg101016jtree200503022
Ibaacutentildeez A M amp Veacutelez C E (2008) Civil conflict and forced migration The micro determinants and welfare losses of displacement in Colombia World Development 36(4) 659ndash676 doiorg101016jworlddev200704013
Justus J (2006) Loop analysis and qualitative modeling Limitations and merits Biology and Philosophy 21(5) 647ndash666 doiorg101007s10539-006-9050-x
Understanding SocialndashEcological Systems using Loop Analysis
55
Kittinger J N Finkbeiner E M Ban N C Broad K Carr M H Cinner J E hellip Crowder L B (2013) Emerging frontiers in social-ecological systems research for sustainability of small-scale fisheries Current Opinion on Environmental Sustainability 5(3ndash4) 352ndash357 doiorg101016jcosust201306008
Kok K (2009) The potential of fuzzy cognitive maps for semi-quantitative scenario development with an example from Brazil Global Environmental Change 19(1) 122ndash133 doiorg101016jgloenvcha200808003
Lane D C (2008) The emergence and use of diagramming in system dynamics A critical account Systems Research and Behavioral Science 25(1) 3ndash23 doiorg101002sres826
Leslie H M Basurto X Nenadovic M Sievanen L Cavanaugh K C Cota-Nieto J J hellip Aburto-Oropeza O (2015) Operationalizing the social-ecological systems framework to assess sustainability Proceedings of the National Academy of Sciences of the USA 112(19) 5979ndash5984 doiorg101073pnas1414640112
Levin P S Fogarty M J Murawski S A amp Fluharty D (2009) Integrated ecosystem assessments Developing the scientific basis for ecosystem-based management of the ocean PLoS Biology 7(1) e1000014 doiorg101371journalpbio1000014
Levins R (1968) Evolution in changing environments Some theoretical explorations Princeton University Press
Levins R (1974) Discussion paper The qualitative analysis of partially specified systems Annals of the New York Academy of Sciences 231(1) 123ndash138 doiorg101111 j1749-66321974tb20562x
Levins R (1975) Evolution in communities near equilibrium In M L Cody and J M Diamond (Eds) Ecology and evolution of communities (pp 16ndash50) Harvard University Press
Levins R (1995) Preparing for uncertainty Ecosystem Health 1(1) 47ndash57
Levins R amp Puccia C J (1988) The controlling factor in biological communities Coenoses 3(3) 149ndash154 wwwjstororgstable43460977
Lewontin R C amp Levins R (2007) Educating the intuition to cope with complexity In R C Lewontin amp R Levins (Eds) Biology under the influence Dialectical essays on ecology agriculture and health (pp 183ndash198) Monthly Review Press
Logofet D (1993) Matrices and graphs Stability problems in mathematical ecology CRC Press
Long R D Charles A amp Stephenson R L (2015) Key principles of marine ecosystem-based management Marine Policy 57 53ndash60 doiorg101016jmarpol201501013
Lotze H K Lenihan H S Bourque B J Bradbury R H Cooke R G Kay M C hellip Jackson J B (2006) Depletion degradation and recovery potential of estuaries and coastal seas Science 312(5781) 1806ndash1809 doiorg101126science1128035
Human Ecology Review Volume 26 Number 2 2020
56
Marcot B G Holthausen R S Raphael M G Rowland M M amp Wisdom M J (2001) Using Bayesian belief networks to evaluate fish and wildlife population viability under land management alternatives from an environmental impact statement Forest Ecology and Management 153(1ndash3) 29ndash42 doiorg101016s0378-1127(01)00452-2
Martone R G Bodini A amp Micheli F (2017) Identifying potential consequences of natural perturbations and management decisions on a coastal fishery socialndashecological system using qualitative loop analysis Ecology and Society 22(1) Article 34 doiorg 105751 es-08825-220134
Melbourne-Thomas J Wotherspoon S Raymond B amp Constable A (2012) Comprehensive evaluation of model uncertainty in qualitative network analyses Ecological Monographs 82(4) 505ndash519 doiorg10189012-02071
Micheli F Saenz-Arroyo A Greenley A Vazquez L Espinoza Montes J A Rossetto M amp De Leo G A (2012) Evidence that marine reserves enhance resilience to climatic impacts PLoS ONE 7 e40832 doiorg101371journalpone0040832
Nival P amp Gorsky G (2001) Conditions for blooming of pelagic species In CIESM Workshop Monographs No 14mdashGelatinous zooplankton outbreaks Theory and practice (pp 23ndash27) Commission Internationale pour lrsquoExploration Scientifique de la Meacutediterraneacutee (CIESM [Mediterranean Science Commission])
Ostrom E (2009) A general framework for analyzing sustainability of social-ecological systems Science 325(5939) 419ndash422 doiorg101126science1172133
Oumlzesmi U amp Oumlzesmi S L (2004) Ecological models based on peoplersquos knowledge A multi-step fuzzy cognitive mapping approach Ecological Modelling 176(1ndash2) 43ndash64 doiorg101016jecolmodel200310027
Partelow S Fujitani M Soundararajan V amp Schluumlter A (2019) Transforming the social-ecological systems framework into a knowledge exchange and deliberation tool for comanagement Ecology and Society 24(1) Article 15 doiorg105751es-10724-240115
Pollino C A Woodberry O Nicholson A Korb K amp Hart B T (2007) Parameterisation and evaluation of a Bayesian network for use in an ecological risk assessment Environmental Modelling amp Software 22(8) 1140ndash1152 doiorg101016jenvsoft200603006
Puccia C J amp Levins R (1985) Qualitative modeling of complex systems An introduction to loop analysis and time averaging Harvard University Press
Raoux A Dambacher J M Pezy J P Mazeacute C Dauvin J C amp Niquil N (2018) Assessing cumulative sociondashecological impacts of offshore wind farm development in the Bay of Seine (English Channel) Marine Policy 89 11ndash20 doiorg101016jmarpol 201712007
Reum J C McDonald P S Ferriss B E Farrell D M Harvey C J amp Levin P S (2015) Qualitative network models in support of ecosystem approaches to bivalve aquaculture ICES Journal of Marine Science 72(8) 2278ndash2288 doiorg101093icesjms fsv119
Understanding SocialndashEcological Systems using Loop Analysis
57
Richardson G P (1997) Problems in causal loop diagrams revisited System Dynamics Review 13(3) 247ndash252 doiorg101002(sici)1099-1727(199723)133lt247aid-sdr 128gt 30co2-9
Stachowicz J J Fried H Osman R W amp Whitlatch R B (2002) Biodiversity invasion resistance and marine ecosystem function Reconciling pattern and process Ecology 83(9) 2575ndash2590 doiorg1018900012-9658(2002)083[2575birame]20co2
Stier A C Samhouri J F Gray S Martone R G Mach M E Halpern B S hellip Levin P S (2017) Integrating expert perceptions into food web conservation and management Conservation Letters 10(1) 67ndash76 doiorg101111conl12245
Stylios C D amp Groumpos P P (1999) A soft computing approach for modelling the supervisor of manufacturing systems Journal of Intelligent and Robotic Systems 26(3ndash4) 389ndash403 doiorg101023A1008165916707
Sweeney L B amp Sterman J (2007) Thinking about systems Student and teacher conceptions of natural and social systems System Dynamics Review 23(2ndash3) 285ndash311 doiorg101002sdr366
Tenza A Peacuterez I Martiacutenez-Fernaacutendez J amp Gimeacutenez A (2017) Understanding the decline and resilience loss of a long-lived social-ecological system Insights from system dynamics Ecology and Society 22(2) Article 15 doiorg105751es-09176-220215
Ticehurst J L Newham L T Rissik D Letcher R A amp Jakeman A J (2007) A Bayesian network approach for assessing the sustainability of coastal lakes in New South Wales Australia Environmental Modelling amp Software 22(8) 1129ndash1139 doiorg101016 jenvsoft 200603003
Worm B Barbier E B Beaumont N Duffy J E Folke C Halpern B S hellip Watson R (2006) Impacts of biodiversity loss on ocean ecosystem services Science 314(5800) 787ndash790 doiorg101126science1132294
Yasuoka J Jimba M amp Levins R (2014) Application of loop analysis for evaluation of malaria control interventions Malaria Journal 13 Article 140 doiorg1011861475-2875-13-140
This text is taken from Human Ecology Review Volume 26 Number 2 2020 published by ANU Press The Australian National University Canberra Australia
doiorg1022459HER2602202003

Human Ecology Review Volume 26 Number 2 2020
52
to be either strong or weak in such cases varying the strength of these linkages in the whole interval (01] does not make sense However it is difficult to translate fuzzy concepts such as strong and weak into numbers so that boundaries for the links can be set In this respect sensitivity analysis may help Either the upper (ie 1) or the lower (ie 10-6) limit of the link magnitude could be iteratively changed so that actual boundaries for certain linkages can be identified through a consistency assessment of the outcomes produced For example performing the sensitivity analysis for the strength of specific interactions might help modeling competitive advantages in the ecological domain (eg Noctiluca scintillans vs zooplankton in the Black Sea Bodini et al 2018) and power or information asymmetries between socioeconomic actors (Bousquet et al 2015) Therefore exploring alternative scenarios by constraining the strength of some interactions would be of great benefit for modeling SESs It should also be noticed that a uniform distribution is considered by default for randomly sampling the strength but it could be substituted by either normal or skewed (eg Poisson) distributions
Concluding remarksThe central issue in the study of SESs is to understand interdependencies that cross the boundaries of the classical domains in which scientific and operational knowledge have been settled Contributions in this respect are expected from tools that allow reconstructing the causal chains that give rise to such interdependencies and that involve variables or components of different nature For such reconstruction to be effective tools must overcome the barriers that make communication between domains difficult (1) the simpler the language used to describe the phenomena and the interactions the better it is (2) a lower level of technicality in the algorithms facilitates understanding the outcomes and (3) flexibility widens the range of applicability to different contexts Loop analysis shares most of these features (1) by classifying the interactions in only two categories positive and negative it facilitates creating connections between variables that differ dramatically in physical form (2) the ease by which a model can be constructed as a graph allows keeping up with rapidly changing conditions (ie variables andor links disappear and others become important) (3) the algorithm for predictions refers directly to structural features of the graph and can be visualized thus making the outcomes easier to understand and (4) it is also characterized by a wide applicability (often the question of interest is not a particular system but a whole class of systems with some similarity of structure) Furthermore loop analysis emphasizes the understanding of mechanisms which is a prime objective when an intellectual and operative framework is taking shape as in the case of SESs
Understanding SocialndashEcological Systems using Loop Analysis
53
ReferencesAnthony K R Dambacher J M Walshe T amp Beeden R (2013) A framework for
understanding cumulative impacts supporting environmental decisions and informing resilience-based management of the Great Barrier Reef World Heritage Area Australian Institute of Marine Science CSIRO NERP Decisions Hub University of Melbourne and Great Barrier Reef Marine Park Authority hdlhandlenet110172850
Bender E A Case T J amp Gilpin M E (1984) Perturbation experiments in community ecology Theory and practice Ecology 65(1) 1ndash13 doiorg1023071939452
Binder C R Hinkel J Bots P W G amp Pahl-Wostl C (2013) Comparison of frameworks for analyzing socialndashecological systems Ecology and Society 18(4) Article 26 doiorg 105751es-05551-180426
Bodini A (2000) Reconstructing trophic interactions as a tool for understanding and managing ecosystems Application to a shallow eutrophic lake Canadian Journal of Fisheries and Aquatic Sciences 57(10) 1999ndash2009 doiorg101139f00-153
Bodini A amp Clerici N (2016) Vegetation herbivores and fires in savanna ecosystems A network perspective Ecological Complexity 28 36ndash46 doiorg101016jecocom 201610001
Bodini A Ricci A amp Viaroli P (2000) A multimethodological approach for the sustainable management of perifluvial wetlands of the Po River (Italy) Environmental Management 26(1) 59ndash72 doiorg101007s002670010071
Bodini A Rocchi M amp Scotti M (2018) Insights into the ecology of the Black Sea through the qualitative loop analysis of the community structure Limnology and Oceanography 63(2) 968ndash984 doiorg101002lno10713
Borsuk M E Stow C A amp Reckhow K H (2004) A Bayesian network of eutrophication models for synthesis prediction and uncertainty analysis Ecological Modelling 173(2ndash3) 219ndash239 doiorg101016jecolmodel200308020
Bousquet F Anderies M Antona M Bassett T Benjaminsen T Bonato O hellip Vassal J-M (2015) Socio-ecological theories and empirical research Comparing socialndashecological schools of thoughts in action [Research report] CIRAD-GREEN halarchives-ouvertesfrhal-01130178
Carey M P Levin P S Townsend H Minello T J Sutton G R Francis T B hellip Ruckelshaus M (2014) Characterizing coastal foodwebs with qualitative links to bridge the gap between the theory and the practice of ecosystem-based management ICES Journal of Marine Science 71(3) 713ndash724 doiorg101093icesjmsfst012
Cinner J E (2011) Socialndashecological traps in reef fisheries Global Environmental Change 21(3) 835ndash839 doiorg101016jgloenvcha201104012
Human Ecology Review Volume 26 Number 2 2020
54
Costanza R amp Mageau M (1999) What is a healthy ecosystem Aquatic Ecology 33(1) 105ndash115 doiorg101023A1009930313242
Dambacher J M Brewer D T Dennis D M Macintyre M amp Foale S (2007) Qualitative modelling of gold mine impacts on Lihir Islandrsquos socioeconomic system and reef-edge fish community Environmental Science amp Technology 41(2) 555ndash562 doiorg 101021es0610333
Dambacher J M Rothlisberg P C amp Loneragan N R (2015) Qualitative mathematical models to support ecosystem‐based management of Australiarsquos Northern Prawn Fishery Ecological Applications 25(1) 278ndash298 doiorg10189013-20301
Downing A S van Nes E H Balirwa J S Beuving J J Bwathondi P O J Chapman L J hellip Mooij W M (2014) Coupled human and natural system dynamics as key to the sustainability of Lake Victoriarsquos ecosystem services Ecology and Society 19(4) Article 31 doiorg105751es-06965-190431
Espinoza-Tenorio A Wolff M Espejel I amp Montantildeo-Moctezuma G (2013) Using traditional ecological knowledge to improve holistic fisheries management Transdisciplinary modeling of a lagoon ecosystem of Southern Mexico Ecology and Society 18(2) Article 6 doiorg105751es-05369-180206
Folke C (2006) Resilience The emergence of a perspective for socialndashecological systems analyses Global Environmental Change 16(3) 253ndash267 doiorg101016jgloenvcha 200604002
Haines-Young R amp Potschin M (2010) The links between biodiversity ecosystem services and human well-being In D G Raffaelli amp C L Frid (Eds) Ecosystem ecology A new synthesis (pp 110ndash139) Cambridge University Press doiorg101017cbo978051175 0458007
Hanspach J Hartel T Milcu A I Mikulcak F Dorresteijn I Loos J hellip Fischer J (2014) A holistic approach to studying socialndashecological systems and its application to southern Transylvania Ecology and Society 19(4) Article 32 doiorg105751es-06915-190432
Hilborn R (2007) Defining success in fisheries and conflicts in objectives Marine Policy 31(2) 153ndash158 doiorg101016jmarpol200605014
Hughes T P Bellwood D R Folke C Steneck R S amp Wilson J (2005) New paradigms for supporting the resilience of marine ecosystems Trends in Ecology amp Evolution 20(7) 380ndash386 doiorg101016jtree200503022
Ibaacutentildeez A M amp Veacutelez C E (2008) Civil conflict and forced migration The micro determinants and welfare losses of displacement in Colombia World Development 36(4) 659ndash676 doiorg101016jworlddev200704013
Justus J (2006) Loop analysis and qualitative modeling Limitations and merits Biology and Philosophy 21(5) 647ndash666 doiorg101007s10539-006-9050-x
Understanding SocialndashEcological Systems using Loop Analysis
55
Kittinger J N Finkbeiner E M Ban N C Broad K Carr M H Cinner J E hellip Crowder L B (2013) Emerging frontiers in social-ecological systems research for sustainability of small-scale fisheries Current Opinion on Environmental Sustainability 5(3ndash4) 352ndash357 doiorg101016jcosust201306008
Kok K (2009) The potential of fuzzy cognitive maps for semi-quantitative scenario development with an example from Brazil Global Environmental Change 19(1) 122ndash133 doiorg101016jgloenvcha200808003
Lane D C (2008) The emergence and use of diagramming in system dynamics A critical account Systems Research and Behavioral Science 25(1) 3ndash23 doiorg101002sres826
Leslie H M Basurto X Nenadovic M Sievanen L Cavanaugh K C Cota-Nieto J J hellip Aburto-Oropeza O (2015) Operationalizing the social-ecological systems framework to assess sustainability Proceedings of the National Academy of Sciences of the USA 112(19) 5979ndash5984 doiorg101073pnas1414640112
Levin P S Fogarty M J Murawski S A amp Fluharty D (2009) Integrated ecosystem assessments Developing the scientific basis for ecosystem-based management of the ocean PLoS Biology 7(1) e1000014 doiorg101371journalpbio1000014
Levins R (1968) Evolution in changing environments Some theoretical explorations Princeton University Press
Levins R (1974) Discussion paper The qualitative analysis of partially specified systems Annals of the New York Academy of Sciences 231(1) 123ndash138 doiorg101111 j1749-66321974tb20562x
Levins R (1975) Evolution in communities near equilibrium In M L Cody and J M Diamond (Eds) Ecology and evolution of communities (pp 16ndash50) Harvard University Press
Levins R (1995) Preparing for uncertainty Ecosystem Health 1(1) 47ndash57
Levins R amp Puccia C J (1988) The controlling factor in biological communities Coenoses 3(3) 149ndash154 wwwjstororgstable43460977
Lewontin R C amp Levins R (2007) Educating the intuition to cope with complexity In R C Lewontin amp R Levins (Eds) Biology under the influence Dialectical essays on ecology agriculture and health (pp 183ndash198) Monthly Review Press
Logofet D (1993) Matrices and graphs Stability problems in mathematical ecology CRC Press
Long R D Charles A amp Stephenson R L (2015) Key principles of marine ecosystem-based management Marine Policy 57 53ndash60 doiorg101016jmarpol201501013
Lotze H K Lenihan H S Bourque B J Bradbury R H Cooke R G Kay M C hellip Jackson J B (2006) Depletion degradation and recovery potential of estuaries and coastal seas Science 312(5781) 1806ndash1809 doiorg101126science1128035
Human Ecology Review Volume 26 Number 2 2020
56
Marcot B G Holthausen R S Raphael M G Rowland M M amp Wisdom M J (2001) Using Bayesian belief networks to evaluate fish and wildlife population viability under land management alternatives from an environmental impact statement Forest Ecology and Management 153(1ndash3) 29ndash42 doiorg101016s0378-1127(01)00452-2
Martone R G Bodini A amp Micheli F (2017) Identifying potential consequences of natural perturbations and management decisions on a coastal fishery socialndashecological system using qualitative loop analysis Ecology and Society 22(1) Article 34 doiorg 105751 es-08825-220134
Melbourne-Thomas J Wotherspoon S Raymond B amp Constable A (2012) Comprehensive evaluation of model uncertainty in qualitative network analyses Ecological Monographs 82(4) 505ndash519 doiorg10189012-02071
Micheli F Saenz-Arroyo A Greenley A Vazquez L Espinoza Montes J A Rossetto M amp De Leo G A (2012) Evidence that marine reserves enhance resilience to climatic impacts PLoS ONE 7 e40832 doiorg101371journalpone0040832
Nival P amp Gorsky G (2001) Conditions for blooming of pelagic species In CIESM Workshop Monographs No 14mdashGelatinous zooplankton outbreaks Theory and practice (pp 23ndash27) Commission Internationale pour lrsquoExploration Scientifique de la Meacutediterraneacutee (CIESM [Mediterranean Science Commission])
Ostrom E (2009) A general framework for analyzing sustainability of social-ecological systems Science 325(5939) 419ndash422 doiorg101126science1172133
Oumlzesmi U amp Oumlzesmi S L (2004) Ecological models based on peoplersquos knowledge A multi-step fuzzy cognitive mapping approach Ecological Modelling 176(1ndash2) 43ndash64 doiorg101016jecolmodel200310027
Partelow S Fujitani M Soundararajan V amp Schluumlter A (2019) Transforming the social-ecological systems framework into a knowledge exchange and deliberation tool for comanagement Ecology and Society 24(1) Article 15 doiorg105751es-10724-240115
Pollino C A Woodberry O Nicholson A Korb K amp Hart B T (2007) Parameterisation and evaluation of a Bayesian network for use in an ecological risk assessment Environmental Modelling amp Software 22(8) 1140ndash1152 doiorg101016jenvsoft200603006
Puccia C J amp Levins R (1985) Qualitative modeling of complex systems An introduction to loop analysis and time averaging Harvard University Press
Raoux A Dambacher J M Pezy J P Mazeacute C Dauvin J C amp Niquil N (2018) Assessing cumulative sociondashecological impacts of offshore wind farm development in the Bay of Seine (English Channel) Marine Policy 89 11ndash20 doiorg101016jmarpol 201712007
Reum J C McDonald P S Ferriss B E Farrell D M Harvey C J amp Levin P S (2015) Qualitative network models in support of ecosystem approaches to bivalve aquaculture ICES Journal of Marine Science 72(8) 2278ndash2288 doiorg101093icesjms fsv119
Understanding SocialndashEcological Systems using Loop Analysis
57
Richardson G P (1997) Problems in causal loop diagrams revisited System Dynamics Review 13(3) 247ndash252 doiorg101002(sici)1099-1727(199723)133lt247aid-sdr 128gt 30co2-9
Stachowicz J J Fried H Osman R W amp Whitlatch R B (2002) Biodiversity invasion resistance and marine ecosystem function Reconciling pattern and process Ecology 83(9) 2575ndash2590 doiorg1018900012-9658(2002)083[2575birame]20co2
Stier A C Samhouri J F Gray S Martone R G Mach M E Halpern B S hellip Levin P S (2017) Integrating expert perceptions into food web conservation and management Conservation Letters 10(1) 67ndash76 doiorg101111conl12245
Stylios C D amp Groumpos P P (1999) A soft computing approach for modelling the supervisor of manufacturing systems Journal of Intelligent and Robotic Systems 26(3ndash4) 389ndash403 doiorg101023A1008165916707
Sweeney L B amp Sterman J (2007) Thinking about systems Student and teacher conceptions of natural and social systems System Dynamics Review 23(2ndash3) 285ndash311 doiorg101002sdr366
Tenza A Peacuterez I Martiacutenez-Fernaacutendez J amp Gimeacutenez A (2017) Understanding the decline and resilience loss of a long-lived social-ecological system Insights from system dynamics Ecology and Society 22(2) Article 15 doiorg105751es-09176-220215
Ticehurst J L Newham L T Rissik D Letcher R A amp Jakeman A J (2007) A Bayesian network approach for assessing the sustainability of coastal lakes in New South Wales Australia Environmental Modelling amp Software 22(8) 1129ndash1139 doiorg101016 jenvsoft 200603003
Worm B Barbier E B Beaumont N Duffy J E Folke C Halpern B S hellip Watson R (2006) Impacts of biodiversity loss on ocean ecosystem services Science 314(5800) 787ndash790 doiorg101126science1132294
Yasuoka J Jimba M amp Levins R (2014) Application of loop analysis for evaluation of malaria control interventions Malaria Journal 13 Article 140 doiorg1011861475-2875-13-140
This text is taken from Human Ecology Review Volume 26 Number 2 2020 published by ANU Press The Australian National University Canberra Australia
doiorg1022459HER2602202003

Understanding SocialndashEcological Systems using Loop Analysis
53
ReferencesAnthony K R Dambacher J M Walshe T amp Beeden R (2013) A framework for
understanding cumulative impacts supporting environmental decisions and informing resilience-based management of the Great Barrier Reef World Heritage Area Australian Institute of Marine Science CSIRO NERP Decisions Hub University of Melbourne and Great Barrier Reef Marine Park Authority hdlhandlenet110172850
Bender E A Case T J amp Gilpin M E (1984) Perturbation experiments in community ecology Theory and practice Ecology 65(1) 1ndash13 doiorg1023071939452
Binder C R Hinkel J Bots P W G amp Pahl-Wostl C (2013) Comparison of frameworks for analyzing socialndashecological systems Ecology and Society 18(4) Article 26 doiorg 105751es-05551-180426
Bodini A (2000) Reconstructing trophic interactions as a tool for understanding and managing ecosystems Application to a shallow eutrophic lake Canadian Journal of Fisheries and Aquatic Sciences 57(10) 1999ndash2009 doiorg101139f00-153
Bodini A amp Clerici N (2016) Vegetation herbivores and fires in savanna ecosystems A network perspective Ecological Complexity 28 36ndash46 doiorg101016jecocom 201610001
Bodini A Ricci A amp Viaroli P (2000) A multimethodological approach for the sustainable management of perifluvial wetlands of the Po River (Italy) Environmental Management 26(1) 59ndash72 doiorg101007s002670010071
Bodini A Rocchi M amp Scotti M (2018) Insights into the ecology of the Black Sea through the qualitative loop analysis of the community structure Limnology and Oceanography 63(2) 968ndash984 doiorg101002lno10713
Borsuk M E Stow C A amp Reckhow K H (2004) A Bayesian network of eutrophication models for synthesis prediction and uncertainty analysis Ecological Modelling 173(2ndash3) 219ndash239 doiorg101016jecolmodel200308020
Bousquet F Anderies M Antona M Bassett T Benjaminsen T Bonato O hellip Vassal J-M (2015) Socio-ecological theories and empirical research Comparing socialndashecological schools of thoughts in action [Research report] CIRAD-GREEN halarchives-ouvertesfrhal-01130178
Carey M P Levin P S Townsend H Minello T J Sutton G R Francis T B hellip Ruckelshaus M (2014) Characterizing coastal foodwebs with qualitative links to bridge the gap between the theory and the practice of ecosystem-based management ICES Journal of Marine Science 71(3) 713ndash724 doiorg101093icesjmsfst012
Cinner J E (2011) Socialndashecological traps in reef fisheries Global Environmental Change 21(3) 835ndash839 doiorg101016jgloenvcha201104012
Human Ecology Review Volume 26 Number 2 2020
54
Costanza R amp Mageau M (1999) What is a healthy ecosystem Aquatic Ecology 33(1) 105ndash115 doiorg101023A1009930313242
Dambacher J M Brewer D T Dennis D M Macintyre M amp Foale S (2007) Qualitative modelling of gold mine impacts on Lihir Islandrsquos socioeconomic system and reef-edge fish community Environmental Science amp Technology 41(2) 555ndash562 doiorg 101021es0610333
Dambacher J M Rothlisberg P C amp Loneragan N R (2015) Qualitative mathematical models to support ecosystem‐based management of Australiarsquos Northern Prawn Fishery Ecological Applications 25(1) 278ndash298 doiorg10189013-20301
Downing A S van Nes E H Balirwa J S Beuving J J Bwathondi P O J Chapman L J hellip Mooij W M (2014) Coupled human and natural system dynamics as key to the sustainability of Lake Victoriarsquos ecosystem services Ecology and Society 19(4) Article 31 doiorg105751es-06965-190431
Espinoza-Tenorio A Wolff M Espejel I amp Montantildeo-Moctezuma G (2013) Using traditional ecological knowledge to improve holistic fisheries management Transdisciplinary modeling of a lagoon ecosystem of Southern Mexico Ecology and Society 18(2) Article 6 doiorg105751es-05369-180206
Folke C (2006) Resilience The emergence of a perspective for socialndashecological systems analyses Global Environmental Change 16(3) 253ndash267 doiorg101016jgloenvcha 200604002
Haines-Young R amp Potschin M (2010) The links between biodiversity ecosystem services and human well-being In D G Raffaelli amp C L Frid (Eds) Ecosystem ecology A new synthesis (pp 110ndash139) Cambridge University Press doiorg101017cbo978051175 0458007
Hanspach J Hartel T Milcu A I Mikulcak F Dorresteijn I Loos J hellip Fischer J (2014) A holistic approach to studying socialndashecological systems and its application to southern Transylvania Ecology and Society 19(4) Article 32 doiorg105751es-06915-190432
Hilborn R (2007) Defining success in fisheries and conflicts in objectives Marine Policy 31(2) 153ndash158 doiorg101016jmarpol200605014
Hughes T P Bellwood D R Folke C Steneck R S amp Wilson J (2005) New paradigms for supporting the resilience of marine ecosystems Trends in Ecology amp Evolution 20(7) 380ndash386 doiorg101016jtree200503022
Ibaacutentildeez A M amp Veacutelez C E (2008) Civil conflict and forced migration The micro determinants and welfare losses of displacement in Colombia World Development 36(4) 659ndash676 doiorg101016jworlddev200704013
Justus J (2006) Loop analysis and qualitative modeling Limitations and merits Biology and Philosophy 21(5) 647ndash666 doiorg101007s10539-006-9050-x
Understanding SocialndashEcological Systems using Loop Analysis
55
Kittinger J N Finkbeiner E M Ban N C Broad K Carr M H Cinner J E hellip Crowder L B (2013) Emerging frontiers in social-ecological systems research for sustainability of small-scale fisheries Current Opinion on Environmental Sustainability 5(3ndash4) 352ndash357 doiorg101016jcosust201306008
Kok K (2009) The potential of fuzzy cognitive maps for semi-quantitative scenario development with an example from Brazil Global Environmental Change 19(1) 122ndash133 doiorg101016jgloenvcha200808003
Lane D C (2008) The emergence and use of diagramming in system dynamics A critical account Systems Research and Behavioral Science 25(1) 3ndash23 doiorg101002sres826
Leslie H M Basurto X Nenadovic M Sievanen L Cavanaugh K C Cota-Nieto J J hellip Aburto-Oropeza O (2015) Operationalizing the social-ecological systems framework to assess sustainability Proceedings of the National Academy of Sciences of the USA 112(19) 5979ndash5984 doiorg101073pnas1414640112
Levin P S Fogarty M J Murawski S A amp Fluharty D (2009) Integrated ecosystem assessments Developing the scientific basis for ecosystem-based management of the ocean PLoS Biology 7(1) e1000014 doiorg101371journalpbio1000014
Levins R (1968) Evolution in changing environments Some theoretical explorations Princeton University Press
Levins R (1974) Discussion paper The qualitative analysis of partially specified systems Annals of the New York Academy of Sciences 231(1) 123ndash138 doiorg101111 j1749-66321974tb20562x
Levins R (1975) Evolution in communities near equilibrium In M L Cody and J M Diamond (Eds) Ecology and evolution of communities (pp 16ndash50) Harvard University Press
Levins R (1995) Preparing for uncertainty Ecosystem Health 1(1) 47ndash57
Levins R amp Puccia C J (1988) The controlling factor in biological communities Coenoses 3(3) 149ndash154 wwwjstororgstable43460977
Lewontin R C amp Levins R (2007) Educating the intuition to cope with complexity In R C Lewontin amp R Levins (Eds) Biology under the influence Dialectical essays on ecology agriculture and health (pp 183ndash198) Monthly Review Press
Logofet D (1993) Matrices and graphs Stability problems in mathematical ecology CRC Press
Long R D Charles A amp Stephenson R L (2015) Key principles of marine ecosystem-based management Marine Policy 57 53ndash60 doiorg101016jmarpol201501013
Lotze H K Lenihan H S Bourque B J Bradbury R H Cooke R G Kay M C hellip Jackson J B (2006) Depletion degradation and recovery potential of estuaries and coastal seas Science 312(5781) 1806ndash1809 doiorg101126science1128035
Human Ecology Review Volume 26 Number 2 2020
56
Marcot B G Holthausen R S Raphael M G Rowland M M amp Wisdom M J (2001) Using Bayesian belief networks to evaluate fish and wildlife population viability under land management alternatives from an environmental impact statement Forest Ecology and Management 153(1ndash3) 29ndash42 doiorg101016s0378-1127(01)00452-2
Martone R G Bodini A amp Micheli F (2017) Identifying potential consequences of natural perturbations and management decisions on a coastal fishery socialndashecological system using qualitative loop analysis Ecology and Society 22(1) Article 34 doiorg 105751 es-08825-220134
Melbourne-Thomas J Wotherspoon S Raymond B amp Constable A (2012) Comprehensive evaluation of model uncertainty in qualitative network analyses Ecological Monographs 82(4) 505ndash519 doiorg10189012-02071
Micheli F Saenz-Arroyo A Greenley A Vazquez L Espinoza Montes J A Rossetto M amp De Leo G A (2012) Evidence that marine reserves enhance resilience to climatic impacts PLoS ONE 7 e40832 doiorg101371journalpone0040832
Nival P amp Gorsky G (2001) Conditions for blooming of pelagic species In CIESM Workshop Monographs No 14mdashGelatinous zooplankton outbreaks Theory and practice (pp 23ndash27) Commission Internationale pour lrsquoExploration Scientifique de la Meacutediterraneacutee (CIESM [Mediterranean Science Commission])
Ostrom E (2009) A general framework for analyzing sustainability of social-ecological systems Science 325(5939) 419ndash422 doiorg101126science1172133
Oumlzesmi U amp Oumlzesmi S L (2004) Ecological models based on peoplersquos knowledge A multi-step fuzzy cognitive mapping approach Ecological Modelling 176(1ndash2) 43ndash64 doiorg101016jecolmodel200310027
Partelow S Fujitani M Soundararajan V amp Schluumlter A (2019) Transforming the social-ecological systems framework into a knowledge exchange and deliberation tool for comanagement Ecology and Society 24(1) Article 15 doiorg105751es-10724-240115
Pollino C A Woodberry O Nicholson A Korb K amp Hart B T (2007) Parameterisation and evaluation of a Bayesian network for use in an ecological risk assessment Environmental Modelling amp Software 22(8) 1140ndash1152 doiorg101016jenvsoft200603006
Puccia C J amp Levins R (1985) Qualitative modeling of complex systems An introduction to loop analysis and time averaging Harvard University Press
Raoux A Dambacher J M Pezy J P Mazeacute C Dauvin J C amp Niquil N (2018) Assessing cumulative sociondashecological impacts of offshore wind farm development in the Bay of Seine (English Channel) Marine Policy 89 11ndash20 doiorg101016jmarpol 201712007
Reum J C McDonald P S Ferriss B E Farrell D M Harvey C J amp Levin P S (2015) Qualitative network models in support of ecosystem approaches to bivalve aquaculture ICES Journal of Marine Science 72(8) 2278ndash2288 doiorg101093icesjms fsv119
Understanding SocialndashEcological Systems using Loop Analysis
57
Richardson G P (1997) Problems in causal loop diagrams revisited System Dynamics Review 13(3) 247ndash252 doiorg101002(sici)1099-1727(199723)133lt247aid-sdr 128gt 30co2-9
Stachowicz J J Fried H Osman R W amp Whitlatch R B (2002) Biodiversity invasion resistance and marine ecosystem function Reconciling pattern and process Ecology 83(9) 2575ndash2590 doiorg1018900012-9658(2002)083[2575birame]20co2
Stier A C Samhouri J F Gray S Martone R G Mach M E Halpern B S hellip Levin P S (2017) Integrating expert perceptions into food web conservation and management Conservation Letters 10(1) 67ndash76 doiorg101111conl12245
Stylios C D amp Groumpos P P (1999) A soft computing approach for modelling the supervisor of manufacturing systems Journal of Intelligent and Robotic Systems 26(3ndash4) 389ndash403 doiorg101023A1008165916707
Sweeney L B amp Sterman J (2007) Thinking about systems Student and teacher conceptions of natural and social systems System Dynamics Review 23(2ndash3) 285ndash311 doiorg101002sdr366
Tenza A Peacuterez I Martiacutenez-Fernaacutendez J amp Gimeacutenez A (2017) Understanding the decline and resilience loss of a long-lived social-ecological system Insights from system dynamics Ecology and Society 22(2) Article 15 doiorg105751es-09176-220215
Ticehurst J L Newham L T Rissik D Letcher R A amp Jakeman A J (2007) A Bayesian network approach for assessing the sustainability of coastal lakes in New South Wales Australia Environmental Modelling amp Software 22(8) 1129ndash1139 doiorg101016 jenvsoft 200603003
Worm B Barbier E B Beaumont N Duffy J E Folke C Halpern B S hellip Watson R (2006) Impacts of biodiversity loss on ocean ecosystem services Science 314(5800) 787ndash790 doiorg101126science1132294
Yasuoka J Jimba M amp Levins R (2014) Application of loop analysis for evaluation of malaria control interventions Malaria Journal 13 Article 140 doiorg1011861475-2875-13-140
This text is taken from Human Ecology Review Volume 26 Number 2 2020 published by ANU Press The Australian National University Canberra Australia
doiorg1022459HER2602202003

Human Ecology Review Volume 26 Number 2 2020
54
Costanza R amp Mageau M (1999) What is a healthy ecosystem Aquatic Ecology 33(1) 105ndash115 doiorg101023A1009930313242
Dambacher J M Brewer D T Dennis D M Macintyre M amp Foale S (2007) Qualitative modelling of gold mine impacts on Lihir Islandrsquos socioeconomic system and reef-edge fish community Environmental Science amp Technology 41(2) 555ndash562 doiorg 101021es0610333
Dambacher J M Rothlisberg P C amp Loneragan N R (2015) Qualitative mathematical models to support ecosystem‐based management of Australiarsquos Northern Prawn Fishery Ecological Applications 25(1) 278ndash298 doiorg10189013-20301
Downing A S van Nes E H Balirwa J S Beuving J J Bwathondi P O J Chapman L J hellip Mooij W M (2014) Coupled human and natural system dynamics as key to the sustainability of Lake Victoriarsquos ecosystem services Ecology and Society 19(4) Article 31 doiorg105751es-06965-190431
Espinoza-Tenorio A Wolff M Espejel I amp Montantildeo-Moctezuma G (2013) Using traditional ecological knowledge to improve holistic fisheries management Transdisciplinary modeling of a lagoon ecosystem of Southern Mexico Ecology and Society 18(2) Article 6 doiorg105751es-05369-180206
Folke C (2006) Resilience The emergence of a perspective for socialndashecological systems analyses Global Environmental Change 16(3) 253ndash267 doiorg101016jgloenvcha 200604002
Haines-Young R amp Potschin M (2010) The links between biodiversity ecosystem services and human well-being In D G Raffaelli amp C L Frid (Eds) Ecosystem ecology A new synthesis (pp 110ndash139) Cambridge University Press doiorg101017cbo978051175 0458007
Hanspach J Hartel T Milcu A I Mikulcak F Dorresteijn I Loos J hellip Fischer J (2014) A holistic approach to studying socialndashecological systems and its application to southern Transylvania Ecology and Society 19(4) Article 32 doiorg105751es-06915-190432
Hilborn R (2007) Defining success in fisheries and conflicts in objectives Marine Policy 31(2) 153ndash158 doiorg101016jmarpol200605014
Hughes T P Bellwood D R Folke C Steneck R S amp Wilson J (2005) New paradigms for supporting the resilience of marine ecosystems Trends in Ecology amp Evolution 20(7) 380ndash386 doiorg101016jtree200503022
Ibaacutentildeez A M amp Veacutelez C E (2008) Civil conflict and forced migration The micro determinants and welfare losses of displacement in Colombia World Development 36(4) 659ndash676 doiorg101016jworlddev200704013
Justus J (2006) Loop analysis and qualitative modeling Limitations and merits Biology and Philosophy 21(5) 647ndash666 doiorg101007s10539-006-9050-x
Understanding SocialndashEcological Systems using Loop Analysis
55
Kittinger J N Finkbeiner E M Ban N C Broad K Carr M H Cinner J E hellip Crowder L B (2013) Emerging frontiers in social-ecological systems research for sustainability of small-scale fisheries Current Opinion on Environmental Sustainability 5(3ndash4) 352ndash357 doiorg101016jcosust201306008
Kok K (2009) The potential of fuzzy cognitive maps for semi-quantitative scenario development with an example from Brazil Global Environmental Change 19(1) 122ndash133 doiorg101016jgloenvcha200808003
Lane D C (2008) The emergence and use of diagramming in system dynamics A critical account Systems Research and Behavioral Science 25(1) 3ndash23 doiorg101002sres826
Leslie H M Basurto X Nenadovic M Sievanen L Cavanaugh K C Cota-Nieto J J hellip Aburto-Oropeza O (2015) Operationalizing the social-ecological systems framework to assess sustainability Proceedings of the National Academy of Sciences of the USA 112(19) 5979ndash5984 doiorg101073pnas1414640112
Levin P S Fogarty M J Murawski S A amp Fluharty D (2009) Integrated ecosystem assessments Developing the scientific basis for ecosystem-based management of the ocean PLoS Biology 7(1) e1000014 doiorg101371journalpbio1000014
Levins R (1968) Evolution in changing environments Some theoretical explorations Princeton University Press
Levins R (1974) Discussion paper The qualitative analysis of partially specified systems Annals of the New York Academy of Sciences 231(1) 123ndash138 doiorg101111 j1749-66321974tb20562x
Levins R (1975) Evolution in communities near equilibrium In M L Cody and J M Diamond (Eds) Ecology and evolution of communities (pp 16ndash50) Harvard University Press
Levins R (1995) Preparing for uncertainty Ecosystem Health 1(1) 47ndash57
Levins R amp Puccia C J (1988) The controlling factor in biological communities Coenoses 3(3) 149ndash154 wwwjstororgstable43460977
Lewontin R C amp Levins R (2007) Educating the intuition to cope with complexity In R C Lewontin amp R Levins (Eds) Biology under the influence Dialectical essays on ecology agriculture and health (pp 183ndash198) Monthly Review Press
Logofet D (1993) Matrices and graphs Stability problems in mathematical ecology CRC Press
Long R D Charles A amp Stephenson R L (2015) Key principles of marine ecosystem-based management Marine Policy 57 53ndash60 doiorg101016jmarpol201501013
Lotze H K Lenihan H S Bourque B J Bradbury R H Cooke R G Kay M C hellip Jackson J B (2006) Depletion degradation and recovery potential of estuaries and coastal seas Science 312(5781) 1806ndash1809 doiorg101126science1128035
Human Ecology Review Volume 26 Number 2 2020
56
Marcot B G Holthausen R S Raphael M G Rowland M M amp Wisdom M J (2001) Using Bayesian belief networks to evaluate fish and wildlife population viability under land management alternatives from an environmental impact statement Forest Ecology and Management 153(1ndash3) 29ndash42 doiorg101016s0378-1127(01)00452-2
Martone R G Bodini A amp Micheli F (2017) Identifying potential consequences of natural perturbations and management decisions on a coastal fishery socialndashecological system using qualitative loop analysis Ecology and Society 22(1) Article 34 doiorg 105751 es-08825-220134
Melbourne-Thomas J Wotherspoon S Raymond B amp Constable A (2012) Comprehensive evaluation of model uncertainty in qualitative network analyses Ecological Monographs 82(4) 505ndash519 doiorg10189012-02071
Micheli F Saenz-Arroyo A Greenley A Vazquez L Espinoza Montes J A Rossetto M amp De Leo G A (2012) Evidence that marine reserves enhance resilience to climatic impacts PLoS ONE 7 e40832 doiorg101371journalpone0040832
Nival P amp Gorsky G (2001) Conditions for blooming of pelagic species In CIESM Workshop Monographs No 14mdashGelatinous zooplankton outbreaks Theory and practice (pp 23ndash27) Commission Internationale pour lrsquoExploration Scientifique de la Meacutediterraneacutee (CIESM [Mediterranean Science Commission])
Ostrom E (2009) A general framework for analyzing sustainability of social-ecological systems Science 325(5939) 419ndash422 doiorg101126science1172133
Oumlzesmi U amp Oumlzesmi S L (2004) Ecological models based on peoplersquos knowledge A multi-step fuzzy cognitive mapping approach Ecological Modelling 176(1ndash2) 43ndash64 doiorg101016jecolmodel200310027
Partelow S Fujitani M Soundararajan V amp Schluumlter A (2019) Transforming the social-ecological systems framework into a knowledge exchange and deliberation tool for comanagement Ecology and Society 24(1) Article 15 doiorg105751es-10724-240115
Pollino C A Woodberry O Nicholson A Korb K amp Hart B T (2007) Parameterisation and evaluation of a Bayesian network for use in an ecological risk assessment Environmental Modelling amp Software 22(8) 1140ndash1152 doiorg101016jenvsoft200603006
Puccia C J amp Levins R (1985) Qualitative modeling of complex systems An introduction to loop analysis and time averaging Harvard University Press
Raoux A Dambacher J M Pezy J P Mazeacute C Dauvin J C amp Niquil N (2018) Assessing cumulative sociondashecological impacts of offshore wind farm development in the Bay of Seine (English Channel) Marine Policy 89 11ndash20 doiorg101016jmarpol 201712007
Reum J C McDonald P S Ferriss B E Farrell D M Harvey C J amp Levin P S (2015) Qualitative network models in support of ecosystem approaches to bivalve aquaculture ICES Journal of Marine Science 72(8) 2278ndash2288 doiorg101093icesjms fsv119
Understanding SocialndashEcological Systems using Loop Analysis
57
Richardson G P (1997) Problems in causal loop diagrams revisited System Dynamics Review 13(3) 247ndash252 doiorg101002(sici)1099-1727(199723)133lt247aid-sdr 128gt 30co2-9
Stachowicz J J Fried H Osman R W amp Whitlatch R B (2002) Biodiversity invasion resistance and marine ecosystem function Reconciling pattern and process Ecology 83(9) 2575ndash2590 doiorg1018900012-9658(2002)083[2575birame]20co2
Stier A C Samhouri J F Gray S Martone R G Mach M E Halpern B S hellip Levin P S (2017) Integrating expert perceptions into food web conservation and management Conservation Letters 10(1) 67ndash76 doiorg101111conl12245
Stylios C D amp Groumpos P P (1999) A soft computing approach for modelling the supervisor of manufacturing systems Journal of Intelligent and Robotic Systems 26(3ndash4) 389ndash403 doiorg101023A1008165916707
Sweeney L B amp Sterman J (2007) Thinking about systems Student and teacher conceptions of natural and social systems System Dynamics Review 23(2ndash3) 285ndash311 doiorg101002sdr366
Tenza A Peacuterez I Martiacutenez-Fernaacutendez J amp Gimeacutenez A (2017) Understanding the decline and resilience loss of a long-lived social-ecological system Insights from system dynamics Ecology and Society 22(2) Article 15 doiorg105751es-09176-220215
Ticehurst J L Newham L T Rissik D Letcher R A amp Jakeman A J (2007) A Bayesian network approach for assessing the sustainability of coastal lakes in New South Wales Australia Environmental Modelling amp Software 22(8) 1129ndash1139 doiorg101016 jenvsoft 200603003
Worm B Barbier E B Beaumont N Duffy J E Folke C Halpern B S hellip Watson R (2006) Impacts of biodiversity loss on ocean ecosystem services Science 314(5800) 787ndash790 doiorg101126science1132294
Yasuoka J Jimba M amp Levins R (2014) Application of loop analysis for evaluation of malaria control interventions Malaria Journal 13 Article 140 doiorg1011861475-2875-13-140
This text is taken from Human Ecology Review Volume 26 Number 2 2020 published by ANU Press The Australian National University Canberra Australia
doiorg1022459HER2602202003

Understanding SocialndashEcological Systems using Loop Analysis
55
Kittinger J N Finkbeiner E M Ban N C Broad K Carr M H Cinner J E hellip Crowder L B (2013) Emerging frontiers in social-ecological systems research for sustainability of small-scale fisheries Current Opinion on Environmental Sustainability 5(3ndash4) 352ndash357 doiorg101016jcosust201306008
Kok K (2009) The potential of fuzzy cognitive maps for semi-quantitative scenario development with an example from Brazil Global Environmental Change 19(1) 122ndash133 doiorg101016jgloenvcha200808003
Lane D C (2008) The emergence and use of diagramming in system dynamics A critical account Systems Research and Behavioral Science 25(1) 3ndash23 doiorg101002sres826
Leslie H M Basurto X Nenadovic M Sievanen L Cavanaugh K C Cota-Nieto J J hellip Aburto-Oropeza O (2015) Operationalizing the social-ecological systems framework to assess sustainability Proceedings of the National Academy of Sciences of the USA 112(19) 5979ndash5984 doiorg101073pnas1414640112
Levin P S Fogarty M J Murawski S A amp Fluharty D (2009) Integrated ecosystem assessments Developing the scientific basis for ecosystem-based management of the ocean PLoS Biology 7(1) e1000014 doiorg101371journalpbio1000014
Levins R (1968) Evolution in changing environments Some theoretical explorations Princeton University Press
Levins R (1974) Discussion paper The qualitative analysis of partially specified systems Annals of the New York Academy of Sciences 231(1) 123ndash138 doiorg101111 j1749-66321974tb20562x
Levins R (1975) Evolution in communities near equilibrium In M L Cody and J M Diamond (Eds) Ecology and evolution of communities (pp 16ndash50) Harvard University Press
Levins R (1995) Preparing for uncertainty Ecosystem Health 1(1) 47ndash57
Levins R amp Puccia C J (1988) The controlling factor in biological communities Coenoses 3(3) 149ndash154 wwwjstororgstable43460977
Lewontin R C amp Levins R (2007) Educating the intuition to cope with complexity In R C Lewontin amp R Levins (Eds) Biology under the influence Dialectical essays on ecology agriculture and health (pp 183ndash198) Monthly Review Press
Logofet D (1993) Matrices and graphs Stability problems in mathematical ecology CRC Press
Long R D Charles A amp Stephenson R L (2015) Key principles of marine ecosystem-based management Marine Policy 57 53ndash60 doiorg101016jmarpol201501013
Lotze H K Lenihan H S Bourque B J Bradbury R H Cooke R G Kay M C hellip Jackson J B (2006) Depletion degradation and recovery potential of estuaries and coastal seas Science 312(5781) 1806ndash1809 doiorg101126science1128035
Human Ecology Review Volume 26 Number 2 2020
56
Marcot B G Holthausen R S Raphael M G Rowland M M amp Wisdom M J (2001) Using Bayesian belief networks to evaluate fish and wildlife population viability under land management alternatives from an environmental impact statement Forest Ecology and Management 153(1ndash3) 29ndash42 doiorg101016s0378-1127(01)00452-2
Martone R G Bodini A amp Micheli F (2017) Identifying potential consequences of natural perturbations and management decisions on a coastal fishery socialndashecological system using qualitative loop analysis Ecology and Society 22(1) Article 34 doiorg 105751 es-08825-220134
Melbourne-Thomas J Wotherspoon S Raymond B amp Constable A (2012) Comprehensive evaluation of model uncertainty in qualitative network analyses Ecological Monographs 82(4) 505ndash519 doiorg10189012-02071
Micheli F Saenz-Arroyo A Greenley A Vazquez L Espinoza Montes J A Rossetto M amp De Leo G A (2012) Evidence that marine reserves enhance resilience to climatic impacts PLoS ONE 7 e40832 doiorg101371journalpone0040832
Nival P amp Gorsky G (2001) Conditions for blooming of pelagic species In CIESM Workshop Monographs No 14mdashGelatinous zooplankton outbreaks Theory and practice (pp 23ndash27) Commission Internationale pour lrsquoExploration Scientifique de la Meacutediterraneacutee (CIESM [Mediterranean Science Commission])
Ostrom E (2009) A general framework for analyzing sustainability of social-ecological systems Science 325(5939) 419ndash422 doiorg101126science1172133
Oumlzesmi U amp Oumlzesmi S L (2004) Ecological models based on peoplersquos knowledge A multi-step fuzzy cognitive mapping approach Ecological Modelling 176(1ndash2) 43ndash64 doiorg101016jecolmodel200310027
Partelow S Fujitani M Soundararajan V amp Schluumlter A (2019) Transforming the social-ecological systems framework into a knowledge exchange and deliberation tool for comanagement Ecology and Society 24(1) Article 15 doiorg105751es-10724-240115
Pollino C A Woodberry O Nicholson A Korb K amp Hart B T (2007) Parameterisation and evaluation of a Bayesian network for use in an ecological risk assessment Environmental Modelling amp Software 22(8) 1140ndash1152 doiorg101016jenvsoft200603006
Puccia C J amp Levins R (1985) Qualitative modeling of complex systems An introduction to loop analysis and time averaging Harvard University Press
Raoux A Dambacher J M Pezy J P Mazeacute C Dauvin J C amp Niquil N (2018) Assessing cumulative sociondashecological impacts of offshore wind farm development in the Bay of Seine (English Channel) Marine Policy 89 11ndash20 doiorg101016jmarpol 201712007
Reum J C McDonald P S Ferriss B E Farrell D M Harvey C J amp Levin P S (2015) Qualitative network models in support of ecosystem approaches to bivalve aquaculture ICES Journal of Marine Science 72(8) 2278ndash2288 doiorg101093icesjms fsv119
Understanding SocialndashEcological Systems using Loop Analysis
57
Richardson G P (1997) Problems in causal loop diagrams revisited System Dynamics Review 13(3) 247ndash252 doiorg101002(sici)1099-1727(199723)133lt247aid-sdr 128gt 30co2-9
Stachowicz J J Fried H Osman R W amp Whitlatch R B (2002) Biodiversity invasion resistance and marine ecosystem function Reconciling pattern and process Ecology 83(9) 2575ndash2590 doiorg1018900012-9658(2002)083[2575birame]20co2
Stier A C Samhouri J F Gray S Martone R G Mach M E Halpern B S hellip Levin P S (2017) Integrating expert perceptions into food web conservation and management Conservation Letters 10(1) 67ndash76 doiorg101111conl12245
Stylios C D amp Groumpos P P (1999) A soft computing approach for modelling the supervisor of manufacturing systems Journal of Intelligent and Robotic Systems 26(3ndash4) 389ndash403 doiorg101023A1008165916707
Sweeney L B amp Sterman J (2007) Thinking about systems Student and teacher conceptions of natural and social systems System Dynamics Review 23(2ndash3) 285ndash311 doiorg101002sdr366
Tenza A Peacuterez I Martiacutenez-Fernaacutendez J amp Gimeacutenez A (2017) Understanding the decline and resilience loss of a long-lived social-ecological system Insights from system dynamics Ecology and Society 22(2) Article 15 doiorg105751es-09176-220215
Ticehurst J L Newham L T Rissik D Letcher R A amp Jakeman A J (2007) A Bayesian network approach for assessing the sustainability of coastal lakes in New South Wales Australia Environmental Modelling amp Software 22(8) 1129ndash1139 doiorg101016 jenvsoft 200603003
Worm B Barbier E B Beaumont N Duffy J E Folke C Halpern B S hellip Watson R (2006) Impacts of biodiversity loss on ocean ecosystem services Science 314(5800) 787ndash790 doiorg101126science1132294
Yasuoka J Jimba M amp Levins R (2014) Application of loop analysis for evaluation of malaria control interventions Malaria Journal 13 Article 140 doiorg1011861475-2875-13-140
This text is taken from Human Ecology Review Volume 26 Number 2 2020 published by ANU Press The Australian National University Canberra Australia
doiorg1022459HER2602202003

This text is taken from Human Ecology Review Volume 26 Number 2 2020 published by ANU Press The Australian National University Canberra Australia
doiorg1022459HER2602202003