understanding the drinking-water catchment
DESCRIPTION
This publication provides a structured approach to analysing hazards to groundwater quality, assessing the risk they may cause for a specific supply, setting priorities in addressing these, and developing management strategies for their control. For health professionals, it thus is a tool for access to environmental information needed for such a process, and for professionals from other sectors it gives a point of entry for understanding health aspects of groundwater management.TRANSCRIPT

Section II
Understanding the drinking-water catchment


© 2006 World Health Organization. Protecting Groundwater for Health: Managing the Quality of Drinking-water Sources. Edited by O. Schmoll, G. Howard, J. Chilton and I. Chorus. ISBN: 1843390795. Published by IWA Publishing, London, UK.
6 Collecting information for characterizing the catchment and assessing pollution potential
I. Chorus, J. Chilton and O. Schmoll
Sufficient information is key for adequately assessing both the groundwater pollution potential and safety of a drinking-water source. This assessment requires a variety of information, particularly relating to the hydrogeological setting (i.e. aquifer vulnerability), socioeconomic conditions and the range of anthropogenic activities present in the catchment which potentially release pollutants. The establishment of an information inventory is therefore a central tool for developing a sound understanding of potential pollution sources and the likelihood with which pollutants may reach groundwater in concentrations hazardous to human health. The type of information required for assessing groundwater pollution potential is highlighted by the checklists at the end of Chapters 7-13. This chapter addresses general aspects of establishing an information inventory, focusing on the following three questions:
• Which types of information are useful or necessary, and where can they be obtained?
• Who needs to work together to collate the information needed for a comprehensive characterization of the drinking-water catchment area?

160 Protecting Groundwater for Health
• What quality of information is necessary to assess groundwater pollution potential, prioritize hazards and decide on management options?
A key element when compiling an information inventory is to establish adequate data management. This is crucial for viable assessment approaches, regardless of the level of sophistication of data and information that are available and are being used. A well maintained information inventory also supports transparency in the chain from assessment to subsequent management decisions, and is therefore helpful for ensuring acceptance and relevance to all involved parties.
6.1 TYPES OF INFORMATION AND ACCESS TO IT Information needed for assessing the groundwater pollution potential, i.e. the likelihood that disease agents such as pathogens or chemicals reach groundwater (Chapter 14), can be gained from four types of sources:
• site and catchment inspections; • public consultation, i.e. communication with the local population; • collating existing data; • targeted hydrogeological field surveys (e.g. for aquifer vulnerability mapping as
discussed in Chapter 8), and groundwater quality screening or monitoring programmes involving laboratory analyses.
For the most effective use of available resources it is helpful to begin with an initial assessment identifying which information is available. From this, it is often possible to prioritize additional information needed as a basis for making decisions. Such an initial assessment will begin with site inspection and careful evaluation of the available data. Further steps may follow, involving different levels of field surveys including laboratory analysis of samples.
Generally, financial resources and institutional capacity significantly influence both access to different types of information as well as scope and extent of the information collection process. Institutional capacities may be very limited with respect to analytical laboratory equipment or with respect to staff, or both, and this does not necessarily correlate with economic potential. In some settings, financial resources and institutional capacity may allow for regular groundwater monitoring with sophisticated equipment and analytical methods, including modelling of groundwater flows and loading. In contrast, in other settings available options may be limited to visual information gleaned from site or catchment inspection and informal information from communication with the population in the drinking-water catchment.
Assessment strategies that are mainly based on high-tech monitoring easily neglect site or catchment inspection as an important first-hand information sources whereas communities with limited resources can successfully perform pollution potential assessments on the basis of information gleaned from site inspection and public communication. Some countries with excellent laboratory capacity face increasing staff reductions, and site inspection has often been the first activity compromised by structural changes in responsible authorities since they are labour intensive. Other countries with lower labour costs may have more staff capacity for conducting site inspection – in spite

Collecting information 161
of substantially less developed laboratory capacity – and thus have a high potential for good situation assessments, if the staff are adequately trained.
6.1.1 Site and catchment inspection Comprehensive site and catchment inspections provide highly valuable first hand information about the area of interest, and in many cases they uncover self-evident pollution problems in a catchment. Inspections often provide an important early warning function as they can indicate the potential of future groundwater pollution which would only be detected by monitoring after the fact.
Sanitary inspections are specifically designed to provide an overview of the status of drinking-water source contamination risks. They identify probable causes of failures when drinking-water contamination is found (Howard, 2002a), and may include, for example, an assessment of the proximity of polluting activities in relation to drinking-water abstraction points and of the condition of wellheads. A more detailed description of sanitary inspection is given in Chapter 18, and further guidance can be obtained from, for example, Lloyd and Helmer (1991), WHO (1997) and Howard (2002a, 2002b).
Inspections on a broader, catchment oriented scale target the collection of information for the characterization of visible activities which may potentially pollute groundwater and of hydrogeological conditions which determine aquifer pollution vulnerability. The checklists at the end of Chapters 7-13 provide examples of aspects to consider when performing site or catchment inspections. Inspections need to be repeated periodically, as conditions and activities in the catchment are not static and change over time as new development occurs in the area, or may be important only seasonally.
Inspections can often gain more information if performed in collaboration with those responsible for, or operating, activities in the catchment which may potentially contaminate groundwater (e.g. farmers, operators of waste disposal sites or sanitation infrastructure, etc.).
6.1.2 Consulting the public Public consultation and involvement is best undertaken whilst collecting information about groundwater. This is important to establish a basis of open dialogue and mutual trust as well as ownership which is crucial for the implementation of management responses. At this stage, however, public consultation is also important as a potential source of information. People in the community can report how their livelihoods relate to water use and water quality, which sources and wells are used for which purpose and in what amounts, and pressures that have an impact on water uses and on pollution. This helps assess the economic and social values placed upon groundwater in a given community and understand reasons for quality and quantity problems (see also Chapters 5 and 7).
Understanding the community’s perception of issues, e.g. land tenure rights in relation to groundwater use, or performance of government institutions, may be an important source of information for developing successful management responses. Other issues for which this may be important are the perception of quality, e.g. confidence in

162 Protecting Groundwater for Health
public supply and perhaps how this compares to confidence in water from private wells, as well as willingness to pay for better quality of water.
As discussed in Chapter 7, in undertaking community consultation, it is important to ensure that all stakeholder groups are included, and to avoid potential bias in the findings by concentrating on particularly vociferous groups that may have an unrepresentatively negative or positive view of certain issues.
Community consultation is generally an important source of ‘informal local knowledge’. Targeted interviews, questionnaires, telephone or door-to-door surveys are common tools for establishing communication with the local population and thus accessing their knowledge. A wide range of information about technical groundwater issues may be gleaned from interviewing community members, e.g. on water levels in wells, patterns of rainfall and inundations, changes in vegetation cover that might indicate changes in groundwater levels or seasonal patterns relating to groundwater. Communication with the local population may also be a good – though usually incomplete – source of information on potential pollution from human activities (including illicit activities), as discussions can help identify the reasons for which adequate control measures are lacking. Information gleaned from local knowledge may be particularly valuable where those operating polluting activities are reluctant to provide required information or deny access to operation sites for inspection. Consultation can also help identify the numbers and locations of private wells and to map these in relation to public supplies and to centres of population. Further, the community may be able to actively support groundwater monitoring or even conduct elements of it.
In order to maintain open dialogue and trust, it is important to inform the communities of the results of the catchment assessment, e.g. by providing copies of relevant reports and assessments and/or conducting meetings for oral reporting and discussion.
6.1.3 Evaluating existing data Careful evaluation of existing data may prove to be a good basis for assessing groundwater pollution potential. In most settings, current and historical data are likely to be available although often compiled for specific purposes other than groundwater assessments, i.e. for research, land use planning, environmental impact assessments or registration and licensing of commercial activities. Data sources that can be evaluated vary widely but include:
• statistical data (e.g. population, water usage, agrochemical usage, economic activities, land ownership and use, health and epidemiology);
• recorded data from ongoing monitoring programmes (e.g. drinking-water or groundwater quality, drinking-water abstraction, meteorology);
• hydrogeological and geographical information (e.g. area, geologic, vulnerability or land use maps, air photos, satellite images);
• published studies (e.g. from earlier surveys, programmes, inspections, environmental impact assessments).
Water quality data may exist from various types of groundwater surveys or ongoing monitoring programmes. Such data are a highly valuable support for the assessment of pollution. Water quality data for delivered drinking-water are most frequently available and can be helpful for assessing aquifer pollution as contaminants found in drinking-

Collecting information 163
water are likely to have their source in the catchment area. Drinking-water quality cannot, however, always be taken as indicative of the quality of groundwater within the aquifer. This is because samples for drinking-water quality monitoring may be taken in the distribution system, which may be after treatment to remove pollutants and/or after mixing of water from more than one source. These data should be used with care, but can provide useful information for many parameters if these potential constraints are taken into account. In particular, data for natural constituents can provide information on the origin and movement of the water and time series data are important for recognizing potential trends of increasing or decreasing pollutant loading.
Generally, when using data from programmes targeted at purposes other than groundwater pollution potential assessments, their limitations must be kept in mind. For example, existing monitoring programmes may be limited in scope and scale (e.g. in selection of sampling sites, parameters tested or sampling frequency), and thus may not provide satisfactory temporal and spatial coverage in relation to the requirements of a comprehensive pollution potential assessment. However, even if information about specific pollutants is lacking, general hydrochemical information can be valuable for assessing groundwater flow patterns and residence times, as baseline quality from which the effects of human impacts may be distinguished, as well as to provide vital information about naturally-occurring groundwater constituents such as fluoride and arsenic. General hydrochemical data can also provide useful information about the likely behaviour of some pollutants (e.g. the mobility of metals), as referred to in Chapter 4.
Data are available from various governmental and non-governmental bodies and thus may be widely scattered. They include, but are not restricted to:
• public authorities or agencies at different administrative levels (i.e. local, regional, national) and different responsibilities such as:
• health, environment, water management or geology; • planning, permission or licensing bodies for commercial enterprises (e.g.
industry, mining), sanitation, and traffic; • water suppliers and wastewater agencies; • health care facilities; • university departments and other research institutions; • NGOs • local community initiatives (e.g. in water supply, sanitation, environment or
agriculture); • statistical bureaus; • scientific literature or archives; • aid or development organizations; • professional associations (e.g. of farmers, industries).
Personnel and time demands on ‘data mining’ may be substantial: the authorities and agencies possessing valuable databases are often scattered across different administrative levels. Also, more often than not, data are likely to be available by administrative areas, rather than by catchments. Thus for the purpose of an assessment of a given catchment, it may be necessary to seek contact with authorities in several different administrative units.

164 Protecting Groundwater for Health
Much of the data will be unpublished, available only in raw form, perhaps not electronically, and possibly even classified as confidential. Distinction between useful and unimportant data is not always self-evident. Considerable effort may thus be needed to extract, process and categorize useful information. The challenge is to organize and critically assess such data, and to document their sources, including suspected uncertainties about data quality. A further challenge is balancing time and effort needed to obtain data against their usefulness.
Data mining may require more than one iteration of filling information gaps by targeted checking for availability of further data that initially were not readily accessible. This is often the case when data are scattered between different public authorities, water suppliers or universities that produce them. Putting further effort into data mining by revisiting the step of searching for information on activities in the catchment area on a more detailed and targeted level may substantially improve the information inventory or even close critical gaps.
6.1.4 Generating new water quality data In the context of groundwater protection, the term monitoring is usually understood to imply water quality monitoring, and is defined and sub-divided into categories in rather different ways by different authors. Groundwater monitoring tends to be taken for granted in most guidance documents on groundwater protection, e.g. as an ‘additional and essential component’ (Foster et al., 2002). However, in practice groundwater monitoring programmes are often implicitly geared towards scientific investigation per se, and objectives are often not clearly defined and stated. Adriaanse and Lindgaard-Jørgensen (1997) point out the importance of establishing meaningful objectives for water monitoring programmes in order to avoid the data-rich, but information poor syndrome. For providing a basis for management decisions, monitoring programmes need to be tailored to the information needs in the specific setting. Often, the most important information needs for the objective of controlling groundwater quality in drinking-water catchments may not be gained from groundwater monitoring, but rather from monitoring potentially polluting activities and the implementation of measures to prevent them from releasing contaminants to the subsurface. Water quality monitoring Regular groundwater quality monitoring programmes have been established in many countries worldwide. Generally, they provide valuable information on groundwater chemistry, groundwater levels, seasonal quality patterns and other trends over time. Thus they are a supportive component for sound understanding of the hydrological environment, for developing conceptual models of groundwater systems or for mapping groundwater vulnerability. However, as discussed above, it is important to realize that comprehensive groundwater quality monitoring is not an essential prerequisite for assessing groundwater pollution potential in a given drinking-water catchment (Chapter 14). Particularly (though not exclusively) in settings where implementation of regular groundwater monitoring programmes is not feasible (e.g. due to limited financial resources or institutional capacities) or is only just beginning, investigations such as site
Collecting information 165
and catchment inspections and the evaluation of already existing data (Sections 6.1.1-6.1.3) are also highly valuable information sources on which the assessment can build.
In many settings, targeted water quality surveys or screening programmes for selected parameters and/or specific purposes, possibly repeated at more extensive time intervals, may prove sufficient to fill the crucial information gaps and thus confirm and improve pollution potential assessments, e.g. to investigate the extent and severity of suspected pollution ‘hot spots’. In addition, regular monitoring over a certain period of time – often one to two years – may be important to reduce uncertainty of the assessment, particularly in settings where important groundwater parameters show seasonal patterns and trends over time.
Groundwater monitoring in this context can have different objectives: • Understanding natural groundwater quality (i.e. by installing observation wells
in pristine areas). Chemical parameters typically chosen for this objective may include conductivity, pH, redox conditions and natural groundwater constituents including those potentially hazardous to human health, e.g. arsenic and fluoride.
• Provision of data needed for developing groundwater flow models. In this case, monitoring would include tracers or indicators of water movement, e.g. chloride or temperature.
• Characterization of the current level of aquifer pollution. For this purpose, observation wells would be installed in areas of the aquifer considered to be representative of the human activities as well as of the hydrogeological conditions. Parameters for analyses would be selected in relation to contaminants expected from ongoing or previous activities.
Where actual contamination of a drinking-water source is occurring, targeted analysis of the raw water quality will usually identify the pollutant and its concentration. This will then aid in tracking potential pollutant sources and in defining control measures and/or drinking-water treatment requirements. If a pollutant is suspected, but not present in drinking-water wells, water samples from observation wells between the pollution source and the drinking-water well can be used to track movement of the pollutant. In many cases, such observation points are critical in risk assessment of the pollution potential from a known source. Where sufficiently comprehensive programmes can be implemented, they may actually provide quantitative data on microbial and/or chemical contaminants in groundwater to be used in quantitative risk assessments.
Further guidance on specifying information needs in the context of planning monitoring programmes is given by Bartram and Balance (1996), Chapman (1996), UNECE (1996, 2000), Adriaanse and Lindgaard-Jørgensen (1997) and Timmerman and Mulder (1999), provide general guidance and overview on water quality monitoring. Technical aspects of constructing observation wells, sampling and analyses are beyond the scope of this book, and readers are referred to Nielsen (1991), Lapham et al. (1997) and Boulding and Ginn (2003). Because novel sampling and analytical methods are always being developed to improve the monitoring and characterization of subsurface environmental quality, printed material can quickly become dated, and the more technically interested reader should look at the websites of organizations such as US Environmental Protection Agency (US EPA), the American Society for Testing Materials, and US Geological Survey (USGS).

166 Protecting Groundwater for Health
Other types of monitoring For the purpose of this book, the use and understanding of the term monitoring goes beyond groundwater quality monitoring discussed above. The following monitoring categories, which subsume other technical monitoring categories proposed elsewhere, are used in this book, particularly in the context of Water Safety Plans (WSPs) (Chapter 17):
• Operational monitoring for process control does not focus on measuring groundwater quality but is a planned series of observations or measurements to timely quantify efficacy and changes in performance of a control measure that is established to control the occurrence of pathogens or chemicals in groundwater (for more details see Chapter 17 and for examples Chapters 20-25).
• Monitoring for verification is the application of methods, procedures, tests and other evaluations in addition to operational monitoring to determine compliance with and efficacy of the WSP or the groundwater management system, respectively (for more details see Chapter 17 and for examples Chapters 20-25).
6.2 THE NEED FOR COLLABORATION Groundwater assessments are typically undertaken by hydrogeologists, potentially supported by sanitary engineers and/or environmental scientists. These qualifications are indeed essential for understanding groundwater flow and potential contaminant transport. For understanding the potential for contaminant loads to the aquifer, broader competence is needed, preferably in a team that integrates hydrogeological knowledge and an understanding of the potentially polluting human activities (e.g. from agriculture, industry, sanitation, etc.).
Also, as discussed above in Section 6.1.3, existing information on activities potentially impacting on groundwater quality is likely to be broadly scattered. For example, while health or environmental authorities may be responsible for assessing the risk of groundwater pollution, information on human activity in the catchment may be available from diverse government bodies responsible for health, commerce, statistics, traffic, tourism, agriculture, mining, etc. Government agencies with executive and policy functions for the environment and groundwater may have different types of information from local government.
Teamwork and intersectoral collaboration is vital for groundwater assessments. This includes cooperation between all institutions that can contribute from various angles of access to information. The task of collecting and evaluating relevant information will in many cases be the responsibility of a core team of public health, groundwater and environmental experts from public authorities, often supported by water suppliers. However, this core team can be expanded by external experts from the scientific community, representatives of the public, and possibly stakeholders from the catchment. Health authorities may take the initiative in assembling such teams and/or in leading them. The example from India provided in Box 20.2 shows how competence for groundwater pollution potential assessments as well as for developing management options can be built by training employees of government agencies.

Collecting information 167
Water suppliers can successfully take the initiative in establishing interdisciplinary teams for identifying groundwater pollution problems and implementing protection strategies for their specific supply setting. This is mirrored by the WSP approach in which the formation of an interdisciplinary team is a key requirement (Chapter 16). Box 6.1 provides an example of such an approach in an urban setting and Box 16.1 shows how farmers were involved specifically to control nitrate contamination in a rural setting.
Box 6.1. Collaboration of water supply, sanitation and public authorities in
Berlin, Germany: the Hygiene Commission of the Berlin Waterworks
Members of The Hygiene Commission of the Berlin Waterworks include: - a staff member responsible for resource protection, the technical director and
the laboratory director of the waterworks; - a staff member of the municipal public health authority; - a staff member of the municipal environmental authority; - a staff member of the municipal forestry authority; - a staff member of the local police department; - invited experts, e.g. from federal agencies.
Tabling information. All of these members report to the Commission any changes that occurred in the water supply and its catchment since the last meeting. For example, the water supply representatives report on issues regarding water treatment and distribution as well as protection zones. The public authority members report any illegal activities in the catchment observed and/or reported, such as illicit waste disposal, construction activity or traffic, newly identified historic waste sites, and any conspicuous changes observed in the catchment. Reporting also includes public complaints about water quality, odour from sewage treatment works, or observations on recipient water bodies.
Discussing solutions to problems. The Commission evaluates all reports and discusses proposed solutions. This includes administrational measures of public authorities such as issuing permits for construction of facilities, new or changed systems for wastewater collection and treatment, as well as direct regulatory measures of the local police directorate such as removing illegally parked vehicles, closing roads to traffic and posting signs and notices.
Targets of the Hygiene Commission are to: - inform all members about current issues regarding operation of the water
supply and sanitation system as well as catchment protection; - identify pollution potential for management of catchment and supply
system; - coordinate management responses of public authorities from different
sectors and develop intersectorally harmonized strategies for sustainable provision of safe drinking-water;
- coordinate contingency planning.
In many settings worldwide, the key challenge will be to build motivation for collaboration. This may be particularly difficult in situations where, for example, data on
168 Protecting Groundwater for Health
contaminant loading to aquifers are likely to be available only from the polluters themselves, who have no primary interest in control and potential restriction of their activity. Creating ownership, for example through involvement of such stakeholders in drinking-water resource protection teams (Box 6.1), may, therefore, be crucial. Motivation and commitment for collaboration are likely to increase if all players fully understand both their individual contribution to, and benefits from, efforts in protecting groundwater as a drinking-water source. Accounting for value judgements Assessments of the potential for groundwater contamination typically contain a major component of expert judgement rather than being fully quantitative, and they often include substantial uncertainty (Section 6.3). This has two major implications for collecting and compiling information:
• Hazard assessments themselves, but also the information on which they are based, are subject to bias by the knowledge background and the value judgments of the experts involved. It is important to understand implicit value judgements that may drive experts’ assessments, as they are likely to play a role in selecting questions asked, choosing which data are important, assessing data and drawing conclusions. This can be dealt with more appropriately if value judgements are understood, made transparent and explicitly acknowledged.
• Teamwork may be encumbered by implicit value judgements due to differences in scientific background and perception of issues. Both for effective collaboration and for making uncertainties of pollution potential assessments transparent, it is important to be aware of differences in value judgements. In her comprehensive discussion of this aspect of evaluating information for decision-making, Harding (1998) makes the point that ‘even though controversies are typically seen as disputes over “facts”, in most environmental disputes it is the clash between people’s value positions which fuels debate, rather than a disagreement over the “facts”’ (page 61). This applies both to disputes within expert teams and with the general public and is therefore also important when organizing public involvement in the assessment and management of groundwater resources.
For the perception of pollution hazards in groundwater, the general shift to greener or more environmentalist ideology has become relevant in many countries. Environmental protection arguments are often quoted in the context of protecting human health, even where this connection is scientifically unsubstantiated. Perception of health hazards from different classes of substances tends to be linked to the ‘reputation’ the substance has in the media. For example, traces of pesticides in drinking-water may be seen as poisons and therefore as objectionable even at orders of magnitude below health-based guideline values. Specifically for groundwater, the knowledge of the often insurmountable difficulties of removing pollutants from the subsurface has produced strong environmental arguments for protecting aquifers from the impact of human activity.
Often, in assessing information for protecting drinking-water catchments, it will be important to explicitly differentiate between priorities for protecting the environment and priorities for protecting human health. Showing respect for the ethical positions and principles of others may facilitate making motivations transparent. For example,

Collecting information 169
explicitly acknowledging and respecting the position of a team member who considers any groundwater pollution unethical and incompatible with the target of sustainable environmental management may be the basis for attaining his or her support in prioritizing pollutants for the purpose of keeping drinking-water safe for human health.
6.3 SUFFICIENCY AND QUALITY OF INFORMATION – DEALING WITH UNCERTAINTY
Uncertainty is likely to be an issue in all elements of catchment analysis and groundwater pollution potential assessment. The information base on hydrogeological conditions and on the scale and range of human activities in the catchment are only rarely sufficiently comprehensive to allow a fully quantitative determination or prediction of the pollution potential or contaminant concentrations. For example,
• data about the population’s water needs may be incomplete, e.g. with respect to the amount of groundwater abstracted from private wells, possibly illegally;
• information on human activities in the catchment is likely to be incomplete, for potential loads from on-site sanitation and/or leaky sewers as well as for the range and amounts of hazardous substances used and potentially released to the underground in diverse enterprises, agriculture and traffic;
• the meaning of data gained from groundwater monitoring is dependent on the representative selection of sites for observation wells, and costs for their installation constrain the number of sites that can be sampled.
One consequence of this uncertainty is that the target in most cases is a qualitative or semi-quantitative determination of pollution potential, as discussed in Chapter 14 as a basis for risk assessment.
Understanding uncertainty of the information available The concept of uncertainty can be classified in different ways. Harding (1998) proposes the following categories that are relevant for assessing groundwater contamination of a catchment:
• Risk is the most quantifiable and measurable type of uncertainty. It implies that the parameters driving groundwater quality are basically understood. Though the concentration of a contaminant may not be fully quantified or predicted, structured analysis of mechanisms and probabilities allows prediction of the likelihood that it occurs or will occur in concentrations relevant to human health.
• Uncertainty implies that the parameters driving the processes are understood, but not sufficiently well to assess the probability of pollution occurring.
• Ignorance means that not even the most important parameters are understood, i.e. ‘we don’t know what we don’t know’.
A key issue for making management decisions is to understand how sound the available information base is for assessing aquifer groundwater pollution, i.e. the amount of uncertainty involved. This is important both for avoiding wasting resources by poorly informed decisions on management options which later turn out to be ineffective, and for avoiding undue postponement of urgent measures in situations where in fact the information base is already sufficient for making adequate decisions. The question to ask

170 Protecting Groundwater for Health
is ‘how much do we need to know to assess hazards for groundwater quality, and how much uncertainty can we tolerate?’ Aspects of information quality in relation to taking management decisions are discussed in Chapter 15. In the following, the aspects of documenting the quality and reliability of information during its collection are covered together with options for identifying and filling gaps.
Systematic documentation of the information inventory and the information sources, including indication of information quality and reliability, is a useful tool for identifying critical information gaps. Earmarking uncertainties in the database or in the assessment of its quality helps to guide further work on the data inventory. This can be achieved by a list of the factors which probably affect the data but are not well known (e.g. heterogeneity of the subsurface environment as a factor affecting data on estimated flow rates, or illegal manure application as a factor affecting nitrate loads). Such documentation may prove important for acquiring funding for targeted programmes to close gaps.
A next step for assessing sufficiency and quality of information as well as of getting improved information on missing, inconsistent or unverified data is to assign a level of confidence to all data sets in the form of an uncertainty score. Low values of uncertainty indicate data of high reliability, whilst high uncertainty scores indicate estimates or unverifiable information. No data (i.e. a gap) should be given the highest uncertainty score. As discussed in WHO (1982) and by Foster and Hirata (1988), assessments of data quality will often be somewhat subjective. This is endorsed and encouraged, provided that subjectivity is made transparent in the report. As assessment progresses, the aim should be to reduce the uncertainty scores by infilling with more accurate and reliable data. The use of uncertainty scores will aid in prioritization of data acquisition. When the data are used collectively, a summed or weighted uncertainty score can be used to indicate the relative confidence in the interpretation. An indication of where uncertainties are most relevant for assessing potential pollution can often be gleaned from targeted inspection of the respective sites and activities in the catchment.
Reducing uncertainty An effective option for filling information gaps is the design of specific programmes that may prove to be quite feasible if they are properly targeted. For example, where potential pollution sources are known from assessments of activities in the catchment area, but the scale of the activity with regard to the likelihood of the pollutants actually reaching the aquifer is poorly understood or cannot be assessed, a survey of pollutant occurrence in groundwater may prove possible even with limited budgets. Such surveys may be small-scale and well-targeted to address the specific pollutants and limited to localities critical for water supply. For example, in Tajikistan the authorities responsible for drinking-water quality needed information on pesticide levels as a basis for making a decision whether to use shallow aquifers as drinking-water sources. In the face of data showing a substantial decline in the application of pesticides, a small initial survey of pesticide concentrations in the aquifers that were envisaged for providing supplies helped decide which ones could actually be used, and indeed this showed pesticide pollution to be much less of a problem than had been assumed from the historic knowledge of high rates formerly applied.

Collecting information 171
Hydrogeological information gaps are often perceived as intimidating. However, here also, targeting investigations towards specific questions may narrow down the effort required and thus make programmes feasible. Examples are the use of groundwater temperature to indicate ingress of surface water (applicable in settings with seasonal patterns of surface water temperature), the use of electrical conductivity as a simple indicator of saline intrusion or the use of substances characteristic for sewage (e.g. detergents, ammonia, caffeine) as tracers for sewage ingress.
Another aspect of filling information gaps is checking whether further data may indeed be available, though perhaps initially not readily accessible, as discussed in Section 6.1.
Decisions on investments into improving the information base will depend on the consequences of uncertainty. For example, if the assessment of aquifer contamination is highly uncertain (in ignorance of some polluting activity or because of poor understanding of its vulnerability) and a large number of people use it as drinking-water source, the consequence might be severe, e.g. high incidence of waterborne disease. This would be a strong rationale for improving the information base. Vice versa, consequences in terms of public health would be minor if the population is connected to a central supply using an alternative water source, and improving public health would not be a reason to invest in improving the database.
6.4 SUMMARY – HOW TO PROCEED Figure 6.1 outlines principal planning steps that may be taken to glean sufficient information for characterizing a drinking-water catchment as a basis for assessing groundwater pollution potential (Chapter 14). Taking the initiative for compiling a catchment specific information inventory may be the role of local or regional public authorities either in charge of surveillance of drinking-water supplies or of overall catchment management (e.g. environmental authorities or departments), but it may also be taken by a water supplier in the context of protecting the supply’s catchment and/or developing a WSP.
The first step for those initiating a programme for catchment characterization and building an information inventory, both a basis for the assessment of groundwater pollution potential, is to outline the scope of the process. This particularly requires a preliminary understanding of:
• What area to assess, i.e. the delineation of the catchment of the water supply or well field. In many settings, some hydrogeological information is available in relation to the water supply. Where this is lacking, the surface profile gleaned from a topographic map and/or a first visit to the site may provide a preliminary indication.
• The type of information expected to be available (e.g. on socioeconomic aspects, groundwater vulnerability and anthropogenic activities). This can be achieved by compiling and reviewing a first overview of the information sources accessible and the stakeholders involved.
• Key issues to investigate within the process of catchment characterization.

172 Protecting Groundwater for Health
Figure 6.1. Principal planning steps for collecting information
Planning and designing the actual investigation requires defining its targets in consideration of the financial, institutional and personnel resources available. For more detailed guidance on how to design a groundwater quality assessment, see UNECE (2000).
The second step is to identify expertise and key players who need to be involved in catchment investigation and pollution potential assessment, and to convene a team for

Collecting information 173
conducting both. As discussed in Section 6.2, it is useful to involve public authorities from the sectors important in the catchment as well as experts, particularly in the fields of hydrogeology and public health. Often, it is useful to strive for public participation in this early planning phase by including members of communities affected or special interest groups. Supportive involvement of stakeholders from potentially polluting activities may be particularly useful for obtaining sensitive information, e.g. on pollutant loads.
The third step is to carry out the investigation. For gathering comprehensive information, it may be useful to split the team into working-groups which focus on three different activities that may be conducted in parallel. These include:
• Site and catchment inspection (Section 6.1.1) to record and map all features potentially relevant to groundwater pollution, for example settlements and water use practices (Chapter 7), topographic features (such as sinkholes and abandoned wells) that could facilitate rapid transport of pollutants to groundwater (Chapter 8), and human activities that might lead to groundwater pollution (Chapters 9-13). Depending on the scope of catchment characterization, this can include recording of hydrogeological information for assessing groundwater vulnerability, or the latter would be a separate activity conducted by a team of hydrogeologists. Templates for checklists to assist collecting this information at the end of Chapters 7-13 assist inspection and would be tailored to the specific setting. Notes should be included on uncertainties and information gaps perceived as potentially relevant to the assessment (Section 6.3).
• Consult and liase with the local population as a source of information, particularly to glean local knowledge about, for example, economic or cultural values placed upon groundwater, community perceptions on the use and protection of groundwater resources, or information of a more technical nature, e.g. on potential pollution sources, location and use of wells, etc. (Section 6.1.2).
• Evaluation of existing information and data (Section 6.1.3) already available from previous programmes and investigations into groundwater and drinking-water quality, aquifer characteristics which define its vulnerability, and anthropogenic activities in the catchment. This information amends the checklists from catchment inspection.
Step three is followed by an iterative process as shown in Figure 6.1. It involves the following elements, the order of which will depend on the situation and the approach preferred by the team:
• Drafting a groundwater pollution potential assessment as described in Chapter 14. • Identifying uncertainties and information gaps. The evaluation of information
available may reveal that the understanding of catchment characteristics is not sufficient, or information from different sources is inconsistent, and therefore the information inventory needs to be improved for adequately assessing groundwater pollution potential as a decision basis for developing management responses to protect the drinking-water catchment.
• Improving knowledge. Some of the identified information gaps may be fairly readily closed by revisiting specific sites in the catchment for more thorough inspection, or by requesting information from, for example, operators of farms, enterprises or other activities. If uncertainty is too large to make decisions, information gaps need to be closed with specifically targeted groundwater
174 Protecting Groundwater for Health
surveys and or regular groundwater quality monitoring. In many cases the need for this can be limited to selected localities and/or polluting activities in the catchment (Section 6.1.3).
As settlements and human activities in the catchment develop and change, so will pollution potential. Further, the impact of management responses needs to be assessed. In consequence, the topicality of information inventories and pollution potential assessments needs to be reviewed and repeated periodically, and improvement of the assessment is an iterative process. The experience and knowledge gained over time will serve to reduce the uncertainty of the assessment and increase the safety of the water supply in the long term.
6.5 REFERENCES Adriaanse, M. and Lindgaard-Jørgensen, P. (1997) Information systems. In Water Pollution
Control, (eds. R. Helmer and I. Hespanhol), pp. 245-274, UNEP, Water Supply & Sanitation Control and WHO, E & FN Spon, London.
Bartram, J. and Balance, R. (1996) Water Quality Monitoring, UNEP and WHO, E & FN Spon, London.
Boulding, J.R. and Ginn, J.S. (2003) Practical Handbook of Soil, Vadose Zone and Groundwater Contamination Assessment, Prevention and Remediation, 2nd edn, CRC Press, Florida.
Chapman, D. (1996) Water Quality Assessments: A guide to the use of biota, sediments and water in environmental monitoring, 2nd edn, UNEP, UNESCO and WHO, E&FN Spon, London.
Foster, S. and Hirata, R. (1988) Groundwater Pollution Risk Assessment. CEPIS Regional Program on the prevention and control of groundwater pollution, PAHO/WHO, Lima.
Foster, S., Hirata, R., Gomes, D., D’Elia, M. and Paris, M. (2002) Groundwater Quality Protection – A guide for water utilities, municipal authorities, and environmental agencies, The World Bank, Washington, DC.
Harding, R. (ed.) (1998) Environmental Decision-Making. The Federation Press, Sydney. Howard, A.G. (2002a) Water Supply Surveillance – A Reference Manual, WEDC, Loughborough
University. Howard, A.G. (2002b): Water Supply Surveillance – A Practical Guide, WEDC, Loughborough
University. Lapham, W.L., Wilde, F.D. and Koterba, M.T. (1997) Guidelines and Standard Procedures For
Studies of Groundwater Quality: Selection and installation of wells, and supporting documentation, Water Resources Investigations Report 96-4233, USGS, Reston, Virginia.
Lloyd, B. and Helmer, R. (1991) Surveillance of Drinking Water Quality in Rural Areas. Longman, London.
Nielsen, D.M. (ed) (1991) Practical Handbook of Groundwater Monitoring. Lewis Publishers, Chelsea, Michigan.
Timmerman, J.G. and Mulder, W.H. (1999) Information needs as the basis for monitoring. European Water Man., 2(2), 41-45.
UNECE (1996) Guidelines on Monitoring and Assessment of Transboundary Rivers. RIZA, Lelystad.
UNECE (2000) Guidelines on Monitoring and Assessment of Transboundary Groundwaters. RIZA, Lelystad.
WHO (1982) Rapid assessment of sources of air, water, and land pollution. World Health Organization Offset Publication, 62, 1-113.
WHO (1997) Guidelines for Drinking-water Quality, Surveillance and Control of Community Supplies. 2nd edn, vol . 3, World Health Organization, Geneva.

© 2006 World Health Organization. Protecting Groundwater for Health: Managing the Quality of Drinking-water Sources. Edited by O. Schmoll, G. Howard, J. Chilton and I. Chorus. ISBN: 1843390795. Published by IWA Publishing, London, UK.
7 Characterization of the socioeconomic, institutional and legal setting
G. Howard, P. Chave, P. Bakir and B. Hoque
Building on Chapter 5, the purpose of this chapter is to review how data may be collected on socioeconomic conditions, institutional and legal frameworks and valuing of groundwater protection that may affect groundwater protection policies and strategies. The chapter is a review of some of the tools that can be used to collect data and a short check-list is provided for readers to identify the types of information that should be collected.
7.1 DEFINING SOCIOECONOMIC STATUS How socioeconomic status is defined is important as it has implications with regard to the impact of policy on livelihoods, support provided to households to help cope with adverse economic consequences of land use restrictions, and to determine whether and what compensation may be offered to households. There are a number of different ways in which socioeconomic status can be assessed. The selection of the means of defining socioeconomic status and in particular which households are poor, depends on how such

176 Protecting Groundwater for Health
information will be used. Many countries define national ‘poverty lines’ that represent a benchmark level of income associated with poverty. This level of income would usually represent a level below which a set of basic goods and services can no longer be afforded (Satterthwaite, 1997).
In an international context, many organizations apply a measure of absolute monetary poverty, which is usually taken at being less than US$ 1 per day per capita (World Bank, 2002). In many cases, this figure is refined based on purchasing power parity (PPP) which is adjusted to the value of the dollar in 1993. The use of PPP is an attempt to reflect that costs of living as well as incomes vary between countries (World Resources Institute, 1996). The PPP uses a standard ‘shopping basket’ of goods and services and calculates how many units of the national income are required to purchase the shopping basket contents in comparison to the cost in US$ in an ‘average’ country (defined as being the average costs from all countries included in international comparisons). Gross domestic product is adjusted in light of these differential costs and typically lowers the gross domestic product of wealthy countries and raises that of poorer countries (World Resources Institute, 1996).
The numbers of people living in absolute poverty in developing countries remains high and about 1.2 billion people globally live on less than US$ 1 per day (World Bank, 2002). Another level of monetary poverty is sometimes applied to middle-income countries (e.g. in Central and Eastern Europe and Latin America) of US$ 2 per capita per day as a more meaningful description of poverty in these countries (World Bank, 2002).
Although monetary factors are important, the usefulness of absolute monetary values to describe poverty is questioned by many workers who argue that relative poverty is a better measure as it reflects the inequalities within a society. Relative poverty is often deemed to be more influential in determining access to goods and services than measures of income (Hardoy and Satterthwaite, 1989; Stephens et al., 1997).
Monetary definitions of poverty are also criticized because poverty lines are often set too low in comparison to costs of living and because they place too great an emphasis on income as a determinant of poverty (Satterthwaite, 1997). Income is often difficult to precisely gauge and security of income may be at least as important as its value in obtaining services. Furthermore, the means by which households obtain basic goods and services is often complex and is not necessarily reliant on the cash economy (Bigsten and Kayizzi-Mugerwa, 1992; Moser, 1995; Rakodi, 1995; Wratten, 1995). It should also be noted that the poverty line approach takes the view that the lack of services is primarily a consequence rather than a cause of poverty.
An alternative view on poverty is to consider it as a complex set of social and economic relationships (Moser, 1995; Satterthwaite, 1997). Such an approach defines poverty as being dependent on many factors that influence the ability of a household to access goods and services and their ability to fully participate in the society. An example of an approach defining poverty in relation to access to basic goods and services is provided by the UNDP Human Poverty Index (UNDP, 1999). This index incorporates aspects such as access to water and sanitation, education and health care services, as being a defining feature of poverty rather than simply a consequence of poverty.

Characterization of the socioeconomic, institutional and legal setting 177
Socioeconomic indices Another approach that has been used in defining socioeconomic status is through the use of indices based on a set of factors that reflect the standard of living of the household. These indices include aspects such as housing quality or numbers of people living in a dwelling (Rakodi, 1995; Satterthwaite, 1997). This information can take the form of a quantitative index based on data from a census or a qualitative assessment built upon community perceptions and utilizing a range of participatory techniques. Such approaches have been used in developed and developing countries as a mechanism to define vulnerability and disadvantage in relation to access to health care and other services (Jarman, 1984; Stephens et al., 1997). These approaches have proven effective in identifying priority areas and vulnerable populations and therefore in targeting resources at those of greatest risk (Howard, 2002).
Socioeconomic indices can be used at a variety of levels, including national, international and city/town (Townsend et al., 1992; Stephens et al., 1997). When defining these indices, it is important that the variables selected are those that are deemed to be sensitive to changes in relative wealth or status and where there is more than one condition that may be found within a country. Commonly used variables include employment type, roof material, house type and level of education. These variables may also include possession of consumable durables (such as televisions, radios, cars and bikes). It is important when selecting variables to also consider the age of data, how frequently these data will be collected and the rapidity with which ownership of a ‘variable’ by a household may change. For instance, in emerging economies the ownership of consumer durables may provide a good indication of relative wealth. However, if data on ownership of items are only collected once every five to ten years and sales of items is rapidly increasing, the inclusion of such variables within a socioeconomic index would have limited value as the data would rapidly become inaccurate.
The variables selected are typically weighted to reflect their sensitivity to socioeconomic change. Thus variables deemed to be responsive to changes in wealth are given a higher weight than those deemed to be important indicators but less sensitive to change. For example, in the application of an index in Uganda, roofing material was given a high weight and main source of livelihood a much lower weight as the former was considered to be more sensitive to changes in wealth. Within each variable a number of conditions is defined (for instance different types of roofing material) and these are allocated a score that shows the socioeconomic status that the condition represents. Commonly, negative scores are allocated to conditions indicating poverty and positive scores to conditions indicating wealth, with zero representing a medium level of socioeconomic status.
Selection of variables, their weighting and condition scores depends in large part on expert judgement. It is important to ensure that the expert judgement is drawn from a range of people and a useful method to employ is the Delphi method, which allows repeated consultation with different groups of experts building on the conclusions of each group when initiating consultation with the next group (Stephens et al., 1997).

178 Protecting Groundwater for Health
Qualitative approaches to defining poverty All the above approaches rely to a certain extent on quantitative measures of poverty and this aspect has been criticized, because it confers external judgements on the social condition of people (Chambers, 1989). As such approaches use standardized measures, which are usually determined by professionals, they allow little opportunity for communities to describe their own circumstances in relation to their needs and perceptions. As a result, there is often little depth to the description of poverty and this may limit the understanding of the problems and difficulties faced by the poor and the relative priority accorded by poor people to those problems. A consequence of this approach can be that interventions to reduce poverty do not address the underlying causes of poverty – such as lack of influence on decision-making – and therefore make at best superficial changes in socioeconomic status while delivering little fundamental community improvement.
One approach to overcoming such problems is to use more qualitative techniques to describe and identify poverty which allow greater depth to the definition of poverty and place greater emphasis on the needs and perceptions of the poor themselves in defining priorities (Wratten, 1995). Such approaches have an inherent advantage over quantitative methods as they allow the people affected by poverty to define what it means to be poor, what assets they hold that could be used to reduce poverty and what external support is required. Many poverty assessments now utilize participatory approaches, which allow much greater opportunity for those affected by poverty to directly engage in defining ways of increasing assets, reducing vulnerability and achieving more sustainable use of the natural resource base. This approach also has merit because it has a big impact on capacity building for the community through allowing:
• community identification of issues; • community identification of its own preferred approaches for addressing the
issues; • community monitoring to ensure that the approaches selected are working to
deliver the required outcomes. Such approaches have been used at national levels in poverty assessment as well as
small-scale community-orientated approaches to water resources management. However, it is likely that for large-scale water resource management strategies both quantitative and qualitative data may be required (Wratten, 1995). This approach may lead to application of quantitative data being used to identify areas where poverty is greatest or where natural resources are most vulnerable, with qualitative assessments used to define appropriate local priorities and interventions.
Livelihoods analysis Livelihoods analysis has emerged as a new paradigm for assessing the needs of communities and the impacts of interventions by considering how the members of the community ensure a sustainable livelihood. This approach provides a conceptual framework in which to understand communities and the range of assets they posses and the threats they may face in sustaining livelihoods. It therefore places community needs, capabilities and vulnerabilities into the core of understanding socioeconomic conditions.

Characterization of the socioeconomic, institutional and legal setting 179
A set of tools has been developed for undertaking analysis of livelihoods which addresses environmental sustainability as one of the core aspects. The guidance notes on livelihoods prepared by DFID (2003) provide a wide range of quantitative and qualitative tools that can be used to analyse livelihoods. Because there is a wide range of data that may be collected and for each type of data a number of different tools that can be used, they are not discussed in detail here.
Data will often be collected through participatory assessment using tools such as wealth ranking, transect walks, seasonal calendars, resource maps and a range of different methods of interview and group discussion. Data may also be collected from sample surveys looking at specific aspects of the livelihood, for instance access to water sources or economic data. Data from secondary sources (often government or NGO databases) are also often analysed and included within the overall analysis of livelihoods.
Livelihoods analysis usually involves both macro and micro-level assessments and for data to be collected on a wide range of factors that will influence livelihoods. The detail of different methods is not reviewed here as each is underpinned by an extensive literature. However, the most critical aspect of livelihoods analysis is the need to keep livelihood considerations as the primary reason as to why the data are collected, rather than the application of particular methods of data collection.
During the livelihoods analysis, and when considering the likely type and extent of pollution that can be derived from different areas, it is important to collect data on the major source of livelihood and consider the impact that this may have on groundwater. This approach would typically emerge from the assessments on environment and vulnerability, but may also draw information from other aspects, for instance assessment of social capital where governments subsidize access to agrochemicals.
Population and land tenure Information on population density allows both the need for groundwater protection to be defined and should also provide information as to what measures (if any) can be taken in particular areas. It will also help in making a case for protection of less densely populated areas by highlighting potentially negative impacts from more densely populated settlements. Overall, population growth and numbers of people relying on groundwater also help in shaping a policy and strategy that meets long and short-term needs. Population density is relatively easy to calculate when reliable census and cadastral data are available. Alternatively, qualitative estimates based on ranking may also be used.
The degree to which land tenure systems confer rights over the ownership of groundwater resources should be established. In many countries, ownership of land confers rights to exploit resources on or underlying the land, although this may be limited with regard to how much resource may be removed, over what time period and to within what depth below the ground surface automatic rights to abstract extend. In many other countries, ownership of land does not confer automatic rights to exploit resources underlying the surface and any resource, including groundwater, is under public ownership and exploitation is a public rather than private decision. The nature of rights to exploit resources underground will influence how effectively protection strategies can be implemented. This last point is important as rights are increasingly being unpacked from a piece of land and are now being assigned to aspects such as biodiversity, the land itself,

180 Protecting Groundwater for Health
water, other resources, erosion credits, salinity credits. All these factors are recognized as having a significant impact on water quality and quantity and environmental integrity.
Assessing the nature and security of land tenure will help determine what approaches and incentives will need to be available for different communities and may help in directing the overall approach to groundwater resource management. Much of this information would emerge in an analysis of livelihoods as tenure systems will have important asset and vulnerability implications.
7.2 INSTITUTIONAL AND STAKEHOLDER ANALYSIS When characterizing current capacity and future development of groundwater protection the different institutions and stakeholders, their roles and responsibilities should all be identified and reviewed. This approach would typically be undertaken through a stakeholder analysis that attempts to identify all those organizations, agencies and departments (governmental and non-governmental) that have an interest in the use, management or protection of the groundwater resource. A key element of this process is to assess whether the current institutional responsibilities are supportive of the development of effective institutional arrangements.
A common problem is that institutional responsibilities are highly fragmented with multiple organizations taking some responsibility for either provision of services or control of groundwater. These responsibilities commonly overlap, have inherent internal conflicts of interest and frequent inter-institutional conflicts. Therefore, a key component for the institutional analysis is to define what roles different organizations play, the degree to which these are consistent both with their internal and external environment and what rationalizations are required to make institutional relationships more effective. For example, a process for achieving integrated water cycle management has been developed in New South Wales, Australia. Integrated water cycle management has been particularly successful as it includes key government agency and community stakeholder workshops at the beginning and throughout the study process. This approach ensures that the agencies are not only cognisant of the issues pertinent to the study area, and therefore impacts on the water resource(s), but also that the acts, policies, regulations and issues which are administered by the agencies are made transparent and accommodated as part of the integrated approach (Schneider et al., 2003).
This process supports the identification of the appropriate institution to lead groundwater protection and to outline its relations with other institutions and stakeholders. It also helps to define what further strengthening and capacity building is required in order to support the lead institution to develop and implement an effective groundwater protection strategy.
A review should also be undertaken of the roles, responsibilities and interests in water safety of external stakeholders. This should address statutory roles, all aspects of regulation (financial, safety, environment), involvement in capital and operational investment, roles in specific circumstances (for instance epidemics) and interest groups. For each stakeholder, the relative influence each has over policy, investment, regulation and operations should be noted as a means of identifying how each stakeholder interacts with the supplier. In undertaking this exercise, it is important to identify all stakeholders

Characterization of the socioeconomic, institutional and legal setting 181
and not solely concentrate on those deemed powerful or influential. For instance, consumers may not be powerful, but are the most important stakeholders.
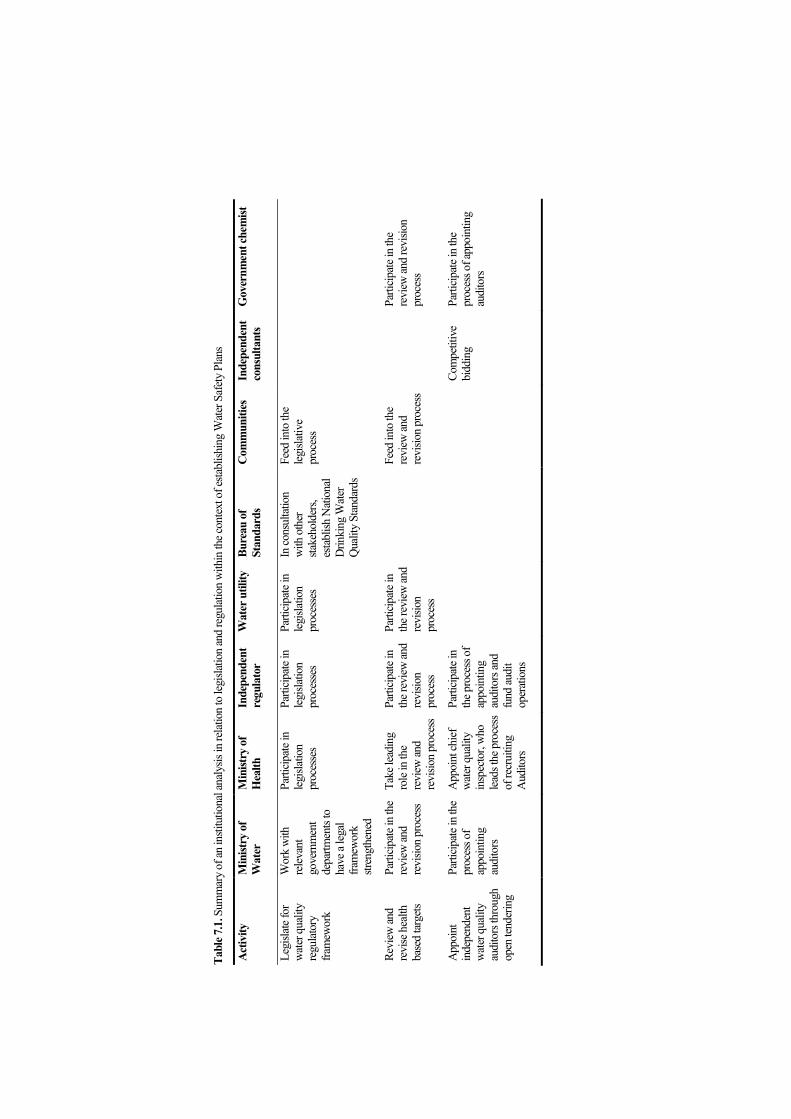
Developing a matrix as a result of the institutional analysis is a useful mechanism to summarize the data and to gain a clear idea of which organizations are responsible to different activities. Table 7.1 provides a summary of an institutional analysis in relation to legislation and regulation for establishing WSPs.
7.2.1 The government environment Government departments and agencies have a key role to play in the development of groundwater management strategies as they usually develop policy and strategic plans. It is important that both national and local government roles are analysed as both may exert significant influence on the actual implementation of any groundwater strategy.
The policy environment within which each institution operates should be analysed and the mandate and jurisdiction that each holds should be identified and clearly defined. Key questions at this stage include:
• What level of autonomy does each institution have? • What level of decision-making are they invested with? • To what degree do they have to refer to other institutions in order to implement
their plans and strategies? • Do they control their own budgets? • What proportion of this budget derives from local and what proportion from
national grants? These questions help define the relative influence of each institution in the practical
application of the policy framework into definable strategies on the ground. For instance, if a department is largely autonomous with its own funding base, it tends to have a significant influence on how policy is translated into action. By contrast, weak departments that have limited autonomy and little budgetary control are likely to have little direct influence on actions related to policy.
It is important to assess whether there are overlapping institutional responsibilities between several government departments and levels of government. It is not uncommon to find that several national government departments have some mandate on the development of groundwater or land use for different purposes and have different policy objectives on which they have to act. Rationalizing the institutional responsibilities is often the critical first step in developing sustainable groundwater management policies and strategies. Resistance to change and responsibility is common. Potential conflicts between different institutions should be identified and addressed from the outset.
Tabl
e 7.1
. Sum
mar
y of
an in
stitu
tiona
l ana
lysis
in re
latio
n to
legi
slatio
n an
d re
gulat
ion
with
in th
e con
text
of e
stabl
ishin
g W
ater S
afety
Plan
s
Act
ivity
M
inist
ry o
f W
ater
M
inist
ry o
f H
ealth
In
depe
nden
t re
gula
tor
Wat
er u
tility
Bu
reau
of
Stan
dard
s C
omm
uniti
es
Inde
pend
ent
cons
ulta
nts
Gov
ernm
ent c
hem
ist
Legi
slate
for
wat
er q
ualit
y re
gulat
ory
fram
ewor
k
Wor
k w
ith
relev
ant
gove
rnm
ent
depa
rtmen
ts to
ha
ve a
lega
l fra
mew
ork
stren
gthe
ned
Parti
cipate
in
legisl
ation
pr
oces
ses
Parti
cipate
in
legisl
ation
pr
oces
ses
Parti
cipate
in
legisl
ation
pr
oces
ses
Feed
into
the
legisl
ative
pr
oces
s
Revi
ew an
d re
vise
hea
lth
base
d tar
gets
Parti
cipate
in th
e re
view
and
revi
sion
proc
ess
Take
lead
ing
role
in th
e re
view
and
revi
sion
proc
ess
Parti
cipate
in
the r
evie
w an
d re
visio
n pr
oces
s
Parti
cipate
in
the r
evie
w an
d re
visio
n pr
oces
s
In co
nsul
tatio
n w
ith o
ther
sta
keho
lder
s, es
tablis
h N
ation
al D
rinki
ng W
ater
Qua
lity
Stan
dard
s
Feed
into
the
revi
ew an
d re
visio
n pr
oces
s
Pa
rticip
ate in
the
revi
ew an
d re
visio
n pr
oces
s
App
oint
in
depe
nden
t w
ater
qua
lity
audi
tors
thro
ugh
open
tend
erin
g
Parti
cipate
in th
e pr
oces
s of
appo
intin
g au
dito
rs
App
oint
chie
f w
ater
qua
lity
insp
ecto
r, w
ho
leads
the p
roce
ss
of re
crui
ting
Aud
itors
Parti
cipate
in
the p
roce
ss o
f ap
poin
ting
audi
tors
and
fund
audi
t op
erati
ons
Co
mpe
titiv
e bi
ddin
g Pa
rticip
ate in
the
proc
ess o
f app
oint
ing
audi
tors

Act
ivity
M
inist
ry o
f W
ater
M
inist
ry o
f H
ealth
In
depe
nden
t re
gula
tor
Wat
er u
tility
Bu
reau
of
Stan
dard
s C
omm
uniti
es
Inde
pend
ent
cons
ulta
nts
Gov
ernm
ent c
hem
ist
Regu
lar
insp
ectio
n of
ut
ility
labs
and
othe
r fac
ilitie
s
Pr
ovid
e pe
rsonn
el su
ppor
t for
in
spec
tion
Rece
ive
repo
rts
Ava
il fa
ciliti
es
for i
nspe
ction
Ca
rry o
ut
insp
ectio
n
Regu
lar re
view
of
WSP
s
Prov
ide
man
pow
er
supp
ort f
or
insp
ectio
n
Rece
ive
repo
rts
Pres
ent W
SPs
Pa
rticip
ate in
re
view
pro
cess
Le
ad ro
le in
re
view
pro
cess
Stre
ngth
en th
e na
tiona
l sys
tem
datab
ase
Prov
ide
histo
rical
data
Prov
ide
histo
rical
data
an
d pa
rticip
ate
in p
roce
ss
Rece
ive w
ater
qu
ality
m
anag
emen
t in
form
atio
n
Prov
ide w
ater
qu
ality
m
onito
ring
and
surv
eillan
ce
data
Rece
ive,
analy
se an
d pr
oces
s dat
a
Regu
lar sy
stem
au
dits
Pr
ovid
e man
-po
wer
supp
ort
for a
udits
Rece
ive
repo
rts an
d se
nd o
ut fe
ed
back
Rece
ive
feed
back
Rece
ive
feed
back
Ca
rry o
ut au
dits
Carry
out
inde
pend
ent s
ampl
e ana
lysis

184 Protecting Groundwater for Health
7.2.2 The non-governmental sector NGOs include farmers groups, industry groups, Chambers of Commerce and environmental groups that have a stake in groundwater management and use. It is important to identify these players, review their potential contribution to the development of groundwater policy and collect their views on the need for groundwater management. This is important information which feeds into the policy development framework.
When assessing the current and potential roles of the non-government sector, it is important to understand whose views each organization represents, the role the organization has in civic society and the influence the organization exerts on policy and public opinion.
7.2.3 Governance The style and means by which decisions are actually made are important considerations within a review of institutional, policy and legal frameworks. The degree to which outlined processes of decision-making and enforcement of legislation are followed by the institutions responsible ultimately determines whether these processes are effective. It is therefore important to evaluate the decision-making process when undertaking a situation analysis.
Evaluating governance can be politically sensitive, although this should not prevent it being undertaken. The key aspect of assessing governance is to determine to what extent requirements under existing legislation are met and whether procedures and criteria for decision-making are documented and followed. This assessment can be done by reviewing acts, policies and operating procedures to assess what should be done, and through consultation with key stakeholders to obtain their perceptions of how processes are followed. Where appropriate, case law may also be reviewed.
Consultation with key stakeholders can be undertaken using a range of techniques, including in-depth interviews, focus-group discussions and semi-structured interviews. In undertaking consultation on these issues, it is important to ensure that all stakeholder groups are included. It is important to avoid potential bias in the findings of such exercises by only concentrating on particular groups that may have an unrepresentatively negative or positive view. Important stakeholder groups will include Government agencies with executive and policy functions for the environment and groundwater, local government, pressure and consumer groups, agriculture and potential polluters. Within these groups it is also important to obtain copies of relevant reports and assessments of the implementation of protection laws and regulations, as this may provide a clear idea of the overall performance.
The review of enforcement actions and results of cases brought to prosecution is also important in determining the extent to which procedures and processes are being followed. This review will require some kind of value judgement being made on whether these (in terms of both quantity and content) constitute showing good governance or whether they indicate a failure in governance and unacceptable circumventing of procedures. Assessing the seriousness of single deviations and the accumulated deviances from documented procedure are likely to be included.

Characterization of the socioeconomic, institutional and legal setting 185
7.3 MANAGING STAKEHOLDER DISCUSSIONS – LEVELLING THE PLAYING FIELD
It is important to ensure that all relevant stakeholders are able to participate in the development process: ‘different stakeholders have different levels of power, different interests, and different resources. Arrangements are needed to “level the playing field” and enable different stakeholders to interact on an equitable and genuinely collaborative basis’ (World Bank, 1996).
Most activities involving groundwater protection involve some technical aspects – assessment, design, construction and/or operation and maintenance. Public participation needs to be co-ordinated with the technical aspects. In addition, the technical aspects need to be carried out professionally and efficiently otherwise the public participation will not ensure mutual trust and support between stakeholders. Although proponents of public participation often blame project failure on the fact that a community was not consulted, there are many cases where failure is due to faulty design of technical aspects. There is no faster way to kill stakeholder support for a project than to include them in all the planning, design, etc., and then to find that the actual design is faulty.
Public participation takes place in all countries of the world, in some form or another. The level of participation varies from country to country, project to project, but many of the lessons learned remain the same. In developing countries, the participating hygiene and sanitation transformation (PHAST) approach has been used as a methodology of participatory learning, which builds on people’s innate ability to address and resolve their own problems. PHAST was developed specifically to help communities manage their water supplies and control sanitation-related diseases. Examples of how this has been used to promote source protection is given in Box 7.1.
7.4 DEVELOPING PUBLIC PARTICIPATION Human settlements are made up of communities and within each community, a number of social structures may be found which represent the interests of the community as it deals with the external world. Whilst community structures and participation are often discussed in the context of developing countries, similar structures often exist in developed countries and in both cases existing community organizations should be incorporated within an assessment of the socioeconomic factors of importance for groundwater protection.
Public participation is useful in improving the outcomes of strategy development, even if it comes too little or too late. However, the ideal scenario is for stakeholders to be included right from the start of project conceptualization and planning. Better yet, the idea comes from the stakeholders themselves, with the role of the outsiders being only one of advisors and catalysts to assist the process.

186 Protecting Groundwater for Health
Box 7.1. PHAST and the children of Dhlabane (based on Breslin, 2000)
Dhlabane is an isolated community in rural KwaZulu/Natal with limited water supply options. Half of Dhlabane is serviced by a reticulated water system while the other half relies on unprotected springs. A series of water quality tests was administered and analysed by children at a local secondary school. The results suggested that water quality was poor at all collection points in the community. Children participated in a range of PHAST exercises that helped them clarify the links between poor water quality and health using a sorting exercise with pictures that depicted activities that could be interpreted as either beneficial or detrimental to water source protection. Children suggested that factors contributing to poor water quality in Dhlabane were:
- open-field defecation near community water sources; - poor animal management near community water sources; - poor waste disposal practices; - infrequent hand washing.
Children were then introduced to a planning exercise story with a gap. The first picture depicted a community with poor water quality, while the second picture was of a community that enjoyed access to clean water supplies. Children were asked how Dhlabane could move to the improved situation depicted.
The children then developed a water quality plan for Dhlabane. They decided to protect a spring that was servicing the school. They developed a plan showing where the pipes would go, what they would feed into, and how the spring could be protected from human and animal contamination. They suggested that Dhlabane residents should provide the labour, but that help was required to fine-tune the design.
The spring was constructed under the supervision and guidance of a local engineering firm that was active in the area and also had invested into child-to-child programmes in the area. The children’s model was followed, although some technical modifications were made. Through the process, the children not only took on responsibility for their water quality, but also managed the process of change in their village.
A fence was put up to protect the spring from contamination (as suggested by the children), and students continue to monitor water quality at the source as part of a school course. Results to date have suggested that water quality has been improved and sustained. The children have also developed plays highlighting the linkages between water quality and poor health, which has also raised awareness..
The earlier that stakeholders are involved, the greater chance that they will support
changes and be active partners in the process. There is a recognized sequence towards successful community participation as set out below (Oakley, 1989):
(1) Initial contact by change-agents; participant observation and assessment by change-agent.

Characterization of the socioeconomic, institutional and legal setting 187
(2) Group identification and analysis of problems. (3) Development and strengthening of community structures; emergence of
appropriate organizations, identification of local cadres. (4) Widespread community awareness of causes of problems; awareness of
community ability to resolve problems. (5) Leadership training, briefing, community education. (6) Concrete group action; programme management. (7) Networking; making outside contacts; building alliances. (8) Self-evaluation; adjusting strategies; expansion. (9) Stabilization; autonomy; functioning alone.
There is no magic formula for the process of participation, and many good references
are available which describe the various techniques and examples (Narayan, 1993; Nagy et al., 1994; Yacoob and Whiteford, 1995; World Bank, 1996). The most important aspect of participation is establishing open dialogue and mutual trust, which can only be achieved by understanding the current level of knowledge, attitudes and practices of the various stakeholders. The US EPA has developed seven rules for successful communication with the public concerning groundwater contamination, shown in Box 7.2.
Box 7.2. Seven cardinal rules for communication on groundwater
contamination (based on Chun and Den, 1999)
1. Accept and involve the public as a legitimate partner in the issue
2. Plan carefully and evaluate your performance as a communicaton
3. Listen to the public’s feelings (active listening)
4. Be honest, open, frank, kind and respectful
5. Coordinate and collaborate with other credible sources
6. Meet the needs of the media
7. Speak clearly with compassion
In developing a communication plan and information needs, the example of the
WaterCOM approach, developed for use in water and wastewater projects, can be used (Chemonics International, 2000). Key organizations, groups and individuals are identified and analysed in terms of their potential roles in policy formulation, policy implementation, management of water resources and actual implementation of water, wastewater and/or irrigation projects. These groups cover all levels, from the individual citizen to the top policy makers. Once these groups and individuals are identified, three types of communication flow are established:
• UP from water users to policy makers and senior managers, e.g. on needs, willingness to pay for services, willingness to support water conservation and pollution prevention policies.
• DOWN from policy makers and senior managers to water users, e.g. explanation of a situation and scale of the water shortage problem, technical

188 Protecting Groundwater for Health
considerations, government priorities for assistance to different areas, input needed from the users.
• ACROSS between groups, e.g. between Ministries of Agriculture and Water, NGOs and government, technical groups and NGOs. Communication between government ministries needs to take place to reduce confusion and conflicts, which can lead to distrust in government and therefore lack of support for water conservation and pollution prevention programmes.
Once established, these communication links are used throughout a project to continue dialogue and fulfilment of commitments made by government and other service agencies.
7.5 ANALYSIS OF LAND USE AND GROUNDWATER USE FOR POLICY DEVELOPMENT
In the development of policies, the core elements in groundwater management are the functions and uses of the groundwater, the problems and threats to it, and the impact of possible measures that are proposed to deal with the problems (UNECE, 2000; Schneider et al., 2003). Measures can include investigations, risk analysis, remediation, control of polluting activities or land uses. When developing management strategies the following need to be identified:
• the boundaries of the aquifers and their relation to surface waters and associated ecosystems (Chapter 8);
• human uses (Chapters 9-13) and ecological functions of the groundwaters; • pressures which have an impact on the uses; • management targets which can be implemented within a specified timescale.
Some functions have an impact on other important functions, which may not be directly related to health or to groundwater, but which must be taken into account when protection policies are being developed because they affect the success of protection measures. For example, cultural or legal problems may be barriers to the use of some possible protective measures and these must be recognized at the outset. However, if it can be shown that the chosen control measure ensures the best use of the resource, can minimize extractions from the environment and is best suited to the community for which it is intended, then it is not out of the question to lobby for changes in statutory or other potentially limiting barriers connected (with the appropriate controls) to the reticulated supply.
If land use planning and management is to be an effective tool for groundwater protection, a good understanding of the distribution and quality of the groundwater resource is necessary. Effective land use management means that sufficient investigations should be undertaken to define groundwater flow patterns and interactions between aquifers, identify recharge and discharge areas and recognize spatial variations in groundwater quality (see Chapter 8). Vulnerability mapping will identify areas that are particularly susceptible to contamination (see Chapter 8). Modelling techniques can be used to predict the movement of contaminants in aquifers, estimate the impact of land use changes in drinking-water catchments, and predict the effects of particular types of developments on groundwater quality. Models can also help define the maximum

Characterization of the socioeconomic, institutional and legal setting 189
density of particular types of development compatible with specific groundwater quality objectives.
It is important in this context that spatial variations in groundwater quality, both those caused by natural processes and those caused by existing land use, are identified. Information is also required about the distribution of land use and its impact on groundwater quality. Some of this information is common to all uses and can be obtained from studies carried out elsewhere. However, there are often local peculiarities in climate, hydrogeology or in the way a particular activity is undertaken that will require site-specific investigations (see Chapters 9-13). Local problems can be obscured by scale, so detailed information is often required (Rudnitski, 1998). Moreover, it is not only present economic activities that affect the environment, and so as well as information about the distribution of existing land uses, information about the distribution of past uses that may have affected groundwater quality should also be investigated if it has not been recorded. Also intrinsic to water resource use is the changing consumption patterns and growth of the community and how this will impact on the resource base. Not only does information need to be gathered on community demographics and growth, but also on system analysis including factors such as unaccounted for water (system leakages) and where water can be accessed from other sources, such as rainwater, storm water and effluent, to supplement the potable water supply. Knowing how water can be best targeted for its intended use can facilitate the sustainable use of the community’s and the environment’s water resources.
7.5.1 Importance of groundwater for domestic supply One of the major issues to be addressed when developing groundwater protection strategies is the level of groundwater use within the country, to what types of use groundwater is put and the long-term strategies for groundwater development within the country. In industrialized countries, use of groundwater is often easy to calculate as access to domestic water supply direct to the homes of the population is effectively universal and the proportion of this water that is derived from groundwater is then easily calculated. A similar situation would also be true for agricultural use of groundwater. However, in some countries, a lack of knowledge of water resources has resulted in over allocation of licences and this fact may cause problems in terms not only of the resource itself but also in terms of compensation as water licences may need to be bought back by the state.
In developing countries, the use of groundwater is likely to be more difficult to accurately calculate. Access to water supplies piped to the home may be restricted to a relatively small proportion of the population, such as the wealthy elite. The remaining population must develop a variety of different strategies to secure a water supply (Howard, 2002). In some countries, people who lack access to a water supply piped to the home will use communal sources, such as public taps or small groundwater sources such as protected springs, tubewells and dug wells (Gelinas et al., 1996; Rahman, 1996; Howard et al., 1999). Levels of use of such supplies may be significant, for instance in Kampala, the capital city of Uganda, it was estimated that protected springs were used for part or all of the domestic water collection by over 60 per cent of poor households

190 Protecting Groundwater for Health
living in areas where springs were found. In a town in the east of the country, this figure went up to over 70 per cent. However in both cases it was noted that most households used several water sources (Howard et al., 2002).
In other countries, whilst multiple source use may be common, the use of water from particular sources may be restricted to specific uses, based on the perception of the users on the quality of that water (Madanat and Humplick, 1993). As the protection of groundwater should take into account the use for which the water is intended, it is therefore important to understand water use patterns. This requires a water usage study to be undertaken in at least a sample of communities in order to understand the importance of groundwater.
7.5.2 Private supplies In many countries, a significant proportion of the population will construct a private water supply and these are often shallow tubewells or dug wells. These are found in both developed and developing countries and the quality of the water and its surveillance are often unsatisfactory. Where access to piped water supply is limited, the total number of private supplies may be very high and greatly exceed the number of public supplies.
For example, in many large Asian cities by far the majority of the wells and boreholes sunk are owned by individuals and thus any estimated use of groundwater would need to take private as well as public tubewells into account. Private supplies are often not adequately controlled. In a number of large cities (e.g. Bangkok, Jakarta, Manila and Dhaka) there are very large numbers of shallow private wells that are largely uncontrolled and unlicensed, are poorly constructed and are rarely monitored (Foster and Lawrence, 1995). When assessments of quality are made, these often indicate poor and deteriorating quality of the water and increasing health risks. In these situations, control of licensed large water supplies operated by utilities or municipalities is of limited benefit if the private supplies are not also adequately controlled (Foster and Lawrence, 1995).
Similar situations are also found in rural areas and the lack of information and control of such small private supplies represents a more significant challenge to the protection of groundwater than where exploitation is through a relatively small number of high volume production sources. It is important to identify the numbers and location of private wells and to map these in relation to public supplies and to centres of population. It is also important to establish some programme of monitoring of these supplies and what response will be made to evidence of poor quality.
The use of private supplies is also widespread in rural areas in Europe, North America, Australia and New Zealand and in many cases the quality of such supplies is problematic. Quality problems include microbial and chemical hazards and control of the quality of such supplies still represents a significant challenge in many countries. In parts of Central and Eastern Europe, there have been very large increases in the numbers of private water supplies since the early 1990s, at a time when the ability of national and local authorities to monitor and advise owners on improvements has declined.
In developing a response to identified contamination, the likely importance of private wells providing a route for contamination of the wider aquifer, thus potentially affecting public supplies, should be considered as there is evidence in some situations of this

Characterization of the socioeconomic, institutional and legal setting 191
causing significant quality problems (Rojas et al., 1995). There may therefore be a case for closure of existing private wells and/or prohibiting development of new wells as a means of protecting the public supply. However, such approaches are only feasible if viable alternative supplies are provided to the population: simply prohibiting private supplies in situations where the public supply is inadequate will not be effective and would be likely to lead to greater public health risks. Furthermore, prohibition of such sources (particularly in rural areas) is unlikely to be fully effective and will be expensive and complicated to enforce.
7.5.3 Long-term sector plans Long-term water supply development plans are also important to consider. In particular it is important to collect information on how shallow and deep groundwater will be developed in the long term. For instance, some contamination of shallow groundwaters may be tolerated if the long-term plan is a water supply based on deeper groundwater or surface water. In the case of deeper groundwater, however, the degree of hydraulic continuity between shallow and deep groundwater should be taken into consideration. This will help to avoid the creation of a long-term resource quality problem that will not be easy to resolve.
When collecting information for a situational analysis, it is important to determine what economic and social values should be placed upon the groundwater taking into account the issues raised above. In Chapter 17 examples are provided of how groundwater protection strategies can take into account the economic value placed upon groundwater through practical measures.
7.6 VALUING GROUNDWATER PROTECTION Valuing of groundwater and estimating the costs of protection measures must take into account several factors in order to gain a clear understanding of the comparative costs of different levels and methods of protection that can be applied. This should address whether it is more effective to purchase land in the drinking-water catchment or whether changes in existing land users’ practice is more effective. The purchase of the land in the catchment will represent a large single capital payment, which can either be recovered or written off (depending on the nature of body purchasing the land and their accounting obligations) or defrayed over several years. Where the approach is to change existing land use, costs will be incurred on an annual basis if compensation is provided to land users. In some cases this may be covered in land rents charged for the use of the land, but where this is not covered the incremental costs must be either absorbed into the overall costs of water production or written off. Where these costs are incorporated into the water production costs they will typically be passed, at least in part, to the consumers of the water produced.
The protection of groundwater will usually incur some costs to the public through taxation, water tariffs or costs of goods that would otherwise have been produced on the land where activities are to be controlled. Therefore, it is important that there is consultation with the public to develop a coherent overview regarding their willingness

192 Protecting Groundwater for Health
to pay for groundwater protection. Willingness to pay may be critical in defining what level of protection will be implemented.
Willingness to pay for environmental improvements is often undertaken through the use of contingent valuation methodologies (CVM) (Mitchell and Carson, 1989; McGranahan et al., 1997). In CVM, an attempt is made to provide a monetary value to non-financial resources or public goods and to elicit from participants what they would pay for environmental improvements or protection. CVM were originally applied in the 1960s but were only later more widely used in the evaluation of the willingness to pay for public goods. This has included increasing application within environmental improvements in and provision of services such as water supply (Briscoe and Garn, 1995; McGranahan et al., 1997; Wedgewood and Sansom, 2003).
There are a number of different approaches to using CVM, but common to all is that participants are asked to state a value they would be willing to pay for a (as yet) hypothetical level of protection or service (Wedgewood and Sansom, 2003). Some approaches present participants with a specified amount for a public good and they find out whether the participant would be willing to pay that sum for the good. This is a relatively simplistic approach and may have limited value for groundwater protection, where it may be more important to provide participants with a broader range of levels of protection and costs in order to determine the optimum willingness to pay. More sophisticated CVM approaches involve bidding games which allow the researcher to raise the stakes in terms of costs and in levels of protection as a means of identifying both the upper limits of willingness to pay and the limits of protection desired. The advantage of bidding games is that it allows much greater flexibility in the options that can be offered to participants and an iterative approach can be used to define optimum interventions matched against willingness to pay. However, it is more complex to analyse as different participants will identify different levels of willingness to pay.
Some other approaches to CVM try to establish lower and upper limits of willingness to pay, which may utilize bidding game processes or may simply ask people to state the least and most they would be willing to pay for groundwater protection. The specific methods are not detailed here and the choice of method will be determined by the range of options available, resource to undertake studies and the participation of the public.
CVM studies may also be subject to a variety of biases and these must be addressed during the design stage. Wedgewood and Sansom (2003) note that these include:
• bias introduced by participants deliberately under-stating their willingness to pay as they perceive that this may deliver lower-cost solutions (strategic bias);
• bias introduced because the participants do not understand or believe the hypothetical scenarios (hypothetical bias);
• bias introduced because there is insufficient quantity and/or quality of information (information bias);
• bias introduced because the starting point in relation to the costs is excessively high or low (starting point bias);
• bias introduced by the interviewer or because the respondent attempts to guess the ‘right’ answer (interviewer/compliance bias);
• bias introduced by the nature of payment method (payment method bias).

Characterization of the socioeconomic, institutional and legal setting 193
All these biases may be overcome through good design, but their potential should not be ignored. In addition to potential for bias in the results, a sound statistical basis for the survey design is preferred. This can use a range of techniques, from simple random sampling to cluster sampling, with the technique being determined by the size, distribution and nature of the population being studied and the degree to which these have common traits among sub-groups.
7.7 CHECKLIST
NOTE The following checklist outlines the information needed for characterizing the socioeconomic, institutional and legal setting in the drinking-water catchment area. It is neither complete nor designed as a template for direct use and needs to be adapted for local conditions.
What are the socioeconomic issues in the drinking-water catchment area?
Analyse socioeconomic status in regions or communities in areas likely to be affected by groundwater protection strategies
Check whether there are particular groups that are poor or vulnerable: where are such groups found and will they be further disadvantaged by the groundwater protection strategy?
Identify main sources of livelihood in protected areas Assess economic impact of protection measures on livelihood in
protected areas Check compensation requirements in protected areas: costs and
compensation delivery mechanisms Compile information on the population residing in protected areas and
density of population Evaluate short and long-term projected demands for water for drinking
and for other sectors …
What is the level of service provision in the drinking-water catchment area?
Estimate the proportion of the population currently having access to public water supplies (divide this into categories based on source type, service level, functional status and use of sources by population)
Compile information on the number of private supplies present: where are they found and what type of technology is used?
Assess the condition and quality of private supplies

194 Protecting Groundwater for Health
Check whether plans exist for future development of groundwater for drinking and domestic supply
…
What are the community characteristics in relation to participation and consultation in the drinking-water catchment area?
Identify the type of communities living in protected areas: rural, peri-urban, urban
Estimate the number of communities living in the protected areas Evaluate social structures existing in the communities and tradition of
community management of resources Analyse experience and demand for public participation in the
country/region Check consultation methods commonly used (will these provide the
information required?) …
What are the land tenure and property rights in the drinking-water catchment area?
Identify ownership of groundwater and rights of exploitation for land owners
Estimate number of private land-owners in protected areas Estimate proportion of land under customary ownership in protected
areas Estimate proportion of land publicly owned in protected areas Compile information on number, size and type of informal settlements in
protected areas …
What is the basis for valuing and costing groundwater protection measures?
Estimate economic value of groundwater resources Evaluate social and cultural values of groundwater resources Estimate costs of protection strategies Assess current water charges and increases likely to result from protection
measures Check for subsidies currently applied to any users of groundwater Identify particular political constraints to cost-recovery …

Characterization of the socioeconomic, institutional and legal setting 195
What are the institutional structures and needs in the drinking-water catchment area?
Identify government bodies involved in water resources management Identify government bodies responsible for development of groundwater Identify government bodies responsible for protection of groundwater Identify government bodies that govern activities that may pollute
groundwater Identify departments having the strongest claim for a groundwater
protection mandate Assess how rationalizations will be made to the institutional framework Identify NGOs or community groups having an interest in groundwater Assess NGOs’ opinion and influences they exert …
Documentation and visualization of information on the socioeconomic and institutional setting.
Compile summarizing report and consolidate information from checklist points above
Map population and settlement structure as well as water supply service structure (use GIS if possible)
…
7.8 REFERENCES Bigsten, A. and Kayizzi-Mugerwa, S. (1992) Adaptation and distress in the urban economy: a study
of Kampala households. World Dev., 20(10), 1423-1441. Breslin, E.D. (2000) Protecting drinking water: water quality testing and PHAST in South Africa.
In Water, Sanitation and Health, (eds. I. Chorus, U. Ringelband, G. Schlag and O. Schmoll), pp. 89-93, IWA, London.
Briscoe, J. and Garn, H.A. (1995) Financing water supply and sanitation under Agenda 21. Natural Resour. Forum, 19(1), 59-70.
Chambers, R. (1989) Editorial introduction: vulnerability, coping and policy. IDS Bull., 20(2), 1-7. Chemonics International web site 2000. WaterCOM. www.chemonics.com (accessed April 29,
2005). Chun, A. and Den, A.R. (1999) A key to decision making: a challenging workshop on how to
communicate, listen and work with our public. In Presenter's Manual for: Superfund Risk Assessment and How You Can Help. http://www.epa.gov/oswer/ riskassessment/pdf/vdmanual.pdf (accessed August 11, 2005).
DFID (2003) Sustainable Livelihoods Guidance Sheets. www.livelihoods.org (accessed April 29, 2005).
Foster, S.S.D. and Lawrence, A.R. (1995) Groundwater quality in Asia: an overview of trends and concerns. UN-ESCAP Water Resour. J. Series C, 184, 97-110.
Gelinas, Y., Randall, H., Robidoux, L. and Schmit, J-P. (1996) Well water survey in two districts of Conakry (republic of Guinea) and comparison with the piped city water. Water Resour., 30(9), 2017-2026.

196 Protecting Groundwater for Health
Hardoy, J.E. and Satterthwaite, D. (1989) Squatter Citizen: Life in the Urban Third World, Earthscan Publications, London.
Howard, G. (ed) (2002) Water Supply Surveillance – A Reference Manual, WEDC, Loughborough University.
Howard, G., Bartram, J.K. and Luyima, P.G. (1999) Small water supplies in urban areas of developing countries. In Providing Safe Drinking Water in Small Systems: Technology, operations and economics, (eds. J.A. Cotruvo, G.F. Craun and N. Hearne), pp. 83-93, Lewis Publishers, Washington DC.
Howard, G., Teuton, J., Luyima, P. and Odongo, R. (2002) Water usage patterns in low-income urban communities in Uganda: implications for surveillance. Internat. J. Environ. Health Res., 12(1), 63-73.
Jarman, B. (1984) Underprivileged areas: validation and distribution of scores. BMJ, 289, 1587-1592.
Madanat, S. and Humplick, F. (1993) A model of household choice of water supply systems in developing countries. Water Resour. Res., 29(5), 1353-1358.
McGranahan, G., Leitman, J. and Surjadi, C. (1997) Understanding Environmental Problems in Disadvantaged Neighbourhoods: Broad spectrum surveys, participatory appraisal and contingent valuation, Urban Management Programme Working Paper 16 Stockholm Environment Institute, Stockholm.
Mitchell, R.C. and Carson, R.T. (1989) Using Surveys to Value Public Goods: The contingent valuation method, Resources for the Future, Washington, DC.
Moser, C.O.N. (1995) Urban social policy and poverty reduction. Environ. and Urbanization, 7(1), 159-171.
Nagy, M.T., Bowman, M., Dusik, J., Jendroska, J., Stec, S., van der Zwiep, K. and Zlinsky, J. (eds) (1994) Manual on Public Participation in Environmental Decision making: Current Practice and Future Possibilities in Central and Eastern Europe, REC, Budapest.
Narayan, D. (1993) Participatory evaluation: tools for managing change in water and sanitation. The World Bank, Washington, DC.
Oakley, P. (1989) Community Involvement in Health Development: An Examination of Critical Issues. World Health Organization, Geneva.
Rahman, A. (1996) Groundwater as source of contamination for water supply in rapidly growing megacities of Asia: Case of Karachi, Pakistan. Water Sci. Technol., 34(7-8), 285-292.
Rakodi, C. (1995) Poverty lines or household strategies? A review of conceptual issues in the study of urban poverty. Habitat Internat., 19(4), 407-426.
Rojas, R., Howard, G. and Bartram, J. (1995) Groundwater quality and water supply in Lima, Peru. In Groundwater Quality, AGID Report No. 16, (eds. H. Nash and G.J.H. McCall), pp. 159-167, Chapman and Hall, London.
Rudnitski, K. (1998) Land Use Planning For Sustainable Groundwater Management in the Port Perry Region, Problems in Land Resource Science. University of Guelph, Guelph, Ontario.
Satterthwaite, D. (1997) Urban poverty: reconsidering its scale and nature. IDS Bull., 28(2), 9-23. Schneider, P., Davison, A.D., Langdon, A., Freeman, G., Essery, C., Beatty, R. and Toop, P. (2003)
Integrated water cycle planning for NSW towns. Water Sci. Technol., 47(7-8), 87-94. Stephens, C., Akerman, M., Avle, S., Maia, P.B., Campanario, P., Doe, B. and Tetteh, D. (1997)
Urban equity and urban health: using existing data to understand inequalities in health and environment in Accra, Ghana and Sao Paulo, Brazil. Environ. and Urbanisation, 9(1), 181-202.
Townsend, P., Whitehead, M. and Davidson, N. (1992) Inequalities in Health. Penguin Books, Harmondsworth.
UNDP (1999) Human Development Report 1999, Oxford University Press, New York. UNECE (2000) Guidelines on Monitoring and Assessment of Transboundary Groundwaters,
RIZA, Inst for Inland Water Management and Wastewater Treatment, United Nations Economic Commission for Europe Task Force for Monitoring and Assessment, Lelystad.

Characterization of the socioeconomic, institutional and legal setting 197
Wedgewood, A. and Sansom, K. (2003) Willingness-To-Pay Surveys – A Streamlined Approach: Guidance Notes for Small Town Water Supplies. WEDC, Loughborough University.
World Bank (1996) Participation Sourcebook, Washington, DC. World Bank (2002) World Development Report 2003: Sustainable Development in a Dynamic
World, OUP, New York. World Resources Institute (1996) World Resources: A Guide to the Global Environment: The
Urban Environment, OUP, New York. Wratten, E. (1995) Conceptualizing urban poverty. Environ. and Urbanization, 7(1), 11-36. Yacoob, M.B.E. and Whiteford, L. (1995) Public Participation in Urban Environmental
Management. WASH Reprint, Technical Report No. 90, Environmental Health Project, Washington, DC.


© 2006 World Health Organization. Protecting Groundwater for Health: Managing the Quality of Drinking-water Sources. Edited by O. Schmoll, G. Howard, J. Chilton and I. Chorus. ISBN: 1843390795. Published by IWA Publishing, London, UK.
8 Assessment of aquifer pollution vulnerability and susceptibility to the impacts of abstraction
J. Chilton
Information about subsurface conditions is needed for the area of investigation, which may be a complete catchment, the outcrop or recharge area of an aquifer or the part of the aquifer contributing water to individual public supply sources or wellfields. The latter is often referred to as the capture zone, and represents the size of the area from which adequate recharge is obtained to balance the total amount of water abstracted. The information required is that which will enable assessments to be made of both the vulnerability of the aquifer to pollution and its susceptibility to the impacts of heavy or even excessive abstraction of groundwater. This chapter first defines aquifer vulnerability and describes how it is assessed, and reviews the range of information types that are likely to be needed about the hydrogeological conditions to enable this to be done. The chapter also provides some general guidance on where such information might be found. While this information is mostly of a physical geographical and geological nature, it can also include land use, as this is often closely linked to or determined by geographical factors. An obvious example of this would be mining, the presence

200 Protecting Groundwater for Health
or absence of which is clearly determined by the geology. The chapter provides a brief summary of the ways in which abstraction can have negative consequences for groundwater. As with the other chapters in this section, a checklist is provided at the end.
NOTE Hydrogeological conditions which determine aquifer pollution potential vary greatly. They therefore need to be analysed specifically for the conditions in a given setting. The information in this chapter supports hazard analysis in the context of developing a Water Safety Plan for a given water supply (Chapter 16).
8.1 DEFINING, CHARACTERIZING AND MAPPING GROUNDWATER VULNERABILITY
8.1.1 Vulnerability of groundwater to pollution In view of the importance of groundwater for potable supplies, it might be expected that aquifer protection to prevent groundwater quality deterioration would have received due attention. However, even in and around urban and industrial areas where many actual or potential sources of pollution are located, aquifer protection has, until relatively recently, not been given adequate consideration. One important reason for this lack of consideration is that groundwater flow and pollutant transport are neither readily observed nor easily measured. These are generally slow processes in the subsurface, and there is widespread ignorance and indeed complacency about the risk of groundwater pollution amongst administrators and planners with responsibility for managing land and water resources. In the long term, however, protection of groundwater resources is of direct practical importance because, once pollution of groundwater has been allowed to occur, the scale and persistence of such pollution makes restoration technically difficult and costly. In taking care of the quality of groundwater, as in many other things, prevention is better than cure.
Natural attenuation capacity varies widely according to geological and soil conditions. Instead of applying controls on possible polluting activities everywhere, it is more cost-effective and provides less severe constraints on economic development if the degree of control is varied according to attenuation capacity. This is the general principle underlying the concept of aquifer vulnerability, and the need for mapping vulnerability distribution (Foster et al., 2002).
Given the complexity of the factors governing pollutant pathways and transport of pollutants to aquifers, it might appear that hydrogeological conditions are just too complicated for vulnerability to be mapped, and that each polluting activity or

Assessment of aquifer pollution vulnerability 201
pollutant should be treated separately. While it is clear that general vulnerability to a universal contaminant cannot really be valid, nevertheless trying to define vulnerability separately for specific pollutants is unlikely to achieve either adequate coverage or universal acceptance, and would have data requirements that are unrealistic in terms of human and financial resources.
A logical approach to assessing the likelihood of groundwater pollution is to think of it as the interaction between the pollutant load that is, or might be, applied to the subsurface environment as a result of human activity and the pollution vulnerability, which is determined by the characteristics of the strata separating the aquifer from the land surface.
In these terms, vulnerability is a function of the ease of access to the saturated aquifer for water and pollutants, and the attenuation capacity of the soil and geological strata between the pollution source and the groundwater. Information needs concerning possible pollutant loads and sources are dealt with in Chapters 9 to 13, and the general guiding principles of aquifer vulnerability are covered below. Firstly, however, some words of caution need to be born in mind in relation to the applicability of the above approach (Foster and Hirata, 1988; NRC, 1993):
NOTE All aquifers are vulnerable to persistent, mobile pollutants in the long term. Less vulnerable aquifers are not easily polluted, but once polluted they are more difficult to restore. Uncertainty is inherent in all pollution vulnerability assessments. If complex assessment systems are developed, obvious factors may be obscured, and subtle differences may become indistinguishable.
The term pollution vulnerability refers to the intrinsic characteristics of an
aquifer that represent its sensitivity to being adversely affected by an imposed contaminant load. It is, in effect, the inverse of the pollution assimilation capacity of the receiving water in river quality management, but with the difference that aquifers usually have at least some overlying strata that can provide additional protection. If such a scheme is adopted, it is possible to have high vulnerability but no pollution risk, because there is no pollution loading, or vice versa. Both are quite consistent in practice. Moreover, the contaminant load can be removed, controlled or modified, but the aquifer vulnerability, which depends on the intrinsic properties of the subsurface, cannot.
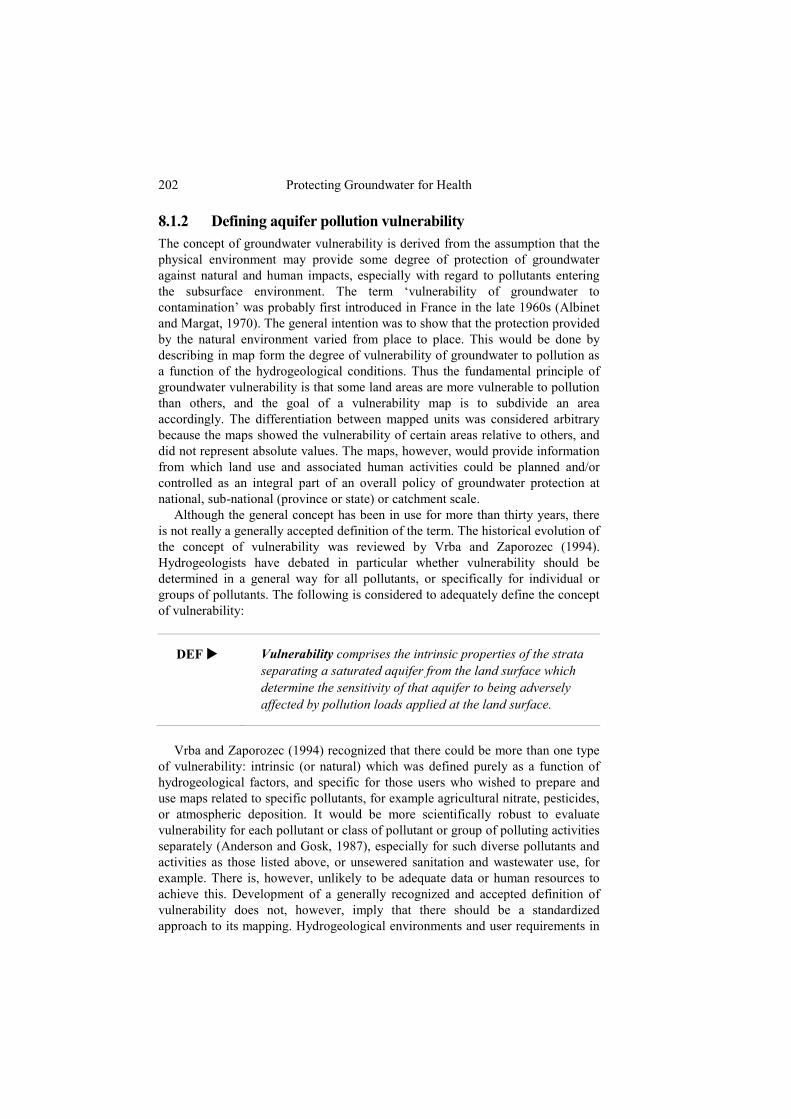
202 Protecting Groundwater for Health
8.1.2 Defining aquifer pollution vulnerability The concept of groundwater vulnerability is derived from the assumption that the physical environment may provide some degree of protection of groundwater against natural and human impacts, especially with regard to pollutants entering the subsurface environment. The term ‘vulnerability of groundwater to contamination’ was probably first introduced in France in the late 1960s (Albinet and Margat, 1970). The general intention was to show that the protection provided by the natural environment varied from place to place. This would be done by describing in map form the degree of vulnerability of groundwater to pollution as a function of the hydrogeological conditions. Thus the fundamental principle of groundwater vulnerability is that some land areas are more vulnerable to pollution than others, and the goal of a vulnerability map is to subdivide an area accordingly. The differentiation between mapped units was considered arbitrary because the maps showed the vulnerability of certain areas relative to others, and did not represent absolute values. The maps, however, would provide information from which land use and associated human activities could be planned and/or controlled as an integral part of an overall policy of groundwater protection at national, sub-national (province or state) or catchment scale.
Although the general concept has been in use for more than thirty years, there is not really a generally accepted definition of the term. The historical evolution of the concept of vulnerability was reviewed by Vrba and Zaporozec (1994). Hydrogeologists have debated in particular whether vulnerability should be determined in a general way for all pollutants, or specifically for individual or groups of pollutants. The following is considered to adequately define the concept of vulnerability:
DEF Vulnerability comprises the intrinsic properties of the strata separating a saturated aquifer from the land surface which determine the sensitivity of that aquifer to being adversely affected by pollution loads applied at the land surface.
Vrba and Zaporozec (1994) recognized that there could be more than one type
of vulnerability: intrinsic (or natural) which was defined purely as a function of hydrogeological factors, and specific for those users who wished to prepare and use maps related to specific pollutants, for example agricultural nitrate, pesticides, or atmospheric deposition. It would be more scientifically robust to evaluate vulnerability for each pollutant or class of pollutant or group of polluting activities separately (Anderson and Gosk, 1987), especially for such diverse pollutants and activities as those listed above, or unsewered sanitation and wastewater use, for example. There is, however, unlikely to be adequate data or human resources to achieve this. Development of a generally recognized and accepted definition of vulnerability does not, however, imply that there should be a standardized approach to its mapping. Hydrogeological environments and user requirements in

Assessment of aquifer pollution vulnerability 203
terms of scales are too diverse to be dealt with in a standardized way, but it is important to agree on a common basis – the definition of vulnerability – before considering approaches to the assessment of such diversified conditions.
Representation of the vulnerability of groundwater to pollution by means of maps has become an important tool by which hydrogeologists can assist the planning community. However, the inevitable limitations of such maps need to be explained to the users by the groundwater specialists who prepare them. These limitations come from the conceptual distinction between intrinsic and specific maps referred to above, from the simplifications imposed by the scale of heterogeneity of soils and aquifers compared to the scale of the map, and from deficiencies in the data available for whatever method of depicting vulnerability is adopted. Given an appreciation of these limitations, vulnerability maps have been demonstrated to play a useful part in groundwater protection (NRC, 1993; Vrba and Zaporozec, 1994).
8.1.3 Classifying aquifer vulnerability Vulnerability assessment involves evaluating likely travel times from the ground surface to the water table, or to the aquifer in the case of confined conditions. The greater the travel time, the more potential there is for pollutant attenuation by the processes outlined in Chapters 3 and 4. Aquifer vulnerability can be subdivided simply into five broad classes (Table 8.1). Extreme vulnerability is associated with aquifers having a high density of open fractures and with shallow water tables, which offer little chance for pollutant attenuation.
Table 8.1. Broad classification of aquifer vulnerability (based on Foster et al., 2002)
Vulnerability class
Definition
Extreme Vulnerable to most water pollutants with relatively rapid impact in many pollution scenarios
High Vulnerable to many pollutants, except those highly absorbed and/or readily transformed, in many pollution scenarios
Moderate Vulnerable to some pollutants, but only when continuously discharged or leached
Low Only vulnerable to the most persistent pollutants in the long term, when continuously and widely discharged or leached
Negligible Confining beds are present and prevent any significant vertical groundwater flow
Thus for preliminary assessment purposes, it is instructive to note that the
hydrogeological environments described in Chapter 2 differ greatly in the time taken for recharge entering at the land surface to reach the water table or potentiometric surface of the aquifer (Table 8.2). Table 8.1 also indicates the likely vulnerability class for each environment, and the general vulnerability of some common soils and rocks is summarized in Figure 8.1, in which the arrows

204 Protecting Groundwater for Health
indicate increasing vulnerability, and the three classes used in this earlier attempt at classification roughly correspond to the three middle classes in Table 8.1.
Figure 8.1. Vulnerability of soils and rocks to groundwater pollution (modified from Lewis et al., 1980)
Table 8.2. Hydrogeological environments and their associated groundwater pollution vulnerability (based on Morris et al., 2003)
Hydrogeological environment
Typical travel times to water-table
Attenuation potential of aquifer
Pollution vulnerability
unconfined weeks-months high-moderate moderate Alluvial and coastal plain sediments
semi-confined years-decades High low
unconfined months-years moderate moderate Intermontane valley-fill and volcanic systems
semi-confined years-decades moderate moderate-low
porous sandstones
weeks-years high moderate-high Consolidated sedimentary aquifers karstic
limestones days-weeks low extreme
Coastal limestones unconfined days-weeks low-moderate high-extreme
Glacial deposits unconfined weeks-years moderate-low high-moderate
lavas days-months low-moderate high-extreme Extensive volcanic sequences ash/lava
sequences months-years high low
unconfined days-weeks low high-extreme Weathered basement semi-confined weeks-years moderate moderate
Loessic plateaux unconfined days-months low-moderate moderate-high

Assessment of aquifer pollution vulnerability 205
Unsaturated zone travel time and aquifer residence time are important factors in any aquifer assessment because they affect the ability of the aquifer in question to protect against pollution. For instance, a residence period of a month or so is adequate to eliminate most bacterial pathogens (Chapter 3). Spillages of more intractable pollutants such as petrol or other fuels, and other organic compounds can, given time, undergo significant degradation in-situ by an aquifer’s indigenous microbial population (Chapter 4).
The soil zone is usually regarded as a principal factors in the assessment of groundwater vulnerability and the first line of defence against pollution. The main properties of soils that relate to vulnerability to pollution are discussed in Section 8.2.4 below. The soil layer is usually continuous, but the spatial variability of its physical, chemical and biological properties can be very great, and generalizations of soil parameters have to be undertaken with some care. Because of its potential to attenuate a range of pollutants, it plays a critical role when considering specific vulnerability to diffuse sources of pollution such as agricultural fertilizers, pesticides and acid deposition. Not all soil profiles and underlying materials are equally effective in attenuating pollutants, and the degree of attenuation will vary widely with the types of pollutant and polluting process in any given environment.
The soil has a particularly important position amongst vulnerability factors because the soil itself is vulnerable. The soil’s function as a natural protective filter can be damaged rather easily by such routine activities as cultivation and tillage, irrigation, compaction and drainage. Human activities at the land surface can greatly modify the existing natural mechanisms of groundwater recharge and introduce new ones, changing the rate, frequency and quality of groundwater recharge. This is especially the case in arid and semi-arid regions where there may be relatively little and infrequent natural recharge, but also applies to more humid regions. Understanding these mechanisms and diagnosing such changes are critical, and the use of soil properties in vulnerability assessment should always take into consideration whether the soils in the area of interest are in their natural state. Further, there are many potentially polluting human activities in which the soil is removed or otherwise by-passed and for these the component of protection provided by the soil does not apply.
Below the soil, the unsaturated zone is very important in protecting the underlying groundwater, especially where soils are thin and/or poorly developed. The character of the unsaturated zone and its potential attenuation capacity then determine decisively the degree of groundwater vulnerability. The main unsaturated zone properties that are important in vulnerability assessment are the thickness, lithology and vertical hydraulic conductivity of the materials. The thickness depends on the depth to the water table, which can vary significantly due to local topography and also fluctuates seasonally, and both these have to be taken into account when determining thickness. The importance of hydraulic conductivity, its distribution and its role in determining groundwater flow rates should be particularly emphasized. Porosity, storage properties, and groundwater flow direction may also be important, and another supplementary parameter in

206 Protecting Groundwater for Health
some types of aquifers and circumstances may be the depth and degree of weathering of the upper part of the unsaturated zone.
Degree of confinement is also an important factor in determining vulnerability. Concern about groundwater pollution relates primarily to unconfined aquifers, especially where the unsaturated zone is thin because the water table is at shallow depth. Significant risk of pollution may also occur in semi-confined aquifers, if the confining aquitards are relatively thin and permeable. Groundwater supplies drawn from deeper and more fully confined aquifers will normally be affected only by the most persistent pollutants and in the long term. Data requirements are summarized in Table 8.3 below.
Table 8.3 Data requirements for principal factors contributing to vulnerability assessments (modified from Foster et al., 2002)
Component of vulnerability
Ideally required Normal availability and source
Degree of aquifer confinement (incl. partial or semi-confined)
Simple division between confined and unconfined from geological maps
Soil thickness and permeability Soil classes in map form and their accompanying descriptions
Depth to groundwater table or potentiometric surface in map form (gives thickness of unsaturated zone)
Varying amounts of water table data from individual wells
Hydraulic inaccessibility (ease and speed of water movement)
Unsaturated zone moisture content and vertical hydraulic conductivity of strata in unsatu-rated zone or confining layers
Little or no data: typical values inferred from existing studies or literature
Mineral and organic matter content of soil, and its thickness
Soil classes in map form and their accompanying descriptions
Grain size and/or fracture distri-bution of strata in unsaturated zone or confining layers
General distinction between intergranular and fracture flow from geological maps
Attenuation capacity
Mineralogy of strata in unsaturated zone or confining beds, including organic content
Maybe found in descriptive memoirs or reports accompanying maps, or from existing studies or literature
Additional attributes that can be considered as of secondary importance to
those in Table 8.3 include topography, surface water features and the nature of geological formations beneath the aquifer of interest. Some of these may have only local significance. Topography influences the location of recharge, soil development, properties and thickness and local groundwater flow. The interaction between surface water and groundwater, i.e. in which direction water is moving, may be important locally.

Assessment of aquifer pollution vulnerability 207
8.1.4 Mapping aquifer vulnerability A vulnerability map shows in a more or less subjective way the capacity of the subsurface environment to protect groundwater. Like all derivative or interpreted maps, it is somewhat subjective because it must meet the requirements of the user. The maps should provide the user with the most accurate and informative assessment of the sensitivity to impacts, allowing comparison between aquifers and between different locations and different parts of the same aquifer. Preparation of the maps usually involves combining or overlaying several thematic maps of selected physical factors that have been chosen to depict vulnerability. These are discussed below, but have been grouped by Vrba and Zaporozec (1994) into those associated with:
• the hydrogeological framework – the characteristics of the soils and underlying geological materials;
• the groundwater flow system – the direction and speed of groundwater movement;
• the climate – the amount and type of recharge. A further general consideration is that vulnerability maps are normally prepared
from existing information only, without the collection of new field data. A number of approaches to the assessment and mapping of vulnerability have
been developed, using varying combinations of the soil, unsaturated and saturated zone factors outlined above. These can be considered in three groups:
• hydrogeological setting methods • parametric methods • analogical relation and numerical model methods.
All methods are briefly explained below and described in more detail by Vrba and Zaporozec (1994). The ways they are incorporated into groundwater protection strategies are discussed in Chapter 17.
The hydrogeological setting methods use the comparison of a subject area to criteria that are judged to represent vulnerable conditions in other areas. A hierarchical system of two or usually more classes is established to cover the range of vulnerability. These widely used methods evaluate the vulnerability of hydrogeological complexes and settings, using an overlay cartographic method (Albinet and Margat, 1970). These methods produce universal systems suitable for large areas and a variety of hydrogeological conditions, and therefore lend them-selves to the production of maps of large land areas, including national coverage.
The second group, parametric methods, can be further subdivided into matrix, rating or point count systems, although the overall approach is the same. Factors judged to be representative of vulnerability are selected, and each has a range that is divided into discrete hierarchical intervals (e.g. 0-5 m, 5-10 m, 10-20 m depth to water), and each interval is assigned a value reflecting its relative degree of vulnerability. Matrix systems are based on a limited number of factors for example two to four classes of vulnerability of soil and aquifer types, two or three intervals of depth to water. Vulnerability mapping of the United Kingdom follows this approach (Adams and Foster, 1992). The Jordan case study presented in Section 8.1.5 is an example of a rating system. Rating systems are largely derived

208 Protecting Groundwater for Health
from the work of Le Grand (1983). A fixed range is given to any parameter considered necessary and adequate for vulnerability assessment. The range is divided according to the variation interval of each parameter and the sum of the ratings for each parameter provides the vulnerability assessment for any point or area. The range of final scores is divided into segments representing relative vulnerability. Some rating systems use primarily soil parameters, others hydrogeological factors, but they are generic and not specific to any pollutant.
An index-based parametric method developed by Foster and Hirata (1988) has been applied in several Latin American countries (Foster et al., 2002). The GOD system uses three generally available or readily estimated parameters, the degree of Groundwater hydraulic confinement, geological nature of the Overlying strata and Depth to groundwater. Each is rated on a vulnerability scale of 0 (lowest) to 1 (highest), and multiplied together to provide an overall index of pollution vulnerability. This method has recently been further developed and adapted to take account of the soil component of vulnerability (Foster et al., 2002). Another approach specifically for karstic areas is the EPIK method developed by Doerfliger and Zwahlen (1998) and discussed by Daly et al. (2001).
Point count systems are a further development in parametric approaches in which a weighting factor or multiplier is added to represent the importance of each parameter in the vulnerability assessment. The ratings for each interval are multiplied by the weight for the parameter and the products summed to obtain a final numerical score, which is higher for greater vulnerability. However, a potential problem with this approach is the breaking down of the final scores into classes of relative vulnerability. One of the best known point count systems is DRASTIC, developed by the US EPA (Aller et al., 1987; US EPA, 1992), which has been widely tested (Kalinski et al., 1994; Rosen, 1994). The method employs seven hydrogeological factors to develop an index of vulnerability:
• Depth to water table • net Recharge • Aquifer media • Soil media • Topography (slope) • Impact on the vadose zone • hydraulic Conductivity
An index is generated by applying a weight to each hydrogeological factor that is represented numerically. As the hydrogeological factors vary spatially, the DRASTIC index provides a systematic way of mapping the relative vulnerability of groundwater to contamination and can be readily incorporated into a GIS (Kim and Hamm, 1999; Shahid, 2000). However, the large number of parameters included means that data requirements are invariably difficult to meet. Further, the large number of variables factored into the final index number may mean that critical parameters may be subdued by other parameters having little or no bearing on vulnerability in that particular setting. Some DRASTIC parameters, such as aquifer and soil media and hydraulic conductivity, are not fully independent but interact with each other.

Assessment of aquifer pollution vulnerability 209
Whichever system is used, the primary sources of data for assessing aquifer vulnerability are soil and geological maps and cross-sections, data or maps of depth to groundwater, supplemented by information from existing hydrogeological investigations that can provide additional information on subsurface transport and attenuation properties (Table 8.3).
Overall, allowing for the cautionary words at the beginning of this discussion, the concept of groundwater vulnerability has become both broadly accepted and widely used (NRC, 1993; Vrba and Zaporozec, 1994). Vulnerability maps should not be used to assess hazards where pollutants are discharged deeper into the subsurface, for example leaking tanks and landfills, or for spillages of DNAPLs. A further note of warning is that for most methods the resulting assessment of vulnerability applies only to the aquifer closest to the ground surface if there is more than one aquifer in a vertical sequence. While this is often the most important for local water supply, deeper aquifers may also be exploited. At first sight, such aquifers may appear to be more than adequately protected from pollution, but they may in fact be vulnerable to downward leakage of pollutants, which can be induced by pumping from the deeper horizons, or to pollutants moving laterally from a more remote source.
8.1.5 Case study: Groundwater vulnerability mapping in the Irbid area in Northern Jordan
The method applied The method established by the State Geological Surveys of Germany (Hölting et al., 1995) for the preparation of groundwater vulnerability maps uses a rating system for the properties of the unsaturated zone. The degree of vulnerability is specified according to the protective effectiveness (the ability of the cover above an aquifer to protect the groundwater) of the soil cover down to a depth of one metre (the average rooting depth), and the rock cover (the unsaturated zone). The following parameters are considered for the assessment of the overall protective effectiveness: effective field capacity of the soil, percolation rate factor, rock type and thickness of the rock cover above the saturated aquifer. Additional positive weightings are given for perched aquifer systems, and for aquifers under strong hydraulic pressure and upward flow conditions.
The process of calculating the overall protective effectiveness for a large area is complex and requires the use of Geographical Information System (GIS) software. Hölting et al. (1995) distinguished five classes of overall protective effectiveness of the soil and rock cover (Table 8.4). The higher the total number of points, the longer the approximate residence time for water percolating through the unsaturated zone and in consequence the greater the overall protective effectiveness.
The Irbid area was selected to test vulnerability mapping for the first time in Jordan, and this method was selected since it allows assessment of groundwater vulnerability over large areas based on existing data, i.e. at low cost and in a short amount of time.
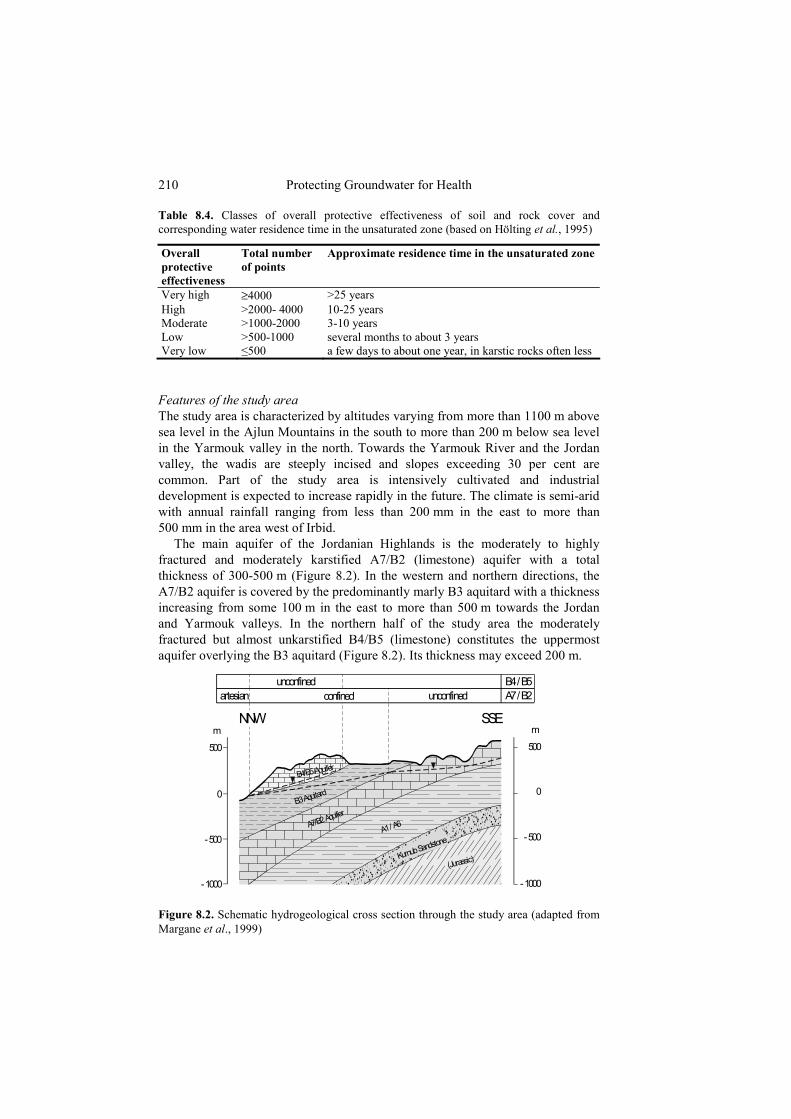
210 Protecting Groundwater for Health
Table 8.4. Classes of overall protective effectiveness of soil and rock cover and corresponding water residence time in the unsaturated zone (based on Hölting et al., 1995)
Overall protective effectiveness
Total number of points
Approximate residence time in the unsaturated zone
Very high ≥4000 >25 years High >2000- 4000 10-25 years Moderate >1000-2000 3-10 years Low >500-1000 several months to about 3 years Very low ≤500 a few days to about one year, in karstic rocks often less
Features of the study area The study area is characterized by altitudes varying from more than 1100 m above sea level in the Ajlun Mountains in the south to more than 200 m below sea level in the Yarmouk valley in the north. Towards the Yarmouk River and the Jordan valley, the wadis are steeply incised and slopes exceeding 30 per cent are common. Part of the study area is intensively cultivated and industrial development is expected to increase rapidly in the future. The climate is semi-arid with annual rainfall ranging from less than 200 mm in the east to more than 500 mm in the area west of Irbid.
The main aquifer of the Jordanian Highlands is the moderately to highly fractured and moderately karstified A7/B2 (limestone) aquifer with a total thickness of 300-500 m (Figure 8.2). In the western and northern directions, the A7/B2 aquifer is covered by the predominantly marly B3 aquitard with a thickness increasing from some 100 m in the east to more than 500 m towards the Jordan and Yarmouk valleys. In the northern half of the study area the moderately fractured but almost unkarstified B4/B5 (limestone) constitutes the uppermost aquifer overlying the B3 aquitard (Figure 8.2). Its thickness may exceed 200 m.
Figure 8.2. Schematic hydrogeological cross section through the study area (adapted from Margane et al., 1999)
500
0
- 500
- 1000
m500
0
- 500
- 1000
m
Kurnub Sandsto
ne
(Jurassic)
B4/B5 Aquifer
B3 Aquitard
A7/B2 Aquifer
A1 / A6
artesianunconfined
confined unconfined
SSE
A7 / B2B4 / B5
NNW

Assessment of aquifer pollution vulnerability 211
In areas where the A7/B2 aquifer is protected by the overlying B3 aquitard, observed groundwater nitrate concentrations are usually below 15 mg/l and often below 1 mg/l. At a few sites of uncovered A7/B2 aquifer, nitrate concentrations above 80 mg/l indicate anthropogenic contamination. In the B4/B5 aquifer, however, many springs cannot be used for public water supply because of chemical or bacteriological contamination. At some intensively cultivated sites nitrate concentrations exceed 100 mg/l. The resulting vulnerability map Figure 8.3 shows the resulting groundwater vulnerability map of the Irbid area. The protective effectiveness of the soil and rock cover above the saturated B4/B5 aquifer has been classified as low to very low. In the main wadis and in the areas where the groundwater is close to the ground surface, the vulnerability of the groundwater is extremely high. Protective effectiveness is classified as moderate only on the high plateaus between the deeply incised wadis running towards the Yarmouk River in the north. Vulnerability of the A7/B2 aquifer is especially high in areas where an effective soil cover is missing, the groundwater table is comparatively shallow and the aquifer is unconfined. Areas of medium vulnerability are widely distributed on the outcrop areas of the A7/B2 aquifer in the southern part of the mapped area.
Further north and west, where the A7/B2 aquifer is overlain by the predominantly marly B3 aquitard and well developed soils, the protective effectiveness of the soil and rock cover has been classified as high and, in the areas where the groundwater is confined, as very high. The Yarmouk Valley in the extreme northern part of the study area, where the B4/B5 unit has been eroded and the highly confined A7/B2 aquifer forms the uppermost aquifer, also belongs in this category. Associated mapping of potential groundwater pollution sources in the same area was also part of the study (Margane et al., 1999).

Figu
re 8
.3. G
roun
dwat
er v
ulne
rabi
lity
map
of t
he Ir
bid
area
, nor
ther
n Jo
rdan
(ada
pted
from
Mar
gane
et a
l., 1
999)

Assessment of aquifer pollution vulnerability 213
8.2 INFORMATION NEEDS AND DATA SOURCES FOR VULNERABILITY ASSESSMENT
8.2.1 Regional geological and hydrogeological setting The first important step in characterizing the physical environment for groundwater protection is to define the principal features of the regional geology so that the dominant aquifer types and hydrogeological settings outlined in Chapter 2 can be identified. The best sources of information from which the aquifer types can be defined are geological maps, which in most countries are produced by the national geological survey organization. Where these are published, printed and sold, they provide a cheap and usually easy to obtain source of this basic but vital information. However, these maps, which are often accompanied by descriptive memoirs, are prepared by, and mainly for, geologists, and this is the reason that at least some knowledge of the technical terms is required, as mentioned in Chapter 2. The associated descriptive notes or memoirs can be very useful as they usually include cross-sections showing the geometry, structure, dip and orientation of the various geological formations, from which the first indications of the likely groundwater flow system can be obtained. In some countries, such memoirs also include a general summary of the hydrogeology and groundwater development of the area covered.
An alternative and often better source of basic information about the groundwater conditions in an area is a hydrogeological map, if such exists. Their production and usage has been promoted for many years by UNESCO, which produced a universal legend to assist in the preparation of hydrogeological maps that could be easily compared with each other (UNESCO, 1970). As a result, national and regional maps showing the distribution of productive aquifers and less productive lower permeability materials now exist for much of the world. The maps distinguish between aquifers in which groundwater flow is dominantly intergranular and those in which it is dominantly through fractures, and also indicate the distribution of the main lithological types. Groundwater level contours provide a general indication of flow directions. The maps can also, therefore, be used as a source of information from which to develop a conceptual model of the groundwater flow regime. The principal groundwater supply sources – boreholes, springs or wellfields are sometimes shown. Groundwater quality information is usually restricted to indications of general groundwater salinity. Struckmeier and Margat (1995) provide a comprehensive list of hydrogeological maps, together with guidance on map preparation and a revised standard legend.
Issues of scale of information availability in relation to the scale of interest can be important. National geological mapping is often undertaken in the field at scales ranging from 1:10 000 to 1:50 000, and the final maps are usually produced at 1:50 000 to 1:100 000, or even broader scales for large countries which are being mapped for the first time. Maps of such scale can provide information about the distribution of the main rock types and may give a preliminary indication of their nature as either granular or fractured aquifers. The maps may, however, be
214 Protecting Groundwater for Health
rather scientific and technical in the names and ages of the rock types depicted, and some help and interpretation from a geologist or hydrogeologist will probably be required. Additional information and first-hand knowledge and experience can often be obtained from local technical staff of, for example, the water utility operating the groundwater supply sources which require protection. Hydrogeological maps may have more simplified depictions of the geological units and are often prepared at even broader scales, 1:250 000 being common. With increasing usage of digital technology, it may be possible to obtain digital geological or hydrogeological maps to be used as layers in a GIS approach to depicting groundwater vulnerability and planning groundwater protection.
8.2.2 Groundwater flow systems Having identified the overall hydrogeological setting and determined the lithology and geometry – the extent and depth – of the relevant aquifers in the area of interest or catchment, the next step is to develop a broad conceptual model of the groundwater flow system. In relation to groundwater protection, this means understanding where groundwater recharge occurs, how it moves and where it discharges, as this forms the hydrogeological basis for the source-pathway-receptor approach to considering pollution threats.
Figures 8.4 and 8.5 provide examples of conceptual groundwater models. The first example shows a sedimentary sequence from the north east of the United Kingdom in which several aquifers and intervening clay layers are dipping eastwards towards the coast. The main chalk aquifer, the minor aquifers of the Carstone and Roach Formation immediately below it and the Spilsby Sandstone (Figure 8.4) are confined. The general scarcity of boreholes in the area means that there are few groundwater level measurements and the positions of the respective piezometric levels are uncertain, as show in Figure 8.4. A component of groundwater discharge from the chalk occurs as springs at the buried cliff, and it is assumed that there is a component of vertical flow between the aquifers through the intervening clay strata.
In contrast to the largely natural groundwater flow system in Figure 8.4, Figure 8.5 shows a highly-developed shallow aquifer beneath the city of Merida in Mexico, which is characterized by very high hydraulic conductivity, low hydraulic gradient and water table within a few meters of the ground surface. The aquifer is an unconfined karstic limestone, with little or no soil cover, providing little scope for attenuation of pollutants, and hence is highly vulnerable to pollution. Rainfall infiltration is supplemented by additional water from leaking mains, wastewater from unsewered sanitation and storm drainage, more than doubling the annual recharge (Morris et al., 2003). As a result, microbial pollution of the shallow aquifer is widespread (Morris et al., 2003), and there is a danger that the increased recharge within the city boundary could change the shallow hydraulic gradient and allow pollution to move towards the public supply wellfields in the neighboring peri-urban and rural areas (Figure 8.5).

Assessment of aquifer pollution vulnerability 215
Figure 8.4. Conceptual model of natural groundwater flow system in eastern England (modified from Groundwater Development Consultants, 1989)
Figure 8.5. Conceptual model of groundwater system Merida, Mexico (modified from Morris et al., 1994)
216 Protecting Groundwater for Health
The geological history and structure of the region provides some of the most important information, especially about the nature of the boundaries of the aquifers. The geological age and stratigraphic sequence define the vertical distribution of aquifers and aquitards, and the folding history determines the way in which aquifer sequences are tilted and dipping. Geological faults with significant displacement can bring permeable and impermeable materials adjacent to each other and reduce or prevent lateral groundwater flow. The geological structure may in fact help to determine the limits of the catchment or recharge area. Understanding of the aquifer boundaries and their hydraulic nature should be part of the development of a three-dimensional conceptual model of the groundwater flow system.
As introduced in Chapter 2, natural groundwater flow directions generally reflect the land surface, and movement is usually from topographically high recharge areas to lower areas of groundwater discharge (Figure 2.7). While this generalization holds for many cases, the occurrence of separate local and regional groundwater flow systems operating at different scales and depths (Figure 8.4) may mean that groundwater flow can be in opposite directions at different depths, and sometimes contrary to the topographic gradient. Also, human activities can affect the flow system by providing additional recharge sources and by abstraction of groundwater modifying or even reversing groundwater flow directions (Figure 8.5).
In many situations, there will be scope for interactions between surface water and groundwater. Thus rivers and lakes may be either losing or gaining, i.e. water can move from the surface water body downwards into the ground, or groundwater may be discharged into the river. To make matters more complicated, the direction of water movement may be different along the length of the river or lake, depending on the topographic relationship and hydraulic connection and gradient between surface water and groundwater. Thus in some places where the stream or riverbed is cut down into a shallow aquifer, groundwater will flow towards the river and augment surface water discharge. Elsewhere, a stream or canal may be located above an aquifer and separated from it by either a significant unsaturated zone or impermeable materials. Slow infiltration of water from the river to the aquifer could occur. Further, the direction of groundwater movement may be reversed at different times of the year as the relationship between river levels and groundwater table can vary seasonally. Only in karstic limestone areas is surface water largely absent, as rainfall that does not evaporate infiltrates, and there is hardly any runoff. Indeed, extreme examples of surface water/groundwater relationships changing along a river course are seen where streams flowing over relatively impermeable materials cross a geological boundary onto karstic limestones and disappear completely.
8.2.3 Physical geography and topography Having established the regional geological setting and consequent hydrogeological conditions and flow regime as outlined above, some other general physical

Assessment of aquifer pollution vulnerability 217
features of the study area are also important. Useful information can often be gained from the topographic maps of the national survey, commonly at scales of 1:50 000 or 1:25 000, and from driving around and looking at the area, and this should always be done. One of the main features directly linked to geology that is of interest from the point of view of this monograph is the occurrence of minerals and the related mining activities, which are discussed in Chapter 11.
Geology and present or past climate interact to define the topography and geomorphology, the hills, mountains, valleys, rivers and lakes and other physical expressions of surface landforms. Steepness of slopes helps define runoff to rivers and concentrates and localizes recharge to groundwater. The configuration of the drainage system defines individual catchments and sub-catchments, and may help to indicate whether there is likely to be close interaction between surface water and groundwater systems. Limestone terrains are, for example, often characterized by a lack of surface drainage, and this often shows on topographic maps. The presence of springs, caves, swallow holes, often marked by their own symbols, also provides an indication of limestone and rapid conduit flow systems. Even the names of villages, farms and natural features such as hills and rivers can provide useful information about the area.
The interaction in turn between physical geomorphology and climate defines soil conditions and fertility, and hence land use and human activities, population density and distribution. As well as controlling runoff and recharge as mentioned above, steepness of slopes also plays a key role in land use – steep slopes may be unsuitable for both cultivation and human settlement. Topographic maps can indicate the main features of land use such as forests, orchards, artificial drainage, irrigated farming, glasshouse cultivation, nature reserves and other protected areas, but actual visits and looking may be required to determine the type of crops grown, cultivation regimes and livestock farming and to provide the more detailed information specified in Chapter 9. The patterns of rural, periurban and urban settlement, and transport infrastructure such as roads, motorways, railways and airfields are also apparent from topographic maps. This overview will, however, need to be supplemented by visual inspection and specific surveys to see the types of industries and their age and degree of activity, as described in Chapter 11.
8.2.4 Characteristics of the soil The soil is the uppermost layer of the earth's crust and is the product of complex interactions between climate, living organisms, parent material and topography. Soils develop through the accumulation of unconsolidated mineral grains from the physical and chemical weathering of rock fragments and the addition of organic material from vegetation. Soil is defined and described in many ways, which differ according to the interests and requirements of the user. For the purposes of groundwater protection, it can be considered as the weathered zone into which plants will root and which experiences seasonal changes in moisture content, temperature and gaseous composition. In temperate regions, it is generally 1-2 m thick and in tropical regions can exceed 5 m. It should already be clear from

218 Protecting Groundwater for Health
Chapters 3 and 4 that the soil is an important factor in groundwater protection, because it is the most chemically and biologically active part of the subsurface environment.
The characteristics of the soil at any particular location and time depend on five main groups of factors that have helped to produce it (Palmer et al., 1995):
• physical and chemical constitution of the parent material; • past and present climate; • relief and hydrology; • length of time during which soil forming processes have operated; • the ecosystem, including the modifying effects of man's activities.
To provide a consistent and systematic basis for differentiating the characteristics and properties of soils, soil scientists develop classifications which group soils that behave in similar, and therefore predictable ways. Maps of soil types (usually called Soil Series) are based largely on the following observable or measurable criteria (Palmer and Lewis, 1998):
• texture of the whole soil profile; • soil water regime – depth to and duration of waterlogging in a soil; • substrate type – the underlying geological material from which the soil has
developed; • organic matter content.
In the United Kingdom, this approach defines the 725 Soil Series used to produce a national soil map. Given the complexity of interactions that are possible between the five groups of factors listed above, it is clear that the resulting spatial distribution of soil series within the landscape can be very complex. It may be difficult to map the variations adequately even at a scale of 1:10 000. For maps at a scale of 1:100 000 or smaller, which may be the chosen publication scale in many instances, soil series which are so intricately mixed within the landscape that they cannot be represented separately may be grouped together into soil associations. These usually reflect the same parent material (and hence the same underlying aquifer), but differ in characteristics related to texture, relief and hydrological conditions.
So that soils can contribute to the assessment of groundwater vulnerability, these series have then been classified according to their potential for allowing pollutants at the ground surface to be leached into underlying aquifers. The classification is based on knowledge of those physical and chemical properties routinely measured during soil surveys. These properties include texture, stoniness, organic matter content, presence of raw peaty topsoils and low permeability layers, and soil water regime, and they will determine the soil's tendency to encourage lateral movement of pollutants, speed of downward pollutant movement and capacity for attenuation and degradation of pollutants by the processes outlined in Chapters 3 and 4. Derivation of the resulting leaching potential classification is described by Palmer et al. (1995) and summarized in Table 8.5.

Assessment of aquifer pollution vulnerability 219
The nature of the soil is important in two other respects. Firstly soils have a direct influence on land use, especially in conjunction with climate, and help to determine the distribution of human activities. The deepest and most fertile soils are generally used for cultivation with or without irrigation, and poorer soils for forestry, grazing and wildlife conservation. Soil type hence influences the distribu-tion of potential pollutants. Secondly, soil properties that affect leaching potential also have a bearing on the mechanisms and amounts of recharge to groundwater.
Table 8.5. Soil leaching potential classification for groundwater vulnerability (based on Palmer and Lewis, 1998)
High soil leaching potential (four sub classes, with H1 having the highest potential) H1 Soils with groundwater at shallow depth Soils with rock, rock-rubble or gravel at shallow depth Undrained lowland peat soils
H3 Sandy soils with moderate topsoil organic matter content Soils with rock, rock-rubble or gravel at relatively shallow depth
H2 Sandy soils with low topsoil organic matter content
HU Soils in urban environments and sites of restored mineral workings where H1 leaching potential is assumed until proven otherwise
Intermediate soil leaching potential (two sub-classes: one for mineral soils / one for peaty soils or humose mineral soils) I1 Deep loamy and clayey mineral soils unaffected by marked seasonal waterlogging
I2 Drained peat with humified topsoil Soils with a humose topsoil
Low soil leaching potential (no sub-classes) L Soils with a slowly permeable layer restricting downward water movement Upland soils with a raw peaty topsoil
8.3 ESTIMATING GROUNDWATER RECHARGE In characterizing catchments or aquifers for protection, understanding how and where recharge occurs is necessary for three principal reasons:
• the relationship between the amount of recharge and the amount of abstraction defines the land area subject to or receiving the recharge that needs to be protected;
• the locations and processes of recharge and their relationship to potential sources of pollution help to determine pollutant loads;
• the relationship between the amount of recharge and the amount of abstraction helps to define the susceptibility of the aquifer to the effects of excessive pumping.

220 Protecting Groundwater for Health
The distinction between the last two is important. Thus in relation to the objective of groundwater protection, it may often be more critical to identify locations, mechanisms and speed of recharge rather than total volumes. General estimates of total recharge volumes are needed to help define catchments and to estimate diffuse pollution loads. A greater degree of effort is required to make estimates that are as precise and reliable as possible for groundwater resources management. Recharge estimation can be technically difficult and costly.
8.3.1 Recharge components and processes Recharge of groundwater may occur naturally from precipitation, rivers or lakes and/or from a whole range of man’s activities such as irrigation and urbanization. Further, an important way of categorizing recharge is to consider it as direct, localized or indirect (Simmers, 1997). The first is defined as water that is in excess of soil moisture deficits and evapotranspiration and which is added to the groundwater reservoir by direct vertical percolation through the unsaturated zone. The second is an intermediate form of recharge that results from percolation to the water table following surface or near-surface movement and subsequent collection and ponding in low-lying areas and in fractured zones as a result of small-scale topographic or geological variability. Indirect recharge is percolation to the water table through the beds of rivers, lakes and canals (Figure 8.6).
LOCAL RECHARGE
NATURAL ARTIFICIAL
DISTANT RECHARGE
regular intermittent
seasonalexcess rainfall
river & lakebed seepage
leakage fromoverlyingaquifers
minor excessrainfall onunvegetateddunes
infiltration offlash run-off
excessirrigation
irrigationdistributionlosses
VIA NATURALVEGETATION
SALINE AREAS
FRESHSURFACE
WATER BODIES
infiltration in adjacentpermeable hills
run-off infiltration inpiedmont areas
discrete wetlands
extensive riparianvegetation (naturalor agricultural)
coastal waters
salt lakes/playas
discrete spring flow
riverbed seepage
artificial recharge works
OTHERGROUNDWATER
BODIES
leakage to
deeper aquifers
regular or intermittent
regular and/or intermittent
DISCHARGE
DISCHARGE
SATURATED AQUIFER(large storage)
semi-permeable base
(vadose zone)
Figure 8.6. Components of groundwater recharge (Foster et al., 2000)

Assessment of aquifer pollution vulnerability 221
While important conceptually, these distinctions are in practice a simplification of complex natural environments in which both may occur. However, comprehensive reviews of the subject by Lerner et al. (1990) and Simmers (1997) concluded that the following general guidelines were evident from the literature:
• recharge occurs, albeit to a limited degree, even in the most arid environments although increasing aridity will be characterized by a decreasing net downward flux and greater time variability;
• direct recharge is likely to become less important and indirect recharge more important with increasing aridity;
• estimates of direct recharge are likely to be more readily derived than those of localized or indirect recharge.
These generalizations certainly show that successful estimation of groundwater recharge depends on first identifying the probable recharge mechanisms and the important features influencing recharge, and secondly on selecting an estimation method which is suitable for the environment. Even with this understanding, recharge estimation remains one of the most difficult tasks for the groundwater specialist and, in many circumstances, groundwater recharge has proved much more difficult to measure than other components of the hydrological cycle.
8.3.2 Methods for estimating recharge While comprehensive technical guidance on the estimation of recharge is outside the scope of this monograph, nevertheless the features that good methods of recharge estimates should have, and the most likely sources of error can be summarized. Simmers (1997) identified four general sources of error:
• Adopting an incorrect conceptual model. This is the most common and serious source of error, and arises when the groundwater flow system and recharge processes are not fully understood or the simplifying assumptions made are too great or unsound. It is important on the one hand to take account of all of the natural and artificial sources of recharge and on the other hand to avoid double accounting of any sources.
• Neglecting spatial and temporal variability. A particular rainfall amount may not cause recharge if it falls at low intensity during times of high evapotranspiration, but the same amount could produce recharge if it occurred with high intensity when evapotranspiration was low. Major errors can arise if temporal variation is not taken proper account of by using monthly, annual or longer-term average data. Recharge estimates over long periods should be obtained from the sum of values over shorter periods – soil moisture balances based on monthly data may indicate no recharge, especially in arid and semi-arid areas, whereas daily time steps will often show that recharge can occur. The high degree of spatial heterogeneity of soils and aquifers will also limit the degree to which estimates at one location can be applied regionally.
• Measurement error. This is governed by the equipment used and operator skills and, for those parameters that are readily measured such has rainfall, is unlikely to be as important as either of the two above.

222 Protecting Groundwater for Health
• Calculation errors. These can usually be avoided by taking care and by checking that the units in which the various parameters used are either compatible or correctly converted.
Further discussion of these sources of error is given in Lerner et al. (1990). There are five features that should be looked for in a recharge estimation method (Lerner et al., 1990; Simmers, 1997):
• The method should explicitly account for the water that does not become recharge.
• Most methods rely on knowledge of the processes that convert source water into recharge and of the flow mechanisms for that water. Good methods should reveal if the conceptual model underlying the method is correct.
• The method should have low errors associated with it and should not be sensitive to parameters which are difficult to measure or to estimate accurately.
• The method should be easy to use. • Methods utilizing readily and widely available data, such as rainfall are
more useful than those requiring specialized observations. The applicability of a number of recharge methods is shown in Table 8.6. The
time in the last column of the table refers to the typical period over which data are needed to apply the method. For those methods that are event, season or yearly based, the actual data for parameters used may be needed at time steps ranging from hourly through daily and weekly to monthly, depending on the hydrologic setting and the precision required. Large volumes of existing data for things like rainfall, potential evapotranspiration and river flow may need to be collected from the appropriate authorities.
Table 8.6. Direct techniques for recharge estimation (modified from Foster et al., 2000)
Technique Applicability Cost range Time Soil water balance from hydro-meteorological data D(L) +¹ ESYH Hydrological data interpretation water table fluctuations differential stream/canal flow
D(L) L
+¹ +¹
YH E
Chemical and isotopic analyses from saturated zone D and L +-++² HG Chemical and isotopic profiling of unsaturated zone Da,b ++-+++² HG Soil physics measurements Da +++ SY
D/L: diffuse(direct)/localized(indirect) distribution of recharge; a: only suitable for relatively uniform soil profiles; b: not appropriate for irrigated agricultural areas; +, ++, +++: approximate relative range of costs; 1: excluding construction and operation of basic data collection network, which is assumed to exist already; 2: isotopic analyses increase the costs substantially; E: event; S: season; Y: year; H: hydrological time; G: geological time.
Most of the methods listed in Table 8.6 have some but not all of these features, and it is therefore desirable to apply and compare a number of independent approaches. The applicability and potential accuracy of these methods depends on the superficial environment of geology, geomorphology, soils and the climatic and hydrological regime. These factors determine the spatial variability of recharge

Assessment of aquifer pollution vulnerability 223
processes, the distribution and extent of runoff, and the characteristics of the vegetation cover, particularly whether it is natural or agricultural and whether the latter is with or without irrigation. An initial indication of how variable the recharge is likely to be can be gained from the overview of the physical conditions of the area of interest outlined above. It is important also to appreciate that average groundwater recharge is not necessarily constant over time, as changes in land use, irrigation infrastructure (such as construction and operation of canals), irrigation technology and cropping regimes can produce significant changes in recharge rates and also affect the quality of the infiltrating recharge water, as shown in Chapter 9.
Two other major human activities can greatly influence recharge processes. Firstly, the covering of the land by impermeable surfaces in urban areas reduces direct infiltration, can lower evaporation and increase and accelerate surface runoff. Depending on the specific arrangements for storm drainage, overall groundwater recharge may be increased or decreased (Foster et al., 1998). Leaking water mains, on-site sanitation and leaking sewers also contribute urban recharge of differing water quality, and the preliminary physical appraisal of the catchment referred to in Chapter 6 will indicate whether a more detailed consideration of urban recharge processes, as given in Lerner et al. (1990) and Foster et al. (1998) is required to support the assessment of urban impacts in Chapters 10 to 12.
Secondly, because of ever-rising water demands and increasing scarcity of freshwater resources, artificial recharge is becoming more widely used as a component of overall resource management to maintain resources, restore groundwater levels or prevent saline intrusion (Chapter 19). Various sources of water are used in artificial recharge schemes, including rainfall harvesting and collection, river water, mains water, groundwater and reclaimed wastewater, and a wide range of technologies is employed. In general, artificial recharge may improve groundwater quality as well as increasing the available storage in an aquifer. Reclaimed wastewater, however, may contain chemical or microbial pollutants that are poorly characterized but could impact human health. Primary, secondary or tertiary treatment progressively removes these pollutants, provided the treatment facilities are of sufficient capacity, properly designed and correctly operated. Reclaimed water has been used to augment groundwater supplies in the southern USA and in Israel for many years. These are well monitored, high technology installations, but there is increasing interest in the use of untreated or partially treated wastewater to augment scarce water resources, either by direct infiltration or through irrigated cultivation (Chapter 9), and an understanding of the likely pollution threats is therefore required.
8.4 NATURAL HYDROCHEMICAL AND GEOCHEMICAL ENVIRONMENTS
Natural quality varies from one rock type to another, and also within aquifers along groundwater flow paths, as described in Chapter 4. It is important for those with responsibility for protecting groundwater quality to be aware of the

224 Protecting Groundwater for Health
geological environments in which naturally-occurring substances are likely to exceed drinking-water criteria so that groundwater is properly tested for these substances and, if necessary, adequately treated to ensure that water is safe for potable use.
The potential for a naturally occurring chemical constituent to pose a threat to public health from drinking-water depends on the distribution of the constituent in the environment, and on the extent to which the physical and chemical environmental conditions ensure that the constituent has a high solubility, and remains soluble. The geology of an area fundamentally controls the distribution of chemicals in the environment, as particular chemical constituents are generally associated with particular rock types. Very high concentrations can occur in rocks associated with specifically mineralized areas (Chapter 11). Climate also plays an important role in controlling the way that rocks are broken down, and climatic fac-tors influence soil forming processes and the extent to which specific constituents are either concentrated in soil profiles, or are leached into rivers or groundwater.
The geological environments from which the most important health-related chemicals are derived are shown in Table 8.7. Further information about the most important individual chemicals is provided in Chapter 4.
Table 8.7. Environmental factors affecting the distribution of naturally occurring toxic chemicals in water and soil
Geological setting1 Climate Possible health-related constituents in soil and water
Felsic igneous rocks (e.g. granites, pegmatites)
Humid, arid As, Ba, B, Mo, F, Pb, Rn, U; concentrations of B, F, U likely to be higher in drier areas
Alkaline igneous and volcanic rocks Humid, arid As, Ba, B, Mo, F, Pb, Rn, U Mafic and ultramafic igneous and volcanic rocks
Humid, arid Co, Cr, Ni, SO42-
Contact metamorphic rocks Humid, arid Mo, U Iron-rich sedimentary rocks (e.g. feruginous sandstones, siltstones)
Mainly arid As, Co, Ni, Se
Manganese rich sedimentary rocks Mainly arid As, Ba, Co, Mo, Ni Phosphorus-rich sedimentary rocks (limestones, mudstones, siltstones)
Mainly arid Mo, Pb, F, U
Black shales Humid, arid As, Mo, Ni, Pb, Sb Sulphide mineralization Humid, arid Al, As, Co, Cd, Cr, Pb, Mo, Ni, Sb, Se Gold mineralization Humid, arid As, CN, Hg Alluvial plains, mainly in coastal areas Humid, arid As, Co, Cd, Cr, Pb, Mo, Ni, Sb, Se All Arid NO3; high concentrations may occur where
there are leguminous plants (e.g. Acacia species, Box 4.1)
All Humid I; very low concentrations occur in areas of very high rainfall or very high relief
1: Geological association of inorganic constituents based on data presented by Rose et al. (1979).
Assessment of aquifer pollution vulnerability 225
8.5 CHARACTERIZING GROUNDWATER ABSTRACTION
The scale of groundwater abstraction and methods of abstraction used are also important factors in assessing groundwater pollution and protecting groundwater quality. In relation to the former, abstraction sources may create pathways for groundwater pollution, either directly via the borehole or well itself or through the aquifer because heavy and prolonged pumping can modify natural groundwater flow regimes. In relation to the latter, the type, scale and numbers of groundwater abstraction sources have a bearing on the way in which groundwater protection measures can be implemented. Further, the condition of wellheads will influence the potential for direct contamination of drinking-water during abstraction, as well as the potential for ingress of pollutants into the aquifer. The situation assessment should therefore include an appraisal of the condition of the wellhead and its surroundings.
8.5.1 Groundwater abstraction types Groundwater abstraction takes many forms and employs a range of techniques. The use of traditional open dug wells goes back thousands of years, drawing water by hand or using animal power, and there are many parts of the developing world where these remain important supply sources. They are cheap, relatively easy to construct in unconsolidated aquifers and simple to maintain, and therefore remain popular in programmes in which community involvement is strongly promoted. They are, however, highly sensitive to pollution being directly introduced into the open top of the well or through the ground immediately around the well. This direct pollution can be greatly reduced by the use of proper sanitary seals and aprons around the well (Chapter 18), by covering them and by installing hand pumps. Drilled boreholes take many forms from very simple, narrow diameter holes for hand pumps producing less than 0.5 l/s to shafts up to 1 m across from which tens of litres per second can be abstracted for urban supply or irrigation (Driscoll, 1986), or wellfields of individual boreholes all connected up to a major supply, such as those of the Great Man Made River project in Libya. Groundwater is also abstracted from protected springs and from galleries such as the ancient qanats of the Middle East.
Clearly, large-scale groundwater abstraction requires major investment in drilling, borehole materials, pumps and power supplies and the associated pipelines and tanks. The loss of a major supply could be a significant problem to the operator if groundwater pollution were severe enough to render the water unusable. Treatment to remove pollutants, or the location and development of an alternative supply, both of which could be very costly, would be required, emphasizing the benefits of prevention by protecting groundwater.

226 Protecting Groundwater for Health
8.5.2 Groundwater abstraction and pollutant pathways Large and prolonged abstraction can modify groundwater flow rates and directions by reducing or reversing hydraulic gradients and producing cones of depression in the water table or piezometric surface around pumping wells and wellfields. These hydraulic changes can in turn create new pollutant pathways or modify existing ones. In multi-layered aquifer systems in urban areas, the uppermost zones have usually been developed first for groundwater supply, often with many shallow, relatively small boreholes and wells. These are typically privately owned and used for domestic, industrial and commercial supply, and often unregistered and uncontrolled. As cities have grown, the uppermost aquifer is also used, either deliberately or accidentally, as a receptor for urban waste and the shallow groundwater becomes more and more polluted, sometimes to the extent that it becomes unusable. Municipal authorities and other larger groundwater users consequently drill into deeper aquifers in search of better quality groundwater, and the increasing abstraction from depth can induce downward movement of polluted groundwater, threatening these deeper supplies, as described in Section 8.6.
In some circumstances, the very act of constructing wells or boreholes may in itself encourage groundwater pollution by puncturing protective layers above or between aquifers. There are examples both of boreholes permitting downward movement of polluted groundwater from shallow to deeper aquifers, and of deep boreholes penetrating confining layers and allowing naturally saline groundwater to move up into aquifers containing high quality water. Sometimes even observation boreholes for measuring groundwater levels or taking groundwater samples, if constructed without proper understanding of the three-dimensional hydrogeological conditions, can allow this to happen. Abandoned boreholes can, therefore, remain as a potential short-circuiting route for pollutants, and consideration may need to be given to sealing them to try to restore the protective layer. If disused or abandoned boreholes are used, perhaps covertly and illegally, for effluent disposal then their passive short-circuiting role can become an active one as a pollution source, releasing pollutants directly into what may be the most permeable and productive part of the aquifer. Backfilling and sealing may then be urgently required.
Within the situation analysis it is also necessary to assess wellhead protection/sanitary completion. It is important to bear in mind the source-pathway-receptor model introduced in Section I, as pollution at wellheads may require a number of factors to be present. These include hazards (i.e. sources of pollutants) and pathways (which often reflect specific problems with the infrastructure). In addition, it may also be useful to assess indirect or contributing factors (Howard, 2002). These do not either directly cause contamination or offer a pathway for the contamination to enter the groundwater source, but may contribute to the development of a pathway or lead to build up of contamination within the immediate vicinity of the borehole. Examples include aspects such as fencing around the groundwater source, allowing animals to gain access close to the source, lack of drainage to divert contaminated surface water from the wellhead area and deterioration in the engineering works at the wellhead (Table 8.8).

Assessment of aquifer pollution vulnerability 227
Table 8.8. Examples of pathways and contributing factors for microbial contamination (modified from ARGOSS, 2001)
Factors Conditions facilitating pollutant ingress Hazards that may cause contamination through direct ingress (hazard factors)
Open-air defecation Stagnant surface water uphill of the source Waste or refuse dumps Animal faecal matter stored above ground
Pathways for contaminants to enter the source (pathway factors)
Cracked lining Lack of seal on top of rising main Lack of cover on well Cracked or damaged apron or pump-house floor Lack of head wall on well Faulty masonry on spring protection works Eroded backfill or catchment area Rope and bucket used to withdraw water
Contributing factors to contamination (indirect factors)
Lack of fencing Lack of lockable pump-house Lack of adequate diversion drainage to remove surface water Lack of drainage to remove wastewater Animal access to source
8.5.3 Abstraction types and groundwater protection The ways in which groundwater is abstracted need to be considered when thinking about its protection. Scale and distribution are particularly important. Taking the example of the United Kingdom, three large consolidated aquifers provide half or more of the public supplies in the south, centre and east of the country from several hundred high yielding boreholes. The United Kingdom’s national approach to protecting groundwater supplies (Adams and Foster, 1992) designates zones from which the recharge is derived around these supplies, in which certain potentially polluting activities are prohibited or controlled. This and other strategies for groundwater protection are discussed in more detail in Chapter 17. While this approach is sometimes hydrogeologically problematic, given the complex local groundwater flow systems that are often encountered in aquifers, it is logistically and institutionally reasonable to establish protection zones around a relatively small number of large abstractions. This protection approach has been applied widely in Europe and North America to large groundwater supplies, both in the form of individual wells or boreholes and as wellfields – small groups of closely-spaced boreholes all drawing water from the same aquifer and feeding into a common pipeline to convey the water to where it is being used.
The situation would be very different where groundwater is drawn from a large number of much smaller groundwater supplies widely dispersed over the aquifer such as, for example, in India and Bangladesh and large parts of Africa. Not only

228 Protecting Groundwater for Health
is it more difficult to implement protection zoning on this broad scale, the shallow aquifers used for supply may be highly vulnerable to pollution, and many of the boreholes or wells may be privately owned. While this situation may occur in either rural or urban environments, protecting small groundwater supplies from the wide range of potential polluting activities in urban areas is especially problematic. Shallow hand dug wells are often particularly difficult to protect. The conventional approach of protection zoning cannot be easily applied, and the best strategy may be to ensure careful borehole or well siting in relation to pollution sources, together with good construction practice with adequate sanitary seals. This may be backed up a by a policy of resource protection, in which the whole aquifer outcrop, rather than defined zones around individual supplies, is subject to some degree of control of likely pollution sources. In practice, however, any groundwater protection measures may be difficult to implement for large numbers of small dispersed, perhaps private and usually unregistered supplies. Siting supplies to avoid pollution sources (and vice versa) and adequate sanitary protection should always be seen as important lines of defence in protecting health.
At the opposite end of the spectrum of groundwater supplies, in karstic areas large springs are often used. Because of the rapid groundwater flow and response times in karstic aquifers, these may be especially vulnerable to pollution. In addition, karst springs may be supported by groundwater recharge from large catchments that are notoriously difficult to define.
NOTE Approaches to protecting groundwater quality need to be matched not only to the hydrogeological situation, but also to the types and scales of groundwater abstraction.
8.6 SUSCEPTIBILITY OF GROUNDWATER RESOURCES TO DEGRADATION
8.6.1 Scope and scale of resource degradation As a component of the overall sustainable management of water resources, i.e. the quantity of water available for use, is largely outside the scope of this monograph, but it is nevertheless necessary to comment on the potential impacts of groundwater usage on the overall resource situation. This is because heavy and prolonged groundwater abstraction and poor management of groundwater resources can have negative consequences for groundwater quality. These consequences can be severe and are often difficult and costly to manage and remedy. Also, lack of water availability for domestic uses can have severe public health consequences, and in such circumstances health authorities may need to

Assessment of aquifer pollution vulnerability 229
ensure their needs are taken account of in overall water resources management. Approaches to managing water resources are dealt with in Chapter 19.
The availability of groundwater in an area affects current and future drinking-water quality either by the direct effects on groundwater quality or indirectly by changing the degree to which groundwater is available for use. For example, lack of future availability of groundwater may force communities to use surface water that is more contaminated or more difficult to access. Thus there is a need to interact with those outside the health sector involved in the management of groundwater to address all aspects of water management. It is also important to recognize that domestic use of groundwater for drinking-water and household purposes is but one use of groundwater. In many areas, withdrawals for other water-use sectors, particularly agriculture, but also possibly industrial uses, may far exceed withdrawals for domestic use. Worldwide, about 70 per cent of total water use (surface water and groundwater) is for agriculture, 22 per cent for industry, and 8 per cent for domestic purposes (Bowden, 2002). Heavy groundwater use for irrigation is commonly a major cause of groundwater level declines. The linkages between water quality and water quantity suggest that monitoring programmes for each should be integrated. Greater attention is needed to the long-term value of water-level data collected as part of water-quality monitoring and to the potential synergies between water quality and water level monitoring networks (Taylor and Alley, 2002).
Traditionally, surface water and groundwater have been treated as separate water resources, so that one could be utilized independently without affecting the other. With increased utilization of water resources, has come greater recognition of surface water and groundwater as fundamentally interconnected (Winter et al., 1998). Depletion of one resource eventually results in depletion of the other, and likewise, contamination of one resource can contaminate the other. This recognition of groundwater and surface water as a single resource has increased the imperative for those involved in development of groundwater to interact with those involved with surface water, and vice versa. This is true from both water quantity and water quality perspectives.
Over-exploitation of groundwater resources or individual aquifers by uncontrolled, excessive abstraction, while often not precisely definable in scientific terms is nevertheless an emotive term when used at the political or institutional level (Foster et al., 2000). At this level, concern relates more to the consequences of excessive abstraction rather than to the volumes of water themselves, although the latter need to be regularly monitored to determine whether control measures are proving effective. Many of the changes in response to groundwater pumping are subtle, and they may occur over long periods of time. Development of groundwater resources increasingly requires a more complete understanding of the effects of abstractions on groundwater systems (Alley et al., 2002).
The impacts of excessive abstraction range from the often reversible interference with springs and other wells to much less reversible degradation caused by ingress of saline or polluted water and land subsidence (Foster, 1992;

230 Protecting Groundwater for Health
Alley et al., 1999; Custodio, 2002). While declines in groundwater levels and reduced spring flow or baseflow may be reversible in humid areas, groundwater mining in arid regions can be virtually irreversible (in the absence of artificial recharge) on any practical time scale. The cumulative effects of pumping can cause significant and unanticipated consequences when not properly considered in management plans. The possible consequences of large abstractions are summarized in Table 8.9 and in the text below, and the susceptibility of the broad classes of hydrogeological environments defined in Chapter 2 to some of these effects is shown in Table 8.10.
Table 8.9. Consequences of excessive groundwater abstraction (adapted from Foster et al., 2000)
Consequences of excessive abstraction Factors affecting susceptibility Reversible interference
pumping lifts/costs increase borehole yield reduction spring flow/base flow reduction
aquifer response characteristic drawdown to productive horizon aquifer storage characteristic
Reversible/ irreversible
phreatophytic vegetation stress (both natural and agricultural) aquifer compaction/transmissivity reduction
depth to groundwater table aquifer compressibility
Irreversible deterioration
saline water intrusion ingress of polluted water (from shallow aquifer, river or canal) land subsidence and related effects
proximity of saline or polluted water vertical compressibility of over-lying/interbedded aquitards
The reversible effects in the upper part of Table 8.9 result when an excessive
number of boreholes or wells are constructed and heavily pumped, especially if the uppermost part of the subsurface geological sequence provides the most productive aquifer. The two effects in the middle of the table, vegetation stress and aquifer compaction with reduction in transmissivity, may be reversible or irreversible, depending on the hydrogeological conditions and the length of time over which the excessive abstraction has been established. The most serious effects, which are irreversible or nearly so, include the mechanisms of quality deterioration given at the bottom of Table 8.9.
8.6.2 Deterioration of groundwater quality Groundwater abstraction can affect water quality in several ways. Perhaps best known is saltwater intrusion in coastal areas resulting from large withdrawals of groundwater. Some inland aquifers also experience similar problems, where withdrawal of good-quality water from the upper parts of aquifers allows underlying saline water to move upward and degrade water quality. Changes in the quality of water as a result of abstractions also can occur as water levels decline and the pumped water originates from different parts of the aquifer system, usually because of the downward movement of polluted water in response to pumping. Likewise, declining water levels can result in changing oxidation and other hydrochemical conditions, mobilizing or precipitating different chemical constituents. In addition,

Assessment of aquifer pollution vulnerability 231
surface water can be drawn into the aquifer with poorer water quality or of a chemical composition that mobilizes naturally occurring chemicals.
There are numerous examples of saline intrusion where heavy groundwater abstraction from productive coastal limestone or alluvial aquifers for urban, industrial or agricultural usage has produced serious intrusion of saline water into these aquifers, often stretching far inland. Under natural conditions in coastal aquifers, fresh water derived from recharge overlies saline water in such a way that flow takes place towards the sea (Figure 8.7A). Their relative densities govern the position of the boundary between fresh and saline water. Under simplifying assumptions (homogeneous aquifer properties and no vertical gradients in heads), the depth of the interface below sea level can be assumed to be about 40 times the height of the fresh groundwater table above sea level. This is known as the Ghyben-Herzberg relationship, and is described in most hydrogeology textbooks (Freeze and Cherry, 1979; Domenico and Schwartz, 1998). On small islands such as those of the Caribbean and the Florida Keys the result is a lens-shaped body of freshwater which can be difficult to exploit without causing quality deterioration.
Figure 8.7. Impact of abstraction on a coastal aquifer system (Morris et al., 2003; British Geological Survey ©NERC)
When pumping disturbs the natural conditions (Figure 8.7B), the consequent lowering of the freshwater table results in a corresponding movement of the freshwater-salt water interface which, given the relationship described above, is in the ratio of 40:1, i.e. 1 m of water level decline produces about 40 m of upward

232 Protecting Groundwater for Health
movement of the interface. In practice the interface is not usually sharp and uniform, but affected by dispersion, and in detail the three-dimensional picture of saline intrusion can be particularly complicated where rapid movement along fractures and fissures permits a complex fingering of saline water far inland. Given that coastal plains are often densely populated and agriculturally productive regions, it is not surprising that groundwater abstraction has grown rapidly. The resulting serious saline intrusion problems have been encountered in many aquifers, e.g. on the Mediterranean Coast of Spain, in the Netherlands, Mexico, Florida, Cyprus and some of the Caribbean islands. Even far from coastal regions, upconing of saline water from deeper aquifers can be caused by heavy groundwater abstraction from freshwater zones above.
Induced downward movement of pollutants is widely observed in many rapidly developing urban areas underlain by multi-layered aquifer sequences in which the establishment of large-scale abstraction from deeper aquifer horizons imposes or accentuates downward hydraulic gradients and induces accelerated downward movement of polluted water from shallower aquifers. In the city of Santa Cruz in Bolivia, for example, most private boreholes supplying water for industries, small businesses and private domestic use draw groundwater from less than 90 m depth, whereas the public supply is largely dawn from deeper aquifers between 90 and 350 m below ground. The shallow groundwater has become polluted (Figure 8.8) from poor waste disposal practices, and abstraction has induced downward movement of polluted water. This general situation is rather widespread, but the degree of protection of the deeper aquifers and likely timescale of any deterioration in the quality of the groundwater abstracted from them depends on the local hydrogeological situation, and will certainly need specific assessment.
��
��
��
��
��
��
��
���
���
��
��
�
���� ������ ��������� ������ �� �������������� �������
����� ����������� ��������������� ���������� �� ������������� ������������
���
���
���
������ � �!"�#�$�����$��%&'��#%�&����"�"�#(�)���*�(�����
���� ��������� ������������� ���������� �� �������������� ������������
��
�
��
�
��
��
�
�
��
���
���
���
��
���
��
��
��
��
��
��
��
��
���
���
� �
��
Figure 8.8. Schematic cross-section illustrating downward pollutant migration induced by pumping in a multi-aquifer sequence, Santa Cruz, Bolivia (modified from Morris et al., 1994)

Assessment of aquifer pollution vulnerability 233
The second situation mentioned above, i.e. changes in the oxidation-reduction potential of the groundwater resulting in the mobilization of metals is illustrated by the situation in Hat Yai, Thailand. The city obtains about 50 per cent of its water supply from private boreholes drawing from an aquifer below a semi-confining layer consisting of about 30 m of silts. Seepage of organic-rich wastewaters from collection canals into the upper part of the underlying alluvial aquifer sequence has produced strongly reducing groundwater. This permits the release of naturally-occurring iron and manganese from the sediments and allows the build up of troublesome concentrations of ammonium, which are being drawn down to the abstraction boreholes (Figure 8.9).
+���,-./�0�-.1�.�2�3.
41.���0�-.1�.�2�3.
�5,6-�1/
*( *% ��%#"���$��7("$%��8 "9"�#�$�$�%�'��� *�(�% ����%�:
�5,64.1
0�-.1�-�;�.
����������
�����#<��% (&"�#�&�� "�"����*�� (&%'"#'�4%��� �=��&��&%�����"���
*"%>� %��"&��(�$�&%��$�% "�&��$"�% ��7("$%�
$������$� � %��%�?�#%"� (&% �)<*( *"�#
�5,64.1
Figure 8.9. Groundwater quality degradation induced by pumping, Hat Yai, Thailand (Foster et al., 1998)
This general picture of urban public supplies being vulnerable to polluted shallow groundwater is probably a widespread problem, and cities such as Nottingham (United Kingdom), Lahore, Karachi (Pakistan) and New Delhi (India) are either experiencing such pollution already or it can be anticipated in the future. The degree of protection afforded by any intervening lower-permeability strata, and the likely timescale of any impacts on deeper groundwater require specific investigations in each case. Similar problems can also be experienced where municipal water supplies are drawn from neighbouring rural areas in which urban wastewater is used for irrigation.
The linkages between groundwater quantity and quality management are well illustrated by the region west of Lake Michigan in the USA, an area that includes the major cities of Chicago and Milwaukee and hosts a population in excess of 12 million people. A number of converging issues have placed increasing pressure in

234 Protecting Groundwater for Health
recent years on groundwater resource for these communities, most of which rely heavily on a regional sandstone aquifer. Pumping from this aquifer has resulted in a drawdown cone that extends throughout much of the region, with water-level declines in excess of 300 m measured at some locations. This regional drawdown cone is one of the largest in the USA. Although partial recovery has taken place in some areas through reduction in withdrawals, concern continues about the drawdowns, as well as their water quality implications. For example, the presence of high levels of arsenic in the upper part of the sandstone aquifer in some areas has been attributed to the oxidation of minerals in the newly unsaturated deposits at the top of the sandstone aquifer. Likewise, proposals for artificial recharge to store Lake Michigan water in the aquifer have been hampered by the detection of arsenic in the recovered water. Drawdown in the sandstone aquifer has also coincided with increases in the concentration of total dissolved solids (TDS) in much of the aquifer from upcoming of saline water and leakage from shale beds. Radium concentrations generally show a direct correlation with the concentration of TDS, and it is anticipated that increases in TDS associated with drawdown in the sandstone aquifer may result in an increase in radium concentrations. To properly address these multi-faceted issues, cooperative efforts are needed on a region wide basis to examine various approaches such as strategically shifting water supply to surface water or to other aquifers, optimizing the location and pumping from wells so as to minimize drawdown problems across pumping centres, installation of deeper casing for new private wells or use of deeper ‘cluster’ wells for multiple households, further investigation of the water-quality effects of artificial recharge, and various treatment options.
8.6.3 Other effects of excessive abstraction As the depth to water increases, the water must be lifted higher to reach the land surface, and as the lift distance increases, greater energy is required to drive the pump. Depending on the use of the water and the cost of energy, it may no longer be economically feasible to use water for a given purpose. Furthermore, with declining water levels, well yields will decline, possibly below usable rates. In extreme cases, groundwater levels may fall below the bottom of existing pumps, necessitating the expense of lowering the pump, deepening the well, or drilling a deeper replacement well.
In many environments, surface-water and groundwater systems are intimately linked. Groundwater abstraction can reduce spring flow, or alter how water moves between an aquifer and streams, lakes, or wetlands. The decrease in contribution to surface water may occur either by intercepting groundwater flow that discharged into a surface water body under natural conditions, or by increasing the rate of water movement from surface water into an aquifer.
Although several different earth processes can cause land subsidence, a considerable amount is caused by groundwater withdrawals. For example, more than 80 per cent of the land subsidence in the USA is related to the withdrawal of groundwater (Galloway et al., 1999). Geologic conditions most susceptible to

Assessment of aquifer pollution vulnerability 235
subsidence are the existence of compressible clay and silt layers or rocks that are relatively soluble, such as limestone, dolomite or evaporite deposits.
8.6.4 Impacts of abstraction and hydrogeological environments All groundwater abstraction results in some decline in water levels in the aquifer over a certain area. Some reduction is often necessary and desirable since improved land drainage is often a side effect or even an objective of the pumping. A degree of induced seasonal water level decline may also be desirable for creating subsurface storage to receive the high rates of wet season recharge. If, however, the overall abstraction rate in the area of interest, or in the aquifer as a whole, exceeds the long-term average rate of replenishment, then there will be continuous decline in groundwater levels and mining of aquifer storage is the result. The presence or absence, and the relative severity of the effects of excessive groundwater exploitation are highly dependent on hydrogeological environment, as shown in Table 8.10.
Table 8.10. Susceptibility of hydrogeological environments to adverse effects of excessive abstraction
Type of side-effect Hydrogeological environment Saline intrusion or upcoming
Land subsidence
Induced pollution
Major alluvial and coastal plain sediments coastal √√ √√ √√ inland √ √ √√ Intermontane alluvium and volcanics with lacustrine deposits √√ √√ √ without lacustrine deposits √ √ √√ with permeable lavas/breccias √√ - √√ without permeable lavas/breccias √ - √ Consolidated sedimentary aquifers √√ - √ Recent coastal calcareous formations √√ - √ Glacial deposits √ √ √ Loessic plateau deposits - √ - Weathered basement complex - - √
√√: major effects; √: occurrences known; -: not applicable or rare.

236 Protecting Groundwater for Health
8.7 CHECKLIST
NOTE The following checklist outlines information needed for assessing aquifer pollution vulnerability and susceptibility to the impacts of abstraction in the drinking-water catchment area. It supports hazard analysis in the context of developing a Water Safety Plan (Chapter 16). It is neither complete nor designed as a template for direct use but needs to be adapted for local conditions.
What is the main hydrogeological environment in the recharge area?
Establish the dominant geology and the major rock types From the geological description and lithology, check whether
intergranular or fracture flow is predominant Check whether a hydrogeological map is available which gives this
information …
Is the groundwater flow regime already known, or can a conceptual model of the regional flow system be developed?
Identify the vertical and lateral aquifer boundaries Check whether the aquifer is single or multi-layered Check whether the groundwater is confined or unconfined Check whether there are major faults which could form hydraulic
barriers Check whether there are rivers, lakes or other surface waters which
could interact with groundwater Identify recharge and discharge areas Establish whether there is hydraulic connection with and
groundwater discharge to the sea …
What are the physical conditions at the land surface?
Define the topography and slopes Estimate annual rainfall, its seasonal pattern and variability from
year to year Identify the main land use types

Assessment of aquifer pollution vulnerability 237
Identify roads, railways, airports and other major infrastructure …
What are the soil conditions?
Check whether soil maps of the area are available Identify the main soil types Assess the leaching potentials of the various soil types …
What are the main sources of recharge to groundwater?
Analyse whether there is direct recharge by infiltration from rainfall Evaluate whether the topography is such as to provide scope for
localized recharge Check whether there are sources and routes for indirect recharge Identify man-made modifications to the natural recharge regime
(e.g. canals, irrigated fields, urban storm water infiltration, leaking water mains, leaking sewers)
Identify artificial recharge facilities Check whether identified recharge sources can be quantified Evaluate whether identified recharge sources can affect groundwater
quality: is their quality known? Analyse whether the identified recharge sources are changing
significantly with time in either quantity or quality …
What is the vulnerability of groundwater to pollution?
Check whether groundwater vulnerability has already been characterized and mapped at an appropriate scale
If not, check whether a broad classification from the geology does mean that it should be formally assessed
Evaluate whether there is sufficient available information to assess groundwater vulnerability
Based on the available information, assess whether a suitable approach can be developed
…

238 Protecting Groundwater for Health
What are the natural baseline hydrochemical conditions in the recharge area?
Analyse underlying geology and assess whether it is likely to give rise to natural groundwater quality constraints
Check availability of monitoring data from which the baseline quality can be established
If not, obtain a preliminary idea of baseline quality from existing literature
Check whether the hydrochemical conditions are oxidizing or reducing
Evaluate whether the conditions change along groundwater flow lines or with depth
Evaluate whether there are elevated constituents of the natural groundwater quality that affect its required uses
…
What is the groundwater abstraction in the study area?
Compile information on the location of groundwater abstraction Compile information on techniques employed for groundwater
abstraction Check adequacy of wellhead protection measures, wellhead
construction and maintenance as well as sanitary seals used (Chapter 18)
Evaluate whether there is a multi-layered aquifer sequence with abstraction from different levels
Assess the potential for shallow polluted groundwater to be induced downwards
Identify occurrence and location of abandoned wells or boreholes which could act as pollutant pathways
…
Is the groundwater susceptible to resource degradation?
Assess whether groundwater abstraction is increasing and likely to continue increasing
Evaluate whether groundwater abstraction exceeds average recharge Identify observable signs of persistent decline in groundwater levels …

Assessment of aquifer pollution vulnerability 239
Documentation and visualization of information on aquifer pollution vulnerability and impacts of abstraction
Compile summarizing report and consolidate information from checklist points above
…
8.8 REFERENCES Adams, B. and Foster, S.S.D. (1992) Land-surface zoning for groundwater protection. J.
Institution of Water & Environ. Man., 6, 312-320. Albinet, M. and Margat, J. (1970) Cartographie de la vulnerabilité à la pollution des nappes
d’eau souterraine. Bulletin BRGM 2nd Series, 3(4), 13-22. Aller, L., Bennett, T., Lehr, J.H., Pett, R.J. and Hackett, G. (1987) DRASTIC: A
Standardised System For Evaluating Groundwater Pollution Potential Using Hydrogeologic Settings. EPA/600/2-85/018, US EPA, Ada, Oklahoma.
Alley, W.M., Reilly, T.E. and Franke, O.L. (1999) Sustainability of Ground-water Resources. USGS, Circular 1186. http://pubs.water.usgs.gov./circ1186/ (accessed April 29, 2005).
Alley, W.M., Healy, R.W., LaBaugh, J.W. and Reilly, T.E. (2002) Flow and storage in groundwater systems. Science, 296, 1985-1990.
Andersen, L.J. and Gosk, E. (1987) Applicability of vulnerability maps. TNO Committee for Hydrological Research: Proceedings and information, 38, 321-332, Delft.
ARGOSS (2001) Guidelines For Assessing the Risk to Groundwater From On-site Sanitation. BGS Commissioned Report, CR/01/142, Keyworth.
Bowden, R. (2002) Water Supply: Our Impact on the Planet, Hodder Wayland, London. Chapman, D. (ed) (1996) Water Quality Assessments, 2nd edn, E & F N Spon, London. Custodio, E. (2002) Aquifer overexploitation: what does it mean? Hydrogeology J., 10,
254-277. Daly, D., Dassargues, A., Drew, D., Dunne, N., Goldschneider, N., Neale, I., Popescu, C.
and Zwahlen, F. (2001) Main concepts of the European approach for karst groundwater resource assessment and mapping. Hydrogeology J., 10, 340-345.
Doerfliger, N. and Zwahlen, F. (1998) Practical Guide to Groundwater Vulnerability Mapping in Karstic Regions. Swiss Agency for Environment, Forest and Landscape, Berne.
Domenico, P.A. and Schwartz, F.W. (1998) Physical and Chemical Hydrogeology, 2nd edn, John Wiley & Sons, New York.
Driscoll, F.G. (1986) Groundwater and Wells, 2nd edn, Johnson Division, St Paul, Minnesota.
Foster, S.S.D. (1992) Unsustainable development and irrational exploitation of groundwater resources in developing nations - an overview. In Selected Papers on Aquifer Overexploitation, vol. 3, pp. 321-336, Heise, Hannover.
Foster, S.S.D. and Hirata, R. (1988) Groundwater Pollution Risk Assessment. Pan American Centre for Sanitary Engineering and Environmental Sciences, Lima.
Foster, S., Chilton, J., Moench, M., Cardy, F. and Schiffler, M. (2000) Groundwater in Rural Development: Facing the challenges of supply and resource sustainability. World Bank Technical Paper 463, Washington, DC.
Foster, S., Lawrence, A. and Morris, B. (1998) Groundwater in Urban Development: Assessing management needs and formulating policy strategies. World Bank Technical Paper 390, Washington, DC.

240 Protecting Groundwater for Health
Foster, S.S.D., Hirata, R, Gomes, D., D’Elia, M. and Paris, M. (2002) Groundwater Quality Protection : A guide for water utilities, municipal authorities and environment agencies. The World Bank, Washington, DC.
Freeze, R.A. and Cherry, J.A. (1979) Groundwater. Prentice Hall, Englewood Cliffs, New Jersey.
Galloway, D.L., Jones, D.R. and Ingebritsen, S.E. (1999) Land Subsidence in the United States. USGS, Circular 1182. http://pubs.water.usgs.gov/circ1182/ (accessed April 29, 2005).
Groundwater Development Consultants (1989) Spilsby Sandstone Investigation. CDP 3R-56. Final Report to Anglian Water, Lincoln.
Hölting, B., Haertlé, T., Hohberger, K-H., Nachtigall, K.H., Villinger, E., Weinzierl, W. and Wrobel, J-P. (1995) Konzept zur Ermittlung der Schutzfunktion der Grundwasser-überdeckung. Geol. Jb., C-63, 5-24. [translated into English by the Federal Institute for Geosciences and Natural Resources: Concept for the Determination of the Protective Effectiveness of the Cover above the Groundwater against Pollution. – Ad-hoc Working Group on Hydrogeology, Hanover]
Howard, G. (ed) (2002) Urban Water Supply Surveillance - A Reference Manual. WEDC, Loughborough University.
Kalinski, R.J., Kelly, W.E., Bogardi, I., Ehrman, R.L. and Yamamoto, P.D. (1994) Correlation between DRASTIC vulnerabilities and incidents of VOC contamination of municipal wells in Nebraska. Ground Water, 32(1), 31-34.
Kim, Y.J. and Hamm, S.Y. (1999) Assessment of the potential for groundwater contamination using the DRASTIC/EGIS technique, Cheonju area, South Korea. Hydrogeology J., 7, 227-235.
Le Grand, H.E. (1983) A Standardised System For Evaluating Waste-Disposal Sites. National Water Well Association, Dublin, Ohio.
Lerner, D.N., Issar, A. and Simmers, I. (1990) Groundwater recharge; a guide to understanding and estimating natural recharge. Internat. Assoc. Hydrogeologists, 8, 345.
Lewis W.J., Foster S.S.D. and Drasar B.S. (1980) Risk of groundwater pollution by on-site sanitation in developing countries: a literature review. IRCWD Report 01/82
Margane, A., Hobler, M. and Subah, A. (1999) Mapping of groundwater vulnerability and hazards to groundwater in the Irbid Area, N. Jordan. Z. Angew. Geol., 45, 175-187.
Morris, B.L., Lawrence, A.R. and Stuart M.E. (1994) The Impact of Urbanization on Groundwater Quality – Project Summary Report. Technical Report WC/94/56, BGS, Keyworth.
Morris, B.L. Lawrence, A.R., Chilton, P.J., Adams, B., Calow, R. and Klinck, B.A. (2003) Groundwater and its Susceptibility to Degradation: A global assessment of the problem and options for management. Early Warning Report Series, RS 03-3, UNEP, Nairobi.
NRC (1993) Groundwater Vulnerability Assessment: Contamination potential under conditions of uncertainty. NRC, National Academy Press, Washington, DC.
Palmer, R.C. and Lewis, M.A. (1998) Assessment of groundwater vulnerability in England and Wales. In Groundwater Pollution, Aquifer Recharge and Vulnerability, pp. 191-198, Geological Society Special Publication 130, London.
Palmer, R.C., Holman, I., Robins, N.S. and Lewis, M.A. (1995) Guide to Groundwater Vulnerability Mapping in England and Wales. National Rivers Authority, HMSO, London.
Rose, A.W., Hawkes, H.E. and Webb, J.S. (1979) Geochemistry in Mineral Exploration. Academic Press, London.
Rosen, L. (1994) A study of the DRASTIC methodology with emphasis on Swedish conditions. Ground Water, 32(2), 278-285.

Assessment of aquifer pollution vulnerability 241
Shahid, S. (2000) A study of groundwater pollution vulnerability using DRASTIC/GIS, West Bengal, India. J. Environ. Hydrol., 8, 1-9.
Simmers, I. (ed) (1997) Recharge of phreatic aquifers in (semi-) arid areas. Internat. Assoc. Hydrogeologists, 19, 277.
Struckmeier, W.F. and Margat, J. (1995) Hydrogeological maps: a guide and a standard legend. Internat. Assoc. Hydrogeologists, 17, 177.
Taylor, C.J. and Alley, W.M. (2002) Ground-water-Level Monitoring and the Importance of Long-term Water-level Data. USGS, Circular 1217, http://pubs.water.usgs.gov/ circ/circ1217/ (accessed April 29, 2005).
UNESCO (1970) International Legend For Hydrogeological Maps. UNESCO/IASH/ IAH/IGS, Paris.
US EPA (1992) Handbook: Ground Water and Wellhead Protection. US EPA Report No. EPA/625/R-94/001, Washington, DC.
Vrba, J. and Zaporozec, A. (eds) (1994) Guidebook on mapping groundwater vulnerability. Internat. Assoc. Hydrogeologists, 16, 131.
Winter, T.C., Harvey, J.W., Franke, O.L. and Alley, W.M. (1998) Ground Water and Surface Water- A Single Resource. USGS, Circular 1139. http://pubs.water.usgs. gov/circ/circ1139/ (accessed April 29, 2005).


© 2006 World Health Organization. Protecting Groundwater for Health: Managing the Quality of Drinking-water Sources. Edited by O. Schmoll, G. Howard, J. Chilton and I. Chorus. ISBN: 1843390795. Published by IWA Publishing, London, UK.
9 Agriculture: Potential hazards and information needs
S. Appleyard and O. Schmoll
Agriculture has only received serious attention as a source of groundwater contamination in the last few decades because of the intense focus on industrial and urban pollution problems in many developed countries. However, agricultural practices are often significant sources of health-relevant groundwater pollution. Nitrate contamination can be found in many parts of the world mainly due to the large land area used for agriculture and the usage of chemical fertilizers and animal manures to enhance crop yields. The use of animal manures and the production and disposal of wastes from livestock can also contaminate groundwater with pathogens. A wide range of pesticides used in agriculture to control weeds, insects, nematodes, and fungi in crops, can pollute groundwater. Further, land clearing for agriculture can also lead to groundwater quality problems due to changes in hydrological conditions.
Contamination of groundwater by agriculture can cause serious health problems in rural and urban populations that depend on groundwater for water supply. The discharge of polluted groundwater into wetlands, rivers, estuaries and the coastal environment can contribute to toxic algal blooms in these water bodies that can also cause health problems. These problems have progressively increased over the last few decades with the general intensification of agriculture to feed the world’s growing population.

244 Protecting Groundwater for Health
In many parts of the world, more than 40 per cent of the land surface is used for agricultural production, and in very densely populated countries, the proportion of agricultural land is often greater than 70 per cent of the land surface. An increasing proportion of the world’s population is moving from rural areas to large urban centres. In both developing and developed countries, horticulture and market gardening are increasingly being carried out on vacant land within cities and in peri-urban areas. Urban agriculture is extremely important for impoverished urban dwellers in low income countries, as it provides a measure of food security when there is little disposable income to purchase food, and urban agriculture typically provides more than half of the urban household’s food needs in many Asian cities.
Agricultural practices vary enormously throughout the world due to variations in climate and soil types, population density and traditional and modern methods of cultivation. However, there are a number of common agricultural activities that frequently are significant sources of groundwater pollution. These are presented here together with guidance on how to compile the information needed for situation assessment.
NOTE Agricultural practices and the environment in which they take place vary greatly. Health hazards arising from agriculture and their potential to pollute groundwater therefore need to be analysed specifically for the conditions in a given setting. The information in this chapter supports hazard analysis in the context of developing a Water Safety Plan for a given water supply (Chapter 16). Options for controlling these risks are introduced in Chapter 21.
9.1 USE OF MANURES AND FERTILIZERS Animal manures and human excrement have probably been used as a source of nutrients to enhance crop yields since agriculture commenced more than 4000 years ago. They are still widely used as fertilizers in the developing world, where chemical fertilizers are often expensive and not widely available. Animal manures are also still used in the developed world to reduce fertilizer costs and as a disposal method for animal wastes, particularly from intensive animal rearing. They are also being re-introduced to agriculture as alternatives to chemical fertilizers through the increased popularity of organic farming methods. Chemical fertilizers in contrast have only been available for the last 100 years, and only widely available for the last 50 years. Nitrate contamination Among the nutrients, nitrogen species in manures and fertilizers are the chemicals of greatest concern as groundwater pollutants, and among them particularly nitrate because of the high solubility of most nitrate salts and because of its potential health effects in drinking-water.

Agriculture: Potential hazards and information needs 245
Livestock manures mainly consist of organic matter, nutrients (nitrogen, phosphorus and potassium) and trace elements. When managed correctly, nutrients in livestock can be a valuable resource. The nutrient content of manures varies considerably depending on animal species, manure moisture, feeding methods and nutritional conditions, but is generally much higher in poultry than other livestock. Table 9.1 shows the mass of nitrogen, phosphorus and potassium contained in excreta for a variety of animals.
Table 9.1. Typical nitrogen (N), phosphorus (P) and potassium (K) content in solid and liquid manure (adapted from US EPA, 2000)
Type of stock Total N Total P Total K Solid manure Dairy cattle Beef cattle Swine Poultry Sheep Horse
Liquid manure Dairy cattle Beef cattle Poultry Swine
(kg/t) 2-7 6-21 8 9-32 12 19
(kg/10³ l) 0.5-4 0.5-5 8-10 0.5-4
(kg/t) 0.7-2 1-3 1-2 3-12 1-2 0.7
(kg/10³ l) 0.2-1 0.5-1 2-3 0.1-1
(kg/t) 0.7-5 4-9 2-3 4-19 9-10 5
(kg/10³ l) 0.5-3 0.5-3 3-10 0.4-2
Nitrogen occurs in both inorganic and organic chemical species in manure. The
ammonium form (NH4+) originates from urea nitrogen in the urine, and the more stable
organic form largely originates from faeces. The nitrogen content of manures varies considerably depending on its age and on how it is handled and stored, and is generally much lower in well aged manures due to the volatilization of ammonia (NH3) into the atmosphere. During storage either in open or closed systems ammonia losses occur in a range of 5-40 per cent (White and Sharpley, 1996).
Losses due to ammonia volatilization can occur very rapidly, and up to 20 per cent of nitrogen can be lost within 4 days of fresh manures being applied to the surface of soils. If manures are ploughed into the soil, ammonium is either directly available to the plants or converts to another plant available form, nitrate nitrogen (NO3
-), and the losses may be reduced to about 5 per cent (White and Sharpley, 1996). Figure 9.1 summarizes the chemical behaviour of nitrogenous material applied to soils in manure and fertilizers.
Once manure is applied to a soil as solids or in slurries, a number of chemical and microbial processes can occur depending on chemical conditions within the soil. Organic matter containing nitrogen is progressively broken down by microbial activity releasing ammonium ions that are generally absorbed by clay particles in the soil. In well aerated soils, nitrifying bacteria oxidize ammonium to nitrate, and if there is abundant organic matter within the soil profile and anaerobic conditions, denitrifying bacteria can convert nitrate to nitrogen gas which diffuses through the soil back into the atmosphere. Plant uptake of nitrate and ammonium removes nitrogen from the soil profile. Organic nitrogen is largely unavailable to plants until microbial activity in soil releases ammonium from the organic matter (Figure 9.1; also see Chapter 4.3).

246 Protecting Groundwater for Health
AtmosphericNitrogen
Denitrification Loss as nitrogen gas
NITRATE
LeachingLoss of nitrateto groundwater
GaseousLoss as
ammonia
Commercialfertiliser
Biologicalfixation
Legumes
AmmoniumAmmonium
Animal & plantwastes
Uptakeby plants
Atmosphericfixation
Figure 9.1. The physical and chemical behaviour of nitrogen in an agricultural catchment
Chemical fertilizers consist of inorganic salts of nitrogen, phosphorus, potassium and sulphur with the addition of some trace metals necessary for healthy plant growth. Generally, nitrogen is present in inorganic fertilizers in the form of soluble salts of ammonium and nitrate. Nitrogen in fertilizer is generally more available for plant uptake than from manures, but is also more easily leached into groundwater if used in excess. Slow release fertilizers greatly reduce the risk of nutrient leaching, but these are often too expensive for widespread use in agriculture. Table 9.2 shows the typical chemical composition of common inorganic fertilizers or constituents of fertilizer formulations.
The amount of nitrogen applied in manure and fertilizer varies greatly depending on a range of factors. Ideally, application rates should be adapted to the cropping system used, plant uptake rates, soil contents of nutrient fraction available to the crop and climate and soil conditions in the drinking-water catchment area (see Chapter 21). However, in many situations rates of application exceed crop uptake rates. This is especially the case in areas with high livestock densities or intensive livestock farming where volumes of animal waste produced often exceed local demand for use as fertilizer. In these areas, application practices for manures may be driven by the need of getting rid of them rather than their use as a nutrient source. This problem tends to occur where other means of managing the large amounts of animal wastes are difficult and transportation costs for a wider distribution of manure to areas where soils show fertilizer deficits are unattractive or prohibitive. Moreover, application of chemical fertilizers and manures can also
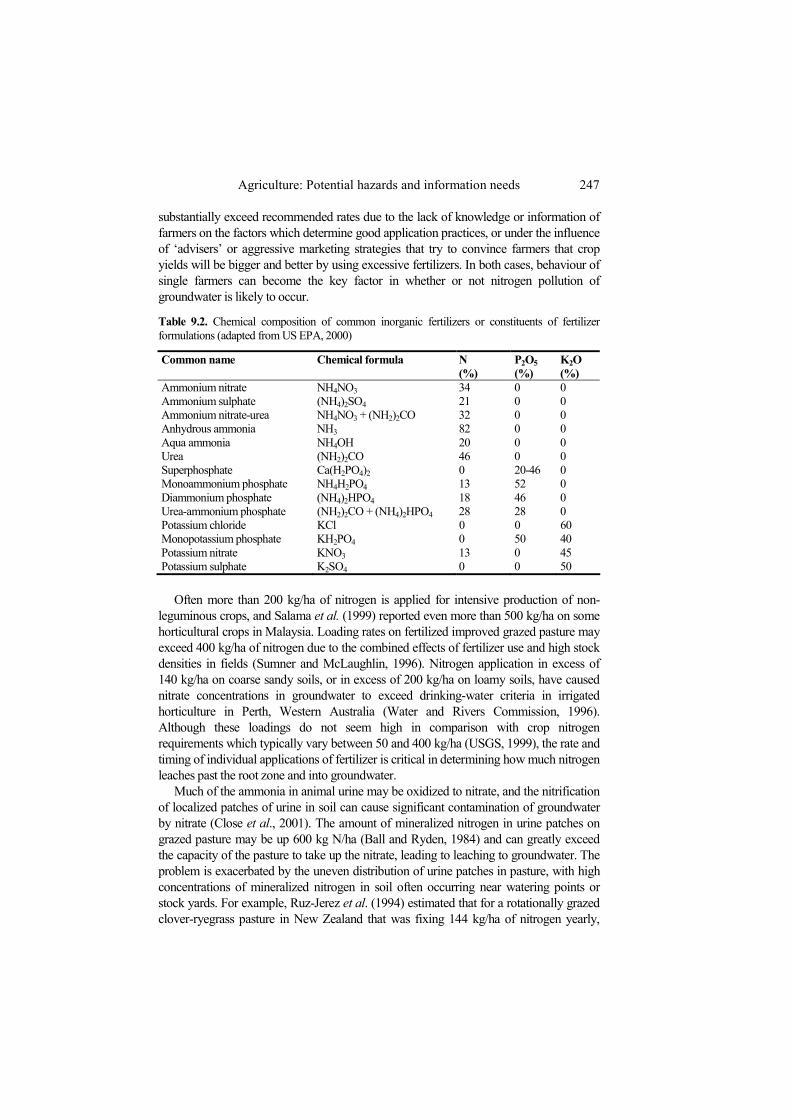
Agriculture: Potential hazards and information needs 247
substantially exceed recommended rates due to the lack of knowledge or information of farmers on the factors which determine good application practices, or under the influence of ‘advisers’ or aggressive marketing strategies that try to convince farmers that crop yields will be bigger and better by using excessive fertilizers. In both cases, behaviour of single farmers can become the key factor in whether or not nitrogen pollution of groundwater is likely to occur.
Table 9.2. Chemical composition of common inorganic fertilizers or constituents of fertilizer formulations (adapted from US EPA, 2000)
Common name Chemical formula N (%)
P2O5 (%)
K2O (%)
Ammonium nitrate NH4NO3 34 0 0 Ammonium sulphate (NH4)2SO4 21 0 0 Ammonium nitrate-urea NH4NO3 + (NH2)2CO 32 0 0 Anhydrous ammonia NH3 82 0 0 Aqua ammonia NH4OH 20 0 0 Urea (NH2)2CO 46 0 0 Superphosphate Ca(H2PO4)2 0 20-46 0 Monoammonium phosphate NH4H2PO4 13 52 0 Diammonium phosphate (NH4)2HPO4 18 46 0 Urea-ammonium phosphate (NH2)2CO + (NH4)2HPO4 28 28 0 Potassium chloride KCl 0 0 60 Monopotassium phosphate KH2PO4 0 50 40 Potassium nitrate KNO3 13 0 45 Potassium sulphate K2SO4 0 0 50
Often more than 200 kg/ha of nitrogen is applied for intensive production of non-
leguminous crops, and Salama et al. (1999) reported even more than 500 kg/ha on some horticultural crops in Malaysia. Loading rates on fertilized improved grazed pasture may exceed 400 kg/ha of nitrogen due to the combined effects of fertilizer use and high stock densities in fields (Sumner and McLaughlin, 1996). Nitrogen application in excess of 140 kg/ha on coarse sandy soils, or in excess of 200 kg/ha on loamy soils, have caused nitrate concentrations in groundwater to exceed drinking-water criteria in irrigated horticulture in Perth, Western Australia (Water and Rivers Commission, 1996). Although these loadings do not seem high in comparison with crop nitrogen requirements which typically vary between 50 and 400 kg/ha (USGS, 1999), the rate and timing of individual applications of fertilizer is critical in determining how much nitrogen leaches past the root zone and into groundwater.
Much of the ammonia in animal urine may be oxidized to nitrate, and the nitrification of localized patches of urine in soil can cause significant contamination of groundwater by nitrate (Close et al., 2001). The amount of mineralized nitrogen in urine patches on grazed pasture may be up 600 kg N/ha (Ball and Ryden, 1984) and can greatly exceed the capacity of the pasture to take up the nitrate, leading to leaching to groundwater. The problem is exacerbated by the uneven distribution of urine patches in pasture, with high concentrations of mineralized nitrogen in soil often occurring near watering points or stock yards. For example, Ruz-Jerez et al. (1994) estimated that for a rotationally grazed clover-ryegrass pasture in New Zealand that was fixing 144 kg/ha of nitrogen yearly,
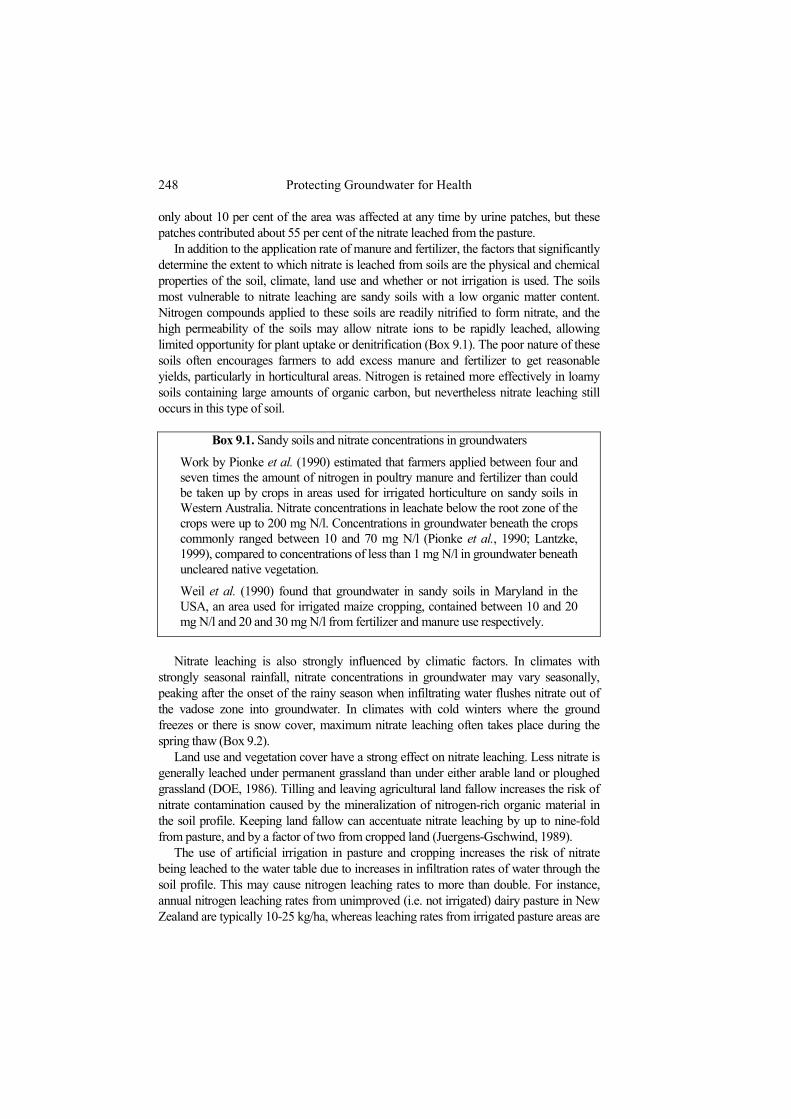
248 Protecting Groundwater for Health
only about 10 per cent of the area was affected at any time by urine patches, but these patches contributed about 55 per cent of the nitrate leached from the pasture.
In addition to the application rate of manure and fertilizer, the factors that significantly determine the extent to which nitrate is leached from soils are the physical and chemical properties of the soil, climate, land use and whether or not irrigation is used. The soils most vulnerable to nitrate leaching are sandy soils with a low organic matter content. Nitrogen compounds applied to these soils are readily nitrified to form nitrate, and the high permeability of the soils may allow nitrate ions to be rapidly leached, allowing limited opportunity for plant uptake or denitrification (Box 9.1). The poor nature of these soils often encourages farmers to add excess manure and fertilizer to get reasonable yields, particularly in horticultural areas. Nitrogen is retained more effectively in loamy soils containing large amounts of organic carbon, but nevertheless nitrate leaching still occurs in this type of soil.
Box 9.1. Sandy soils and nitrate concentrations in groundwaters
Work by Pionke et al. (1990) estimated that farmers applied between four and seven times the amount of nitrogen in poultry manure and fertilizer than could be taken up by crops in areas used for irrigated horticulture on sandy soils in Western Australia. Nitrate concentrations in leachate below the root zone of the crops were up to 200 mg N/l. Concentrations in groundwater beneath the crops commonly ranged between 10 and 70 mg N/l (Pionke et al., 1990; Lantzke, 1999), compared to concentrations of less than 1 mg N/l in groundwater beneath uncleared native vegetation.
Weil et al. (1990) found that groundwater in sandy soils in Maryland in the USA, an area used for irrigated maize cropping, contained between 10 and 20 mg N/l and 20 and 30 mg N/l from fertilizer and manure use respectively.
Nitrate leaching is also strongly influenced by climatic factors. In climates with
strongly seasonal rainfall, nitrate concentrations in groundwater may vary seasonally, peaking after the onset of the rainy season when infiltrating water flushes nitrate out of the vadose zone into groundwater. In climates with cold winters where the ground freezes or there is snow cover, maximum nitrate leaching often takes place during the spring thaw (Box 9.2).
Land use and vegetation cover have a strong effect on nitrate leaching. Less nitrate is generally leached under permanent grassland than under either arable land or ploughed grassland (DOE, 1986). Tilling and leaving agricultural land fallow increases the risk of nitrate contamination caused by the mineralization of nitrogen-rich organic material in the soil profile. Keeping land fallow can accentuate nitrate leaching by up to nine-fold from pasture, and by a factor of two from cropped land (Juergens-Gschwind, 1989).
The use of artificial irrigation in pasture and cropping increases the risk of nitrate being leached to the water table due to increases in infiltration rates of water through the soil profile. This may cause nitrogen leaching rates to more than double. For instance, annual nitrogen leaching rates from unimproved (i.e. not irrigated) dairy pasture in New Zealand are typically 10-25 kg/ha, whereas leaching rates from irrigated pasture areas are

Agriculture: Potential hazards and information needs 249
65-70 kg/ha (Burden, 1986). Excessive irrigation in semi-arid or arid areas can further increase nitrate and other dissolved salt concentrations through evapotranspiration of water in the soil (Romijn, 1986). This may also cause water near irrigation areas to become too saline for potable use.
Box 9.2. Rainfall and nitrate concentrations in groundwaters
In the United Kingdom nitrate leaching is least in spring and summer due to crop uptake and is greatest during autumn and winter when there is little uptake and soils are saturated with water. Annual rates of nitrogen leaching from arable land in the United Kingdom range from 40-120 kg/ha, with a weighted mean of about 50 kg/ha (Addiscott and Gold, 1994).
In tropical regions with monsoonal climates, leaching of nitrogen from soil profiles increases at the onset of the wet season. In a study of the impacts of agriculture on groundwater quality in Sri Lanka, Lawrence and Kumppnarachi (1986) found that nitrate concentrations in groundwater beneath rice paddies and other horticultural areas typically increased from an average of 10 to 25 mg N/l in the dry season to more than 40 mg N/l at the onset of the wet season. Concentrations in groundwater then progressively declined to dry season levels. The high nitrogen concentrations in groundwater were due to both the high rate at which nutrients were applied to crops, and due to the fact that several crops could be grown in a year in the tropical climate.
Pathogen contamination In addition to being a potential source of nitrate contamination, manure can also contaminate groundwater with a variety of pathogens that can affect human health, either through the ingestion of unwashed crops, or through the ingestion of polluted groundwater used as a source of drinking-water.
Animal manure can contain large numbers of pathogenic organisms such as bacteria, viruses, protozoa and helminths that can cause human disease, i.e. up to 106 pathogens per gram of faeces (Gannon et al., 2004). However many species excreted by farm animals do not cause disease in humans. Pathogens from manure that may cause disease from drinking contaminated groundwater are shown in Table 9.3.
The number of viable pathogens in manure can be greatly reduced by storing manure before use. Survival times of disease-causing bacteria and protozoa are greatly affected by ambient temperature (Table 9.4). Viruses may become dormant and can persist for long periods in manure. For example, the infectious avian influenza virus can survive in water for 207 days at 17 °C (Brown and Alexander, 1998), and rotaviruses are stable in faeces for 7 to 9 months (Goss et al., 2001). However, the longevity of some viruses can be reduced by the presence of predatory bacteria. The longevity of pathogens can be further reduced by either aerobically composting or drying manure, and most pathogens die within a week if manure is treated in this manner provided that the temperature in the compost pile reaches 55 °C (Goss et al., 2001) (see Chapter 21 for details).

250 Protecting Groundwater for Health
Table 9.3. Examples of human pathogens potentially present in manure (Playford and Leech, 1977; Addis et al., 1999; Goss et al., 2001; Gannon et al., 2004; WHO, 2004)
Pathogenic organism Main source Bacteria
E. coli O157:H7
Livestock excrement (particularly cattle and sheep and, to a lesser extend, goats, pigs and chickens) (see also example in Box 9.3)
Leptospira species Pig urine Yersinia enterocolitica Pig excrement Campylobacter species Poultry, pig and cattle excrement (see also example in Box 9.3) Listeria moncytogenes Animal excrement Salmonella species Wild animal and livestock excrement (incl. poultry, cattle, pigs,
sheep)
Viruses Hepatitis E virus Livestock excrement (particularly pigs, as well as cattle and goats)
Protozoa Cryptosporidium parvum Livestock excrement (particularly young animals) Giardia lamblia Livestock excrement
Table 9.4. Survival of potentially pathogenic bacteria and protozoa in manure at various temperatures (based on Goss et al., 2001)
Organism Survival time (days) Frozen 5 °C 30 °C E. coli >100 >100 10 E. coli O157:H7 70 49 Salmonella >150 150 28 Campylobacter 50 21 7 Giardia <1 7 7 Cryptosporidium >300 50 28
Soils generally provide an effective barrier against pathogens reaching the water table,
and short die-off time of most pathogens in the sub-surface ensures that the number of viable organisms reaching groundwater are low (Chapter 3). Most cases of waterborne disease from groundwater consumption are caused by viruses and bacteria as protozoa and helminths are too large to be transmitted far through the pore spaces between soil particles (although some occurrences of groundwater contamination by the protozoa Giardia and Cryptosporidium have been recorded). Most cases of waterborne disease from wells where there is a thick soil cover are due to the faulty construction of head works, or to the use of manure near sinkholes, abandoned wells or other features that will allow water and contaminated material direct, rapid access to the water table (Figure 9.2).
Contamination of groundwater by pathogens is often a significant issue in areas where there is a thin or no soil cover over fractured rock or karstic limestone (Box 9.3; Figure 9.2). In these terrains, pathogens can be rapidly carried through preferential flow paths into groundwater with little or no attenuation (Chapters 2 and 3). Pore spaces in

Agriculture: Potential hazards and information needs 251
karstic aquifers may even allow large organisms like protozoa to be transmitted through the aquifer to water supply wells.
Box 9.3. Microbial quality of water in karst aquifers and in badly constructed
wells
Studies of bacterial contamination in springs in a limestone terrain in Ireland (Thorn and Coxon, 1992) indicated contamination with coliform bacteria in spring water samples to be derived from dairy cattle. Detected numbers of microorganisms vary greatly with time from 0 to 300 cfu/100 ml of water within a two hour period. The bacterial quality of water is usually at its worst after heavy rainfall, and water from some springs was estimated to have travelled about 1 km from recharge areas within a 12 to 18 hour period after heavy rain.
One of the best documented outbreaks of disease caused by groundwater contamination by manure occurred in the small Canadian town of Walkerton in May 2000. Seven people died and more than 2300 people became seriously ill when pathogens from manure spread on a nearby farm was washed in surface runoff into a badly constructed and poorly monitored well used as a water supply for the town. The disease was caused by the virulent strain of E. coli O157:H7 and by Campylobacter jejuni. A Parliamentary Enquiry into the incident was held in 2001, and an initial report published (O’Connor, 2001).
Carcaseburial
Animalgrazing
WaterTable
Unprotected springused for water supply
Manure spreadingon crops
Dug well withoutprotective headworks
Well interceptsfractures or karst feature
Water Table
Groundwater flowsin fractures or
solution featuresin bedrock
Figure 9.2. Potential pathways for groundwater contamination by pathogens in an agricultural area

252 Protecting Groundwater for Health
Contamination of groundwater by pathogens is also an issue in shallow fractured rock aquifers and in volcanic aquifers. Large cave systems may also be formed in some volcanic terrains as a result of the degassing of volatiles dissolved in molten lava flows, and the interface between individual lava flows may contain interconnected voids that may allow groundwater to transmit contaminants over long distances. Therefore volcanic aquifers show some of the hydrogeological characteristics of karst aquifers, and share the same extremely high vulnerability to groundwater contamination.
Karst-like features can also develop in tropical or subtropical regions with lateritic soils. Voids can form in lateritic duricrusts due to the erosion of soft, poorly consolidated clays in an otherwise cemented ferruginous matrix. This can give rise to a spongy network of interconnected voids which may be at least several millimetres in diameter, and which can rapidly transmit water and pathogens (Box 9.4).
Box 9.4. Voids in lateritic soils
In Brazil, voids in lateritic soils appear to be caused by termite activity (Mendonça et al., 1994). Where intensive urban development takes place, increased point sources of recharge such as storm water soakwells and sewage disposal systems, coupled with intensive groundwater abstraction, can erode these voids to form sinkholes and caves which may be 5 m or more in diameter and several hundred metres long. These so called ‘pseudosinkholes’ may cause groundwater contamination problems of a similar nature to limestone karst aquifers. Contamination of shallow groundwater by pathogens may become a problem in countries like Brazil where tropical forests overlying laterites are being rapidly cleared and developed for agriculture and urban land use.
9.2 DISPOSAL OF ANIMAL CARCASSES The disposal of animal carcasses by burial on farms or in landfill sites may pose public health problems if burial sites are located near wells or tubewells used as a source of drinking-water (see Figure 9.2). Generally, the risks are similar than those posed by the excessive use of animal manures, including contaminating groundwater with nitrates and pathogens such as verotoxin-producing E. coli, Campylobacter, Salmonella, Cryptosporidium and Giardia.
The risks of groundwater contamination are greatest when very large numbers of animals may be destroyed and buried to control the spread of animal diseases in agricultural areas. Of particular concern to public health are epidemics of animal disease that may also cause disease in humans, especially where the disease-causing agent is persistent in soil and groundwater. The mass burial of animal carcasses infected by such a disease-causing agent may pose a risk to nearby groundwater supplies, although the risks are often reduced by burning of carcases prior to burial (UK Department of Health, 2001).
One group of disease-causing agents of concern in this regard are prions, particularly the prion that causes the disease BSE (Mad Cow disease) in cattle. Ingestion of the prion

Agriculture: Potential hazards and information needs 253
can also infect humans and cause the disease variant Creutzfeldt-Jakob disease (CJD) in humans. Prions are inanimate disease-causing agents. It is hypothesized that they are distorted forms of proteins naturally present in neural as well as many other body tissues of animals (Gannon, 2004). In contrast to beef products, the BSE agent is likely to be highly dispersed in water and therefore the daily intake of infectious prions is likely to be very low by nature (Gannon, 2004). The proteins are highly resistant to physical and chemical agents, such as heat, ultraviolet light and oxidants (e.g. chlorine) and may pass through water treatment plants (Gannon, 2004).
Prions behave as particulates in soil and groundwater, and the movement of these proteins in geological media is likely to be affected by the same processes that influence the behaviour of other particulate infectious agents such as bacteria and viruses (UK EA, 2000). The prion protein has both hydrophilic and hydrophobic domains, and this property limits mobility in groundwater and promotes adhesion to hydrophobic particles (Gannon, 2004). However, it is uncertain whether significant amounts of prions are moved by filtration in soils, and thus the risk of groundwater contamination is uncertain (UK Department of Health, 2001). Therefore the risk of groundwater contamination is most likely when:
• prion-contaminate carcass are disposed of in areas where there is little or no soil cover, and fractures or karstic features provide a direct conduit between land surface and groundwater;
• overland flow transports material from carcasses in fields or from prion-contaminated animal-based fertilizer (blood and bone fertilizer) directly into poorly constructed wells or tubewells.
9.3 ANIMAL FEEDLOTS Stocking densities on agricultural land have progressively increased in many parts of the world due to an increasing demand for animal products and improvements in agricultural techniques. This has culminated in the development of animal feedlots, where animals are maintained in pens in a controlled environment. Feedlots may either be open-air facilities, or completely enclosed within large buildings. Typically feedlots are used for beef and pork production, and for poultry, meat products and eggs. Dairies are similar to feedlots in that a large number of cows are gathered together for milking, although they may be allowed to run free range in between milking events.
The large number of stock housed in animal feedlots generates great amount of wastes that can become an unintended, but nonetheless substantial, point sources of widespread groundwater pollution if not managed properly. For example, beef feedlots may contain 500 or more steers, and a typical 450 kg steer will produce up to 30 kg of solid and liquid wastes each day. The 1996 National Water Quality Inventory carried out by the US EPA (1997) found that agriculture in general was the leading cause of water pollution in the USA and that 20 per cent of the problems were due to animal feedlots alone.
The major sources of pollution from feedlots are manure, animal carcasses, process wastewater (e.g. dairy wastes), feed, and bedding materials. The contaminants of highest concern for groundwater are nutrients, particularly nitrogen and pathogens. Wastewater

254 Protecting Groundwater for Health
from feedlots may also contain growth hormones and pharmaceuticals (e.g. antibiotics) used to accelerate the growth of livestock. Table 9.5 shows the typical nutrient content of wastes from feedlots.
Table 9.5. Nutrient content of wastes from feedlots (based on Goss et al., 2001)
Waste source
Dry matter (%)
Nitrogen (%)
Phosphorus (%)
Potassium (%)
NH4-N (mg/l)
Beef cattle Solid 18-63 0.4-1.0 0.1-0.2 0.3-1.0 30-1050 Liquid 1-13 0.1-0.5 0.02-0.2 0.1-0.2 700-2100 Pig
Solid 17-51 0.8-1.8 0.4-1.2 0.2-1.2 1700-4000 Liquid 1-13 0.2-0.8 0.05-0.4 0.1-0.4 1500-5450 Poultry
Solid 16-90 0.9-3.2 0.4-1.4 0.4-1.6 3221-6450 Liquid 0.5-12 0.2-0.9 0.02-0.4 0.01-0.4 900-6250
Groundwater contamination problems from feedlots are mostly from wastewater
generated by the washdown of the feedlots, and storm water runoff from manure stockpiles and other wastes. If feedlot pens are constructed on bare soil without impermeable floors, leachate for manure and urine can percolate into groundwater. Moreover, if liquid wastes and washdown are not drained into lined retention and treatment ponds but are allowed to discharge directly to the environment, feedlots may become significant point-sources of groundwater contamination. This is particularly critical for feedlots sited in areas with sandy soils or high groundwater tables, and if feedlots are located in flood-prone areas or next to a sinkhole, abandoned well or other feature that will allow direct access to the water table. For example, the Western Australian policy on feedlots states that there is a high risk of groundwater contamination from feedlots occurring if the water table is less than 1.5 m below the surface, particularly if soils are sandy and if they are sited in flood-prone areas with more than 1 in 100 year flooding frequency, or on land sloping at more than 5 per cent (1 in 200 grade), as this makes wastewater management in the feedlot extremely difficult, and indirectly increases the risk of contamination (Agriculture WA et al., 2000). The Government British Columbia, Canada, requires that feedlots and manure storages are not located within 30 m of wells used for water supply, on land with a slope of more than 4 per cent, and that there is sufficient land area to allow for manure application in a sustainable manner that will not cause groundwater pollution (BC MAFF, 2000).
Well-managed feedlots usually have wastewater retention and treatment ponds to contain feedlot effluent. However, feedlots commonly leak if pond liners have not been properly constructed or are not well maintained: a study of feedlot wastewater ponds in North Carolina, USA, found that 50 per cent of the ponds leaked (Centner and Risse, 1999).
Typically, there is a much higher amount of waste generated, and therefore a greater risk of groundwater contamination occurring, in uncovered open-air facilities than in enclosed feedlots with roofs. This is particularly the case if treatment and/or storage

Agriculture: Potential hazards and information needs 255
ponds do not have sufficient storage capacity to store water from intense rainfall events. Treated pond effluent is commonly used to irrigate pasture (Section 9.4), but treatment ponds have to be designed to store water for the wettest period of the year when there is little opportunity to dispose of effluent through land irrigation.
Manure collected in feedlots will commonly be applied as fertilizer on cultivated fields and may become diffuse source of groundwater pollution, particularly in areas where feedlots significantly increase stock densities in relation to application options for manure within economically viable distances. Application of manures is discussed in the previous Section 9.1.
9.4 USE OF WASTEWATER AND SEWAGE SLUDGE ON LAND AND IN AQUACULTURE
There has been an increasing interest in the use of wastewater in agriculture over the last few decades due to increased demand for fresh water. Population growth, increased per capita use of water, and the demands of industry and of the agricultural sector have all put pressure on limited fresh water resources. The use of wastewater has been successful for irrigation of a wide array of crops, and increases in crop yields from 10-30 per cent have been reported. In addition, the use of treated wastewater for irrigation and industrial purposes can be a strategy to increase the amount of fresh water available for domestic use, and to improve the quality of river waters used for abstraction of drinking-water (by reducing the disposal of effluent into rivers).
Sewage sludge (or biosolids) are the organic solids derived from municipal sewage and septic tank treatment processes (Chapter 10). In many countries, this material is being disposed of to landfill or offshore, but these practices are increasingly being seen as environmentally unacceptable, and an increasing proportion of this material is being used as a source of nutrients and as a soil amendment in many agricultural areas.
Municipal wastewater and sewage sludge contain considerable amounts of nitrogen and phosphorus. In sewage sludge, nitrogen content ranges between less than 0.1 and 18 per cent (dry weight), and nitrogen concentrations in secondary effluents of wastewaters range between 10 and 30 mg/l (US EPA, 1996). Used at appropriate application rates, these are a valuable resource. However, in regions with a high population density which produce large volumes of sewage wastes, excessive use on agricultural land can pollute groundwater, particularly with nitrate. As with manures and fertilizers, whether or not irrigation of wastewaters and land application of sludges leads to groundwater contamination depends strongly on physical conditions in the drinking-water catchment area, and on the criteria on which rates and timing of application are based (for more detailed information see Section 9.1).
The variety and concentrations of pathogens contained in sewage sludges and wastewater derived from sewage and agriculture strongly depends on treatment and storage practices, which impact on their die-off rates. Viruses in particular accumulate in sewage sludge. For example, Cliver (1987) reported 2400-115 000 pfu/l in primary sludge and 5000 pfu/l in secondary sludge. Poorly or untreated sludge and wastewater can cause significant health effects. The most significant health risk from wastewater use is the consumption of food directly irrigated with the effluent or the direct contact with

256 Protecting Groundwater for Health
contaminated wastes (e.g. by field workers or by children playing in irrigation channels). Consequently, the WHO has developed guidelines for the application of wastewater intended for use in agriculture to protect human health (WHO, 2005).
In groundwater, wastewater irrigation and spreading of sludges in agriculture – like use of manures – can cause serious pathogen contamination, particularly in areas with high vulnerability (e.g. high water table, thin soil cover over fractured rock or karstic limestone) and features that allow rapid movement of pathogens in the subsurface (Chapter 8 and Section 9.1). For example, Moore et al. (1981) has found virus particles in groundwater up to 27 m below sites irrigated with sewage wastewater, and Jorgensen and Lund (1985) found enteroviruses 3 m below a forest site used for sludge application. However, Liu (1982) found that over a period of 4 years of heavy sludge application to farmland, 92-98 per cent of the bacteria were inactivated by the soil.
Use of sludges which are treated either by composting or by other disinfection methods generally poses a lower risk of groundwater contamination due to greatly reduced numbers of pathogens. Risks to groundwater will depend on both good agricultural practices in use of sludge (e.g. maintaining a suitable buffer zone between areas used for application and water supply wells – Chapter 21) and good sanitation practices in sludge treatment.
Chemical pollutants may be a further concern if wastewater or sewage sludge used in agriculture originates from treatment plants receiving substantial amounts of industrial effluent, or if specific household chemicals are widely used. However, these contaminants generally accumulate in the soil profile (Chapter 4) and are strongly bound by organic matter in the sludge. In most cases, the predominant health concerns are the uptake of these chemicals in crops used for human consumption rather than their role as groundwater pollutants. However, these contaminants are very persistent in soils and may take many decades to degrade into harmless by-products. If excessive amounts of wastes containing these chemicals are applied to soil, there is a risk that the normal biological degradation processes in the soil could break down, and that leaching into groundwater could take place. Therefore, detailed investigations of local soil properties are required if contaminated sludges and wastewater are applied on a long term basis in a particular area to ensure that groundwater contamination does not occur.
Wastewater use in aquaculture Aquaculture is a possible reuse strategy. Fish raised in wastewater-fed ponds are an important source of protein for many millions of people, particularly in countries in Asia where the fertilization of fish ponds with human wastes has been practised for several thousand years. Today, at least two-thirds of the world yield of farmed fish comes from ponds fertilized in this way. China alone produces 60 per cent of the world’s farmed fish in only 27 per cent of the world’s area of fish ponds. The largest wastewater-fed aquaculture project in the world is the Kolkata wetland system. This consists of a 3000 ha area of constructed fish ponds which are fed with 550 000 m3 of untreated wastewater each day. The wetlands produce about 13 000 tonnes of fish each year (mainly Carp and Tilapia) which are supplied to fish markets in central Kolkata and are consumed more widely in the region.
Agriculture: Potential hazards and information needs 257
The use of wastewater and human excreta in aquaculture poses a great threat to groundwater quality. This is because fish ponds are often unlined and in direct contact with the water table, and there is no soil profile to allow the die-off of pathogens or the removal of chemical constituents from the effluent. For this reason, there are significant health risks (particularly from pathogens) from using groundwater from wells construc-ted near fish ponds filled with untreated wastewater and fertilized with raw excrement.
9.5 USE OF PESTICIDES Many pesticides and degradation products are toxic at low concentrations and have the potential to cause health effects if groundwater used for water supply is polluted with these chemicals.
In general, the progression of pesticide development has moved from highly toxic, persistent and bioaccumulating pesticides such as DDT, to pesticides that degrade rapidly in the environment and are less toxic to non-target organisms. Many of the older pesticides are now banned in many countries due to their health and environmental effects (see Box 9.5).
There are a large number of pesticides for control of insects (insecticides), weeds (herbicides), fungus (fungicides), nematodes (nematicides) and mites (acaricides) currently used in agriculture throughout the world. However, the largest usage tends to be associated with a relatively small number of pesticides.
Table 9.6 lists the world’s 35 major crops (on a harvested area basis according to FAO, 2002 statistics) and assigns the known, major uses for pesticides for which WHO has set drinking-water guideline values. In addition to the major uses listed in Table 9.6 there will also be many minor uses of each pesticide which are not stated in the literature because the manufacturers consider this use to be insignificant. In general, similar suites of pesticides are used on different crops in a related group. For example, many more sorghum pesticides may be used on millet than is shown in the table and similar pesticides are likely to be used on chickpeas as cow peas. Table 9.6 is also based on approved or recommended uses for each pesticide. In countries where pesticide use is less well regulated, farmers and growers might use a much greater range of pesticides on each crop than is shown, particularly if the pesticides do not cause unacceptable damage to the crop. Many insecticides in particular could be used on a much wider range of crops than is shown, without damage to the crops (unlike herbicides). It is possible that most of the insecticides shown could be used on most of the crops shown.
Pesticides use creates a risk of a diffuse groundwater pollution. Whether or not pesticides reach groundwater depends on the chemical and physical properties of the active ingredient (see Chapter 4.6), on the local hydrogeological conditions and soil characteristics, and on the manner in which these chemicals are applied to crops. Box 9.6 shows some examples of groundwater contamination by pesticides.
Generally, the usage of pesticides should follow codes of good practice. Application patterns and rates need to be based on the recommendations given by the producer or/and the criteria developed by licensing authorities. The way that pesticides are applied depends on the target pest and on the scale of the agricultural operation. Formulations to kill nematodes, fungal infections or insects (systemic insecticides) are usually applied
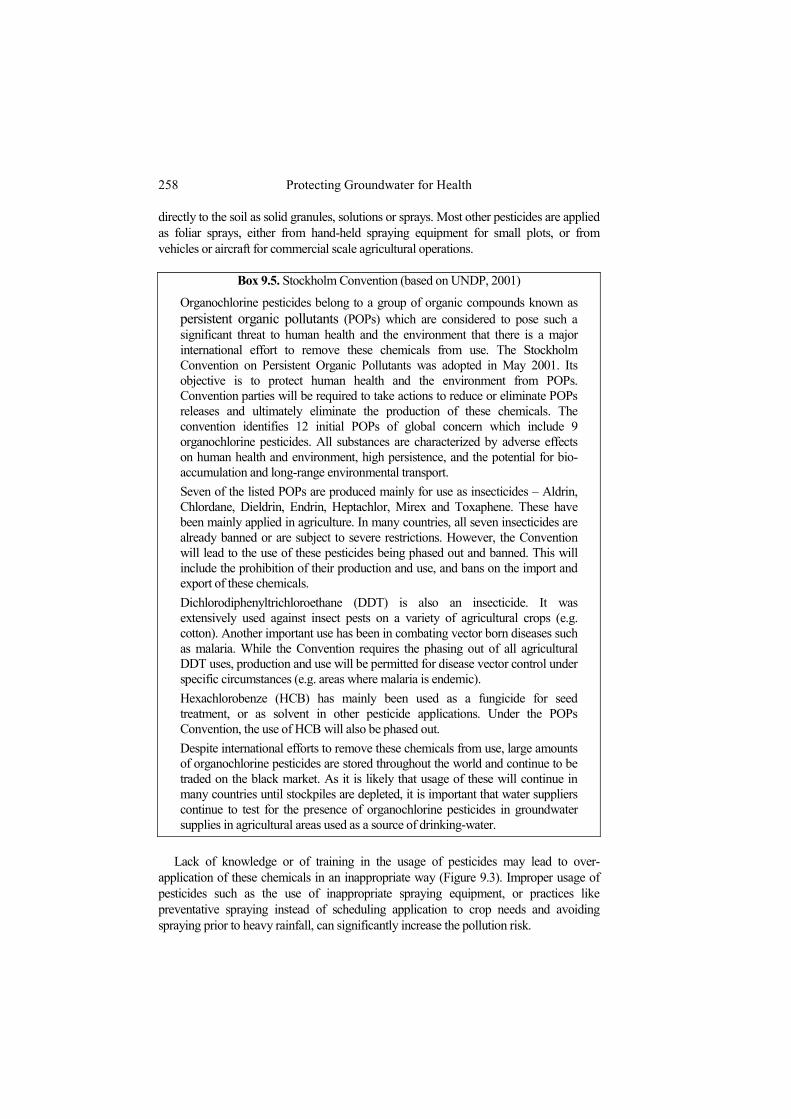
258 Protecting Groundwater for Health
directly to the soil as solid granules, solutions or sprays. Most other pesticides are applied as foliar sprays, either from hand-held spraying equipment for small plots, or from vehicles or aircraft for commercial scale agricultural operations.
Box 9.5. Stockholm Convention (based on UNDP, 2001)
Organochlorine pesticides belong to a group of organic compounds known as persistent organic pollutants (POPs) which are considered to pose such a significant threat to human health and the environment that there is a major international effort to remove these chemicals from use. The Stockholm Convention on Persistent Organic Pollutants was adopted in May 2001. Its objective is to protect human health and the environment from POPs. Convention parties will be required to take actions to reduce or eliminate POPs releases and ultimately eliminate the production of these chemicals. The convention identifies 12 initial POPs of global concern which include 9 organochlorine pesticides. All substances are characterized by adverse effects on human health and environment, high persistence, and the potential for bio-accumulation and long-range environmental transport. Seven of the listed POPs are produced mainly for use as insecticides – Aldrin, Chlordane, Dieldrin, Endrin, Heptachlor, Mirex and Toxaphene. These have been mainly applied in agriculture. In many countries, all seven insecticides are already banned or are subject to severe restrictions. However, the Convention will lead to the use of these pesticides being phased out and banned. This will include the prohibition of their production and use, and bans on the import and export of these chemicals. Dichlorodiphenyltrichloroethane (DDT) is also an insecticide. It was extensively used against insect pests on a variety of agricultural crops (e.g. cotton). Another important use has been in combating vector born diseases such as malaria. While the Convention requires the phasing out of all agricultural DDT uses, production and use will be permitted for disease vector control under specific circumstances (e.g. areas where malaria is endemic). Hexachlorobenze (HCB) has mainly been used as a fungicide for seed treatment, or as solvent in other pesticide applications. Under the POPs Convention, the use of HCB will also be phased out. Despite international efforts to remove these chemicals from use, large amounts of organochlorine pesticides are stored throughout the world and continue to be traded on the black market. As it is likely that usage of these will continue in many countries until stockpiles are depleted, it is important that water suppliers continue to test for the presence of organochlorine pesticides in groundwater supplies in agricultural areas used as a source of drinking-water.
Lack of knowledge or of training in the usage of pesticides may lead to over-
application of these chemicals in an inappropriate way (Figure 9.3). Improper usage of pesticides such as the use of inappropriate spraying equipment, or practices like preventative spraying instead of scheduling application to crop needs and avoiding spraying prior to heavy rainfall, can significantly increase the pollution risk.

Agriculture: Potential hazards and information needs 259
Table 9.6. Known pesticide uses in selected crops (based on Page and Thomson, 1990; Tomlin, 2000; FAO, 2002; WHO, 2004)
Crop Insecticides Herbicides Cereals Barley aldrin*; dieldrin*; dimethoate; γ-
HCH chlorotoluron; cyanazine; 2,4-D; 2,4-DB; dichlorprop; isoproturon; MCPA; MCPP; pendimethalin
Maize aldicarb; aldrin*; dieldrin*; carbofuran; γ-HCH
alachlor; atrazine; cyanazine; 2,4-D; 2,4,5-TP; metalochlor; pendimethalin; simazine; terbuthylazine
Millet 1,3-dichloropropene 2,4-D Oats aldrin*; dieldrin*; dimethoate; γ-
HCH cyanazine; 2,4-D; 2,4-DB; dichlorprop; MCPA; MCPP; pendimethalin
Rice (paddy) carbofuran; dimethoate 2,4-D; MCPA; molinate; pendimethalin Rye dimethoate; γ-HCH chlorotoluron; 2,4-D; 2,4-DB; dichlorprop;
isoproturon; MCPA; MCPP; pendimethalin Sorghum aldicarb; carbofuran atrazine; 2,4-D; metalochlor; pendimethalin;
terbuthylazine Wheat aldrin*; dieldrin*; dimethoate; γ-
HCH chlorotoluron; cyanazine; 2,4-D; 2,4-DB; dichlorprop; isoproturon; MCPA; MCPP; pendimethalin
Fibre crops Flax fibre and tow
1,3-dichloropropene MCPA; trifluralin
Seed cotton aldicarb; aldrin*; dieldrin*; carbofuran; dimethoate; endrin*
alachlor; cyanazine; metalochlor; pendimethalin; trifluralin
Fruits Apples 1,2-dichloropropane*; 1,3-
dichloropropene; dimethoate; γ-HCH; methoxychlor*
2,4-D; pendimethalin; simazine
Bananas aldicarb; carbofuran simazine Citrus fruits aldicarb; dimethoate metolachlor; pendimethalin; simazine;
trifluralin Grapes 1,2-dichloropropane*; 1,3-
dichloropropene; carbofuran; dimethoate; γ-HCH; methoxychlor*
2,4-D; metolachlor; pendimethalin; simazine; terbuthylazine; trifluralin
Oilcrops Coconuts - 2,4,5-T Groundnuts in shell
aldicarb; carbofuran; 1,2-dichloropropane; 1,3-dichloropropene; ethylene dibromide
alachlor; 2,4-DB; metalochlor; pendimethalin; trifluralin
Oil palm fruit simazine; 2,4,5-T; terbuthylazine Olives 1,2-dichloropropane*; 1,3-
dichloropropene simazine; terbuthylazine
Rapeseed carbofuran; γ-HCH alachlor; cyanazine; simazine; trifluralin

260 Protecting Groundwater for Health
Crop Insecticides Herbicides Soybeans aldicarb; carbofuran alachlor; cyanazine; 2,4-DB; metalochlor;
pendimethalin; trifluralin Sunflower seed
carbofuran; γ-HCH alachlor; metalochlor; pendimethalin; trifluralin
Pulses Beans (dry) aldicarb; 1,2-dichloropropane*;
1,3-dichloropropene; dimethoate; γ-HCH; mehoxychlor*
cyanazine; pendimethalin; simazine; terbuthylazine; trifluralin
Chick-peas dimethoate cyanazine; MCPA; pendimethalin; simazine; terbuthylazine; trifluralin
Cow peas (dry)
1,2-dichloropropane*; 1,3-dichloropropene; dimethoate; methoxychlor*
cyanazine; MCPA; pendimethalin; simazine; terbuthylazine; trifluralin
Roots and tubers Cassava dimethoate metolachlor; pendimethalin Potatoes aldicarb; aldrin*; carbofuran; 1;2-
dichloropropane; 1,3-dichloropropene; dieldrin; endrin*; ethylene dibromide; dimethoate
cyanazine; MCPA; metalochlor; pendimethalin; terbuthylazine
Sweet potatoes
aldicarb; 1,2-dichloropropane; 1,3-dichloropropene; methoxychlor*
-
Sugar crops Sugar beet aldicarb; carbofuran; 1,2-
dichloropropane; 1,3-dichloropropene; ethylene dibromide; dimethoate; γ-HCH
metalochlor; trifluralin
Sugar cane aldicarb; carbofuran alachlor; atrazine; cyanazine; 2,4-D; TP; metalochlor; simazine; terbuthylazine; trifluralin
Vegetables Cabbages
1,2-dichloropropane*; 1,3-dichloropropene; dimethoate; γ-HCH; methoxychlor*
metolachlor; trifluralin
Onions 1,2-dichloropropane*; 1,3-dichloropropene; γ-HCH
trifluralin
Tomatoes 1,2-dichloropropane*; 1,3-dichloropropene; dimethoate; γ-HCH; methoxychlor*
trifluralin
Other crops Cocoa beans dimethoate; γ-HCH simazine; terbuthylazine Coffee (green) aldicarb; carbofuran; dimethoate simazine; terbuthylazine Natural rubber - simazine; 2,4,5-T; terbuthylazine
* superseded pesticides (materials believed to be no longer manufactured or marketed for crop protection use).

Agriculture: Potential hazards and information needs 261
Box 9.6. Examples of groundwater contamination by pesticides
A nationwide study of more than 1000 shallow wells and springs in the USA found that one or more pesticides were detected in more than half of the samples collected (Kolpin et al., 1998). 95 per cent of the pesticide detections were at concentrations less than 1 µg/l. The most commonly detected pesticide was atrazine, reflecting both the widespread use of this chemical in agriculture, and its chemical stability and mobility in soil and groundwater. The frequency of pesticide detections was highest in agricultural areas where there was intensive use of these chemicals. Dieldrin was also commonly detected, despite its ban for agricultural use in the USA since the mid 1970s.
Some 40 pesticides were detected in drinking-water supplies in the United Kingdom (England and Wales) each year between 1989 and 1996. Most frequently detected pesticides were the herbicides isoproturon, simazine, atrazine, chlorotoluron MCPP and diuron. The percentage failing the drinking-water standard of 0.1 µg/l fell from 2.8 in 1991 to 0.2 per cent in 1996 (DWI, 1992, 1996, 1997).
Brazil has become the third largest user of pesticides in the world, only exceeded by France and the USA (Andreoli 1993). Contamination of surface water and groundwater by pesticide residues is widespread, and 100 per cent of water samples from springs in the Pirapó sub-basin contained pesticide residues.
A pesticide spill at a mixing site into a storm water soakwell in Western Australia contaminated a nearby irrigation well with concentrations of fenamiphos and atrazine exceeding 1000 and 2000 µg/l respectively (Appleyard, 1995). The concentration of fenamiphos was high enough to be toxic on prolonged skin contact, and would have caused severe health effects if the water had been used for drinking. Ten years after the spill, contamination is still present in toxic levels in groundwater at a distance of more than 300 m from the spill site. Investigations at other pesticide mixing sites in Western Australia (Appleyard et al., 1997) detected a range of pesticides in groundwater including atrazine, chlorphyrifos, diazinon, dimethoate, fenamiphos, maldison, aldrin, chlordane, DDT, dieldrin and heptachlor. The most commonly detected pesticide in groundwater was diazinon, which was detected in 63 of the 78 groundwater samples collected at concentrations ranging between 0.1 and 4 µg/l.
Pesticides have a wide range of physical and chemical properties. As discussed in
Chapter 4.6, the extent to which pesticides can be leached into groundwater through normal agricultural use depends on a number of factors. These include the degree to which pesticides are adsorbed onto organic matter in soils, the degree to which they are volatilized from the soil, the rate at which they degrade within the soil environment, their solubility in water, and the amount of water percolating through the soil profile available to mobilize a specific pesticide (Figure 9.3). Table 4.2 in Chapter 4.6 summarizes the extent to which the major groups of pesticides used in agriculture are retained or degraded in soils.

262 Protecting Groundwater for Health
Pest i c ides
Pest i c ides
Pes t ic ides
Pest
icid
es
Pest icid es
Pest ic ides
Pest ic ides
Pesticides
Pesticides
Pesticides
Water Table
Use of pesticidecontainers to store
drinking water
Spills andresidue disposal
Occupationalexposure
(Inhalation andSkin contact)
Adsorption onclay and organic
particles
Infiltrationthrough bedrockfractures or other direct conduits tothe water table
(Fast)
Chemicaldecomposition
BiologicaldegradationLeaching
(Slow)
Volatilisation
Spraydrift
Overland flowon suspended
sediments
Photo -decomposition
Figure 9.3. Transport of pesticides to groundwater, degradation behaviour and possible pathways that can cause human health problems
Low level contamination of groundwater by pesticides (concentrations less than 1 µg/l) commonly occurs in agricultural areas where the water table is shallow, and where soils are sandy and contain little or no organic matter. High concentrations of pesticides in groundwater (greater than 5 µg/l) are much more likely to result from the percolation of contaminated runoff into natural and man-made pathways through the soil profile than through their normal agricultural use (DeMartinis and Cooper, 1994). Natural preferred pathways due to vulnerable hydrogeology include karst features, fissured or fractured bedrock exposed at the surface, fissured clays, and deep animal burrows (Figure 9.3).
The most common man-made causes of severe groundwater pollution by pesticides is the infiltration of contaminated runoff directly into poorly constructed or abandoned water-supply wells, soak wells and other man-made conduits. This takes place either through the open casing, if the well is not properly capped, or through the annular space around the casing if the well has not been properly constructed. In particular, practices such as mixing of pesticides and cleaning of pesticide spraying equipment on bare soil, or the disposal of pesticide residues and empty drums near to man-made or natural features that allow rapid infiltration of contaminated runoff, pose a significant risk to groundwater. Drainage wells used to drain excess water in some irrigation areas are another common point of entry of pesticides into groundwater (DeMartinis and Cooper, 1994). Important point sources of pesticide pollution in groundwater are dip sites used to

Agriculture: Potential hazards and information needs 263
treat sheep and other livestock for ectoparasites (Hadfield and Smith, 1997), and spills or poor handling practice at sites used to mix or store pesticides before use. Moreover, there are large stockpiles of persistent pesticides in many countries, and if storage facilities are poorly designed or constructed (e.g. not sealed, covered or lockable) they may leak and cause pollution of waters. In this context, abandoned stockpiles (for example as a result of storage of older batches of pesticides or of civil war) are of particular concern as those normally are not subject to any means of control. Generally, all point sources can produce extremely high concentrations of pesticides that may persist in groundwater for long periods with little or no degradation.
Generally, there is much less information on the extent and severity of groundwater contamination by pesticides in developing countries. Pesticide usage in low-income countries is extremely variable, varying from almost no usage in large parts of Africa and Asia that rely on traditional and subsistence agriculture, to very high application rates in plantations in Central and South America.
9.6 IRRIGATION AND DRAINAGE Irrigation is widely used in agriculture as a means of making otherwise unproductive land suitable for agriculture, or for substantially increasing agricultural productivity. However, this activity can affect groundwater quality by altering the water and salt balance in soil profiles, which in turn can change the physical and chemical characteristics of the soil. The large volumes of water used in irrigation – typically between 5000 and 15 000 cubic m per year per ha (Romijn, 1986) – allows solutes in irrigated soil profiles to be readily leached and affect groundwater quality.
Water can be applied to crops or pasture by surface irrigation (often by land flooding), by sub-surface irrigation, or by overhead irrigation through sprinklers, drip or trickle systems. Growing plants selectively uptake nutrients and some solutes, such as calcium and magnesium ions, from the irrigation water and water in the soil leaving residual soil water that is progressively enriched in some ions, particularly sodium. The solute content in the residual soil water cannot be allowed to increase too high, or else the changes in osmotic pressure across plant roots will inhibit the ability of plants to take up moisture and nutrients, so salts are generally allowed to leach to groundwater by applying excess irrigation water. However, even minor increases in the salinity of groundwater can affect the viability of growing some highly salt-sensitive crops like some vegetable species.
The problems can be compounded if irrigation water contains a high proportion of sodium ions. Sodium ion concentrations in residual water in these soils can accumulate to the point that ion-exchange sites on clays in the soil become saturated with sodium, changing the physical properties of the soil. Soils with excess sodium often become structureless and impermeable to water and air, and may not support plant growth. Sodicity problems in soils can also develop if the irrigation water contains high concentrations of bicarbonate or carbonate ions which causes calcium and magnesium carbonates to precipitate within the soil profile. Under these circumstances, residual soil water again becomes preferentially enriched in sodium ions.
As well as creating salinity and sodicity problems, irrigation can introduce a number of contaminants into groundwater that can affect human health. The large amount of

264 Protecting Groundwater for Health
water used in irrigation makes the risk of nitrate and pesticide leaching greater in irrigated than non-irrigated areas. In areas where soils contain significant concentrations of selenium, like parts of the USA and the Indian subcontinent, the infiltration of irrigation water can leach selenium and locally contaminate groundwater with this element. Water in soils beneath irrigation areas is often alkaline, and can leach significant amounts of fluoride that naturally occurs in soils at high concentrations in many areas, and is also introduced into soils as a contaminant in phosphatic fertilizers (Kolaja et al., 1986).
Water is often drained from land to maintain or increase the agricultural productivity, but this activity can also have adverse impacts on groundwater quality. The major impacts include increasing groundwater salinity and nitrate concentrations and, in some areas, increasing sulphate, iron and heavy metal concentrations due to the acidification of soils caused by drainage.
Drainage systems often consist of a series of ditches or drainage pipes in or around individual fields to control the position of the water table, connected to collector and main drains designed to move the drained water to a convenient discharge area. In irrigation areas, water collected in drains can have a salinity up to ten times that of the applied irrigation water (Romijn, 1986), and in semi arid or arid areas, the salinity can be further increased by evaporation as water is moved in open channels away from the irrigated fields. Leakage of water from drainage channels can contaminate groundwater at some distance from irrigated areas with salt and nitrate and, in some areas, with other contaminants like selenium and fluoride.
Reclamation of waterlogged peaty soils by drainage causes land subsidence, firstly due to the shrinkage and compaction of the peat, and then due to the oxidation of the organic matter. It is estimated that drainage of peaty soils over the last 900 years in the Netherlands has caused land subsidence of about 2 m, of which 85 per cent is due to the oxidation of the peat (Romijn, 1986). The oxidation releases substantial amounts of nitrogen bound up in organic form in the peat, and nitrate concentrations in groundwater near drained peat areas often greatly exceed drinking-water guidelines. Drained peat soils are often grazed by a high density of livestock which can further increase nitrate concentrations in groundwater. The rate of oxidation of organic matter in peat is much greater in subtropical or tropical climates than in temperate areas, and the peat loss caused by oxidation can exceed 5 cm per year in some areas (Romijn, 1986).
The drainage of soils containing pyrite and other sulphide minerals can further cause severe environmental and health problems due to the release of sulphuric acid and toxic levels of metals caused by the oxidation of sulphides. These so called ASS were first recognized in the Netherlands more than 250 years ago, and although localized problems occur in parts of Europe, these soils are particularly widespread in some coastal parts of Asia, Australia, Africa and Latin America, and worldwide cover an area of more than one million square kilometres (ARMCANZ, 2000). It has been estimated conservatively that Australia alone has over 40 000 km2 of acid sulphate soils, containing in excess of one billion tonnes of pyrite. If these soils were fully drained and developed for agriculture, the total amount of sulphuric acid released would be about 1.6 billion tonnes.
Groundwater beneath ASS areas can become contaminated with high concentrations of arsenic and heavy metals. The health status of farming communities living in ASS

Agriculture: Potential hazards and information needs 265
areas in Asia is often poor as they rely on metal rich acidic water for water supply (ARMCANZ, 2000). There is also evidence that certain species of disease-carrying mosquito actively seek acid drainage for breeding, compounding health effects in these areas.
9.7 CHECKLIST
NOTE The following checklist outlines information needed for characterizing agricultural activities in the drinking-water catchment area. It supports hazard analysis in the context of developing a Water Safety Plan (Chapter 16). It is neither complete nor designed as a template for direct use but needs to be specially adapted for local conditions. The analysis of the potential of groundwater pollution from human activity requires combining the checklist below with information about socioeconomic conditions (Chapter 7), aquifer pollution vulnerability (Chapter 8), and other specific polluting activities in the catchment area (Chapters 10-13).
What are the agricultural land use characteristics in the drinking-water catchment area?
Determine the proportion of land covered by agriculture Compile information on the types of agriculture (e.g. pasture land, arable
land, irrigated or drained agriculture, horticulture, market gardening) Identify the main crops cultivated (including change over time) Compile information on the location and spatial distribution of
agricultural land and different cultivation types Evaluate information on the historical evolution of land use patterns …
Is manure applied in the drinking-water catchment area?
Estimate livestock densities, animal species and amount of manures produced
Characterize storage conditions and handling practices for manures and estimate nitrogen volatilization and pathogen die-off rates
Estimate composition of manures: presence of pathogens, nitrogen content, presence of veterinary pharmaceuticals

266 Protecting Groundwater for Health
Estimate quantity of manures applied and concentrations or loads of potential groundwater pollutants (e.g. pathogens, nitrogen, pharmaceuticals), including their change over time
Evaluate patterns of manure application: • Assess adequacy of application rates: check whether criteria are based
on (a) nutrient budgets and crop uptake rates, and/or (b) the need of getting rid of manure in areas with high livestock densities or intensive livestock farming
• Assess timing of application in relation to hydrological events and to seasonal aspects (e.g. presence/absence of vegetation cover, frozen ground)
• Assess adequacy of spreading methods • Assess adequacy of irrigation practices (if employed)
Evaluate manure application practices in relation to aquifer vulnerability and physical conditions in the drinking-water catchment area (e.g. water table, soil, hydrogeology), and features that allow direct access of disease agents to the water table (e.g. abandoned wells, voids): consider checklist for Chapter 8
…
Are animal carcasses being buried in the drinking-water catchment area?
Determine the location and density of carcass burial sites Determine whether animals were culled because of a disease outbreak,
and identify the disease …
Are fertilizers applied in the drinking-water catchment area?
Characterize types and products of fertilizers used (slow or fast release) Check composition of fertilizers (e.g. nitrogen content) Estimate quantity of fertilizers applied and concentrations or loads of
potential groundwater pollutants (e.g. nitrogen), including their change over time
Evaluate patterns of fertilizer application: consider checklist for manure application (see above) for adequacy of application rates, timing, spreading methods and irrigation practices
Evaluate fertilizer application practices in relation to aquifer vulnerability and physical conditions in the drinking-water catchment area (e.g. water table, soil, hydrogeology), and natural or man-made features that allow direct access of nitrogen to the water table (e.g. abandoned wells, voids): consider checklist for Chapter 8
…

Agriculture: Potential hazards and information needs 267
Are feedlots operated in the drinking-water catchment area?
Define locations and size (stock numbers) of feedlots Evaluate adequacy of siting and operation in relation to vulnerability and
physical conditions in the drinking-water catchment area (e.g. water table, soil, hydrogeology), and features that allow direct access of disease agents to the water table (e.g. abandoned wells, voids): consider checklist for Chapter 8
Assess adequacy of design, construction, condition, operation and maintenance (e.g. sealing, lining, open-air or closed facilities)
Characterize wastes generated (e.g. manure, process wastewater, feed and bedding materials, silage)
Evaluate availability, storage capacity, treatment efficiency and adequacy of design, construction, condition and maintenance of wastewater treatment facilities
Check and assess disposal practices for treated or non-treated wastewater (e.g. irrigation): consider checklist for use of wastewater (see below)
Estimate quantity of wastes generated and concentrations or loads of potential groundwater pollutants disposed (e.g. pathogens, nitrogen, pharmaceuticals), including their change over time
Check and assess disposal practices for manures: consider checklist for manure application (see above)
…
Is sewage sludge or wastewater used in the drinking-water catchment area?
Estimate composition of sludges and treated or non-treated wastewaters (e.g. pathogens, nitrogen, household and/or industrial chemicals): consider checklist for Chapter 10
Evaluate adequacy of sludge treatment (e.g. composting) and/or storage time before land application
Estimate quantity of sewage sludge or wastewater applied and concentrations or loads of potential groundwater pollutants (e.g. pathogens, nitrogen, pharmaceuticals), including their change over time
Evaluate patterns of land application: consider checklist for manure application (see above) for adequacy of application rates, timing, spreading methods and irrigation practices
Evaluate sludge and wastewater application practices in relation to aquifer vulnerability and physical conditions in the drinking-water catchment area (e.g. water table, soil, hydrogeology), and natural or man-made features that allow direct access of disease agents to the water table (e.g. abandoned wells, voids): consider checklist for Chapter 8
Check whether fishponds are operated, define their locations

268 Protecting Groundwater for Health
Evaluate adequacy of siting and operation of fishponds in relation to vulnerability and physical conditions in the drinking-water catchment area (e.g. water table, soil, hydrogeology): consider checklist for Chapter 8
Assess adequacy of design, construction, condition, operation and maintenance of fishponds (e.g. sealing, lining)
…
Are pesticides used in the drinking-water catchment area?
Check which pesticides are used and which active ingredients they contain
Check whether there is indication for illegal use of banned pesticides Assess adequacy of siting, design, construction and practices of handling
and mixing sites as well as storage facilities Check the location of dip sites for livestock treatment, and assess
adequacy of practices employed Check whether there is indication of inadequate disposal practices of
residues, surplus pesticides or drums Check whether there is indication of abandoned pesticide stocks Estimate quantity of pesticides applied as well as concentrations or loads
leached to groundwater, including their change over time Assess patterns of pesticide application:
• Assess adequacy of application rates: check whether criteria are based on (a) recommendations of producer and/or licensing authorities, and/or (b) the need to get rid of surplus pesticides, and/or (c) preventative spraying practice
• Assess timing of application in relation to hydrological events, seasonal aspects (e.g. presence/absence of vegetation cover, frozen ground), and crop needs
• Assess adequacy of spreading methods • Assess adequacy of irrigation practices (if employed)
Evaluate pesticide application practices in relation to aquifer vulnerability and physical conditions in the drinking-water catchment area (e.g. water table, soil, hydrogeology), and natural or man-made features that allow direct access of pesticides to the water table (e.g. abandoned wells, voids): consider checklist for Chapter 8
…
Are irrigation and drainage practiced in the drinking-water catchment area?
Determine the scale to which irrigation and drainage is practised Compile information on irrigation and drainage techniques employed

Agriculture: Potential hazards and information needs 269
Assess irrigation methods used in relation to amounts reaching groundwater
Check chemical composition of irrigation water and whether admixture of agrochemicals to drainage water is practised
Evaluate irrigation and drainage practices in relation to aquifer vulnerability and physical conditions in the drinking-water catchment area (e.g. water table, soil, hydrogeology): consider checklist for Chapter 8
…
Are hazardous events likely to increase groundwater pollution potential?
Evaluate whether and how storm water events would enhance transport of pollutants to the aquifer
Evaluate which spills and accidents are likely to cause groundwater pollution
…
Is drinking-water abstracted in proximity to agricultural activity?
Assess distance between agricultural activity and drinking-water abstraction
Check adequacy of wellhead protection measures, wellhead construction and maintenance as well as sanitary seals used (see Chapter 18) to prevent ingress of contaminants from agriculture
…
Are groundwater quality data available to indicate pollution from agricultural activity?
Compile historic data from the area of interest, e.g. from local or regional surveys, research projects or previous monitoring programmes
Check need and options for implementation of new or expanded monitoring programmes likely to detect contamination from agricultural activities
…
What regulatory framework exists for agricultural activity?
Compile information on national, regional, local, or catchment area specific legislation, regulations, recommendations, voluntary cooperation agreements, or common codes of good practices on the use, restrictions, ban, prohibition of substances in agriculture

270 Protecting Groundwater for Health
Check whether the regulatory framework adequately addresses environmental and specifically groundwater protection
Identify known gaps and weaknesses which may encourage specific pollution problems
…
Documentation and visualization of information on agricultural practices.
Compile summarizing report and consolidate information from checklist points above
Compile summary of types and amounts of substances produced, intentionally applied on land, non-intentionally released into soils or generated as wastes and which are potentially hazardous if they leach into the aquifer
Map spatial distribution of general land use and specific agricultural uses (use GIS if possible)
Map locations of fish ponds, feedlots, storage facilities (e.g. for pesticides, manures, sewage sludges), mixing, cleaning, livestock treatment sites and groundwater abstraction points (use GIS if possible)
…
9.8 REFERENCES Addiscott, T.M. and Gold, A.J. (1994) Challenges and implications of changes in nitrate limits for
natural or potable water. In Proc. of the XXV Congress of IAH ‘Water Down Under’, pp. 273-278, Adelaide.
Addis, P.B., Blaha, T., Crooker, B., Diez, F., Feirtag, J., Goyal, S., Greaves, I., Hathaway, M., Janni, K., Kirkhorn, S., Moon, R., Morse, D.E., Phillips, C., Reneau, J., Shutske, J. and Wells, S. (1999) Generic Environmental Impact Statement on Animal Agriculture: A summary of the literature related to the effects of animal agriculture on human health. Report produced by the University of Minnesota.
Agriculture W.A. (Western Australia) (2000) Guidelines for the Environmental Management of Beef Cattle Feedlots in Western Australia. Department of Environmental Protection, Health Department of WA, WRiversc and Western Australian Lot Feeders Association, Government of WA, South Perth.
Andreoli, C.V. (1993) The influence of agriculture on water quality. In Proc. FAO Expert Consultation ‘Prevention of Water Pollution by Agriculture and Related Activities’, Santiago, Chile, 1992, pp. 53-65, Water Report 1, FAO, Rome.
Appleyard, S.J. (1995) Investigation of ground water contamination by fenamiphos and atrazine in a residential area: source and distribution of contamination. Ground Water Mon. Remed., 15(4), 110-114.
Appleyard, S.J., Manning, P. and Thorpe, P. (1997) Pest control depots as sources of groundwater contamination in Perth, Western Australia. Land Contam. Remed., 5(4), 299-305.
ARMCANZ (2000) National Strategy for the Management of Coastal Acid Sulfate Soils. Agriculture and Resource Management Council of Australia and New Zealand Discussion Paper, Tasmania.

Agriculture: Potential hazards and information needs 271
Ball, P.R. and Ryden, J.C. (1984) Nitrogen relationships in intensively managed temperate grasslands. Plant Soil, 76, 23-33.
Bauld, J. (1994) Groundwater quality in irrigation areas in Australia: interactions of agriculture and hydrogeology. In Proc. of the XXV Congress of the International Association of Hydrogeologists ‘Management to Sustain Shallow Groundwater Systems’, pp. 423-432, Adelaide.
BC MAFF (2000) Environmental Guidelines for Beef Producers, http://www.agf.gov.bc. ca/resmgmt/fppa/pubs/environ/beef/beeftoc.htm (accessed April 29, 2005).
Brown, I.H. and Alexander, D.J. (1998) Influenza. In Zoonoses: Biology, clinical practice and public health control, (eds. Lord Soulsby and D.I. Simpson), pp. 365-386, OUP.
Burden, R.J. (1986) Elevated levels of nitrate in ground water beneath intensively grazed pastureland in New Zealand. In Impact of Agricultural Activities on Ground Water (eds. J. Vrba and E. Romijn), pp. 263-270, IAH Monograph vol 5, International Association of Hydrogeologists/UNESCO.
Centner, T.J. and Risse, M. (1999) US regulations regarding diffuse animal waste pollution. In Proc. of an International Conference of Diffuse Pollution, ‘Solutions and Innovations’, pp. 352-361, Perth.
Cliver, D.O. (1987) Fate of viruses during sludge processing. In Human Viruses in Sediments, Sludges and Soils, (eds. V.C. Rao and J.L. Melnick), pp. 111-127, CRC Press, Boca Raton, Florida.
Close, M.E., Rosen, M.R. and Smith, V.R. (2001) Fate and transport of nitrate and pesticides in New Zealand’s aquifers In Groundwaters of New Zealand, (eds. M.R. Rosen and P.A. White), pp. 185-220, NZ Hydrological Society Inc., Wellington.
DeMartinis, J.M. and Cooper, S.C. (1994) Natural and man-made modes of entry (of pesticides) in agronomic areas. In Mechanisms of Pesticide Movement into Ground Water, (eds. R.C. Honeycutt and D.J. Schabacker), pp. 165-175, Lewis Publishers, Boca Raton, Florida.
DOE (1986) Nitrate in Water, A Report of the Nitrate Coordination Group. Pollution Paper No. 26, Her Majesty’s Stationery Office, London.
DWI (1992; 1996; 1997) Nitrate, Pesticides and Lead Series – 1989 and 1990; 1991 to 1994; 1995 and 1996, Drinking Water Inspectorate, London.
FAO (2002) Statistical online database on agricultural production-crops primary, http:// apps.fao.org/subscriber/page/collections?subset=agriculture (accessed April 29, 2005).
Gannon, V.P.J. (2004) Control of zoonotic waterborne pathogens in animal reservoirs. In Waterborne Zoonoses: Identification, causes and control, (eds. J.A. Cotruvo, A. Dufour, G. Rees, J. Bartram, R. Carr, D.O. Clover, G.F. Craun, R. Frayer and V.P.J. Gannon), pp. 380-408, IWA Publishing, London.
Gannon, V.P.J., Humenik, F., Rice, M. Cicmanec, J.L., Smith Jr, J.E. and Carr, R. (2004) Control of zoonotic pathogens in animal wastes. In Waterborne Zoonoses: Identification, causes and control, (eds. J.A. Cotruvo, A. Dufour, G. Rees, J. Bartram, R. Carr, D.O. Clover, G.F. Craun, R. Frayer and V.P.J. Gannon), pp. 409-425, IWA Publishing, London.
Goss, M.J., Rollins, K.S., McEwan, K., Shaw, J.R. and Lammers-Helps, H. (2001) The Management of Manure in Ontario with Respect to Water Quality. Report produced by the University of Guelph for the Walkerton Inquiry, http://www.walkerton inquiry.com/part2info/commissuepapers (accessed April 29, 2005).
Hadfield, J. and Smith, D. (1997) Pesticide contamination of groundwater: an investigation in the Waikato region, New Zealand. In Proc. of the 24th Australasian Hydrology and Water Resources Symposium ‘Wai Whenua’, pp. 246-251, Auckland.
Jorgensen, P.H. and Lund. E. (1985) Detection and stability of enteric viruses and indicator bacteria in sludge, soil and groundwater. Water Sci. Technol., 17, 185-195.
Juergens-Gschwind, S. (1989) Groundwater nitrates in other developed countries (Europe): Relationships to land use patterns. In Nitrogen Management and Ground Water Protection, (ed. R.F. Follet), pp. 75-138, Elsevier, Amsterdam.

272 Protecting Groundwater for Health
Kolaja, V., Vrba, J. and Zwirnmann, K.H. (1986) Control and management of agricultural impact on groundwater. In Impact of Agricultural Activities on Ground Water, (eds. J. Vrba and E. Romijn), pp. 197-229, International Association of Hydrogeologists Monograph No 5, Verlag Heinz Heise.
Kolpin, D.W., Barbash, J.E. and Gilliom, R.J. (1998) Occurrence of pesticides in shallow ground water of the United States: initial results from the National Water Quality Assessment Program. Environ. Sci. Technol., 32, 558-566.
Lantzke, N.C. (1999) Phosphorus and nitrate loss from horticulture on the Swan Coastal Plain. In Proc. of an International Conference of Diffuse Pollution, ‘Solutions and Innovations’, pp. 157-166, Perth.
Lawrence, A.R. and Kumppnarachi, (1986) Impact of Agriculture on Groundwater Quality in Kalpitiya, Sri Lanka. BGS, Report WD/03/86/20, Wallingford.
Liu, D. (1982) The effect of sewage sludge land disposal on the microbiological quality of groundwater. Water Res., 16, 957-961.
Mendonça, A.F., Pires, A.C.B. and Barros, J.G.C. (1994) Pseudosinkhole occurrences in Brasilia, Brazil. Environ. Geol., 23, 36-40.
Moore, B.E., Sagik, B.P. and Sorber, C.A. (1981) Viral transport to ground water at a wastewater land application site. J. Water Pollution Control Foundation, 53, 1492-1502.
O’Connor, The Hon. D.R. (2001) Report of the Inquiry into the Walkerton Incident. Report published by the Ontario Ministry of the Attorney General.
Page, B.G. and Thomson, W.T. (1990) The Insecticide, Herbicide, Fungicide Quick Guide. Thomson Publications, Fresno, California.
Pionke, H.B., Sharma, M.L. and Hirschberg, K.-J. (1990) Impact of irrigated horticulture on nitrate concentrations in groundwater. Agri., Ecosystems and Environ., 32, 119-132.
Playford, P.E. and Leech, R.E. (1977) Geology and Hydrology of Rottenest Island. Geological Survey of Western Australia, Report 6.
Romijn, E. (1986) Influence of irrigation and drainage. In Impact of Agricultural Activities on Ground Water, (eds. J. Vrba and E. Romijn), pp.133-148, IAH Monograph vol 5, International Association of Hydrogeologists/UNESCO.
Ruz-Jerez, B.E., White, R.E. and Ball, P.R. (1994) Long-term measurement of denitrification in three contrasting pastures grazed by sheep. Soil Biol. Biochem., 26, 29-39.
Salama, R., Pollock, D. and Byrne, J. (1999) Experimental and modelling results of pesticide leaching in agricultural systems: examples from Thailand, Malaysia and Western Australia. In Proc. of an International Conference of Diffuse Pollution, ‘Solutions and Innovations’, pp. 454-462, Perth.
Sumner, M.E. and McLaughlin, M.J. (1996) Adverse impacts of agriculture on soil, water and food quality. In Contaminants and the Soil Environment in the Australasia-Pacific Region, (eds. R. Naidu, R.S. Kookana, D.P. Oliver, S. Rogers and M.J. McLaughlin), pp. 125-182, Kluwer Academic, Dordrecht.
Thorn, R.H. and Coxon, C.E. (1992) Hydrogeological aspects of bacterial contamination of some Western Ireland karstic limestone aquifers. Environ. Geol. and Water Sci., 20(1), 65-72.
Tomlin, C.D.S. (2000) The Pesticide Manual, 12th edn, The British Crop Protection Council, Alton, Hampshire.
UK Department of Health (2001) A Rapid Qualitative Assessment of Possible Risks to Public Health From Current Foot and Mouth Disposal Options. Department of Health technical report, http://www.doh.gov.uk/fmdguidance/disposalrisk assessment.htm (accessed April 29, 2005).
UK Environment Agency (2000) Witness statement made to the UK BSE Enquiry, http://www. bseinquiry.gov.uk/files/ws/s490.pdf (accessed April 29, 2005).
UNDP (2001) UNDP-GEF Persistent Organic Pollutants (POPs) Resource Kit, GEF, New York. US EPA (1996) Use of Reclaimed Water and Sludge in Food Crop Production. Report produced
by the Office of Wastewater Management. http://www.epa.gov/OW-OWM.html/mtb/biosolids/biolib.htm (accessed August 11, 2005).

Agriculture: Potential hazards and information needs 273
US EPA (1997) National Water Quality Inventory: 1996 Report to Congress. US EPA Report EPA841-R-97-008. http://www.epa.gov/305b/96report/index.html (accessed August 11, 2005).
US EPA (2000) National Management Measures to Control Nonpoint Source Pollution From Agriculture. Report produced by the Office of Water, US EPA. Contract No 68-C99-249, Washington, DC.
USGS (1999) Fertilizers-Sustaining Global Food Supplies, Fact sheet published by the USGS, http://pubs.usgs.gov/factsheet/fs155-99/fs155-99.html (accessed April 29, 2005).
Water and Rivers Commission of Western Australia (1996) Guidelines for Irrigation of Vegetated Land With Nutrient-Rich Wastewaters, Government of Western Australia, Perth.
Weil, R.R., Weismiller, R.A. and Turner, R.S. (1990) Nitrate contamination of groundwater under irrigated coastal plain soils. J. Environ. Qual., 19, 441-448.
White, R.E. and Sharpley, A.N. (1996) The fate of non-metal contaminants in the soil environment. In Contaminants and the Soil Environment in the Australasia-Pacific Region, (eds. R. Naidu, R.S. Kookana, D.P. Oliver, S. Rogers and M.J. McLaughlin), pp. 29-68, Kluwer Press, Dordrecht.
WHO (2004) Guidelines for Drinking-water Quality: Recommendations, Volume 1, 3rd edition, World Health Organization, Geneva.
WHO (2005) Guidelines for the Safe Use of Wastewater, Excreta and Greywater. Volume 2: Wastewater use in Agriculture, World Health Organization, Geneva.


© 2006 World Health Organization. Protecting Groundwater for Health: Managing the Quality of Drinking-water Sources. Edited by O. Schmoll, G. Howard, J. Chilton and I. Chorus. ISBN: 1843390795. Published by IWA Publishing, London, UK.
10 Human excreta and sanitation: Potential hazards and information needs
G. Howard, J. Jahnel, F.H. Frimmel, D. McChesney, B. Reed, J. Schijven and E. Braun-Howland
In 2002 some 2.6 billion people (almost half of the world’s population) did not have access to basic sanitation, based on the definitions given in Table 10.1 below (WHO and UNICEF, 2004). The population lacking sanitation is more than twice as many people as those lacking access to an ‘improved’ water supply. Increases in sanitation coverage have been achieved during the last decade, but they have essentially done little more than kept pace with population increase. It is in the rural areas of developing countries that access to sanitation remains most limited, in particular African and South Asian countries have very low rates of rural sanitation access. Current estimates suggest that access to improved sanitation has not increased above approximately half of the population of developing countries (WHO and UNICEF, 2004).
The lack of adequate sanitation is a key contributing factor to the ongoing high rates of diarrhoeal disease noted in developing countries. Improvement in sanitation has been consistently identified as being an important intervention to improve health (Esrey et al., 1991; Esrey, 1996).

276 Protecting Groundwater for Health
Table 10.1. Definitions of improved and unimproved sanitation (WHO and UNICEF, 2004)
Improved technologies Unimproved technologies Connection to a public sewer Connection to a septic system Pour-flush latrine Simple pit latrine Ventilated improved pit latrine
Service or bucket latrines (where excreta are manually removed) Public latrines Latrines with an open pit
Improvements in sanitation continue to lag behind the needs of the population and the
provision of water services for a number of reasons. The water and sanitation sector has traditionally focused more on the provision of water services than sanitation facilities. This is partly due to the differing domains in which such facilities operate and the greater attractiveness of community as opposed to household interventions. As the provision of sanitation primarily functions at a household level, it has attracted less support from governments and donors more interested in community interventions, despite the gains delivered to the broader community by sanitation improvements. The demand for sanitation by households and communities has also sometimes been limited when there are other competing demands for environmental improvements (Briscoe, 1996).
There are numerous low-cost technologies that may be used to improve access, mainly using simple on-site disposal methods. The potential for such sanitation facilities for contaminating groundwater used for drinking supply is well recognized (Lewis et al., 1982; ARGOSS, 2001), and it is strongly related to the hydrogeological and demographic characteristics of the settings in which they are applied. There is often a need to balance these risks and to accept some degradation in water quality where the health gains from improved sanitation outweigh potential risks of contamination from sanitation. This is most obvious in relation to chemical contamination, but also applies to microbial quality. For example, where potential contamination of shallow groundwater from on-site facilities is not a health threat because other water sources are used for drinking or because the filtration efficiency of the soil is likely to reduce pathogens, health gains from excreta disposal will outweigh potential risks from groundwater contamination through sanitation. However, such degradation should be prevented as far as feasible in order to avoid compromising future as well as present use of such groundwaters.
Contamination of groundwater by sanitation systems also occurs in settings where centralized sewerage systems are widely in place, as is common in most industrialized countries. They are often poorly maintained and leaks contaminate groundwater with pathogens and a diverse array of household and industrial chemicals. If sewage is treated in treatment plants and discharged into surface waters, in a number of settings persistent substances then reach groundwater, particularly where artificial recharge or bank filtration are practised. Further, in high income countries, groundwater contamination from decentralized on-site sanitation systems is also common, and may be due to inadequate design and maintenance. These typically occur in proximity to private wells and may become a hazard to such decentralized drinking-water supplies.

Human excreta and sanitation: Potential hazards and information needs 277
NOTE Sanitation practices and the environment in which they take place vary greatly. Health hazards arising from sanitation practices and their potential to pollute groundwater needs to be analysed specifically for the conditions in a given setting. This chapter supports hazard analysis in the context of developing a WSP for a given water supply (Chapter 16).Options for controlling these risks are introduced in Chapter 22.
10.1 CONTAMINANTS OF CONCERN FROM SANITATION SYSTEMS
10.1.1 Pathogens Table 3.1 in Chapter 3 provides an overview of those viruses, bacteria, and in some settings protozoa, which are of concern in groundwater affected by human excreta. When assessing the risk of pathogen occurrence in groundwater, it is important to bear in mind that pathogens may be transmitted via a number of routes other than ingestion from water, including direct contact with excreta, food, flies or from aerosols emanating from excreted wastes. In developed countries, because of their infectivity, small size, persistence and low adsorption to solid surfaces, viruses can be regarded as the most critical microorganisms with respect to groundwater contamination and the related health risks. In developing countries, viral exposures may be much greater through other routes, notably related to poor hygiene and sanitation and the residual risk presented by viruses in groundwater is very low in comparison. Bacterial contamination of groundwater in these situations remains common and prevention of this may take precedence.
The presence of pathogens derived from human faeces in groundwater requires that faecal material leaching into the sub-surface contains pathogens excreted by infected individuals. Predicting whether pathogens may be in the population is difficult as the outward health of an individual cannot be taken as determinant of their status as pathogen reservoirs. An asymptomatic individual may harbour pathogenic organisms and serve as a carrier of disease. Therefore, because the majority of pathogens that affect human health are derived from human faeces, sanitation facilities should be sited, designed, operated and maintained on the assumption that excreta will contain pathogens.
Table 10.2 below provides data on the microbial content of untreated sewage entering into two sewage treatment works in the Netherlands and waste stabilization ponds in Brazil. The figures all refer to organisms per litre and the figures for bacterial content from Brazil have been adjusted from those reported in relation to numbers per 100 ml.

278 Protecting Groundwater for Health
Table 10.2. Geometric mean concentration of selected microorganisms per litre in untreated sewage from two wastewater treatment works in the Netherlands (Hoogenboezem et al., 2001) and waste stabilization ponds in Brazil (Oragui et al., 1987)
Organism Rotterdam Kralingseveer
Amsterdam Westpoort
Waste stabilization ponds Brazil
Cryptosporidium 540 4650 - Giardia 1220 21 300 - Sulphite-reducing clostridia 6.2 × 10⁵ 7.9 × 10⁵ - Clostridium perfringens 6.0 × 10⁵ 5.4 × 10⁵ 5 x 10⁵ Thermotolerant coliforms 9.4 × 10⁷ 1.6 × 10⁸ 2 x 10⁸ Faecal streptococci 3.6 × 10⁶ 1.6 × 10⁷ 3 x 10⁷ Campylobactera - - 700 Salmonellae - - 200 F-specific RNA bacteriophage 2.2 × 10⁶ 4.3 × 10⁶ - Enterovirus 34 190 1 x 10⁴ Reovirus 69 370 - Rotavirus - - 800
10.1.2 Chemical contaminants Where dry on-site latrines are used and no other wastes are disposed into the on-site system, contaminants are expected to be derived wholly from excreta. The major risk will therefore be from nitrate contamination. Nitrate is formed by the sequential, microbially-catalysed oxidation of ammonia to nitrite and then to nitrate (Cantor, 1997). Most nitrogen is excreted as urea, which readily degrades to ammonium. The person specific nitrogen load daily excreted amounts to 11-12 g (Hamm, 1991). With respect to manure, storage times and conditions will affect ammonium losses due to volatilization (Chapter 9). Most relevant for groundwater, microbial oxidation may convert ammonium to nitrate, which is conserved in oxidizing subsurface environments. As nitrate is highly soluble in water and very mobile it readily poses a risk to groundwater (Chapter 4). However, it should be noted that in reducing conditions nitrogen remains in a reduced form (ammonia and nitrite) and this has been noted in groundwater underlying several cities dependent on groundwater (Lawrence et al., 1997).
Wet sanitation systems, especially those which serve household waste water as well as excreta, likely contain a more complex mix of chemicals including those derived from household use such as laundry detergents. Sewage that has centralized management, and serves both residential and industrial users, is likely to contain a complex mixture of organic and inorganic chemicals mainly used in manufacturing and processing. Industrial contaminants will depend on the types of industry in the catchment of the sewerage system, and their mixture in sewage is typically very variable and complex (see e.g. Burston et al., 1993; Bishop et al., 1998). If released to the subsurface, their persistence and mobility determines the potential to contaminate groundwater (Chapter 4).
The concentrations of dissolved constituents in sewage depend both on the household consumption of water and the relative proportion of industrial effluent in relation to domestic sewage in municipal sewers. The average composition of organic and inorganic substances found in domestic sewage is shown below in Table 10.3.

Human excreta and sanitation: Potential hazards and information needs 279
Sewage composition shows diurnal patterns as domestic water use changes. It may also change over larger time intervals due to changes in industrial effluent inputs, as can be seen in the example of the raw sewage composition in Nottingham in Table 10.4.
Table 10.3. Average composition of domestic sewage (Koppe and Stozek, 1986; Klopp, 1999)
Parameter Concentration (mg/l) Parameter Concentration (mg/l) Carbohydrates 95 Magnesium 15 Fats 100 Zinc 0.2 Proteins 115 Manganese 0.15 Detergents 43 Copper 0.15 Phosphorus 10 Lead 0.1 Sulphur 46 Nickel 0.04 Chloride 50 Chromium 0.03 Boron 2 Tin 0.015 Sodium 80 Silver 0.01 Potassium 19 Cadmiun <1 Calcium 70 Mercury <0.1
Table 10.4. Filtered raw sewage composition in Nottingham (based on Barrett et al., 1997)
Parameter Sample date 2 Feb 1995 15 Aug 1995 1 Feb 1996 13 June 1996 CaCO3 (mg/l) 162 282 Cl (mg/l) 322 353 386 200 NH4-N (mg/l) 25.7 40.6 22.2 30.0 NO2-N (mg/l) <0.1 0.1 <0.1 <0.1 NO3-N (mg/l) <0.3 <0.3 <0.1 <0.3 Ca (mg/l) 86 76 99 63 Mg (mg/l) 33 30 41 21 Na (mg/l) 226 289 170 157 K (mg/l) 17.5 24.5 13 18 SO4 (mg/l) 135 78 178 69 PO4-P (mg/l) 6.3 10.7 4.0 6.7 Ag (µg/l) 40 B (µg/l) 1050 1700 980 1300 Pb (µg/l) <10 41 <10 Hg (µg/l) 0.4 0.5 <0.1 8.0 Cr (µg/l) <5.0 0.04 9 Cu (µg/l) <20 130 25 Ni (µg/l) 9 0.15 20 Zn (µg/l) 177 290 95 Cd (µg/l) 2.1 <1.0 <1.0 TTC(cfu/100 ml) 200 2 086 000 58 000 >500 000 TON (mg/l) 24.2 14.1 TCM (µg/l) 6 Trace 0 0 Toluene (µg/l) 14 138 215 50 TeCE (µg/l) 11 10 28 63 Decane Not quantified 0 0 0 Oxylene 0 0 Trace 0 TCE 0 0 0 Trace 1,4-DCB 0 0 0 Trace

280 Protecting Groundwater for Health
This example is typical of bulk sewage from a medium-sized, moderately industrial city and highlights the diversity and variability of substances that can potentially impair groundwater quality, where such sewage leaks into groundwater. The greatest risk posed to groundwater under such settings is often from leaking sewers (see Section 10.2.3).
The prevalence of pharmaceutical chemicals and personal care products (PCPs) is increasingly observed in water supplies (Doughton and Ternes, 1999). Sources of PCPs and pharmaceuticals can be from manufacturers, medical facilities or personal use. Pharmaceuticals may be excreted by patients and can reach the aquatic environment via waste water and potentially enter groundwater (see also Chapter 4.7.1).
10.2 TYPES OF SANITATION AND THEIR POTENTIAL TO CONTAMINATE GROUNDWATER
This section provides an overview of widely practised methods of excreta disposal. There are numerous excreta disposal methods, which range from low-cost options suitable for low-income communities to expensive methods involving several stages of collection and treatment. In general terms, excreta disposal methods fall into two broad categories – on-site and off-site systems. On-site systems are point sources and therefore will be expected to exert the greatest impact on the groundwater in their vicinity, although where there are large numbers of on-site systems the overall impact may be widespread. There are a number of references that provide detailed descriptions of design, engineering, construction, use, and maintenance of various on-site sanitation systems (Metcalf and Eddy, 1991; Franceys et al., 1992; Mara, 1996). Off-site systems represent more diffuse pollution and risks to groundwater may be found along the sewer lines, at the treatment works and from the final effluent discharged to the environment. The discussion in this section provides a summary of the available knowledge of the potential of these technologies to contaminate groundwater and the type of information needed to assess this potential.
10.2.1 Open air defecation WHO and UNICEF (2004) estimated that in 2002 more than one-third of the global population (ca. 40 per cent) still lack access to basic sanitation facilities. The unserved population primarily resides in lower-income countries in Africa and South Asia and within rural areas. The lack of adequate sanitation for half of the Earth’s population indicates that open-air defecation is practised by millions of people. Open-air defecation is generally found in developing countries, particularly in low-income rural and peri-urban communities (Pedley and Howard, 1997).
The risks of groundwater contamination from open-air defecation are variable and largely depend on local conditions, including groundwater use for drinking-water supply. Pathogenic microorganisms in faeces may contaminate groundwater or spring abstraction points by leaching through soils into shallow groundwater or springs, flowing into outcropping or shallow rock fractures, seeping into pits or low areas (recharge zones) or runoff to surface water, with secondary transport to connected aquifers. Several studies in developing countries have shown that open-air defecation in urban areas may
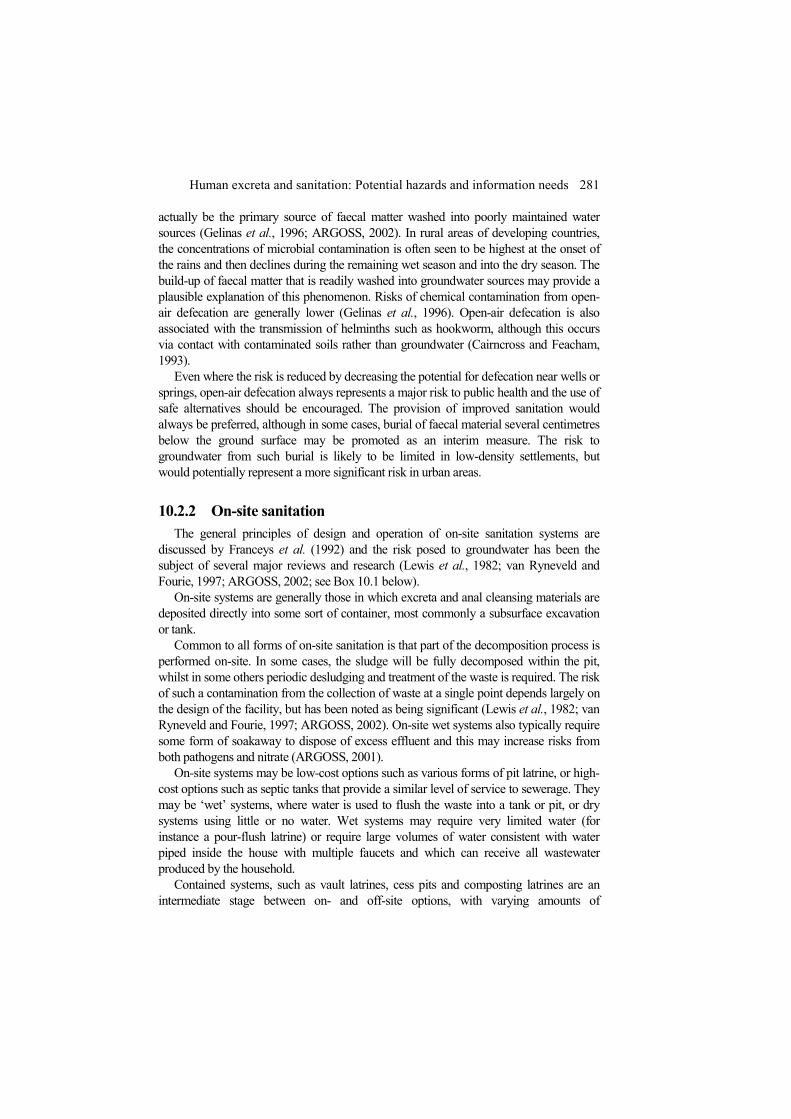
Human excreta and sanitation: Potential hazards and information needs 281
actually be the primary source of faecal matter washed into poorly maintained water sources (Gelinas et al., 1996; ARGOSS, 2002). In rural areas of developing countries, the concentrations of microbial contamination is often seen to be highest at the onset of the rains and then declines during the remaining wet season and into the dry season. The build-up of faecal matter that is readily washed into groundwater sources may provide a plausible explanation of this phenomenon. Risks of chemical contamination from open-air defecation are generally lower (Gelinas et al., 1996). Open-air defecation is also associated with the transmission of helminths such as hookworm, although this occurs via contact with contaminated soils rather than groundwater (Cairncross and Feacham, 1993).
Even where the risk is reduced by decreasing the potential for defecation near wells or springs, open-air defecation always represents a major risk to public health and the use of safe alternatives should be encouraged. The provision of improved sanitation would always be preferred, although in some cases, burial of faecal material several centimetres below the ground surface may be promoted as an interim measure. The risk to groundwater from such burial is likely to be limited in low-density settlements, but would potentially represent a more significant risk in urban areas.
10.2.2 On-site sanitation The general principles of design and operation of on-site sanitation systems are
discussed by Franceys et al. (1992) and the risk posed to groundwater has been the subject of several major reviews and research (Lewis et al., 1982; van Ryneveld and Fourie, 1997; ARGOSS, 2002; see Box 10.1 below).
On-site systems are generally those in which excreta and anal cleansing materials are deposited directly into some sort of container, most commonly a subsurface excavation or tank.
Common to all forms of on-site sanitation is that part of the decomposition process is performed on-site. In some cases, the sludge will be fully decomposed within the pit, whilst in some others periodic desludging and treatment of the waste is required. The risk of such a contamination from the collection of waste at a single point depends largely on the design of the facility, but has been noted as being significant (Lewis et al., 1982; van Ryneveld and Fourie, 1997; ARGOSS, 2002). On-site wet systems also typically require some form of soakaway to dispose of excess effluent and this may increase risks from both pathogens and nitrate (ARGOSS, 2001).
On-site systems may be low-cost options such as various forms of pit latrine, or high-cost options such as septic tanks that provide a similar level of service to sewerage. They may be ‘wet’ systems, where water is used to flush the waste into a tank or pit, or dry systems using little or no water. Wet systems may require very limited water (for instance a pour-flush latrine) or require large volumes of water consistent with water piped inside the house with multiple faucets and which can receive all wastewater produced by the household.
Contained systems, such as vault latrines, cess pits and composting latrines are an intermediate stage between on- and off-site options, with varying amounts of
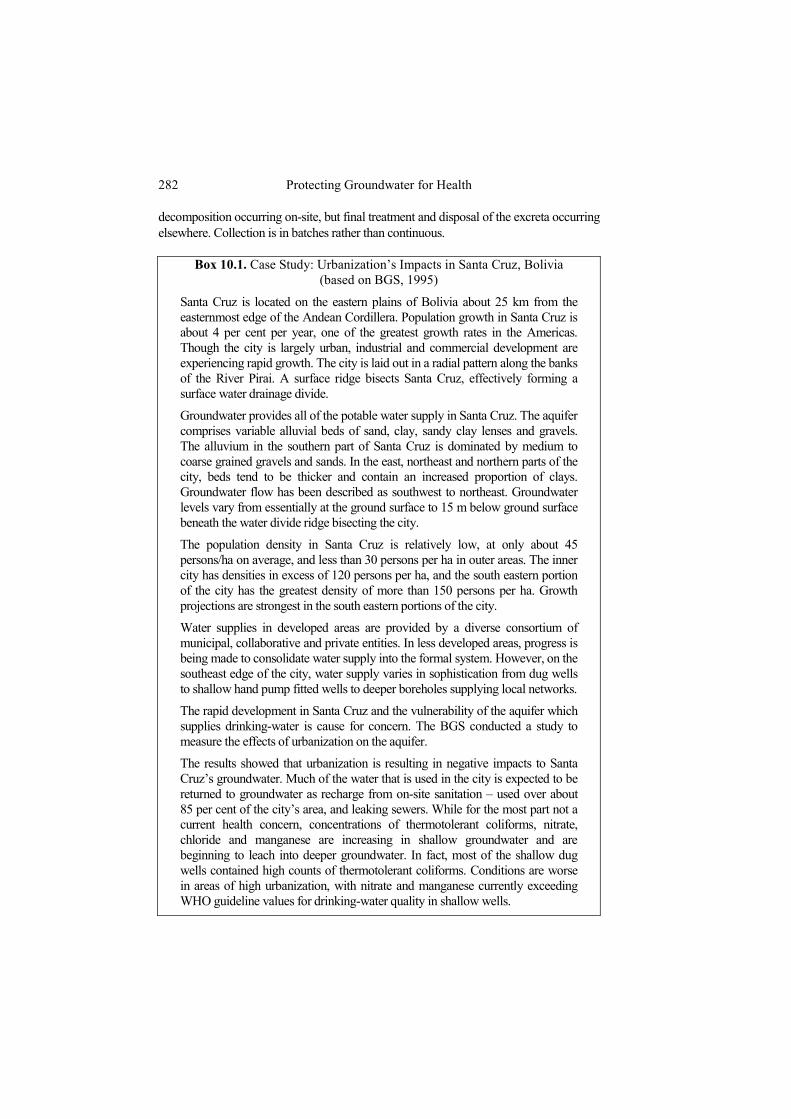
282 Protecting Groundwater for Health
decomposition occurring on-site, but final treatment and disposal of the excreta occurring elsewhere. Collection is in batches rather than continuous.
Box 10.1. Case Study: Urbanization’s Impacts in Santa Cruz, Bolivia
(based on BGS, 1995)
Santa Cruz is located on the eastern plains of Bolivia about 25 km from the easternmost edge of the Andean Cordillera. Population growth in Santa Cruz is about 4 per cent per year, one of the greatest growth rates in the Americas. Though the city is largely urban, industrial and commercial development are experiencing rapid growth. The city is laid out in a radial pattern along the banks of the River Pirai. A surface ridge bisects Santa Cruz, effectively forming a surface water drainage divide.
Groundwater provides all of the potable water supply in Santa Cruz. The aquifer comprises variable alluvial beds of sand, clay, sandy clay lenses and gravels. The alluvium in the southern part of Santa Cruz is dominated by medium to coarse grained gravels and sands. In the east, northeast and northern parts of the city, beds tend to be thicker and contain an increased proportion of clays. Groundwater flow has been described as southwest to northeast. Groundwater levels vary from essentially at the ground surface to 15 m below ground surface beneath the water divide ridge bisecting the city.
The population density in Santa Cruz is relatively low, at only about 45 persons/ha on average, and less than 30 persons per ha in outer areas. The inner city has densities in excess of 120 persons per ha, and the south eastern portion of the city has the greatest density of more than 150 persons per ha. Growth projections are strongest in the south eastern portions of the city.
Water supplies in developed areas are provided by a diverse consortium of municipal, collaborative and private entities. In less developed areas, progress is being made to consolidate water supply into the formal system. However, on the southeast edge of the city, water supply varies in sophistication from dug wells to shallow hand pump fitted wells to deeper boreholes supplying local networks.
The rapid development in Santa Cruz and the vulnerability of the aquifer which supplies drinking-water is cause for concern. The BGS conducted a study to measure the effects of urbanization on the aquifer.
The results showed that urbanization is resulting in negative impacts to Santa Cruz’s groundwater. Much of the water that is used in the city is expected to be returned to groundwater as recharge from on-site sanitation – used over about 85 per cent of the city’s area, and leaking sewers. While for the most part not a current health concern, concentrations of thermotolerant coliforms, nitrate, chloride and manganese are increasing in shallow groundwater and are beginning to leach into deeper groundwater. In fact, most of the shallow dug wells contained high counts of thermotolerant coliforms. Conditions are worse in areas of high urbanization, with nitrate and manganese currently exceeding WHO guideline values for drinking-water quality in shallow wells.

Human excreta and sanitation: Potential hazards and information needs 283
In on-site systems, the solid part of the waste undergoes anaerobic decomposition within the pit and the contaminants in the effluent are removed through attenuation, die-off, predation and dilution as it travels through the underlying soil, or from soakaways and drain fields. Natural attenuation processes tend to act most effectively in the upper soil level and because so many on-site sanitation systems bypass this layer, this may increase risks of groundwater contamination. This may be a particular problem with designs that allow for direct infiltration of effluent through the sides and base of the pit, particularly where hydraulic loads are high. However research suggests that within a relatively short period of time a biologically active layer forms around the active layers of the pit (i.e. those receiving faecal material) and forms a mat of gelatinous material of bacteria and fungi. Previous research suggests that within three months this layer inhibits movement of faecal bacteria and within seven months the presence of bacteria is largely restricted to the latrine (Caldwell and Parr, 1937). Other studies point to the limited penetration of bacteria to within a travel time equivalent to five to seven days and lateral breakthrough generally limited to within five meters (Subrahmanyan and Bharaskan, 1980; Chidavaenzi et al., 2000).
The biologically active layer appears to work in two key ways. Firstly, the presence of predatory microorganisms within the biologically active layer allows for permanent removal of some pathogens. Secondly the nature of the mat reduces the porosity of the soil matrix – essentially clogging the soil pores – thereby allowing an increased period for attenuation. In a properly sited, designed and operated system, the mat can also provide a protective barrier between waste and groundwater by effectively maintaining an unsaturated zone between the clogged pores and groundwater. This would appear to work in dry systems but is unlikely to be as effective when wet systems are used as the hydraulic load may be sufficient to overload the natural removal of microorganisms and may extend the saturated zone between the pit and the water table (ARGOSS, 2001).
It has been noted that the formation of a biologically active layer varies with subsurface nature. Some formations allow much greater breakthrough (presumably be-cause the nature of the pores does not allow such ready formation of biologically active layers). Viruses in particular are not so readily retarded. Fissures in the sub-surface, hy-draulic overloading of the system or a high groundwater table can result in system failure and contamination of groundwater or breakthrough. For instance, a study by Pyle et al. (1979) showed that bacteria could travel as far as 920 m where flow rates were high.
The biologically active layer appears to have a far more limited impact on chemical pollution, particularly nitrate. In most shallow groundwaters nitrate concentrations are likely to increase with the use of on-site sanitation. In some groundwater environments, this risk is mitigated because of reducing conditions that promote reduction of nitrate to ammonia. This may lead to very limited nitrate concentrations in groundwater despite a high density of pit latrines (ARGOSS, 2002). Oxidation reactions in shallow ground-water where organic loading is high (as would be typically found under urban areas) may enhance denitrification by using nitrate as further oxidizing agent after oxygen has been consumed (Lawrence et al., 1997). However, in lower density urban settlements and in rural areas, oxidizing conditions are more likely to be found, and denitrification does not take place, allowing nitrate from on-site sanitation to accumulate. This potentially affects long-term availability of groundwater as a source of drinking-water (ARGOSS, 2002).

284 Protecting Groundwater for Health
Box 10.2. Nitrate contamination of groundwater in areas with pit latrines in Francistown, Botswana
A study carried out on nitrate contamination of groundwater in populated areas of Botswana in 1976 found elevated concentrations of up to 80 mg/l in wells in several major villages (Hutton et al., 1976). The phenomenon was related to the occurrence of pit latrines and septic tanks used for sanitation. In 2000 the Geological Survey of Botswana in co-operation with the Federal Institute of Geosciences and Natural Resources, Germany, carried out a study on groundwater contamination in the city of Francistown. Francistown is located in the semi-arid region of eastern Botswana at the confluence of the seasonal Tati and Ntshe rivers. Rainfall averages around 500 mm/a. Born during the late 19th century as a gold mining town, the city’s rapid economic development particularly since the 1970s has turned Francistown into the second largest city in Botswana with a population of approximately 80 000 inhabitants. The water demand of the town used to be met entirely by groundwater resources locally available from shallow alluvial and fractured volcanic rock aquifers. The overlying soils are rarely thicker than 0.5 m. In the 1970s it was found that groundwater produced from the city’s public wells contained elevated concentrations of nitrate. In addition the growing water demand could no longer be met by the groundwater resources. For these reasons public water supply was shifted to surface water from the new Shashe dam in 1982, which was originally constructed for mining purposes 30 km from Francistown. The rapid population growth led to an extensive development of pit latrines, which also serve for domestic wastewater disposal. A centralized sewerage system covering approximately 50 per cent of the city area started to operate some years ago, now discharging to a wastewater treatment plant. Recently the sewerage system was extended to the remaining city area. However, connection to the sewerage system is voluntary, and the use of pit latrines and – to a lesser extent – septic tanks is currently still the main means of wastewater discharge in the newly connected areas. The recent groundwater quality survey sampled 47 public and private wells within and around Francistown. Analyses showed that nitrate concentrations well above the maximum allowable limit for drinking-water in Botswana of 45 mg/l were frequent within the city area, often reaching values between 100 and 300 mg/l (Figure 10.1). Some of these wells had already been sampled in the mid 1970s, and comparison with the old extremes of 80 mg/l shows that nitrate levels had significantly increased. Groundwater sampled in the recent survey from wells situated in remote areas outside the city contained considerably less nitrate, in most cases below 40 mg/l, which indicates that the cause of nitrate contamination is likely to be anthropogenic. To gain knowledge on the possible causes of contamination, potential point and non-point hazards to groundwater pollution such as areas with pit latrines, intensive farming, mining activity, cemeteries, abattoirs etc. were mapped. In addition flow directions of groundwater were inferred from the construction of a groundwater

Human excreta and sanitation: Potential hazards and information needs 285
contour map. Combining the results of the nitrate analyses with this information showed that nitrate concentrations in fact maximize in areas with pit latrines. Also, not a single borehole lying in or close to such areas was found to have a nitrate concentration below 100 mg/l. This relation between the location of areas with pit latrines and the occurrence of nitrate contamination can be seen in Figure 10.1, which shows a part of the project area in the south eastern part of Francistown. However, nitrate concentrations seem to quickly decrease with distance from a contamination source, whether this occurs by denitrification or dilution. The July 2000 nitrate contamination of groundwater might have been aggravated by extraordinarily high rainfall in the range of 2000 mm in February and March 2000. The findings support the conception that the use of pit latrines can cause serious nitrate contamination in groundwater. Nitrate contamination is promoted when households are connected to water supply but not to sewerage, as this causes an increase of percolation of waste water from the pit latrines to the groundwater. An improvement is likely when all households of Francistown are connected to the centralized sewerage system.
Figure 10.1. Nitrate concentration in groundwater in southeastern Francistown, eastern Botswana, in July 2000
Pit and trench latrines Pit and trench latrines are widely used for direct disposal of excreta due to the simplicity of design, ease of construction and low cost. Examples of pit latrine designs include simple pit latrines, ventilated improved pit latrines, pour-flush latrines, raised pit latrines, and composting latrines (Franceys et al., 1992). Aqua privies are discussed in conjunction with septic systems below.
Some pit latrine designs incorporate a twin-pit design, which provides several benefits (Pickford, 1995). Additional time is afforded for decomposition of the waste in the pit not being used, rendering a well-composted, odourless product which is relatively easy to handle when the pit is emptied. Where two pits are used, they are often dug to shallower

286 Protecting Groundwater for Health
depths, thereby increasing the depth of the unsaturated soil zone and providing more time for attenuation and, consequently, enhanced protection of groundwater. However, the use of twin pits requires effective user operation and this cannot always be assured, leading to overloading and risks incurred during emptying.
The risks from pit latrines are primarily derived from the increased risk of accumulation of faecal material in one place that may allow subsurface leaching of contaminants. The Francistown case study given in Box 10.2 highlights the potential for nitrate contamination from pit latrines and shows how situation assessment can document this by mapping.
As noted above, the presence of biologically active layers reduces the risk of subsurface leaching caused by the accumulation of faecal material. It has been suggested that ensuring that there are two meters of sandy or loamy soil below the base of the pit will reduce the risk of microbial contamination of groundwater (Franceys et al., 1992). The depth of the soil in the pit or trench in relation to the seasonal high groundwater table will indicate the seasonal risk of contamination.
Pits constructed into the water table are almost always a substantial cause for concern. In general, if pit or trench latrines are constructed so that they are safe from flooding and sufficient depth between the base of the pit and the groundwater is maintained, risks of microbial pollution are reduced. Septic tanks and aqua privies Septic systems provide a similar level of service as sewers as they can be linked to water closets located within a house. In unsewered cities, such as many in North America, septic tanks are the main method of sewage disposal (Lerner, 1996). While some large, community-scale septic systems are in use, most accommodate waste loads from a single dwelling to a few dwellings. Aqua privies are essentially limited to single or a few dwellings. The amount of space necessary for a septic system’s drainage field, described below, can limit the number of individuals or dwellings served by septic systems.
Septic tanks and aqua privies operate by initial deposition of excreta into an impermeable tank with overflow of excess liquid into a soakaway or drain field. In some cities, such as Hanoi in Vietnam, the effluent enters the surface water drainage system. In both technologies, the sludge is retained under water and this must be maintained to reduce offensive odours. Septic tanks are usually located at a distance from the toilet and water is used to flush excreta into the tank. Typically water volumes required are similar to those used in sewerage and most household wastewater may be discharged into the septic tank. The tank in an aqua privy is located just below or adjacent to the toilet. Water requirements are often lower than for septic tank systems, but the tank requires periodic addition of water to ensure a water seal is maintained.
Inside the tank of septic systems and aqua privies, solids settle out and are deposited on the tank bottom; a scum forms a crust on the surface. As the tank fills with liquid, the overflow is channelled out of the tank. A variety of options are available for the liquid once it leaves the tank. Many systems connect to a lateral permeable pipe or series of parallel permeable pipes. A method which allows for both filtering and treatment by soil microorganisms is to disperse the liquid into a shallow soil drainage field by means of a
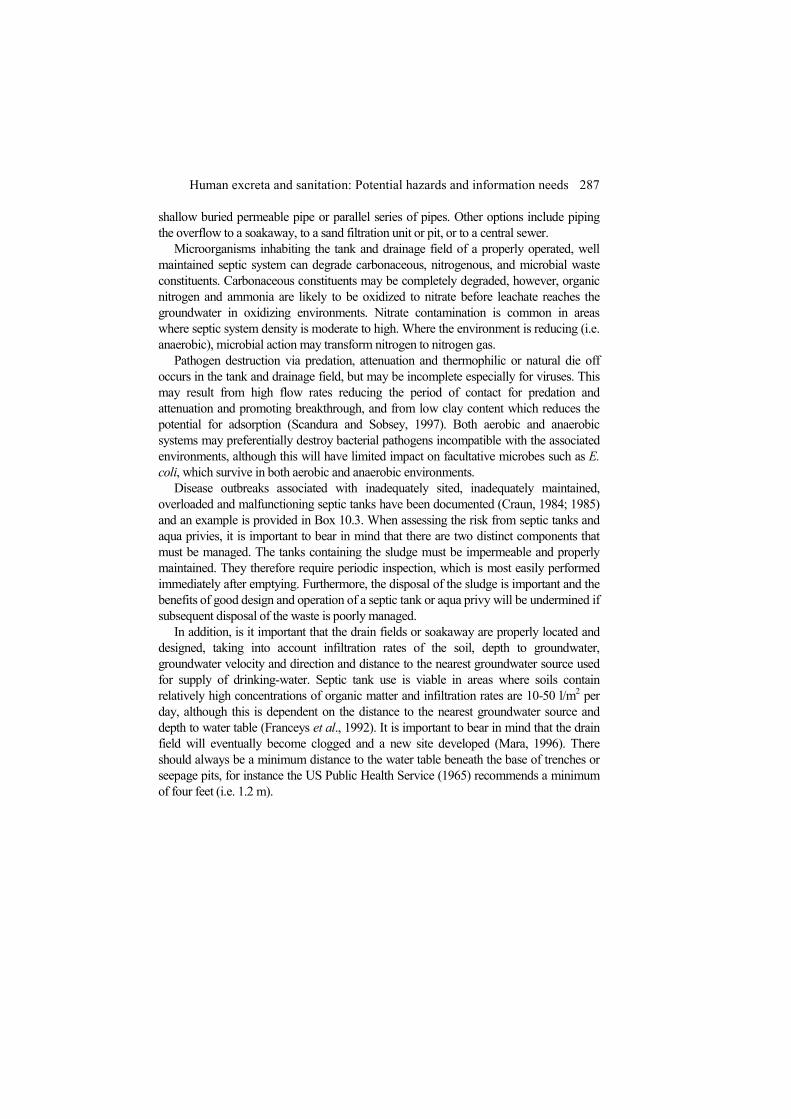
Human excreta and sanitation: Potential hazards and information needs 287
shallow buried permeable pipe or parallel series of pipes. Other options include piping the overflow to a soakaway, to a sand filtration unit or pit, or to a central sewer.
Microorganisms inhabiting the tank and drainage field of a properly operated, well maintained septic system can degrade carbonaceous, nitrogenous, and microbial waste constituents. Carbonaceous constituents may be completely degraded, however, organic nitrogen and ammonia are likely to be oxidized to nitrate before leachate reaches the groundwater in oxidizing environments. Nitrate contamination is common in areas where septic system density is moderate to high. Where the environment is reducing (i.e. anaerobic), microbial action may transform nitrogen to nitrogen gas.
Pathogen destruction via predation, attenuation and thermophilic or natural die off occurs in the tank and drainage field, but may be incomplete especially for viruses. This may result from high flow rates reducing the period of contact for predation and attenuation and promoting breakthrough, and from low clay content which reduces the potential for adsorption (Scandura and Sobsey, 1997). Both aerobic and anaerobic systems may preferentially destroy bacterial pathogens incompatible with the associated environments, although this will have limited impact on facultative microbes such as E. coli, which survive in both aerobic and anaerobic environments.
Disease outbreaks associated with inadequately sited, inadequately maintained, overloaded and malfunctioning septic tanks have been documented (Craun, 1984; 1985) and an example is provided in Box 10.3. When assessing the risk from septic tanks and aqua privies, it is important to bear in mind that there are two distinct components that must be managed. The tanks containing the sludge must be impermeable and properly maintained. They therefore require periodic inspection, which is most easily performed immediately after emptying. Furthermore, the disposal of the sludge is important and the benefits of good design and operation of a septic tank or aqua privy will be undermined if subsequent disposal of the waste is poorly managed.
In addition, is it important that the drain fields or soakaway are properly located and designed, taking into account infiltration rates of the soil, depth to groundwater, groundwater velocity and direction and distance to the nearest groundwater source used for supply of drinking-water. Septic tank use is viable in areas where soils contain relatively high concentrations of organic matter and infiltration rates are 10-50 l/m2 per day, although this is dependent on the distance to the nearest groundwater source and depth to water table (Franceys et al., 1992). It is important to bear in mind that the drain field will eventually become clogged and a new site developed (Mara, 1996). There should always be a minimum distance to the water table beneath the base of trenches or seepage pits, for instance the US Public Health Service (1965) recommends a minimum of four feet (i.e. 1.2 m).

288 Protecting Groundwater for Health
Box 10.3. A severe outbreak of waterborne disease – an on-site treatment system suspected of contaminating a well (based on CDC, 1999)
The investigation by the New York State Department of Health into the 1999 outbreak associated with attendance at the Washington County Fair indicated that the outbreak may have resulted from contamination of the Fair's Well 6 by a dormitory septic system on the fairgrounds. A total of 781 people were affected with either confirmed or suspected cases in the outbreak. Of these, 127 cases of E. coli infection and 45 cases Campylobacter jejuni were confirmed, with 2 deaths and 71 people hospitalized, of which 14 developed haemolytic uraemic syndrome, a severe complication of E. coli O157:H7 infection that can lead to kidney failure. A case-control study concluded that consumption of beverages sold by vendors supplied with water from Well 6 was a key risk factor for patients with culture-confirmed illness. E. coli O157:H7 was found in samples from Well 6, which supplied unchlorinated water to some vendors, and water distribution pipes leading from Well 6. E. coli O157:H7 was found in the septic system of the dormitory building. The discharge area (seepage pit) of that septic system was approximately 36 feet from Well 6 and tests showed a hydraulic connection, at the time of the tests, from the septic system to Well 6. The source of the E. coli O157:H7 in the dormitory septic system is unknown and tests did not identify Campylobacter in samples from the dormitory septic system or Well 6. Tests did not demonstrate a connection from the manure storage area near the Youth Cattle Barn or the presence of E. coli O157:H7 in samples taken from that area. However, because exact environmental conditions (including drought followed by rain) present at the time of the Fair could not be replicated and because manure was removed daily, it may never be known if manure-contaminated water percolated from the manure storage area to Well 6.
Contained systems Contained systems, also referred to as ‘cartage systems’, are impermeable vessels used to collect excreted wastes. Bucket latrines are contained systems in their simplest form. Excreta in a bucket latrine, commonly referred to as night soil, must be emptied routinely. Bucket latrines represent a major health risk, particularly to the collectors and their use should not be promoted. WHO has developed guidelines for the safe use of excreta in agriculture (WHO, 2005).
The risk of groundwater contamination from bucket latrines may be limited and will certainly be far less than occupational hazards of collectors and transmission of pathogens via flies for users. If bucket latrines are used, the risk to groundwater sources used for drinking-water will be reduced by disposal in lined pits or trenches, or in a sewer if available. This should largely limit the potential for leaching of pathogens and nitrate into groundwater. Cartage to areas far removed or downgradient from groundwater supplies affords more options, with unlined pits or trenches as disposal options for a lesser risk to drinking-water. Dispersed burial reduces the potential for significant groundwater contamination and provides the opportunity for reducing health impacts due to direct contact and insect or vermin attraction, as well as permitting soil bacteria to

Human excreta and sanitation: Potential hazards and information needs 289
degrade excreta. The presence of a confining soil layer will determine whether or not leaching into groundwater occurs. Disposal of night soil into surface waters may not only contaminate these waters but also groundwater if the aquifer is under the influence of surface water.
Impermeable tanks are an alternative system that primarily provide a holding area for excreta. Wastes must be removed periodically, generally by hand or by pumping. Wastes are then transported to a centralized treatment system. Such latrines are often referred to as vault latrines or cess pits and some decomposition will occur during storage, although nonetheless the waste must be periodically removed. If the container is intact, no risk to groundwater exists other than that from waste which might seep into soils during emptying or spills during transport. However, maintaining a completely impermeable container may be difficult. Furthermore, in some settings deliberate drilling into the container is practised, often illegally, which allows liquids to leak to the subsurface thus reducing the amount of wastes to be collected and transported to centralized treatment systems, and therefore saving disposal costs for the owner of the container. Though hard to identify, this practise may pose an increased risk to groundwater pollution with pathogens where hydrogeological conditions favour their transport.
Composting technologies Composting utilizes bacteria, fungi, and other microorganisms to degrade organic waste materials. Composting may be performed in anaerobic or aerobic regimes. As treatment is effected, temperatures in the degrading waste increase due to microbial activity. As the temperature increases, a succession of microorganisms, progressing from mesophilic to thermophilic, inhabit the compost until temperatures rise beyond the ability of organisms to survive. When properly managed, composting temperature can be controlled to optimize degradation, often through the introduction of air and mixing. Introduction of air also minimizes odour production. Odour problems are more predominant in anaerobic systems which generally require additional maintenance and collection of methane off-gas. Control of moisture is important in any composting system to optimize degradation rate. At the end of the composting process, temperature can be allowed to increase to effect pathogen destruction.
Latrines that employ composting as a treatment process are more advantageous, in many respects, than alternative treatment or disposal processes. Modern designs generally require minimal maintenance, destroy waste products and pathogens biologically and produce a by-product that may be used as a soil amendment or fill material. Some designs include the need to segregate urine from faeces (i.e. urine diversion). Disposal of the urine can result in contamination of surface water or groundwater, if not controlled.
A functioning composting process will protect groundwater from contamination with pathogens and will contribute to denitrification, thus reducing nitrate loads. The potential for contamination arises from incomplete composting processes in conjunction with poor attenuation in sub-surface, following the same pathways and with the same risk factors as for other on–site systems. Equally, contamination with household chemicals and personal care products will contaminate the compost product with those components which are not readily biodegradable.

290 Protecting Groundwater for Health
There is increasing interest in the use of ecological sanitation that is designed to maximize the recycling and use of nutrients from excreta and to minimize environmental discharges. However, such technologies are not risk free in relation to groundwater, although the restriction on hydraulic loads can be expected to significantly reduce the risk, and the use of sealed containers may also reduce risks. Risk assessment approaches for urine diversion technologies should take into account the potential for accidental leakage and spills and also consider the end-use and disposal of the treated waste.
Although systems which incorporate composting in a centralized facility are not in general use, the concept holds promise in light of designs more widely applied to composting municipal sludge. They would locally focus potential risks to groundwater. Thus as in other centralized systems, they require increased attention in situation assessment, design and surveillance.
10.2.3 Off-site sanitation: Sewerage and centralized treatment Off-site systems are forms of sewerage which transport excreta through sewer pipes using water. They only transport faecal matter away from the household and do not involve on-site decomposition to a significant degree. Conventional sewerage systems usually transport excreta and wastewater to centralized treatment plants. They are the norm in urban areas of most developed countries and use large diameter pipes with significant hydraulic gradients to ensure continuous suspension of solids. Conventional sewers usually require significant volumes of water to transport the waste and therefore require high levels of reliable water supply service. Sewerage systems need to be maintained regularly to prevent leakage. Leaking sewers are likely to represent a significant risk to groundwater where centralized wastewater collection is practised. Leaking sewers are therefore described in a separate section below.
There are two forms of modified sewerage which use lower volumes of water and are found in Latin American and Asia (Mara, 1996). Simplified sewers (sometimes called condominial sewers) require typically lower quantities of water. Research in Brazil has shown that simplified sewers can cause suspension of solids at relatively low velocities and are more efficient than conventional sewers where flows are intermittent and solids are moved along the sewer line through a process of repeated deposition and re-suspension (Mara, 1996). However, to do this, sufficient numbers of people must be connected to ensure the necessary level of flow is maintained. Small-bore sewers are another form of modified sewerage that carry effluent and have an inceptor tank to remove solids at the household level (Reed, 1995; Mara, 1996). They therefore work as a mixture of both on-site and off-site sanitation, although there is usually little decomposition in the inceptor tanks, which require periodic desludging, and disposal has been noted to be often poorly managed (Reed, 1995).
In some settings, sewerage systems include rainwater drainage from roads and other paved surfaces, and these overflow periodically when water volumes from precipitation are beyond their capacity, thus leading to an overflow of a mixture of excreta and surface runoff that is commonly discharged to surface or marine waters with no or mechanical treatment.

Human excreta and sanitation: Potential hazards and information needs 291
The use of off-site methods requires treatment of wastes prior to their final disposal to prevent health-relevant contaminants in the effluent from reaching water intended for human use. In almost all cases, the final discharge of treated wastewaters and a significant proportion of untreated wastewater is to surface or marine waters. Risks to groundwater are therefore often dependent on the nature of the relationship between ground and surface water, in particular whether groundwater is recharged by surface water or whether groundwater provides baseflow to surface water bodies. This relationship may not be static and seasonal changes are common (Foster and Hirata, 1988).
Centralized wastewater treatment and storage facilities can bestow significant benefits to communities. Processes can be combined to optimize treatment of physical, chemical, and biological constituents in a waste stream. Pathogen removal and destruction vary between different types of sewage treatment technology, but may be very significant. The quality of the effluent required will not usually depend on meeting drinking-water quality requirements in groundwater sources, but rather relate to surface water use for abstracting drinking-water, recreation, or use of wastewater in agriculture and aquaculture (Bartram and Rees, 2000; Fewtrell and Bartram, 2001).
Centralized wastewater treatment produces substantial amounts of sludges –essentially the biomass that remains after biological treatment of wastewater. These must be disposed of or re-used as a soil amendment, fill, landfill cover, or other beneficial uses. Application to land may represent a significant risk to groundwater where poorly designed and operated. Composting either aerobically or anaerobically is a viable option for treating and thermally disinfecting wastewater sludges, which may then be put to use as soil amendments, backfill and landfill cover without inducing risks due to pathogens.
Where wastewater includes effluent from industries and dispersed small enterprises, it is likely to be contaminated with an array of often unknown chemical substances. Distribution of such sludges in the environment may be a substantial non-point source of contamination, some of which may reach groundwater. This in some cases is mitigated where application is on the land surface, as many contaminants will be removed through adsorption, sequestration and complexing with organic material. Situation assessments of centralized wastewater treatment systems need to include sludge quality and disposal. Sewage treatment Various options are available for successfully treating waste flows at centralized facilities. These include trickling filters, activated sludge treatment, oxidation ditches, sequencing batch reactors, constructed wetlands, irrigation fields and sand filtration (Dinges, 1982; Metcalf and Eddy, 1991; US EPA, 1996; Lens et al., 2001). Advanced technologies include filtration, e.g. through membranes, for pathogen removal, wastewater disinfection, nitrification and denitrification, as well as phosphorus removal either biologically or by chemical precipitation using alum, iron salts and lime.
Wastewater treatment facilities can impose inadvertent risks to groundwater. Spills, leaks and overflows, either accidental or occurring during rain events, can enter the ground at or nearby the facility. Raw or non-disinfected wastewater which directly enters or migrates to soils can percolate to groundwater. Large events, or those associated with flooding, also pose risks to groundwater via entry through recharge areas, excavations,

292 Protecting Groundwater for Health
abandoned wells, trenches or pits, and by leaking around or into the well itself. The location of wastewater treatment and effluent discharge in relation to a potable groundwater source are important considerations for situation assessments.
Where treated wastewater effluent is used for groundwater recharge, determination of travel times for the recharged groundwater is imperative to ensure that adequate time exists for pathogen attenuation to occur. The use of recharge basins or other techniques of application to the soil surface has the distinct advantage of being able to utilize natural soils above the natural groundwater table for additional treatment and natural filtering. Retention times in basins may also be engineered to be long enough to permit significant pathogen destruction.
The use of waste stabilization ponds as a form of treatment has also become widely used in many parts of the world. When designed and operated properly the use of waste stabilization ponds has been shown to be effective in a variety of settings from arid to humid tropics and have proved to produce effluent of high quality (Pearson et al., 1987; WHO, 1987; Horan, 1990; Mara et al., 1992; Mara, 1996).
There are three principal types of ponds: facultative, anaerobic and maturation. In some cases only a single pond (usually a facultative pond) may be employed, whilst in other as series of ponds may be used. Anaerobic ponds are often used prior to facultative ponds to ensure adequate BOD reduction and sludge decomposition. Such ponds would typically be used where septic tank wastes are disposed of into the treatment works. Maturation ponds are used where good effluent quality is required and these have been shown to produce effluent of very high quality (Mara et al., 1992).
Whether leaching from waste stabilization ponds represents a risk to groundwater depends on the quality of construction, the depth of the unsaturated zone, and whether this is altered by the pond, and depth to the water table. If ponds are unlined, the unsaturated zone below the ponds is low, or materials below the pond are highly permeable, then the risk of leaching may increase. Some workers note that in well-designed ponds, the risk to underlying groundwater from both chemical and microbial contaminants will be limited (WHO, 1987; Foster and Gomes, 1989).
Leaking sewers Leaking sewers have been shown to be a significant source of groundwater pollution in numerous urban settings of the world though information on the full extent of the potential hazard confronting groundwater is rather poor. Evidence of sewer-related groundwater contamination incidents is known from Bolivia, United Kingdom, Germany, Ireland, Israel, Sweden and the USA (BGS, 1995; Misstear and Bishop, 1997; Bishop et al., 1998).
A number of documented outbreaks have occurred that can be linked to leaking of sewers and subsequent ingress into water supplies, including sources such as wells and distribution systems (Hejkal et al., 1982; D’Antonio et al., 1985; Swerdlow et al., 1992; Bergmire-Sweat et al., 1998). The most dramatic incident was reported from Haifa, Israel in 1985, where leakage from a broken sewer in an adjacent village resulted in epidemics of typhoid and dysentery, with 6000 people affected and one fatality. In the United Kingdom a serious outbreak of disease occurred in 1980 at Bramham in Yorkshire, resulting in 3000 cases of gastroenteritis (Short, 1988; Lerner and Barrett,

Human excreta and sanitation: Potential hazards and information needs 293
1996). In Naas, Ireland leakage from a sewer led to 4000 cases of gastroenteritis (Bishop et al., 1998). Many studies cite groundwater quality data as evidence of sewer-related contamination (Burston et al., 1993). These all indicate the need to address sewer proximity to groundwater sources and condition as important in situation assessments.
Two of the most detailed recent studies of sewer leakage in the United Kingdom have been carried out in Coventry (Burston et al., 1993) and Nottingham (Barrett et al., 1997; 1999a). The Nottingham case study given in Box 10.4 shows the extent to which leaky sewers can compromise groundwater quality with a range of contaminants, including microbial indicators. Yang et al. (1999) estimated that about five per cent of recharge of groundwater in Nottingham in the United Kingdom came from sewer leakage, although noted that the confidence intervals on this estimation were very wide. This is in line with estimates derived from an international review by Misstear et al. (1996), although these authors noted that estimates of the proportion of sewers that were defective are much higher.
In Germany, the extent of leakage from sewers was estimated to be about 15 per cent according to a poll which registered 17 per cent of the public sewerage system (Dyk and Lohaus, 1998). Eiswirth and Hötzl (1997) estimated that several 100 million m3 wastewater leak every year from damaged sewers in Germany. Härig and Mull (1992) calculated the extent of exfiltration to the aquifer below the city of Hannover, Germany to be 6.5 million m3/year and the infiltrated water to 20 million m3/year.
In earthquake-prone countries, loss rates are significantly higher, for example up to 60 per cent were estimated for parts of Lima, Peru (Lerner, 1996).
There is far less available information regarding the risks posed by modified sewerage (as discussed above in Section 10.2.2), in part because their use is limited. However, there is significant potential for modified sewers to increase risks both through leaks and by their mode of operation. The use of interceptor tanks in small-bore sewers causes similar potential risks as on-site sanitation, although as contained systems this risk may be limited. The shallow depth of most small-bore sewers increases the likelihood of breakage particularly where these are close to roads and may therefore lead to infiltration of contaminated effluent into the sub-surface. The design of the sewer also means surcharging will be more frequent than with conventional sewers. Similar problems may occur with shallow sewers.
The quality of sewage will depend on the source. Sewers draining industrial areas will reflect the waste being disposed of in the factories. This may vary in quality and quantity depending on the activities. Washing down a factory floor may result in large quantities of water with inert suspended solids, but five minutes later there may be a much smaller volume of water from washing equipment that is contaminated with complex chemicals.
Sewers draining residential areas will have a more consistent load, but people dispose of a wide range of wastes down sewers. Oils, grease, household chemicals and faeces may be expected, but chemical spills can occur anywhere. Even surface water cannot be regarded as uncontaminated. Unless it is running off a clean surface, rainfall will pick up dust, spilt oil, air deposits (such as particulate matter from car exhausts) and these can lead to pollution.

294 Protecting Groundwater for Health
Box 10.4. Leaky sewers compromising groundwater safety in Nottingham
Cities may dramatically change recharge pathways and quantities (see e.g. Lerner et al., 1982; Lerner, 1986; 1990). This is highlighted by a study of groundwater quality in Nottingham, UK conducted from 1994 to 2001. The setting. Public water supply to the Nottingham area is from several reservoirs fed by boreholes, only one of which is located within the city itself. Chlorination is carried out at the borehole sites prior to pumping to the reservoir. The borehole located within the city is currently used only in drought situations due to concerns regarding quality. Limited blending of sources is carried out before filling some reservoirs to ensure nitrate limits are not exceeded: As well as the mains supply, some industrial sites and hospitals have private boreholes. Groundwater is mainly found in the Triassic Sherwood Sandstone Group, which varies in thickness from zero in the west to over 150 m in the north. It is confined to the east and south by the Mercia Mudstone Group, and overlain in the valleys of the rivers Trent and Leen by alluvium. Regional groundwater flow is to the south and east, discharging into large boreholes and the two rivers. In much of the urban area there is little drift cover and the aquifer is unconfined and vulnerable to contamination. Study results. Analysis showed degradation of the inorganic quality of the urban aquifer in comparison to the surrounding unconfined rural aquifer. Nitrate concentra-tions frequently exceeded 50 mg/l. Within industrial sites contamination by chlori-nated solvents was widespread, TeCE being the most common contaminant and exceeding drinking-water limits in 50 per cent of samples. A survey of shallow groundwater in a residential district for nitrogen isotopes and TTC showed all the sampled shallow piezometers at the water table to be contaminated by sewage. Contamination is concentrated at specific horizons (preferential flow paths), but these exist throughout the aquifer thickness. Vertical and temporal distributions of microbial contaminants were found to be far more variable than those of chemical solutes, reflecting different source and transport characteristics. It is not possible to quantify the groundwater recharges of the city directly. There are three main sources of recharge in Nottingham (precipitation, mains and sewers). This study simultaneously calibrated four flux balance models for groundwater and three conservative chemical species (chloride, sulphate and total nitrogen). A groundwater flow model and three solute transport models were constructed and calibrated against hydrographs and all available measurements of solute concentrations dating back to the 19th century. The study area was divided into six zones, and the study period of 1850-1995 was divided into 13 periods to represent the spatial and temporal variations in recharge, pumping and solute loads. At 700 mm of rainfall per year, the average rates of recharge in the urban area for the most recent period were calculated to be: 211 mm per year total recharge, 138 mm per year mains water leakage, 64 mm per year precipitation, and 9 mm per year sewer leakage. There is uncertainty associated with these estimates due to the scarcity of hydrological data and limited historical data on quality. On a broad scale, sewage is found to be the major threat to the quality of urban Triassic Sandstone aquifers. The study highlights the vulnerability of sandstone aquifers to microbial contamination and the challenge to the delineation of wellhead protection areas.

Human excreta and sanitation: Potential hazards and information needs 295
The variation in sewage quality (see also Table 10.4) will lead to varying impacts from sewage leakage and may result in periodic discharges of highly contaminated sewage into the environment. Assessing sewage quality and likely variations will help inform control strategies to ensure that areas of particular high-risk are noted and that actions are prioritized in these areas.
As pollutants are transformed within sewers, it has proven useful to classify them accordingly into primary, secondary and tertiary products. Primary pollutants include microbes and ammonia as well as substances used in bleaching, cleansing and disinfection. Detergents, solvents, fertilizers and salts also increase concentrations of bulk organics reflected by parameters such as dissolved organic carbon (DOC) and absorbable organic halides. Secondary pollution effects arise from subsequent reactions, such as lack of dissolved oxygen, formation of carbon dioxide, decrease in redox potential and changes in electrical conductivity due to microbial degradation of wastewater compounds (Eiswirth et al., 1995). Tertiary pollution effects are changes of specific water constituents through biological and chemical reactions such as ammonification, nitrification, denitrification, desulphurization and mobilization processes (Eiswirth and Hötzl, 1997).
In discussing interactions between groundwater and sewers, some confusion may prevail with terminology. A sewer engineer will refer to infiltration as water coming into the sewer. A groundwater specialist will refer to infiltration as water going into the ground. This may be water that is exfiltrated from the sewer. The problems of infiltration and exfiltration may occur alternately where sewers are at a level between maximum and minimum groundwater table positions. Water table fluctuations may cause reversals of infiltration and exfiltration with consequent potential for groundwater contamination.
Sewer managers are normally concerned with infiltration of groundwater into sewers. Too much water entering the sewer will result in elevated amounts of wastewater that needs to be treated at the treatment works. This may overload the capacity of the sewers and reduce the efficiency of wastewater treatment plants (Härig and Mull, 1992). For example, in Plittersdorf, Germany nearly 52 per cent of the total wastewater discharge is infiltrated groundwater (Eiswirth and Hötzl, 1997). Infiltrated water can also bring silt into the pipe blocking it. A steady stream of groundwater entering the pipe may wash away the surrounding soil, causing settlement and damage to the pipe. An assessment of infiltration can indicate the condition of the pipe.
More important for groundwater quality, leaks in sewers may cause exfiltration from the sewer into the groundwater. If sewers are situated above the zone of fluctuation of the groundwater level, the impact of exfiltration from damaged sewers to groundwater is controlled by aquifer vulnerability, depending on permeability of the material between a leaking sewer and the aquifer (Misstear et al., 1996; Bishop et al., 1998). The pollution of groundwater with exfiltrated harmful chemicals from wastewater typically results in long-term damage that can only be rectified over very long periods of time and with considerable technical and financial effort.
In order to understand the mechanisms of groundwater pollution from sewers and methods of monitoring and mitigation, some background information is required on the construction of sewers. Sewers are the pipes that form a sewerage system that convey sewage or wastewater. They can be made from a variety of materials such as concrete,

296 Protecting Groundwater for Health
cast iron, plastic or, especially for older sewers, brick. The sewer pipes are laid in a trench as shown in Figure 10.2 below.
The trench is filled with a granular material. This bedding and surround protects and supports the pipe, makes it easier to compact the material in the trench and thus avoid settlement of the ground above the pipe and also makes it easier to lay the pipes so they are in the correct position. Pipes are typically manufactured in short lengths to make it easier to transport and lay them, but this does mean they have to be joined. Some metal pipes are bolted together, some plastic pipes can be heated and welded to form a joint, but many cast iron and concrete pipes have a spigot and socket joint. The end of one pipe can be pushed into a socket of the next pipe. This allows for some movement and allows the pipes to be laid at a slight angle to each other in a gentle curve.
Figure 10.2. Sewer design
Infiltration and exfiltration can occur via a variety of routes as shown in Figure 10.3 below. Loose joints (1), displaced joints (2), and cracks in the structure of the pipe (3) all allow water into and sewage out of the pipe. Other routes include poor junctions between pipe branches (4), leaking manholes (6) and at the points where pipes enter structures (7) or as inflow, directly along pipes (for example pipes leading to abandoned or future connections) (5). These are shown in Figure 10.4 below.
Physical damage is caused when pipes settle relative to other pipes or structures. Chemical damage can occur when hydrogen sulphide from anaerobic decay of organic matter, oxygen and bacteria combine to form sulphuric acid that can attack the soffit (roof) of the sewer and damage materials such as concrete.

Human excreta and sanitation: Potential hazards and information needs 297
Figure 10.3. Points of leakage from sewers
Figure 10.4. Further leakage points from sewers
Leakage from sewers and other damage also occurs due to mechanical malfunctions such as open or displaced joints, deformation, collapse and blockage. From an extensive survey, Bishop et al. (1998) showed a steady rise in the rate of failure as sewers age, the most common cause of sewer failure being joint fracturing related to the practice of using rigid joints, while deterioration of pipe material did not play an important role. Tree root ingress, rodent activity (Battersby and Pond, 1997) and damage from subsurface work on other utilities may also cause leaks.
Factors that influence leakage of sewers include (Aigner et al., 1998): • type of subsoil; • height of groundwater level above sewers; • standard of workmanship in laying pipes; • type of pipe joint, number of joints and pipe size; • total length of sewer (including house connections); • number and size of manholes and inspection chambers; • rainfall (daily and seasonal); • age of system.
Whether the water is moving into or out of the sewer will depend on the relative head of the water. A sewer will only leak if it is below the water table or if it is overloaded or surcharged. The pipe trench can then act as a soakaway. The sewage can flow through the granular backfill, away from the leaking crack or joint and this can increase the rate the wastewater can infiltrate into the ground. Where wastewater has to be pumped uphill, pressure sewers will have a positive head, so more attention needs to paid to ensure they do not leak.

298 Protecting Groundwater for Health
Sewers can be graded according to their structural condition (WRc, 1994). Using methods such as close-circuit television, the pipes are examined for cracks and deformation. Sewers graded in the most severe category may collapse. Leaking sewers that are not necessarily in danger of structural failure will have a lower priority for action. However, groundwater pollution can arise from both the long term diffuse leakage from pipes as well as the sudden collapse of a sewer. Most utilities conduct structural assessments only for important large sewers, as planned replacement of these is preferable to having to react to a large hole opening up in a road. The collapse of smaller sewers has less of an economic impact and so they are not routinely monitored, yet their length can contribute significantly to diffuse pollution and their shallowness lead to structural damage. In the United Kingdom about 75 per cent of the sewage network is regarded as structurally non-critical (Read and Vickridge, 1997). House connections constructed by non-specialists can also provide a source of groundwater contamination that would not be recorded by a structural survey.
Pollution routes do not only occur through leakage into aquifers. Blockages or hydraulic overloading (due to storm water or increased foul flows) can cause the sewer to become full and eventually flood. This can be through lifting manholes, backing up into people’s houses or through specifically designed combined sewer overflows (CSOs). Pumping stations also require emergency overflows in case of complete failure of the pumps. The design should ensure that sewage flooding occurs in an area with minimal social, economic and environmental impact, rather than flooding homes, public areas or environmentally sensitive zones.
Storm water management Current practice separates foul sewage from surface water runoff in many urban areas. However in older urban areas or areas with poor regulation and enforcement, sewers can carry both surface and foul water. Storm water drainage systems may collect effluent from septic tanks, misconnections from foul sewers, excreta and other wastes washed from the ground surface and flood water contaminated by inundated pit latrines. As storm sewers are ‘officially’ for rainwater, they are not designed to cater for faecally contaminated material. Open drains and lack of treatment before discharge to surface or groundwaters can provide a route for pollutant transmission.
10.3 ASSESSING THE RISKS TO GROUNDWATER
10.3.1 Assessing risk from on-site sanitation Understanding the hydrogeological environment and the siting of on-site sanitation is as important as knowing the specific design of the facility, and the two interact to define the level of risk. Of particular concern is whether the natural attenuation of pathogens will be effective. The use of pit latrines, for instance, is often of particular concern as they by-pass the major attenuating layer of the soil. Although the development of biologically active layers around the pit reduces breakthrough, this cannot be wholly relied upon in all situations and periodic overloading may occur.

Human excreta and sanitation: Potential hazards and information needs 299
The assessment of risks to groundwater from on-site sanitation should take into account the hydraulic load, the depth to the water table, the nature of the groundwater (whether oxidizing or reducing) and the time taken for water to travel from the pollutant source to the groundwater abstraction point. The lithology of the unsaturated zone will also be important in relation to the potential for attenuation. For chemicals, and to a lesser extent pathogens, the density of population may also be important in assessing whether significant contamination will occur. Relatively simple approaches are available for assessing such risks using only limited hydrogeological data (ARGOSS, 2001). However, it is important to ensure that faecal material cannot enter the drinking-water source through other means. This can be determined through targeted assessments.
10.3.2 Assessing the risks to groundwater from sewerage Assessing risks of groundwater pollution from sewerage systems has in the past not attracted much attention and assumptions regarding the expected attenuation of microbial contaminants resulted in little concerted effort to define the extent and nature of groundwater contamination (Reynolds and Barrett, 2003). Powell et al. (2003) demonstrated that microbial contaminants (both bacterial and viral) derived from sewage can penetrate to depths of up to 90 m in some aquifers. These included indicator organisms and enteric viruses including Norovirus and Coxsackie B virus.
In assessing the risks of contamination from sewerage, due consideration must be given to the nature of sub-surface below the sewer including the depth of unsaturated zone, the lithology (and likely attenuation potential), the depth of groundwater and the hydraulic loading that could be derived from leaking sewers. In particular, estimating the volume of exfiltration from sewers into groundwater will assist in determining the risk to groundwater, although this is a complex task. Several methods have been developed to quantify the water exchange between groundwater and sewers. Härig and Mull (1992) used budgets of wastewater flow streams, a calibrated groundwater flow model and the detection of sewage indicators. Yang et al. (1999) developed a model supplemented by solute budgets of chloride, sulphate, and total nitrogen for the estimation of recharge to groundwater in Nottingham.
In addition, assessments can be made of the state and age of the sewer infrastructure as a guide to the risk of sewer leakage. Older sewers will be more likely to leak as the likelihood of breakage increases because of age and often because of construction techniques that increase vulnerability to breaking. However, whilst more recent sewers may be less prone to breaking, construction techniques may increase the likelihood of leakage paths in the surrounds around the pipes. Reynolds and Barrett (2003) suggest that assessing risks to groundwater from sewer leakage should be based on the frequency of sewer breaks noted, age and methods of construction, grading of material surrounding the pipe and groundwater level. Active monitoring programmes may also assist in identifying the extent and nature of contamination from sewers.

300 Protecting Groundwater for Health
10.4 ANALYTICAL INDICATION OF HUMAN EXCRETA AND SEWAGE IN GROUNDWATER
Identifying pollutant sources from sewage is often a major task due to the multitude of potential sources and pollutants in an urban environment and detection of leaks in sewers may be difficult. Indicator organisms such as E. coli, faecal streptococci and bacteriophages remain useful in detecting general faecal contamination although it may be difficult to precisely identify the source of contamination. Less robust organisms such as sulphite-reducing bifidobacteria may be useful as species can be identified that are unique to human faeces.
Barrett et al. (1999a) tried to use chemical marker species which can be used to indicate groundwater recharge from sewage. Most useful major ions are chloride, sulphate and individual nitrogen species (Härig and Mull, 1992; Eiswirth et al., 1995), while cation ratios can change due to ion exchange processes (Trauth and Xanthopoulos, 1997). Potential markers for sewage include ingredients of detergents like phosphate, boron, ethylendiamine tetraacetic acid (EDTA), optical brighteners and d-limonene. Constraints on the value of these substances as markers are the variable composition of detergents so that these compounds may not always be present. In addition, boron and phosphate are not unique to sewage, and their occurrence and mobility in groundwater is influenced by pH. Elevated groundwater concentrations of phosphorous may result from overloading soil adsorption capacities from waste treatment systems (i.e. indicating wastewater ingress), but may arise from agricultural use as fertilizer (Day, 2001).
Stable nitrogen isotopes and microbial parameters are further tools. However due to the die-off of microorganisms and the mixing and fractionation processes affecting the nitrogen isotopes both parameters are not absolute indicators and may be difficult to interpret. The study described by Barrett et al. (1999a) shows that ideal marker species are rare because most groundwater constituents are present in more than one potential source of recharge. There is a need for a multi-component approach rather than using individual markers.
The introduction of sewage to an aquifer may cause significant changes in the chemical quality of groundwater. Observed effects may include depletion of dissolved oxygen, lowering of pH, increases in DOC, chemical oxygen demand (COD), biological oxygen demand (BOD) and conductivity as well as decrease of redox potential (Rivers et al., 1996; BGS, 1997; Barrett et al., 1999a). A further important effect of organic matter is that it blocks sites for attachment on the surface of grains of the porous medium, thereby reducing attenuation of microorganisms. Clogging will also eventually occur to block flow paths.
Nitrate is frequently used as a marker of sewage input, as it is derived from the microbial oxidation of excreted ammonia in soils, and is generally conserved in groundwater. However, nitrate may be derived from a number of other sources (e.g. fertilizer or manure application). A more reliable tool is the ratio of nitrate to chloride. High nitrate to chloride ratios are indicative of faecal origin, although the precise ratio will depend upon population density and leaching to groundwater (Morris et al., 1994). A drawback is that this ratio may vary seasonally, particularly in shallow groundwater. Nitrate levels have been shown to decrease through dilution during the early part of the

Human excreta and sanitation: Potential hazards and information needs 301
rainy season and then to subsequently increase in shallow groundwater in Kampala, Uganda (Barrett et al., 1999b; ARGOSS, 2002). Isotopic nitrogen ratios have demonstrated promise in distinguishing between various sources of nitrogen inputs, thereby providing a useful tool for assessing sources of nitrate pollution (Rivers et al., 1996; Barrett et al., 1999a). Ammonia may be indicative of very recent sewage contamination of shallow groundwater, but is likely to be rapidly oxidized to nitrate under typical conditions in shallow, unconfined aquifers.
A promising marker of sewage is 1-aminopropanone, which is present in human urine and which is not produced significantly by other natural processes. Caffeine may be a non-adsorbed, conservative indicator of sewage inputs, but it not be readily detectable in groundwater (Stroud, 2001). Other potential chemical indicators of sewage contamination in groundwater include trace metals, faecal sterols (e.g. coprostanol), sodium dodecyl sulphate and sodium tripolyphosphate (Ashbolt et al., 2001; Barrett et al., 1999a)
10.5 CHECKLIST
NOTE The following checklist outlines information needed for characterizing sanitation practices in the drinking-water catchment area. It supports hazard analysis in the context of developing a Water Safety Plan (Chapter 16). It is neither complete nor designed as a template for direct use but needs to be specially adapted for local conditions. The analysis of the potential of groundwater pollution from human activity requires combining the checklist below with information about socioeconomic conditions (Chapter 7), aquifer pollution vulnerability (Chapter 8) and other specific polluting activities in the catchment area (Chapters 9 and 11-13).
Is on-site sanitation practised in the drinking-water catchment area?
Compile inventory on coverage with different types of on-site and/or off-site sanitation systems (including change over time)
Assess size and proportion of population using on-site sanitation Estimate quantity of excreta disposed and loadings of pathogens, nitrate
and other chemicals Evaluate adequacy of design, construction, condition and maintenance of
on-site systems in relation to aquifer vulnerability and physical conditions in the catchment area (e.g. water table, soil, hydrogeology): consider checklist for Chapter 8
Analyse population awareness regarding the need for protecting their groundwater sources through adequate design, construction, and maintenance of on-site systems

302 Protecting Groundwater for Health
For trench or pit latrines: assess siting in relation to groundwater levels, vulnerability to flooding, routines for excrement removal and inspection of liner integrity (and access of potential disease vectors such as insects and rodents for differentiation between them and drinking-water as cause of disease)
For septic tank systems: assess siting both of tanks and drainage fields in relation to groundwater levels, vulnerability to flooding, adequacy of routines of sludge removal, tank inspection
For contained or cartage systems: assess adequacy of collection, transportation and disposal practices in relation to groundwater sources
For composting latrines or central systems: assess efficacy of the composting process as well as siting in relation to groundwater levels, vulnerability and to flooding
…
Are centralized sewage treatment facilities located in the drinking-water catchment area?
Check structure of services (e.g. percentage of population and areas of the settlement connected to storm water sewers, foul sewers and/or combined systems), and estimate wastewater volume per capita
Evaluate adequacy of design, construction, condition and maintenance of treatment and sewage systems in relation to aquifer vulnerability and physical conditions in the in the drinking-water catchment area: consider checklist for Chapter 8
Assess siting of treatment facilities in relation to groundwater, integrity of containment, susceptibility of facilities to flooding
Assess practices for re-use of treated wastewater irrigation, aquifer recharge, fish ponds or other purposes
Assess practices of human excreta or sludge re-use and/or disposal, e.g. land application: consider checklist for Chapter 9
Evaluate the potential for contamination of sewage (and sludge arising from its treatment) with industrial chemicals, particularly persistent and toxic substances from an inventory of commercial activities in the catchment of the facility and licenses for connection to the system: consider checklist for Chapter 11
In some settings, conduct microbiological analyses of raw sewage and effluent to assess treatment performance for pathogen elimination
In some settings, particularly with reuse of effluent or sludge, conduct chemical analyses of concentrations of substances that potentially could contaminate groundwater in effluents and/or sludge
…

Human excreta and sanitation: Potential hazards and information needs 303
Are there sewers in the drinking-water catchment area that may leak into groundwater?
Note: In many settings, assessing the risk of groundwater contamination from leaky sewers may be effectively combined with assessing the risk of direct ingress of sewage leaking out of sewers into the central drinking-water distribution system.
Check depth of sewers in relation to groundwater table (for assessing likelihood of exfiltration and infiltration)
Compile registered information on design, material and age of the sewer system
Check whether regular sewer inspections are carried out (e.g. visual or close-circuit television)
Compile inventory of licensed industrial and commercial discharges into the sewer system
Compile inventory of medical care facilities connected to the system Compile information on land use and historic waste deposits that may
indicate unregistered connections to the sewerage system or potential infiltration through leaks
Compile information from laboratory analyses of groundwater samples taken in the vicinity of sewers (marker species, e.g. stable nitrogen isotopes, multi-component analyses in relation to known sewage constituents)
Check for indication of leaks from budgets of wastewater flow streams and groundwater flow models
…
Are hazardous events likely to increase groundwater pollution potential?
Evaluate whether and how storm water events would enhance transport of pollutants to the aquifer
Evaluate which spills and accidents are likely to cause groundwater pollution
…
Is drinking-water abstracted in proximity to sanitation facilities?
Assess distance between sanitation facilities and drinking-water abstraction
Check adequacy of wellhead protection measures, wellhead construction and maintenance as well as sanitary seals used (see Chapter 18) to prevent ingress of contaminants from excreta disposal practices
…

304 Protecting Groundwater for Health
Are groundwater quality data available to indicate pollution from sanitation?
Compile historic data from the area of interest, e.g. from local or regional surveys, research projects or previous monitoring programmes
Check need and options for implementation of new or expanded monitoring programmes likely to detect contamination from sanitation
…
What regulatory framework exists for sanitation?
Compile information on national, regional, local or catchment area specific legislation, regulations, recommendations or common codes of good practices on siting, construction, operation and maintenance of sanitation facilities
Check whether the regulatory framework adequately addresses environmental and specifically groundwater protection
Identify gaps and weaknesses known which may encourage specific pollution problems
…
Documentation and visualization of information on sanitation practices.
Compile summarizing report and consolidate information from checklist points above
Compile summary of types and amounts of wastewater and sludges generated, and of disease agents which are potentially hazardous if they leach into the aquifer
Map locations of settlements and inventory sanitation facilities (use GIS if possible)
…
10.6 REFERENCES Aigner, C.M, Armstrong, R.J. and Butler, D. (1998) Dry Weather Flow in Sewers, CIRIA Report
177, London. ARGOSS (2001) Guidelines for Assessing the Risk to Groundwater From On-site Sanitation. BGS
Commissioned Report CR/01/42, BGS, Wallingford. ARGOSS (2002) Assessing Risk to Groundwater From On-site Sanitation: Scientific review and
case studies. BGS Commissioned Report CR/02/079N, BGS, Wallingford. Ashbolt, N.J., Grabow, W. and Snozzi, M. (2001) Indicators of microbial water quality. In Water
Quality: Guidelines, standards and health – assessment of risk and risk management for water-related infectious disease, (eds. L. Fewtrell and J. Bartram), pp. 289-315, IWA, London.

Human excreta and sanitation: Potential hazards and information needs 305
Barrett, M.H., Hiscock, K.M., Pedley, S., Lerner, D.N. and Tellam, J.H. (1997) The use of marker species to establish the impact of the city of Nottingham (UK) on the quantity and quality of its underlying groundwater. Groundwater in the Urban Environ., 1, 85-90.
Barrett, M.H., Hiscock, K.M, Pedley, S., Lerner, D.N., Tellam, J.H. and French, M.J. (1999a) Marker species for identifying urban groundwater recharge sources: a review and case study in Nottingham, UK. Water Res., 33(14), 3083-3097.
Barrett, M.H., Nalubega, M. and Pedley, S. (1999b) On-site sanitation systems and urban aquifer systems in Uganda. Waterlines, 17(4), 10-13.
Bartram, J. and Rees, G. (2000) Monitoring Bathing Waters: A practical guide to the design and implementation of assessments and monitoring programmes. E&F Spon, London.
Battersby, S. and Pond, K. (1997) Rat Infestations and Underground Drainage - Report of a Survey of Local Authorities. Robens Institute for Public and Environmental Health, Guildford.
Bergmire-Sweat, D., Wilson, K., Marengo, L., Lee, Y.M., MacKenzie, W.R., Morgan, J. Von Alt, K., Bennett, T., Tsang, V.C.W. and Furness, B. (1999) Cryptosporidiosis in Brush Creek: describing the epidemiology and causes of a large outbreak in Texas, 1998. In Proc. International Conference on Emerging Infectious Diseases, Milwaukee, WI, AWWA, Denver, Colorado.
Bishop, P.K., Misstear, B.D., White, M. and Harding, N.J. (1998) Impacts of sewers on groundwater quality. Water & Environ. Man., 12(3), 216-223.
Briscoe, J. (1996) Financing water and sanitation services: the old and new challenges. Water Supply, 14(3/4), 1-17.
BGS (1995) Impact of Urbanisation on Groundwater in Santa Cruz, Bolivia: Final report. International Division, British Geological Survey, Nottingham.
BGS (1997) The Study of Pollution Risk to Deep Groundwaters from Urban Wastewaters: Project summary report. International Division, British Geological Survey, Nottingham.
Burston, M.W., Nazari, M.M., Bishop, P.K. and Lerner, D.N. (1993) Pollution of groundwater in the Coventry region (UK) by chlorinated hydrocarbon solvents. J. Hydrology, 149, 137-161.
Cairncross, S. and Feachem, R. (1993) Environmental Health Engineering in the Tropics: An introductory text, 2nd edn, John Wiley & Sons, Chichester.
Caldwell, E.L. and Parr, L.W. (1937) Groundwater pollution and the bored hole latrine. J. Infectious Diseases, 61, 148-183.
Cantor, L.W. (1997) Nitrates in Groundwater. Lewis Publishers/CRC Press, New York. CDC (1999) Outbreak of Escherichia coli O157:H7 and Camplyobacter among attendees of the
Washington County Fair – New York 1999. Morbidity and Mortality Weekly Report, 48(36), 803-804.
Chidavaenzi, M., Bradley, M., Jere, M. and Nhandara, C. (2000) Pit latrine effluent infiltration into groundwater: the Epworth case study. In Water, Sanitation and Health, (eds. I. Chorus, U. Ringelband, G. Schalg and O. Schmoll), pp. 171-178, IWA, London.
Craun, G.F. (1984) Health aspects of groundwater pollution. In Groundwater Pollution, (eds. G. Bitton and C. Gerba), pp. 135-179, John Wiley & Sons, New York.
Craun, G,F. (1985) A summary of waterborne illness transmitted through contaminated groundwater. J. Environ. Health, 48, 122-127.
D’Antonio, RG., Winn, RE., Taylor, J.P., Gustafson, T.L., Current, W.L., Rhodes, M.M. Gary, W. and Zajac, R.A.. (1985) A waterborne outbreak of Cryptosporidiosis in normal hosts. Annals of Int. Med., 103, 886-888.
Day, L.D. (2001) Phosphorous Impacts from Onsite Septic Systems to Surface Waters in the Cannonsville Reservoir Basin, NY. Delaware County Soil and Water Conservation District, Walton, New York.
Dinges, R. (1982) Natural Systems for Water Pollution Control. Van Nostrand Reinhold, New York.
Doughton, C.G., and Thomas A.T. (1999) Pharmaceuticals and personal care products in the environment: agents of subtle change? EHP, 107(6), 907-938.

306 Protecting Groundwater for Health
Dyk, C. and Lohaus, J. (1998) Der Zustand der Kanalisation in der Bundesrepublik - Ergebnisse der ATV-Umfrage 1997. Korrespondenz Abwasser, 45, 865-874.
Eiswirth, M. and Hötzl, H. (1997) The impact of leaking sewers on urban groundwater. Groundwater in the Urban Environ., 1, 399-404.
Eiswirth, M., Hötzl, H., Lazar, C. and Merkler, G-P. (1995) Detection of contaminant transport from damaged sewerage systems and leaky landfills. In Groundwater Quality: Remediation and protection, pp. 337-346, IAHS 225.
Esrey, S. (1996) Water, waste and wellbeing: the results of a multicountry study. Am. J. Epidem., 143(6), 608-623.
Esrey, S.A., Potash, J.B., Roberts, L. and Shiff, C. (1991) Effects of improved water supply and sanitation on ascariasis, diarrhoea, dracunculiasis, hookworm infection, schistosomiasis, and trachoma. Bulletin of the WHO, 69(5), 609-621.
Fewtrell, L. and Bartram, J. (2001) Water Quality: Guidelines, standards and health. IWA Publishing, London.
Foster S.S.D and Hirata R. (1988) Groundwater Pollution Risk Assessment – A Methodology Using Available Data. CEPIS, Lima.
Foster, S.S.D. and Gomes, DC. (1989) Groundwater Quality Monitoring: An Appraisal of Practices and Costs. CEPIS, Lima.
Franceys, R., Pickford, J. and Reed, R. (1992) A Guide to the Development of On-Site Sanitation. WHO, Geneva.
Gelinas, Y., Randall, H., Robidoux, L. and Schmit, J-P. (1996) Well water survey in two districts of Conakry (Republic of Guinea) and comparison with the piped city water. Water Resour., 30(9), 2017-2026.
Hamm, A. (ed.) (1991) Studie über Wirkungen und Qualitätsziele von Nährstoffen in Fließgewässern. Academia Verlag, Sankt Augustin.
Härig, F. and Mull, R. (1992) Undichte Kanalisationssysteme - Einfluß auf das Grundwasser. GWF Wasser/Abwasser, 133(4), 196-200.
Hejkal, T.W., Keswick, B., LaBelle, R.L., Gerba, C.P., Sanchez, Y., Dressman, G., Hafkin, B. and Melnick, J.L. (1982) Viruses in a community water supply associated with an outbreak of gastroenteritis and infectious hepatitis. JAWWA, 74, 318-321.
Hoogenboezem, W., Ketelaars, H.A.M., Medema, G.J., Rijs, G. and Schijven, J. (2001) Cryptosporidium and Giardia: Occurrence in sewage, manure and surface water. RIWA/RIVM/RIZA-report, Amsterdam.
Horan, N.J. (1990) Biological Wastewater Treatment Systems. John Wiley & Sons, Chichester. Hutton, L.G., Lewis, W.J. and Skinner, A.C. (1976) A Report on Nitrate Contamination of
Groundwater in Some Populated Areas of Botswana. Report No. BGSD/8/76, Department of Geological Survey, Lobatse.
Klopp, R. (1999) Kommunales Abwasser und seine Behandlung. In Wasser und Gewässer, (ed. F.H. Frimmel), pp. 369-444, Spektrum Akademischer Verlag, Heidelberg.
Koppe, P. and Stozek, A. (1986) Kommunales Abwasser. Vulkan Verlag, Essen. Lawrence, A.R., Morris, B.L., Gooddy, D.C., Calow, R. and Baird, M.J. (1997) The Study of the
Pollution Risk to Deep Groundwater From Urban Wastewaters: Project summary report, BGS, Technical Report WC/97/15, Wallingford.
Lens, P., Zeeman, G. and Lettinga, G. (eds.) (2001) Decentralised Sanitation and Reuse. IWA Publishing.
Lerner, D.N. (1986) Leaking pipes recharge groundwater. Ground Water, 24(5), 654-662. Lerner, D.N. (1990) Groundwater recharge in urban areas. Atmospheric Environ., 24(1), 29-33. Lerner, D.N. (1996) Urban groundwater an asset for the sustainable city. European Water Control,
6, 43-51. Lerner, D.N. and Barrett, M.H. (1996) Urban groundwater issues in the United Kingdom.
Hydrogeology J., 4(1), 80-89.

Human excreta and sanitation: Potential hazards and information needs 307
Lerner, D.N., Dellow, D.J., Lloyd, J.W. and Mansell-Moullin, M. (1982) Groundwater studies for Lima, Peru. In Proc. symposium on Optimal Allocation of Water Resources, Exeter, July 1982, pp. 17-35, IAHS Publication 135.
Lewis, J.W., Stephen, S.D.F., Bohumil, S. and Drasar, B.S. (1982) The Risk of Groundwater Pollution by On-Site Sanitation in Developing Countries. International Reference Centre for Wastes Disposal (IRCWD), Duebendorf.
Mara, D.D. (1996) Low-Cost Urban Sanitation. John Wiley & Sons, Chichester. Mara, D.D., Alabaster, G.P., Pearson, H.W. and Mills, S.W. (1992) Waste Stabilisation Ponds: A
design manual for Eastern Africa. Lagoon Technology, Leeds. Metcalf and Eddy, Inc. (1991) Wastewater Engineering: Treatment, disposal, and reuse, 3rd edn,
(revised by G. Tchobanoglous and F.L. Burton), McGraw-Hill, New York. Misstear, B.D. and Bishop, P.K. (1997) Groundwater contaminations from sewers: experience from
Britain and Ireland. Groundwater in the Urban Environ., 1, 491-496. Misstear, B., White, M., Bishop, P. and Anderson, G. (1996) Reliability of Sewers in
Environmentally Vulnerable Areas. Construction Industry Research and Information Association (CIRIA) Project Report 44, London.
Morris, B.L., Lawrence, A.R., Stuart, M.E. (1994) The Impact of Urbanisation on Groundwater Quality: Project summary report, BGS Technical Report WC/94/56, Wallingford.
Oragui, J.I., Curtis, T.P., Silva, S.A. and Mara, D.D. (1987) The removal of excreted bacteria and viruses in waste stabilisation ponds in northeast Brazil. Water Res., 27(4), 727-728.
Pearson, H.W., Mara, D.D. and Bartone, C.R. (1987) Guidelines for the minimum evaluation of the performance of full-scale waste stabilisation pond systems. Water Res., 21(9), 1067-1075.
Pedley, S. and Howard, G. (1997) The public health implications of microbiological contamination of groundwater. Q. J. Eng. Geol., 30, 179-188.
Pickford J. (1995) Low-Cost Sanitation: A review of practical experience. IT Publications, London. Powell, K.L., Taylor, R.G., Cronin, A.A., Barrett, M.H., Pedley, S., Sellwood, J., Trowsdale, S.A.
and Lerner, D.N. (2003) Microbial contamination of two urban sandstone groundwater aquifers in the UK. Water Res., 37(2), 339-352.
Pyle, B.H., Sinton, L.W., Noonana, M.J. and McNabb, J.F. (1979) The movement of micro-organisms in groundwater. In Proc. New Zealand Institution of Engineers Technical Group on Water, Groundwater Symposium, Victoria University, Wellington.
Read, G.F. and Vickridge, I.A. (eds.) (1997) Sewers: Rehabilitation and new construction. Arnold, London, New York.
Reed, R.A. (1995) Sustainable Sewerage: A guide for community schemes. IT Publications, London.
Reynolds, J.H. and Barrett, M.H. (2003) A review of the effects of sewer leakage on groundwater quality. JCIWEM, 17(1), 34-39.
Rivers, C.N., Barrett, M.H., Hiscock, K.M , Dennis, P.F., Feast, N.A. and Lerner, D.N (1996) Use of isotopes to identify nitrogen contamination of the Sherwood sandstone aquifer beneath the City of Nottingham, United Kingdom. Hydrogeology J., 4(1), 90-102.
Scandura, J.E. and Sonsey, M.D. (1997) Viral and bacterial contamination of groundwater from on-site treatment systems. Water Sci. Technol., 35(11-12), 141-146.
Short, C.S. (1988) The Bramham incident 1980 - an outbreak of water borne disease. J. Instit. Water & Environ. Man., 2, 383-390.
Stroud Water Research Center (2001) New York City Watersheds Year One Progress Report. SWRC, Pennsylvania.
Subrahmanyan, K. and Bharaskan, T.R. (1980) Pollution of groundwater from borehole latrines. Indian Medical Gazette, 85(9), 418-423.
Swerdlow, D.L., Woodruff, B.A., Brady, R.C., Griffin, P.M., Tippen, S., Donnel Jr. H., Geldreich, E., Payne, B.J., Meyer Jr. A., Wells, J.G., Greene, K.D., Bright, M., Bean, N.H. and Blake, P.A. (1992) A waterborne outbreak in Missouri of Escherichia coli O157:H7 associated with bloody diarrhoea and death. Annals Int. Med., 117 (10), 812–819.

308 Protecting Groundwater for Health
Trauth, R. and Xanthopoulos, C. (1997) Non-point pollution of urban groundwater. Water Res., 31, 2711-2718.
US EPA (1996) Wastewater Treatment: Alternatives to Septic Systems. EPA/909-K-96-001, Region 9 Drinking Water Program, San Francisco.
US Public Health Service (1965) Manual of Septic Tank Practice. USPHS, Washington, DC. Van der Ryn, S. (1995) The Toilet Papers: Recycling waste and conserving water. Ecological
Design Press, Sausalito, CA. Van Ryneveld, M.B. and Fourie, A.B. (1997) A strategy for evaluating the environmental impact of
on-site sanitation systems. Water SA, 23(4), 279-291. WHO (1987) Wastewater Stablization Ponds: Principles of planning and practice. World Health
Organization-Eastern Mediterranean Regional Office, Alexandria. WHO and UNICEF (2004) Meeting the MDG Drinking Water and Sanitation Target: A mid-term
assessment of progress. World Health Organization, Geneva, and UNICEF, New York. WHO (2005) Guidelines for the Safe Use of Wastewater, Excreta and Greywater. Volume 4:
Excreta and Greywater Use in Agriculture, World Health Organization, Geneva. WRc (1994) Sewerage Rehabilitation Manual, 3rd ed. UK Water Research Centre/Water
Authorities Association, Swindon. Yang, Y., Lerner, D.N., Barrett, M.H. and Tellam, J.H. (1999) Quantification of groundwater
recharge in the City of Nottingham, UK. Environ. Geol., 38(3), 183-198.

© 2006 World Health Organization. Protecting Groundwater for Health: Managing the Quality of Drinking-water Sources. Edited by O. Schmoll, G. Howard, J. Chilton and I. Chorus. ISBN: 1843390795. Published by IWA Publishing, London, UK.
11 Industry, mining and military sites: Potential hazards and information needs
C. Teaf, B. Merkel, H.-M. Mulisch, M. Kuperberg and E. Wcislo
Many similarities exist between aspects of site characterization and facility evaluation that are applicable for industrial and mining activities as well as military facilities, as a result of the wide range of activities conducted there. This includes use of fuels, solvents and other chemicals, as well as large storage volumes for some raw materials and wastes. Many elements of planning and preventive measures can be developed based on knowledge of site attributes, processes that are conducted, waste management procedures and site closure activities. With the possible exception of high explosives and ammunition, a large number of potential organic and inorganic groundwater impacts for these types of facilities are coincident.
As illustrations of the principles and strategies for site characterization, this chapter provides case studies. Some of the elements of these case studies are immediately evident, while others emphasize the need for careful collection and interpretation of the data. While they focus on groundwater contamination by one type of human activity,

310 Protecting Groundwater for Health
they also highlight that settings are often influenced by a more complex mixture of multiple pollution sources to be identified in situation assessment.
NOTE Industrial, mining and military activities as well as the environment in which they take place vary greatly. Health hazards arising from industrial, mining and military activities and their potential to pollute groundwater therefore needs to be analysed specifically for the conditions in a given setting. The information in this chapter supports hazard analysis in the context of develop-ing a Water Safety Plan for a given water supply (Chapter 16). Options for controlling these risks are introduced in Chapter 23.
11.1 INDUSTRIAL ACTIVITIES Industrial activities in groundwater recharge zones have significant potential to affect large areas of local or regional groundwater as a result of normal operations (e.g. waste disposal, materials storage) as well as short term adverse events (e.g. spills, leaks). Activities defined as industrial may include a wide variety of large scale or small scale commercial, public, governmental or military facilities that are engaged in manufacturing, chemical processing, power generation or ancillary services (US EPA, 1999). In many instances, the aggregate effect of several small local industrial facilities, or even the effects from a single small facility, have severely affected groundwater quality, with impacts on drinking-water supplies.
Although it is an important consideration, apparent industrial facility size may not be the sole or even the principal determinant of risk to groundwater. The degree to which a facility poses risks to aquifers can be related to many factors, including:
• the specific industrial processes and chemicals in use; • the age and size of the facility; • corporate ‘housekeeping’ or environmental management practices; • local geological and hydrological characteristics.
In addition to contaminant release issues, industrial activities in drinking-water catchment areas may exert other non-chemical influences which change the vertical or horizontal flow regime of contaminants (e.g. changes in recharge inflow quantity or percolation rate), or which serve to reduce the overall capacity of the recharge area (e.g. groundwater withdrawal). Thus as discussed further in Chapter 23, the most effective preventive or management strategies for drinking-water catchments from an engineering and cost perspective are those which seek to eliminate, minimize or carefully control potential contaminant sources (Zektser et al., 1995; Berg et al., 1999).

Industry, mining and military sites: Potential hazards and information needs 311
11.1.1 Types of industrial facilities and potential impacts to groundwater
Many industrial facilities employ practices that historically have been associated with groundwater contamination, such as the production, treatment or handling of metals, petroleum, paints and coatings, rubber and plastics, electrical components, pharmaceuticals, pesticides, non-chlorinated and chlorinated solvents, paper, inks and dyes, fabrics, adhesives, fertilizers, wood preservatives, laundry/dry cleaning and explosives. In addition, complex facilities may have a significant component of vehicular traffic, power production, water withdrawal/treatment and grounds maintenance, all of which may be associated with problems related to non-process use of fuels and lubricants. As a result of the extreme industrial diversity in many regions of the world, it is important to identify the types and sizes, as well as numbers of facilities, that may be potential contributors to groundwater pollution. Table 11.1 illustrates categories of industrial plant processes and ancillary processes that may be potential groundwater pollution sources.
Table 11.1. Typical industrial plant processes and ancillary processes
Industrial plant processes Ancillary processes Transfer and storage of raw materials Production process Storage and management of waste products Storage, transfer and transportation of final product
Transfer, storage and use of fuels and lubricants Power production Water withdrawal and treatment Run-off management Grounds maintenance employing fertilizers and pesticides
Recognition of potential classes of groundwater contaminants for specific types of
industries serves as an aid in the development of appropriate plans for the monitoring of ongoing activities (US EPA, 1999), as well as guiding the investigation of impacts that may be associated with past site operations (see Chapter 23).
Table 11.2 presents a number of examples of chemicals commonly associated with important industrial processes that historically have caused groundwater contamination. Substances marked bold are both toxic to humans and frequently found in groundwater. Their behaviour and attenuation in groundwater is discussed in more detail in Chapter 4.
Some of the substances listed in Table 11.2 are raw materials or production intermediates for chemical manufacturing, while some are typical of waste streams from the indicated industrial process. Yet others, however, may not be released from the facility, but rather are formed as natural degradation phenomena once the release of a parent chemical has occurred (Canter and Knox, 1987). For example, dichloroethene (DCE) or vinyl chloride (VC) may in rare instances be released directly but, more commonly, they are detected in groundwater as breakdown products in anaerobic conditions related to the release of perchloroethylene/tetrachloroethene (PCE) or trichloroethene (TCE) in the presence of specific subsurface bacterial populations. Similar changes may be observed in the progressive, sequential reductive dehalogenation of polychlorinated biphenyls (PCBs), which can result in the formation of lower chlorinated homologues from the parent PCBs. Presence of the new analytes, e.g. in

312 Protecting Groundwater for Health
groundwater samples, may create uncertainty regarding the source of the contaminants and, hence, may complicate decisions concerning the appropriate response measures.
Table 11.2. Potential groundwater contaminants from common industrial operations (substances marked bold are both toxic to humans and frequently found in groundwater)
Industry type or industrial process
Representative potential groundwater contaminants
Adhesives acrylates, aluminium, chlorinated solvents, formaldehyde, isocyanates, mineral spirits, naphthalene, phenol, phthalates, toluene
Electrical components
acids, aluminium, arsenic, beryllium, cadmium, caustics, chlorinated solvents, cyanides, lead, mercury, nickel, selenium
Explosives ethyl acetate, HMX, methanol, nitrobenzenes, nitroglycerine, nitrotoluenes, pentaerythritol tetranitrate, RDX, tetrazene, tetryl, 1,3-DNB
Fabrics acetic acid, acetone, acrylates, ammonia, chlorinated solvents, copper, formaldehyde, naphthalene, nickel, phthalates
Fertilizers ammonia, arsenic, chlorides, lead, phosphates, potassium, nitrate, sulphur
Foods and beverages
chlorine, chlorine dioxide, nitrate/nitrite, pesticides, biogenic amines, methane, dioxins, general organic wastes
Inks and dyes acrylates, ammonia, anthraquinones, arsenic, benzidine, cadmium, chlorinated solvents, chromium, ethyl acetate, hexane, nickel, oxalic acid, phenol, phthalates, toluene
Laundry and dry-cleaning
calcium hypochlorite, DCE, PCE, Stoddard solvent, TCE, VC
Metals production and fabrication
acids, arsenic, beryllium, cadmium, chlorinated solvents, chromium, lead, mercury, mineral oils, napthtalene, nickel, sulphur
Solvents (chlorinated)
carbon tetrachloride/tetrachloromethane (CTC), chlorofluoroethanes, DCE, methylene chloride, PCE, TCE, VC, 1,1,1-trichloethane
Solvents (non chlorinated)
acetates, alcohols, benzene, ethylbenzene, ketones, napthtalene, toluene, xylene
Paints and coatings
acetates, acrylates, alcohols, aluminium, cadmium, chlorinated solvents, chromium, cyanides, glycol ethers, ketones, lead, mercury, methylene chloride, mineral spirits, nickel, phthalates, styrene, terpenes, toluene, 1,4-dioxane
Paper manufacturing
acrylates, chlorinated solvents, dioxins, mercury, phenols, styrene, sulphur
Pesticides arsenic, carbamates, chlorinated insecticides, cyanides, ethylbenzene, lead, naphthalene, organophosphates, phenols, phthalates, toluene, xylene
Petroleum refining alkanes, benzene, ethylbenzene, nickel, polynuclear aromatic hydrocarbon (PAHs), napthtalene, sulphur, toluene, xylene
Pharmaceuticals alcohols, benzoates, bismuth, dyes, glycols, mercury, mineral spirits, sulphur
Rubber and plastics acrylonitrile, antimony, benzene, butadiene, cadmium, chloroform, chromium, DCE, lead, phenols, phthalates, styrene, VC
Wood preserving
ammonia, arsenic, chromium, copper, creosote, dioxins, pentachlorophenol (PCP), phenol, tri-n-butyltin oxide

Industry, mining and military sites: Potential hazards and information needs 313
In the example of both the chlorinated solvents and PCBs, the result may be that Chemical A is disappearing, when in parallel the concentration of the corresponding Chemical B is increasing. This seeming benefit of the reducing concentration of Chemical A can mask marked increases in the significance of potential risk when the degradation product (Chemical B) is more toxicologically potent than the parent molecule (e.g. VC >> DCE).
11.1.2 Types of industrial practices potentially impacting on groundwater quality
Virtually any aspect of industrial operations has the potential to release chemicals, though some processes are more likely than others to be of consequence when consider-ing the vulnerability of groundwater. Organic and inorganic contaminants may reach groundwater most readily as a result of discharge to the ground surface and subsequent leaching through and from soils, or through subsurface releases from tanks, ponds, underground pipelines, injection wells, and similar structures (Canter and Knox, 1987; US EPA, 1999). Problems and characteristics of contamination that are related to individual chemicals may be compounded by events such as fires or explosions which often cause major changes in the chemical structures, chemical properties and distribution of industrial releases.
The withdrawal of groundwater, though not a waste-related or discharge-related matter, may dramatically affect the subsurface movement and distribution of chemicals, especially if the withdrawal is of large volume such as for single pass cooling water. In many parts of the world, permits are required for such withdrawal. Therefore, permits may represent one source of valuable information during reviews of potential industrial impacts in a drinking-water catchment area. Similarly, discharge permits may provide a valuable source of data on potential contamination origins.
Releases of small or large magnitude to surface soils may occur from raw material piles, aboveground tanks, drums and other containers, as well as from process leaks that may occur within the plant, and which may subsequently reach the ground from improper routing of wash waters or process overflow volumes. Industrial material handling operations, including incoming and outgoing shipments, as well as in-house transfers of materials, are often associated with episodic releases of chemicals over time (Canter and Knox, 1987). While each individual event is not necessarily significant, the cumulative effects can be severe.
Factors such as ground cover type (e.g. paved vs. unpaved), interceptor drains, local precipitation rate, soil types and aquifer vulnerability (see Chapter 8) as well as water solubility, vapour pressure, soil microbial activity and the mobility of the chemicals of interest (see Chapter 4) will influence how rapidly and in what form they move toward groundwater through the soil column once released at the surface. Non-production related activities on a site, such as grounds maintenance, may represent potential groundwater impacts from use of chemicals such as fertilizers, pesticides and herbicides (US EPA, 1999). Table 11.3 illustrates a number of acute and chronic release possibilities that have the potential to contaminate groundwater.

314 Protecting Groundwater for Health
Table 11.3. Potential release points and mechanisms
Chronic releases Acute releases Direct discharge: ground surface or surface water Subsurface discharge: injection wells Leaks: tanks, pipes or impoundments Transfer loss: pipelines, transfer points, storage facilities Non-process activities: herbicides, fertilizers, pesticides
Explosion Fire Catastrophic failure: storage site or transfer system
Once released, low water solubility and strong binding behaviour cause some
materials to move slowly in the subsurface environment, in comparison to substances that are highly water soluble and that do not attach to soil particles (see Chapter 4). In addition, high vapour pressure indicates that a chemical will favour volatilization, and spilled materials may be lost to air from water or soils, as opposed to leaching to groundwater. Local and regional meteorology will exert effects on whether or to what extent these or other airborne materials may be subject to later atmospheric ‘washout’ by precipitation, and subsequent re-deposition on the ground in complexed form, which then is available for future soil leaching processes that may contaminate groundwater.
Subsurface releases often represent the most direct pathway by which industrial contaminants may reach groundwater. These occur most commonly as a result of storage or disposal of liquids to pits, ponds, basins and underground tanks (Canter and Knox, 1987), as highlighted in Box 11.1. Such structures often are designed to act principally as evaporation or holding structures; however, as a practical matter, those that are not lined with clay or synthetic materials frequently exhibit a percolation component through the floor and walls of the structure, or through cracks in theoretically impervious tank materials (e.g. concrete, metal). The type, age, burial depth of the structure, soil type, proximity to (or contact with) the groundwater interface, the care with which it was constructed or installed, and the regularity of maintenance procedures, all are important influences on the likelihood that such holding structures may serve as sources to long term groundwater contamination potentially to be addressed in situation assessment.
Subsurface releases also may be caused by leakage from underground pipes at connections and valve locations, or as a result of rupture related to pressurization, corrosion and mechanical damage. Such releases frequently go unnoticed and over time may contribute to significant subsurface contamination. The oil refinery case study in Box 11.1 is an example of this type of situation. The frequency, duration and volume of such events, as well as the mobility and toxicity characteristics of the materials that are released will determine the potential risks within drinking-water catchment areas. Some important factors to consider with regard to storage structures are shown in Table 11.4.

Industry, mining and military sites: Potential hazards and information needs 315
Box 11.1. Groundwater pollution with aromatic hydrocarbons and metals caused by a petroleum refinery site in Czechowice, Poland
The process of refining hydrocarbons carries with it potential problems of raw materials transport, handling/storage in large volumes, and chemical production processes. These activities represent points at which chemical substances may be lost to the environment as a result of leaks, spills or other short and long term events. Many thousands of such facilities globally have been the source of local or regional groundwater contamination, particularly in the case of the more water soluble, aromatic hydrocarbon components (e.g. benzene, toluene) and of some historically common additives (e.g. lead). This phenomenon is well-illustrated by the case of a 100-year old refinery located in an urban industrialized area of Poland. Capacity has more than doubled from early production rates of 40 000 tons of paraffinic crude oil a year producing gasoline, engine oil and fuel oil, as well as specialty oil products. Disposal from by-products of the historical sulphuric acid-based oil refining resulted in the deposition of more than 140 000 tons of acidic petroleum sludges in a series of open, unlined waste lagoons. The refinery site is underlain predominantly by silty sands, interspersed with several thin discontinuous subsurface clay layers that do little to retard vertical movement of contaminants. Groundwater was located at about 10 m below the ground level in most areas on-site. There is a nearby water supply well, used for commercial and industrial purposes, where increasing levels of petroleum substances have been observed in recent years. Nearby residences are connected to a public water supply system. A comprehensive refinery site investigation was conducted to assess the extent, degree and potential migration of site contamination, focusing on several principal indicator chemicals, including BTEX, PAHs and heavy metals. These were selected on the basis of their concentrations, mobilities and toxicological properties, as well as their known linkage to historical facility operations. These typically are ‘sentinel compounds’ for the evaluation of potential risks at facilities such as the Polish site. Soil and groundwater sampling data indicated broadly variable contaminant levels at the refinery site, with a definite ‘hot spot’ within the large lagoon area. Groundwater was found to be heavily impacted mainly by benzene and toluene, though these substances often were at low levels in the lagoon sludges, due to their volatility and the long residence time of sludges in the lagoon. It was concluded from the observed distribution of contamination that the lagoons represent at least localized long-term sources to groundwater for hydrocarbons and some metals, largely limited by the viscosity and low water solubility of their contents. However, more recent plumes of volatile chemicals (e.g. benzene, toluene) are likely a result of ongoing refinery operations, probably related to pipeline leaks, spills associated with product transfer and product losses in other areas of the site. It was recommended that remedial action should be undertaken at the refinery site, strategies be implemented for the prevention of releases and that efforts be initiated to contain the expanding groundwater plume (see Chapter 23, Box 23.1).

316 Protecting Groundwater for Health
Table 11.4. Information needs for storage vessels
Type Tank, lagoon, pit, pipeline Age Years in service, planned life span Contents pH, water content, corrosivity Construction material Native soils, concrete, metal, clay, plastic Containment Type, volume and security of secondary containment structures Location Above/below ground surface
Proximity to groundwater Location and nature of pipes and valves
As an example, some metal manufacturing and finishing processes generate large
volumes of liquid, semisolid and solid wastes that historically have required at least some element of on-site storage and/or disposal. These same facilities often have extensive above ground and underground piping systems that may be sources of groundwater contaminants. The historical use of pits, ponds, lagoons and tanks to store oil or hydrocarbon wastes, as well as solvent-contaminated washwaters and acidic (low pH) or caustic (high pH) sludges, has resulted in many instances of broad scale aquifer contamination. Such contamination includes water-soluble substances of health significance (e.g. arsenic, lead, mercury, chlorinated solvents, fuel components, acidic solutions), as well as those with minimal solubility (e.g. PAHs and PCBs). The large facility size and long operational time frames for many smelters and metal production plants pose specific concerns in terms of clearly identifying and characterizing releases, as well as in terms of implementing effective containment or remedial measures to address the problems.
The use of injection wells for the purpose of liquid industrial waste disposal has the capacity to introduce large volumes of chemical constituents, often of poorly understood composition, into deep groundwater. Well type, construction and integrity, as well as injection depth, chemical composition and duration/volume of injection events all will influence the likelihood that an injection well serves as a source of groundwater contamination.
Impacted streams and rivers are often overlooked as potential sources of groundwater contamination, though they may serve as significant contributors to local groundwater quality if the surface water body recharges local groundwater. Thus the detailed understanding of local and regional surface water quality and/or quantity may play a role in assessing the impact of industrial facilities in areas where upstream discharges to or withdrawal of river volumes affects the downstream recharge characteristics.
Aside from the industrial releases themselves, environmental transport of contaminants from soil to groundwater or within groundwater may be enhanced greatly by the presence of conditions which act to mobilize otherwise recalcitrant chemicals. For example, many organic substances may be bound well to soil if they are present alone, but may become quite mobile if they are present concurrently with another chemical that acts as a cosolvent (e.g. fuels mobilize organic chemical residues in soil). Similarly, mobility of a number of metals in soils (e.g. lead) is dramatically enhanced by low pH conditions in the soil or in local precipitation (Mather et al., 1998). Thus site-specific geological, physicochemical, and land cover or land use considerations often are the

Industry, mining and military sites: Potential hazards and information needs 317
dominant features in determining the likelihood that a facility may contribute to groundwater contamination.
Box 11.2. Groundwater pollution with chlorinated solvents caused by leather
tanning industry in the United Kingdom
As with refinery sites, large and small chlorinated solvent sites around the world have been associated with groundwater contamination. This is as a result of their historical widespread use for degreasing, metals cleaning, textile treatments and other applications. Although these solvents exhibit comparatively low water solubility, their environmental behaviour and their ability to act as dense non-aqueous phase liquids (DNAPLs) (see Chapter 4) often cause disproportionate problems in developing engineered remediation solutions. In addition, many countries have established quite restrictive water quality protection criteria for chlorinated solvents (e.g. TCE, PCE) or potential environmental degradation products (e.g. VC). A case which has elements reminiscent of many others involved the Cambridge Water Company and several local tanneries in the United Kingdom during the 1950s through to the 1990s.
TCE and PCE are among the most common chlorinated solvents encountered, and were used in the leather tanning process. On-site handling practices, as well as spills and other releases, caused soil contamination at this industrial site. The complex geology in the area (multilayered Chalk composition) complicated several efforts to model the contaminant flow in the vertical and horizontal direction. However, it was concluded that the releases likely occurred in the early years of chlorinated solvent usage at the facility (i.e. the late 1950s). Discovery of contamination of a local water supply well in the early 1980s triggered an extensive investigation by the local Water Authority and the British Geological Survey (BGS), which ultimately demonstrated that significant contamination was broadly distributed in the area at concentrations exceeding 1000 micrograms per litre. Despite conversion of the local water supply well to a pump-and-treat recovery well (which recovered over 3600 litres of PCE in 5 years), a substantial quantity was unrecoverable, as is often the case with the chlorinated solvents.
Although there is a tendency to focus on large industries as most likely to cause large groundwater impacts, the judicial actions surrounding this case emphasized the potential for contributions to local groundwater pollution by many small industries in an area, as well as the valuable benefits of planning and proper chemical handling, as opposed to attempting remedial actions decades after the release has occurred. Of course this observation can be made for other industries as well including, for example, textile operations, tanneries, motor vehicle fuel stations, electroplating shops, etc.
Implementation of rigorous management practices at individual facilities may provide
an excellent organizational structure for maintaining good control of raw materials and wastes that have the potential to contaminate groundwater. Recycling, waste minimization and good materials balance accounting have the potential to reduce energy
318 Protecting Groundwater for Health
requirements, transportation requirements, chemical demands, water demand and waste disposal needs (see Chapter 23). Situation assessment therefore needs to identify the extent to which such practices are operating.
Furthermore while in many regions of the world practices in production, transport and containment of hazardous chemicals has substantially improved during the past two decades, historical contamination may be substantial. The case study in Box 11.2 shows how discovery of contamination in drinking-water may lead to detection of large-scale contamination of historic origin, particularly also from a high number of small-scale enterprises.
Effective documentation of the hazards that may be posed to groundwater by any particular facility will be a function of the ability to show that good management practices and responsible chemical stewardship are in place and working (Ekmekci and Gunay, 1997). Further evaluation of the existing impacts to groundwater (or lack thereof) can be assisted by access to historical groundwater data for the facility, adjacent facilities or the region in which the facility is located. Based upon that information, it should be possible to expand existing programmes of monitoring or develop new programmes to more effectively detect industrial contamination.
11.2 MINING ACTIVITIES A number of activities associated with mining operations have a significant potential to pollute groundwater resources. With the exception of some deep mining areas, mines tend to be at higher elevation in the catchment areas where rocks are closer to the surface. Thus impacts from these mining activities may affect downgradient groundwater resources as well.
The broad term mining includes both open pit (surface mines) and underground mines, as well as oil and gas mining (via wells), solution mining, in situ leaching (ISL), heat (geothermal) mining and even gas hydrate mining or ocean dredging. Open pit mining includes not only ore and lignite mining, but also excavation of gravel, sand and clay for the construction industry. While the latter may be less intrusive, they can result in severe environmental effects if not properly managed. Historically, mining was chiefly conducted as underground mining following veins of e.g. ore and coal, whereas more recently the availability of large machinery has promoted a tendency towards open pit mining. Today, criteria determining which option is preferred include economic considerations such as costs for labor (which is substantially more intensive in deep mining) and investment into machinery (which is high for open pit mining), as well as aspects of occupational safety (deep mining tends to be more hazardous) and the acceptability of sacrificing large areas for devastation as open mine pits. ISL is a high-tech option chiefly employed for mining copper and uranium.
Impacts on groundwater quality from mining operations include but are not restricted to:
• mobilization of metals and metalloids due to low pH values in acid mine drainage;
• leaching of substances from rock formations ISL;

Industry, mining and military sites: Potential hazards and information needs 319
• leaching from inadequately designed or operated mining waste dumps or tailing piles (i.e. overburden soil and rock);
• activities directly linked to mining operations, often in their direct vicinity, such as inappropriate usage, handling, storage or spillage of chemicals employed in ore treatment, underground or surface traffic, heavy mining machinery, workshop or refining work operations as well as wood strut preservation in underground mines.
Figure 11.1 provides a general overview of activities associated with the operation of underground mines.
Mining activities may directly impact on groundwater quantity. Both open pit mines and underground mines are often associated with groundwater withdrawal which creates a cone of depression during the operating lifetime of the mine. Thus the unsaturated zone (zone of aeration) is significantly enlarged, leaving rocks and sediments exposed to oxygen for a long time, which may cause the oxidation of sulphides and other minerals. This phenomenon also may occur with ‘heaps’ or tailing piles from milling sites where minerals can be oxidized.
Figure 11.1. Sources of groundwater contamination linked to mining activities

320 Protecting Groundwater for Health
Additional and different problems occur when mines are closed down, as discussed in more detail in Sections 11.2.2 and 11.2.3. Open pit mines may be left open or refilled with waste rock, tailings, industrial by-products and/or they become landfills for municipal waste. Cessation of groundwater withdrawal that is associated with normal mine operations typically leads to a rise in groundwater levels, which may form a lake or may infiltrate the backfill materials and flood former mine shafts. As underground mining changes rock permeability significantly, it is unlikely that natural groundwater conditions will recover to previous levels after mine closure. Mining at the West Rand Goldfields in South Africa, for example, created links through underground penetration of original dykes which originally had separated different groundwater reservoirs in dolomitic areas.
Rewatering after closure of the mines may be a very complicated process with great uncertainty as to the eventual outcome to groundwater quality. Re-establishment of local natural flow conditions can allow polluted waters to contaminate hitherto pollution-free areas. To protect the aquifer against negative impacts after mine closure, a sustainable groundwater management system in the vicinity of abandoned mines is required (see Chapter 23.2). Thus situation assessment in settings with mine closure would address how well such processes are controlled, which often has not been the case in the past.
The scale of mining activities is an important factor to the potential for groundwater pollution since small-scale mining activities are more difficult to monitor and control. On the other hand, large-scale mining operations typically have a greater impact on local groundwater resources. Many countries have environmental legislation to address impacts from mining operations or to guide closure and reclamation of individual newer mines; however old mines often are not considered. There is a lack of definition for controls on mine water quality and mine water in excess of maximum contamination levels being allowed to spill into groundwater or surface water in many instances.
11.2.1 Operation of mines: Chemical processes and potential impacts to groundwater
Of all the processes which occur during mining activities, sulphide oxidation is one of the most severe pollution problems where sulphide minerals (e.g. pyrite) occur geologically. It can lead to acid mine drainage that is often enriched with metals such as iron, aluminum, arsenic, cadmium, lead, mercury and uranium. In this respect, the Boshan case study given in Box 11.3 is typical for groundwater contamination through mining, though contaminants from industrial activity more or less strongly linked to mining were found as well.
Sulphide oxidation happens when sulphidic minerals (e.g. pyrite) are exposed to air and water. This process is complex because it involves chemical, microbiological, and electrochemical reactions. The rate of oxidation is controlled by a number of parameters including water pH, partial pressure of oxygen, mineral surfaces and the presence or absence of bacteria.
Geologically, sulphidic minerals (e.g. pyrite) are formed in a reducing environment when sulphate and iron or other inorganics are supplied by water in the presence of decomposable organic matter. Depending upon the boundary conditions and time, the

Industry, mining and military sites: Potential hazards and information needs 321
formation of sulphide can be quite variable resulting in different crystal structures of sulphides and pyrite (e.g. framboid, polyframboid, conglomerates and massive octahedron). A limited supply of organic matter in marine sediments is assumed to result in low sulphate reducing rates, and thus formation, of framboidal pyrite (Evangelou, 1995).
Framboidal pyrite is believed to be the major contributor to acid mine drainage due to its large surface area and resulting rapid rates of reactivity. Pyrite in waste piles and tailings is of finer grain and therefore much more reactive than forms that may be present in the original bedrock (Langmuir, 1997). In the absence of buffering material, such drainage is extremely acidic with pH values approaching zero and even negative pH values (Nordstrom et al., 2000).
Box 11.3. Mining and industrial contamination of groundwater in Boshan,
Shandong Province, China
Boshan is located in the centre of Shandong Province in China, and is an important mining, industrial and manufacturing centre known particularly for the production of ceramics. Although Boshan only has a population of a few hundred thousand people, the surrounding District is densely populated and industrialized, close to the industrial centre of Zibo City, which has a population in excess of 3.5 million. Like many towns and cities in densely populated regions, it is difficult to distinguish a clear boundary between the urban centre of Boshan and the surrounding semi-rural or rural areas, which in effect form an extensive peri-urban region.
The City of Boshan and the Boshan District are totally dependent on groundwater for water supplies, because surface streams have become seriously contaminated through the disposal of mine water, sewage and industrial wastes. Currently more than 80 000 m3 per day is pumped from the Tianjinwan well-field located to the east of Boshan. Another well field, the Liangzhuang well field, was abandoned in 1986 due to contamination.
There is widespread contamination of the limestone aquifers near Boshan, which has greatly reduced the amount of groundwater that is available for potable supplies. Possibly the single largest source of contamination in the District is acid mine drainage containing high concentrations of dissolved iron and sulphate from nearby coal mines. Currently about 40 000 m3 per day of acid mine water is drained from mines, and this has caused progressive increases in the sulphate concentration in local groundwater, with concentrations commonly exceeding 500 mg/l.
In addition to pollution from mining, a major pathway for groundwater pollution in Boshan is seepage from recharge basins and surface streams, particularly from the Xiaofu Stream that passes through urban areas of Boshan. These are heavily contaminated with industrial wastewater containing a variety of chemicals including sulphate, petroleum hydrocarbons, phenols, cyanide, arsenic and other metals.

322 Protecting Groundwater for Health
Sulphate and iron are the most common inorganic contaminants in acid mine water. In addition, chloride, sodium and potassium are increased significantly if halite is present. Several metals and metalloids of public health importance that are associated with increased concentrations due to mining activities include arsenic, manganese, lead, cadmium, nickel, copper, zinc, aluminum, mercury and uranium. For selected elements, Table 11.5 shows ranges of typical background concentrations in relation to increased concentration ranges induced through mining and thus helps in assessing whether concentrations found in groundwater potentially affected by mining might indeed be elevated through this activity.
Uranium, radium, radon and thorium are radioactive elements which are encountered not only in uranium mining, but also in metal ore, lignite and coal mining, where they commonly occur in increased concentrations. In the case of ISL mining, chemicals (e.g. acids or alkaline brines) are pumped into injection wells in large quantities and may remain to some extent in the underground. Oil and gas exploration may be associated with the presence of groundwater and brines with elevated concentrations of potentially hazardous elements (e.g. boron, lithium, selenium, arsenic, bromine, barium and thallium). Mining of evaporites (e.g. halite) is of special concern owing to the extremely high solubility of the salt. Waste rock piles from halite mining commonly contain large amounts of easily dissolved salt. Therefore, groundwater and surface water bodies are commonly impacted by salty waste water during active mine operations.
Table 11.5. Element concentrations from oilfield groundwater and from metal mining in comparison to WHO guidelines values and ranges of background concentrations observed in groundwater under natural conditions (adapted from Merkel and Sperling, 1998; WHO, 2004)
Element Oilfield groundwater (mg/l)
Metal mining
Background (extreme values)
WHO guideline value (µg/l)
Arsenic 0.05-0.8 0.1-50 0.0001-0.01 (>1.0) 0.01 (P) Barium 20-180 1-90 0.005-0.1 0.7 Boron 120-400 No data 0.005-0.070 0.5 (P) Cadmium 0.001-0.10 0.001-0.4 <0.001-0.005 (0.07) 0.003 Lead 0.001-0.03 0.01-1.5 <0.001-0.01 0.01 Manganese 2-30 0.1-220 0.02-8.0 0.4 Mercury No data 0.01-0.5 0.00001-0.0005 0.001 Nickel 0.001-0.5 0.001-100 0.001-0.17 0.02 (P) Selenium 0.5-4.0 1-30 0.0001-0.14 0.01 Uranium <0.001 0.1-200 <0.001-0.02 (>0.1) 0.015 (P)
P = provisional Different chemicals, some of health relevance, are used for ore treatment which is
commonly conducted close to the mine to reduce transport costs. Cyanide is used, for example, during the extraction of gold. Another problem is the fixation of unwanted by-products, for example in the case of uranium ore treatment where radium is fixed by adding barium chloride to the tailing water in order to precipitate the solid solution mineral Ba(Ra)-sulphate in the tailings. These precipitates may represent long term concerns as potential sources of groundwater contaminants.

Industry, mining and military sites: Potential hazards and information needs 323
During mining activities, precipitation of mineral phases termed secondary minerals may occur. In addition to clay minerals being a common weathering by-product, some minerals such as KAl3(SO4)2(OH)6 (Alunite) and KFe3(SO4)2(OH)6 (Jarosite), can form solid solution complexes with Fe3+ and Al3+ by evaporation in deep mines and at depth in saturated tailings or in heaps under acid sulphate conditions. Their solubility is relatively low under pH conditions greater than 3. Also, gypsum can be formed in the presence of sulphate and calcium and melanterite (FeSO4⋅7H2O) in the presence of iron. Most secondary minerals have low solubility which is important in the case of mine flooding because it limits the rate of their re-solution. Thus secondary minerals may act as temporary or permanent sinks for groundwater contaminants making their investigation important.
Large quantities of hydrocarbonsare used in the mining industry for trucks and heavy mining machinery, and chlorinated hydrocarbons may be used for equipment cleaning purposes. PCP, γ-HCH and creosote are commonly used for the preservation of wood which may be of special concern in deep mines using wood struts. When a mine is closed down quantities of hydrocarbons and chlorinated hydrocarbons may be left in the subsurface or in surface contaminant areas and may act as long-term sources for potential contamination. Wood treatment agents like PCP will be leached slowly from remaining wood struts and may contaminate the groundwater in the mine vicinity over a long period. During open pit mining (e.g. lignite mining) spills of fuel and oil may occur regularly. Also, pipelines from oil and gas fields often run over hundreds or thousands of kilometres and leaks and spills can occur (see Chapter 13). Further, explosives from mining activities were suspected to be the chief source of nitrate contamination at the Orapa diamond mine in Botswana (Box 11.4).
Box 11.4. Diamond mining as potential nitrate source in groundwater at the
Orapa diamond mine in Botswana
Mining of the kimberlite pipe at Orapa began in 1971. This is the second largest kimberlite pipe in the world in terms of area, covering 117 ha. Mining operation is in a conventional open pit with the pit bottom now at approximately 110 m below surface.
Although no contamination of the groundwater is to be expected from diamond mining, a study by the Debswana Diamond Company (Pty) Ltd revealed elevated levels of nitrate (generally >50 mg/l), in particular for wellfield 2 and 5 (Mokokwe, 1999). In addition, the available data revealed a strong spatial and temporal variability of the observed nitrate levels. The latter was surprising since the main aquifer, the Ntane sandstone, is largely confined and features water of an old age. Thus one would expect nitrate levels to be rather uniform and of natural origin.
A potential anthropogenic source of nitrate, even if only at a limited scale, is the 240 t of ammonium nitrate-based explosives that are used in the pit monthly. Although most of the explosives will be converted to nitrogen and other gases, and be vaporized during the explosion, pollution of the groundwater in the overlying Kalahari Group sediments may occur, in particular through leachates from the slimes and slurry dams (Tredoux, 2000). Because high nitrate levels

324 Protecting Groundwater for Health
constitute a health risk to infants, the Federal Institute for Geosciences and Natural Resources, Germany and the Technical University of Berlin and the Debswana Diamond Company (Pty) Ltd carried out a survey in Orapa in January 2000 of 60 boreholes and wells. The results of this survey again highlighted that nitrate concentrations in Orapa almost always exceeded the WHO guideline level (Figure 11.2). The highest concentration of 199 mg/l was found to the east of the old mining dumps. Concentrations decreased in the direction of the surrounding production boreholes which indicates that this very high nitrate concentration is caused by leachate from the old refuse dumps.
In contrast, groundwater samples from the observation boreholes around the new township landfill site displayed neither significant ion concentration nor changes of ion ratios. Hence, this waste disposal site does not seem to be a source of groundwater pollution yet.
Nitrate was also high at a borehole north of the Orapa Township, probably due to ingress of excreta from households that are not connected to the sewage system. This case highlights the complexity of potential sources of nitrogen.
0.0010.0020.0030.0040.0050.0060.0070.0080.0090.00100.00110.00120.00130.00140.00150.00160.00170.00180.00
NO3 [mg/l]
OD13OD39
OD35
OD3 OD9
OD40 OD17OD18
OD19OD20OD22
OD1
OMLF3OMLF1OMLF2
Z2154 OS1_6OS1_3 OS1_4 OS1_5
ORD 2OS1_2
OLF2OLF1
ORD 5
ORD 4
OS2_5OS2_4
OS2_6
OS2_3OD 8
OS2_2OS2_1PB 02
PB 03
PB 21
PB 12
PB 09
PB 10
PB 22
PB 27 PB 01
PB 14
PB 28
35331000.0035332000.0035333000.0035334000.0035335000.0035336000.00
7640000.00
7641000.00
7642000.00
7643000.00
7644000.00
7645000.00
PIT
TOWNSHIP LANDFILL SITE
OLD REFUSEDUMPS
NEW LANDFILL SITESLIMES DAMS
SLURRY DAMS
TAILINGS DUMP
UTM - KOORDINATES
SAMPLE POINT
LEGEND
N SCALE
0 500 1000
Figure 11.2. Nitrate distribution at the Orapa diamond mine and at wellfield 5

Industry, mining and military sites: Potential hazards and information needs 325
11.2.2 Closure of deep mines Deep mining is often conducted in hard rock environments with a small degree of total porosity. In the large majority of settings, their operation requires continuous dewatering of the mine shafts. Thus the recovery rate to refill a cone of depression caused by long term dewatering operations can be very slow. However, if the bedrock is more porous, as in the case of sandstone with both fracture flow and pore flow (Chapter 2), the artificial and natural fracture cavities will refill quickly, while the pores will refill much more slowly. This may cause entrapment of air in some parts of the mine. This entrapped air can be removed only by diffusion over a long period of time, until the whole mine area is saturated.
Effective flooding of deep mines will vary according to local conditions. The simplest way is to switch off the pumps used for dewatering. Groundwater levels will then recover at rates dependent upon the hydrogeology of the area. However, due to the higher permeability of adits (drainage tunnels) and shafts, water levels and flow directions are unlikely to recover to natural pre-mining conditions (Figure 11.3). When the cone of depression is refilled, groundwater will resume flow towards the natural drainage and may transport potential contaminants in a downgradient direction. This process of mine closure is referred to as uncontrolled flooding.
Figure 11.3. Changes in groundwater hydraulic heads due to increased conductivity caused by adits and shafts in mined areas
The rapid solution of minerals on first contact with water (‘first flush’) often results in a maximum of inorganic contaminants during the initial flushing of the mine at closure. Groundwater quality from a flooded mine may recover to background concentrations after some years or concentrations may remain increased for decades or centuries if pyrite oxidation is still taking place in the unsaturated zone. Some of the secondary

326 Protecting Groundwater for Health
minerals that have been precipitated during the mine operational time are also dissolved during the mine flooding process. Thus groundwater often contains significantly increased concentrations of various contaminants at the very beginning of groundwater recovery; however, they may decrease with time due to dissolution of secondary minerals like gypsum or melanterite (FeSO4).
It is quite common in mountainous areas to manage groundwater withdrawal passively from an active mine by means of drainage tunnels known as adits. Construction of such tunnels is expensive; however they are comparatively inexpensive to operate (no need for pumps, no electrical power consumption). If such tunnels are not sealed by concrete dams at or during mine closure, groundwater drainage will continue as long as the tunnel remains open. Thus groundwater levels will not return to pre-mining conditions. In consequence, pyrite oxidation may continue to take place until all sulphide minerals are consumed. Low pH and elevated metal concentrations associated with pyrite oxidation may make the water unsafe for drinking purposes both locally and downgradient.
11.2.3 Closure of open pit mines Closing surface mines is related to the refilling of excavations with overburden and the recovery of groundwater levels. If other wastes (e.g. industrial wastes, municipal wastes) are deposited together with waste rock during mine closure, additional contamination problems may occur (Chapter 12). Waste rock which was backfilled into the open pit mine may have a high potential to produce acid mine drainage due to oxygen contact over long time periods and thus the formation of secondary minerals which can be easily dissolved with the recovering water table.
Depending on the amount of ore or coal/lignite mined, it is quite common that the deficit volume of an open pit mine is filled largely with groundwater, forming a lake. This lake formation may result in a deformation of local groundwater elevations. At the in-flowing (upgradient) end of the lake the depth-to-groundwater elevation will be increased and will be decreased at the out-flowing lakeshore. If the lake is elongated this impact is more severe.
Whereas during mine operation dewatering chiefly transports contaminants into surface waters, post-mining lakes often become highly acidic and contain high concentrations of metals. As they are integral elements of the local groundwater system, these pollutants will be transported downgradient and impact the aquifer. This is a large-scale quality problem in the Lausitz Region of Germany, as highlighted in Box 11.5.
In arid and semiarid areas with low flow groundwater conditions, which are linked with a low gradient of the groundwater table, any open pit mine lake which forms will be subject to intensive evaporation from the open water surface. Thus the mine lake actually may become a depression in the regional groundwater system even without downgradient outflow. Consequently, the salinity of groundwater or concentrations of other inorganic constituents may increase with time, making the resource unusable for drinking-water or other purposes.

Industry, mining and military sites: Potential hazards and information needs 327
Box 11.5. Consequences of the closure of open pit mines in the Lausitz region, Germany
When groundwater withdrawal occurs over long periods, many mining areas suffer from the effects of the export of groundwater long after mine closure, as illustrated by the Lausitz lignite open pit mining district in Germany. Since the beginning of the 20th century lignite mining took place in an area of approximately 2100 km2. Groundwater withdrawal initially was conducted at a rate of 2 to 3 m3/s, increasing to a maximum of 33 m3/s in 1989. The water was largely pumped to the rivers Spree and Schwarze Elster. This dewatering activity accumulated to a groundwater deficit of 13 billion m3 in 1990, at which time lignite mining was reduced dramatically following the unification of western and eastern Germany. Natural recharge is not locally sufficient to replace these massive deficits within a short time and measures have been set in operation to ensure a minimum base flow in the rivers. Thus a river catchment and groundwater management system was implemented, which is expected to remain in operation for at least two to three decades, until nearly natural conditions have been re-established in groundwater and surface water levels. The process of filling the open pit lakes created by the mining activities with river water has the potential to result in infiltration into oxidized waste rock piles, thereby creating strong potential for development of acid mine drainage. An acidic plume can already be observed migrating downstream of these lakes. The concern is that even after two to three decades when the groundwater deficit is reversed the interconnected lakes will result in severe problems of acid groundwater. Further, these pH impacts, with associated toxic metals, are likely to affect the local lakes and rivers, rendering them also unusable for abstracting drinking-water for several decades at minimum.
11.2.4 Predicting post-mining groundwater quality Mine operators and local authorities need to understand water quality both during and after mining operations. A first step in prediction is to consider water quality at operating or abandoned mines in similar geological and hydrogeological conditions. A second step is the analysis of rock samples from the site to determine both alkaline-producing potential and acid potential (Brady and Cravotta, 1992). In addition to such static tests, kinetic leaching tests have been developed as measures of water quality effects; however, long term field verification is lacking for these kinetic tests. In some cases, the prediction of post-mining hydrochemical conditions can be accomplished by the use of regression analyses.
In order to understand complex chemical processes and/or to predict post-mining water quality, a variety of hydrogeochemical models are available, such as PhreeqC2, Phrqpitz or EQ3/6 (Plummer et al., 1988; Wolery, 1992; Parkhurst and Appelo, 1999). Where acid neutralization reactions can have a strong effect on the transport of dissolved metals, models based on the coupled solute-transport/hydrogeochemical mass-transfer like MINTRAN (Walter et al., 1994) or TREAC are preferable. They predict pH

328 Protecting Groundwater for Health
buffering sequences and metal attenuation mechanisms that are similar to those observed at field sites.
11.3 MILITARY FACILITIES AND ACTIVITIES Regional and international conflicts or military occupations, coupled with day-to-day operations of military bases and support facilities, have resulted in environmental degradation and long-term contamination of soil and groundwater at both former and active military sites. An example of severe contamination from day-to-day operations is given in the Valcunai case study in Box 11.6. For assessing impact on groundwater, a distinction can often be drawn between direct military actions or conflicts on one hand and the (often longer term) use history of military sites and manufactories on the other. Depending upon the nature of the site, contamination to be addressed by situation assessment will include non-ordnance-related chemicals that are associated with typical ancillary military operations (e.g. fuels, pest control chemicals and municipal wastes). Because military bases often resemble towns or small cities in their breadth of activities (Teaf, 1995), many of the considerations that are presented in Chapters 10, 11.1 and 12 regarding municipal and industrial risks to groundwater recharge areas also are relevant here.
Box 11.6. Impacts on groundwater quality by a former military base in Lithuania
The Valcunai Oil Product base, which is located 14 km south of Vilnius, was a site of underground storage of light oils and rocket propellants (nitrogen tetroxide) from 1963 until 1993. Over 33 000 m3 of storage in leaky underground tanks was in service (27 500 m3 for light oils and over 3000 m3 for rocket fuels). A three year monitoring study (Seirys and Marcinonis, 1999) determined that groundwater has been impacted both by pure oil product (3000 to 3500 m2 at a depth of 5.5-7.5 m), chlorinated solvents (e.g. TCE, PCE, carbon tetrachloride) as well as dissolved aqueous phase constituents from oils and other organics and inorganics (nitrates, metals). While a glacial till confining unit of approximately 60 m thickness separates the shallow aquifer from the productive deeper aquifer beneath the oil storage areas, this confining unit is absent beneath the rocket fuel storage areas, rendering the deep aquifer very vulnerable. This aquifer supplies the Pagairai Wellfield, the largest potable water supply for the City of Vilnius. Subsurface ravines representing historical glacial features act as drainage channels for groundwater. Contamination has been observed to be mobile both vertically and horizontally in groundwater. The study reported contaminated shallow groundwater to be discharging to the Rudamina River approximately 0.8 km distant. Thus the Valcunai site represents an example of complex subsurface characteristics with high levels of contamination affecting soils, groundwater and surface water, all of which illustrate the difficult technical aspects of remediation. Removal of free phase hydrocarbons is addressed with extraction wells and oil separation units treating very large volumes of groundwater. The estimated goal of recovery is in the range of 400 to 500 m3 per two years.

Industry, mining and military sites: Potential hazards and information needs 329
Groundwater pollution resulting from deployment of explosives in military conflict includes the impact of damage or destruction of industry, traffic facilities and municipal sewage that may lead to pollutant release. This is similar to spills in ‘extreme events’ as discussed in Chapters 10, 11.1 and 12, but may additionally include combustion products and their transformation products. Further aspects of groundwater pollution through military conflict are physical damage to water supply infrastructure, and the direct contamination of water by residues of many types of explosives, for most of which health and environmental impacts as well as their behaviour in groundwater are poorly understood. The discussion below focuses on the potential for groundwater contamination released from warfare agents’ production and military operation sites.
In historical review, as with many other human activities potentially polluting groundwater, the scale of deployment and the variety of warfare agents increased dramatically during the 20th century. The additional use of chemical warfare (CW) agents introduced a potential for environmental damage. After conflicts, entire armament production plants and military facilities have been dismantled or destroyed and ordnance buried or dumped without any environmental safety precautions.
The groundwater pollution potential from military operations became apparent and subject of scientific research only in the early 1990s. The results disproved the often-expressed hope that many of the military chemicals which are classified as dangerous would quickly be degraded in soil to non-hazardous concentrations (Mulisch et al., 1999a; 1999b).
The specific difficulty in assessing the potential for chemical impairments to groundwater from military sites is that substances used are often subject to secrecy, while their identification in a historical review of site-specific activities would greatly support situation assessment. Only if the substances to be expected are known can their hazard potential be determined for a given site on the basis of substance-specific data. Investigations of the complex biophysical, chemical and biochemical transfer processes as well as of microbial metabolism of organics further supplement the basis for a prognosis of the likely groundwater impacts in the recharge area, including contaminant fate, distribution, bioavailability and degradation in the subsurface (Mulisch et al., 1996; 2000). Historical research to identify military chemical production sites and the areas in which these products were used can substantially help to identify possible risks to groundwater in a region.
The description of potential groundwater contaminant problems, as given in the following section, follows the basic categorization of sites into armament production sites (manufactories) and areas/sites at which the products are used (military operation sites). The latter may include base facilities as well as deployment areas (e.g. shooting ranges, test sites). Potential control and remediation measures for settings in which military sites are suspected sources of groundwater contamination are similar to those for industrial sites and are discussed together with these in Chapter 23.

330 Protecting Groundwater for Health
11.3.1 Potential groundwater contaminants from military production sites
Both active and abandoned military production and manufactory sites may comprise explosives and powder factories, plants for the production of CW and smoke agents, armament filling plants and munitions factories, as well sites at which munitions were stored, disposed of or buried. For production-related reasons (e.g. need for large volumes of groundwater), these armament complexes are often located in areas that are rich in groundwater resources, which potentially elevates risks of large-scale pollution. In particular, contamination has been reported from sites where loading/unloading and filling operations took place, as well as cleaning and maintenance work on machinery or the cleaning/refurbishment of containers and ammunition. Wastewater from cleaning operations was generally highly contaminated by explosives, such as trinitrotoluene (TNT) isomers. Blasting operations can result in widespread contamination by explosives especially at large plants. Areas of suspected contamination also include, in particular, sites at which residues of explosives and off-specification batches of munitions were burned or buried.
The groups of products generally referred to as military warfare agents mainly comprise explosives and a number of chemical agents. Of the categories of explosives, the high-brisance (very powerful) explosives are of greatest interest, largely because they typically are safer to handle on a regular basis and have very high detonation velocities. Major representatives are 2,4,6-TNT, 2,4 or 2,6-DNT, 1,3-DNB, hexogen (cyclotrimethylenetrinitramine) and picric acid (2,4,6-trinitrophenol), but also nitropenta and tetryl. To detonate the high-brisance explosives, it is necessary to ignite them with highly sensitive initiating explosives (e.g. nitropenta and tetryl as well as lead azide, mercury fulminate, thallium azide, and tetrazene). Other important explosives include cyclotrimethylenetetranitramine (RDX), cyclotetramethylenetetranitramine (HMX), ammonium picrate, ammonium nitrate, nitroguanidine, nitroglycerin and dinitrophenols.
Several of the military explosives are of more dominant interest than others because of the large volume of their use, their potential to migrate to groundwater, persistence and toxicity characteristics. For example, 2,4,6-TNT has been very widely used as filling for bombs, mines and shells, readily dissolves in water and can move to groundwater with ease, is persistent (though microbial degradation to aminodinitrotoluolene occurs), and has a high degree of toxicity. It also is classified by US EPA as a possible human carcinogen. Dinitrotoluene (DNT) is mobile in groundwater, is scarcely oxidized biochemically, and not hydrolysed under environmental conditions. Many examples of TNT and DNT contamination have been identified in European and USA military facilities or support industries. Tetryl slowly hydrolyses to picric acid, which does not degrade biochemically under aerobic conditions and only slowly to picramic acid under anaerobic conditions.
Some military ordnance chemicals (e.g. amines, nitro compounds and nitroso compounds) are of interest also because their degradation products (e.g. nitrates) represent significant groundwater contamination sources. Table 11.6 identifies a number of the most common explosive or other military substances with notes on their environmental and health concerns.

Industry, mining and military sites: Potential hazards and information needs 331
Table 11.6. Health-relevant military ordnance chemicals in groundwater (ATSDR, 1995-2001; NIOSH, 1997; US EPA, 2002)
Chemical Potential migration
Non-cancer toxicity
Cancer potential
Explosives 2,4,6-TNT High High Yes 2,4 or 2,6-DNT33 High High Yes Nitroglycerin High High Unknown Dinitrophenols High/moderate High Unknown RDX High Moderate Yes HMX High Moderate Unknown Tetryl High Moderate Unknown 1,3-DNB Moderate Moderate Unknown
CW agents Phosgene High High No HD High High No Organophosphates (e.g. sarin) High High No Hydrocyanic acid High High No
The human health relevance of most of these compounds is a result of the specific
metabolic transformations (mostly reductions) of their nitrogroup(s) by the intestinal microorganisms and by hepatic metabolism. Many intermediates are strongly electrophilic compounds. They have the potential to damage DNA either directly or by disturbing its regulation and expression by epigenetic mechanisms up to the protein and cellular level. High intakes of some compounds are also acutely dangerous by inhibiting the transport of oxygen by oxidizing Hb to metHb. The in vivo toxicologic database, especially for some environmental and microbial metabolites, is very poor.
Chemical weapons About 70 different chemicals were used or stockpiled as CW agents during the 20th century. Now banned worldwide, CW agents can still be found at former manufactories or at clandestine production and storage facilities. They may be categorized according to their main effects on the human organism, and include but are not restricted to blood agents (e.g. hydrocyanic acid), nerve agents (e.g. sarin), skin agents (e.g. mustard gas; HD), or respiratory agents (e.g. phosgene).
CW agents are frequently called ‘war gases’ though this historic term is no longer correct, since many effective CW agents are liquids or solids and only gases in specialized circumstances. As with other chemicals, the relevance of CW agents to potential groundwater contamination depends primarily on their water solubility and their hydrolytic stability (see Chapter 4). Table 11.6 gives examples of warfare agents in relation to their potential to migrate in groundwater.

332 Protecting Groundwater for Health
11.3.2 Potential groundwater contaminants from military operation sites
For assessing pollution potential of military bases and operation sites, both the military-specific substances discussed above and contaminants from other activities on the site may be relevant. In times of peace, warfare agents are used only for training purposes, though such activities may pose contamination risks for groundwater as well. Abandoned sites are categorized according to their main original uses (e.g. training grounds, barracks, facilities for maintenance of technical equipment, airfields and missile sites). Even at locations that, based on their use history, initially are not suspected of encompassing contaminated areas (e.g. administrative buildings, dwellings), considerable contamination including that extending into the groundwater has been found in many cases, and this contamination can threaten the local drinking-water supply if it occurs in recharge areas (Teaf, 1995).
In contrast, training grounds can be expected to exhibit widespread contamination from munitions, as a result of non-point inputs caused directly by military activities (e.g. bomb-dropping grounds, shooting ranges for tanks). Likewise refueling activities in the field or at base support facilities have caused widespread contamination of soil and groundwater by hydrocarbons. Contamination from point sources arises within individual operational areas such as areas in which military equipment is maintained or cleaned, burning sites, or as a result of exceptional events (hazardous release incidents). All of these activities have resulted in groundwater contamination with metals, solvents, hydrocarbons, explosives and other substances.
Many substances used in the military sector are also used in the civilian sector, including petroleum products from fuel depots for motor vehicles and aircraft. According to results obtained from numerous exploratory investigations into contaminated military sites, contamination by petroleum hydrocarbons ranks first, in quantitative terms. Other contaminants found are mainly organic solvents (e.g. chlorinated hydrocarbons) such as were used in large quantities in maintenance facilities and tank-washing installations. Plant treatment, agricultural and pest control products were used in large quantities as defoliants or to keep strategic or militarily sensitive areas free of vegetation or nuisance insects. Large residential facilities (e.g. base housing and daily military operations) also generated the equivalent of municipal waste which, if improperly disposed (see Chapter 12), has the potential to affect groundwater (Herndon et al., 1995).
At training grounds known as ABC facilities (training in defense against Atomic, Biological and Chemical weapons), contamination has occurred mainly from the use of CW agents, from decontamination activities and from the use of incendiaries and smoke agents. Original warfare agents were used for training purposes at these facilities only in very small quantities. Today, CW agents may be found buried on training grounds or in disposal areas at active as well as closed military bases.
On many military properties, illegal and/or uncharacterized waste dumps were established, so that no information is available about the chemical composition of the waste dumped or the length of time the dumps were in use. The special conditions that typically govern the establishment of landfills, and the associated use restrictions (e.g. restrictions on abstraction of drinking-water in the catchment area), tend to have been
Industry, mining and military sites: Potential hazards and information needs 333
disregarded by military forces. The variability and site-specificity of these conditions has made chemical characterization, site investigation and groundwater pollution assessment difficult (Herndon et al., 1995).
11.4 CHECKLIST
NOTE The following checklist outlines information needed for characterizing industrial, mining and military activities in the drinking-water catchment area. It supports hazard analysis in the context of developing a Water Safety Plan (Chapter 16). It is neither complete nor designed as a template for direct use but needs to be specially adapted for local conditions. The analysis of the potential of groundwater pollution from human activity requires combining the checklist below with information about socioeconomic conditions (Chapter 7), aquifer pollution vulnerability (Chapter 8), and other specific polluting activities in the catchment area (Chapters 9-10 and 12-13).
Are active or abandoned industrial, mining and military sites located in the drinking-water catchment area?
Compile inventory of registered large-scale facilities and operations, and check their locations
Compile inventory of small-scale enterprises, production sites, mining sites or military operations, and check their locations
List operations at these sites for • Industry: processes employed and goods produced • Mining: products mined (e.g. ore, coal, lignite, gravel, sand) and mine
type (e.g. deep or open pit mining, ISL) • Military: type (e.g. ordinance testing, troop training, logistic support)
Compile inventory of abandoned industrial sites, mines, military facilities and disposal areas that may still be leaching pollutants to groundwater
Check data about past accidents (e.g. fires, explosions, spillages) which may have left potential ‘hot spots’ on historic or active facilities
…
What kind and which amounts of materials are used, transported and stored at individual facilities?
Compile inventory of raw materials needed for production or operation at individual industry, mining or military facilities (including potentially hazardous degradation products if known)

334 Protecting Groundwater for Health
Classify site-related goods and materials according to their potential hazard to groundwater
Compile inventory of permits for discharging effluents to soils, water bodies, injection wells (including predisposal treatment if known)
Compile information on transportation to and from the facility, i.e. on raw materials, ore, potentially hazardous products and wastes
Compile inventory of number, size, type, age and materials held in pipelines, storage ponds, lagoons and tanks for liquids, with particular consideration given to subsurface structures
Check for indication of episodic releases accumulating contaminants over time
Estimate amount of groundwater withdrawn by industries, mines or military sites, including uses if known (e.g. process water, cooling water)
…
Are the individual facilities in good condition and safe locations?
Check existence of containment structures for storage, production and transportation of hazardous goods and materials (e.g. pipelines, storage ponds, lagoons, tanks for liquids)
Evaluate siting, design, construction and technical condition of individual structures and facilities in relation to aquifer vulnerability and physical conditions in the catchment area (e.g. water table, soil, hydrogeology): consider checklist for Chapter 8
For mining: Evaluate location of heaps and tailings in relation to aquifer vulnerability
Check type of grounds maintenance and use of chemicals (e.g. herbicides, explosives, pesticides, fertilizers, combustible hydrocarbons)
…
Are good management practices implemented at individual sites and facilities to protect groundwater?
Note: See Chapter 23 for the information background for these items. Check availability and implementation of environmental management
concepts, and whether there are audits for best management practice and operational precautions in relation to groundwater protection
Check closure plans and maintenance of decommissioned sites: • For industrial and military sites: adequate dismantling of facilities and
removal of potential groundwater contaminants from sites • For mining: adequate management of acid mine drainage to prevent
acidification and mobilization of metals Check availability and implementation of emergency response plans,
particularly in relation to groundwater protection Check availability and implementation of waste management concepts

Industry, mining and military sites: Potential hazards and information needs 335
Check whether there is accounting for materials brought in, materials processed, wastes requiring disposal and long term closure procedures
Evaluate operation and management practices at individual facilities in relation to aquifer vulnerability and physical conditions in the catchment area (e.g. water table, soil, hydrogeology): consider checklist for Chapter 8
…
Are side effects of production processes also relevant to groundwater contamination?
Identify vehicular traffic, power production, water withdrawal/treatment, and grounds maintenance
Evaluate emission of substances that act as cosolvents (e.g. fuel, acids) and are likely to mobilize other hazardous chemicals
Identify construction activities on industrial, mining or military sites that may physically affect the aquifer or cause contaminant emissions
…
Are hazardous events likely to increase groundwater pollution potential?
Evaluate whether and how storm water events would enhance transport of pollutants to the aquifer
Evaluate which spills and accidents are likely to cause groundwater pollution
…
Is drinking-water abstracted in proximity to industry, manufacturing, mining or military sites?
Assess distance between such sites and drinking-water abstraction (see Chapter 8)
Check adequacy of wellhead protection measures, wellhead construction and maintenance as well as sanitary seals used (see Chapter 18) to prevent ingress of contaminants from production, mining or military sites
…
Are groundwater quality data available to indicate pollution from industrial, mining or military activities?
Compile historic data from the areas and facilities of interest, e.g. from local or regional surveys, research projects or previous monitoring programmes

336 Protecting Groundwater for Health
Check need and options for implementation of new or expanded monitoring programmes likely to detect contamination from industrial, mining or military operations
…
What regulatory framework exists for industrial, mining and military activities?
Compile information on national, regional, local, or catchment area specific legislation, regulations, recommendations, voluntary agreements or common codes of good practices on siting, construction, operation, maintenance of sites, and on restrictions, ban or prohibition of substances produced, processed or generated as wastes
Check whether the regulatory framework adequately addresses environmental and specifically groundwater protection
Identify gaps and weaknesses known which may encourage specific pollution problems
…
Documentation and visualization of information on practices at industry, manufacturing, mining and military sites and operations.
Compile summarizing report and consolidate information from checklist points above
Compile summary of types and amounts of substances produced, processed or generated as wastes and which are potentially hazardous if they leach into the aquifer
Map industrial and mining production sites and military facilities (in-use and abandoned), preferably including suspected ‘hot spots’ of contamination (use GIS if possible)
…
11.5 REFERENCES ATSDR (1995-2001) Toxicological Profiles. Agency for Toxic Substances and Disease Registry,
U/S. Public Health Service, Atlanta, Georgia. Berg, R.C., Curry, B. Brandon, B. and Olshansky, R. (1999) Tools for groundwater protection
planning: An example from McHenry County, IL, USA. Environ. Man., 23, 321-331. Brady K.B.C. and Cravotta C.A. (1992) Acid-base accounting: an improved method of interpreting
overburden chemistry to predict quality of coal-mine drainage. In Proc. 13th Annual West Virginia Surface Mine Drainage Task Force Symposium, WV Mining and Reclamation Association, pp. 13-21.
Canter, L.W. and R.C. Knox. (1987) Ground Water Quality Protection, Lewis Publishers, Chelsea, Michigan.
Ekmekci, M. and G. Gunay. (1997) Role of public awareness in groundwater protection. Environ. Geol., 30,1/2.
Industry, mining and military sites: Potential hazards and information needs 337
Evangelou V.P. (1995) Pyrite Oxidation and its Control, CRC Press Boca Raton, New York, London, Tokyo.
Herndon, R.C., Richter, P.I., Moerlins, J.E., Kuperberg, J.M. and Biczo I.L. (eds.) (1995) Clean-up of Former Soviet Military Installations, Springer-Verlag, Berlin.
Langmuir D. (1997) Aqueous Environmental Geochemistry, Prentice Hall, Upper Saddle River, New Jersey.
Mather, J., Banks, D., Dumpleton, S. and Fermor M. (eds.) (1998) Groundwater Contaminants and their Migration. Geological Society, London, Special Publications, 128.
Merkel B. and Sperling B. (1998) Hydrogeochemische Stoffsysteme II. DVWK Schriftenreihe, 117. Mokokwe, K. (1999) Occurrence of Groundwater with High Nitrate Content - Orapa Well Fields.
Inception Report, Department of Geological Survey (DGS), Lobatse. Mulisch, H-M., Winter, W. and Grohmann, A. (1996) Assessment of the hazards to drinking water
from former military sites. J. Water SRT – Aqua, 45(2), 72-75. Mulisch, H.M., Winter, W. and Schörling, H. (1999a) Assessment of the Hazards to Drinking
Water from Former Military Sites (Advanced Study). In Society of Environmental Toxicology and Chemistry, 9th Annual Meeting of SETAC-Europe 25-29 May 1999: Quality of life and environment in cultured landscapes, p. 229, Leipzig.
Mulisch, H-M., Winter, W. and de Lima, S. (1999b) Drinking water protection in the associated field of former properties of the west group of the troops of the Soviet Army (WGT). TEXTE, 77, 99, Umweltbundesamt, Berlin.
Mulisch, H.-M., Winter, W., Dieter, H. H. and Kerndorff, H. (2000) Kriterienkatalog zur Beurteilung von Gefahren in Einzugsgebieten von Trinkwassergewinnungsanlagen am Beispiel militärischen Altlasten. WaBoLu-Hefte, 6, 99, Umweltbundesamt.
NIOSH (1997) Pocket Guide to Chemical Hazards, National Institute for Occupational Safety and Health, Washington, DC.
Nordstrom D.K., Alpers C.N., Ptacek C.J. and Blowes D.W. (2000) Negative pH and extremely acid mine waters from Iron Mountain, California. Environ. Sci. Technol., 34(2), 254-258.
Parkhurst D.L. and Appelo C.A.J. (1999) User’s Guide to PHREEQC (Version 2) - A Computer Program for Speciation, Batch-Reaction, One-Dimensional Transport, and Inverse Geochemical Calculations. Water Res. Invest. Report 99-4259.
Plummer L.N., Parkhurst D.L., Fleming G.W. and Dukle S.A. (1988) A Computer Program Incorporating Pitzer's Equations for Calculation of Geochemical Reactions in Brines. USGS. Water Res. Invest. Report 88-4153, Reston, Virginia.
Seirys, N. and Marcinonis, A. (1999) Underground pollution at a former military installation in Valcunai (Lithuania). In Bioavailability or Organic Xenobiotics in the Environment, (eds. P. Bayeve et al.), pp. 57-72, Kluwer Academic Publishers, Dordrecht.
Teaf, C.M. (1995) Human health and environmental risks associated with contaminated military sites. In Clean-up of Former Soviet Military Installations, (eds. R.C. Herndon et al.), Springer-Verlag, Berlin.
Tredoux, G. (2000) Report on a Visit to Botswana Regarding Nitrate in Groundwater. Research proposals for the Orapa area and elsewhere. Department of Geological Survey (DGS), Lobatse.
US EPA (1999) Guide for Industrial Waste Management: Ground-water modeling technical background document. EPA530-R-99-002, Washington, DC.
US EPA (2002) Integrated Risk Information System (IRIS) Database. US EPA, Washington, DC. Walter, A.L., Frind, E.O., Blowes, D.W., Ptacek, C.J. and Molson, J.W. (1994) Modeling of
multicomponent reactive transport in groundwater, 1, Model development and evaluation. Water Resources Res., 30, 3137-3148.
Wolery T.J. (1992) EQ3/6, a software package for geochemical modeling of aqueous Systems. Package overview and installation guide (Version 7.0). UCRL_MA-110662-PT-I, Lawrence Livermore National Laboratory Livermore.
Zektser, I.S., Belousova A.P. and Dudov, V.Y. (1995) Regional assessment and mapping of groundwater vulnerability to contamination. Environ. Geol., 25, 225-231.

© 2006 World Health Organization. Protecting Groundwater for Health: Managing the Quality of Drinking-water Sources. Edited by O. Schmoll, G. Howard, J. Chilton and I. Chorus. ISBN: 1843390795. Published by IWA Publishing, London, UK.
12 Waste disposal and landfill: Potential hazards and information needs
R. Taylor and A. Allen
Solid wastes, the subject of this chapter, are mainly disposed of to landfill, because landfill is the simplest, cheapest and most cost-effective method of disposing of waste (Barrett and Lawlor, 1995). In most low to medium income developing nations, almost 100 per cent of generated waste goes to landfill. Even in many developed countries, most solid waste is landfilled. For instance, within the European Union, although policies of reduction, reuse and diversion from landfill are strongly promoted, more than half of the member states send in excess of 75 per cent of their waste to landfill (e.g. Ireland 92 per cent), and in 1999 landfill was still by far the main waste disposal option (EEA, 2003). Furthermore, although the proportion of waste to landfill may in future decrease, the total volume of municipal solid waste (MSW) being produced is still increasing significantly, in excess of 3 per cent per annum for many developed nations (Douglas, 1992). Landfill is therefore likely to remain a relevant source of groundwater contamination for the foreseeable future (Allen, 2001).
Solid waste composition, rate of generation and methods of treatment and disposal vary considerably throughout the world and largely determine the potential of waste to impair groundwater quality. The purpose of this chapter is to outline the risk that waste disposal presents to groundwater quality and the information that is required to assess this risk.

340 Protecting Groundwater for Health
NOTE Waste disposal and landfill activities and the environment in which they are placed vary greatly. Health hazards arising from waste disposal and landfill and their potential to pollute groundwater therefore needs to be analysed specifically for the conditions in a given setting. The information in this chapter supports hazard analysis in the context of developing a Water Safety Plan for a given water supply (Chapter 16).
12.1 TYPES OF SOLID WASTE Wastes generated by the full extent of human activities range from relatively innocuous substances such as food and paper waste to toxic substances such as paint, batteries, asbestos, healthcare waste, sewage sludge derived from wastewater treatment and, as an extreme example, high-level (radioactive) waste in the form of spent nuclear fuel rods. Numerous classifications of solid wastes have been proposed (e.g. Tchobanoglous et al., 1993; Ali et al., 1999), and the following represents a simple classification of waste into broad categories according to its origin and risk to human and environmental health:
• household waste; • MSW; • commercial and non-hazardous industrial wastes; • hazardous (toxic) industrial wastes; • construction and demolition (C&D) waste; • health care wastes – waste generated in health care facilities (e.g. hospitals,
medical research facilities); • human and animal wastes; • incinerator wastes.
Household waste represents waste generated in the home often collected by municipal waste collection services. MSW includes also shop and office waste, food waste from restaurants, etc., also collected by municipal waste collection systems, plus waste derived from street cleaning, and green (organic) waste generated in parks and gardens.
Storage of waste in a disposal facility serves to minimize the effects of waste on the environment. This is achieved by restricting any effluent derived from the waste to a single location, where emissions can be controlled. If control is lacking or inadequate, disposal facilities may become point sources of groundwater contamination. In many regions, centralized waste disposal has historically occurred by landfilling, wherein local quarries and gravel pits have been filled with waste because, in many cases, they simply constituted an appropriately sized hole in the ground. Such locations typically offered little protection against contamination of adjacent groundwater supplies. Legislation designed to protect usable groundwater has helped to reduce the incidence of this practice in many high to middle income countries (e.g. US EPA, 1974; CEC, 1980; NRA, 1992). Modern waste management practices involve disposal of waste in specially sited and engineered sites known as sanitary landfills (see Chapter 24).

Waste disposal and landfill: Potential hazards and information needs 341
Waste accepted in municipal waste landfills in developed countries would normally consist of MSWs, plus commercial and non-hazardous industrial wastes and C&D waste. There is a tendency in many countries for C&D waste, usually regarded as inert, to be buried on the construction site where it is generated. However, since downward percolating rainwater may leach heavy metals from C&D waste, recent waste regulations in some developed countries require all C&D waste to be disposed of in landfills.
Hazardous and non-hazardous wastes are differentiated in the waste management legislation of many countries. A range of legal definitions exist for hazardous waste, but it can generally be thought of as waste or a combination of wastes with the capacity to impair human health or the environment due to its quantity, concentration or physical, chemical or infectious characteristics when improperly used, treated, stored, transported or disposed. In many countries, hazardous (toxic) industrial wastes (both organic and inorganic), solid incinerator residues, bottom and fly ash are disposed in special hazardous waste landfills, and specialized disposal or incineration may also be practiced for healthcare wastes (see Box 12.1).
Box 12.1. Health care and research facilities
Health-care facilities can contaminate groundwater through wastes and wastewater containing infectious pathogens, e.g. from contaminated blood or infectious body parts. Health-care facilities may also release various pharmaceuticals, diagnostics (e.g. radiochemicals) and disinfectants depending on the kinds of medical examination being conducted and local practices for handling these substances. These include, but are not restricted to the following:
- cytostatic agents applied in cancer therapy; - antibiotics; - disinfectants for surface, instrument and skin disinfection; - heavy metals such as platinum from excretion by patients treated with the
cytostatic agents, mercury from preservatives, disinfectants, diuretic agents, amalgam separators;
- adsorbable organic halogenes from solvents, disinfectants, cleaners and drugs containing chlorine, as well as iodized X-ray contrast media.
Research institutions may use solvents and other potentially hazardous chemicals and radiochemicals (e.g. mutagenic substances used in molecular biology). Also, organisms used in production and research, especially pathogenic bacteria and viruses, as well as genetically modified organisms, are utilized.
For health-care and research facilities, situation assessment should be based on an inventory of substances used or produced, and of processes, which have the potential to emit hazardous organisms or chemicals. Such assessments should necessarily cover storage (containment), handling and disposal practices (e.g. disinfection of wastes). Additionally, assessment should address how effectively these practices are being implemented and the ultimate destination of disposal (e.g. local dump, sewage mains), as this will determine the nature and magnitude of the risk to groundwater.

342 Protecting Groundwater for Health
In many low to medium income parts of the world, where uncontrolled open dumps are common, all waste tends to be dumped together, regardless of its origins or its hazardous nature. A specific characteristic of leachate from hazardous industrial waste is that it may be toxic to the bacteria naturally present and thus delay biodegradation of organic substances in leachate.
Human and animal wastes are usually not disposed of in landfills, although animal carcasses and waste from abattoirs may in some countries be disposed of in dumps and landfills. Human corpses are not generally regarded as waste, but they degrade in a similar way to other organic waste, and also produce leachate in significant quantities. The majority of corpses are buried in cemeteries (see Box 12.2), although a significant proportion are cremated (incinerated), the proportion varying from country to country depending on the proportions of different religious groups in the population and their funeral rites. The main health concern with human and animal wastes is the high concentrations of pathogenic organisms associated with this type of waste, and the potential it has to spread disease.
Box 12.2. Cemeteries
In many regions burials are concentrated into relatively small areas, such as municipal cemeteries, where each body introduces a heavy burden of organic, inorganic and biological parameters into the subsurface. Hydrogeological factors have historically not been taken into account when locating cemeteries and the potential impact of cemeteries on groundwater quality has not been considered.
Animal and human remains, although not considered a waste product, represent a risk to local groundwater because of the proliferation of microorganisms that occurs during the process of corpse decomposition (Pacheco et al., 1991). There are more bacteria in a human body than human cells. Many of the bacteria are harmless saprophytes that benefit the host (e.g. by synthesizing vitamins or by metabolizing toxic waste products). However, some will be pathogenic or have the potential to be pathogenic. In addition, the human body is host to a variety of different viruses, fungi and protozoa that may cause disease if transmitted to a susceptible person. Most pathogens will remain viable for a period of time after the host dies. In most cases long-term survival of the pathogen is unlikely, but notable exceptions have generated concerns during investigations of burial sites. The examination of graves containing the remains of smallpox, cholera, anthrax and plague victims, as well as victims of the 1918 influenza pandemic, have been subject to rigorous controls to prevent the potential dispersal of the pathogen from the burial site.
One of the main agents in decomposition (putrefaction) is Clostridium perfringens. These bacteria spread along blood vessels causing haemolysis, proteolysis and gas formation in blood and other tissues. The liquids produced through putrefaction contain a high density of microorganisms. Very few studies have been carried out on the microbiology of human putrefaction. Corry (1978), published a catalogue of bacterial species that have been isolated from human cadavers; some of the species listed are pathogenic. These liquids can

Waste disposal and landfill: Potential hazards and information needs 343
migrate down into the water table, particularly as coffins and caskets are not water tight and are liable to decay. Microbial contaminants that may result from the decomposition of cadavers include Staphylococcus spp., Bacillus spp., Enterobacteriacae spp., faecal streptococci, Clostridium spp., Helicobacter pylori, enteroviruses, rotavirus, calicivirus, and F-specific RNA phage.
Spongberg and Becks (2000) list potential chemicals that can be released from cemeteries. These include arsenic and mercury (embalming and burial practices), formaldehyde (embalming, varnishes, sealers and preservatives) as well as lead, zinc and copper (coffins). Spongberg and Becks (2000) also discuss investigations in Ohio where increases in zinc, copper and lead in the soil at a large cemetery were observed. Significant increases in arsenic were thought to indicate contamination from embalming fluids or wood preservatives.
There are several historical accounts of pollution of water wells in the vicinity of cemeteries (e.g. Teale, 1881), but few recent studies of the microbial impact of cemeteries on groundwater (West et al., 1998). An analysis of groundwater quality beneath an active cemetery in the United Kingdom provided evidence that confirms the risk to groundwater, although no pathogens or viruses were isolated. The impacts on groundwater of three cemeteries in Sao Paulo and Santos, Brazil have been monitored by Pacheco et al. (1991), by installing piezometers throughout each of the cemetery sites. One cemetery is situated on Tertiary sediments, 4-12 m above the water table, one is on weathered granite, 4-9 m above the water table, and the third is on Quaternary sandy marine sediments, 0.6-2.2 m above the water table. Contamination of the piezometers by faecal coliforms, faecal streptococci and sulphite reducing clostridia was found to be widespread throughout all of the cemeteries. Thus assessing groundwater pollution potential clearly needs to include the potential for pathogens from cemeteries, particularly from large cemeteries.
Although the above considerations are valid for long-term permanent situations, it is generally accepted that corpses in situations of disaster do not constitute a major health hazard. When a disaster strikes a community, authorities should prioritise their actions to attend to the injured and the displaced. The risk of deaths and epidemics due to unattended dead bodies is far smaller than the risk of deaths and diseases due to lack of sufficient food, shelter, drinking water, sanitation and basic medical care. Evidence obtained from emergency operations would indicate that in the majority of the cases the dead bodies do not pose an appreciable risk for public health in areas where there are no endemic diseases (Üçisik and Rushbrook, 1998; Western, 2004).
The rate at which waste is generated corresponds roughly with levels of income. In
high income countries of Europe and North America between 500 and 750 kg of solid waste are produced per person per year (OECD, 1997). In contrast, urban populations in most low income countries, for example in Nigeria and Côte d'Ivoire, generate between 100 and 200 kg of solid waste per person per year (Attahi, 1999; Onibokun and Kumuyi, 1999). Despite this lower rate, rapid urbanization, particularly in low income developing
344 Protecting Groundwater for Health
countries, has left little space for disposal of the increasing amounts of waste material being generated in urban settings (Sangodoyin, 1993). As a result, uncontrolled disposal (i.e. fly tipping) is rife in many countries, and is a diffuse source of groundwater contamination.
12.2 WASTE STORAGE, TREATMENT AND DISPOSAL SITES
The processes of storage, collection, transport, treatment and disposal of wastes all have the potential to pollute the environment and particularly groundwater due to uncontrolled migration of fluids (leachate) derived from the wastes. In addition to the potential for groundwater pollution at sites where wastes are produced and stored prior to collection, sites associated with the treatment and disposal of wastes, where leachate may be generated include:
• landfills (both controlled as sanitary landfill or uncontrolled as open dumps) • scrap-yards • cemeteries • waste collection and processing facilities • composting facilities.
For situation assessment, landfills are most readily identified with the pollution of groundwater by waste-derived liquids. However, any site where waste is concentrated, processed (e.g. recycled) and stored even for a short period of time may be a potential point source of groundwater contamination. Such processing facilities are often not well regulated or licensed and frequently occur in urban or semi-urban settings, where local water supply points may be impacted by these activities. An inventory of these locations, the types of waste handled and management processes for waste products will aid in the assessment of the polluting capability of such sites.
For situation assessment, a critical criterion in estimating potential groundwater pollution from waste disposal is the siting of all of the above mentioned waste treatment and disposal facilities, particularly sanitary landfills and open dumps (discussed in Sections 12.3.2 and 12.3.3). Most modern landfills in high to medium income countries require licenses to operate (see Chapter 24.2), and must be engineered to prevent groundwater pollution. This generally involves lining the site with an artificial lining system, but liners leak and degrade with time (Chapter 24.3). Even if the site is well engineered and managed with an artificial lining system installed and even if or the waste materials are inert, leachate, which may have the potential to pollute groundwater, will be produced. It is therefore essential to assess the capacity of the underlying geology to protect groundwater in the event of liner failure. The likelihood of disposed wastes polluting groundwater depends on the thickness of the unsaturated zone and the attenuation capacity of the overburden (i.e. any loose unconsolidated material which overlies solid bedrock) underlying the site, and also on the total and effective precipitation at the site, since the quantity and concentration of leachate generated is a function of the access of water to the waste. Thus the potential for pollution of groundwater will be least at sites carefully selected to take advantage of the most favourable geological/ hydrogeological conditions.

Waste disposal and landfill: Potential hazards and information needs 345
Historic landfills (dumps) were generally not subject to the regulations governing modern landfills, and were usually sited for convenience, such as the presence of a pre-existing hole into which the waste could be deposited. The general assumption that an aftercare period of 30 years is adequate to allow for degradation of waste to an inert state, is now being questioned, with recent studies (Hjelmar et al., 1995; Wall and Zeiss, 1995; Kruempelbeck and Ehlrig, 1999; Röhrs et al., 2000; Fourie and Morris, 2003) suggesting that waste may remain active for many decades and even hundreds of years, particularly under moisture-deficient conditions. This includes not only landfills from regions where evaporation exceeds precipitation, but also all lined and capped landfills employing the concept of dry entombment of waste.
In the past, hazardous and non-hazardous wastes were not distinguished so that hazardous substances may be stored in all of these landfills. For situation assessment, it is important to locate all waste disposal sites in the drinking-water catchment, including both currently operating landfills, and historic dumps, now closed and covered over (see Chapter 24). Assessment of all landfills, but in particular historic landfills, should include age and type of waste, underlying geology, most importantly type and thickness of overburden and thickness of the unsaturated zone. The state of degradation of the waste can be ascertained by analysing the leachate and landfill gases generated, as degradation of waste follows a distinctive pattern manifested in well-known and documented compositional variations in liquid and gaseous emissions. All of this, together with the proximity of all of these sites to sources of drinking-water, can determine the threat to public health posed by waste disposal.
12.3 FACTORS GOVERNING CONTAMINATION OF GROUNDWATER BY DISPOSAL OF WASTE
Waste deposited in landfills or in refuse dumps immediately becomes part of the prevailing hydrological system. Fluids derived from rainfall, snowmelt and groundwater, together with liquids generated by the waste itself through processes of hydrolysis and solubilization, brought about by a whole series of complex biochemical reactions during degradation of organic wastes, percolate through the deposit and mobilize other components within the waste. The resulting leachate, subsequently migrates from the landfill or dump and has the potential to contaminate local groundwater either through direct infiltration on site or by infiltration of leachate-laden runoff off-site. The risk posed to groundwater-fed drinking-water sources by waste disposal in landfills or dumps can be considered in terms of three controls:
• waste composition and loading • leachate production • leachate migration – attenuation and dilution.
12.3.1 Waste composition and loading The composition and volume of disposed wastes vary nationally and regionally in relation to the local human activities, and the quantity and type of products that communities consume (Table 12.1). Discarded waste in lower income areas is typically

346 Protecting Groundwater for Health
rich in food-related waste, i.e. organic (carbon-rich) substances (Table 12.1). Although such waste is not in itself toxic, decomposition of organic matter can alter the physicochemical quality of groundwater and enhance the mobility of hazardous chemicals including metals and solvents (see Section 12.3.2). The proportion of manufactured (e.g. paper) and potentially hazardous (e.g. textiles, metals, plastics) wastes increases in relation to income and degree of industrialization (Table 12.1), and waste disposal leachate from highly industrialized settings may contain a wide range of anthropogenic contaminants (see Section 12.3.2). The types of hazardous substances likely to occur in discarded waste may be assessed from the types of industry, small-scale enterprise and other human activity of a particular area.
Table 12.1. Solid-waste generation and composition from selected regions in the world (OECD, 1993, 1997; Attahi, 1999; Lusugga Kironde 1999; Onibokun and Kumuyi, 1999)
Location Rate (kg/pers/year)
Composition (%)
Paper Food Plastics Glass Metals Textiles Other China 285 3 60 4 1 0 2 - Denmark 520 30 37 7 6 3 17 - France 560 30 25 10 12 6 17 - Iran 324 8 74 5 3 1 2 - Mexico 320 14 52 4 6 3 20 - Poland 290 10 38 10 12 8 23 - USA 730 38 23 9 7 8 16 - Abidjan (Côte d'Ivoire) 211 4 63 5 1 1 1 25
A major concern in many countries is also of waste import, particularly of hazardous wastes. Export from industrialized countries to low-income countries circumvents strict waste disposal regulations implemented in the country generating these wastes. Often this is highly organized, as informal, though illegal, transactions between an exporter and importer using false documentation (e.g. Mackenzie, 1989). Such waste export/import practices are difficult to detect, but important for situation assessment as disposal of such wastes is likely to pose a risk of groundwater contamination. It is therefore often necessary to collect information on both formal and informal (i.e. illegal) waste composition and loading.
Landfilled refuse is rich in microorganisms. Mature sites may be compared to large bioreactors in which the organic content of the waste is decomposed anaerobically. Most of the organisms that carry out these processes are harmless saprophytes. An analysis of household waste in the United Kingdom showed that over 4 per cent of the waste comprised disposable nappies (diapers) of which about one-third may be soiled with faeces. Domestic waste also contains bloodstained materials, such as sanitary pads, tampons and discarded wound dressings, and animal wastes, such as dog faeces and soiled cat litter. The potential for pathogens within this mixture of sources is extremely high. Pathogens may also be transported to landfill sites by vermin (rats) and other scavengers, in particular seagulls.
The fate of pathogens in landfill sites is not understood. Although it is generally assumed that most are rapidly inactivated by the conditions that prevail in the landfill
Waste disposal and landfill: Potential hazards and information needs 347
environment, the potential of leachate and runoff from landfill sites to transport pathogens into local water resources should be addressed in situation assessment.
12.3.2 Leachate production Most waste deposited in landfills is not inert. Degradation of many components of waste including food, paper and textiles consumes oxygen thereby changing the redox potential of the liquid present and potentially influencing mobility of other constituents. Plastics, glass and metal compounds tend to be less reactive and degrade more slowly. Under some conditions, metals may, however, become rapidly mobilized (see Chapter 4).
Percolating rainwater provides a medium in which waste, particularly organics, can undergo degradation into simpler substances through a range of biochemical reactions involving dissolution, hydrolysis, oxidation and reduction, processes controlled to a large extent within landfills and dumps by microorganisms, primarily bacteria. Table 12.1 indicates that the largest fraction of disposed waste is organic matter (e.g. food, paper), which has a well-documented degradation path. Mechanisms regulating mass transfer from wastes to leaching water, from which leachate originates, can be divided into three groups of processes:
• hydrolysis of solid waste and biological degradation; • solubilization of soluble salts contained in the waste; • suspension of particulate matter.
The first two groups of processes, which have the greatest influence on the composition of leachate produced, are associated with the stabilization of waste.
Initially, organic matter in the form of proteins, carbohydrates and fats, is decomposed under aerobic conditions (i.e. oxidized), through a series of hydrolysis reactions, to form carbon dioxide and water together with nitrates and sulphates via a number of intermediate products such as amino acids, fatty acids and glycerol. Such oxidation reactions are exothermic, so temperatures in the landfill become elevated. Carbon dioxide is released as a gas or is dissolved in water to form carbonic acid (H2CO3) which subsequently dissociates to yield the bicarbonate anion (HCO3
-) at near neutral pH. Aerobic decomposition of organic matter depletes the waste deposit of oxygen (O2) as
buried waste in the landfill or refuse dump becomes compacted and circulation of air is inhibited. As oxygen becomes depleted, it is replaced as the oxidizing agent by, in succession, nitrate (NO3
-), manganese (as MnO2), iron (as Fe(OH)3) and sulphate (SO42-).
In general, the aerobic stage is short, no substantial volumes of leachate are produced, and aerobic conditions are rapidly replaced by anaerobic conditions. The main stages of anaerobic digestion are (i) acetogenic (acid) fermentation, (ii) intermediate anaerobiosis, and (iii) methanogenic fermentation, all three of which can be operating simultaneously in different parts of the landfill.
Acetogenic fermentation brings about a decrease in leachate pH, high concentrations of volatile acids and considerable concentrations of inorganic ions (e.g. Cl-, SO4
2-, Ca2+, Mg2+, Na+). As the redox potential drops, sulphate is slowly reduced, generating sulphides, which may precipitate iron, manganese and heavy metals that are dissolved by the acid fermentation. Decrease in pH is due to production of volatile fatty acids (VFAs) and to high partial pressures of carbon dioxide (CO2), whilst the increased concentrations

348 Protecting Groundwater for Health
of anions and cations results from leaching (lixiviation) of easily soluble organic material present in the waste mass. Breakdown of organic material reduces the redox potential to <330mV, which allows the next stage of the process to become initiated. Leachate from this phase is characterized by high values of biological oxygen demand (BOD) (commonly >10 000 mg/l), high BOD5/COD ratios (commonly >0.7), acidic pH values (typically 5-6) and ammonia (NH3) due to hydrolysis and fermentation in particular of proteins.
Intermediate anaerobiosis commences with a gradual increase in the methane (CH4) concentration in the gas, coupled with a decrease in H2, CO2 and VFAs. Conversion of the VFAs leads to an increase in pH values and to alkalinity, with a consequent decrease in the solubility of calcium, iron manganese and the heavy metals, which are probably precipitated as sulphides. Ammonia is released but is not converted to nitrate in such an anaerobic environment.
Methanogenic fermentation, the final stage in the degradation of organic wastes, operates within the extremely limited pH range of 6-8. At this stage in the degradation process, the composition of leachate is characterized by almost neutral pH, and low concentrations of volatile acids and TDS, indicating that solubilization of the majority of organic components is almost complete, although waste stabilization will continue for several decades. The biogas being produced has a methane content of generally >50 per cent, whilst ammonia continues to be released by the acetogenic process. Leachate produced at this stage is characterized by relatively low BOD values, and low ratios of BOD/COD.
Degradation processes convert nitrogen into a reduced form (ammonium), and bring about mobilization of manganese and iron and also liberation of hydrogen sulphide gas. Production of methane indicates strongly reducing conditions with a redox potential in the order -400 mV. Unlike carbon dioxide, methane is poorly soluble in water.
Due to the decomposition of organic matter, leachate derived from landfills or dumps comprises primarily DOC (Table 12.2), largely in the form of fulvic acids (Christensen et al., 1998). The solubility of metals in leachate is enhanced through complexation by dissolved organic matter. The solubility of organic contaminants in waste may also be slightly enhanced through the presence of high levels of organic carbon in leachate. The range of organic compounds that may be found in groundwater affected by landfill leachate is shown in Box 12.3 and Table 12.3. Hydrophobic compounds may be mobilized through leachate, as they adsorb to organic carbon in solution. For example, benzene- and naphthalene-sulphonates comprise between 1-30 per cent of the DOC in landfill-leachates analysed in Switzerland (Riediker et al., 2000).

Waste disposal and landfill: Potential hazards and information needs 349
Box 12.3. Organic contaminants in groundwater affected by landfill
leachate in Germany
A study investigating groundwater from 250 different municipal waste sites in Western Germany (Kerndorff et al., 1992) identified a wide range of organic contaminants within 10-100 m downgradient of the deposit, some of which occurred in a large number of samples and attained concentrations well into the range of mg/l (Table 12.3). Benzene and its alkyl derivatives (four compounds) constitute the majority of the seven non-halogenated contaminants. The highest mean concentration was obtained for volatile halogenous substances, predominantly for dichloromethane (DCM) (≈ 38 mg/l), cis-1,2-DCE (≈ 22 mg/l), VC (≈ 1.7 mg/l), and trichloroethene (TCE) (≈ 1 mg/l). The high concentrations associated with these VOC confirm the significance of this class of substances as major emissions from waste disposal sites
Table 12.2. Key characteristics of landfill leachates from England, Germany and USA (all values in mg/l except pH) (Ehrig, 1982; Robinson et al., 1982; Fetter, 1993)
Parameter United Kingdom
Germany USA
pH 6.2-7.4 6.1-8.0 5.4-7.2 TDS Not analysed Not analysed 2180-25 900 COD 66-11 600 3000-22 000 1120-50 500 BOD <2-8000 180-13 000 100-29 200 Total organic carbon 21-4400 Not analysed 427-5890 Ammonia-nitrogen 5-730 741 26-557 Total phosphorous <0.02-3.4 5.7 0.3-117 Chloride 70-2780 2-119 180-2650 Iron 0.1-380 15-925 2.1-1400 Manganese 0.3-26.5 0.7-24 0.03-25.9 Calcium 165-1150 80-1300 200-2100 Magnesium 12-480 250-600 120-780
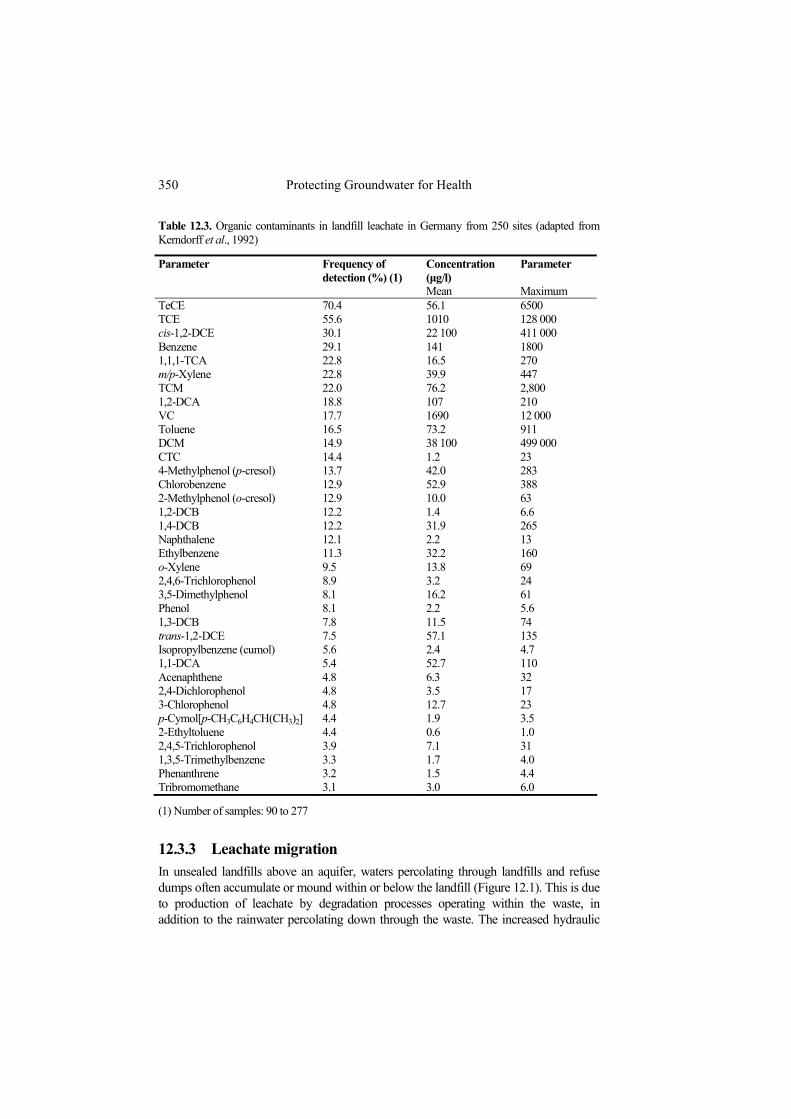
350 Protecting Groundwater for Health
Table 12.3. Organic contaminants in landfill leachate in Germany from 250 sites (adapted from Kerndorff et al., 1992)
Parameter Frequency of detection (%) (1)
Concentration (µg/l)
Parameter
Mean Maximum TeCE 70.4 56.1 6500 TCE 55.6 1010 128 000 cis-1,2-DCE 30.1 22 100 411 000 Benzene 29.1 141 1800 1,1,1-TCA 22.8 16.5 270 m/p-Xylene 22.8 39.9 447 TCM 22.0 76.2 2,800 1,2-DCA 18.8 107 210 VC 17.7 1690 12 000 Toluene 16.5 73.2 911 DCM 14.9 38 100 499 000 CTC 14.4 1.2 23 4-Methylphenol (p-cresol) 13.7 42.0 283 Chlorobenzene 12.9 52.9 388 2-Methylphenol (o-cresol) 12.9 10.0 63 1,2-DCB 12.2 1.4 6.6 1,4-DCB 12.2 31.9 265 Naphthalene 12.1 2.2 13 Ethylbenzene 11.3 32.2 160 o-Xylene 9.5 13.8 69 2,4,6-Trichlorophenol 8.9 3.2 24 3,5-Dimethylphenol 8.1 16.2 61 Phenol 8.1 2.2 5.6 1,3-DCB 7.8 11.5 74 trans-1,2-DCE 7.5 57.1 135 Isopropylbenzene (cumol) 5.6 2.4 4.7 1,1-DCA 5.4 52.7 110 Acenaphthene 4.8 6.3 32 2,4-Dichlorophenol 4.8 3.5 17 3-Chlorophenol 4.8 12.7 23 p-Cymol[p-CH3C6H4CH(CH3)2] 4.4 1.9 3.5 2-Ethyltoluene 4.4 0.6 1.0 2,4,5-Trichlorophenol 3.9 7.1 31 1,3,5-Trimethylbenzene 3.3 1.7 4.0 Phenanthrene 3.2 1.5 4.4 Tribromomethane 3.1 3.0 6.0
(1) Number of samples: 90 to 277
12.3.3 Leachate migration In unsealed landfills above an aquifer, waters percolating through landfills and refuse dumps often accumulate or mound within or below the landfill (Figure 12.1). This is due to production of leachate by degradation processes operating within the waste, in addition to the rainwater percolating down through the waste. The increased hydraulic
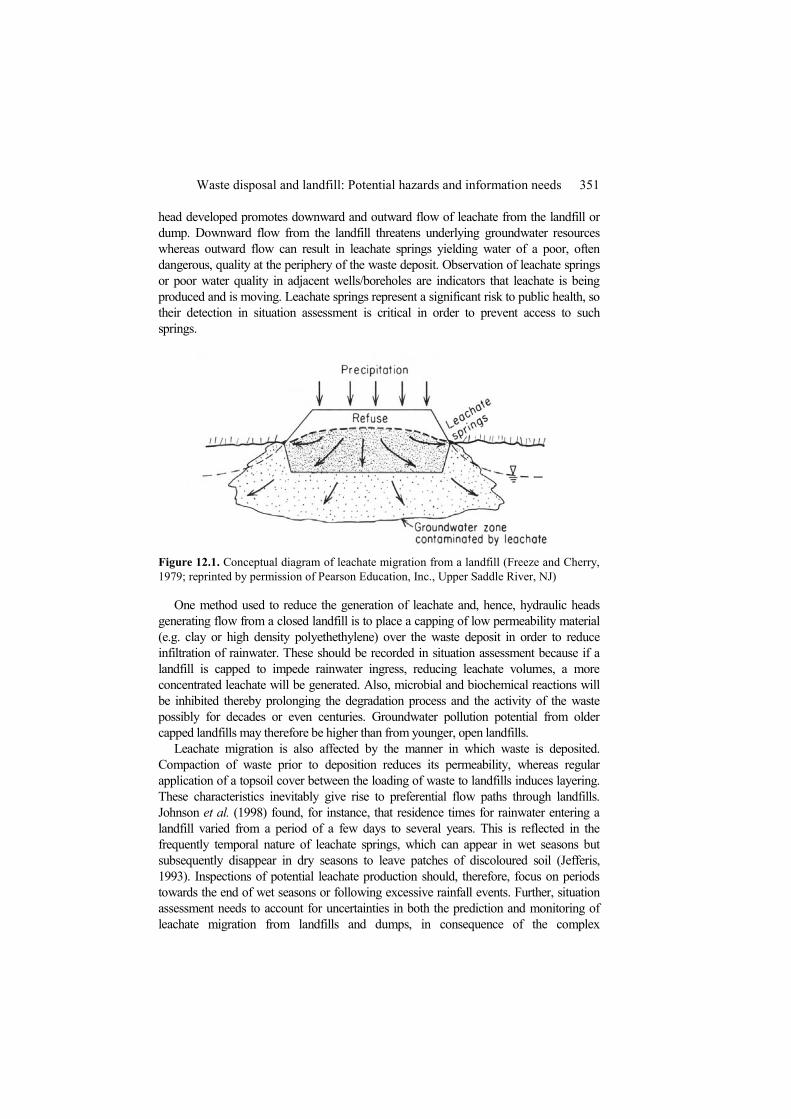
Waste disposal and landfill: Potential hazards and information needs 351
head developed promotes downward and outward flow of leachate from the landfill or dump. Downward flow from the landfill threatens underlying groundwater resources whereas outward flow can result in leachate springs yielding water of a poor, often dangerous, quality at the periphery of the waste deposit. Observation of leachate springs or poor water quality in adjacent wells/boreholes are indicators that leachate is being produced and is moving. Leachate springs represent a significant risk to public health, so their detection in situation assessment is critical in order to prevent access to such springs.
Figure 12.1. Conceptual diagram of leachate migration from a landfill (Freeze and Cherry, 1979; reprinted by permission of Pearson Education, Inc., Upper Saddle River, NJ)
One method used to reduce the generation of leachate and, hence, hydraulic heads generating flow from a closed landfill is to place a capping of low permeability material (e.g. clay or high density polyethethylene) over the waste deposit in order to reduce infiltration of rainwater. These should be recorded in situation assessment because if a landfill is capped to impede rainwater ingress, reducing leachate volumes, a more concentrated leachate will be generated. Also, microbial and biochemical reactions will be inhibited thereby prolonging the degradation process and the activity of the waste possibly for decades or even centuries. Groundwater pollution potential from older capped landfills may therefore be higher than from younger, open landfills.
Leachate migration is also affected by the manner in which waste is deposited. Compaction of waste prior to deposition reduces its permeability, whereas regular application of a topsoil cover between the loading of waste to landfills induces layering. These characteristics inevitably give rise to preferential flow paths through landfills. Johnson et al. (1998) found, for instance, that residence times for rainwater entering a landfill varied from a period of a few days to several years. This is reflected in the frequently temporal nature of leachate springs, which can appear in wet seasons but subsequently disappear in dry seasons to leave patches of discoloured soil (Jefferis, 1993). Inspections of potential leachate production should, therefore, focus on periods towards the end of wet seasons or following excessive rainfall events. Further, situation assessment needs to account for uncertainties in both the prediction and monitoring of leachate migration from landfills and dumps, in consequence of the complex

352 Protecting Groundwater for Health
hydrogeology of waste deposits. This is further addressed in Chapter 24 in relation to problems of planning and management.
Despite the complexity of leachate migration through landfills, fundamental aspects of subsurface contaminant transport, reviewed in Section 12.4, can practically be applied to the movement of leachate-derived contaminants from a landfill or refuse dump. These include the thickness of the unsaturated zone, the permeability and moisture content of the earth materials within the unsaturated zone, and the hydraulic conductivity and local hydraulic gradient of geological units in the saturated zone. Poorly conductive units underlying the landfill or refuse dump, e.g. clay-rich material or the presence of an installed artificial liner inhibit leachate migration. On the other hand, discontinuities such as fissures and joints in the subsurface or faults or holes in a liner, dramatically increase leachate flow. For situation assessments, access to hydrogeological information (see Chapter 8) as well as information on design and condition of potentially installed lining system (see also Chapter 24) from both beneath and downstream of landfills, is vital.
Equally important as understanding the magnitude and direction of leachate flow is recognition of the significant biochemical changes that occur, as strongly reducing leachate (redox potential <-100 mV), mixes with shallow underlying groundwater, which is mildly to strongly oxidizing (redox potential >+100 mV). These changes, illustrated in Figure 12.2 represent a reversal of the reducing reactions which take place in the landfill, and give rise to a series of redox zones in the leachate plume adjacent to the landfill in the reverse order to the sequence described in Section 12.3.2. The leachate plume thus becomes less reducing and organic carbon in the leachate is rapidly oxidized to CO2 through contact with oxygenated groundwater.
The leachate plume undergoes continuous transition in the direction of groundwater flow (Figures 12.2 and 12.3) until conditions are reached where it is no longer anaerobic, and attains redox levels identical to background levels in the aquifer. In this transition zone, chemically reduced species such as methane and ammonia disappear, and aqueous nitrogen and sulphur are converted into their oxidized forms of nitrate and sulphate respectively. Iron is oxidized and precipitates as hydrous iron oxide, whereas in contrast, manganese, which is soluble over a wider range of electrochemical (i.e. redox) conditions, remains in solution longer (i.e. travels further with the leachate plume). Consequently, analysis for these compounds and comparison with background levels elsewhere in the aquifer can indicate the presence and extent of the plume. Significantly, a number of detailed studies of leachate plumes indicate that they rarely extend more than a few hundred metres from the landfill before all but a handful of the most persistent contaminants are completely attenuated (e.g. Christensen et al., 1994: Robinson et al., 1999). To determine the vertical extent of the plume often multiple depth sampling boreholes are required as indicated in Figure 12.3.
Migration of reactive constituents in leachate, such as microorganisms, organic solvents and metals, is inhibited through biochemical reactions in the plume (e.g. precipitation, volatilization), and by the interaction of these constituents with the geological materials forming the aquifer matrix (e.g. adsorption, cation exchange), as discussed in Chapters 3 and 4. These processes reduce contaminant concentrations in local groundwater by removing contaminants from solution.

Waste disposal and landfill: Potential hazards and information needs 353
Figure 12.2. Schematic redox zonation in an originally aerobic aquifer downgradient from a landfill, and the distribution of redox-sensitive species along a streamline in the plume
Concentrations of unreactive (i.e. conservative) species in leachate can, however, only be reduced through dispersion and dilution. The extent to which dilution can reduce the concentrations of waste-derived contaminants in the leachate plume adjacent to the landfill or dump, depends upon the magnitude of both groundwater and leachate flows, together with the relative concentrations of contaminants in both the leachate and in the natural groundwaters of the aquifer upstream of the landfill (see Section 12.4).
As leachate migrates from a waste deposit in the direction of groundwater flow, the plume disperses (i.e. spreads due to differing contaminant flow paths and flow velocities), and also diffuses through the aquifer. Concentrations of both reactive and conservative contaminants decrease with distance along the groundwater flow path (Figure 12.3). It should, however, be recognized that exceptions to this general trend

354 Protecting Groundwater for Health
occur when a contaminant is transformed into a more toxic compound, as occurs in the dehalogenation of perchloroethylene/tetrachloroethene (PCE) to TCE. It should be noted that the concentration of a pollutant at any point removed from its source may vary throughout the year due to seasonal influences on recharge and release of the contaminant, or reaction times governed by variations in factors such as temperature.
Figure 12.3. Mixing of landfill leachate with shallow groundwater in a sandy aquifer underlain by clay, as indicated by chloride concentrations (Freeze and Cherry, 1979; reprinted by permission of Pearson Education, Inc., Upper Saddle River, NJ)
12.4 ASSESSING GROUNDWATER CONTAMINATION ASSOCIATED WITH WASTE SITES
The checklist below provides guidance on how to approach assessing the likelihood of groundwater contamination through wastes and landfills found in a given drinking-water catchment. Much information for estimating pollution potential can be gleaned from amounts and types of wastes deposited, site management and site location in relation to aquifer vulnerability. As discussed in Chapters 2 and 8, this approach is not always easy, as the hydraulic conductivity and hydraulic gradient are crucially dependent on whether the aquifer has an intergranular or fissure permeability. Flow velocity can be several orders of magnitude higher in the latter. Also different contaminants may migrate at different velocities.
A number of countries use drinking-water protection zone concepts (Chapter 17) to delineate boundaries within which activities such as waste disposal are banned. Their delineation faces the same problems of understanding the hydrology of the setting. However, where protection zones exist, they are valuable for situation assessment which would begin with checking implementation (i.e. whether waste disposal is indeed being kept outside of the protection zone). Also, reviewing the information basis for their

Waste disposal and landfill: Potential hazards and information needs 355
delineation will help to understand both the hydrogeological setting as well as the quality of the information base available for determining aquifer vulnerability.
Where hydrogeological understanding is poor and means to improve it are limited, a default approach to assessing pollution potential from wastes is to investigate distances between waste disposal and drinking-water abstraction, and to assess the potential hazard on the basis of the current general body of knowledge on landfill leachate plume attenuation and migration. A number of studies monitoring unlined landfills in operation before the advent of containment landfills have been ongoing over the past 20 years (e.g. Christensen et al., 1994; Blight, 1995; Robinson et al., 1999; Williams, 1999; Williams et al., 1999; Ball and Novella, 2003; Butler et al., 2003). These show that leachate plumes do not usually exceed a length of 1000 m, even in fast-flowing aquifers over periods in excess of 50 years after the initial wastes were deposited, and even within geological media with supposedly poor attenuation potential, such as sandy overburden. The processes of degradation and attenuation operating within the plume result in the front of the plume becoming stationary as degradation processes keep pace with. The migration of plume, and most pollutants, even complex organic compounds, degrade rapidly within the plume and are attenuated within a few hundred metres (Christensen et al., 1995; Hancock et al., 1995).
In the process of developing a GIS model for landfill site selection (Allen et al., 2001), a survey of buffering distances used in various site selection criteria indicated that for individual dwellings with their own water wells in rural areas, a distance of 500 m was widely used, and except in extreme cases this would constitute a safe distance from a landfill for a water abstraction point. This distance could be reduced considerably on the upstream side of the landfill, if the direction of groundwater flow is known. Similarly, studies of leachate plumes (Christensen et al., 1994) indicate that they do not tend to exceed the width of the landfill, so the plume does not fan out from the landfill in the direction of groundwater flow. Where hydrogeological information is available, such as the type of aquifer, groundwater flow direction and flow velocity, considerably smaller buffer distances of the order of 100-200 m would be adequate on the upstream and lateral sides of the landfill. On the whole, when assessing whether a landfill is safely distant from a water abstraction point, a distance of 500 m would in most cases be adequate, whilst a distance of 1000 m would be extremely conservative.
In contrast to many other human activities which cause diffuse groundwater pollution potential, landfill concentrates this to point sources. This facilitates assessing their pollution potential through screening and monitoring programmes which do not necessitate sophisticated chemical analyses of the wide range of potentially occurring pollutants, but rather select a few persistent substances, such as NH3 and Cl, to detect and characterize leachate plume migration. Such an approach reflects the major influence that landfill leachate can exert on the abundance and concentration of individual substances present in groundwater. This is primarily valid for organic contaminants, which are almost exclusively anthropogenic, their presence in groundwater often indicating the influence of a waste site, but it is also valid for naturally occurring inorganic groundwater constituents, the content of which is increased by landfill leachate. Leachate migration can therefore be assessed by analysing the concentrations of common inorganic parameters in groundwater downgradient from a landfill in relation to their

356 Protecting Groundwater for Health
concentrations in groundwater sampled sufficiently upgradient, i.e. where it is not influenced by the landfill-derived contamination.
In order to rank the impact on groundwater of the leachate migrating from a landfill, Kerndorff et al. (1992) use a cf, representing the ratio of the measured concentration in the groundwater 10-100 m downgradient of the landfill to the concentration in the uncontaminated groundwater upgradient of the site. If the site is not leaking, or if the substance measured is not involved in the leakage event, the ratio should be 1.0. However, if the substance is leaking from the site, the ratio will increase to a value greater than 1.0. Thus the larger the leakage event, the larger the resultant cf. This approach identifies specific inorganic substances (those with the highest mean cfs) likely to be associated with landfill leakage events and therefore suitable for the indication of groundwater contaminations caused by landfills. In the above example, they proved to be the following: arsenic with a cfmean of 122, ammonium with 65.5, cadmium with 26.9, nitrite with 25.7, boron with 21.6, chromium with cfmean of 15.8, and nickel with 14.8. However, in using this approach it must be remembered that substances with high cfs are not necessarily those with the highest hazard potential nor those with the highest loads. They merely indicate the potential occurrence of groundwater contamination from a landfill with high loads of substances which may be hazardous due to their toxicity and/or persistency if they move through the aquifer towards a water supply.
12.5 CHECKLIST NOTE The following checklist outlines information needed for characte-
rizing waste disposal and landfill activities in the drinking-water catchment area. It supports hazard analysis in the context of developing a Water Safety Plan (Chapter 16). It is neither complete nor designed as template for direct use but needs to be specially adapted for local conditions. The analysis of the potential of groundwater pollution from human activity requires combining the checklist below with information about socioeconomic conditions (Chapter 7), aquifer pollution vulnerability (Chapter 8), and other specific polluting activities in the catchment area (Chapters 9-11 and 13).
Is waste disposed in the drinking-water catchment area?
Compile an inventory of sanitary landfills and legal or illegal uncontrolled waste disposal sites or dumps
Compile an inventory of sites potentially producing special types of waste, such as health care facilities, cemeteries, scrap yards, slaughterhouses, industries (consider checklist for Chapter 11)
Compile an inventory of sites storing, processing or treating wastes

Waste disposal and landfill: Potential hazards and information needs 357
Compile historic data from the areas and facilities of interest For each inventory, identify relevant procedures, processes,
responsibilities (who is in charge?) and substances/products in use Evaluate whether disposal sites were selected according to aquifer
vulnerability and physical conditions in the catchment area (e.g. water table, soil, hydrogeology); consider checklist for Chapter 8
…
What kind and which amounts of waste are disposed is the drinking-water catchment area?
Estimate the amount of wastes produced and deposited in the drinking-water catchment
For given deposits, assess the type and content of wastes (e.g. domestic, industrial, hospital) deposited
Assess the likelihood of disposal of hazardous substances (e.g. from industry or hospitals)
Estimate the amount and type of waste collected and deposited on controlled sites (sanitary landfills), unregulated dumps or that is randomly scattered
Check for indication of illegal wastes imported from other countries and their nature
…
What is the condition of the disposal sites?
Evaluate siting, design, construction and technical condition of individual waste disposal sites in relation to aquifer vulnerability and physical conditions in the catchment area (e.g. water table, soil, hydrogeology); consider checklist for Chapter 8
Check whether containment structures are in place and intact (e.g. lining) For sites with hazardous wastes, assess particularly the adequacy of
protective structures in place, e.g. defence wells, drainage, containment (see Chapter 24)
Assess the type of wastes and wastewater generated by these facilities and whether specific structures exist for separate collection of hazardous wastes or wastewater
Identify key structural and technical strengths and weaknesses of individual disposal sites in relation to their groundwater pollution potential (see also Chapter 24)
…

358 Protecting Groundwater for Health
Are good management practices in place?
Note: See Chapter 24 for the background information for these items Check whether waste management concepts are in place, e.g. for waste
reduction and waste separation Assess whether implementation of such waste management concepts is
satisfactory Check whether regulations are well known by administration and other
staff Check whether broader environmental management concepts pertinent to
waste disposal are understood Identify key strengths and weaknesses of the management practices
implemented Assess whether containment structures for hazardous agents are intact and
monitored at adequate intervals Check whether regular information is distributed, and whether training
with respect to handling of wastes is adequate Check whether principles of good practice are followed by health care
and research units working with highly infectious material and/or hazardous substances
…
Are hazardous events likely to increase groundwater pollution potential?
Evaluate whether and how storm water events would enhance transport of pollutants to the aquifer
Evaluate which spills and accidents are likely to cause groundwater pollution
…
Is drinking-water abstracted in proximity to waste disposal sites?
Determine the direction and magnitude of the local hydraulic gradient, and whether drinking-water wells are upgradient or downgradient of the waste depository
Assess distance between (formal and informal) waste disposal sites and drinking-water wells (see Chapter 8)
Check adequacy of wellhead protection measures, wellhead construction and maintenance as well as sanitary seals used (see Chapter 18) to prevent ingress of contaminants from waste disposal sites
…

Waste disposal and landfill: Potential hazards and information needs 359
Are groundwater quality data available to indicate pollution from waste disposal activities?
Find out if leachate and/or groundwater monitoring programmes are in place around waste disposal sites
Check whether seasonal leachate patterns are expected in relation to precipitation
Compile data from local or regional waste disposal surveys, research projects or previous monitoring programs
Check need and options for implementation of new or expanded monitoring programs likely to detect contamination from waste disposal facilities
…
What regulatory framework exists for waste disposal?
Compile information on national, regional, local or catchment area specific legislation, regulations, recommendations or common codes of good practices on siting, construction, operation, maintenance of sites
Check whether a regulatory framework exists for waste avoidance, waste separation, and particularly for waste disposal, and whether enforcement appears sufficient to protect groundwater
Check whether the regulatory framework adequately addresses environmental and specifically groundwater protection
Identify gaps and weaknesses known which may encourage specific pollution problems
If wastes are imported, check whether this is due to stricter regulations in the country of origin, and whether the imports are legal
…
Documentation and visualization of information on waste disposal practices.
Compile summarizing report and consolidate information from checklist points above
Compile summary of types and amounts of substances expected from the specific waste disposal sites and sites potentially producing special types of waste
Map formal and informal waste disposal sites and sites potentially producing special types of waste, preferably including suspected ‘hot spots’ of contamination (use GIS if possible)
…

360 Protecting Groundwater for Health
12.6 REFERENCES Ali, M., Cotton, A. and Westlake, K. (1999) Down to Earth: Solid waste disposal for low-income
countries, WEDC, Loughborough. Allen, A.R. (2001) Containment landfills: The myth of sustainability. J. Eng. Geol., 60, 3-19. Allen, A., Brito, G., Caetano, P., Costa, C., Cummins, V., Donnelly, J., Fernandes, C., Koukoulas,
S., O'Donnell, V., Robalo, C. and Vendas, D. (2001) The Development of a GIS Model for the Location of Landfill Sites in Ireland and Portugal. Final Report Interreg 2C Atlantic Region, EA-B1IRE-No.2.15, Cork.
Attahi, F. (1999) Abidjan, Côte d'Ivoire. In Managing the Monster: Urban waste and governance in Africa, (ed. A.G. Onibokun), pp. 11-48, IDRC, Ottawa.
Ball, J.M. and Novella, P.H. (2003) Coastal Park Landfill: leachate plume migration and attenuation. In Proc. Sardinia 2003, Ninth International Landfill Symposium, (eds. T.H. Christensen, R. Cossu and R. Stegmann), CISA Publisher, Cagliari.
Barrett, A. and Lawlor, J. (1995) The Economics of Waste Management in Ireland, Economic and Social Research Institute, Dublin.
Blight, G.E. (1995) Ground-water pollution from a landfill in a semi-arid climate. In Proc. Sardinia 95, Fifth International Landfill Symposium (eds. T.H. Christensen, R. Cossu, and R. Stegmann), vol. 3, pp. 593-599, CISA Publisher, Cagliari.
Butler, A.P., Brook, C., Godley, A., Lewin, K. and Young, C.P. (2003) Attenuation of landfill leachate in unsaturated sandstone. In Proc. Sardinia 2003, Ninth International Landfill Symposium, (eds. T.H. Christensen, R. Cossu and R. Stegmann), CISA Publisher, Cagliari.
Christensen, T.H., Kjeldsen, P., Albrechtsen H-J., Heron, G., Bjerg, P.L. and Holm, P. (1994) Attenuation of landfill leachate pollution in aquifers. Crit. Rev. in Environ. Sci. Technol., 24, 119-202.
Christensen, T.H., Nielsen, P.H. and Bjerg, P.L. (1995) Degradation of organic chemicals in a leachate pollution plume: an in-situ experiment. In: Proc. Sardinia 95, Fifth International Landfill Symposium, (eds. T.H. Christensen, R. Cossu, and R. Stegmann), vol. 3, pp. 621-628, CISA Publisher, Cagliari.
Christensen, J.B., Jensen, D.L., Grøn, C., Filip, Z. and Christensen, T.H. (1998) Characterisation of the dissolved organic carbon fraction in landfill leachate-polluted groundwater. Water Res., 32(1), 125-135.
Corry, J.E.L. (1978) Possible sources of ethanol ante- and post-mortem: its relationship to the biochemistry and microbiology of decomposition. J. Appl. Bacter., 44, 1-56.
Council of European Communities (1980) Directive on the protection of groundwater from certain dangerous substances. Official J. European Communities, L20(26), 43.
Douglas, T. (1992) Patterns of land, water and air pollution by waste. In Managing the Human Impact on the Natural Environment, (ed. M. Newson), pp. 150-171, John Wiley & Sons, New York.
European EA (2003) Europe’s Environment: The third assessment. Environmental Assessment Report, No. 10, pp. 151-164, EEA, Copenhagen.
Ehrig, H.J. (1982) Quality and quantity of sanitary landfill leachate. Waste Man. Res., 1, 53-68. Fetter, C.W. (1993) Contaminant Hydrogeology, Prentice-Hall, New Jersey. Fourie, A.B. and Morris, J.W.F. (2003) The irrelevance of time as a criterion for aftercare provision.
In Proc. Sardinia 03, Ninth International Waste Management and Landfill Symposium, (eds. T.H. Christensen, R. Cossu and R. Stegmann), CISA Publisher, Cagliari.
Freeze, R.A. and Cherry, J.A. (1979) Groundwater, Prentice-Hall, New Jersey. Hancock, J.S., Phillips, J.R. and Seignior, M. (1995) In Proc. Sardinia 95, Fifth International
Landfill Symposium, (eds. T.H. Christensen, R. Cossu and R. Stegmann), vol. 3, pp. 611-620, CISA Publisher, Cagliari.
Hjelmar, O., Johannsen, L.M., Knox, K., Ehrig, H.J., Flyvbjerg, J., Winther, P. and Christensen, T.H. (1995) Composition and management of leachate from landfills within the EU. In

Waste disposal and landfill: Potential hazards and information needs 361
Proceedings Sardinia 95, Fifth International Landfill Symposium, (eds. T.H. Christensen, R. Cossu and R. Stegmann), vol. 1, pp. 243-262, CISA Publisher, Cagliari.
Jefferis, S.A. (1993) Old landfills: perceptions and remediation of problem sites. In Waste Disposal by Landfill, (ed. R.W. Sarsby), pp. 93-106, Balkema, Rotterdam.
Johnson, C.A., Richner, G.A., Vitvar, T., Schittli, N. and Eberhard, M. (1998) Hydrological and geochemical factors affecting leachtae composition in municipal solid waste incinerator bottom ash Part I: The hydrology of landfill Lostorf, Switzerland. J. Contam. Hydrol., 33, 361-376.
Kerndorff, H., Schleyer, R., Milde, G. and Plumb Jr., R.H. (1992) Geochemistry of groundwater pollutants at German waste disposal sites. In Groundwater Contamination and Analysis at Hazardous Waste Sites, (eds. S. Lesage and R. Jackson), vol. 4, pp. 245-271, Environmental Science and Pollution Control Series, Marcel Dekker Inc., New York.
Kruempelbeck, I. and Ehlrig, H-J. (1999) Long-term behaviour of municipal solid waste landfills in Germany. In Proc. Sardinia 99, Seventh International Waste Management and Landfill Symposium, (eds. T.H. Christensen, R. Cossu and R. Stegmann), vol. 1, pp. 27-36, CISA Publisher, Cagliari.
Lusugga Kironde, J.M. (1999) Dar es Salaam, Tanzania. In Managing the Monster: Urban waste and governance in Africa, (ed. A.G. Onibokun), pp. 101-172, IDRC, Ottawa.
Mackenzie, D. (1989) If you can't treat it, ship it. New Scientist, 122, 1658. National Rivers Authority (1992) Policy and Practice for the Protection of Groundwater, NRA,
Bristol. Onibokun, A. and Kumuyi, A.J. (1999) Ibadan, Nigeria. In Managing the Monster: Urban Waste
and Governance in Africa, (ed. A.G. Onibokun), pp. 49-100, IDRC, Ottawa. OECD (1993) Environmental Data, Compendium 1993. OECD, Paris. OECD (1997) Environmental Data, Compendium 1997. OECD, Paris Pacheco, A., Mendes, J.M.B., Martins,T., Hassuda, S. and Kimmelmann, A.A. (1991) Cemeteries -
a potential risk to groundwater. Water Sci. Technol., 24(11), 97-104. Riediker, S., Suter, J.-F. and Giger, W. (2000) Benzene- and naphthalene-sulphonates in leachates
and plumes of landfills. Water Res., 34(7), 2069-2079. Robinson, H.C., Barber, C. and Maris, P.J. (1982) Generation and treatment of leachate from
domestic wastes in landfills. Water Pollution Control, 54, 465-478. Robinson, H.C., Carey, M., Watson, G. and Gronow, J. (1999) In-situ monitoring of the unsaturated
zone beneath Stangate East Landfill Site: Sixteen years of detailed data. In Proc. Sardinia 99, Seventh International Waste Management and Landfill Symposium, (eds. T.H. Christensen, R. Cossu, and R. Stegmann), vol. IV, pp. 117-124, CISA Publisher, Cagliari.
Röhrs, L.H., Fourie, A.B. and Blight, G.E. (2000) Is 30 years an appropriate after-care period for Municipal Landfills. In Proc. ‘WasteCon 2000’, Somerset West, South Africa, vol. 2, pp. 369-378, Institute of Waste Management, Somerset West.
Sangodoyin, A.Y. (1993) Considerations on contamination of groundwater by waste disposal systems in Nigeria. Environ. Technol., 14, 957-964.
Spongberg, A.L. and Becks, P.M. (2000) Inorganic soil contamination from cemetery leachate. Water, Air and Soil Pollution, 117(1-4), 313-327.
Tchobanoglous, G., Thiesen, H. and Vigil, S. (1993) Integrated Solid Waste Management Engineering Principles and Management Issues, McGraw-Hill.
Teale, T.P. (1881) Dangers To Health. A Pictorial Guide to Domestic Sanitary Defects, Churchill, London.
Üçisik, A. S. and Rushbrook, P. (1998) The Impact of Cemeteries on the Environment and Public Health: An Introduction Briefing. World Health Organization, Copenhagen.
US EPA (1974) Safe Drinking Water Act, Code: 42 USC. s/s 300f et seq., Washington, DC. Wall, D.K. and Zeiss, C. (1995) Municipal waste degradation and settlement. J. Env. Eng., 121,
214-223.
362 Protecting Groundwater for Health
West, J. M., Pedley, S., Baker, S. J., Barrott, L., Morris, B., Storey, A., Ward, R. S. and Barrett, M.H. (1998) A Review of the Impact of Microbiological Contaminants in Groundwater. UK EA, R&D Technical Report, Bristol.
Western, K. (2004) Health considerations in cases of mass fatalities. In Management of Dead Bodies in Disaster Situations, Disaster Manuals and Guidelines Series, Nº 5, Pan American Health Organization, Washington, D.C.
Williams, G.M. (1999) Natural attenuation of contaminants in a lacustrine sand aquifer at Villa Farm, UK. In Proc. Sardinia 99, Seventh International Landfill Symposium, (eds. T.H. Christensen, R. Cossu and R. Stegmann), Vol IV, pp. 229-236, CISA Publisher, Cagliari.
Williams, G.M., Boland, M.P., Higgo, J.W., Ogilvy, R.D., Klinck, B.A., Noy, D.J. and Hart, P. (1999) Effect of old landfills on groundwater quality. In Proc. Sardinia 99, Seventh International Landfill Symposium (eds. T.H. Christensen, R. Cossu and R. Stegmann), vol. IV, pp. 125-132, CISA Publisher, Cagliari.

© 2006 World Health Organization. Protecting Groundwater for Health: Managing the Quality of Drinking-water Sources. Edited by O. Schmoll, G. Howard, J. Chilton and I. Chorus. ISBN: 1843390795. Published by IWA Publishing, London, UK.
13
Traffic and transport: Potential hazards and information needs
A. Golwer and R. Sage
Vehicles and traffic routes are a widespread potential source of groundwater contamination. In some countries, economic development is currently swiftly leading to rapid increase of motorization and concomitant increases in pollution. Impacts on human health through contaminants in groundwater from traffic are generally substantially lower than the direct health effects through, for example, injuries and deaths in accidents, air pollution, noise and stress.
NOTE Traffic and transport related activities and the environment in which they take place vary greatly. Health hazards arising from traffic and transport related activities and their potential to pollute groundwater therefore need to be analysed specifically for the conditions in a given setting. The information in this chapter supports hazard analysis in the context of developing a Water Safety Plan for a given water supply (Chapter 16). Options for controlling these risks are introduced in Chapter 25.

364 Protecting Groundwater for Health
Traffic associated operations and facilities to recognize in situation assessments include roads, airfields, railway lines, inland waterway transportation (rivers, lakes, canals) where surface water strongly influences groundwater, as well as pipelines for crude oil and oil derivatives (Figure 13.1).
kerosenehydrocarbonshydrocarbons
Cl
herbicides
satu
rate
d zo
neun
satu
rate
dzo
ne
NaCl metals nitrogen
well
nitrogen
Figure 13.1. Most important groundwater contamination pathways from traffic and transport
A range of emissions of organic and inorganic substances from traffic settings may reach soils, sediments from drainage systems or surface waters via both water and air. Some of these may partly reach groundwater. The sources of groundwater pollution from the four traffic sectors may be classified according to types of traffic as well as different aspects of activity related to traffic, as outlined in Figure 13.2.
In addition to traffic routes as linear sources of emissions, transport installations and facilities, especially petrol stations, railway stations, airfields, inland harbours, car scrap yards and abandoned vehicles, may be substantial point sources of groundwater pollution. In some regions vehicle traffic, fuel storage and spills through accidents have been identified as important sources of traffic-related contaminants in groundwater.
13.1 GROUNDWATER POLLUTANTS FROM TRAFFIC The volume of traffic obviously has a significant influence on the quantity and type of traffic-related pollution. Average daily traffic volume is an appropriate criterion for classifying roads in categories with different levels of potential pollution risk. Golwer (1991) proposes a classification of risk ranging from low (less than 2000 vehicles per day) to high (more than 15,000 vehicles per day). The traffic-related substance groups most frequently polluting groundwater are mineral oil products (including fuel additives such as methyl tertiary-butyl ether; MTBE), in many cases herbicides, and in specific situations heavy metals and de-icing agents.

Traffic and transport: Potential hazards and information needs 365
Figure 13.2. Traffic sectors and potential groundwater pollution sources
The condition and technical design of the traffic related infrastructure are critical in
determining their pollution potential. Issues for situation assessment include assessing whether this infrastructure was designed to prevent or minimize pollution as well as whether or not maintenance and repair are conducted regularly. For instance, oil separators that have become full of grit will no longer work. Porous pavement materials may aid in minimizing direct runoff, but could carry pollutants directly to vulnerable groundwater sources. Other issues to consider in situation assessment are whether containment features are in use on transfer and fuelling locations, for example, how sewerage is moved from ships and trains to a point of treatment, whether there is a possibility of spillage and where such spillage would end up.
The input of dissolved mineral oil hydrocarbons – and of their decomposition products – into groundwater is dependent on the biological half-life of individual

366 Protecting Groundwater for Health
substances as well as climate and time of year. On busy roads in winter, in areas where the unsaturated zone provides little protection, mineral oil hydrocarbons have caused substantial groundwater contamination. Mineral oil hydrocarbons affect groundwater not only along roads, but particularly around petrol stations, airfields and railway stations. Accidents involving the transport of mineral oil and leaking long-distance pipelines (Morganwalp, 1994) have resulted in heavy local contamination, and have also affected groundwater quality through reduction in oxygen content (Schwille, 1976). Further, accident responses involving large volumes of water for extinguishing fires or removing contaminants may increase contaminant transport to the aquifer. Other contaminant sources such as abraded particles from tyres as well as exhaust gas and evaporation losses, generally have a low impact on groundwater though they may be re-deposited on soil surfaces and leached into the soil.
In addition to these fuel-derived contaminants, anti-knock agents have been widely detected in groundwater. These include lead and later MTBE and toluene which have replaced lead since the 1970s in the USA and later also in Europe. These are highly water-soluble and have been widely reported as pollutants related to accidental spillages and leaks from filling stations. Their health-relevance is briefly discussed in Chapter 4. Further, they serve as suitable tracers for traffic-related contamination.
For traffic safety on roads and airfields at temperatures below freezing, de-icing agents are widely employed. On roads, de-icing salts (mainly sodium chloride and lower levels of calcium chloride and magnesium chloride) have been used widely since the beginning of the 20th century. These are particularly found to be polluting in rural areas where roads are drained to soakaways. Whilst chloride itself is not a health hazard, its presence can be an indicator of other pollution from traffic. However, with greatly increased chloride concentrations, the mobility of zinc and cadmium can be increased through the formation of chloro-complexes (Bauske and Goetz, 1993).
On airports, nitrogenous de-icing agents, e.g. urea, have been employed since the mid 1970s. This has led to local high nitrate concentrations in groundwater and in some cases has required extensive remediation measures. Degradation of nitrate may produce nitrite and also ammonium. In the 1990s, non-nitrogenous agents (sodium and potassium acetates and formates) increasingly replaced nitrogenous de-icing agents. Propylene glycol and diethylene glycol are used for de-icing aircraft, which if not properly contained can also lead to pollution of both surface and groundwaters. In climates with frost, situation assessment should include airports as areas potentially contaminated not only with fuel, but also with de-icing agents.
Training areas for fire fighting on airports may give rise to special cases of pollution, especially if drainage from the area is not contained properly and not removed for treatment. The use of chemicals to aid in fire fighting and the large volumes of water involved can lead to contamination of the surrounding area. Even if the fire training areas are connected to a sewer system, leakage from this system and spray drift from the area can result in localized contamination of the soil and underlying aquifers. The associated chemicals will depend on the type of fire extinguisher agents used. Carbon tetrachloride/tetrachloromethane (CTC) and anionic synthetic detergents are frequent pollutants from such operations.

Traffic and transport: Potential hazards and information needs 367
Railways, roads, parking lots and airports are sometimes kept clear of vegetation with repeated herbicide application. These have been detected in groundwater in their original form or as degradation products. The quantity of herbicide used at traffic facilities per unit area is often higher than in agriculture, and herbicides can swiftly enter surface waters and groundwater through drainage systems (Schweinsberg et al., 1999). This organic substance group therefore poses a pronounced and widespread contamination hazard for groundwater, which is frequently unrecognized due to lack of targeted investigations. The substances used, e.g. atrazine (now banned in some European countries), diuron and bromacile may be alternated to avoid plant resistance to the active ingredient. In the United Kingdom, lengths of railway track crossing catchment areas for public supply boreholes, and draining to critical stretches of rivers, have been identified as potential sources of pollution.
Heavy metals specifically emitted from traffic are lead, cadmium, chromium, copper, nickel and zinc. Among these, generally even from sites with heavy traffic volume, only zinc and copper intermittently reach groundwater in amounts causing considerably increased concentrations, although a wider range may occur. In the groundwater downgradient of a basin collecting and infiltrating runoff from a very busy motorway (daily average of 125 560 vehicles in 1995) into porous soils since 1973, many substances were found in elevated concentrations as compared to upstream (Golwer, 1999). Even if concentrations are below levels hazardous to human health, their increase indicates a pollution pathway and the need for due regard to spillages and other releases.
13.2 TRAFFIC- AND TRANSPORT-RELATED ACTIVITIES POLLUTING GROUNDWATER
In addition to traffic and transport itself, construction and maintenance of transport associated facilities may cause considerable pollution of groundwater (Figure 13.2). Construction of transport lines and sites (including airports and harbours as well as roads, railways and canals) can change flowpaths and percolation patterns by relocating soil. It can lead to pollution through injuring the protective layers above the aquifer, as well as through construction activity. Refuelling and associated spillage often cause localized contamination and in sensitive areas construction of such refuelling points should be assessed for leakage and spillage. In addition to accidental spillages on the route line there may also be pollution from provisional quarters for construction workers, particularly with human excreta. As these are often only temporary facilities, they may not be subject to the same level of scrutiny or assessment as a permanent installation. Siting of such construction compounds should be subject to pollution risk assessments and adequate mitigation measures implemented.
Maintenance measures with the potential to cause pollution may include washing of tunnel surfaces which produces runoff with high contaminant concentrations, or detergents used in cleaning traffic signs. Other facilities such as refuelling depots, filling stations, car wash facilities, roadside cafes and service stations all have the potential to pollute groundwater. In vulnerable sites, situation assessment includes checking whether

368 Protecting Groundwater for Health
they are constructed properly, e.g. with spillage and runoff containment and adequate treatment.
Major pollution incidents have resulted from leakage from underground storage tanks and pipelines. These may not be detected for some time and once detected can require a significant amount of remedial action to clear up the pollution. In most cases, fuel products do not move very far from the point of pollution (at low field velocities less than 100 m) unless a preferential pathway is available. However, dissolved compounds and degradation by-products can pollute significant volumes of aquifer and be difficult to remediate. Fuel additives such as MTBE are extremely water soluble and can be detected in low concentrations over very wide areas.
13.3 PATHWAYS OF POLLUTANTS INTO GROUNDWATER
Though vehicle traffic often emits substantial amounts of airborne organic substances which deposit on the soil surface, it has been shown that this generally results in negligible impact on groundwater quality, since deposition rates from air are relatively low and the protective effect of the unsaturated zone results in sufficient reduction of concentration (Schleyer and Raffius, 2000). Nitrogen oxides from vehicle exhaust emission, however, contribute considerably to acidification of precipitation in some areas. Where soils have poor buffering capacity, this pollution can influence particularly the quality of shallow groundwater by mobilizing metals such as aluminium. Thus situation assessment may need to include vulnerability to soil acidification and mineral mobilization in areas with heavy air pollution through traffic.
Dispersion of traffic-borne pollutants from surfaces into water occurs intermittently and is strongly linked to rainfall and temperature. Obviously, at temperatures below freezing, pollutants will not be transported in water. At rainfalls of less than 0.5 mm, runoff from impermeable traffic-area surfaces generally does not occur. However, pollutants deposited on surfaces during dry periods or frost accumulate and the first rainfall or snow melt flushes these into the soil or into runoff collection systems. Most pollution from traffic routes generally occurs within 10 m of the route, and thus they can be considered as linear sources.
Where runoff from paved traffic surfaces is collected in retention basins, these may themselves be significant sources of groundwater pollution through seepage or leakage. Beneath infiltration basins percolation may occur either intermittently or continuously, usually in a vertical direction.
In the zone of percolation substance dispersion depends on distribution of precipitation and soil temperature. Because of the filtration effect, particles and particle adsorbed substances (e.g. platinum, lead, polycyclic aromatic hydrocarbons) are largely retained in the upper centimetres and decimetres of soils. Infiltration rates can be considerably higher alongside permeable traffic surfaces and on the edge or bottom of infiltration basins than in adjacent areas with soils and rocks of comparable texture, as the larger quantity of water per unit of area often leads to increased permeability through solution and removal of fine particles by the increased velocities. Dead leaf matter can be

Traffic and transport: Potential hazards and information needs 369
broken up by tyre action and concentrated on the sides of roads, leading to enhanced leaching of humic acids. Atmospheric deposition of pollutants accumulating on paved surfaces can also be a pathway for pollutants into the groundwater system.
Once pollutants reach groundwater, their dispersion and concentration chiefly depend on substance loading and its characteristics, as well as on the hydrogeological characteristics in the specific setting, as discussed in Chapters 2 and 4. Substance characteristics (especially water-solubility, volatility, sorption, as well as biological and photochemical degradation) are of decisive importance for retention, conversion and dilution processes during subsoil passage.
Climatic conditions fundamentally influence substance dispersion and, to some extent indirectly, substance inventory, as explained above. Climate also determines rates of degradation (which are frequently temperature-dependent and thus higher in the tropics), patterns of substance dispersion into groundwater, patterns of dilution and human activities, such as the extent of application of de-icing agents or herbicides.
13.4 CHECKLIST
NOTE The following checklist outlines information needed for characterizing traffic and transport related activities in the drinking-water catchment area. It supports hazard analysis in the context of developing a Water Safety Plan (Chapter 16). It is neither complete nor designed as a template for direct use but needs to be specially adapted for local conditions. The analysis of the potential of groundwater pollution from human activity requires combination of the checklist below with information about socioeconomic conditions (Chapter 7), aquifer pollution vulnerability (Chapter 8), and other specific polluting activities in the catchment area (Chapters 9-12).
Are transport related facilities and traffic routes present in the drinking-water catchment area?
Compile inventory of roads, parking lots, refuelling stations, fuel storage tanks and pipelines, car wash, car scrap yards, airfields, railway lines and stations, inland harbours, canals
Evaluate siting of individual traffic facilities in relation to aquifer vulnerability; consider checklist for Chapter 8
Check for presence of abandoned sites (particularly for storage of fuels and maintenance chemicals) that could still be contaminating groundwater
…

370 Protecting Groundwater for Health
How high is traffic intensity and its potential to pollute groundwater?
Assess vehicle traffic information on traffic volume (e.g. daily traffic volume on roads), transport of hazardous goods, accident rates
Assess whether accident prevention measures (e.g. crash barriers, speed limits and their implementation) are adequate in relation to traffic volume and groundwater vulnerability
Check availability and implementation of accident response plans to restrict groundwater contamination with fuel or hazardous goods
…
Are the transport-related facilities and traffic lines in good condition?
Assess adequacy of design, construction and technical condition of transport-related facilities with respect to protecting groundwater from pollution, e.g. pavement, drainage system for collection of runoff, runoff treatment, containment for filling stations and car wash runoff, collection and disposal of sewage on trains and ships
…
Is there transport related construction in the drinking-water catchment area?
Consider impact of physical change of protective layers and permeability to shallow aquifers caused by construction
Assess risk of aquifer pollution with fuel, lubricants and hydraulic oil from construction machines
Assess availability of sanitation for construction workers Check waste removal and disposal from construction sites Check whether there is storage and processing of potentially hazardous
construction materials Assess design of and protection for re-fuelling areas …
What maintenance practices for traffic routes might contaminate groundwater?
Check whether application of herbicides on railway lines, de-icing agents on roads and airfields, cleaning agents for road signs or tunnel walls is practised
Check adequacy of design, construction and maintenance of storage and cleaning facilities for these agents, e.g. for herbicides used on railway lines
Traffic and transport: Potential hazards and information needs 371
Evaluate whether good practice is used in the handling and application of such agents, whether these are regularly checked and verified, and whether their application is minimized to ensure no excess is available for pollution
…
Are hazardous events likely to increase groundwater pollution potential?
Evaluate whether (and how) storm water events would enhance transport of pollutants to the aquifer
Evaluate which spills and accidents are likely to cause groundwater pollution
…
Is drinking-water abstracted in proximity to traffic facilities?
Assess distance between traffic facilities and drinking-water abstraction (see Chapter 8)
Check adequacy of wellhead protection measures, wellhead construction and maintenance as well as sanitary seals used (see Chapter 18) to prevent ingress of contaminants from traffic
…
Are groundwater quality data available to indicate pollution from traffic?
Compile data, particularly chemical analyses, from local or regional surveys, research projects or previous monitoring programmes
Check for implementation of new or expanded monitoring programmes likely to detect contamination from traffic
…
What regulatory framework exists for traffic?
Compile information on national, regional, local, or catchment area specific legislation, regulations, recommendations, or common codes of good practices on siting, construction, operation, maintenance of traffic facilities and on restrictions, ban or prohibition of substances applied on traffic settings
Compile regulations and permits to transport hazardous substances Check whether the regulatory framework adequately addresses
environmental and specifically groundwater protection

372 Protecting Groundwater for Health
Identify gaps and weaknesses known which may encourage specific pollution problems
…
Documentation and visualization of information on traffic settings.
Consolidate information from checklist points above and compile in a summarizing report
Map traffic routes, preferably including average daily traffic volume, road drainage and runoff retention ponds (use GIS if possible)
Map locations of airports, parking lots scrap yards, filling stations and pipe line routes, preferably including suspected ‘hot spots’ of contamination (use GIS if possible)
…
13.5 REFERENCES Bauske, B. and Goetz, D. (1993) Effects of de-icing-salts on heavy metal mobility. Acta
Hydrochim. Hydrobiol., 21, 38-42. Golwer, A. (1991) Belastung von Böden und Grundwasser durch Verkehrswege. Forum Städte-
Hygiene, 43, 266-275. Golwer, A. (1999) Beeinflussung der Grundwasserbeschaffenheit durch Straßenverkehr in
Wasserschutzgebieten. Geol. Jb. Hessen, 127, 131-146. Morganwalp, B.W. (1994) Groundwater contamination from injection wells and pipelines. In
Groundwater Contamination and Control, (ed. U. Zoller), pp. 399-423, Marcel Dekker Inc., New York.
Schleyer, R. and Raffius, B. (2000) Grundwassergefährdung durch organische Luftschadstoffe. DVWK-Materialien, 1/2000, 385.
Schweinsberg, F., Abke, W., Rieth, K., Rohmann, U. and Zullei-Seibert, N. (1999) Herbicide use on railway tracks for safety reasons in Germany. Toxicology Letters, 107, 201-205.
Schwille, F. (1976) Anthropogenically Reduced Groundwaters. Hydrol. Sci. Bull., XXI (4), 629-645.