understanding the ela parent report - west islip public ... · new york state testing program...
TRANSCRIPT

New York State Testing Program
Common Core
English Language Arts Test
Understanding the
English Language Arts Parent Report
August 2013
Note: The scale score and "Points Earned By Your Child" for subscores are provided for illustrative purposes only. All other reported numbers reflect actual state performance.
THE STATE EDUCATION DEPARTMENT / THE UNIVERSITY OF THE STATE OF NEW YORK / ALBANY, NY
12234
New York State Testing Program Common Core English Language Arts Test
Understanding the English Language Arts Parent Report
With the adoption of the New York P-12 Common Core Learning Standards (CCLS) in English Language Arts (ELA)/Literacy and Mathematics, the Board of Regents signaled a shift in both instruction and assessment. In Spring 2013, New York State administered the first set of tests designed to assess student performance in accordance with the instructional shifts and the rigor demanded by the Common Core State Standards (CCSS). To aid in the transition to new tests, New York State released a number of resources during the 2012-2013 year, including test blueprints and specifications, sample questions, and criteria for writing test questions. Now that we have administered the first tests, we are providing this document to explain reports that families receive for both the Spring 2013 ELA and Mathematics tests. These annotated score reports will help students, families, educators, and the public better understand how to interpret the 2013 score reports.
Understanding the ELA Parent Report Each year, students in grades 3–8 take the ELA Common Core Test. After the test, families receive a report that explains how their child performed. This document explains the parts of that score report. This document uses a grade 3 score report as an example. For ELA, the same subscores are reported across all grades: Reading and Writing from Sources. There is only one difference in the ELA score reports across grades 3 – 8: the total number of possible points per subscore. The number of subscore points for each grade are presented in Table 1 at the end of the document as a reference.
Note: The scale score and "Points Earned By Your Child" for subscores are provided for illustrative purposes only. All other reported numbers reflect actual state performance.
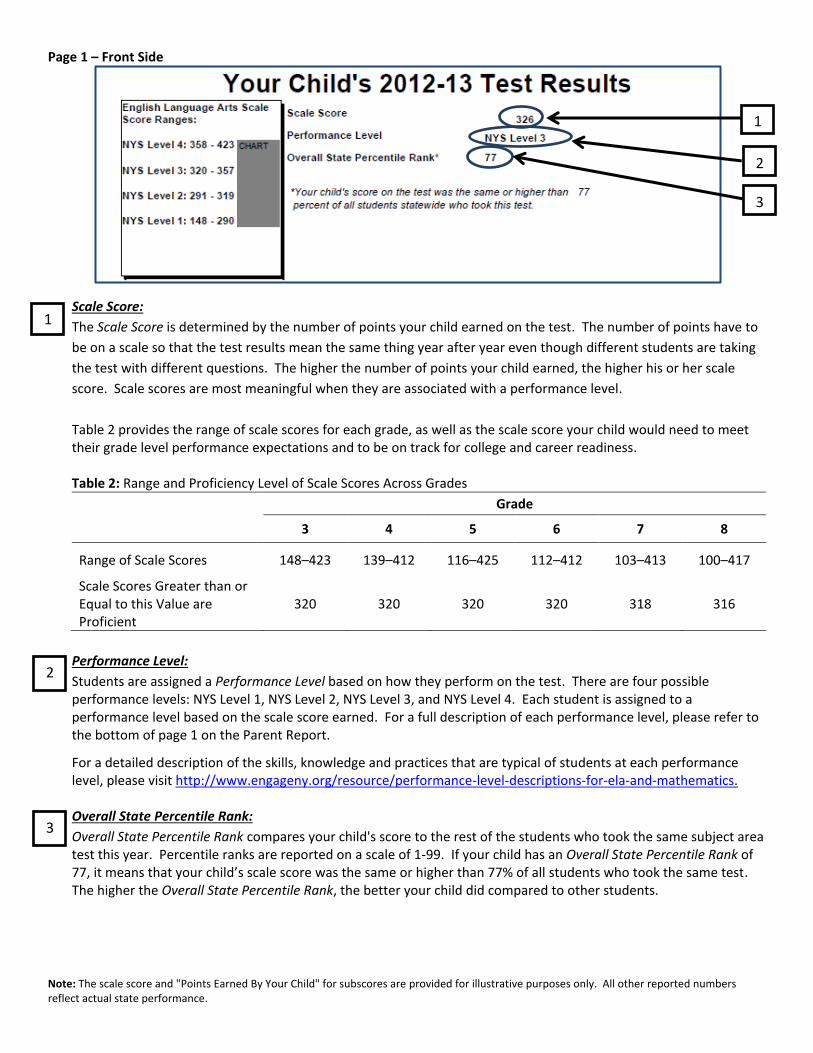
Page 1 – Front Side
Scale Score:
The Scale Score is determined by the number of points your child earned on the test. The number of points have to
be on a scale so that the test results mean the same thing year after year even though different students are taking
the test with different questions. The higher the number of points your child earned, the higher his or her scale
score. Scale scores are most meaningful when they are associated with a performance level.
Table 2 provides the range of scale scores for each grade, as well as the scale score your child would need to meet their grade level performance expectations and to be on track for college and career readiness. Table 2: Range and Proficiency Level of Scale Scores Across Grades
Grade
3 4 5 6 7 8
Range of Scale Scores 148–423 139–412 116–425 112–412 103–413 100–417
Scale Scores Greater than or Equal to this Value are Proficient
320 320 320 320 318 316
Performance Level:
Students are assigned a Performance Level based on how they perform on the test. There are four possible performance levels: NYS Level 1, NYS Level 2, NYS Level 3, and NYS Level 4. Each student is assigned to a performance level based on the scale score earned. For a full description of each performance level, please refer to the bottom of page 1 on the Parent Report.
For a detailed description of the skills, knowledge and practices that are typical of students at each performance level, please visit http://www.engageny.org/resource/performance-level-descriptions-for-ela-and-mathematics. Overall State Percentile Rank:
Overall State Percentile Rank compares your child's score to the rest of the students who took the same subject area test this year. Percentile ranks are reported on a scale of 1-99. If your child has an Overall State Percentile Rank of 77, it means that your child’s scale score was the same or higher than 77% of all students who took the same test. The higher the Overall State Percentile Rank, the better your child did compared to other students.
1
2
3
1
2
3

Note: The scale score and "Points Earned By Your Child" for subscores are provided for illustrative purposes only. All other reported numbers reflect actual state performance.
Page 2- Back Side
Reading and Writing from Sources Subscores Subscores are calculated based on points earned on groups of questions on the test that measure similar or related
knowledge or skills. Subscores provide additional information about how your child performed. The points from the
ELA test are divided into Reading and Writing from Sources. The Reading subscore provides a general sense of your
child’s performance on multiple-choice questions that measure Reading. These Reading questions measure learning
standards in both reading and language conventions. The Writing from Sources subscore is based on the points
your student earned on short (2 point) and extended (4 point) writing questions. Writing from Sources questions
measure learning standards in writing, reading, and language conventions.
A grade 3 score report is provided as an example. Because the score reports for all grades on the ELA assessment
present the same information, these interpretations apply to grades 3 – 8.
For examples of questions from the 2013 ELA test from grades 3 – 8, please visit
http://www.engageny.org/resource/new-york-state-common-core-sample-questions
Points Earned By Your Child on Reading
Points Earned by Your Child on Reading represents the number of questions measuring reading that your child has
answered correctly. Each question that your child answered correctly earns one point. For example, if your child
correctly answers 20 questions that measure Reading, he or she will have a 20 for Points Earned by Your Child on
Reading.
Number of Possible Points on Reading
Number of Possible Points on Reading describes the total number of questions measuring Reading on the 2013
Grade 3 ELA test. This can be compared with Points Earned By Your Child on Reading. For example, if your child
correctly answered 20 questions out of 31, the Number of Possible Points on Reading, then he or she answered 11 of
the questions incorrectly.
5 6 7
4
4
5
6
8 9 10

Note: The scale score and "Points Earned By Your Child" for subscores are provided for illustrative purposes only. All other reported numbers reflect actual state performance.
For more information about how many questions measuring Reading were included on the test, please refer to
http://www.engageny.org/resource/test-guides-for-english-language-arts-and-mathematics.
Average Points Earned Across NY on Reading
The Average Points Earned Across NY on Reading reports the average number of points earned by students
throughout the state. This number can be used to compare how your child compared to the other students who
took the ELA test. For example, if your child earned 20 points in Reading, he or she has correctly answered three
more Reading questions than the average student in the state. However, please note that it is possible to earn
more points than average in Reading and still be considered not proficient.
Points Earned by your Child on Writing from Sources
Points Earned by your Child on Writing from Sources represents the number of points earned on questions
measuring Writing from Sources. Questions that measure Writing from Sources include two types of constructed-
response questions: short-response (maximum of 2 points) and extended-response (maximum of 4 points).
Teachers rate each student's response to these questions. The points earned on each question are totaled to
determine Points Earned by your Child on Writing from Sources.
Number of Possible Points on Writing from Sources
Number of Possible Points on Writing from Sources describes the total number of points a student can earn on
questions measuring Writing from Sources on the 2013 Grade 3 ELA test. This can be compared with Points Earned
By Your Child for Writing from Sources. For example, if your child earned 17 points on questions that measure
Writing from Sources, and there are 24 possible points on questions that measure Writing from Sources, then he or
she did not earn 7 of the possible points. These points may have been missed because of the degree to which your
child’s written responses were developed and/or supported with evidence.
For more information about how many questions measuring Writing from Sources were included on the test, please
refer to http://www.engageny.org/resource/test-guides-for-english-language-arts-and-mathematics.
Average Points Earned Across NY on Writing from Sources
The Average Points Earned Across NY on Writing from Sources represents the average number of points earned by
students throughout the state on questions that measure Writing from Sources. This number can be used to
compare your child's performance to that of the average ELA test taker in grade 3. For example, if your child earned
17 points on questions that measure Writing from Sources, he or she has correctly answered five more Writing
from Sources questions than the average student in the state. However, it is important to note that is possible to
earn more points than average in Writing from Sources and still be considered not proficient.
7
8
9
10

Note: The scale score and "Points Earned By Your Child" for subscores are provided for illustrative purposes only. All other reported numbers reflect actual state performance.
Table 1. The Number of Possible Subscore Points for ELA
Grade
Reporting Categories
Reading Writing from Sources
3-4 31 24
5 42 24
6 41 24
7-8 42 24

Note: The scale score and "Points Earned By Your Child" for subscores are provided for illustrative purposes only. All other reported numbers reflect actual state performance.
New York State Testing Program
Common Core
Mathematics Test
Understanding the
Mathematics Parent Report
August 2013

Note: The scale score and "Points Earned By Your Child" for subscores are provided for illustrative purposes only. All other reported numbers reflect actual state performance.
THE STATE EDUCATION DEPARTMENT / THE UNIVERSITY OF THE STATE OF NEW YORK / ALBANY, NY
12234
New York State Testing Program Common Core Mathematics Test
Understanding the Mathematics Parent Report
With the adoption of the New York P-12 Common Core Learning Standards (CCLS) in English Language Arts (ELA)/Literacy and Mathematics, the Board of Regents signaled a shift in both instruction and assessment. In Spring 2013, New York State administered the first set of tests designed to assess student performance in accordance with the instructional shifts and the rigor demanded by the Common Core State Standards (CCSS). To aid in the transition to new tests, New York State released a number of resources during the 2012–2013 year, including test blueprints and specifications, sample questions, and criteria for writing test questions. Now that we have administered the first tests, we are providing this document to explain reports that families receive for both the Spring 2013 ELA and Mathematics tests. These annotated score reports will help students, families, educators, and the public better understand how to interpret the 2013 score reports.
Understanding the Mathematics Parent Report Each year, students in grades 3–8 take the Mathematics Common Core Test. After the test, families receive a report that explains how their child performed. This document explains the parts of that score report. This document uses a grade 3 score report as an example. If your child is not in grade 3, you may notice some differences. These differences are explained in Section 4 of the document.

Note: The scale score and "Points Earned By Your Child" for subscores are provided for illustrative purposes only. All other reported numbers reflect actual state performance.
Page 1 – Front Side
Scale Score: The Scale Score is determined by the number of points your child earned on the test. The number of points have to be on a scale so that the test results mean the same thing year after year even though different students are taking the test with different questions. The higher the number of points your child earned, the higher his or her scale score. Scale scores are most meaningful when they are associated with a performance level.
Table 1 provides the range of scale scores for each grade, as well as the scale score your child would need to meet their grade level performance expectations and to be on track for college and career readiness.
Table 1: Range and Proficiency Level of Scale Scores Across Grades
Grade
3 4 5 6 7 8
Range of Scale Scores 139–394 126–402 126–406 119–399 133–401 119–403
Scale Scores Greater than or Equal to this Value are Proficient
314 314 319 318 322 322
Performance Level: Students are assigned a Performance Level based on how they perform on the test. There are four possible performance levels: NYS Level 1, NYS Level 2, NYS Level 3, and NYS Level 4. Each student is assigned to a performance level based on the scale score earned. For a full description of each performance level, please refer to the bottom of page 1 on the Parent Report.
For a detailed description of the skills, knowledge, and practices that are typical of students at each performance level, please visit http://www.engageny.org/resource/performance-level-descriptions-for-ela-and-mathematics
Overall State Percentile Rank: Overall State Percentile Rank compares your child's score to the rest of the students who took the same subject area test this year. Percentile ranks are reported on a scale of 1-99. If your child has an Overall State Percentile Rank of 82, it means that your child’s scale score was the same or higher than 82% of all students who took the same test. The higher the Overall State Percentile Rank, the better your child did compared to other students.
1
2
3
1
2
3

Note: The scale score and "Points Earned By Your Child" for subscores are provided for illustrative purposes only. All other reported numbers reflect actual state performance.
Page 2- Back Side
Mathematics Domain Subscores: The points from the Mathematics test are divided into three reported subscores. These subscores measure major content areas for the grade, which are organized by domains (e.g., Operations and Algebraic Thinking). Domain subscores are calculated based on points earned on groups of questions that assess major content areas. These subscores differ by grade because of the differences in the knowledge and skills students are required to demonstrate at each grade. Please refer to Table 2 at the end of this document for the reported domains in other grades.
Please refer to the test guides for more information on the specific domains for each grade (http://www.engageny.org/resource/test-guides-for-english-language-arts-and-mathematics).
Points Earned By Your Child on Domain Subscores: Points Earned By Your Child on domain subscores represents the number of points your child earned on questions measuring that domain (e.g., Operations and Algebraic Thinking). Each multiple-choice question that your child answered correctly earns one point. Your child may earn multiple points for each constructed-response question.
There are two types of constructed-response questions: short-response (maximum of 2 points) and extended-response (maximum of 3 points). Teachers rate each student’s response to these questions. The points earned on the constructed-response questions are added to the number of multiple-choice questions answered correctly to equal the Points Earned By Your Child on the domain subscore. See the example below.
For examples of questions from the 2013 Mathematics test, please visit http://www.engageny.org/resource/new-york-state-common-core-sample-questions
4
4
5
5 6 7
6

Note: The scale score and "Points Earned By Your Child" for subscores are provided for illustrative purposes only. All other reported numbers reflect actual state performance.
Number of Possible Points on Domain Subscores: Number of Possible Points on domain subscores describes the total number of points measuring that specific domain on the 2013 Mathematics test. This includes all possible points from both multiple-choice and constructed-response questions in that domain. These points can be compared with Points Earned By Your Child on domain subscores. For example, if your child earned a total of 25 points from questions measuring Operations and Algebraic Thinking out of a total of 27 possible points on Operations and Algebraic Thinking, then he or she missed a total of two points in the Operations and Algebraic Thinking domain.
For more information about how many questions were included on each section of the test, please refer to http://www.engageny.org/resource/test-guides-for-english-language-arts-and-mathematics
Average Points Earned Across NY: The Average Points Earned Across NY on domain subscores reports the average number of points earned by students throughout the state. This number can be used to compare your child’s performance to the other students who took the Mathematics test in their grade. For example, if your child earned 25 points in Operations and Algebraic Thinking, he or she has earned eight more points in Operations and Algebraic Thinking than the average student in the state. However, please note that is possible to earn more points than the average Mathematics test taker in grade 3 in Operations and Algebraic Thinking, and other subscores, and still be considered not proficient.
6
7

Note: The scale score and "Points Earned By Your Child" for subscores are provided for illustrative purposes only. All other reported numbers reflect actual state performance.
Table 2. The Domain Subscores and Number of Possible Subscore Points for Math by Grade
Grade
Reporting Categories
1 2 3
3 Operations and Algebraic
Thinking 27
Number and Operations—Fractions
12
Measurement and Data
12
4 Operations and Algebraic
Thinking 11
Number and Operations in Base Ten 17
Number and Operations—Fractions
18
5 Number and Operations in
Base Ten 17
Number and Operations—Fractions
26
Measurement and Data 9
6 Ratios and Proportional
Relationships 19
The Number System 11
Expressions and Equations 28
7 Ratios and Proportional
Relationships 20
The Number System 14
Expressions and Equations 22
8 Expressions and Equations
30 Functions
11 Geometry
14