understanding the fundamental principles of metal … review r815 • extensive testing for...
TRANSCRIPT

INSTITUTE OF PHYSICS PUBLISHING JOURNAL OF PHYSICS: CONDENSED MATTER
J. Phys.: Condens. Matter 15 (2003) R813–R839 PII: S0953-8984(03)33587-8
TOPICAL REVIEW
Understanding the fundamental principles of metaloxide based gas sensors; the example of CO sensingwith SnO2 sensors in the presence of humidity
N Barsan and U Weimar
Institute of Physical and Theoretical Chemistry, University of Tubingen, Auf der Morgenstelle 8,D-72076 Tubingen, Germany
Received 8 February 2003Published 12 May 2003Online at stacks.iop.org/JPhysCM/15/R813
AbstractThis paper investigates the effect of water vapour in CO sensing by usingPd doped SnO2 sensors realized in thick film technology as an example ofthe basic understanding of sensing mechanisms applied to sensors. Theresults of phenomenological and spectroscopic measurement techniques, allof them obtained under working conditions for sensors, were combined withmodelling in order to derive conclusions able to be generalized to the fieldof metal oxide based gas sensors. The techniques employed were: dcconductance, ac impedance spectroscopy, work function (by using the Kelvinprobe method), catalytic conversion and diffuse reflectance infrared Fouriertransform measurements. The most important conclusion is that the differentparts of the sensor (sensing layer, electrodes, substrate) are all influencing thegas detection and their role has to be taken into consideration when one attemptsto understand how a sensor works.
(Some figures in this article are in colour only in the electronic version)
Contents
1. Introduction 8142. Experimental details 815
2.1. Sample preparation 8152.2. DC measurements 8172.3. Catalytic conversion measurements 8172.4. Work function change measurements 8172.5. Impedance spectroscopy measurements 8172.6. DRIFT measurements 8182.7. Gas tests 818
0953-8984/03/200813+27$30.00 © 2003 IOP Publishing Ltd Printed in the UK R813

R814 Topical Review
3. Results and discussion 8183.1. CO sensing and transduction—state of the art 8183.2. DC measurements 8213.3. Catalytic conversion measurements 8233.4. Work function change measurements 8243.5. Impedance spectroscopy measurements 8273.6. DRIFT measurements 835
4. Conclusion and outlook 837References 838
1. Introduction
This contribution uses mainly results obtained in the last few years by the Gas Sensor Groupat the University of Tubingen in an attempt to understand metal oxide based gas sensors. Thereason for starting this work was the finding that a fractal knowledge is the result of researchand development in this field. Accordingly, the aim was to put together a research approachthat results in a coherent picture integrating both a basic understanding and sensor applicationaspects. The approach/research program was first outlined in [1]. Its rationale is presented inthe following:
• Assessment of the state of the art by a literature survey and selection of an appropriatemetal oxide system. The candidate used for this is SnO2.SnO2 is a wide bandgap n-type semiconductor, its conduction type being related to theintrinsic oxygen vacancies. Gas sensors based on this material are extensively used in thedetection of toxic gases. Their advantages, such as low cost and high sensitivity, makethem very attractive, whereas their disadvantages, such as lack of selectivity and the stronginterfering effect of water vapour, still hinder their use as measuring devices.
• Definition of objectives for the next steps:
∗ What are the relevant parameters to be focused on?+ Identification of relevant problems, e.g. CO in the presence of humidity.+ Typical 3S parameters (stability, sensitivity, selectivity) as a basis for
benchmarking.∗ What are the experimental and boundary conditions?
+ Measure as much as possible in real world conditions and on real world samples.This will lead to measurements performed under gas atmospheres provided bygas mixing stations. Most of the measurements are electrical measurements andoptical spectroscopy. For material characterization tasks UHV techniques werealso used.
• Preparation of appropriate samples according to the following criteria:
∗ ‘Simple’ preparation of sensitive material, which avoids additives (where the additiverole is not quite understood).
∗ Very sensitive samples to get sufficient ‘effect’ (good signal to noise ratio).∗ Optimized substrate (materials).∗ Solid experimental basis: high throughput reproducible preparation method, which
ensures a high sample to sample reproducibility and consequently allows for testingof devices in totally different experimental rigs in different laboratories over a longperiod.
Topical Review R815
• Extensive testing for selection of appropriate combinations of samples and relevantparameters. Anticipating a little bit, the main conclusions were:
∗ The home-made SnO2-based sensors live up to the standards of commercial SnO2-based sensors. In particular, the ones doped with 0.2 wt% Pd showed excellentsensitivity for CO detection and remarkable long-term stability and have been chosenfor the following basic studies.
∗ CO detection is especially influenced by the presence of humidity. Consequently, thewater–CO combination was used as a model system.
• Selection of complementary experimental techniques appropriate to the above mentionedresearch approach.
∗ DC resistance measurements are the ‘normal’ way for sensor measurements and allowfor the screening of a large number of sensors.
∗ AC impedance spectroscopy as a technique which is applied in normal operationconditions. AC impedance spectroscopy provides knowledge on the differentcontributions (surface, bulk, contact) to gas sensing.
∗ Work function change measurements by the Kelvin method are also performedin normal operation conditions. They additionally provide insight about surfacereactions where free charge carriers are not involved.
∗ Catalytic conversion measurements in normal operation conditions give additionalinformation about the gas sensing reaction paths.
∗ Infrared spectroscopy, and especially DRIFT measurements, are allowing (inprinciple) the identification of the surface species involved in the sensing processin normal operation conditions. It is one of the few spectroscopic techniques whichcan be applied in normal operation conditions.
• Development of the necessary tools for the interpretation of the experimental findings;the modelling should start from elementary steps governing those surface–moleculeinteractions which lead to charge transfer (adsorption, reaction, desorption, etc) and thenshow how these steps are linked with the macroscopic parameters describing the sensorresponse.
• Application of the interpretation tools to precisely planned experimental model systems.
Most of the experimental techniques were used in the past for studying gas sensors [2–13].However, they were never combined and applied to the same samples/sensors and their resultsnever integrated into a complete modelling of gas sensing.
Partly, the experimental results and the modelling tools are already published [14–18]or submitted for publication [19, 20]. Nevertheless, the general picture became clearer justrecently and it was not reported up to now. In the following, the approach is demonstrated ina step by step manner.
2. Experimental details
2.1. Sample preparation
The sensing material is based on a nanocrystalline tin oxide powder. As a starting point,Sn(OH)4 is precipitated by adding ammonia to an aqueous solution of tin chloride. Aftera washing step, the precipitate is calcined at 450 C for 8 h. The surface doping (0.2 wt%Pd) of the final sensing material is realized by powder impregnation using the correspondingmetal chloride. An additional heat treatment (450 C for 1 h) reduces the metal chloride tometallic Pd and removes the chlorine. Afterwards, the powder is mixed with an appropriate
R816 Topical Review
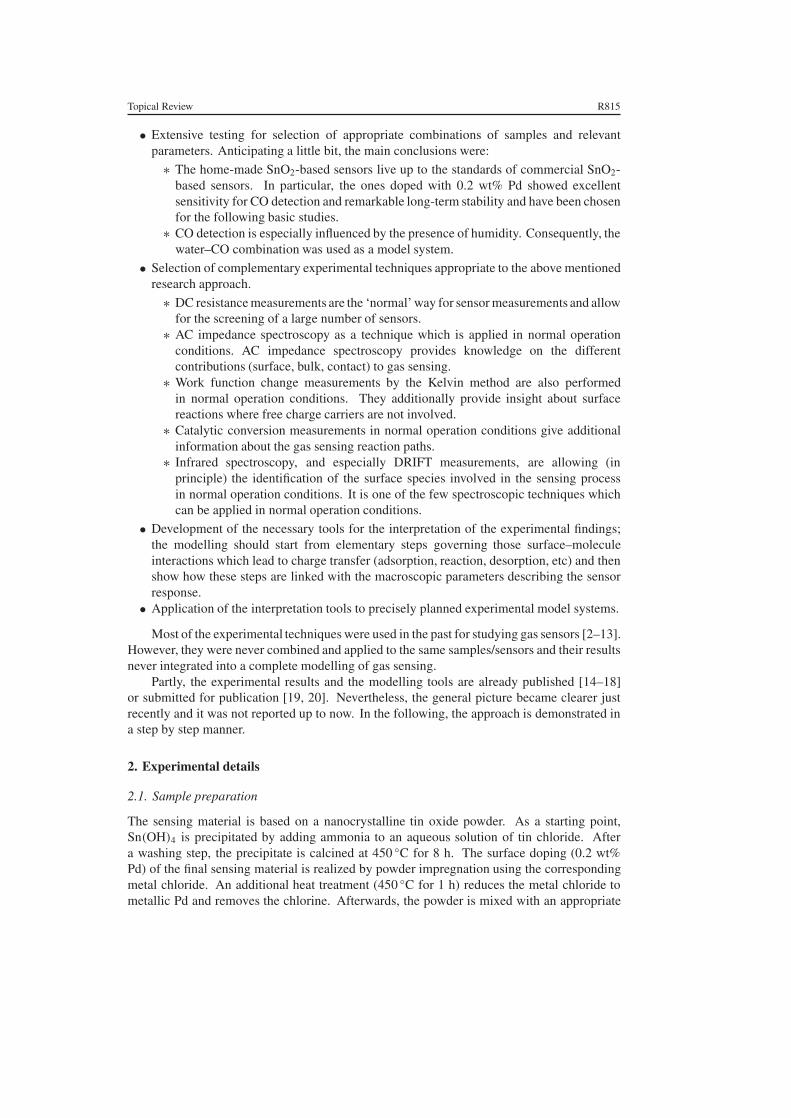
Figure 1. SEM pictures of the SnO2 sensing layer.
Interdigitated Electrodes
Sensitive Layer (SnO2)
Platinum Heater
25.4 mm
4.2 mm
Tin dioxidePt Electrodes
Pt Heater
0.7 mm
50 µm
5 µm
5µm
Top View
Bottom View
Side View
Cross Section
AluminaSubstrate
3.5 mm
7 mm
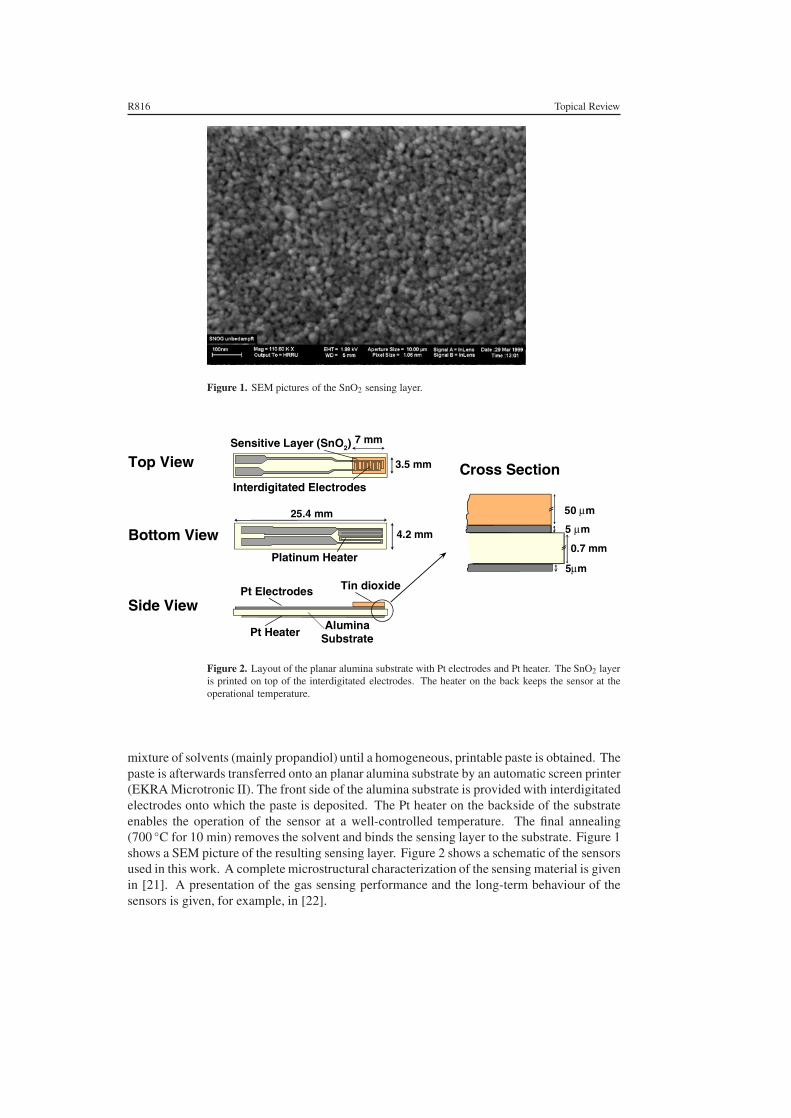
Figure 2. Layout of the planar alumina substrate with Pt electrodes and Pt heater. The SnO2 layeris printed on top of the interdigitated electrodes. The heater on the back keeps the sensor at theoperational temperature.
mixture of solvents (mainly propandiol) until a homogeneous, printable paste is obtained. Thepaste is afterwards transferred onto an planar alumina substrate by an automatic screen printer(EKRA Microtronic II). The front side of the alumina substrate is provided with interdigitatedelectrodes onto which the paste is deposited. The Pt heater on the backside of the substrateenables the operation of the sensor at a well-controlled temperature. The final annealing(700 C for 10 min) removes the solvent and binds the sensing layer to the substrate. Figure 1shows a SEM picture of the resulting sensing layer. Figure 2 shows a schematic of the sensorsused in this work. A complete microstructural characterization of the sensing material is givenin [21]. A presentation of the gas sensing performance and the long-term behaviour of thesensors is given, for example, in [22].

Topical Review R817
2.2. DC measurements
The typical measurement technique for metal oxide sensors is the measurement of conductanceor resistance. In this work dc measurements were performed by using electronic circuitrywhich ensures a constant voltage drop over the sensing layer. With such a technique, a definedpolarization and a known and constant measurement potential, were ensured. In this way,effects of the possible influence of the measuring potential, like the ones already reported forvery similar samples, were avoided [23]. The measuring potential was adjusted in a range inwhich its influence on the measurement is minimal.
2.3. Catalytic conversion measurements
The catalytic conversion of CO to CO2 during the gas sensing with SnO2-based sensors wasmonitored by using a combination of liquid amperometric CO sensors (EC) and IR CO2 sensors(for details, see [17]). The gas mixtures produced by a gas flow system were successivelydelivered to: first to the EC and then to the sensors and, afterwards, first to the sensors andthen to the EC. The differences in the signal of the EC were used to calculate the amount ofCO catalytically converted to CO2 and the IR CO2 sensor was used as an additional checkingmethod. The absence of any other reaction products was previously checked by a FTIRspectrometer.
2.4. Work function change measurements
The technique used here for measuring differences in work functions is the well establishedKelvin oscillator method [24, 25]. In our case, the Kelvin oscillator consists of a metallic gridin electrical contact with the sample, which oscillates at a mean distance d over the sample.Due to the electrical contact, a contact potential VC , which is equal to the difference in workfunction of the two materials , occurs. This results in an electrical field between the twoplates of the capacitor, the sample and the grid. Changes in distance due to the oscillationresult in changes of the capacity C and therefore in a current i(t) according to
C(t) = εε0 A/(d0 + δ sin ωt) = Q(t)/VC (1)
i(t) = Q = −VCεε0 Aδω cos ωt/(d20 (1 + δ/d0) sin ωt)2. (2)
Experimentally, a counter-voltage VG is adjusted until i(t) disappears and the contact potentialVC = −VG = is measured (for details see figure 3). Consequently, if the work function ofthe metallic grid is unaffected by changes in the ambient atmosphere it is possible to determinethe work function changes of the sample dependent on gas adsorption.
2.5. Impedance spectroscopy measurements
For the measurements a Hewlett-Packard impedance analyser (HP 4194A) was used incombination with a self-made test fixture designed for the auto-balancing bridge method.The analyser allows us to measure in the frequency range between 100 Hz and 40 MHz and toperform open/short compensation for the whole frequency range in one run. The home-madetest fixture, in fact a gas-tight test chamber provided with gas inlet and outlet, allowed theplugging in of the sensor by using a standard connector. Comparison of the results obtainedby measuring standard resistances and capacitances with the test fixture provided by Hewlett-Packard and with the home-made test fixture did not show significant differences. For detailssee also [20].

R818 Topical Review
d
Aω
sample
u(t)
i(t)VG
Figure 3. Principal set-up of a Kelvin probe. A metallic grid oscillates over a sample. Thecounter-voltage VG is adjusted in such a way that the current i vanishes.
2.6. DRIFT measurements
Among the spectroscopic techniques, needed to be applied in order to validate thephenomenological results, infrared spectroscopy seems to be the most suitable for experimentsperformed under realistic operation conditions. Due to its nature, as most of the signalcomes from indirect reflections and its good sensitivity in the spectral range where interestingsurface species are found, DRIFT is particularly suitable for application to studies of surfacephenomena and large specific surface materials such as the sensing layers we are interested in.In our experiments, the sensors were placed in a special home-made sensor chamber, whichallows for:
• a maximum of diffuse reflectance from the sensor surface due to the presence of windowsthrough which the IR incident beam could enter and the diffuse reflected beam could reachthe DRIFT optical system.
• the exposure of the sensor to different gas mixtures due to the possibility of connectingthe tight sensor chamber to a gas flow system and purging it with the desired gas mixtures.
• the sensor chamber being placed in the DRIFT unit of an evacuable Bruker IFS 66v FTIRspectrometer, which allowed for recording spectra at a spectral resolution of 2 cm−1 and1024 scans. For more details on the experimental procedure see [19].
2.7. Gas tests
The adjustment of the desired gas mixtures was performed by means of a gas flow system withcomputer-driven mass flow controllers. The humidity was adjusted by bubbling synthetic airthrough a column of water and subsequently mixing it with dry air in a gas blender. Betweentwo successive exposures to test gases the sensors were purged for 1 h with background gas(dry or humidified synthetic air) to allow the sensors to recover.
3. Results and discussion
3.1. CO sensing and transduction—state of the art
Tin oxide sensors are generally operated in air in the temperature range between 200 and 400C.At these temperatures it is generally accepted that the conduction is electronic; it is also accepted

Topical Review R819
ener
gy
gasproduct
xxg > λD
x
z
currentflow
qVs
Eb
large grains
small grains
xg
2x0
Figure 4. Schematic representation of a porous sensing layer with geometry and energy band. λD
is the Debye length, xg is the grain size and x0 is the depth of the depletion layer.
that chemisorption of atmospheric gases takes place at the surface of the tin oxide. The overallconduction in a sensor element,which will determine the sensor resistance, is determined by thesurface reactions, the resulting charge transfer processes with the underlying semiconductingmaterial and the transport mechanism from one electrode to the other through the sensinglayer (the latter can even be influenced by the electrical and chemical electrode effects). Forexample, it is well known and generally accepted that the effect of oxygen ionosorption as O−
2or O− will be the building of a negative charge at the surface and the increase of the surfaceresistance [1, 26–28]. It is also considered that reducing gases like CO react with the surfaceoxygen ions, freeing electrons—the sensing step—that can return to the conduction band. Thetransduction step, i.e. the actual translation of this charge transfer into a decrease of the sensorresistance, depends (as shown in [14]) on the morphology of the sensing layer. The resultis that, even for exactly the same surface chemistry, the dependence of the sensor resistanceon the concentration of CO can be very different for compact and porous sensing layers (asdefined in [14]).
In our case, the sensing layer consists of single crystalline grains with a narrow sizedistribution (see figure 1 and [21]). Due to the fact that the final thermal treatment is performedat 700 C, the grains are just loosely connected. Accordingly, the best way to describe theconduction process is to consider that the free charge carriers (electrons for SnO2) have toovercome the surface barriers appearing at the surface of the grains (see figure 4 and [14]).Due to the narrow size distribution it is also quite probable that a mean-field treatment sufficesand there is no need for Monte Carlo simulations or percolation theory. One can easily modelthe dependence of the resistance on the CO concentration by making the following assumptions,supported by the already established knowledge in the field:
• The reaction of CO takes place just with the previously adsorbed oxygen ions (welldocumented for the temperature and pressure range in which the gas sensors operate).
• The adsorption of CO is proportional to the CO concentration in the gas phase (quitereasonable but never really experimentally proved).

R820 Topical Review
On the basis of the a.m. assumptions one can combine quasi-chemical reaction formalism withsemiconductor physics calculations and one obtains power-law dependences of the form
R ∼ pnCO (3)
where the value of n depends on the morphology of the sensing layer and on the actual bulkproperties of the sensing materials (see a complete analysis in [14]). The relationship describedby equation (3) is well supported by experiments.
In order to verify the validity of the modelling, it is very important to check whether theassumption of the proportionality between the adsorbed and gaseous CO is valid; this is oneof the objectives of our experimental studies.
For the effect of water vapour on the resistance of tin oxide based gas sensors thereare a couple of ideas, briefly presented below (for details see [14]). There are three typesof mechanisms to explain the experimentally proven increase of surface conductivity in thepresence of water vapour. Two, direct mechanisms, are proposed by Heiland and Kohl [29]and the third, indirect, is suggested by Morrison and by Henrich and Cox [30, 31].
The first mechanism of Heiland and Kohl attributes the role of the electron donor to the‘rooted’ OH group, the one including lattice oxygen. The equation proposed is
H2Ogas + SnSn + OO (Snδ+Sn − OHδ−) + (OH)+
O + e− (4)
where (Snδ+Sn − OHδ−) is referred to as an isolated hydroxyl or OH group (dipole) and (OH)+
Ois the rooted one. In the first equation, the donor is already ionized.
The reaction implies the homolytic dissociation of water and the reaction of the neutral Hatom with the lattice oxygen. The latter is normally fixing two electrons and then consequentlybeing in the (2−) state. The built-up rooted OH group, having a lower electron affinity, canbecome ionized and become a donor (with the injection of an electron into the conductionband).
The second mechanism takes into account the possibility of the reaction between thehydrogen atom and the lattice oxygen and the binding of the resulting hydroxyl group to theSn atom. The resulting oxygen vacancy will produce, by ionization, the additional electrons.The equation proposed by Heiland and Kohl [29] is
H2Ogas + 2SnSn + OO 2(Snδ+Sn − OHδ−) + V2+
O + 2e−. (5)
Morrison, as well as Henrich and Cox [30, 31], consider an indirect effect more probable.This effect could be the interaction between either the hydroxyl group or the hydrogen atomoriginating from the water molecule with an acid or basic group,which are also acceptor surfacestates. Their electronic affinity could change after the interaction. It could also be the influenceof the co-adsorption of water on the adsorption of another adsorbate,which could be an electronacceptor. Henrich and Cox suggested that the pre-adsorbed oxygen could be displaced by wateradsorption. In any of these mechanisms, the particular state of the surface plays a major role,due to the fact that it is considered that steps and surface defects will increase the dissociativeadsorption. The surface dopants could also influence these phenomena; Egashira et al [32]showed by TPD and isotopic tracer studies combined with TPD that the oxygen adsorbates arerearranged in the presence of adsorbed water. The rearrangement was different in the case ofAg and Pd surface doping.
In choosing between one of the proposed mechanisms, one has to keep in mind that:
• in all reported experiments, the effect of water vapour was the increase of surfaceconductance,
• the effect is reversible, generally with a time constant of the order of around 1 h.

Topical Review R821
It is not easy to quantify the effect of water adsorption on the charge carrier concentration,nS (which is normally proportional to the measured conductance). For the first mechanism ofwater interaction proposed by Heiland and Kohl (‘rooted’, equation (4)), one could include theeffect of water by considering the effect of an increased background of free charge carriers onthe adsorption of oxygen.
For the second mechanism proposed by Heiland and Kohl (‘isolated’, equation (5)) onecan examine the influence of water adsorption (see [33]) as an electron injection combined withthe appearance of new sites for oxygen chemisorption; this is valid if one considers oxygenvacancies as good candidates for oxygen adsorption. In this case one has to introduce thechange in the total concentration of adsorption sites [St ]:
[St ] = [St0] + k0 pH2O (6)
obtained by applying the mass action law to equation (5). [St0] is the intrinsic concentrationof adsorption sites and k0 is the adsorption constant for water vapour.
In the case of the interaction with surface acceptor states, not related to oxygen adsorption,one can proceed as in the case of the first mechanism proposed by Kohl. In the case of aninteraction with oxygen adsorbates, one can consider that the dissociation of oxygen ions isincreased and examine the implications.
Due to the large effort implied by the modelling, it is important to find out which of theproposed mechanisms is the important one. This is also an objective of the experiments to bepresented in what follows.
The influence of water vapour on CO detection is well documented (see, forexample, [16, 33–39]). Generally the papers are just describing the effects without going toofar into the modelling/explanation of the effects. When they provide models, they are not basedon the combination of spectroscopic and phenomenological measurement techniques appliedin realistic sensor operation conditions, as presented here. The explanations span betweenconsidering OH groups as weak acceptors, competing with oxygen for the same adsorptionsites and more easily accessible to the reaction with CO [28] to a complete decoupling betweenthe CO and water surface reactions [35, 38]. Anyhow, the active surface species related towater vapour are considered to be the hydroxyl groups.
3.2. DC measurements
The results obtained by dc characterization of Pd doped sensors can be summarized as follows.With increasing humidity:
• the resistance in air decreases,• the resistance in the presence of CO decreases,• the sensor signal to CO increases,• the calibration curves and the corresponding sensor signals can be approximated by power
laws.
These facts are not surprising and are very similar to the ones generally reported. Interestingfindings are shown in figures 5 and 6; figure 5 shows two types of normalized sensor signaldependences on CO concentration (in the range 50–500 ppm) for 0 and 50% relative humidity.The sensor resistance is either related to the sensor resistance in the absence of CO (S1) or tothe sensor resistance in the presence of a fixed CO concentration (S2).
The difference in the dependence on humidity is quite striking. The sensor signals S1 for0 and 50% relative humidity differ strongly, whereas the sensor signals S2 overlap completelyin the presence of CO. When the normalization procedure S2 is applied to the resistance data

R822 Topical Review
0 100 200 300 400 500
1
10
100
G/G(0ppm) 0% r.h. 50% r.h.
Sen
sor
sign
al G
CO/G
Air
CO concentration (ppm)
0.01
0.1
1
Pd dopedTop=275°C
Sensor signal: G
CO /G
(200ppm C
O)
G/G(200ppm) 0% r.h. 50% r.h.
Figure 5. Sensor signal dependence on CO concentration of Pd doped sensors in dry air ( and )and at 50% relative humidity ( and •). The two normalization procedures are performed withrespect to the resistance in the absence of CO (full curves) and in the presence of 200 ppm CO(broken curves).
150 200 250 300 350 400 450
1
CO500ppm400ppm
200ppm
100ppm
50ppm
0%r.h. 30%r.h. 50%r.h.
Sen
sor
sign
al S
2 G
CO/G
(100
ppm
CO
)
Temperature in °C
Figure 6. Normalized sensor signal S2 (GCO/G(100 ppm CO)) as a function of operationaltemperature. The Pd doped sensors have been characterized for operational temperatures between150 and 400 C, the ambient humidity was varied between 0 and 50% relative humidity, the COconcentration was between 50 and 500 ppm. Above 250 C, S2 is independent of the ambienthumidity and hardly dependent on the operational temperature.
obtained at the various operational temperatures (250–400 C) it does not only work for eachsingle temperature, but also all resulting sensor curves overlap. This is illustrated in figure 6.The normalization S2 completely eliminates the influence of water for CO concentrations inthe range 50–500 ppm and temperatures between 250 and 400C. These findings suggest thatCO reacts at the surface of the Pd doped sensors with water-related species and, as is generallyaccepted, with oxygen ions; it seems that the reaction with the water-related species is limitedto concentrations below 50 ppm CO and that, in terms of the influence on conductance, itseffect appears as a constant multiplicative term at concentrations above 50 ppm CO.

Topical Review R823
0 100 200 300 400 500-50
0
50
100
150
200
250
300
350
r.h.
50%r.h.
0%r.h.30%r.h.
Pd 0.2%wt.Top=266°C
200 250 300 350 400
50
55
60
65
70
r.h.50%r.h.
0% r.h.30%r.h.
Pd 0.2%wt.
CO incoming (ppm) Operation temperature (°C)
Con
sum
ed C
O (p
pm)
Con
sum
ed C
O (%
)
Figure 7. CO consumption by Pd doped sensors. Left: dependence of CO consumption on theambient humidity for Top = 270 C. The CO consumption of the sensors is linear and decreaseswith increasing humidity. Right: summary of CO consumption dependence on the operationaltemperature and ambient humidity. CO consumption increases with the operational temperatureand decreasing humidity.
0 10 20 30 40 50 60 70
0
5
10
15
20
25
30
35
40
45
50
Plain substrate
Humidity (% r.h.)200 250 300 350 400
0
5
10
15
20
25
30
35
40
45
50
55
50%r.h.
0 %r.h.
30%r.h.
-(1-psensor) = (1-player) ce .(1-psubstrate)
r.h.
Operation temperature (°C)
Pd doped layerElectrodes and heaterSensor
Con
sum
ed C
O (
%)
CO
con
sum
ptio
n (%
)
Figure 8. CO consumption related to the individual sensor parts of Pd doped thick film sensors.Left: CO consumption related to the bare alumina substrates, alumina substrates with Pt electrodesand heater, alumina substrates with sensitive layer on top, and consumption of sensors. Right:consumption related to the sensitive layer as calculated from the consumption data for sensors andthe consumption data for substrates provided with electrodes and heater.
The results also support the idea that in this temperature range CO interacts with onlyone type of ionosorbed oxygen species, probably O−; otherwise reactions with differentionosorbed species would determine different relationships between sensor resistance andCO concentration [14], i.e. different slopes for sensors and no overlapping curves as shown infigure 6.
3.3. Catalytic conversion measurements
The main results obtained by studying the catalytic conversion of CO to CO2 during sensing arepresented in figures 7 and 8 (a detailed presentation can be found in [17]). One can observe thatthe CO consumption is a linear phenomenon, which increases when the temperature is increasedand the humidity is decreased (see figure 7). The linearity of the consumption relation suggeststhat the assumption of a linear relationship between gaseous and adsorbed CO is correct and,as a consequence, the non-linearity of the dependence of the resistance/conductance is indeed

R824 Topical Review
determined by the transduction. The increase of the catalytic conversion by the increase of theoperational temperature is not surprising. What is really surprising, at least at a first glance, isthe decrease of consumption due to the increase of humidity. One would expect that, due tothe fact that the increase in humidity determines an increase of the sensor signal and that anincreased sensor signal means more sensing reactions, the associated CO consumption shouldalso increase. This fact signals that a sensor, being a complex device,means there are additionalphenomena that result in CO consumption without an electrical/sensor signal counterpart. Toclarify that aspect, the catalytic conversion associated with the different sensor parts wasinvestigated (figure 8, left). One can see that the bare alumina substrates show—within theprecision of the measurement—no CO consumption. Substrates provided with electrodes anda heater show a significant consumption, which strongly decreases with humidity. Aluminasubstrates with a sensitive layer on top also show strong consumption but no measurabledependence on humidity, although we expected an increase in consumption with increasingambient humidity. Finally, the consumption of sensors is remarkably large and decreaseswith increasing humidity. These findings suggest that the humidity influence is not relatedto the sensing material alone but to a combination of the substrate and the electrode-sensingmaterial. One could assume that the consumption of the sensors is an independent overlappingof the consumption of the sensitive layer and the substrate provided with electrodes and heater.However, any attempts to apply such a reasoning for calculation of the CO consumption of thesensors as a sum of the consumption associated with its constituents failed. As a consequence,one can conclude that the consumption of the sensor is not just the sum of the independentcontributions of the sensitive layer and the substrate. The substrate and the sensitive layerinteract in some way. If one calculates the contribution to the CO consumption that is due tothe sensing layer–electrode combination one finds that it is increases with increasing humidity,which is in line with the humidity influence on the sensor signal (figure 8, right).
3.4. Work function change measurements
By performing simultaneous conductance/resistance and work function measurements onecan get information about the changes in surface concentration species that are not carryinga net charge, such as dipoles. This is of special interest when one studies the effect of watervapour because their surface interaction can lead to such species (see equation (4)). Thishappens because work functions of semiconductors contain three contributions: the energydifference between the Fermi level and conduction band in the bulk (EC − EF)b, band bendingqVS and electron affinity χ (equation (8) and figure 9). All three contributions may, in principle,change upon gas exposure:
= (EC − EF )b + qVS + χ. (7)
The corresponding conductance G may formally be described by equation (8) (see, forexample, [14]); here we assume that the work function changes measured by the Kelvin probe atthe outer layers are identical with the electrostatic potential changes involving the inner grains.The latter control the conduction changes upon gas exposure; one also assumes a narrowsize distribution of the electrically active grains in the sensing layer and hence homogeneouselectrical properties, percolation paths of the conductivity independent of the work functionchanges, and constant mobility of the charge carriers in the nanoparticles:
G = G0 exp
(EF − EC)b − qVS
kT
= G0 exp
χ −
kT
. (8)
It is worth mentioning that changes in the electron affinity χ influence the work function
but not the electrical conductance G.

Topical Review R825
EF Ess
EVac
ECs
EVs
zz0
EVb
ECb µ
Φχ
qVs
Ed
Figure 9. Band bending after chemisorption of charged species (e.g. ionosorption of oxygen onESS levels). denotes the work function, χ is the electron affinity and µ is the electrochemicalpotential.
By combining equations (7) and (8), it gives that
kT ln G/G0 = χ − . (9)
If the sensors are exposed to two different gas atmospheres (initial gas atmosphere I and finalgas atmosphere F) and the related resistances (RI , RF ) and work functions (I ,F ) aremonitored, the different contributions to the work function change, , can be determinedaccording to
I,F = −kT ln(G I,F/G0) + χI,F . (10)
Hence
= F − I = kT ln(G I /G F) + χF − χI = kT ln(RF/RI ) + χ (11)
where I , RI and χI are the work function, the resistance and the electron affinity in the initialgas atmosphere, respectively, and F , RF and χF are the corresponding values in the final gasatmosphere. In all our experiments and the electrical resistance were measured and, byusing equation (12), χ was calculated.
In order to characterize the influence of water only, the sensors (operated at 270 C)were exposed to an atmosphere with different concentrations of water vapour. The resultsare presented in figure 10. An increase in humidity results in a decreased resistance andan increased electron affinity χ . Affinity changes may formally be attributed to changesin the coverage and/or absolute value of dipoles oriented perpendicular to the surface [40].The observed increase in electron affinity and the decrease in resistance (band bending) withincreasing humidity can be explained by an increased coverage of surface hydroxyl groups assuggested by the mechanisms proposed by Heiland and Kohl ([29] and equations (4) and (5))and the appearance of donors. It is still not possible to decide between the two models because

R826 Topical Review
0 20 40 60 80-0.20
-0.15
-0.10
-0.05
0.00
0.05
0.10
0.15
0.20
∆χ
kTln(RF/RI)
∆Φ
270°C, Pd doped
Pot
entia
l cha
nges
(eV
)
r.h. concentration (%)
Figure 10. Typical potential changes of Pd doped sensors upon water vapour exposure determinedhere at 270 C. For the definition of the three contributions, see the text.
0 10 20 30 40 50
-0.25
-0.20
-0.15
-0.10
-0.05
0.00
0.05
Pot
entia
l cha
nges
(eV
)
CO concentration (ppm)
Figure 11. Typical potential changes upon CO exposure determined at 270 C using Pd dopedsensors (a) in dry air ( indicates , indicates kT ln(RF /RI ), indicates χ ) and (b) at50% relative humidity ( indicates , • indicates kT ln(RF/RI ), indicates χ ).
one cannot differentiate, with phenomenological techniques, between the different ways inwhich the donors are produced; one can just record the effects, namely the decrease of theresistance.
To further investigate the CO–water interaction,simultaneous work function and resistancemeasurements have been performed in a background of both humidified and dry syntheticair. Figure 11 shows typical results of the influence of water during CO exposure. For zerohumidity the electron affinity χ did not change (within the precision of the measurement). In thepresence of water the electron affinity changes dramatically upon exposure to CO even at verylow concentrations and remains almost constant for higher CO concentrations. The decrease

Topical Review R827
of the electronic affinity can be attributed to a decrease of the concentration of isolated surfacehydroxyl groups associated to a reaction with CO. It was proposed in [15] that, following areaction of CO with the oxygen of the isolated hydroxyl group, the freed H atom could build upa donor in a similar way as the one in which donors were built by hydrogen atoms resulting fromthe dissociation of the water molecule. In the case of the first mechanism (equation (4)) thisdecrease in electron affinity may be explained by the decrease of the concentration of surfacedipoles, attributed to (Sn+
Sn − OH−), and the observed resistance decrease by the generationof additional ‘rooted’ OH groups:
COgas + (Sn+Sn − OH−) + OO → CO2
gas + SnSn + (OH)+O + e− (12)
whereas in the case of the second mechanism (equation (5)), one would have to assume that
COgas + (Sn+Sn − OH−) + OO → CO2
gas + (Sn+Sn − OH−) + V2+
O + 2e−. (13)
For the second case, the electron affinity would not change, which contradicts the experimentalobservations. This strongly suggests that the mechanism of water adsorption is the onedescribed by equation (4). The reaction of equation (12) occurs in addition to the reaction of COwith ionosorbed oxygen. The proposed mechanism explains the sensitization effect of wateron CO detection by the fact that an increased humidity results in an increased concentrationof surface dipoles and thus in an increased number of reaction partners (hydroxyl groups) andan increased efficiency in the CO reaction.
The impact of the CO–water reaction seems to decrease strongly with increasing COconcentration; above 10 ppm CO, there are only small changes in the electron affinity. Thesame behaviour is also observed at higher temperatures up to 400 C but, due to the thermaldecomposition of OH groups, the corresponding absolute changes in χ , as well as thesensitivity to CO, decrease. It looks like the difference in CO sensitivity for this type ofsensor, doped with Pd, when the temperature or the dopant concentration changes, is mainlyrelated to the changes in the interaction with water vapour. The results of work function changemeasurements provide a more solid basis for the findings of dc measurements alone.
For a confirmation of the results one can evaluate the change in surface dipole coverage(θ); this can be determined by means of the following equation (see [40]):
χ = q
εSε0θ Nad
(S)max µad . (14)
With the assumptions that Nad(s)max ≈ 1019 m−2 (surface density of tin atoms), µad ≈
1.66 D = 1.66 × 3.3 × 10−30 C m [5] and εS = εSnO2/(2)0.5 = 8.5, the changes in dipolecoverage are in the range of fractions of a monolayer (ML). Bearing in mind that, for hydroxylgroups, TDS coverage experiments indicate a surface coverage of about 15% of a ML [41],the results seem quite reasonable.
3.5. Impedance spectroscopy measurements
Impedance spectroscopy is an useful tool for the identification of different elements of acomplex device, such as a thick film gas sensor. In figure 12 the different elements possibleto be present in our gas sensors are shown together with their ac equivalent circuits andtheir dependence on the main parameters that might be influenced by the different ambientatmospheric conditions (VS and ε: for details see [20]). As has been discussed before, thesensitive layer of the sensors consists of interconnected tin dioxide grains. In the presence ofoxygen the surface layer of every grain becomes depleted of charge carriers and, in the case ofλD < r , an energy barrier results (for the full modelling,see [14]; the case in which the oppositesituation is present, λD > r , would be modelled by the case of fully depleted grains with no

R828 Topical Review
En
erg
y
Gas
Product
x
x
z
Currentflow qVS
Eb
Large grains (λD<r)
r
Rgb
Cgb
Rb Rb
~
~(ε/qVS)0.5
∆Φ
~ nb
Rc
Cc
~
~
nbexp(∆Φ/kBT)
(ε/∆Φ)0.5
nbexp(qVS/kBT)
Figure 12. Equivalent circuit for the different contributions; intergranular contact, bulk andelectrode contact. Intergranular contact: the ionosorption of oxygen at the grain surface resultsin the creation of a potential barrier and the corresponding depletion layers at the intergranularcontacts. An intergranular contact can be represented electronically by a resistor Rgb (due tothe high resistive depletion layers) and a capacitor Cgb (due to the sandwiching of high resistivedepletion layers between two high conductive ‘plates’ of bulk material) in parallel. The electrodecontact can also be represented by a (RC) element. The values of the resistor Rc and the capacitorCc are independent of the ambient gas atmosphere. The bulk contribution can be represented by aresistor Rb , whose resistance value is hardly influenced by changes in the ambient atmosphere.
band bending described by simple resistors, see also [27]). The depletion layer thickness andthe corresponding barrier height depend on the ambient gas atmosphere. A similar situationholds for the semiconductor–metal contact at the electrodes. However, in contrast to thegrain–grain contacts, their Schottky barrier height is determined by the difference in the workfunctions of the metal and semiconductor and not by the surface processes (see [14]). Changesin the electron concentration near the metal–semiconductor contact due to the gas interactionat the SnO2 grains are immediately compensated by electron transfer from the electrode and,as a result, the resistance of the metal–semiconductor contact does not depend on the ambientatmosphere.
The experimental results are presented in figures 13–16.The results, which have been obtained by ac characterization, can be summarized as
follows:
• The sensor impedance can be represented by an equivalent circuit consisting of a resistor,a (RCPE) element and, for dry air, an additional (RC) element, all in series (figures 13and 14).
• For dry background air, the CO dependence of all resistive and capacitive elementsof the equivalent circuit resemble those of an intergranular Schottky contact, i.e. the

Topical Review R829
50403020100
104
105
250°C 300°C 350°C 400°C
0 20000 40000 60000 80000 100000 12000010000
0
-10000
-20000
-30000
-40000
-50000
-60000
-70000
-80000
-90000
-100000
-110000
-120000
50 ppm CO
40 ppm CO
30 ppm CO
20 ppm CO
10 ppm CO
Top = 300°CDry air
Real part
U,I,FRA
R1 R2R0
CPE C
Cgeom=const.
b)
a)
CO concentration (ppm)
R
1 (Ω
)Im
agi
nary
par
t
ϕ
Figure 13. Equivalent circuit for the sensitive layer with dry synthetic air as background gas.(a) Impedance data in the Bode diagram for dry background gas. Two measurements have beenperformed for each CO concentration (0, 10–50 ppm). The data can be fitted nicely with anequivalent circuit consisting of a resistor (R0), a R-CPE (R1 ‖ CPE) element and a (RC) element(R2 ‖ C) parallel to the geometric capacitance Cgeom . The resistances are in the k range, whilethe capacitance and the CPE are in the pF range. The geometric capacity determined Cgeom isconstant for all ambient atmospheres and equal to the geometric capacitance of a bare substrate.(b) The resistance R1 decreases for all operational temperatures with increasing CO concentration(0–50 ppm).
resistance decreases with increasing CO concentration, whereas the capacitance increases(see figures 13 and 15 and the formula in figure 12; the decrease of the band bending VS
decreases the resistance and increases the capacitance).
• For humid background air, the resistance behaviour resembles that for dry air, but thecapacitive behaviour is different. For small CO concentrations the capacitance is decreasedwhereas for higher CO concentrations it is increasing as in the case of dry background

R830 Topical Review
0 1000 2000 3000 4000 5000 6000500
0
-500
-1000
-1500
-2000
-2500
-3000
-3500
-4000
-4500
-5000
-5500
-6000
50 ppm CO40 ppm CO
30 ppm CO
20 ppm CO 10 ppm CO
Top = 300°C
50% r.h.
Real part
U,I,FRA
R1 R2R0
CPE C
Cgeom=const.
50403020100
103
104
250°C 300°C 350°C 400°C
CO concentration (ppm)
a)
b)
Ima
gina
ry p
art
R1
(Ω)
ϕ
Figure 14. Equivalent circuit for the sensitive layer in the case of humid synthetic air as thebackground gas. (a) Impedance data in the Bode representation for humidified background gas.Two measurements have been performed for each CO concentration (0, 10–50 ppm). The datacan be fitted nicely with an equivalent circuit consisting of a resistor (R0) and a (R-CPE) element(R1 ‖ CPE) in parallel to the geometric capacitance Cgeom . The resistances are in the k rangeand the CPE are in the pF range. The determined geometric capacitance Cgeom is constant for allambient atmospheres and equal to the geometric capacitance of a bare substrate. (b) The resistanceR1 decreases for all operational temperatures with increasing CO concentration (0–50 ppm).
air (see figures 14 and 15). The ‘strange’ capacitive behaviour can be explained if oneconsiders that, in the value of the capacitance of intergranular contacts, one also has thedielectric constant (see figure 12). For low CO concentrations, the water–CO reactiondominates, i.e. surface dipoles (OH groups) are removed from the surface and electronsare released into the grains. This is in line with the observed decrease in resistance. Thereason for the observed capacitance decrease is the decrease of ε associated to the decrease

Topical Review R831
0 10 20 30 40 50 600,0
0,5
1,0
1,5
2,0
humid air
dry air
Nor
mal
ised
CP
E
CO concentration (ppm)
250°C 300°C 350°C 400°C
Figure 15. Normalized values of the CPE in a background of dry and humid air (50% relativehumidity) for exposure to CO (0–50 ppm). In the case of dry air as the background gas, theCPE value increases monotonically with increasing CO concentration. In the case of humid air(50% relative humidity) as the background gas it decreases at first when exposed to 10 ppm COand then increases with increasing CO concentration. For CO concentrations above 20 ppm, thecurves in dry and humid air are approximately parallel.
240 260 280 300 320 340 360 380 400 420
-0.65
-0.60
-0.55
-0.50
-0.45
-0.40
-0.35
-0.30
-0.25
n
R0
R1
240 260 280 300 320 340 360 380 400 420
-0.8
-0.7
-0.6
-0.5
-0.4
-0.3
n
R0
R1
R2
0% r.h. 50% r.h.
Temperature (°C) Temperature (°C)
Figure 16. Influence of the operational temperature on the different resistors in the equivalentcircuit for dry air (left) and humid air (right) as the background gas. The resistance behaviour ofthe various resistors in the presence of CO has been characterized by the power law exponent n. Thepower law exponents have been obtained by fitting the resistance curves of a resistor as a functionof the CO concentration with a power law (R = R0 p−n
CO). The error bars in the plots representthe standard deviation of the fitting values. The power law exponent of R0 decreases slightly withincreasing temperature, whereby the behaviour is similar for dry and humid air. The power lawexponent dependence of the other resistors on the operation temperature is significantly different.However, the behaviour of the exponents in dry air again resembles the exponent behaviour inhumid air.
of surface dipole concentration, which is dominant at low CO concentrations. One assumesthat in the capacitance change the driving factor is the change in the dielectric constantε (which decreases the capacitance) and not the change of band bending VS (which, asalready described, increases the capacitance). For higher CO concentrations, the CO–
R832 Topical Review
oxygen reaction dominates, which means that the dominant factor is the decrease of theband bending VS . Accordingly the resistance is decreased and the capacitance is increasedexactly as in the dry case, so the curves in dry background gas and in humid backgroundgas become parallel with increasing CO concentration.
• The different behaviours in dry and humid background air confirm the hypothesis resultingout of the work function measurements of a dominant OH–CO interaction for low COconcentrations (ε-effect) and a dominant CO–O interaction for high CO concentrations(VS-effect).
The resistance dependence on the CO concentration can be described by a power law function(R ∼ p−n
CO) in the examined concentration range (10–50 ppm CO) for all resistors R0 to R2
(one has to remember that R0 appears without a capacitive term, which could indicate thatit is not associated with a depletion region). If the exponents are plotted for both dry andhumid background air as a function of the operational temperature (figure 16), the exponentsfor R0 and R1 in dry background air resemble those for humid background air. Moreover,the exponent behaviour of R2 greatly resembles the exponent behaviour of R1. The exponentvalues for R1 and R2 are strongly affected by changes in the operational temperature, whereasfor R0 the exponent changes only slightly with operational temperature. Based on theseresults, it is plausible to assume that, for both dry and humid background air, there are twocontributions within the sensitive layer, which behave qualitatively differently. These twocontributions might be related to two different regions within the layer or to two differenttypes of contribution, which are distributed more or less homogeneously within the layer. R2,which only appears in dry background air, shows a similar CO dependence to R1. It is likelythat, in the case of humidified background gas, the humidity masks the presence of R2 in thefit, for example, resulting in a more narrow distribution of the grain boundary characteristicsreflected by only one (RC) element.
Before, it was assumed that all resistors R0 to R2 are related to Schottky barriers at the grainboundaries. The qualitative difference in CO dependence should thus be related to two differenttypes of grain–grain interconnections or to grain boundaries with two different surroundings.However, theoretical calculations [42, 43] show that a distribution of the energy barriers arounda mean value can be approximated by an effective barrier height q · V ef f
S . Therefore, the COinteraction and thus the power law exponent should not be affected.
The observed difference in the power law exponent of the resistors R0 and R1 (R2) couldthen be related to a change in the reactivity. If this is the case, a difference in the surroundingsmust cause this change in reactivity. One explanation would be that the surface of SnO2 grains,which are rather close to the Pt electrodes, might be populated—due to the catalytic activity ofthe electrodes—with a different concentration of reactive species than those which are ratherdistant from the electrodes.
Another possible interpretation for the presence of different reactivities would be a mixtureof partly and completely depleted grains. In this case the different surroundings of the grain–grain interconnections are the depleted (r < λD) or partly depleted grains (r > λD) withwhich they are connecting. As presented in [14], depleted grains and partly depleted grainswould also give rise to different power law exponents. Also, completely depleted grains shouldappear only as a resistor in the equivalent circuit due to the lack of a Schottky capacitance.The CO dependence of the resistor can be described by a power law whose exponent is smallerthan that of partly depleted grains. This is in accordance with what has been observed for R0
in relation to R1 and R2.There are a few elements that indicate that the first explanation might be the right one.
First of all, the above-mentioned effect of Pt electrodes on the CO catalytic conversion. In

Topical Review R833
0.00 0.02 0.04 0.06 0.08 0.10
0
500
1000
1500
1/d (1/µm)
Air
10, 40, 120 ppm CO
0 100 200 300 400 500
500
0
1000
1500
2000
l (µm)
Air
10, 40, 120 ppm CO
b)
a)
R (k
Ω)
R b
(kΩ
cm)
Figure 17. Dependence of the sensor resistance in air and in 10, 40 and 120 ppm CO on thesensor geometry as determined by Bauer et al [23]. The measurements have been performed in50% relative humidity. (a) Dependence on the layer length l. (b) Dependence on the layer thicknessd.
addition, results obtained by Bauer et al [23] on similar thick film sensors, where the sensitivelayer of these sensors is based on doped SnO2 and has been deposited by screen printing onan identical alumina substrate, may provide additional information on the results discussedpreviously. Figure 17 presents the influence of the geometry on the sensor resistance in airor CO (10–120 ppm). The sensitive layer deposited can be approximated as a parallelepiped.Transmission line measurements have been performed on the layer, i.e. the resistance of thelayer has been determined for various electrode distances and thus various sample lengths l.With increasing sample length l, the resistance in air and in CO increases in a linear fashionas one would expect from
R = ρl
bd(15)
with l = layer length, b = layer width and d = layer thickness.

R834 Topical Review
If, on the other hand, the layer thickness d is reduced from 100 to 5 µm, only the resistancein air changes as expected. In contrast to this, the resistance in CO remains unchanged. Asa consequence, the resistivity ρ cannot be homogenous throughout the layer. It is reasonableto assume that a partial layer with resistance and a thickness of d < 5 µm determines theresistance in the case of CO exposure. A further increase in the total layer thickness does notchange the layer resistance. Therefore the resistivity of the added part has to be significantlylarger. The total layer can be divided into three partial layers: a layer at the top which is in directcontact with the gas atmosphere, a layer in the middle which is reached after gas diffusion and alayer at the bottom which is in direct contact with the substrate. With increasing thickness, thethickness of the intermediate layer is increased. Therefore it is plausible to assume that eitherthe top or the bottom layer is the layer which has the characteristically low resistivity underCO exposure. In another experiment on the same sensors Bauer et al [23] investigated thedependence of the response time and the recovery time for CO exposure on the layer thickness.They found that the response time increases in a linear way with the layer thickness. This is ahint that the layer on the bottom plays the main role in the case of CO detection and that the gashas to reach the bottom layer before the equilibrium response can be achieved. These resultsemphasize once more the significant influence of the substrate on the gas sensing properties.
On the basis of the results obtained from the phenomenological sensor characterization,the sensing of CO in the presence of water vapour seems to be described as follows:
(1) CO sensing on tin oxide sensors is associated with consumption forming CO2. Theconsumption is a linear phenomenon. The power law dependence of the resistance on theCO concentration is due to the transduction dominated by Schottky barriers.
(2) Water adsorption results in the formation of:
• hydroxyl groups bound to Sn atoms forming strong surface dipoles and hence leadingto changes in the electron affinity;
• donors attributed to ‘rooted’ hydroxyl groups.
(3) Oxygen adsorption results in temperature-dependent ionosorbed species (O−2 , O2− and
O−), with O− dominating in the range of interest (250–400 C)
(4) CO sensing occurs via two pathways:
• reaction with ionosorbed oxygen and• reaction with hydroxyl groups, which changes the electron affinity and releases H
atoms. The latter combine with lattice oxygen and provide donors (rooted hydroxylgroups), i.e. free charge carriers.
For lower concentrations and temperatures the reaction with OH groups dominate.(5) The resistance dependence—of the equivalent circuit resistors corresponding to the
different elements in the sensing layer—on the CO concentration for both dry and humidbackground air can be described by a power law (R ∼ p−n
CO) and resemble each other.The dependence of the exponent on the operational temperature can be related to twoqualitatively different contributions to the layer resistance. These two contributions couldbe due to tin dioxide grains close to and further away from the catalytically active electrodesor due to the existence of depleted and undepleted grains.
(6) The overall consumption of sensors is not an independent combination of the contributionsof the different sensor parts. The presence of the substrate influences the consumption ofthe sensitive layer. The effect of the sensor signal and the sensitive layer in contact withthe Pt electrodes increases with increasing water vapour content of the gas.
For the validation of the modelling, additional spectroscopic measurements were performed.

Topical Review R835
4000 3800 3600 3400 3200 3000
0.00
0.02
0.04
0.06H
2O / H
3O+
OHroot, SnO
2
OHiso, SnO
2
OHAl
2O
3-l
ogR
efle
ctiv
ity
wavenumber (cm-1)
Pd doped sensor, RTundoped powder, RT
Figure 18. DRIFT spectra of a sol–gel SnO2 powder and of the Pd doped sensor in the OH rangeat room temperature.
3.6. DRIFT measurements
The DRIFT spectra of sensors can be divided into three regions with their characteristic bands(for experimental details and complete results, see [19]):
• the region between 4000 and 3000 cm−1: the stretching mode of hydroxyl groups andwater-related species,
• the region between 2700 and 2000 cm−1: hydrated proton species, CO and CO2 in thegas phase, physisorbed CO and CO2,
• the region between 2000 and 1000 cm−1: unidentate, bidentate carbonates, carboxylates,oxygen ions, the deformation mode of water-related species and the absorption of freecharges.
As an illustration, figure 18 shows RT DRIFT spectra of a powder prepared by a sol–gelmethod with a grain size of 100 nm and of a Pd doped sensor in the region between 4000 and3000 cm−1 (the baseline was performed by using the spectra of KBr powder and of a KBrlayer deposited over a sensor substrate). This comparison was necessary in order to:
• assess, by comparison with the well known and accepted use of the DRIFT technique onpowders, the correctness of our results,
• to evaluate the differences originating from the sensor substrate.
One can see that several bands corresponding to the surface hydroxyl groups from the spectraof the sensor and the powder are overlapping. The bands at 3660, 3623 and 3608 cm−1
correspond to the isolated OH groups from tin dioxide (Sn–OH) while the bands at 3555, 3525and 3484 cm−1 correspond to the tin dioxide rooted hydroxyl groups (OO–H). This indicatesthat what we are measuring is coming from the SnO2 sensitive layer.
However, in this region we also see differences. For example, a sharp band at 3728 cm−1,not detected in the powder, can be assigned to hydroxyl groups observed on the aluminasubstrate [44, 45]. The occurrence of this additional band is due to the fact that the penetrationdepth of the IR radiation is in the range of millimetres and the thickness of the sensitive layeris 50 µm only; accordingly, we will also gain information related to the species adsorbed onthe substrate. Also, the band at 3522 cm−1, corresponding to the one for the rooted OH group,

R836 Topical Review
2000 1800 1600 1400 1200 1000
0
2
4
6
8
10
12
1450 ppm CO, 50% r.h.250 ppm CO, 50% r.h.500 ppm CO, 50% r.h.
10-2
10-210-2
KM
-uni
t
wavenumber (cm-1)
2600 2400 2200 2000
0.0
0.1
0.2
0.3
0.4
0.5
0.6
0.7
COgas
CO2 (gas)
H3O+
50 ppm CO, 50% r.h.250 ppm CO, 50% r.h.500 ppm CO, 50% r.h.
KM
-uni
t
wavenumber (cm-1)4000 3800 3600 3400 3200 3000
-1.2
-0.9
-0.6
-0.3
0.0
0.3
OH / H2O associate/ H
2O / H
3O+
OHAl
2O
3
50 ppm CO, 50% r.h.250 ppm CO, 50% r.h.500 ppm CO, 50% r.h.
KM
-uni
t
wavenumber (cm-1)
(a) (b)
(c)
Figure 19. DRIFT spectra of Pd doped sensor at different CO concentrations in humid air; thedifferent spectral ranges are shown separately.
and the broad band corresponding to the coordinated water/hydrated proton species belongingto the SnO2 were not observed in the spectrum of the powder. The latter differences are mostprobably caused by the different pre-treatments of the powder and sensor and by the differentsurface properties of the compared SnO2.
In the recorded DRIFT spectra of the sensor a general increase of absorption can beseen: it is caused by the absorption on free charges and almost completely masks all usefulinformation between 2000 and 1000 cm−1. As an example, figure 19 presents the effect of COadsorption in the presence of humidity on the DRIFT spectra of the Pd doped sensors (for thebaseline correction the spectra of the sensor before CO exposure was used as reference). Inthe presence of water the isolated hydroxyl groups on SnO2 are becoming broader and showa shift towards lower wavenumbers. This fact indicates an association of the hydroxyl groupsto water molecules most probably through hydrogen bonds. Hydroxyl groups on alumina donot show the same trend (no broadening and shifting of this band) (figure 19(a)). The broadband belonging to the OH/H2O associations shows a very marked decrease with the increase ofCO concentration (more than one order of magnitude when compared to the dry case: resultsnot shown here; for details, see [19]). The OH groups on alumina also show a decrease inintensity. Parallel to the decrease of the band intensity in the OH/H2O region, a clear increaseof hydrated proton species, CO2 and CO in the gas phase (between 2700 and 2000 cm−1) and

Topical Review R837
an increase of free charge concentration were observed. At 50% relative humidity the decreaseof the hydroxyl group band intensity, the sensor signal and the concentration of the hydratedproton species, as well as the concentration of the free charges, are much higher upon COexposure than in the case of dry air. In order to derive the correlation between the changesin the intensity of the different bands during CO exposure, a quantitative band analysis forPd doped and undoped sensors was performed. (Measurements on undoped sensors are stillbeing carried out and their detailed results will be published elsewhere.)
To summarize, the results for CO experiments on Pd doped sensors are:
• the reduction of the bands in the OH/H2O region is much higher in humid air than in dry air,as well as the increase of the concentration of the hydrated proton species (between 2700and 2000 cm−1) and free charges (2000 and 1000 cm−1). The reaction between surfaceoxygen ions and CO is most probably responsible for the changes of the resistance in dryair. In the presence of water, the reaction between CO and hydroxyl groups determinesthe creation of hydrated protons, which additionally increases the sensor signal. The exactrole of Pd in the reaction mechanism is still unclear but, due to the fact that for undopedsensors we record a different effect of humidity, Pd should play a determining role. Itis also important to note that hydroxyl groups present at the sensor surface do not seemto react with CO in the absence of water vapour; this fact indicates that the associationbetween OH groups and H2O is the condition necessary for reaction with CO.
• The creation of CO2 is not in line with the expected sensitization in the presence ofhumidity. As shown in [17], the cause is the additional oxidation of CO on the Pt electrodesand heater, which does not influence the sensor response and which is inhibited by thepresence of humidity.
The results of DRIFT studies suggest that the role of the donor is played by the hydratedproton and not by the rooted hydroxyl group as was assumed by only taking into account thephenomenological studies. This again indicates that spectroscopic knowledge is crucial to theunderstanding of gas sensing. Using only electrical studies it is not possible to distinguishbetween the surface species which can play the same ‘electrical’ role.
On the basis of the knowledge gained up to now, one will have to advance in the followingdirections:
• Improvement of the performance of the DRIFT method with the aim of gaining usefulinformation in the spectral range where the absorption bands of oxygen ions, carbonatesand carboxylates are present;
• Using knowledge of the nature of the reaction paths for the microscopic modelling of theelementary steps with the aim of determining the associated energetic (electronic) levelsof the surface, adsorption complex, precursor state and free molecule, and understandingthe role of dopants;
• The transformation of the microscopic knowledge of changes in concentrations andmobilities of free charge carriers and the sensor resistance dependence of the ambientatmosphere to be validated by phenomenological measurements.
4. Conclusion and outlook
This work demonstrates that gas sensors based on metal oxides are complex devices and thatit is not possible to understand them in the absence of a systematic approach. Accordingly,such an approach was proposed and applied with a reasonable degree of success. The results

R838 Topical Review
obtained up to now are the first steps in understanding the mechanism of gas sensing with metaloxide sensors starting with the mechanistic level and continuing with the transducer function.
There are still a number of specific topics to be investigated and clarified; however, thealready acquired knowledge allows for the next advances, especially towards an understandingof the role of dopants. The open questions are currently under investigation following theproposed line of thinking.
We think that by using the methodology developed in this work it is possible to expand thisapproach to other model systems including different metal oxides and target gases (mixtures).It is important to remember that the identification of the research targets, the preparation of thesamples needed and the use of the appropriate research methods are crucial steps in any suchattempt. Accordingly, it seems to us that sensor science has to be elaborated by combiningthe interests and knowledge of sensor developers, sensor users and scientists aiming at basicunderstanding; all these experts should talk to each other for their mutual benefit. The userscan clearly identify the relevant objectives, the developers can optimize the samples/sensorsand the scientists will be able to acquire the knowledge needed for further advances. The latterwill have to be validated by the development of better performing real world sensors able tobe applied for solving relevant practical problems.
References
[1] Barsan N, Schweizer-Berberich M and Gopel W 1999 Fundamentals and practical applications to designnanoscaled SnO2 gas sensors: a status report Fresenius J. Anal. Chem. 365 287–304
[2] Schierbaum K D, Weimar U and Gopel W 1990 Multicomponent gas analysis: an analytical approach appliedto modified SnO2 sensors Sensors Actuators B 2 71
[3] Mizsei J and Harsanyi J 1983 Resistivity and work function measurements on Pd-doped SnO2 sensor surfaceSensors Actuators 3 397
[4] Mizsei J and Lantto V 1991 Simultaneous response of work function and resistivity of some SnO2-based samplesto H2 and H2S Sensors Actuators B 4 163
[5] Geistlinger H, Eisele I, Flietner B and Winter R 1996 Dipole- and charge transfer contribution to the workfunction change of semiconducting thin films: experiment and theory Sensors Actuators B 34 499
[6] Lenaerts S, Honore M, Huyberechts G, Roggen J and Maes G 1994 In situ infrared and electrical characterizationof tin dioxide gas sensors in nitrogen/oxygen mixtures at temperatures up to 720 K Sensors Actuators B 18/19478
[7] Gutierrez J, Ares M, Horrillo M.C, Sayago I, Agapito J and Lopez L 1991 Use of complex impedancespectroscopy in chemical sensor characterization Sensors Actuators B 4 359
[8] Gutierrez F J, Ares L, Robla J I, Horrillo M, Sayago I and de Agapito J A 1992 Properties of polycrystalline gassensors based on dc and ac electrical measurements Sensors Actuators B 8 231
[9] Xingqin L, Chunhua C, Wendong X, Yusheng S and Guangyao M 1993 Study on SnO2–Fe2O3 gas-sensingsystem by ac impedance technique Sensors Actuators B 17 1
[10] Ovenston, Sprinceana D, Walls J.R and Caldararu M 1994 Effect of frequency on the electrical characteristicsof tin–antimony-oxide mixtures J. Mater. Sci. 29 4946
[11] Weimar U and Gopel W 1995 AC measurements on tin oxide sensors to improve selectivities and sensitivitiesSensors Actuators B 26/27 13
[12] Martinelli G, Carotta M.C, Passari L and Tracchi L 1995 A study of the moisture effects on SnO2 thick filmsby sensitivity and permittivity measurements Sensors Actuators B 26/27 53
[13] Labeau M, Schmatz U, Delabouglise G, Roman J, Vallet-Regi M and Gaskov A 1995 Capacitance effects andgaseous adsorption on pure and doped polycrystalline tin oxide Sensors Actuators B 26/27
[14] Barsan N and Weimar U 2001 Conduction model of metal oxide gas sensors J. Electroceramics 7 143–67[15] Barsan N, Heilig A, Kappler J, Weimar U and Gopel W CO—water interaction with Pd-doped SnO2 gas sensors:
simultaneous monitoring of resistances and work functions Conf. Proc. EUROSENSORS XIII, The Hague(The Netherlands) pp 183–4
[16] Kappler J, Barsan N, Weimar U and Gopel W Influence of water vapour on nanocrystalline SnO2 to monitorCO and CH4 Conf. Proc. EUROSENSORS XI, Warschau (P) pp 1177–80

Topical Review R839
[17] Kappler J, Barsan N, Tomescu A and Weimar U 2001 CO consumption of Pd doped SnO2 based sensors ThinSolid Films 391 186–91
[18] Harbeck S, Barsan N, Weimar U and Hoffmann V 2001 In situ diffuse reflectance infrared spectroscopy studyof CO adsorption on SnO2 Thin Solid Films 391 176–85
[19] Harbeck S, Szatvanyi A, Barsan N, Weimar U and Hoffmann V 2003 DRIFT and electrical resistance studies ofthick film SnO2 sensors: temperature changes effect and CO detection mechanism in the presence of watervapour Thin Solid Films submitted
[20] Barsan N, Siciliano P, Kappler J, Vantaggio M, and Weimar U 2003 CO sensing with SnO2 sensors in thepresence of humidity as revealed by impedance spectroscopy measurements Sensors Actuators B submitted
[21] Kappler J, Barsan N, Weimar U, Diegez A, Alay J L, Romano-Rodriguez A, Morante J R and Gopel W 1998Correlation between XPS, Raman and TEM measurements and the gas sensitivity of Pt and Pd doped SnO2
based gas sensors Fresenius J. Anal. Chem 361 110–14[22] Barsan N, Stetter J R, Findlay M and Gopel W 1999 High performance gas sensing of co: comparative tests for
semiconducting (SnO2-based) and for amperometric gas sensors Anal. Chem. 71 2512–17[23] Bauer M, Barsan N, Ingrisch K, Zeppenfeld A, Denk I, Schuman B, Weimar U and Gopel W 1997 Geometry
and electrodes on the characteristics of thick films SnO2 gas sensors; influence of measuring voltage Proc.11th European Microelectronics Conference (Venice, May 1997) pp 37–44
[24] Riviere J C 1969 Work Function: Measurements and Results in Solid State Surface Science ed M Green (NewYork: Dekker) pp 179–289
[25] Tracy J C and Blakely J M 1968 A study of faceting of tungsten single crystal surfaces Surf. Sci. 13 313[26] Ihokura K and Watson J 1994 The Stannic Oxide Gas Sensor Principles and Applications (Boca Raton, FL:
Chemical Rubber Company Press)[27] Gopel W and Schierbaum K D 1995 SnO2 sensors: current status and future prospects Sensors Actuators B
26/27 1[28] Williams D 1999 Semiconducting oxides as gas-sensitive resistors Sensors Actuators B 57 1–16[29] Heiland G and Kohl D Chemical Sensor Technology vol 1, ed T Seiyama (Tokyo: Kodansha) ch 2 pp 15–38[30] Morrison S R 1990 The Chemical Physics of Surfaces 2nd edn (New York: Plenum)[31] Henrich V A and Cox P A 1994 The Surface Science of Metal Oxides (Cambridge: Cambridge University Press)
p 312[32] Egashira M, Nakashima M and Kawasumi S 1981 Change of thermal desorption behaviour of adsorbed oxygen
with water coadsoption on Ag+-doped Tin (IV) oxide J. Chem. Soc. Chem. Commun. 1047[33] Barsan N and Ionescu R 1993 The mechanism of the interaction between CO and an SnO2 surface: the role of
water vapour Sensors Actuators B 12 71[34] Ionescu R and Vancu A 1994 Time-dependence of the conductance of SnO2:Pt:Sb in atmospheres containing
oxygen, carbon monoxide and water vapour 1. Non-oscillatory behaviour Appl. Surf. Sci. 74 207–12[35] Schierbaum K D, Weimar U and Goepel W 1991 Conductance, work function and catalytic activity of SnO2-
based gas sensors Sensors Actuators B 205–14[36] Tanaka K, Morimoto S, Sonoda S, Matsuura S, Moriya K and Egashira M 1991 Combustion monitoring sensor
using tin oxide semiconductor Sensors Actuators B 3 247–53[37] Huyberechts G, Szecwka P, Roggen J and Licznerski B W 1997 Simultaneous quantification of carbon monoxide
and methane in humid air using a sensor array and an artificial neural network Sensors Actuators B 45 123–30[38] Vancu A, Moise C, Tomescu A and Ionescu R 1999 Role of water vapour in the interaction of SnO2 with CO
and CH4 Sensors Actuators B 61 39–42[39] Hahn S, Barsan N and Weimar U 2001 Investigation of CO/CH4 mixture measured with differently doped SnO2
sensors Sensors Actuators B 78 64–8[40] Gopel W 1985 Chemisorption and charge transfer at semiconductor surfaces: implications for designing gas
sensors Prog. Surf. Sci. 20 9[41] Yamazoe N, Fuchigami J, Kishikawa M and Seiyama T 1979 Interactions of tin oxide surfaces with O2, H2O
and H2 Surf. Sci. 86 335[42] Romppainen R and Lantto V 1988 The effect of microstructure on the height of potential energy barriers in
porous tin dioxide gas sensors J. Appl. Phys. 63 5159[43] Sinkkonen J 1980 DC conductivity of a random barrier network Phys. Status Solidi b 102 151[44] Liu X and Truit R E 1997 DRIFT studies of the surface of gamma-alumina J. Am. Chem. Soc. 119 9856–60[45] Tsyganenko A A and Mardilovich P P 1996 Structure of alumina surfaces J. Chem. Soc. Faraday Trans. 92
4843–52