understanding the implications of the digital generation ... · pdf fileunderstanding the...
TRANSCRIPT

Proprietary and Confidential
Prepared by:
Understanding the Implications of the
Digital Generation on Business Education
Phase 3: Attitudes and Usage Study 2017
Quantitative Report
Commissioned by:

Proprietary and Confidential 2
Table of Contents
Introduction 3
How to Read This Report 4
Executive Summary 5
Select Insights and Commentary 14
Country-Specific Infographics 31
Detailed Data 42
Appendix 64

Proprietary and Confidential 3
Introduction
Objectives
Three associations that serve the business management education industry, AACSB International, the Executive MBA
Council (EMBAC), and the International Consortium for Executive Education (UNICON), seek insights into the
evolving expectations and experiences of the up-and-coming generations of professionals spanning “Generation Z”
and “Millennials” (so-called “digital generations”). These three associations will be collectively referred to as
“Commissioning Organizations” throughout this report as the sponsor of this study.
In addition to understanding the evolving demographics as they relate to business education, the Commissioning
Organizations are specifically interested in opportunities that the digital generations present for business schools in
both degree-based education and non-degree executive education spaces. The Commissioning Organizations seek to
learn how business schools can align their education models and adopt effective strategies to meet the needs of the
digital generations throughout their careers. This study was designed to explore the broad range of management
learning and development alternatives that will be available to these respondents in the future, respondents’
motivations for pursuing certain management education options, and their attitudes toward available options.
This Quantitative Report summarizes Phase 3 of a multi-phase study sponsored by the Commissioning Organizations.
Methodology
• The questionnaire was developed by the Commissioning Organizations and Percept Research.
• The questionnaire was administered in five native languages (Chinese-Traditional, English, French,
Portuguese, Spanish) via a web survey hosted by Percept Research and delivered through a select panel
provider.
• Percept Research tabulated the data and developed the quantitative report.
• Sample quotas were proposed to provide representation among countries that have the largest populations of
potential advanced management education students. The per-country quota was highest for the United States
owing to the country’s market size and population diversity.
Fielding Overview
• Fielding Started: July 28, 2017
• Fielding Completed: August 20, 2017
Current Residence N % of Total Quota % of Quota
Australia 111 6.7% 100 111.0%
Brazil 106 6.4% 100 106.0%
China 108 6.5% 100 108.0%
France 110 6.6% 100 110.0%
India 102 6.1% 100 102.0%
Singapore 36 2.2% 30 120.0%
South Africa 78 4.7% 75 112.0%
Spain 112 6.7% 100 104.0%
UK 110 6.6% 100 110.0%
United States 792 47.6% 800 99.0%
Total 1,665 100.0% 1,605 103.7%
Quota by Country

Proprietary and Confidential 4
How to Read this Report
Segmentation
• Male vs. Female
• 21-30 vs. 31-40 years old
• Country of Residence: Australia, Brazil, China, France, Germany, India, Singapore, South Africa, Spain, United
Kingdom, United States. ”Outside the United States” refers to individuals that reside in Australia, Brazil, China,
France, Germany, India, Singapore, South Africa, Spain, and the United Kingdom.
• Employment Status (i.e., full-time, part-time, not employed).
• Education level (answer options categorized into three groups: No college through two-year Associate’s degree;
Bachelor’s degree; and graduate coursework through graduate degree).
• Likelihood to pursue advanced management education in the next ten years (categorized into three groups, including
respondents Extremely or Very Likely (Top 2 Box); those Somewhat Likely; and those Not Very and Not at All Likely
(Bottom 2 Box).
Reading Chart Values
• Charts in this report display values to one decimal place (e.g., 4.6). For reported percentages, aggregated values may
not always sum to 100.0% due to rounding. For “checkbox” questions in which respondents “Select all that apply,”
total reported percentages may exceed 100.0% since more than one answer choice may be selected by a single
respondent.
Statistical Precision
• Significance testing (comparisons of column means and column proportions) were conducted across the segmentation
above at a 95% confidence level. Significant differences are highlighted in the findings commentary.
• A 0.1 difference in means may be statistically significant given the large sample size and the amount of variance
around the mean.
• The commentary within this report presents the word “significant” to identify statistical significance.
Data Cleaning
• Straight-line responses removed (i.e., respondents who entered the same value across all questions or attributes) from
data set and Do Not Know/Not Applicable removed where appropriate.
• Data cleaning also included removal of responses that indicated the respondent completed the survey in half the
median completion time or otherwise contributed nonsensical responses to open-ended questions.
Verbatim Responses
• Responses to open-ended and ‘other specify’ questions were grouped into key mentions and listed throughout this
report. To view all responses in their entirety to those questions, please refer to the Verbatim Document.
Terminology
• The symbol ‘N’ refers to the number of respondents that provided a valid response to that particular question.
• For many of the 5-point scale questions within the study, frequency ratings are presented as ‘Top 2 Box’ or ‘Bottom 2
Box’ – this provides an intuitive approach to understand the number of respondents with a strong sentiment. A Top 2
Box is the net score of the highest two categories of a rating scale. For example, if the scale is: Extremely Likely, Very
Likely, Somewhat Likely, Not Very Likely, and Not at All Likely, then the combined category of Extremely Likely and
Very Likely is referred to as the Top 2 Box score (whereas Bottom 2 Box is the combined ratings of Not Very Likely,
and Not at All Likely). Note: The Top refers to the positive/highest scale response options, not the position of the
options on the questionnaire or in a table.
Proprietary and Confidential 5
Executive Summary

Proprietary and Confidential 6
Executive SummaryKey Findings
• When considering motivations for pursuing advanced management education, female respondents issued higher ratings for Provide increased career stability and job security than male counterparts. Male respondents provided higher ratings for Make it easier to start my own business.
• Female respondents look specifically to the MBA or MA/MS in Management to Improve my standard of living and Provide increased career stability and job security; however, female respondents look to Management courses and Non-Degree Executive Education to Gain additional respect and credibility in my current job.
• Respondents 21 to 30 years old consider Make it easier to start my own business and Obtain international exposure and access stronger motivations for their pursuit of advanced management education compared to their older counterparts. Conversely, those between 31 and 40 years old give more credence to advanced management education to Make it easier to change fields or organizations.
Career objectives can vary subtly but notably among various demographic segments.
• Only one in ten respondents are Not Very Likely or Not at All Likely to pursue certificates or digital badges as an educational option.
• Certificates and digital certificates provide more attractive options for individuals employed full-time and those holding a graduate degree. In an open-ended question, respondents frequently mentioned the convenience it would provide in their attempt to juggle current employment.
• Compared to respondents working toward or holding a graduate degree, those whose highest level of education is a Bachelor’s degree are more likely to see value in certificates and digital badges.
• Individuals not considering pursuing an MBA, Specialized Master’s, or Business and Management courses not part of a formal program in the next ten years are more likely to find certificates and digital badges as a complement to non-degree coursework compared to those Extremely or Very Likely to pursue these options.
• Almost half of respondents overall believe certificates and digital badges are valuable as a complement to a non-degree coursework or program; over a quarter believe it can substitute for a formal degree, and another 17.4% see these as equally valuable as a substitute or complement to a formal or non-degree program.
• Over half of female respondents (53%) recognized value in certificates and digital badges compared to 44% of males.
Non-traditional education options, like certificates and digital badges, are gaining credibility and interest among respondents.

Proprietary and Confidential 7
Executive SummaryKey Findings
• The MBA or MA/MS in Management is considered the Most Appropriate choice across all motivations for pursuing advanced management education addressed in this study; however, substantial interest lies in other forms and formats.
• Respondents overall express strong interest in credit for life/work experience. Individuals most interested in pursuing credit for life/work experiences report being Extremely Likely or Very Likely to pursue an advanced management program in the next 10 years and are currently employed full-time.
• Those who are Extremely or Very Likely to pursue Non-degree Executive Education are respondents who are currently employed full-time, who possess a graduate degree or completed some graduate coursework, and who reside in the United States.
• Female respondents placed more significance than males to On-the-job training.
• In calculations of respondents’ perceived value of the four education formats as Most Appropriate for motivations addressed in this study, a cumulative 41.5% of respondents selected either Non-Degree Executive Education or Management Courses. This indicates that there is a strong demand for informal and non-graduate degree education options.
Although traditional Master’s programs continue to carry weight as markers of credibility, prospective students express interest in flexible options they can use to customize their own course plans.
• The top three overall motivations (Improve my (and/or my family's) standard of living; Provide increased career stability and job security; and Improve my leadership/management skills) received significantly higher ratings from respondents from the United States compared to residents outside the United States. Make it easier to advance in my field or organization, the sixth highest rated motivation, also received higher ratings in the United States. Obtain international exposure and access was the one motivation that received significantly higher ratings from respondents outside the United States.
• Respondents in the United States are significantly more likely to have Completed at Least One Online or Blended Course compared to those outside the United States.
• Residents of the United States are more likely to pursue Non-degree Executive Education than those outside the United States.
• Residents of the United States expressed greater interest in On-the-job training compared to respondents outside the United States.
• Residents outside the United States are driving the selection of Specialized Master’s as the Most Appropriate education option for motivations studied here.
Each country and culture presents unique education experiences and preferences that suggest program design and delivery be developed considering each country’s demographics and distinctions.
Proprietary and Confidential 8
Executive Summary
Key Findings
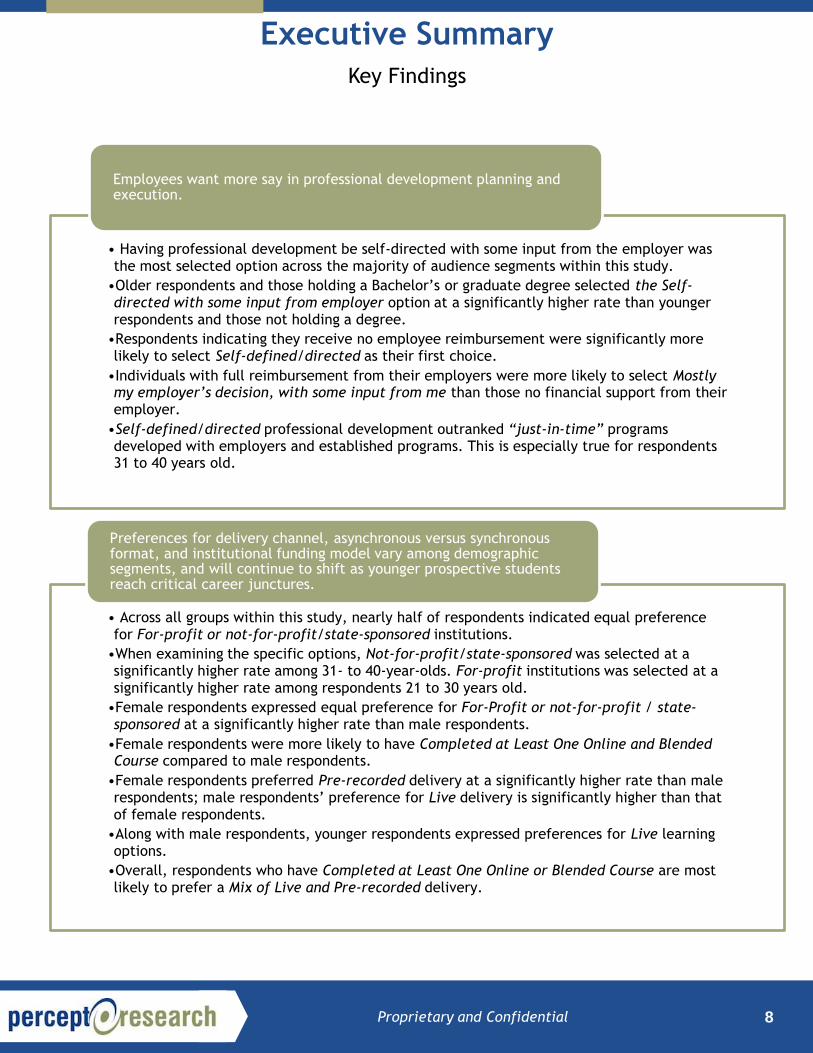
• Having professional development be self-directed with some input from the employer was the most selected option across the majority of audience segments within this study.
•Older respondents and those holding a Bachelor’s or graduate degree selected the Self-directed with some input from employer option at a significantly higher rate than younger respondents and those not holding a degree.
•Respondents indicating they receive no employee reimbursement were significantly more likely to select Self-defined/directed as their first choice.
•Individuals with full reimbursement from their employers were more likely to select Mostly my employer’s decision, with some input from me than those no financial support from their employer.
•Self-defined/directed professional development outranked “just-in-time” programs developed with employers and established programs. This is especially true for respondents 31 to 40 years old.
Employees want more say in professional development planning and execution.
• Across all groups within this study, nearly half of respondents indicated equal preference for For-profit or not-for-profit/state-sponsored institutions.
•When examining the specific options, Not-for-profit/state-sponsored was selected at a significantly higher rate among 31- to 40-year-olds. For-profit institutions was selected at a significantly higher rate among respondents 21 to 30 years old.
•Female respondents expressed equal preference for For-Profit or not-for-profit / state-sponsored at a significantly higher rate than male respondents.
•Female respondents were more likely to have Completed at Least One Online and Blended Course compared to male respondents.
•Female respondents preferred Pre-recorded delivery at a significantly higher rate than male respondents; male respondents’ preference for Live delivery is significantly higher than that of female respondents.
•Along with male respondents, younger respondents expressed preferences for Live learning options.
•Overall, respondents who have Completed at Least One Online or Blended Course are most likely to prefer a Mix of Live and Pre-recorded delivery.
Preferences for delivery channel, asynchronous versus synchronous format, and institutional funding model vary among demographic segments, and will continue to shift as younger prospective students reach critical career junctures.

Proprietary and Confidential 9
Likelihood of Enrolling in the Next 10 YearsA4. How likely is it that you will enroll in each of the following types of advanced management education
programs or courses in the next 10 years?
All Respondents
59.9%50.0% 47.8%
38.0%
25.8%
26.3% 31.0%
30.4%
14.3%23.8% 21.2%
31.6%
Master of BusinessAdministration, or MA or MSin Business or Management
Specialized Master's(Finance, Accounting,
Analytics, etc.)
Business and Managementcourses not part of a formal
program
Non-degree ExecutiveEducation
Top 2 Box Somewhat Likely Bottom 2 Box
Executive Summary
62.2%51.3% 45.2% 37.2%
25.1%27.4% 33.4%
30.7%
12.8%21.4% 21.4%
32.1%
Master ofBusiness
Administration,or MA or MS in
Business orManagement
SpecializedMaster's
(Finance,Accounting,
Analytics, etc.)
Business andManagement
courses not partof a formal
program
Non-degreeExecutiveEducation
Top 2 Box Somewhat Likely Bottom 2 Box
57.3%48.6% 50.7%
39.0%
26.6%24.9% 28.3%
30.1%
16.1%26.5% 21.0%
30.9%
Master ofBusiness
Administration,or MA or MS in
Business orManagement
SpecializedMaster's
(Finance,Accounting,
Analytics, etc.)
Business andManagement
courses not partof a formal
program
Non-degreeExecutiveEducation
Top 2 Box Somewhat Likely Bottom 2 Box
Respondents 21 to 30 Year Old Respondents 31 to 40 Year Old

Proprietary and Confidential
3.4
3.4
3.5
3.6
3.6
3.8
3.9
4.0
3.6
3.6
3.7
3.8
3.7
3.9
4.0
4.1
1 2 3 4 5
Lectures
Presentations done by you and/or other participants
Small-group seminars
Case studies
Simulations or competitions
Project-based learning
Hands-on classroom exercises, demonstrations, or workshops
On-the-job training
Extremely + Very Likely to Pursue(Top 2 Box)
All Respondents
10
Executive Summary
Master of Business Administration, or MA or MS in Business or Management
14.3%
5.9%
8.5%
25.8%
25.0%
34.9%
59.9%
Bottom 2 Box
Not at All Likely
Not very Likely
Somewhat Likely
Very Likely
Extremely Likely
Top 2 Box
Likelihood to Pursue in Next 10 Years
Demographic Profile (Significant Differences):
• Males selected Extremely Likely to pursue at a significantly higher rate than Females (Males 39.6% versus Females
30.4%).
• Residents of the United States selected Extremely Likely to pursue at a significantly higher rate than those residing
outside the United States (40.5% United States versus 30.0% outside United States).
• Individuals employed Full-time selected Extremely Likely to pursue at a significantly higher rate than those not
employed Full-time (38.1% Full-time versus 23.9% not employed Full-time).
• Individuals who have either started graduate work or completed a graduate degree (grouped into one analysis
category) selected Extremely Likely to pursue at a significantly higher rate than the two other analysis groups, namely,
those who currently hold a Bachelor’s degree, and those who have not started college/started college/hold a two-year
Associate’s Degree (43.2% Graduate versus 33.2% Bachelor’s versus 24.9% No college/Associate’s).
• The ratings of Effectiveness of Learning Approaches by those most likely to pursue this advanced management
education program are higher compared to All Respondents. This indicates higher expectations among individuals most
likely to pursue this advanced management program.
56.6%63.1%
Female Male
Likelihood to Pursue in Next 10 YearsTop 2 Box (Extremely Likely and Very
Likely) by Gender
Not at All
LikelyExtremely
Likely
Comparison of Effectiveness of Learning Approaches:All Versus Respondents Selecting Extremely or Very Likely to Pursue

Proprietary and Confidential
3.4
3.4
3.5
3.6
3.6
3.8
3.9
4.0
3.6
3.7
3.7
3.8
3.8
3.9
3.9
4.0
1 2 3 4 5
Lectures
Presentations done by you and/or other participants
Small-group seminars
Case studies
Simulations or competitions
Project-based learning
Hands-on classroom exercises, demonstrations, or workshops
On-the-job training
Extremely + Very Likely to Pursue(Top 2 Box)
All Respondents
11
Executive Summary
Specialized Master’s (Finance, Accounting, Analytics, etc.)
23.8%
9.0%
14.8%
26.3%
27.9%
22.2%
50.0%
Bottom 2 Box
Not at All Likely
Not very Likely
Somewhat Likely
Very Likely
Extremely Likely
Top 2 Box
Likelihood to Pursue in Next 10 Years
Demographic Profile (Significant Differences):
• Males selected Extremely Likely and Very Likely to pursue a Specialized Master’s at a significantly higher rate than
Females (Males 24.5% and 30.7%, respectively, versus Females 19.5% and 24.8%).
• Individuals interested in an MBA or MA/MS in Business or Management selected Extremely Likely and Very Likely to
pursue a Specialized Master’s program at a significantly higher rate than individuals not interested in the advanced
management education program (30.5% Extremely Likely and 35.2% Very Likely versus 9.2% and 16.9%, respectively).
• The ratings of Effectiveness of Learning Approaches by those most likely to pursue this advanced management
education program are higher compared to All Respondents across several variables. This indicates higher expectations
among individuals most likely to pursue this advanced management program.
44.3%
55.2%
Female Male
Likelihood to Pursue in Next 10 YearsTop 2 Box (Extremely Likely and Very
Likely) by Gender
Comparison of Effectiveness of Learning Approaches:All Versus Respondents Selecting Extremely or Very Likely to Pursue
Not at All
LikelyExtremely
Likely

Proprietary and Confidential
3.4
3.4
3.5
3.6
3.6
3.8
3.9
4.0
3.6
3.7
3.7
3.8
3.8
3.9
4.0
4.1
1 2 3 4 5
Lectures
Presentations done by you and/or other participants
Small-group seminars
Case studies
Simulations or competitions
Project-based learning
Hands-on classroom exercises, demonstrations, or workshops
On-the-job training
Extremely + Very Likely to Pursue(Top 2 Box)
All Respondents
12
Executive Summary
Business and Management courses not part of a formal program
21.2%
7.8%
13.4%
31.0%
26.2%
21.6%
47.8%
Bottom 2 Box
Not at All Likely
Not very Likely
Somewhat Likely
Very Likely
Extremely Likely
Top 2 Box
Likelihood to Pursue in Next 10 Years
Demographic Profile (Significant Differences):
• Individuals interested in an MBA or MA/MS in Business or Management selected Extremely Likely and Very Likely to
pursue Business and Management courses not part of a formal program at a significantly higher rate than individuals
not interest in the advanced management education program (27.0% Extremely Likely and 30.5% Very Likely versus
13.0% and 19.4%, respectively).
• Individuals interested in a Specialized Master’s selected Extremely Likely and Very Likely to pursue these informal
options at a significantly higher rate than individuals not interested in the advanced management education program
(28.8% Extremely Likely and 31.4% Very Likely versus 14.5% and 21.0%, respectively).
• Individuals who have started graduate work or completed a graduate degree (grouped into one analysis category)
selected Extremely Likely to pursue this education option at a significantly higher rate than the two other analysis
groups, namely, those who hold a Bachelor’s degree, and those who have not started college/started college/hold a 2
year Associate’s Degree (26.2% Graduate versus 19.8% Bachelor’s versus 17.9% No college/Associate’s).
• The ratings of Effectiveness of Learning Approaches by those most likely to pursue this advanced management
education program are higher compared to All Respondents. This indicates higher expectations among individuals most
likely to pursue this advanced management program.
45.0%50.1%
Female Male
Likelihood to Pursue in Next 10 YearsTop 2 Box (Extremely Likely and Very
Likely) by Gender
Comparison of Effectiveness of Learning Approaches:All Versus Respondents Selecting Extremely or Very Likely to Pursue
Not at All
LikelyExtremely
Likely

Proprietary and Confidential
3.4
3.4
3.5
3.6
3.6
3.8
3.9
4.0
3.6
3.7
3.7
3.8
3.8
3.9
4.0
4.0
1 2 3 4 5
Lectures
Presentations done by you and/or other participants
Small-group seminars
Case studies
Simulations or competitions
Project-based learning
Hands-on classroom exercises, demonstrations, or workshops
On-the-job training
Extremely + Very Likely to Pursue(Top 2 Box)
All Respondents
13
Executive Summary
Non-degree Executive Education
31.6%
12.3%
19.2%
30.4%
22.3%
15.7%
38.0%
Bottom 2 Box
Not at All Likely
Not very Likely
Somewhat Likely
Very Likely
Extremely Likely
Top 2 Box
Likelihood to Pursue in Next 10 Years
Demographic Profile (Significant Differences):
• Residents of the United States selected Extremely Likely to pursue Non-degree Executive Education at a significantly
higher rate than those residing outside the United States (17.7% United States versus 13.9% outside United States).
• Individuals employed Full-time selected Extremely Likely to pursue at a significantly higher rate than those not
employed Full-time (16.9% Full-time versus 11.7% not employed Full-time).
• Individuals selecting Extremely Likely and Very Likely to pursue the other three advanced management education
programs in this study are also significantly more likely to select the same likelihood for the Non-degree
• Individuals who have started graduate work or completed a graduate degree (grouped into one analysis category)
selected Extremely Likely to pursue at a significantly higher rate than the two other analysis groups, namely, those
who hold a Bachelor’s degree, and those who have not started college/started college/hold a 2 year Associate’s
Degree (20.8% Graduate versus 12.7% Bachelor’s versus 13.8% No college/Associate’s).
• The ratings of Effectiveness of Learning Approaches by those most likely to pursue this advanced management
education option are higher compared to All Respondents across most attributes.
35.8% 39.5%
Female Male
Likelihood to Pursue in Next 10 YearsTop 2 Box (Extremely Likely and Very
Likely) by Gender
Comparison of Effectiveness of Learning Approaches:All Versus Respondents Selecting Extremely or Very Likely to Pursue
Not at All
LikelyExtremely
Likely

Proprietary and Confidential 14
Select Insights and Commentary
Proprietary and Confidential 15
Select Insights and Commentary
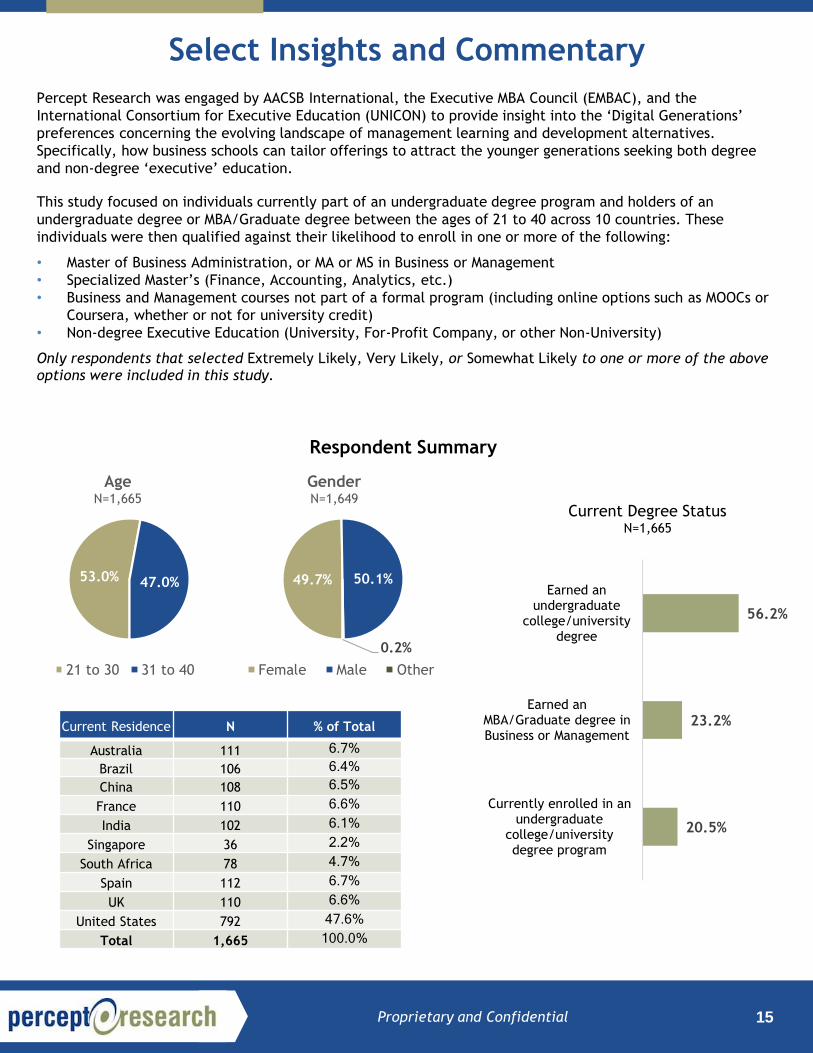
Percept Research was engaged by AACSB International, the Executive MBA Council (EMBAC), and the
International Consortium for Executive Education (UNICON) to provide insight into the ‘Digital Generations’
preferences concerning the evolving landscape of management learning and development alternatives.
Specifically, how business schools can tailor offerings to attract the younger generations seeking both degree
and non-degree ‘executive’ education.
This study focused on individuals currently part of an undergraduate degree program and holders of an
undergraduate degree or MBA/Graduate degree between the ages of 21 to 40 across 10 countries. These
individuals were then qualified against their likelihood to enroll in one or more of the following:
• Master of Business Administration, or MA or MS in Business or Management
• Specialized Master’s (Finance, Accounting, Analytics, etc.)
• Business and Management courses not part of a formal program (including online options such as MOOCs or
Coursera, whether or not for university credit)
• Non-degree Executive Education (University, For-Profit Company, or other Non-University)
Only respondents that selected Extremely Likely, Very Likely, or Somewhat Likely to one or more of the above options were included in this study.
20.5%
23.2%
56.2%
Currently enrolled in anundergraduate
college/universitydegree program
Earned anMBA/Graduate degree inBusiness or Management
Earned anundergraduate
college/universitydegree
Current Degree StatusN=1,665
49.7% 50.1%
0.2%
GenderN=1,649
Female Male Other
Respondent Summary
53.0% 47.0%
AgeN=1,665
21 to 30 31 to 40
Current Residence N % of Total
Australia 111 6.7%Brazil 106 6.4%China 108 6.5%France 110 6.6%India 102 6.1%
Singapore 36 2.2%South Africa 78 4.7%
Spain 112 6.7%UK 110 6.6%
United States 792 47.6%Total 1,665 100.0%

Proprietary and Confidential 16
Improve my (and/or my family's) standard of living (82.4%)
Improve my leadership/management skills (81.6%)
Provide increased career stability and job security (81.3%)
Top 3 MotivationsTop 2 Box
Likelihood of Enrolling in the Next 10 Years
Bottom 2 Box:
Not Very Likely or Not
at All Likely
Top 2 Box:
Extremely Likely
Or Very Likely
Master of Business Administration, or MA or MS in Business or Management 14.3% 59.9%
Specialized Master's (Finance, Accounting, Analytics, etc.) 23.8% 50.0%
Business and Management courses not part of a formal program 21.2% 47.8%
Non-degree Executive Education 31.6% 38.0%
1.8 1.92.3
1
2
2
3
Self-defined /directed
“Just-in-time” An establishedprogram
Least
Attractive
Most
Attractive
Program Preferences by Type of Institution
Top Preference for Planning Professional Development
48.6%
31.5%
15.2%4.6%
Mostly mydecision
Equal input fromme and myemployer
Mostly myemployer'sdecision
Do not know
Effectiveness of Learning Approaches
3.4
3.4
3.5
3.6
3.6
3.8
3.9
4.0
1.0 2.0 3.0 4.0 5.0
Lectures
Presentations done by youand/or other participants
Small-group seminars
Simulations or competitions
Case studies
Project-based learning
Hands-on classroom exercises,demonstrations, or workshops
On-the-job training
Mean Not at All
Effective
Extremely
Effective
46.1%31.0%
22.9%
For-profit or not-
for-profit / state-sponsored
Not-for-profit orstate-sponsored
For-profit
Select Insights and Commentary
Attractiveness of OptionsNote: Scale is reversed where lower is a more positive result

Proprietary and Confidential 17
Select Insights and Commentary
Motivations for Pursuing Advanced Management Education
Respondents were asked to rate the importance of a series of statements as it relates to motivations for
pursuing an advanced management education. The results provide insights into how providers can target
messaging to potential students. The table below indicates the motivations that received an above average
rating (4.0 or higher) — motivations with a below average rating are not displayed (means in parentheses).
Improve my (and/or my family's) standard of living (4.3)
Provide increased career stability and job security (4.2)
Improve my leadership/management skills (4.2)
Improve my technical/functional skills (4.2)
Make it easier to advance in my field or organization I am in at that time (4.1)
Increase my professional network (4.1)
Gain additional respect and credibility in my current job (4.0)
Source: B1. How important are each of the following motivations to your interest in pursuing future
advanced management education? 1 to 5 scale with 1 = Not at all Important and 5 = Extremely Important.
Mean across all variables is 4.0.
Improving my (and/or my family’s) standard of living was the highest rated variable in terms of motivation.
Over 51% of respondents rated this motivation as Extremely Important, making it the only motivation to receive
such a high rating from over half of all respondents. Provide increased career stability and job security and
Improve my leadership/management skills received the second and third highest Extremely Likely ratings (46.5%
and 45.5%, respectively).

Proprietary and Confidential 18
Select Insights and Commentary
Motivations and Gender
Gender diversity is recognized by corporations and the advanced management education industry alike as a
focal point for identifying talent and fostering a diverse workforce. The 2015 Phase 2 study by Executive Core
found that 80% of the corporations they interviewed had a focus on accelerating females through their
development programs and into top positions.1 Phase 3 data exhibits distinctions in motivations for advanced
management education between female and male respondents. Female respondents in this study did provide
statistically significant higher ratings for Provide increased career stability and job security than their male
counterparts (4.3 versus 4.2). Male respondents, however, provided significantly higher ratings for Make it
easier to start my own business (3.8 versus 3.6), but this was not one of the main motivations referenced on the
previous page. Female respondents are looking at the MBA or MA/MS in Management to Improve my standard of
living and Provide increased career stability and job security; however, female respondents look to
Management courses and Non-Degree Executive Education to Gain additional respect and credibility in my
current job.
1 Executive Core. “Future Trends in Business Education.” 2015, page 3.
3.7
3.8
3.9
3.9
4.1
4.1
4.2
4.2
4.2
4.3
3.6
3.6
3.9
4.0
4.0
4.2
4.2
4.2
4.3
4.3
3.6
3.7
3.9
4.0
4.1
4.1
4.2
4.2
4.2
4.3
1.0 2.0 3.0 4.0 5.0
Obtain international exposure and access
Make it easier to start my own business
Make it easier to change fields or organizations
Gain additional respect and credibility in my current job
Increase my professional network
Make it easier to advance in my field or organizationI am in at that time
Improve my technical/functional skills
Improve my leadership/management skills
Provide increased career stability and job security
Improve my (and/or my family's) standard of living
All Female Male
Not at All
Important
Extremely
Important

Proprietary and Confidential 19
Select Insights and Commentary
Motivations and Age
Although there are no significant differences between age and the seven top-rated motivations, there are some
differences within the three motivations rated lowest overall. For example, 21- to 30-year-olds consider Make it
easier to start my own business and Obtain international exposure and access more motivating than their older
counterparts. Conversely, those between 31 and 40 years old give more credence to advanced management
education to Make it easier to change fields or organizations.
3.9 3.7 3.63.8 3.8 3.74.0
3.6 3.5
1.0
2.0
3.0
4.0
5.0
Make it easier to change fields ororganization
Make it easier to start my ownbusiness
Obtain international exposure andaccess
Total 21 to 30 31 to 40
Not at All Important
Extremely Important
Source: B1. How important are each of the following motivations to your interest in pursuing future advanced
management education?
Motivations and Geography
While overall ranking is not impacted dramatically, there are significant differences in geography when
comparing motivations of respondents from the United States to those of other countries. The top three overall
motivations received significantly higher ratings from respondents from the United States compared to residents
outside the United States. Make it easier to advance in my field or organization, the sixth highest rated
motivation, also received higher ratings in the United States. Obtain international exposure and access was the
one motivation that received significantly higher ratings from respondents outside the United States.
4.3 4.2 4.2 4.13.6
4.4 4.3 4.3 4.2
3.5
4.2 4.2 4.2 4.13.8
1.0
2.0
3.0
4.0
5.0
Improve my (and/ormy family's)
standard of living
Provide increasedcareer stability and
job security
Improve myleadership /
management skills
Make it easier toadvance in my field
or organization
Obtain internationalexposure and access
Total United States Outside the United States
Source: B1. How important are each of the following motivations to your interest in pursuing future advanced
management education?
Not at All Important
Extremely Important

Proprietary and Confidential 20
Select Insights and Commentary
Motivations and Education Choices
Overall, the MBA or MA/MS in Management is considered the Most Appropriate choice across all motivations. This
type of advanced management education received its highest ratings across two of the top three motivations –
Improve my (and/or my family’s) standard of living (36.6%) and Provide increased career stability and job
security (35.3%).
32.4%
26.1%
18.1%
23.4%
Most Appropriate Choice(Degree of Perceived Value, Averaged)
MBA or MA/MS in Management
Specialized Master's
Non-Degree Executive Eduction (including online options,not a formal program)Management Courses
Source: B2A-J. Which type of advanced management
education do you think would be the Most Appropriate
choice for each of the following motivations? Results
presented are average across all motivations.
The Specialized Master’s received the second highest
ratings across all motivations. When it comes to
Improve my technical/functional skills, this type of
program was the most often selected (30.9%). This
program type was also selected as the Most Appropriate
by close to 30% of respondents across an additional two
of the top motivations – Gain additional respect and
credibility in my current job (30.8%) and Make it easier
to advance in my field or organization I am in at the
time (29.3%). According to Mastering the Mix, by Tricia
Bisoux, the number of specialized masters programs
offered by MBA programs has increased by over 10%
from 2009 to 2013.2 It is apparent that business schools
are reacting to this trend, and the findings in this study
support that this is an opportunity for growth.
Leveraging the key motivations can assist in attracting
prospective students and working with corporations to
partner in these programs.
Improve my leadership/management skills (30.7%) was
the only motivation in which Management Courses
received significant responses. Management Courses
was selected as the second Most Appropriate choice for
Make it easier to start my own business (27.4%),
Improve my technical/functional skills (26.8%) and
Increase my professional network (24.8%).
2 Bisoux, Tricia. “Mastering the Mix.” Biz Ed, September/October 2015, page 24.
Non-Degree Executive Education received the lowest frequency of Most Appropriate choice across all
motivations except for Improve my leadership/management skills (18.6%) where it was the second lowest. For
this education channel, younger respondents did provide significantly higher ratings than older respondents
across several motivations. This includes Gain additional respect and credibility in my current job, Make it
easier to advance in my current field or organization, Make it easier to change fields or organizations, Improve
my leadership/management skills, Improve my standard of living and Provide increased career stability and job
security. There is also a similar trend among those not holding a college degree and those bearing a two-year
Associate’s degree.
When examining across all four advanced management education options, it should be noted that 41.5% of
respondents selected Non-Degree Executive Education or Management Courses. This indicates that there is a
strong demand for informal and non-graduate degree education options. While not consistent across all
variables, there is tendency for those with an two-year Associate’s degree or a graduate degree to state that
Informal, non-graduate degree options are the Most Appropriate choice for certain motivations, including
include Gain additional respect and credibility in my current job, Increase my professional network, Improve
my leadership/management skills and Make it easier to change fields or organizations.

Proprietary and Confidential 21
Select Insights and Commentary
-13.8%
-16.0%
10.4%
19.4%
-40.0% -20.0% 0.0% 20.0% 40.0%
Management Courses
Non-Degree Executive…
Specialized Master's
MBA or MA/MS in Management
Improve my (and/or my family's) standard of living
Education Options Deemed Most and Least Appropriate for Motivations
As expected, there is an inverse relationship between the selection of Most Appropriate and Least Appropriate
in terms of motivations of advanced executive education. The charts below demonstrate this relationship across
the top six motivations by displaying the difference between these two ratings (positive number indicates higher
percentage selected as Most Appropriate compared to Least Appropriate).
-11.4%
-16.0%
9.4%
18.0%
-40.0% -20.0% 0.0% 20.0% 40.0%
Management Courses
Non-Degree Executive…
Specialized Master's
MBA or MA/MS in Management
Provide increased career stability and job security
1.2%
-12.0%
-4.2%
14.9%
-40.0% -20.0% 0.0% 20.0% 40.0%
Management Courses
Non-Degree Executive…
Specialized Master's
MBA or MA/MS in Management
Improve my leadership/management skills
-2.3%
-13.5%
9.8%
5.9%
-40.0% -20.0% 0.0% 20.0% 40.0%
Management Courses
Non-Degree Executive…
Specialized Master's
MBA or MA/MS in Management
Improve my technical/functional skills
-7.8%
-13.9%
8.8%
12.9%
-40.0% -20.0% 0.0% 20.0% 40.0%
Management Courses
Non-Degree Executive…
Specialized Master's
MBA or MA/MS in Management
Make it easier to advance in my field or organization I am in at that time
-7.9%
-10.9%
2.8%
15.9%
-40.0% -20.0% 0.0% 20.0% 40.0%
Management Courses
Non-Degree Executive…
Specialized Master's
MBA or MA/MS in Management
Increase my professional network
Source: B2A-J. Which type of advanced management education do you think would be the most appropriate choice for
each of the following motivations? Results presented are average across all motivations.
Source: B3A-J. Which type of advanced management education do you think would be the least appropriate choice for
each of the following motivations? Results presented are average across all motivations.
Least Appropriate - Most Appropriate
Least Appropriate - Most Appropriate
Least Appropriate - Most Appropriate
Least Appropriate - Most Appropriate
Least Appropriate- Most Appropriate
Least Appropriate - Most Appropriate

Proprietary and Confidential 22
Select Insights and Commentary
Delivery Methods
Business schools are exploring new delivery methods in an attempt to adapt to the changing requirements of the
market. According to the Executive MBA Council’s annual Membership Program Survey, over 46.7% of programs
reported coursework was delivered through distance learning.3 Online delivery of courses, both full delivery or
hybrid delivery, has been under consideration by traditional classroom-based institutions for several years.
According to “Mastering the Mix,” several global business schools have, or are considering, shutting down
classroom-based programs in favor of hybrid approaches.4 The discontinuation of the face-to-face full-time MBA
program at the University of Iowa Tippie College of Business is one recent example of a shift from traditional
models to meet the changing demands of the market.5
Among the respondents to this study, 54.0% indicated they have Completed at Least One Online or Blended
Course. This covers both undergraduate or graduate courses across any field. Conversely, 25.1% of respondents
have Never Taken an Online or Blended Course.
3 Executive MBA Council. “Standard Report. Industry Trends and Research Results.” 2016, page 63.4 Bisoux, Tricia. “Mastering the Mix.” Biz Ed, September/October 2015, page 24.5 Gardyasz, Joe. “Cost-cutting Not a Factor in Full-time MBA Phase-out, Gardial Says.” Business Record August 20, 2017.
Source: C1. How would you describe your own experience with online learning at the undergraduate or graduate
level (in any field, not just management)?
54.0%
25.1% 20.9%
Completed at Least OneOnline or Blended Course
Never Taken an Online orBlended Course
Started an Online orBlended Course but Never
Completed One
The findings of this study suggest that while older respondents may have had more opportunity to pursue and
complete Online or Blended Courses, female respondents were significantly more likely to take advantage of
that delivery method compared to male respondents:
• Female respondents are significantly more likely to have Completed at Least One Online or Blended Course
compared to male respondents (56.7% versus 51.6%).
• Respondents 31 to 40 years old are significantly more likely to have Completed at Least One Online or
Blended Course compared to their younger counterparts (57.5% versus 50.9%). The same can be said of
respondents in the United States compared to those outside the United States (60.6% versus 48.0%).
• Respondents 21-30 years old are significantly more likely to have Started an Online or Blended Course but
Never Completed One compared to those 31-40 years old (25.0% versus 16.2%). Respondents outside the
United States also follow the same trend compared to those residing in the United States (23.5% versus
18.1%).

Proprietary and Confidential 23
Select Insights and Commentary
Respondents were also asked to state their previous experience with various delivery methods and delivery
preferences. The graphic below demonstrates the correlation between experience with an online or blended
course and propensity to prefer this mechanism for future courses.
• Individuals who have Completed at Least One Online or Blended Course are most likely to prefer a Mix of
Live and Pre-recorded delivery.
• Respondents who have started but not completed an online or blended course are most likely to prefer Pre-
recorded delivery exclusively.
From an overall market perspective, content delivered Live exclusively is the least preferred method. It should
be noted, however, that there is a specific set of respondents that have never taken an online or blended
course and still prefers live delivery. This appears to be a shrinking population.
36.4% 34.5% 25.1% 29.9%
26.6%42.5%
32.6% 33.2%
37.1%23.0%
42.3% 36.9%
Never Taken Online orBlended Course
Started Online orBlended Course butNever Completed
Completed at Least OneOnline or Blended Course
Total
Delivery Preference by Experience
Live Pre-recorded Mix of Live and Pre-recorded
Learning Options
29.9%
33.2%
36.9%
Live Pre-Recorded Mix
Preference regarding learning options is relatively evenly split across
all respondents with a Mix of Live and Pre-recorded content being
the most popular choice. While female respondents stated this Mixed
delivery is the preferred method (39.3%), they also prefer Pre-
recorded delivery at a significantly higher rate than male
respondents (36.2% versus 29.9%). Conversely, male respondents
slightly prefer Live delivery and Mixed delivery at a similar rate
(35.1% and 35.0% respectively). Their preference for Live delivery is
significantly higher than female respondents (24.5%).
Source: C2. For subjects which are taught online, or for online components of blended courses, which of the
following learning options would you prefer?

Proprietary and Confidential 24
Select Insights and Commentary
Value of Certificate or Digital Badge
This study examined the viability of several new options for advanced management education. One item
presented was the concept of receiving certificates or digital badges for completing management courses.
According to Jim Fong and Christin Fleming in “Navigational Generational Shifts: Understanding Today’s Student
Demographics, Preferences and Expectations,” Universities should be exploring and offering multiple types of
credentials.” In fact, their study found that 34% of their respondents are very interested in earning an
educational, professional, or skill-based certificate or badge in the future.6
Within this study, almost half of the respondents believe certificates or digital badges are Valuable as a
complement to non-degree coursework or program. This is driven by female respondents, where over half (53%)
recognized value in this option compared to 44% of males. A similar trend is present among two other groups:
those who work non-full-time versus full-time employment, and those holding a Bachelor’s degree versus
working towards or holding a graduate degree. Individuals not considering pursuing an MBA, Specialized
Master’s, or Business and Management courses not part of a formal program in the next ten years are more
likely to find certificates and digital badges Valuable as a complement to non-degree coursework compared to
those Extremely or Very Likely to pursue these options.
Over a quarter of the respondents believe it can be Valuable as a substitute to a formal degree program. While
not as high as the the previously mentioned options, 17.4% of respondents did indicate these options are equally
valuable to a formal or non-degree program as a substitute or complement. The sizeable percentage of
respondents indicating value, combined with only 8.4% indicating it is Not at all valuable, supports the belief
that alternatives to traditional credentials is growing in popularity.
48.2%
26.0%
17.4%
8.4%
Valuable as a complement tonon-degree coursework or
program
Valuable as a substitute to aformal degree program
Equally valuable to a formalor non-degree program as asubstitute or complement
Not at all valuable, either as asubstitute or complement
Value of Certificate or Digital Badge
Source: D1. For your own professional development, how would you compare the value of a certificate or digital
badge to a degree program in helping you reach your goals?
6 Fong, Jim and Fleming, Christina, “Navigating Generational Shifts: Understanding Today’s Student Demographics,
Preferences and Expectations.” June 2017, page 8.

Proprietary and Confidential 25
Select Insights and Commentary
50.4%31.5% 23.2%
26.5%
34.1%29.9%
15.8%25.7%
36.1%
5.0% 5.8% 8.5%
2.4% 2.9% 2.3%
Valuable as a substitute to a formaldegree program
(N=419)
Equally valuable to a formal or non-degree program as a substitute or
complement(N=276)
Valuable as a complement to non-degree coursework or program
(N=773)
Likelihood to Pursue a Certificate or Digital Badge by Perceived Value
Extremely Likely Very Likely Somewhat Likely Not Very Likely Not at All Likely
Perceived Value of Traditional and Non-Traditional Education Credentials
Approximately 50.4% of respondents that believe certificates or digital badges are Valuable as a substitute to a
formal degree program are Extremely Likely to pursue this option as a way to achieve professional or personal
goals. In fact, more than 3 in 4 are Extremely Likely or Very Likely to pursue certificates or digital badges. This
rate is significantly higher than those that see this option as Valuable as a complement to non-degree
coursework or program and Equally valuable to a formal or non-degree program as a substitute or complement.
Respondents interested in an advanced management education program are also more likely to be interested in
a digital badge or certificate.
Source: D2. How likely would you be to pursue a certificate or digital badge to achieve your professional or personal
goals?
There is a direct correlation between likelihood to pursue an advanced management education program and
likelihood to pursue a certificate or digital badge. For example, regarding respondents who stated they are
Extremely Likely or Very Likely to pursue a Master of Business Administration, or MA or MS in Business or
Management in the next ten years, they were significantly more likely also to report they are Extremely Likely
to pursue a certificate or digital badge to achieve their professional or personal goals (42.0% versus 15.5% of
those who are Somewhat Likely, Not Very Likely or Not at All Likely). This trend can be seen across all four
advanced management education programs within this study.

Proprietary and Confidential 26
Select Insights and Commentary
Perceived Value of Traditional and Non-Traditional Education Credentials
Respondents were asked to provide additional detail on reasons that would influence how likely they would be
to pursue a certificate or digital badge. Overall, respondents’ most frequently mentioned items relate to the
flexibility of such an option. Individuals gave numerous mentions on the convenience it would provide in their
attempt to juggle their current employment while furthering their desire to gain additional knowledge. In
addition, respondents perceive that certificates and digital badges would be a valuable tool in their career
growth as a tangible certification would provide them additional credibility. The word cloud below highlights
key themes in respondents’ explanations for their interests in certificates and digital badges.
Note: Verbatim responses were examined and coded by key themes. Those themes are represented below with
extraneous words removed. The larger the word, the more frequently the term was mentioned.
Source: D2. Please explain your answer in the previous question by telling us the reasons that influence how likely you would
be to pursue a certificate or digital badge.

Proprietary and Confidential 27
Select Insights and Commentary
Attractiveness of Advanced Management Education Customization
Respondents were asked to rate the attractiveness of customized advanced management education options using
a three-point scale (1=Most Attractive and 3=Least Attractive). Self-defined/directed professional development
received the most ‘1’ mentions across all three options presented. “Just-in-time” courses received the second
most ‘1’ mentions with established programs a distant third. In fact, Established programs received more ‘3’
ratings than Self-directed and “just-in-time” combined.
Source: D4. Please rank the following three alternatives on how attractive they are to you, with “1” as the Most
Attractive and “3” as Least Attractive, as a way of achieving your goals?
42.9%
33.9%
23.1%
35.6%
40.7%
23.7%21.5%
25.4%
53.2%
Self-defined/directed professionaldevelopment, possibly using
employer guidelines
A “just-in-time” series of courses which you would develop jointly
with an employer to better prepare you for your current and/or next job
An established program, such as onethat would be used to earn an MBA
at a leading business school
Rated '1' Rated '2' Rated '3'
Individuals 31 to 40 years old favor a Self-defined/directed option at a significantly higher rate than those 21 to
30 years old. Comparing the mean result, the older age group scored Self-defined/directed at 1.7 versus 1.8 for
the younger group. Conversely, 21- to 30-year-olds gave established programs a mean score of 2.3, which is
significantly lower than the 2.4 from 31- to 40-year-olds. Individuals holding a Bachelor’s degree find Self-
defined/directed options more appealing than both those holding a Graduate degree and groups with a two-year
Associates degree/some college/no degree. Respondents with full-time employment believe established
programs are the least attractive option at a significantly higher rate compared to respondents with part-time or
not currently employed. The same trend holds true for residents of the United States compared to those residing
outside the United States.

Proprietary and Confidential 28
Select Insights and Commentary
Attractiveness of Customization by Intent to Pursue Advanced Management Education
Trends do emerge when examining by individuals who stated they were Extremely Likely to one of the four
degree options presented. Individuals most likely to pursue an MBA or MA/MS in Business or Management are
significantly more interested in the self-defined route. This is influenced by individuals who are currently are
employed full-time and perhaps looking for more flexibility to fit their schedule. Specialized Master’s, while not
as closely aligned to employment status, also follows a similar trend. This is further supported by the findings
from “Future Trends of Leadership Development” which stated companies are seeking customized and “just-in-
time” learning that supports better alignment with their needs and market trends.7
21.9%
25.4%
27.3%
29.0%
MBA or MA/MS in Business
Specialized Master's
Bus./Mgmt Courses Not Partof Formal Program
Non-Degree Exec. Education
Established Program
35.0%
34.0%
34.4%
32.9%
MBA or MA/MS in Business
Specialized Master's
Bus./Mgmt Courses Not Partof Formal Program
Non-Degree Exec. Education
Just-in-Time
43.1%
40.6%
38.4%
38.1%
MBA or MA/MS in Business
Specialized Master's
Bus./Mgmt Courses Not Partof Formal Program
Non-Degree Exec. Education
Self-defined/Directed
Percentage of ‘1’ Ratings By Those “Extremely Likely” To Pursue a Degree
7 Executive Core. “Future Trends in Business Education.” 2015, pages 5-6.
Source: D4 by A4.

Proprietary and Confidential 29
Select Insights and Commentary
Almost half of the individuals in this study prefer to
have the content, delivery and provider of their
advanced management education be primarily self-
directed with some input from their employer.
Slightly over 30% more believe it should be based on
equal input from their employer. Business schools
will have to work with both employees and
employers to ensure their input is taken into
consideration but ensure neither group is alienated
through perception of it being driven primarily by
the learner or employer.
Another trend in the industry is providing credit for
life/work experience. In spite of the potential
downside of not having as much knowledge on the
subject and lack of documentation of knowledge
(i.e., course not on transcript), 89% of respondents
are either Extremely Likely, Very Likely, or
Somewhat Likely to pursue this option.
There is also a correlation between individuals
Extremely Likely to pursue an advanced
management program in the next 10 years and
likelihood to pursue credit for life/work
experiences. This is largely driven by individuals
who are currently employed full-time.
48.6%
31.5%
15.2%
4.6%
Mostly my decision, with some input from my employer
Equal input from me and my employer
Mostly my employer’s decision, with some input from me
Do not know
Source: D5. Some employers can influence the content,
delivery, and provider of advanced management education
for their employees. If these were not solely the
employer’s decision, and you were interested in advanced
management education, which of the following options
would you prefer when planning for your professional
development?
4.2 4.2 4.1 4.2
MBA or MA/MS inBusiness
SpecializedMaster's
Bus./MgmtCourses Not Part
of FormalProgram
Non-Degree Exec.Education
Likelihood to Pursue Credit For Life/Work Experience Based on Specific Degree Interest
Source: D6. How likely would you be
to pursue this option (credit for
life/work experience) if it were
available to you as part of an
advanced management education
program?
A4. How likely is it that you will enroll
in each of the following types of
advanced management education
programs or courses in the next 10
years? Results come only from those
who responded Extremely Likely.
Preference on Planning Professional Development

Proprietary and Confidential 30
Select Insights and Commentary
Type of Institutions
Comparing education providers, respondents in this study identified For-profit institutions as the least desirable
institution type for advanced management education. Instead, Not-for-profit or state-sponsored institutions
were selected at a higher rate. Female respondents expressed Equal preference, for-profit or not-for-profit /
state-sponsored at a significantly higher rate than male respondents (50.5% versus 42.1%). Younger respondents
were more likely to select For-Profit institutions than older respondents. Older respondents stated preference
for Not-for-profit or state-sponsored at a significantly higher rate than their younger counterparts.
Source: D7. For your own professional development, would you be more likely to pursue a program offered by a
for-profit institution compared to a program offered by a not-for-profit or state-sponsored college/university?
46.1%31.0%
22.9%
Equal preference, for-profit or not-for-profit / state-sponsored
Prefer not-for-profit or state-sponsored
Prefer for-profit
Program Preferences by Type of Institution
30.0% 27.1% 28.8% 28.9%
44.9% 46.9% 46.0% 45.3%
25.0% 26.1% 25.3% 25.9%
Master of BusinessAdministration, or MA or MS in
Business or Management(N=571)
Specialized Master's (Finance,Accounting, Analytics, etc.)
(N=362)
Business and Managementcourses not part of a formal
program(N=352)
Non-degree ExecutiveEducation
(N=252)
Institution Preference by Those ”Extremely Likely” To Pursue a Degree
Not for profit or state sponsored For profit or not for profit / state sponsored For profit
When examining the results by individuals Extremely Likely or Very Likely to pursue some type of advanced
management education in the next 10 years, the preferences do not change significantly. Individuals interested
in Non-degree Executive Education are the most likely to consider a Not-for-profit or state-sponsored
institution.

Proprietary and Confidential 31
Country-Specific Infographics

Proprietary and Confidential 32
Australia(N=111)
51.4% 48.6%
Age
21 to 30 31 to 40
Full-Time Work Experience
10.8%
35.1% 29.7%24.3%
0Years
1-5Years
6-10Years
More than10 Years
Improve my technical/functional skills (4.1)
Improve my leadership/management skills (4.0)
Provide increased career stability and job security (4.0)
Top 3 Motivations
Likelihood of Enrolling in the Next 10 YearsNot at All
Likely
Not Very
Likely
Somewhat
Likely
Very
Likely
Extremely
Likely
Master of Business Administration, or MA or MS in Business or Management 8.3% 10.1% 33.9% 27.5% 20.2%Specialized Master's (Finance, Accounting, Analytics, etc.) 10.2% 20.4% 32.4% 25.0% 12.0%Business and Management courses not part of a formal program 7.5% 7.5% 30.8% 29.9% 14.0%Non-degree Executive Education 10.3% 20.6% 31.8% 29.9% 7.5%
2.2 2.0 1.8
1
2
3
An establishedprogram
“Just-in-time” Self-defined /directed
Least
Attractive
Most
Attractive
Attractiveness of OptionsNote: Scale is reversed where lower is a more positive result
Program Preferences by Type of Institution
27.0%47.7%
25.2%
Not-for-profit orstate-sponsored
For-profit or not-for-
profit / state-sponsored
For-profit
Top Preference for Planning Professional Development
48.6%
23.4% 19.8%8.1%
Mostly mydecision
Equal input fromme and myemployer
Mostly myemployersdecision
Do not know
Effectiveness of Learning Approaches
3.1
3.3
3.3
3.4
3.4
3.7
3.7
3.9
1 2 3 4 5
Presentations done by youand / or other participants
Lectures
Simulations or competitions
Case studies
Small-group seminars
Hands-on classroom exercises,demonstrations, or workshops
Project-based learning
On-the-job training
Mean Not at All
Effective
Extremely
Effective
15.3%
60.4%
24.3%
Earned an MBA/Grad.degree in Bus. Or Mgmt.
Earned an undergraduatecollege/university degree
Currently enrolled inundergrad. college/univ.
degree program
Current Status

Proprietary and Confidential 33
Brazil(N=106)
50.9% 49.1%
Age
21 to 30 31 to 4028.3%
45.3%
26.4%
Earned an MBA/Grad.degree in Bus. or Mgmt.
Earned an undergraduatecollege/university degree
Currently enrolled inundergrad. college/univ.
degree program
Current Status Full-Time Work Experience
4.7%
35.8% 36.8%22.6%
0Years
1-5Years
6-10Years
More than10 Years
Top 3 Motivations
Likelihood of Enrolling in the Next 10 YearsNot at All
Likely
Not Very
Likely
Somewhat
Likely
Very
Likely
Extremely
Likely
Master of Business Administration, or MA or MS in Business or Management 7.6% 12.4% 23.8% 24.8% 31.4%Specialized Master's (Finance, Accounting, Analytics, etc.) 7.6% 18.1% 24.8% 21.9% 27.6%Business and Management courses not part of a formal program 3.8% 5.7% 29.5% 28.6% 32.4%Non-degree Executive Education 7.9% 19.8% 32.7% 18.8% 20.8%
2.31.9 1.7
1
2
3
An establishedprogram
“Just-in-time” Self-defined /directed
Least
Attractive
Most
Attractive
31.1%49.1%
19.8%
Not-for-profit orstate-sponsored
For-profit or not-for-
profit / state-sponsored
For-profit
45.3%34.9%
17.9%1.9%
Mostly mydecision
Equal input fromme and myemployer
Mostly myemployersdecision
Do not know
3.3
3.4
3.5
3.6
3.8
3.8
3.9
3.9
1 2 3 4 5
Small-group seminars
Presentations done by youand / or other participants
Lectures
Simulations or competitions
On-the-job training
Project-based learning
Case studies
Hands-on classroom exercises,demonstrations, or workshops
Mean Not at All
Effective
Extremely
Effective
Improve my (and/or my family's) standard of living (4.4)
Improve my technical/functional skills (4.3)
Improve my leadership/management skills (4.3)
Top Preference for Planning Professional Development
Effectiveness of Learning Approaches
Program Preferences by Type of Institution
Attractiveness of OptionsNote: Scale is reversed where lower is a more positive result

Proprietary and Confidential 34
China(N=108)
60.2%
39.8%
Age
21 to 30 31 to 4018.5%
70.4%
11.1%
Earned an MBA/Grad.degree in Bus. or Mgmt.
Earned an undergraduatecollege/university degree
Currently enrolled inundergrad. college/univ.
degree program
Current Status Full-Time Work Experience
3.7%
43.5% 37.0%
15.7%
0Years
1-5Years
6-10Years
More than10 Years
Top 3 Motivations
Likelihood of Enrolling in the Next 10 YearsNot at All
Likely
Not Very
Likely
Somewhat
Likely
Very
Likely
Extremely
Likely
Master of Business Administration, or MA or MS in Business or Management 0.9% 6.5% 21.5% 30.8% 40.2%Specialized Master's (Finance, Accounting, Analytics, etc.) 1.9% 11.3% 22.6% 40.6% 23.6%Business and Management courses not part of a formal program 3.8% 9.4% 42.5% 25.5% 18.9%Non-degree Executive Education 0.9% 9.4% 41.5% 29.2% 18.9%
2.32.0
1.7 1
2
3
An establishedprogram
“Just-in-time” Self-defined /directed
Least
Attractive
Most
Attractive
30.6%50.0%
19.4%
Not-for-profit orstate-sponsored
For-profit or not-for-
profit / state-sponsored
For-profit
57.4%
25.0%15.7%
1.9%
Mostly mydecision
Equal input fromme and myemployer
Mostly myemployersdecision
Do not know
3.3
3.4
3.7
3.7
3.8
3.8
3.8
3.8
1 2 3 4 5
Lectures
Presentations done by youand / or other participants
On-the-job training
Small-group seminars
Case studies
Hands-on classroom exercises,demonstrations, or workshops
Project-based learning
Simulations or competitions
Mean Not at All
Effective
Extremely
Effective
Improve my technical/functional skills (4.3)
Improve my leadership/management skills (4.3)
Increase my professional network (4.2)
Top Preference for Planning Professional Development
Effectiveness of Learning Approaches
Program Preferences by Type of Institution
Attractiveness of OptionsNote: Scale is reversed where lower is a more positive result

Proprietary and Confidential 35
France(N=110)
60.9%
39.1%
Age
21 to 30 31 to 4040.0%
46.4%
13.6%
Earned an MBA/Grad.degree in Bus. or Mgmt.
Earned an undergraduatecollege /university degree
Currently enrolled inundergrad. college/univ.
degree program
Current Status Full-Time Work Experience
1.8%
48.2%36.4%
13.6%
0Years
1-5Years
6-10Years
More than10 Years
Top 3 Motivations
Likelihood of Enrolling in the Next 10 YearsNot at All
Likely
Not Very
Likely
Somewhat
Likely
Very
Likely
Extremely
Likely
Master of Business Administration, or MA or MS in Business or Management 9.2% 16.5% 36.7% 22.0% 15.6%Specialized Master's (Finance, Accounting, Analytics, etc.) 15.7% 15.7% 27.8% 25.9% 14.8%Business and Management courses not part of a formal program 13.9% 22.2% 27.8% 22.2% 13.9%Non-degree Executive Education 8.3% 15.7% 37.0% 23.1% 15.7%
2.1 2.0 1.9
1
2
3
An establishedprogram
“Just-in-time” Self-defined /directed
Least
Attractive
Most
Attractive
40.0% 39.1%20.9%
Not-for-profit orstate-sponsored
For-profit or not-for-
profit / state-sponsored
For-profit
46.4%
28.2%14.5% 10.9%
Mostly mydecision
Equal input fromme and myemployer
Mostly myemployersdecision
Do not know
3.1
3.4
3.4
3.4
3.4
3.4
3.5
3.7
1 2 3 4 5
Lectures
Case studies
Hands-on classroom exercises,demonstrations, or workshops
Presentations done by youand / or other participants
Simulations or competitions
Small-group seminars
Project-based learning
On-the-job training
Mean Not at All
Effective
Extremely
Effective
Improve my (and/or my family's) standard of living (4.1)
Increase my professional network (3.9)
Improve my technical/functional skills (3.9)
Top Preference for Planning Professional Development
Effectiveness of Learning Approaches
Program Preferences by Type of Institution
Attractiveness of OptionsNote: Scale is reversed where lower is a more positive result

Proprietary and Confidential 36
India(N=102)
63.7%
36.3%
Age
21 to 30 31 to 4033.3%
52.9%
13.7%
Earned an MBA/Grad.degree in Bus. or Mgmt.
Earned an undergraduatecollege/university degree
Currently enrolled inundergrad. college/univ.
degree program
Current Status Full-Time Work Experience
5.9%
58.8%
28.4%6.9%
0Years
1-5Years
6-10Years
More than10 Years
Top 3 Motivations
Likelihood of Enrolling in the Next 10 YearsNot at All
Likely
Not Very
Likely
Somewhat
Likely
Very
Likely
Extremely
Likely
Master of Business Administration, or MA or MS in Business or Management 2.0% 5.1% 14.1% 21.2% 57.6%Specialized Master's (Finance, Accounting, Analytics, etc.) 4.0% 9.0% 18.0% 33.0% 36.0%Business and Management courses not part of a formal program 9.0% 10.0% 19.0% 31.0% 31.0%Non-degree Executive Education 5.3% 19.1% 29.8% 27.7% 18.1%
2.2 2.0 1.8
1
2
3
An establishedprogram
“Just-in-time” Self-defined /directed
Least
Attractive
Most
Attractive
31.4%41.2%
27.5%
Not-for-profit orstate-sponsored
For-profit or not-for-
profit / state-sponsored
For-profit
49.0%33.3%
13.7%3.9%
Mostly mydecision
Equal input fromme and myemployer
Mostly myemployersdecision
Do not know
3.7
3.8
3.9
3.9
4.0
4.0
4.0
4.1
1 2 3 4 5
Lectures
Presentations done by youand / or other participants
Hands-on classroom exercises,demonstrations, or workshops
Small-group seminars
Case studies
Project-based learning
Simulations or competitions
On-the-job training
Mean Not at All
Effective
Extremely
Effective
Increase my professional network (4.5)
Improve my leadership/management skills (4.5)
Provide increased career stability and job security (4.5)
Top Preference for Planning Professional Development
Effectiveness of Learning Approaches
Program Preferences by Type of Institution
Attractiveness of OptionsNote: Scale is reversed where lower is a more positive result
Proprietary and Confidential 37
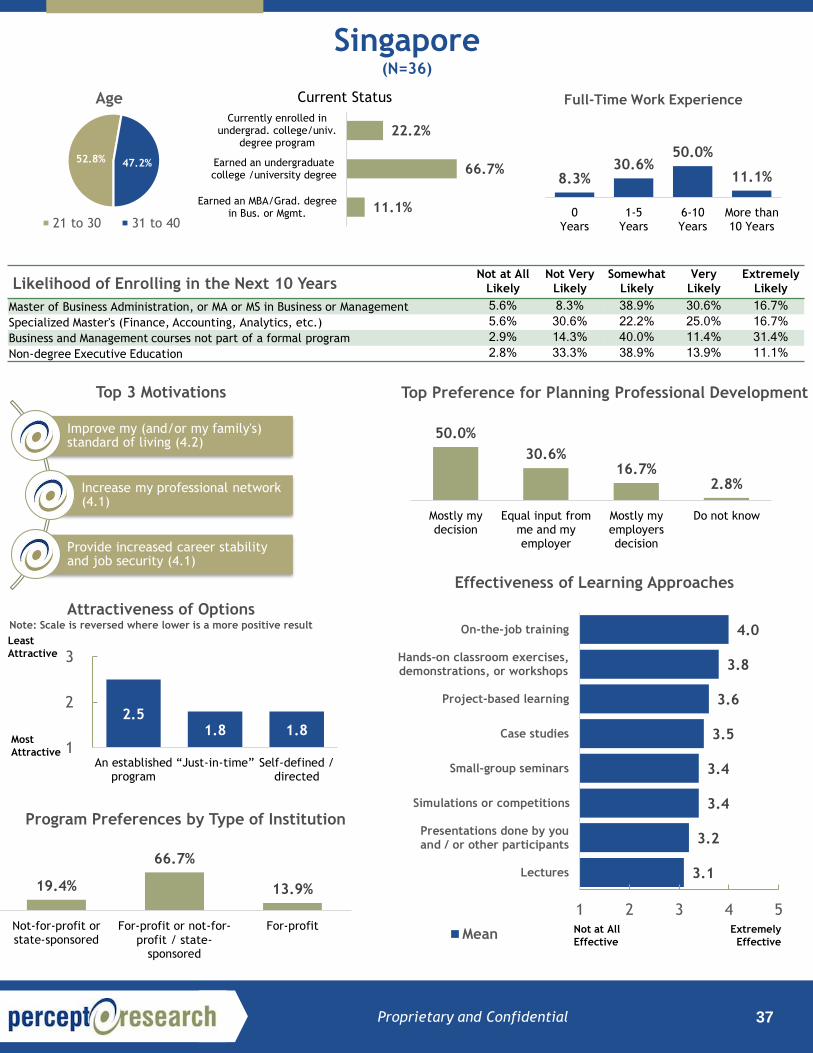
Singapore(N=36)
52.8% 47.2%
Age
21 to 30 31 to 4011.1%
66.7%
22.2%
Earned an MBA/Grad. degreein Bus. or Mgmt.
Earned an undergraduatecollege /university degree
Currently enrolled inundergrad. college/univ.
degree program
Current Status Full-Time Work Experience
8.3%30.6%
50.0%
11.1%
0Years
1-5Years
6-10Years
More than10 Years
Improve my (and/or my family's) standard of living (4.2)
Increase my professional network (4.1)
Provide increased career stability and job security (4.1)
Top 3 Motivations
Likelihood of Enrolling in the Next 10 YearsNot at All
Likely
Not Very
Likely
Somewhat
Likely
Very
Likely
Extremely
Likely
Master of Business Administration, or MA or MS in Business or Management 5.6% 8.3% 38.9% 30.6% 16.7%Specialized Master's (Finance, Accounting, Analytics, etc.) 5.6% 30.6% 22.2% 25.0% 16.7%Business and Management courses not part of a formal program 2.9% 14.3% 40.0% 11.4% 31.4%Non-degree Executive Education 2.8% 33.3% 38.9% 13.9% 11.1%
2.51.8 1.8
1
2
3
An establishedprogram
“Just-in-time” Self-defined /directed
Least
Attractive
Most
Attractive
19.4%
66.7%
13.9%
Not-for-profit orstate-sponsored
For-profit or not-for-
profit / state-sponsored
For-profit
50.0%
30.6%16.7%
2.8%
Mostly mydecision
Equal input fromme and myemployer
Mostly myemployersdecision
Do not know
3.1
3.2
3.4
3.4
3.5
3.6
3.8
4.0
1 2 3 4 5
Lectures
Presentations done by youand / or other participants
Simulations or competitions
Small-group seminars
Case studies
Project-based learning
Hands-on classroom exercises,demonstrations, or workshops
On-the-job training
Mean Not at All
Effective
Extremely
Effective
Top Preference for Planning Professional Development
Effectiveness of Learning Approaches
Program Preferences by Type of Institution
Attractiveness of OptionsNote: Scale is reversed where lower is a more positive result

Proprietary and Confidential 38
South Africa(N=78)
55.1%44.9%
Age
21 to 30 31 to 4011.5%
56.4%
32.1%
Earned an MBA/Grad.degree in Bus. or Mgmt.
Earned an undergraduatecollege/university degree
Currently enrolled inundergrad. college/univ.
degree program
Current Status Full-Time Work Experience
5.1%
46.2% 37.2%
11.5%
0Years
1-5Years
6-10Years
More than10 Years
Improve my (and/or my family's) standard of living (4.6)
Improve my leadership/management skills (4.5)
Improve my technical/functional skills (4.5)
Top 3 Motivations
Likelihood of Enrolling in the Next 10 YearsNot at All
Likely
Not Very
Likely
Somewhat
Likely
Very
Likely
Extremely
Likely
Master of Business Administration, or MA or MS in Business or Management 2.6% 9.1% 23.4% 31.2% 33.8%Specialized Master's (Finance, Accounting, Analytics, etc.) 7.8% 9.1% 18.2% 33.8% 31.2%Business and Management courses not part of a formal program 6.5% 7.8% 28.6% 35.1% 22.1%Non-degree Executive Education 14.7% 18.7% 30.7% 20.0% 16.0%
2.31.9 1.8
1
2
3
An establishedprogram
“Just-in-time” Self-defined /directed
Least
Attractive
Most
Attractive
11.5%
55.1%33.3%
Not-for-profit orstate-sponsored
For-profit or not-for-
profit / state-sponsored
For-profit
38.5%47.4%
9.0% 5.1%
Mostly mydecision
Equal input fromme and myemployer
Mostly myemployersdecision
Do not know
3.5
3.6
3.7
3.8
3.9
3.9
4.1
4.2
1 2 3 4 5
Simulations or competitions
Small-group seminars
Case studies
Lectures
Presentations done by youand / or other participants
Project-based learning
Hands-on classroom exercises,demonstrations, or workshops
On-the-job training
Mean Not at All
Effective
Extremely
Effective
Top Preference for Planning Professional Development
Effectiveness of Learning Approaches
Program Preferences by Type of Institution
Attractiveness of OptionsNote: Scale is reversed where lower is a more positive result

Proprietary and Confidential 39
Spain(N=112)
47.3% 52.7%
Age
21 to 30 31 to 4012.5%
69.6%
17.9%
Earned an MBA/Grad.degree in Bus. or Mgmt.
Earned an undergraduatecollege/university degree
Currently enrolled inundergrad. college/univ.
degree program
Current Status Full-Time Work Experience
4.5%
33.0%44.6%
17.9%
0Years
1-5Years
6-10Years
More than10 Years
Top 3 Motivations
Likelihood of Enrolling in the Next 10 YearsNot at All
Likely
Not Very
Likely
Somewhat
Likely
Very
Likely
Extremely
Likely
Master of Business Administration, or MA or MS in Business or Management 2.7% 10.9% 37.3% 23.6% 25.5%Specialized Master's (Finance, Accounting, Analytics, etc.) 5.4% 14.4% 33.3% 27.0% 19.8%Business and Management courses not part of a formal program 5.4% 13.4% 41.1% 24.1% 16.1%Non-degree Executive Education 7.3% 20.0% 41.8% 23.6% 7.3%
2.3 2.0 1.8
1
2
3
An establishedprogram
“Just-in-time” Self-defined /directed
Least
Attractive
Most
Attractive
33.0%46.4%
20.5%
Not-for-profit orstate-sponsored
For-profit or not-for-
profit / state-sponsored
For-profit
47.3%40.2%
11.6%0.9%
Mostly mydecision
Equal input fromme and myemployer
Mostly myemployersdecision
Do not know
3.4
3.4
3.4
3.6
3.7
3.7
3.8
4.0
1 2 3 4 5
Lectures
Presentations done by youand / or other participants
Small-group seminars
Case studies
Project-based learning
Simulations or competitions
On-the-job training
Hands-on classroom exercises,demonstrations, or workshops
Mean Not at All
Effective
Extremely
Effective
Provide increased career stability and job security (4.3)
Improve my technical/functional skills (4.2)
Improve my leadership/management skills (4.2)
Top Preference for Planning Professional Development
Effectiveness of Learning Approaches
Program Preferences by Type of Institution
Attractiveness of OptionsNote: Scale is reversed where lower is a more positive result
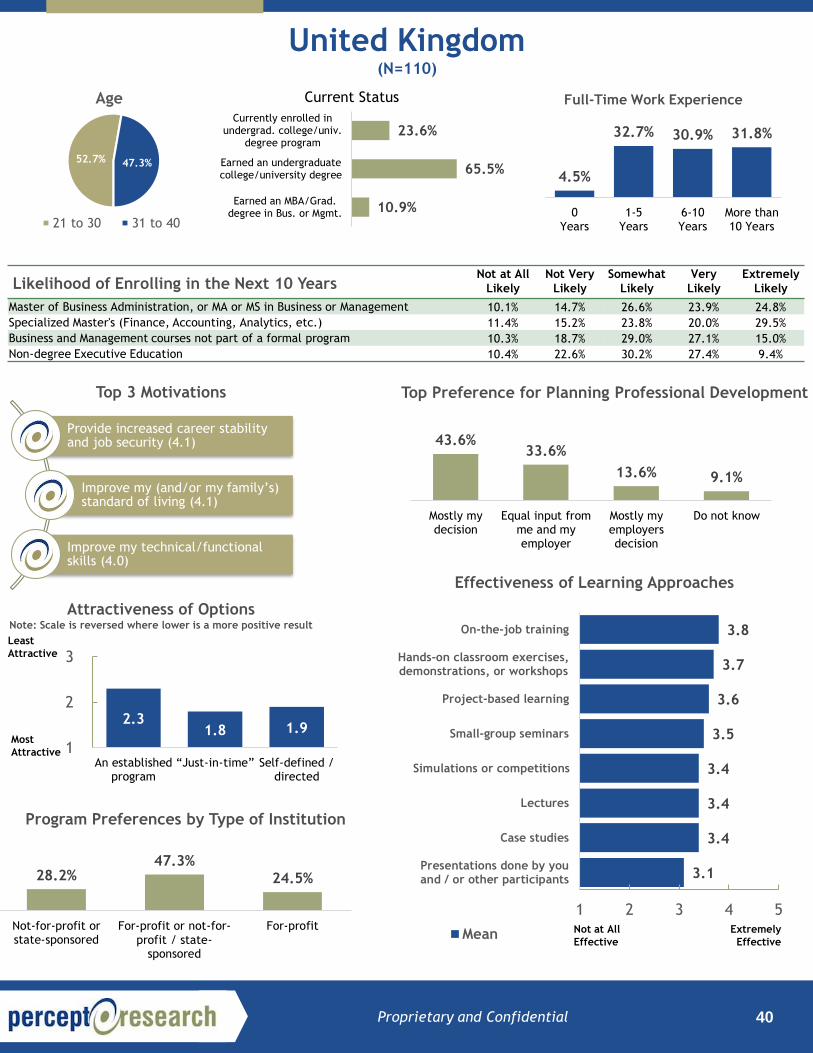
Proprietary and Confidential 40
United Kingdom(N=110)
52.7% 47.3%
Age
21 to 30 31 to 4010.9%
65.5%
23.6%
Earned an MBA/Grad.degree in Bus. or Mgmt.
Earned an undergraduatecollege/university degree
Currently enrolled inundergrad. college/univ.
degree program
Current Status Full-Time Work Experience
4.5%
32.7% 30.9% 31.8%
0Years
1-5Years
6-10Years
More than10 Years
Provide increased career stability and job security (4.1)
Improve my (and/or my family’s) standard of living (4.1)
Improve my technical/functional skills (4.0)
Top 3 Motivations
Likelihood of Enrolling in the Next 10 YearsNot at All
Likely
Not Very
Likely
Somewhat
Likely
Very
Likely
Extremely
Likely
Master of Business Administration, or MA or MS in Business or Management 10.1% 14.7% 26.6% 23.9% 24.8%
Specialized Master's (Finance, Accounting, Analytics, etc.) 11.4% 15.2% 23.8% 20.0% 29.5%
Business and Management courses not part of a formal program 10.3% 18.7% 29.0% 27.1% 15.0%
Non-degree Executive Education 10.4% 22.6% 30.2% 27.4% 9.4%
2.31.8 1.9
1
2
3
An establishedprogram
“Just-in-time” Self-defined /directed
Least
Attractive
Most
Attractive
28.2%47.3%
24.5%
Not-for-profit orstate-sponsored
For-profit or not-for-
profit / state-sponsored
For-profit
43.6%33.6%
13.6% 9.1%
Mostly mydecision
Equal input fromme and myemployer
Mostly myemployersdecision
Do not know
3.1
3.4
3.4
3.4
3.5
3.6
3.7
3.8
1 2 3 4 5
Presentations done by youand / or other participants
Case studies
Lectures
Simulations or competitions
Small-group seminars
Project-based learning
Hands-on classroom exercises,demonstrations, or workshops
On-the-job training
Mean Not at All
Effective
Extremely
Effective
Top Preference for Planning Professional Development
Effectiveness of Learning Approaches
Program Preferences by Type of Institution
Attractiveness of OptionsNote: Scale is reversed where lower is a more positive result

Proprietary and Confidential 41
United States of America(N=792)
50.8% 49.2%
Age
21 to 30 31 to 4025.6%
53.3%
21.1%
Earned an MBA/Grad.degree in Bus. or Mgmt.
Earned an undergraduatecollege/university degree
Currently enrolled inundergrad. college/univ.
degree program
Current Status Full-Time Work Experience
3.0%
38.5%32.1%
26.4%
0Years
1-5Years
6-10Years
More than10 Years
Improve my (and/or my family's) standard of living (4.4)
Improve my leadership/management skills (4.3)
Provide increased career stability and job security (4.3)
Top 3 Motivations
Likelihood of Enrolling in the Next 10 YearsNot at All
Likely
Not Very
Likely
Somewhat
Likely
Very
Likely
Extremely
Likely
Master of Business Administration, or MA or MS in Business or Management 6.2% 6.0% 23.3% 24.2% 40.4%Specialized Master's (Finance, Accounting, Analytics, etc.) 10.2% 14.4% 27.2% 27.6% 20.6%Business and Management courses not part of a formal program 8.3% 13.5% 30.3% 25.4% 22.6%Non-degree Executive Education 17.5% 19.6% 25.5% 19.7% 17.7%
2.31.9 1.8
1
2
3
An establishedprogram
“Just-in-time” Self-defined /directed
Least
Attractive
Most
Attractive
32.8%44.4%
22.7%
Not-for-profit orstate-sponsored
For-profit or not-for-
profit / state-sponsored
For-profit
50.0%
30.3%15.7%
4.0%
Mostly mydecision
Equal input fromme and myemployer
Mostly myemployersdecision
Do not know
3.4
3.5
3.5
3.7
3.7
3.8
3.9
4.1
1 2 3 4 5
Lectures
Presentations done by youand / or other participants
Small-group seminars
Case studies
Simulations or competitions
Project-based learning
Hands-on classroom exercises,demonstrations, or workshops
On-the-job training
Mean Not at All
Effective
Extremely
Effective
Top Preference for Planning Professional Development
Effectiveness of Learning Approaches
Program Preferences by Type of Institution
Attractiveness of OptionsNote: Scale is reversed where lower is a more positive result

Proprietary and Confidential 42
Detailed Data

Proprietary and Confidential 43
Section A: Respondent Summary
53.0%47.0%
21 to 30 31 to 40
Age is split relatively evenly between 21- to 30-year-olds and 31- to 40-year-olds. When it comes
to current employment status, 31- to 40-year-olds are significantly more likely to be employed
full-time versus part-time. The inverse is true for 21- to 30-year-olds.
AgeA1. What is your current age?
N=1,665

Proprietary and Confidential 44
Section A: Respondent Summary
Current ResidenceA2. In which of the following countries do you currently reside?
N=1,665
Respondents from India tend to be younger, male, and more interested in pursuing an MBA degree.
Respondents from the United Kingdom are more likely to be female and not interested in pursuing
an MBA degree. Respondents from the United States are more interested in pursuing non-degree
executive education. Respondents from China are almost exclusively employed full-time and
interested in pursing an MBA or MS and MS in Business or Management, a Specialized Master’s
degree, or Non-degree Executive Education.
Current
ResidenceN % of Total Quota % of Quota
Australia 111 6.7% 100 111.0%
Brazil 106 6.4% 100 106.0%
China 108 6.5% 100 108.0%
France 110 6.6% 100 110.0%
India 102 6.1% 100 102.0%
Singapore 36 2.2% 30 120.0%
South Africa 78 4.7% 75 112.0%
Spain 112 6.7% 100 104.0%
UK 110 6.6% 100 110.0%
United States 792 47.6% 800 99.0%
Total 1,665 100.0% 1,605 103.7%

Proprietary and Confidential 45
Section A: Respondent Summary
20.5%
23.2%
56.2%
Currently enrolled in anundergraduate college/university
degree program
Earned an MBA/Graduate degree inBusiness or Management
Earned an undergraduatecollege/university degree
Current StatusA3. Which one of the following statements best describes you?
N=1,665
The overwhelming majority of respondents have earned an undergraduate degree from a college
or university. As one might expect, individuals currently employed in a full-time capacity are
significantly more likely to have earned an MBA or graduate degree in Business or Management
than either hold an undergraduate degree or be currently enrolled in an undergraduate program.
There is also a foreseeable correlation between age and current status: Younger students are
more likely to be currently enrolled in a degree program while older students are significantly
more likely to have earned an MBA or graduate degree.

Proprietary and Confidential 46
Section A: Respondent Summary
Likelihood of Enrolling in the Next 10 YearsA4. How likely is it that you will enroll in each of the following types of advanced management education
programs or courses in the next 10 years?
N ranges from 1,634 to 1,604(Note: Do Not Know/Not Applicable responses (99s) are not included in respondent count)
34.9%
22.2% 21.6%15.7%
25.0%
27.9% 26.2%
22.3%
25.8%
26.3% 31.0%
30.4%
8.5%14.8% 13.4%
19.2%
5.9% 9.0% 7.8% 12.3%
Master of BusinessAdministration, or MA or MSin Business or Management
Specialized Master's(Finance, Accounting,
Analytics, etc.)
Business and Managementcourses not part of a formal
program
Non-degree ExecutiveEducation
Extremely Likely Very Likely Somewhat Likely Not Very Likely Not at All Likely
The MBA or MA/MS in Business or Management received the most interest across the respondent
base with 59.9% stating they would be Extremely or Very Likely to pursue in the next 10 years.
Individuals from the United States, male, or currently employed full-time are the drivers of this
interest. Respondents who are Extremely or Very Likely to pursue a Specialized Master’s are more
likely to be male and also Extremely or Very Likely to pursue the other three advanced
management education options. Those who are Extremely or Very Likely to pursue Non-degree
Executive Education are currently respondents who are employed full-time, who possess a
graduate degree or completed some graduate coursework, and who reside in the United States.

Proprietary and Confidential 47
Section B: Advanced Management Education
Motivations
Importance of Motivations in Pursuing Future Advanced Management EducationB1. How important are each of the following motivations to your interest in pursuing future advanced
management education?(Note: Do Not Know/Not Applicable responses (99s) are not included in respondent count)
3.6
3.7
3.9
4.0
4.1
4.1
4.2
4.2
4.2
4.3
1.0 2.0 3.0 4.0 5.0
Obtain international exposure and access(N=1,641)
Make it easier to start my own business(N=1,637)
Make it easier to change fields or organizations(N=1,639)
Gain additional respect and credibility in my current job(N=1,643)
Increase my professional network(N=1,642)
Make it easier to advance in my field or organization I am in at thattime
(N=1,645)
Improve my technical / functional skills(N=1,647)
Improve my leadership / management skills(N=1,647)
Provide increased career stability and job security(N=1,650)
Improve my (and/or my family’s) standard of living
(N=1,645)
Mean
Not at All
Important
Extremely
Important
Motivations are directly correlated to interest to pursue an advanced management education. The
higher the interest, the higher ratings given to the series of motivations (see next page for
additional data and findings).

Proprietary and Confidential 48
Section B: Advanced Management Education
Motivations
Not at All
Important
Not Very
Important
Somewhat
Important
Very
Important
Extremely
Important
Gain additional respect and credibility in my
current job
(N=1,643)1.9% 6.3% 21.9% 33.8% 36.0%
Obtain international exposure and access
(N=1,641) 4.8% 14.0% 23.5% 28.7% 29.1%Make it easier to advance in my field or
organization I am in at that time
(N=1,645)1.1% 4.6% 16.7% 34.5% 43.1%
Make it easier to change fields or organizations
(N=1,639) 1.6% 7.3% 23.7% 35.8% 31.6%
Make it easier to start my own business
(N=1,637) 4.5% 12.2% 22.4% 29.9% 31.0%
Improve my leadership/management skills
(N=1,647) 1.0% 3.4% 14.0% 36.1% 45.5%
Improve my technical/functional skills
(N=1,647) 0.9% 3.0% 16.1% 35.8% 44.2%
Improve my (and/or my family’s) standard of living
(N=1,645) 0.8% 3.9% 12.9% 30.8% 51.6%
Increase my professional network
(N=1,642) 1.1% 5.1% 19.4% 36.5% 37.9%
Provide increased career stability and job security
(N=1,650) 1.2% 3.6% 13.9% 34.8% 46.5%
Importance of Motivations in Pursuing Future Advanced Management EducationB1. How important are each of the following motivations to your interest in pursuing future advanced
management education? (Note: Do Not Know/Not Applicable responses (99s) are not included in respondent count)
Respondents from the United States are driving the ratings for 4 of the top 5 rated motivations (not
including Improve my technical/functional skills where both residents of the United States and residents
outside the United States gave similar ratings) with significantly higher ratings than those residing outside
the United States. As one might expect, individuals employed full-time provided significantly higher
ratings to the top three rated motivations versus those not employed full-time. Respondents holding a
Bachelor’s or graduate degree give higher ratings to all motivations compared to those with no college or
a two-year Associates degree. For all respondents, motivations most frequently rated Not Very or Not at
All Important for pursing advanced management education include Obtaining international exposure and
access and Making it easier to start my own business.

Proprietary and Confidential 49
Section B: Advanced Management Education
Motivations
Most Appropriate Type of Advanced Management Education Based on motivationsB2. Which type of advanced management education do you think would be the most appropriate choice for
each of the following motivations? (Note: Do Not Know/Not Applicable responses (99s) are not included in respondent count)
35.3%
33.2%
36.6%
22.9%
33.2%
35.8%
32.2%
30.6%
33.2%
31.6%
28.8%
22.7%
28.0%
30.9%
17.5%
18.7%
26.0%
29.3%
27.9%
30.8%
15.8%
19.4%
16.1%
19.4%
18.6%
18.0%
19.5%
18.9%
17.3%
17.7%
20.1%
24.6%
19.3%
26.8%
30.7%
27.4%
22.3%
21.2%
21.5%
20.0%
Provide increased career stability and job security(N=1,610)
Increase my professional network(N=1,599)
Improve my (and/or my family’s) standard of living
(N=1,585)
Improve my technical/functional skills(N=1,622)
Improve my leadership/management skills(N=1,622)
Make it easier to start my own business(N=1,571)
Make it easier to change fields or organizations(N=1,604)
Make it easier to advance in my field or organizationI am in at that time
(N=1,610)
Obtain international exposure and access(N=1,528)
Gain additional respect and credibility in my current job(N=1,609)
MBA or MA/MS in Management Specialized Master's Non-Degree Executive Eduction Management Courses
An MBA or MA/MS in Management is the Most Appropriate type of advanced management education across all
motivations but one, Improve my technical/functional skills, where a Specialized Master’s degree is the most
common choice. Female respondents are looking at the MBA or MA/MS in Management to Improve my standard
of living and Provide increased career stability and job security; however, female respondents look to
Management courses and Non-Degree Executive Education to Gain additional respect and credibility in my
current job. Individuals residing in the United States selected the MBA or MA/MS in Management, and at a
significantly higher rate than those outside the United States, to Make it easier to start my own business,
Improve my standard of living, and Provide increased career stability and job security. Residents from outside
the United States are driving the selection of Specialized Master’s as the Most Appropriate education option for
the motivations studied here.

Proprietary and Confidential 50
Section B: Advanced Management Education
Motivations
Least Appropriate Type of Advanced Management Education Based on MotivatorsB3. Which type of advanced management education do you think would be the least appropriate choice for
each of the following motivations?(Note: Do Not Know/Not Applicable responses (99s) are not included in respondent count)
17.4%
17.3%
17.2%
17.0%
18.2%
18.2%
17.0%
17.7%
15.7%
18.0%
19.3%
19.9%
17.6%
21.0%
21.7%
21.1%
22.3%
20.5%
18.4%
18.3%
31.8%
30.3%
32.1%
32.9%
30.6%
32.6%
31.5%
32.8%
31.9%
32.5%
31.5%
32.5%
33.1%
29.1%
29.5%
28.1%
29.2%
29.0%
34.0%
31.2%
Provide increased career stability and job security(N=1,491)
Increase my professional network(N=1,486)
Improve my (and/or my family’s) standard of living
(N=1,486)
Improve my technical/functional skills(N=1,492)
Improve my leadership/management skills(N=1,508)
Make it easier to start my own business(N=1,457)
Make it easier to change fields or organizations(N=1,506)
Make it easier to advance in my field or organizationI am in at that time
(N=1,490)
Obtain international exposure and access(N=1,469)
Gain additional respect and credibility in my current job(N=1,485)
MBA or MA/MS in Management Specialized Master's Non-Degree Executive Education Management Courses
Non-degree Executive Education and Management Courses not part of a formal program are the
most commonly selected as the Least Appropriate choice across all motivations.

Proprietary and Confidential 51
Section C. Advanced Management Education
Online Versus In-Person
Experience with Online Learning (Undergraduate or Graduate)C1. How would you describe your own experience with online learning at the undergraduate or
graduate level (in any field, not just management)?
N=1,665
54.0%
25.1%20.9%
Completed at Least OneOnline or Blended Course
Never Taken an Online orBlended Course
Started an Online or BlendedCourse but Never Completed
One
Over half of the respondents indicate they have Completed at Least One Online or Blended Course. Individuals
between 31 to 40 years old are significantly more likely to have completed one of these courses than those
between 21 to 30 years old, but it is the most selected option across both groups. The same holds true by
gender: Female respondents are significantly more likely to have completed at least one online learning option.
Younger respondents are significantly more likely to have Started an Online or Blended Course but Never
Completed One. Respondents who are Extremely or Very Likely to pursue an advanced management education
program in the next ten years are significantly more likely to have Completed at Least One Online or Blended
Course. Conversely, those not expressing a high level of interest are significantly more likely to have Never
Taken an Online or Blended Course.

Proprietary and Confidential 52
Section C. Advanced Management Education
Online Versus In-Person
Learning Option Preferences for Online DeliveryC2. For subjects which are taught online, or for online components of blended courses, which of the
following learning options would you prefer?
N=1,665
36.9% 33.2%29.9%
Mix of Live andPre-recorded
Pre-recorded Live
There is a tight distribution of responses across the three learning preferences for online delivery.
Mix of Live and Pre-recorded is driven by respondents 31 to 40 years old, residing outside the
United States, and holding a Bachelor’s degree. Females, residents of the United States, non-full-
time employees, individuals without a Bachelor’s or graduate degree, and those without interest
in pursuing formal advanced management education programs (e.g., MBA, Specialized Master’s)
gave significantly higher ratings to the Pre-recorded option. The Live learning option received
higher ratings from all respondents interested in pursuing an advanced management education
program, and notably from males and younger respondents.

Proprietary and Confidential 53
Section D. Advanced Management Education
New Options
Value of Certificate or Digital Badge Compared to a Degree ProgramD1. One new option is receiving certificates or “digital badges” for completing specific management-
related courses. For your own professional development, how would you compare the value of a
certificate or digital badge to a degree program in helping you reach your goals?
N=1,624(Note: Do Not Know responses (5s) are not included in respondent count)
48.2%
26.1%
17.4%
8.4%
Valuable as a complement tonon-degree coursework
or program
Valuable as a substitute to aformal degree program
Equally valuable as asubstitute or complement
Not at all valuable, either as asubstitute or complement
The majority of respondents believe certificates and digital badges are Valuable as a complement
to non-degree coursework or programs. This is driven by female respondents, where over half
(53%) recognized value in this option compared to 44% of males. A similar trend is present among
two other groups: those who work non-full-time versus full-time employment, and those holding a
Bachelor’s degree versus working toward or holding a Graduate degree. Individuals not considering
pursuing an MBA, Specialized Master’s, or Business and Management courses not part of a formal
program in the next ten years are more likely to consider certificates and digital badges a
complement to non-degree coursework compared to those Extremely or Very Likely to pursue
these options.

Proprietary and Confidential 54
Section D. Advanced Management Education
New Options
Likelihood to Pursue a Certificate or Digital BadgeD2. How likely would you be to pursue a certificate or digital badge to achieve your professional or
personal goals?
N=1,503(Note: Do Not Know/Not Applicable responses (99's) are not included in respondent count)
32.1%29.3% 28.5%
7.5%
2.5%
Extremely Likely Very Likely Somewhat Likely Not Very Likely Not at All Likely
Certificates and digital badges are perceived as valued options for achieving professional or
personal goals. Only one in ten respondents are not likely to pursue this option (summing Not Very
Likely and Not at All Likely). Certificates and digital certificates provide more attractive options
for individuals employed full-time and those holding a graduate degree. In addition, respondents
Extremely Likely or Very Likely to pursue an advanced management education program are also
significantly more likely to consider a certificate or digital badge.

Proprietary and Confidential 55
Section D. Advanced Management Education
New Options
Attractiveness of Advanced Management Education OptionsD4. There has been a recent increase in the customization of advanced management
education. Please rank the following three alternatives on how attractive they are to you, with
“1” as the Most Attractive and “3” as Least Attractive, as a way of achieving your goals?
N=1,665
Self-defined/directed professional development received the highest percentage of ’1’ ratings. This was
driven by individuals between 31 and 40 years old, holding a Bachelor’s degree, and those considering
pursuit of Non-degree Executive Education. A “just-in-time” series of courses received the second highest
number of ‘1’ ratings. These ratings were consistent across all of the different groups within this study.
There is a correlation between attractiveness of these options and employer reimbursement. Individuals
indicating they receive no employee reimbursement are significantly more likely to select Self-
defined/directed as their first choice. Conversely, respondents with full or partial reimbursement are
significantly more likely to select Self-defined/directed as a third choice compared to respondents
without employee reimbursement.
42.9%
33.9%
23.1%
35.6%
40.7%
23.7%21.5%
25.4%
53.2%
Self-defined/directed professionaldevelopment, possibly using
employer guidelines
A “just-in-time” series of courses which you would develop jointly
with an employer to better prepare you for your current and/or next job
An established program, such as onethat would be used to earn an MBA
at a leading business school
Rated '1' Rated '2' Rated '3'

Proprietary and Confidential 56
Section D. Advanced Management Education
New Options
Preference on Planning Professional DevelopmentD5. Some employers can influence the content, delivery, and provider of advanced management
education for their employees. If these were not solely the employer’s decision, and you were
interested in advanced management education, which of the following options would you prefer when
planning for your professional development?
N=1,665
48.7%
31.5%
15.2%
4.6%
Mostly my decision, withsome input from my
employer
Equal input from me andmy employer
Mostly my employer’s decision, with some input
from me
Do not know
Having professional development be self-directed with some input from the employer was the
most selected option across the majority of the groups within this study. Older respondents and
those holding a Bachelor’s or graduate degree did select this option at a significantly higher rate
than younger respondents and those not holding a degree. Individuals with full reimbursement
from their employers are significantly more likely to select Mostly my employer’s decision, with
some input from me than those no financial support from their employer.

Proprietary and Confidential 57
Section D. Advanced Management Education
New Options
Likelihood to Pursue an Advanced Management Education Program that Provides Credit
for Life/Work ExperienceD6. How likely would you be to pursue this option (credit for life/work experience) if it were available to
you as part of an advanced management education program?
N=1,665
29.0%32.5%
27.6%
7.6%
3.3%
Extremely Likely Very Likely Somewhat Likely Not Very Likely Not at All Likely
Respondents residing in the United States selected Extremely Likely to pursue an advanced
management education program that gives credit for life/work experience more frequently than
those residing outside the United States. Conversely, residents outside the United States selected
Very Likely at a significantly higher rate. As one might expect, individuals employed full-time are
more likely to pursue an advanced management education program that supports credit for
life/work experience.

Proprietary and Confidential 58
Section D. Advanced Management Education
New Options
Program Preferences by Type of InstitutionD7. The role of for-profit institutions in advanced management education is growing in many
countries. For your own professional development, would you be more likely to pursue a
program offered by a for-profit institution compared to a program offered by a not-for-profit
or state-sponsored college/university?
N=1,665
46.1%
31.0%
22.9%
For-profit ornot-for-profit/state-sponsored
Not-for-profit orstate-sponsored
For-profit
Across all groups within this study, nearly half of respondents indicated equal preference for For-
profit or not-for-profit/state-sponsored institutions. When examining the other options, Not-for-
profit or state-sponsored was selected at a significantly higher rate among those 31 to 40 years
old. The same holds true regarding For-profit institutions among respondents 21 to 30 years old.
Nonetheless, For-profit or not-for-profit/state-sponsored was the most commonly selected
option for all age groups.

Proprietary and Confidential 59
Extremely
Effective
Very
Effective
Somewhat
Effective
Not Very
Effective
Not at All
Effective
On-the-job training 33.0% 39.9% 20.1% 4.9% 2.0%Hands-on classroom exercises,
demonstrations, or workshops 25.5% 42.9% 24.6% 5.5% 1.5%
Project-based learning 21.3% 43.4% 27.4% 6.4% 1.6%
Simulations or competitions 18.4% 38.2% 32.4% 9.2% 1.7%
Case studies 17.3% 41.9% 30.6% 8.3% 1.9%Presentations done by you and/or other
participants 15.0% 33.0% 35.9% 13.3% 2.9%
Small-group seminars 13.2% 38.6% 37.5% 8.6% 2.2%
Lectures 12.9% 33.3% 37.2% 14.7% 1.9%
Section D. Advanced Management Education
New Options
Effectiveness of Learning Approaches for Advanced Management EducationD8. Recognizing that this could vary by subject or by program type, in general how effective would you
personally find each of the following learning approaches for advanced management education?
N=1,665
(Sorted by % of Extremely Effective)
Overall, the findings above can provide insight into course design and development. Taking into
account the effectiveness ratings of the various learning approaches provides insight for faculty in
how to best structure their curriculum to meet the expectations of future students. While relative
order of these eleven learning approaches was consistent across most groups, respondents 31 to
40 years old gave significantly higher ratings to the top three items above than their younger
counterparts. Female respondents also place more significance than males to On-the-job training,
as did residents of the United States. Individuals Extremely Likely or Very Likely to pursue any
type of advanced management education in the next ten years gave significantly higher ratings
across every learning option.

Proprietary and Confidential 60
Section E. Employer and Employment
Full-Time Work ExperienceE1. How many total years of full-time work
experience do you currently have, excluding part-
time work or internships?
N=1,665
4.2%
39.8%34.0%
22.0%
0 Years 1-5 Years 6-10 Years More than10 Years
Current Employment StatusE2. What is your current employment status?
N=1,665
77.5%
14.2%8.3%
Full-time Part-time Not Employed
Employer SizeE3. How many people work for your current
employer worldwide?
N=1,527
3.1%
30.0%
18.9%
21.5%
13.2%
13.4%
Do Not Know
1,001 or More
501 to 1,000
101 to 500
51 to 100
1 to 50
Employer IndustryE4. Which of the following industry categories best
describes your current employer?
N=1,527
12.7%
1.9%
3.6%
3.9%
5.6%
6.7%
7.2%
7.3%
8.1%
13.4%
13.7%
15.9%
Other
Utlities
Transportation
Marketing, Advertising orPublic Relations
Public Administration
Wholesale or Retail Trade
Healthcare
Construction
Manufacturing
Services
Communications orInformation Tech.
Finance, Accounting,Insurance or Real Estate

Proprietary and Confidential 61
Section E. Employer and Employment
Employer ReimbursementE5. What level of reimbursement will your current
employer provide for advanced management
education?
N=1,527
30.2%
39.9%
21.7%
8.2%
Full Partial None Do Not Know
Employer Learning PlatformE6. Does your current employer have a learning
platform where you can take management-related
courses?
N=1,527
54.4%
37.6%
8.0%
Yes No Do Not Know
Likelihood of Leveraging For Advanced Management OfferingE7. How likely are you to use each of the following information sources when choosing a specific advanced
management education program, offering, or provider?
N=1,527
49.1%42.0% 40.7% 38.8% 38.7%
31.3%
44.9%46.2% 51.2% 51.8% 52.6%
54.8%
6.0% 11.9% 8.1% 9.4% 8.7% 13.9%
Employers orcolleagues
MBA or otheradmissionsconsultants
Provider orprogram websitesor print materials
Friends orrelatives
Print or onlineratings orrankings
Print or onlinedirectories
Very Likely Somewhat Likely Not Likely

Proprietary and Confidential 62
Section F. Additional Background Information
Level of EducationF1. What is the highest level of education you have
completed (in any field, not just management)?
N=1,665
2.8%
21.7%
9.8%
45.5%
7.9%
10.8%
1.4%
Doctoral-level Degree
Master's-level Degree
Some Graduate Workbut No Degree
Three- or Four-YearBachelor's Degree
Two-year Associate'sDegree
SomeCollege/University
but No Degree
NoCollege/University
Management EducationF2. Which of the following types of management
education have you completed? Please select all
that apply.
N=1,665
12.8%
8.2%
15.6%
4.3%
12.0%
23.4%
17.8%
49.2%
16.6%
None of the above
Executive Education(University, For-Profit
Company, or otherNon-University)
Business orManagement coursesnot part of a formal
program
Doctoral-level degree
Specialized Master’s (Finance, Accounting,
Analytics, etc.)
Master of BusinessAdministration, or MAor MS in Business or
Management
Non-degree graduate orprofessional school
coursework
Three- or four-year Bachelor’s degree or
equivalent
Two-year Associate’s degree
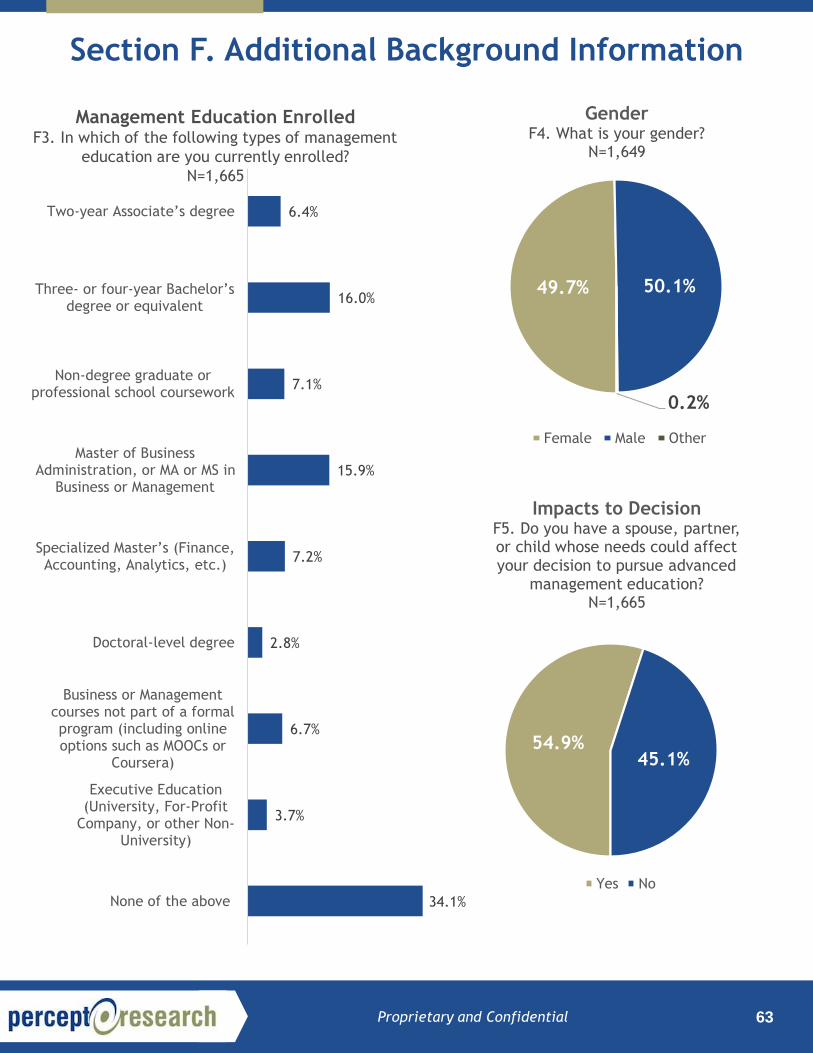
Proprietary and Confidential 63
Section F. Additional Background Information
Management Education EnrolledF3. In which of the following types of management
education are you currently enrolled?
N=1,665
34.1%
3.7%
6.7%
2.8%
7.2%
15.9%
7.1%
16.0%
6.4%
None of the above
Executive Education(University, For-Profit
Company, or other Non-University)
Business or Managementcourses not part of a formalprogram (including onlineoptions such as MOOCs or
Coursera)
Doctoral-level degree
Specialized Master’s (Finance, Accounting, Analytics, etc.)
Master of BusinessAdministration, or MA or MS in
Business or Management
Non-degree graduate orprofessional school coursework
Three- or four-year Bachelor’s degree or equivalent
Two-year Associate’s degree
49.7% 50.1%
0.2%
GenderF4. What is your gender?
N=1,649
Female Male Other
54.9%45.1%
Impacts to DecisionF5. Do you have a spouse, partner, or child whose needs could affect your decision to pursue advanced
management education? N=1,665
Yes No

Proprietary and Confidential 64
Appendix
The following deliverables are available as documents separate from this report:
• Questionnaire
• Masked Data Set
• Verbatim Document
• Crosstabs Spreadsheet
The consultants on this project welcome questions:
• Joyce Kurpiers, PhD [email protected]
• Rodney Alsup, DBA, CPA, CITP [email protected]
• Brian Mahoney [email protected]
• Eric Small [email protected]