understanding user location - microsoft.com · 45% 30% 9% age
TRANSCRIPT

0

1
Understanding User Location in Mobile Social Networks
Xing Xie

2
User Location Prediction
Three basic questions of philosophy from concierges Who are you?
Where do you come from?
Where do you go to?
They can be great research problems too

3
Active Badges (OliverttiResearch, 1989)
First automated indoor location system
The small device worn by personnel transmits a unique infra-red signal every 10 seconds.
Each office within a building is equipped with one or more networked sensors which detect these transmissions.

4
Ubicomp Research Projects
RADAR (Microsoft, 2000) Wi-Fi signal-strength based
indoor positioning system
Place Lab (Intel, 2003) Low-cost, easy-to-use device
positioning for location-enhanced computing applications
GSM tower, Bluetooth, 802.11 access points
5
Sensors Are Becoming Ubiquitous
85% of mobile devices will ship with GPS by 2013
By 2013, 50% of mobile devices will ship with accelerometers and ~50% with gyroscopes
Shipments of mobile motion sensors (accelerometers, compasses, gyroscopes, and pressure sensors) will reach 2.2B units in 2014, up from 435.9M in 2009.
Contextual Computing will be a $160B market by 2015
6
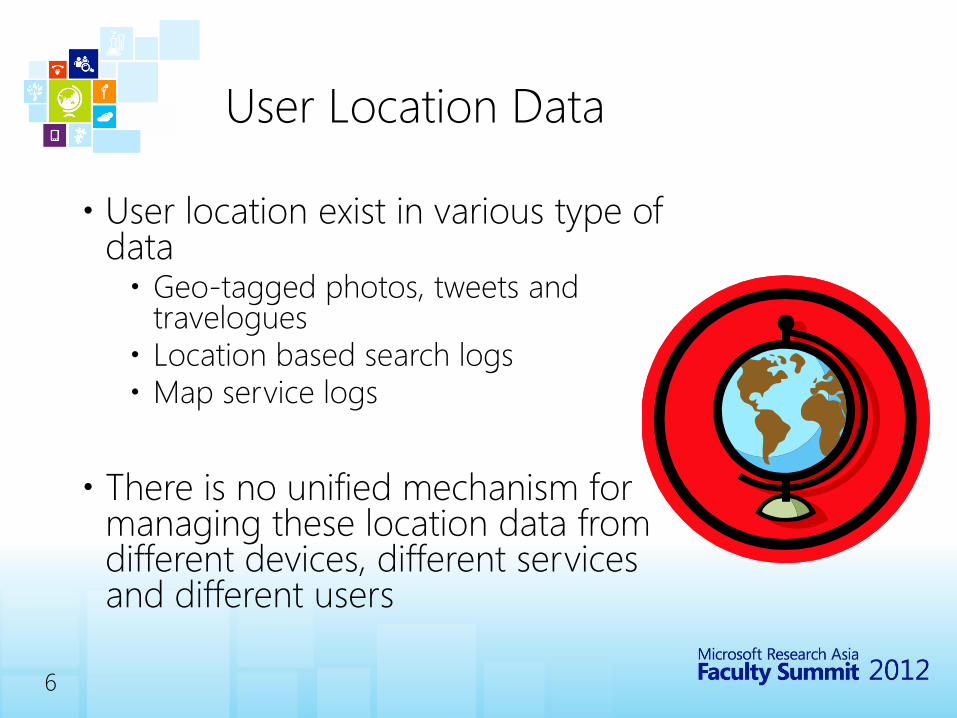
User Location Data
User location exist in various type of data Geo-tagged photos, tweets and
travelogues Location based search logs Map service logs
There is no unified mechanism for managing these location data from different devices, different services and different users
7
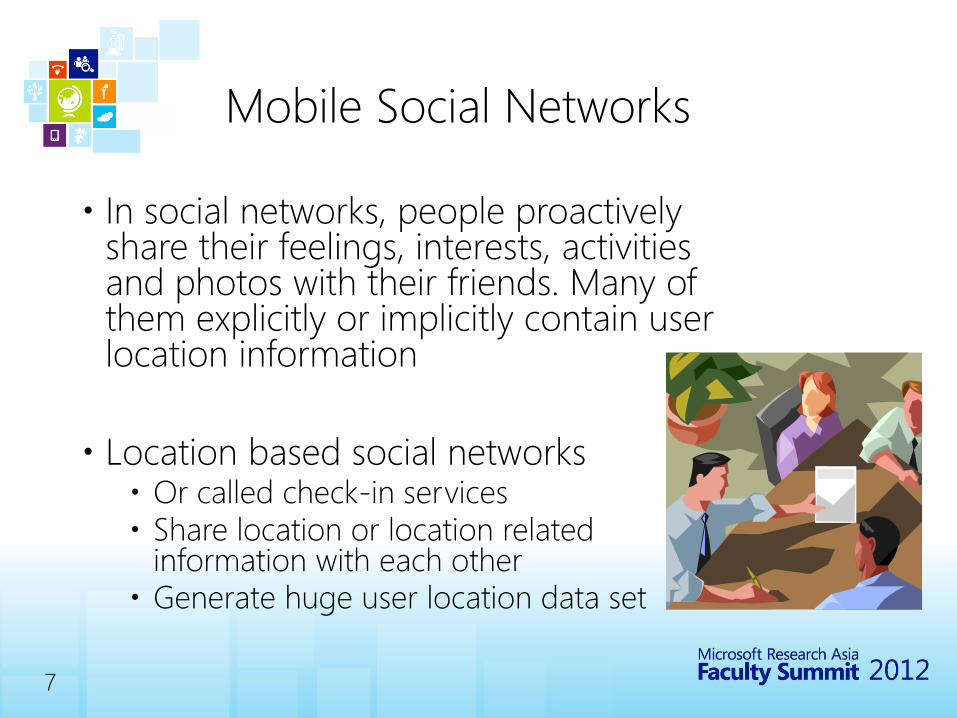
Mobile Social Networks
In social networks, people proactively share their feelings, interests, activities and photos with their friends. Many of them explicitly or implicitly contain user location information
Location based social networks Or called check-in services Share location or location related
information with each other Generate huge user location data set

8
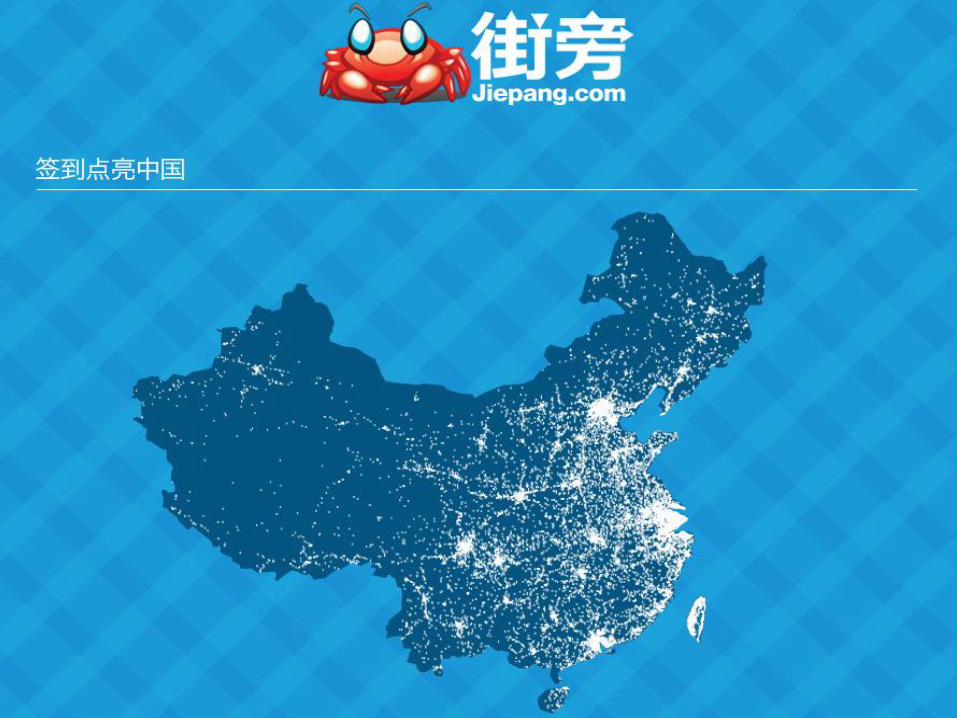
2 billion check-ins from Foursquare users
9
10
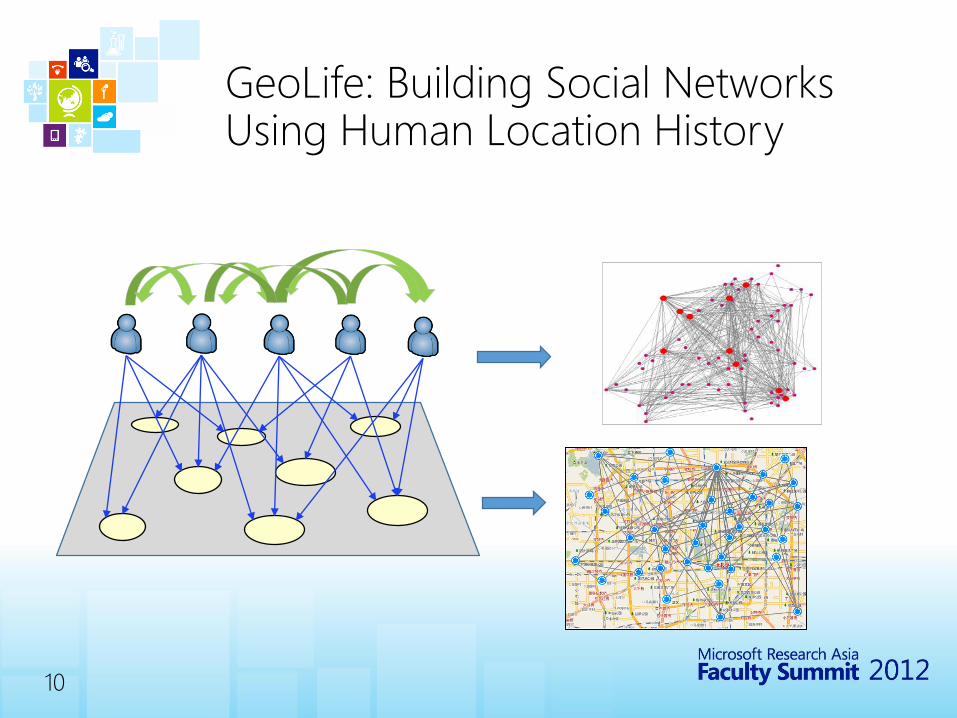
GeoLife: Building Social Networks Using Human Location History
11
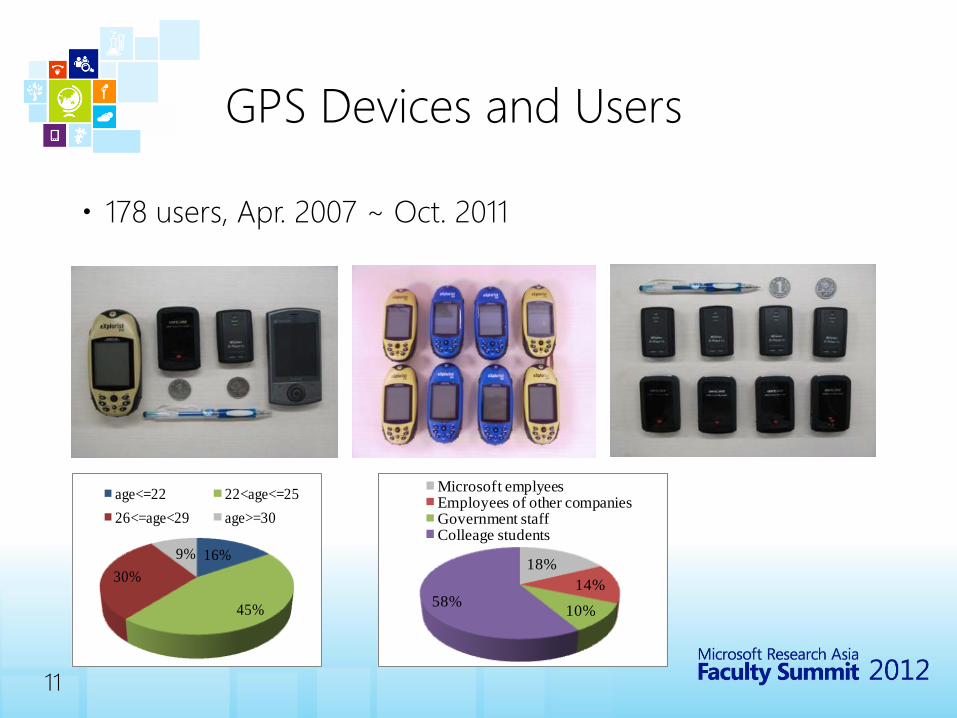
GPS Devices and Users
178 users, Apr. 2007 ~ Oct. 2011
16%
45%
30%
9%
age<=22 22<age<=25
26<=age<29 age>=30
18%
14%
10%58%
Microsoft emplyeesEmployees of other companies Government staffColleage students

12
A Free Large-Scale GPS Dataset
17621 trajectories, 1.2 million kilometers, 48000+ hours

13
Collaborative Activity and Location Recommendation
Location Recommendation
Question: I want to find nice food, where should I go?
Activity Recommendation
Question: I will visit the downtown, what can I do there?
Nice food!
Big sale!
AI Journal, AAAI
2010, WWW
2010
14
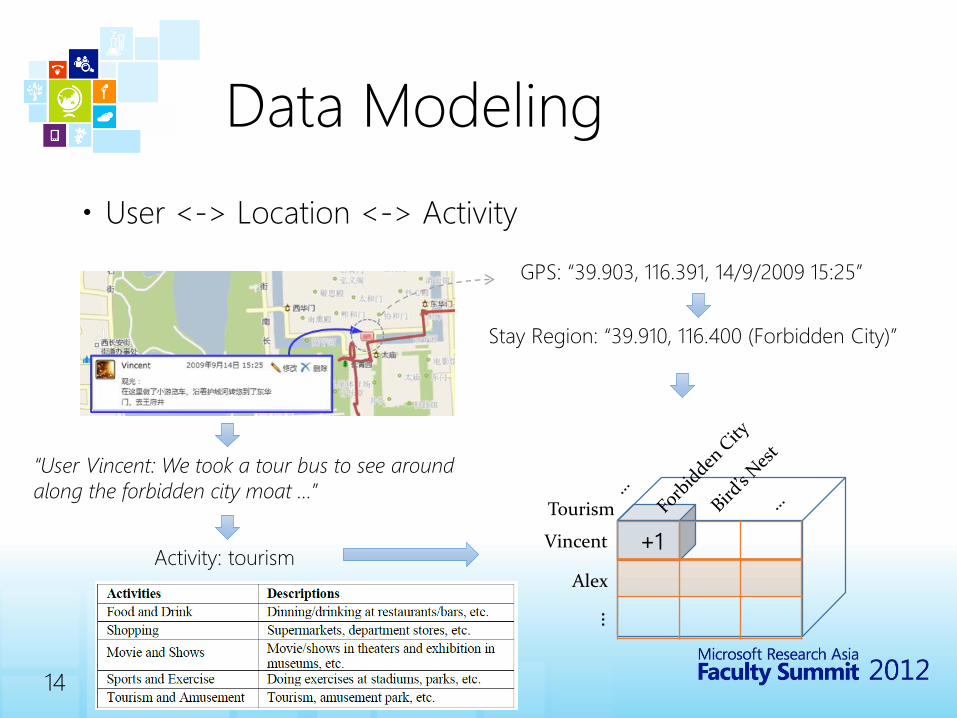
Data Modeling
User <-> Location <-> Activity
Activity: tourism
“User Vincent: We took a tour bus to see around
along the forbidden city moat …”
GPS: “39.903, 116.391, 14/9/2009 15:25”
Stay Region: “39.910, 116.400 (Forbidden City)”
+1Vincent
Tourism
Alex…

15
How to Do Recommendation?
If the tensor is full, then for each user:
Vincent
Tourism
Alex
…
2 1 6
4 3 2
5 4 1
Location recommendation for Vincent
Tourism:
Forbidden City > Bird’s Nest > Zhongguancun
Tourism
Exhibition
Shopping
Activity recommendation for Vincent
Forbidden City:
Tourism > Exhibition > Shopping
Tourism
Vincent
Unfortunately, in practice, the tensor is usually sparse!
16
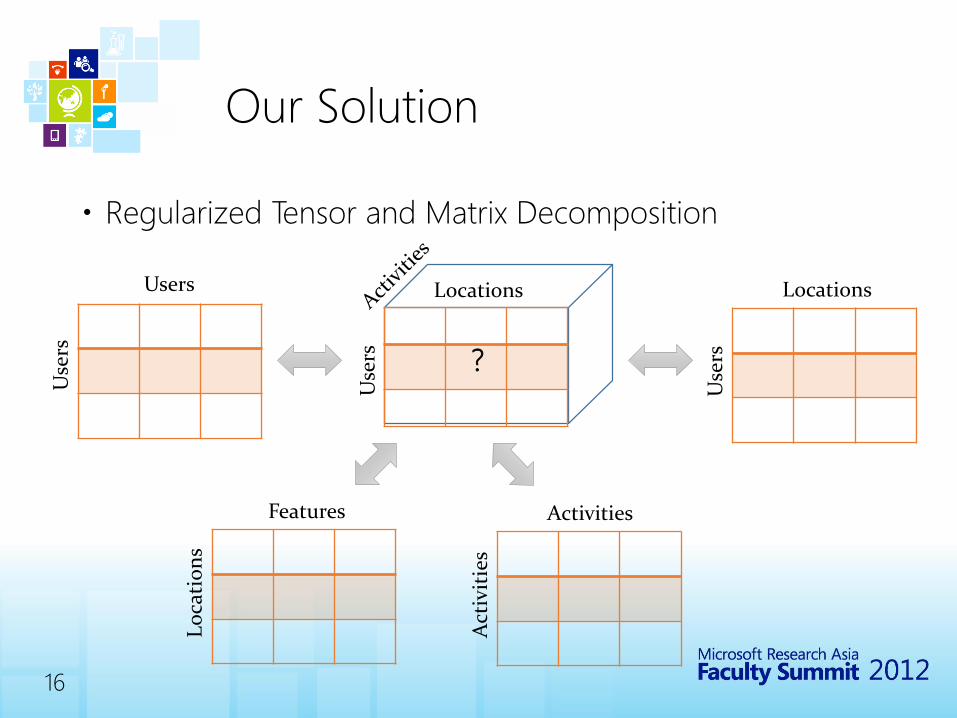
Our Solution
Regularized Tensor and Matrix Decomposition
Locations
Users
Locations
Features
Users
Locations
Users
Users
Activities
Activities
?

17
Our Model
X X, Y
Y Z

18
Experiments
Data GeoLife data set
13K GPS trajectories, 140K km long
530 comments
After clustering, #(loc) = 168; #(user) = 164, #(act) = 5, #(loc_fea) = 14
The user-loc-act tensor has 1.04% of the entries with values
Evaluation Ranking over the hold-out test dataset
Metrics:
Root Mean Square Error (RMSE)
Normalized discounted cumulative gain (nDCG)

19
Baselines – Category I
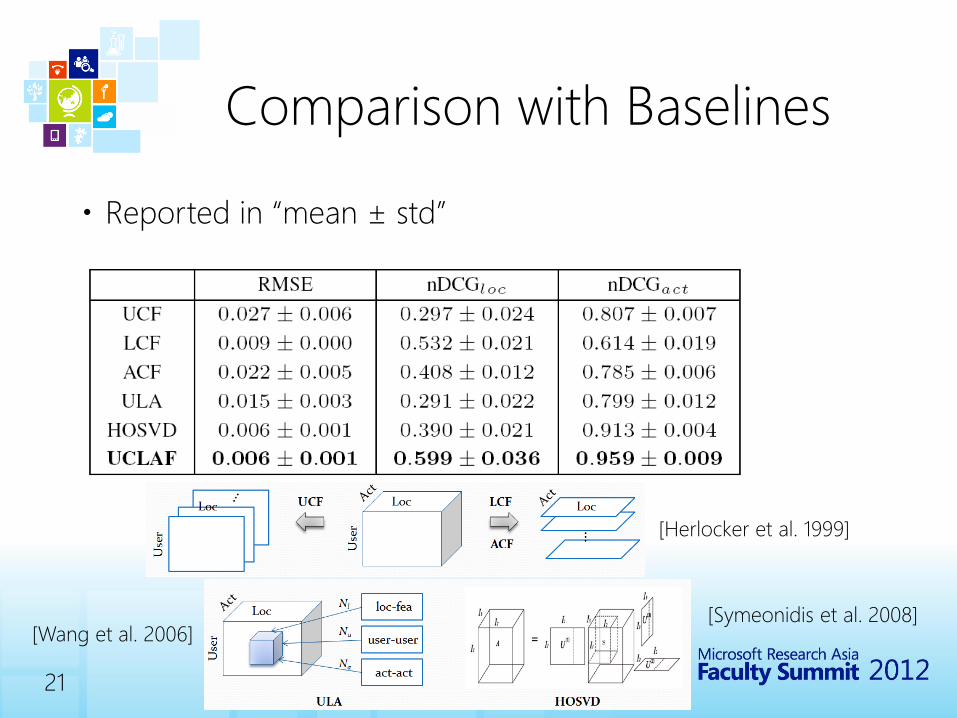
Tensor -> Independent matrices [Herlocker et al. 1999]
Baseline 1: UCF (user-based CF) CF on each user-loc matrix + Top N similar users for weighted average
Baseline 2: LCF (location-based CF) CF on each loc-act matrix + Top N similar locations for weighted
average
Baseline 3: ACF (activity-based CF) CF on each loc-act matrix + Top N similar activities for weighted
average
Loc
User
Loc
…
User
Loc UCF LCF
ACF

20
Baselines – Category II
Tensor-based CF
Baseline 4: ULA (unifying user-loc-act CF) [Wang et al. 2006]
Top Nu similar users, top Nl similar loc’s, top Na similar act’s
Similarities from additional matrices + Small cube for weight average
Baseline 5: HOSVD (high order SVD) [Symeonidis et al. 2008]
Singular value decomposition with matrix unfolding
Loc
User
loc-fea
user-user
act-act
Nu
Nl
Na
ULA HOSVD
21
Comparison with Baselines
Reported in “mean ± std”
[Herlocker et al. 1999]
[Wang et al. 2006][Symeonidis et al. 2008]
22
Collaborative Activity and Location Recommendation
We showed how to mine knowledge from GPS data to answer If I want to do something, where should I go?
If I will visit some place, what can I do there?
We evaluated our system on a large GPS dataset 19% improvement on location recommendation
22% improvement on activity recommendation
over the simple memory-based CF baseline (i.e. UCF, LCF, ACF)

23
User Location Naming
Mapping from GPS to location name

24
Problem Definition
Given POI database 𝑃
Check-in history 𝐶𝑡𝑠𝑡𝑒 , where 𝑡𝑠, 𝑡𝑒 is the start and end
time
User 𝑢
Time 𝑡
GPS reading 𝑔
Rank a subset 𝑃′ from a POI database 𝑃 𝑅𝑔,𝑢,𝑡,𝐶𝑡𝑠𝑡𝑒
= 𝜋𝑔,𝑢,𝑡,𝐶𝑡𝑠𝑡𝑒𝑃′ , 𝑃′ ⊆ 𝑃

25
Positioning Error & Dense POI
GPS errors
High density, hierarchical and large scale properties of POIs
Size(m2) 200x200 100x100 50x50
avg #poi 10.6 6.0 3.7
stdvar #poi 21.8 11.2 6.9
max #poi 490 286 237
26
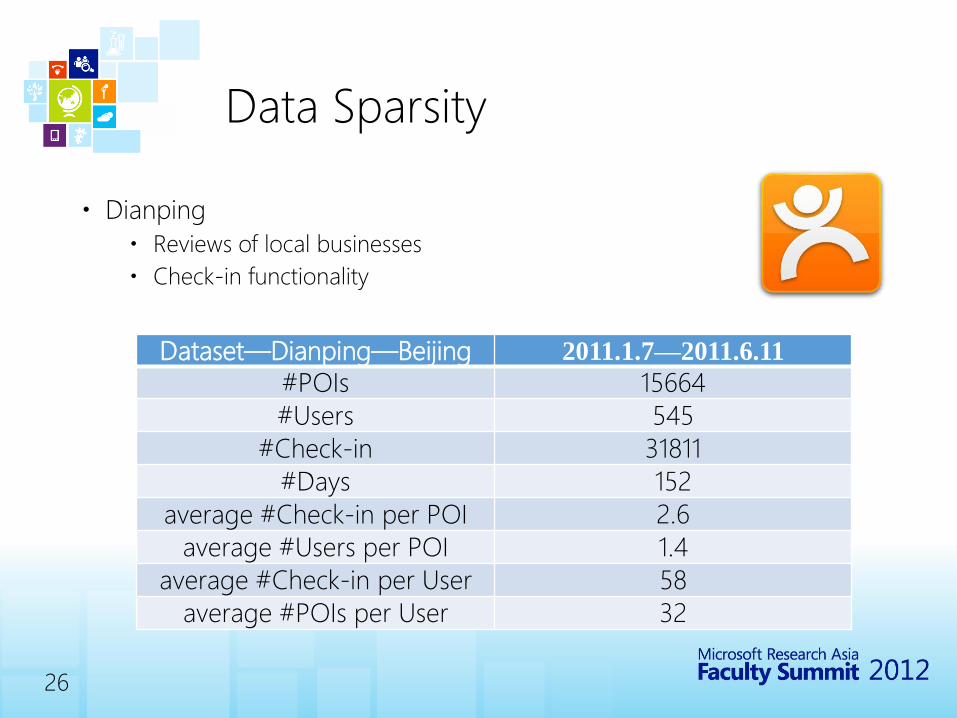
Data Sparsity
Dianping
Reviews of local businesses
Check-in functionality
Dataset—Dianping—Beijing 2011.1.7—2011.6.11
#POIs 15664
#Users 545
#Check-in 31811
#Days 152
average #Check-in per POI 2.6
average #Users per POI 1.4
average #Check-in per User 58
average #POIs per User 32
27
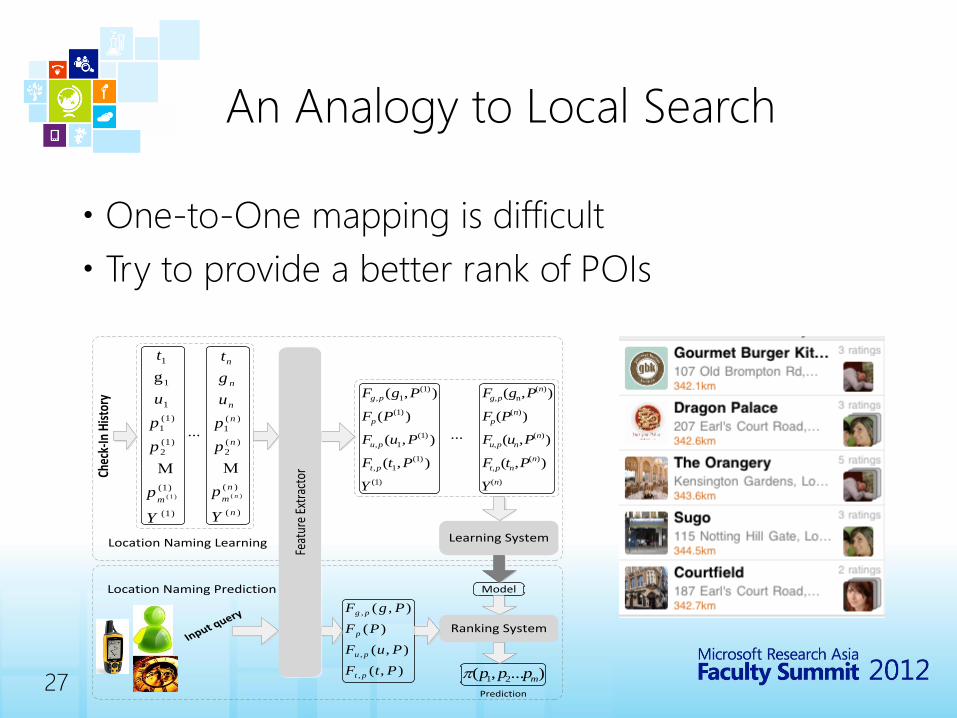
An Analogy to Local Search
One-to-One mapping is difficult
Try to provide a better rank of POIs
Learning System
Model
Ranking System
),(
),(
)(
),(
,
,
,
PtF
PuF
PF
PgF
pt
pu
p
pg
)...,( 21 mppp
Prediction
)1(
)1(
1,
)1(
1,
)1(
)1(
1,
),(
),(
)(
),(
Y
PtF
PuF
PF
PgF
pt
pu
p
pg
)1(
)1(
)1(
2
)1(
1
1
1
1
)1(
g
Y
p
p
p
u
t
m
)(
)(
)(
2
)(
1
)(
n
n
m
n
n
n
n
n
Y
p
p
p
u
g
t
n
...
)(
)(
,
)(
,
)(
)(
n,
),(
),(
)(
),(
n
n
npt
n
npu
n
p
n
pg
Y
PtF
PuF
PF
PgF
...
Feat
ure
Extr
acto
r
Location Naming Learning
Input query
Location Naming Prediction
Chec
k-In
His
tory

28
Static Features
Number of reviews related to it
Average score given by social network users
Number of web pages referring to it
Number of check-ins
Number of people checked-in
Number of photos users have uploaded

29
Dynamic Features
Features for an individual user Distance between the GPS reading and the POI
location
Preference of user 𝑢 on POI 𝑝 Measured by the number of check-ins by user 𝑢 at POI 𝑝
Features for a group of users Temporal pattern between time 𝑡 and POI 𝑝
Measured by the number of check-ins at time 𝑡 and at POI 𝑝
30
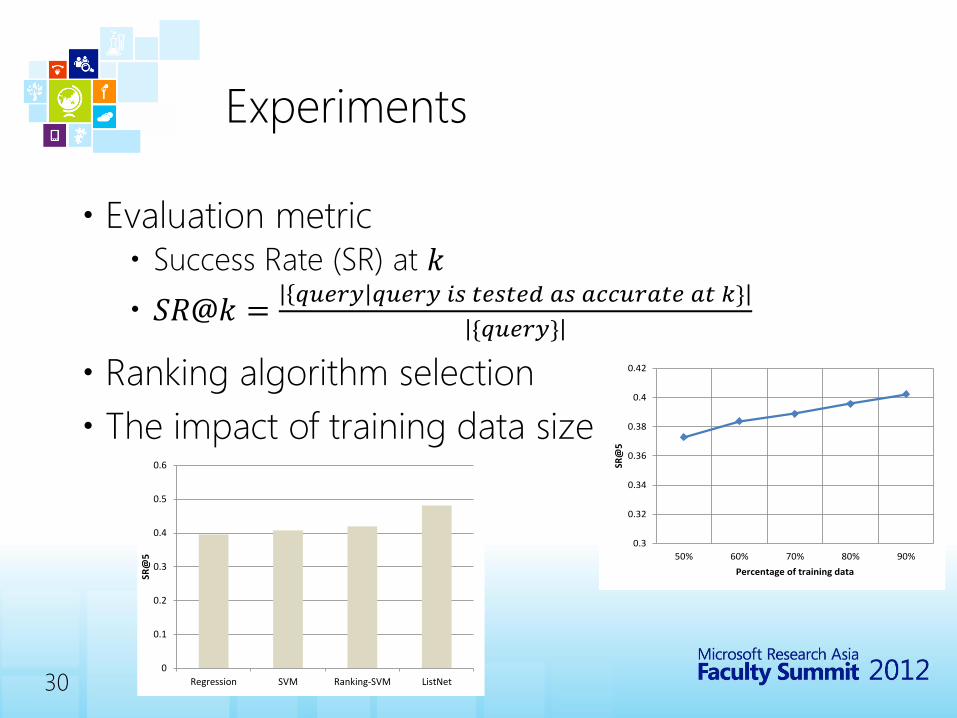
Experiments
Evaluation metric Success Rate (SR) at 𝑘
𝑆𝑅@𝑘 =𝑞𝑢𝑒𝑟𝑦 𝑞𝑢𝑒𝑟𝑦 𝑖𝑠 𝑡𝑒𝑠𝑡𝑒𝑑 𝑎𝑠 𝑎𝑐𝑐𝑢𝑟𝑎𝑡𝑒 𝑎𝑡 𝑘}
{𝑞𝑢𝑒𝑟𝑦}
Ranking algorithm selection
The impact of training data size
0
0.1
0.2
0.3
0.4
0.5
0.6
Regression SVM Ranking-SVM ListNet
SR@
5
0.3
0.32
0.34
0.36
0.38
0.4
0.42
50% 60% 70% 80% 90%
SR@
5
Percentage of training data
31
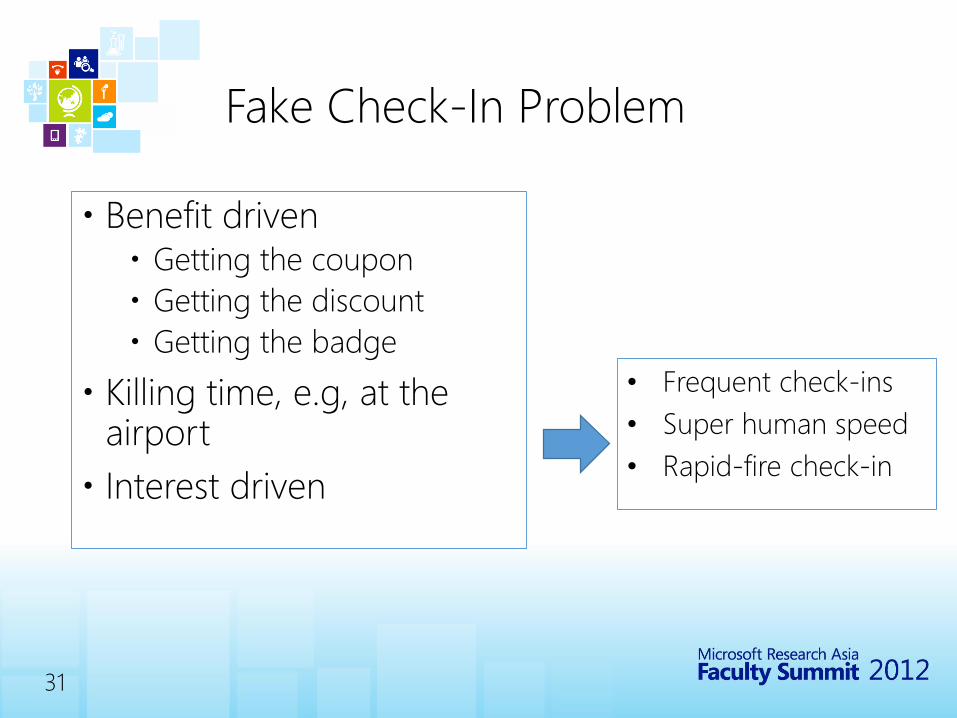
Fake Check-In Problem
Benefit driven Getting the coupon
Getting the discount
Getting the badge
Killing time, e.g, at the airport
Interest driven
• Frequent check-ins
• Super human speed
• Rapid-fire check-in
32
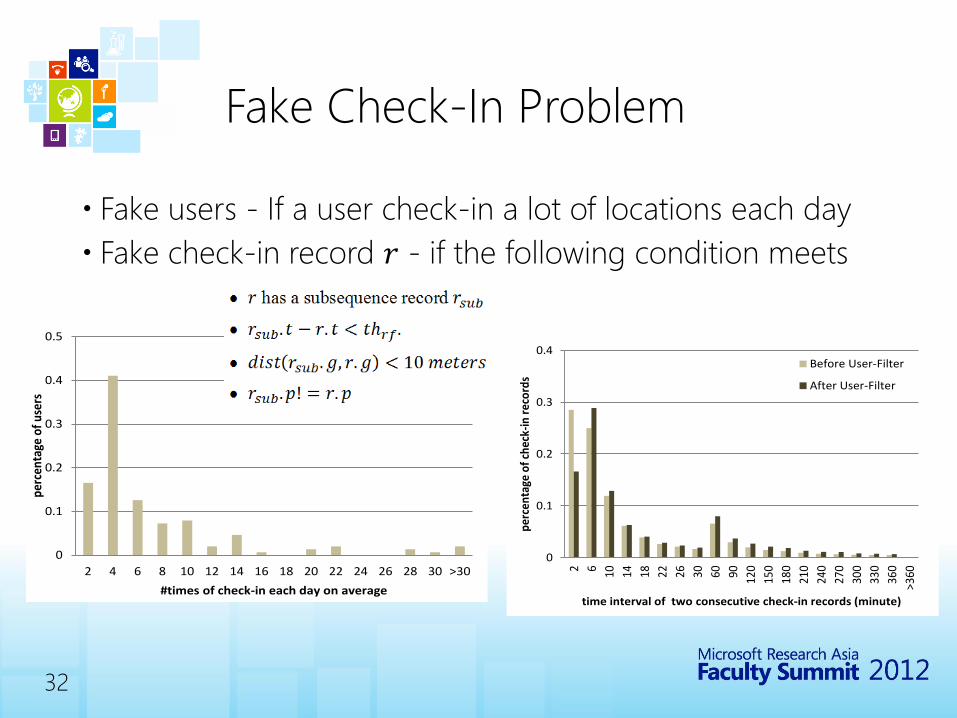
Fake Check-In Problem
Fake users - If a user check-in a lot of locations each day
Fake check-in record 𝑟 - if the following condition meets
0
0.1
0.2
0.3
0.4
0.5
2 4 6 8 10 12 14 16 18 20 22 24 26 28 30 >30
perc
enta
ge o
f use
rs
#times of check-in each day on average
0
0.1
0.2
0.3
0.4
2 6 10 14 18 22 26 30 60 90 120
150
180
210
240
270
300
330
360
>360
per
cen
tage
of
chec
k-in
rec
ord
s
time interval of two consecutive check-in records (minute)
Before User-Filter
After User-Filter
33
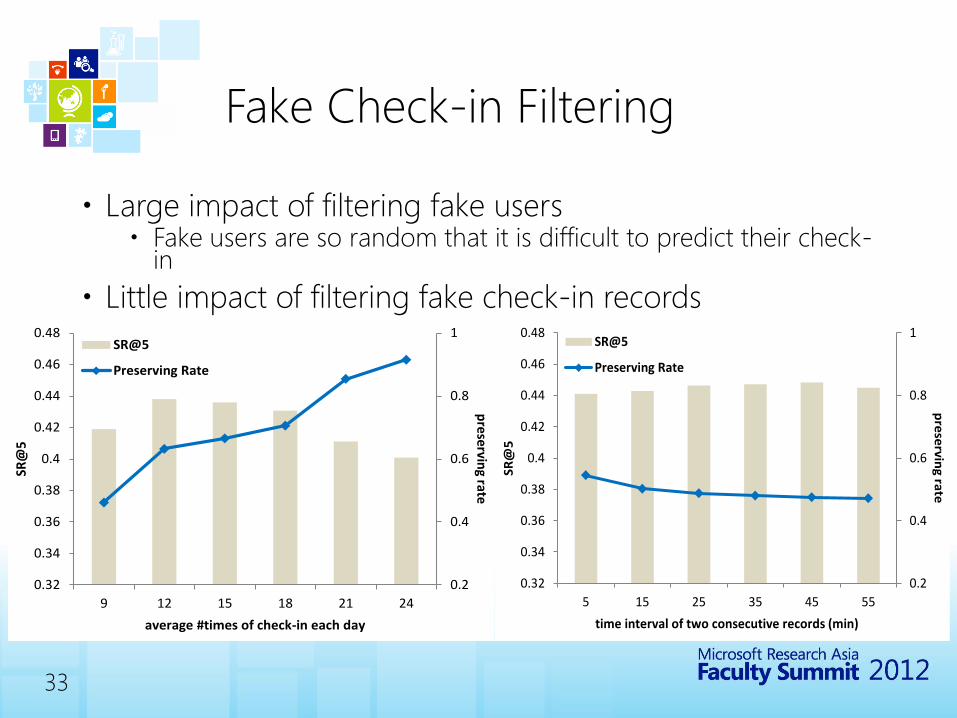
Fake Check-in Filtering
Large impact of filtering fake users Fake users are so random that it is difficult to predict their check-
in
Little impact of filtering fake check-in records
0.2
0.4
0.6
0.8
1
0.32
0.34
0.36
0.38
0.4
0.42
0.44
0.46
0.48
9 12 15 18 21 24
preservin
g rate
SR@
5
average #times of check-in each day
SR@5
Preserving Rate
0.2
0.4
0.6
0.8
1
0.32
0.34
0.36
0.38
0.4
0.42
0.44
0.46
0.48
5 15 25 35 45 55
pre
servin
g rate
SR@
5
time interval of two consecutive records (min)
SR@5
Preserving Rate
34
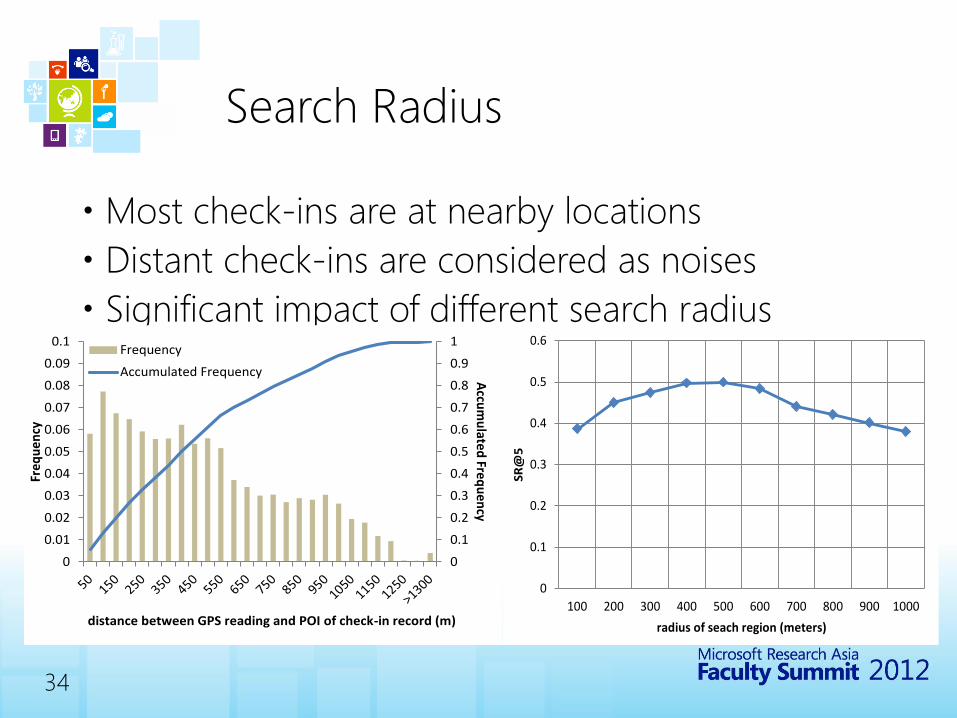
Search Radius
Most check-ins are at nearby locations
Distant check-ins are considered as noises
Significant impact of different search radius
0
0.1
0.2
0.3
0.4
0.5
0.6
0.7
0.8
0.9
1
0
0.01
0.02
0.03
0.04
0.05
0.06
0.07
0.08
0.09
0.1
Accu
mu
lated Freq
uen
cy
Freq
uen
cy
distance between GPS reading and POI of check-in record (m)
Frequency
Accumulated Frequency
0
0.1
0.2
0.3
0.4
0.5
0.6
100 200 300 400 500 600 700 800 900 1000
SR@
5
radius of seach region (meters)

35
Feature Effectiveness
#check-in is significantly better than webPop
No big difference of different temporal patterns
0
0.1
0.2
0.3
0.4
0.5
#check-in #people #review #photo score webPop
SR
@5
0.45
0.46
0.47
0.48
0.49
0.5
time of day weekend or not day of week
SR@
5

36
Overall Results
Our proposed LSRank performs the best, but not significantly better than UserRank.
Distance and interaction between user and POI is important
Static features can not be ignored.
0.2
0.3
0.4
0.5
0.6
0.7
LSRank UserRank DistRank TimeRank StaticRank
SR@
5

37
User Location Naming
A novel location naming approach which provides concrete and meaningful names to users based on time, GPS reading and check-in histories.
Most important features User history Distance #review Web popularity
64.5% of test queries can return intended POIs within top 5 results

38
Human Mobility
Mobility based on Levy Flight and variants (Brockmann et al Nature’06, Gonzalez et al Nature’08, Song et al Nature Physics’10, Rhee et al Infocom’08)
Data from Bank notes, CDR, GPS Jump step size analysis Collective and individual behavior Gyration distribution
Mobility extracted from real traces (Isaacman et al MobiSys’12, Kim et al, Infocom’06, Cho et al KDD’11, Sadilek et al WSDM’11, Krumm et al Ubicomp’06, Yoon et al MobiSys’06, Jing et al KDD’12)
Data from GPS, CDR and WLAN, Check-in and Geo-twitters Collective and individual significant places (home/workplace) detection Markov process between hot spots modeling Duration estimation at a location Socially controlling mobility (Geo-twitters and check-ins)
Move near friends’ home
Move similar to friends

39
Mobility Prediction
Predictability (Song et al Science’10 , Jensen et al MLSP, Lin et al Ubicomp’12) Low resolution GSM/WLAN/blue tooth/acceleration with
entropy measurement
High resolution GPS data with redundancy measurement
Prediction Spatial (Song et al TMC’06, Eagle et al Pers Ubiquit
Comput’06, Scellato et al. Pervasive’11)
Temporal (Chon et al PerCom’12, Scellato et al. Pervasive’11)
Activity recognition (Eagle et al Behav Ecol Sociobiol’ 09)
40
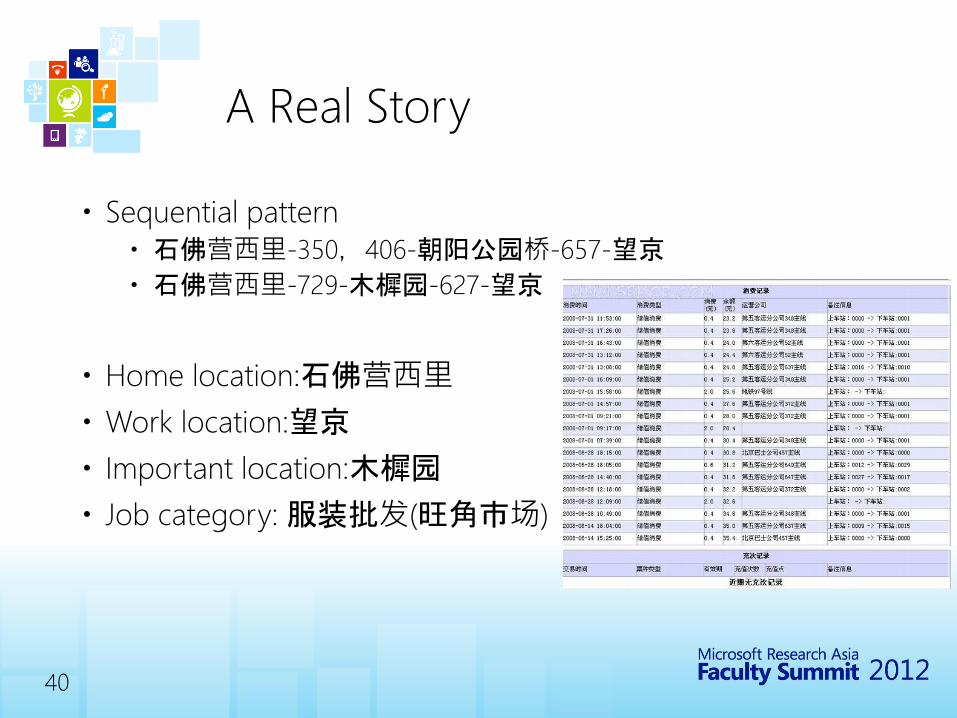
A Real Story
Sequential pattern
石佛营西里-350,406-朝阳公园桥-657-望京
石佛营西里-729-木樨园-627-望京
Home location:石佛营西里
Work location:望京
Important location:木樨园
Job category: 服装批发(旺角市场)

41
Summary
Understanding location and people through mobile social networks
GeoLife: Building Social Networks Using Human Location History
Learning Location Naming from User Check-In Histories

42
Thank you!