understanding users: using metrics and surveys to understand our consumers
TRANSCRIPT

UNDERSTANDING USERS: Who are they and why do they use ACME.com?UX Research Team @ ACME.com

Burning questionsHow to explain the Christmas/New Year spike in traffic.

The post-Christmas/New Year spike

2012 post-Christmas Spike

2013 post-Christmas Spike

2014 post-Christmas Spike

Burning questionsHoliday traffic spike prompts the two perennial questions: 1. Who is causing the increase
in traffic2. Why does it happen on
Christmas/ New Year and not Jan 14 or Feb 2?

Ask them: “Who are you?”

Overview Data reporting tells an incomplete
picture Data analysis requires more than
reporting In order to analyze data such as metrics,
traffic analytics, or conversion rates, we follow the maxim: “Keep Calm and Take Data in Context”
Buyers are liars; users often are too


So what do the numbers in our dashboard tell us?
Reading our dashboard

Traffic patterns: a closer look
We looked at the meta-context: our yearly business cycle and the Christmas/New Year spike.
Next, we look more granularly at traffic and lead conversion patterns at Christmas and New Year.

Unique visitors at Christmas
23-Dec 24-Dec 25-Dec 26-Dec 27-Dec 28-Dec0
50,000
100,000
150,000
200,000
250,000
300,000
350,000
400,000
450,000
500,000
Unique Visitors

23-Dec 24-Dec 25-Dec 26-Dec 27-Dec 28-Dec0
100,000
200,000
300,000
400,000
500,000
600,000
Visits
Total visits at Christmas
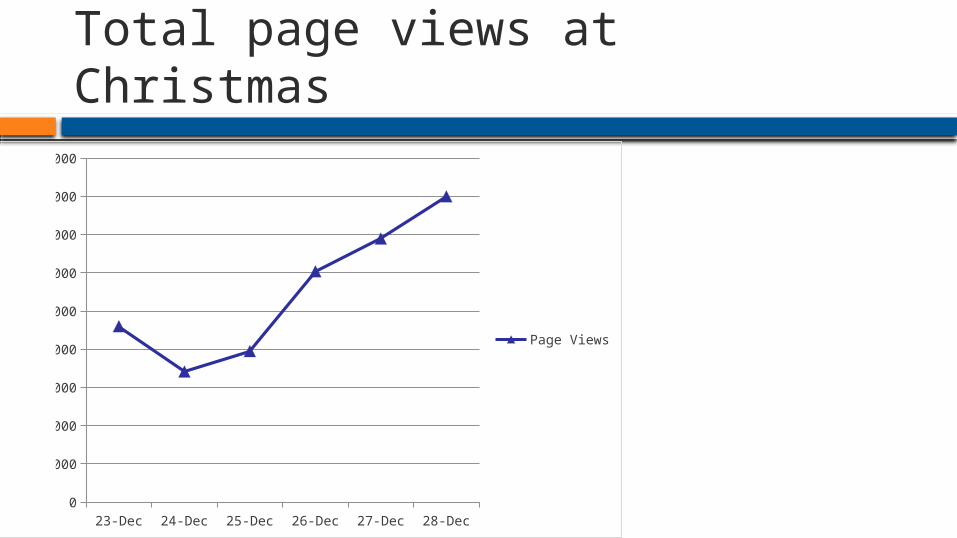
Total page views at Christmas
23-Dec 24-Dec 25-Dec 26-Dec 27-Dec 28-Dec0
500,000
1,000,000
1,500,000
2,000,000
2,500,000
3,000,000
3,500,000
4,000,000
4,500,000
Page Views

What do we notice?

2014- Similar pattern

To answer that question, we need to look at historical and comparative data
Is the pattern typical?

Similar pattern year over year (2012-2014)

Is there a similar pattern for leads?
23-Dec 24-Dec 25-Dec 26-Dec 27-Dec 28-Dec0
1,0002,0003,0004,0005,0006,0007,000
Rental leads
23-Dec 24-Dec 25-Dec 26-Dec 27-Dec 28-Dec0
200400600800
100012001400
Apartment leads
23-Dec 24-Dec 25-Dec 26-Dec 27-Dec 28-Dec0
500100015002000
For sale leads

Is there a similar pattern for survey responses?
23-Dec 24-Dec 25-Dec 26-Dec 27-Dec 28-Dec0
100
200
300
400
500
600
700
800
900
1000
Survey respondents

Similar patterns
Very similar pattern with the exception of Christmas Day.
Speculation as to why?

Similar pattern

Conclusions• Given this context, can we draw any
conclusions?• Do the traffic patterns tell a story?• What about conversion patterns?

Now that we’ve looked at total traffic numbers, we need to look at ratios and rates
Totals, ratios, and rates

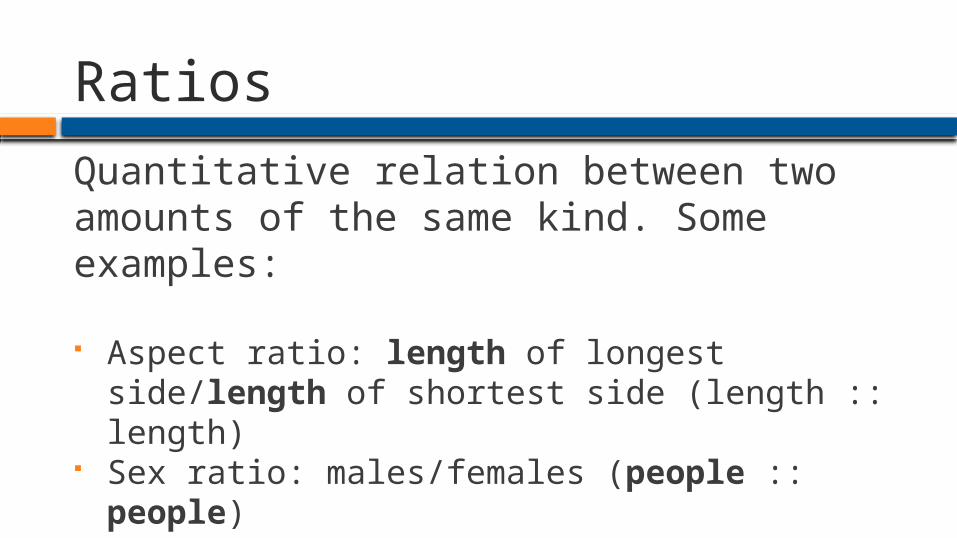
RatiosQuantitative relation between two amounts of the same kind. Some examples: Aspect ratio: length of longest side/length of
shortest side (length :: length) Sex ratio: males/females (people :: people) Student/teacher ratio (people :: people)

RateAs a type of ratio, it is a quantitative relation between two amounts of a different kind. Examples: MPG and MPH Crude Marriage Rate and General Marriage Rate Lead Conversion Rate and Bounce Rate

ConversionsTotal number of desired outcomes
• ACME.com: the desired outcome is for people to submit their information to an agent or broker

ConversionsTwo ways to count
conversions• Total conversions: count every
form submission even if several submissions were generated by one person
• Unique conversions: count only the people who submit the form. Even if they submit several inquiries, we count them only once

Conversion rateNumber of desired outcomes divided by unique visitors during a particular time.
-

Conversion rateAnother way to measure: Number of unique desired
outcomes divided by unique visitors during a particular time.
-
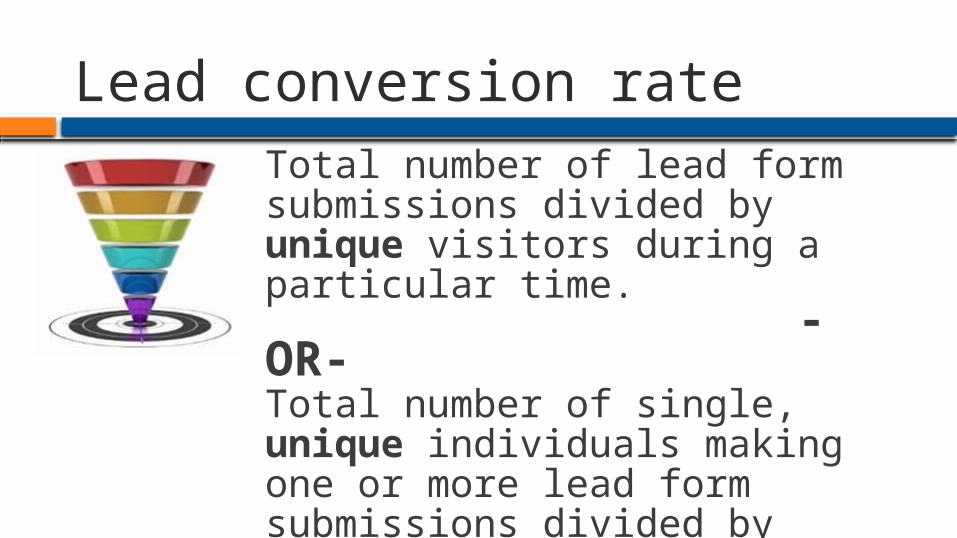
Lead conversion rateTotal number of lead form submissions divided by unique visitors during a particular time. -OR-Total number of single, unique individuals making one or more lead form submissions divided by unique visitors during particular time.-
What are our lead conversion ratesGiven the patterns we found with traffic, are there any patterns we should expect for conversion rates?

For sale lead conversion rate
23-Dec 24-Dec 25-Dec 26-Dec 27-Dec 28-Dec0.00%
0.05%
0.10%
0.15%
0.20%
0.25%
0.30%
0.35%
0.40%
for sale conversion rate
A steady rise

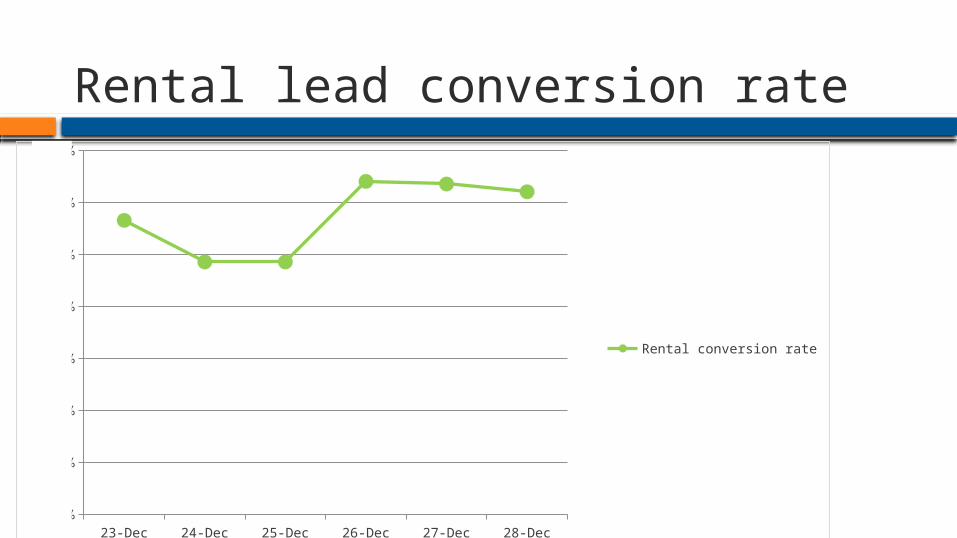
Rental home lead conversion rate
23-Dec 24-Dec 25-Dec 26-Dec 27-Dec 28-Dec0.00%
0.20%
0.40%
0.60%
0.80%
1.00%
1.20%
1.40%
Rental conversion rate
More erratic and doesn’t amount to much change over time frame
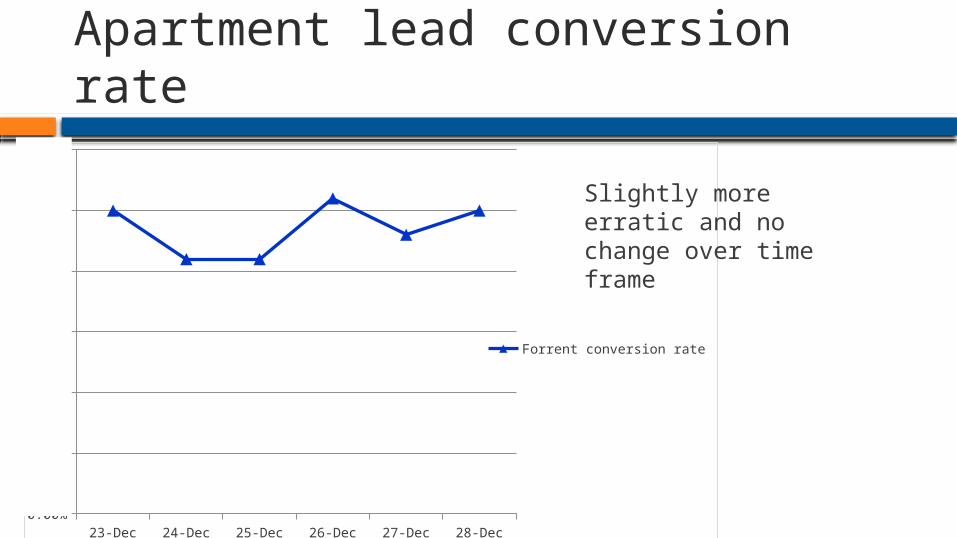
Apartment lead conversion rate
23-Dec 24-Dec 25-Dec 26-Dec 27-Dec 28-Dec0.00%
0.05%
0.10%
0.15%
0.20%
0.25%
0.30%
Forrent conversion rate
Slightly more erratic and no change over time frame

Which is the best performer?
23-Dec 24-Dec 25-Dec 26-Dec 27-Dec 28-Dec0.00%0.05%0.10%0.15%0.20%0.25%0.30%0.35%0.40%
For sale
23-Dec 24-Dec 25-Dec 26-Dec 27-Dec 28-Dec0.00%0.20%0.40%0.60%0.80%1.00%1.20%1.40%
Rental homes
23-Dec 24-Dec 25-Dec 26-Dec 27-Dec 28-Dec0.00%
0.05%
0.10%
0.15%
0.20%
0.25%
0.30%
Apartment.com
1.13 % 1.24% = +.11 / +10%
3,697 5,878 = +2181 / +63%
.27 % .36% = +.09 / +33%
875 1719 = +844 / +97%
0.25 % .25% = 0 / 0
833 1192 = +359 / +43%

For sale lead conversion rate
22-Dec 23-Dec 24-Dec 25-Dec 26-Dec 27-Dec0.00%
0.05%
0.10%
0.15%
0.20%
0.25%
0.30%
0.35%
0.40%
For sale conversion rate

For sale lead totals + unique visitors + for sale conversions
Rental lead conversion rate
23-Dec 24-Dec 25-Dec 26-Dec 27-Dec 28-Dec0.00%
0.20%
0.40%
0.60%
0.80%
1.00%
1.20%
1.40%
Rental conversion rate

Rental lead totals + unique visitors

Rental lead totals + unique visitors + conversion rate
rate
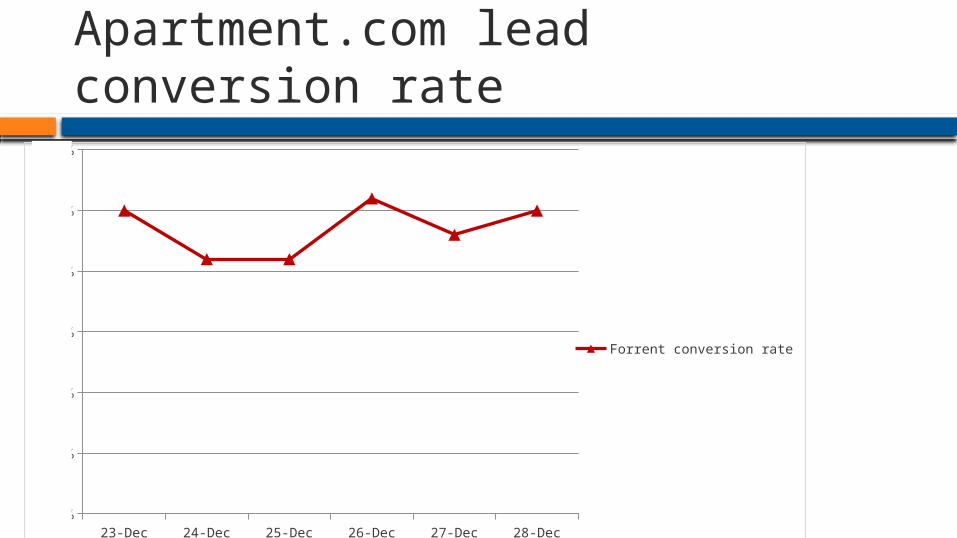
Apartment.com lead conversion rate
23-Dec 24-Dec 25-Dec 26-Dec 27-Dec 28-Dec0.00%
0.05%
0.10%
0.15%
0.20%
0.25%
0.30%
Forrent conversion rate

Apartment.com lead totals + unique visitors

Apartment lead totals + unique visitors + conversions

Context helps us understand While the for sale conversion rate goes up (orange line), the for sale conversion totals go down, as do uniques.
While the rental conversion rate goes down (blue line), the total conversions increase as do uniques
875731
831 1231
48685305
5878

• We know what ordinary traffic totals are
• We know what our rates are• We see differences• How do we explain them?
Who visited and took the poll

Total survey respondents
23-Dec 24-Dec 25-Dec 26-Dec 27-Dec 28-Dec0
100
200
300
400
500
600
700
800
900
1000
Survey respondents

Survey response rate
23-Dec 24-Dec 25-Dec 26-Dec 27-Dec 28-Dec0
0.05
0.1
0.15
0.2
0.25
0.3
Survey response rate

Survey respondent totals compared to rate
23-Dec 24-Dec 25-Dec 26-Dec 27-Dec 28-Dec
Survey respondents
23-Dec 24-Dec 25-Dec 26-Dec 27-Dec 28-Dec
Survey respons...
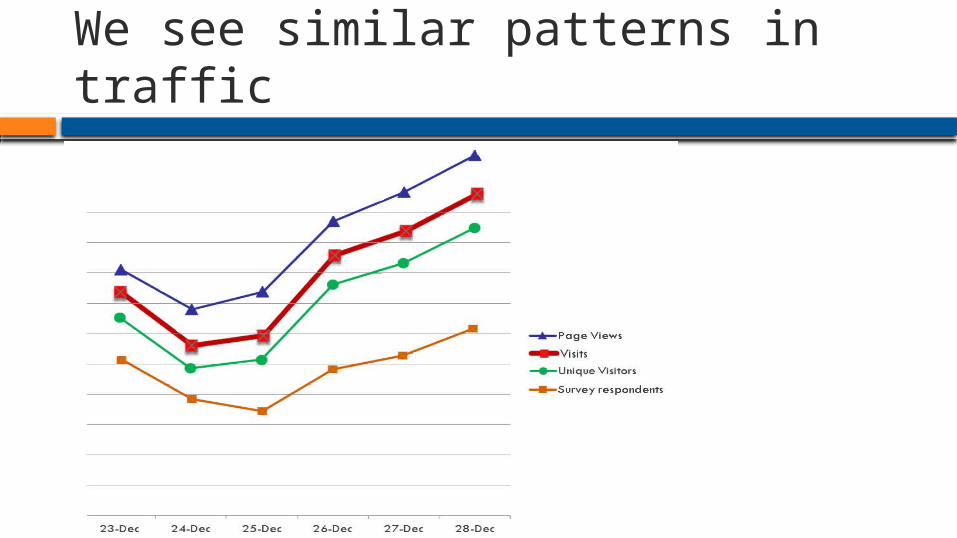
We see similar patterns in traffic

Similar patterns in response rate compared to survey response and unique visitor traffic
#REF!Unique Visitors

Given all this context, let’s look at the poll
The context is like a sanity check, to make sure it’s not telling an aberrant story
Who visited during the Christmas holiday?


US - Renters and buyers

33:67 For every 1 renter,
there are 2 buyers 1:2
35:65 For every 1 renter,
there are 1.86 buyers
1:1.86

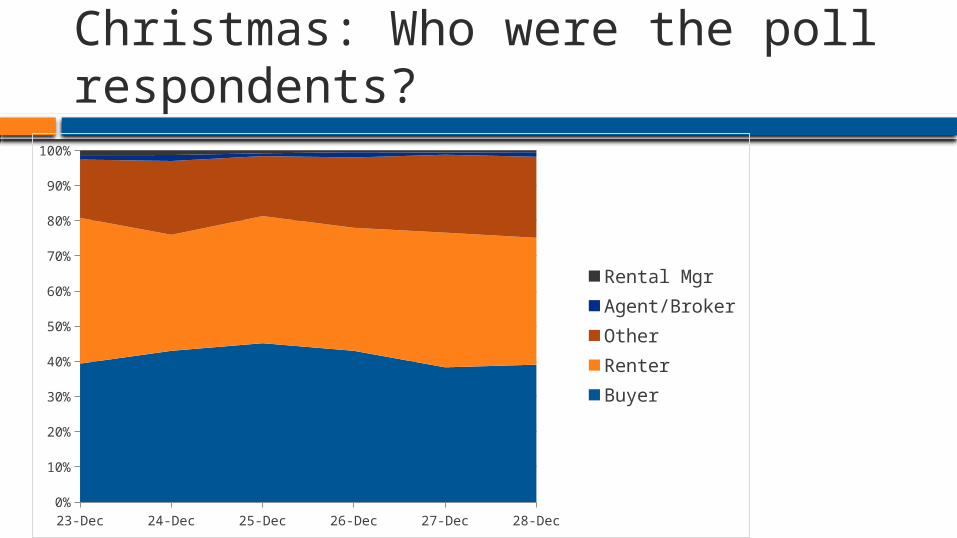
Respondent’s self-ID (Christmas) 23-Dec 24-Dec 25-Dec 26-Dec 27-Dec 28-Dec 29-Dec
Buyer 39 43 45 43 38 39 40
Renter 40 33 36 35 38 36 36
Other 15 21 17 20 22 23 22
Agent/Broker 1 2 1 2 1 1 2
Rental Mgr 1 1 1 1 1 1 1

Christmas: Who were the poll respondents?
23-Dec 24-Dec 25-Dec 26-Dec 27-Dec 28-Dec 29-Dec0%
10%
20%
30%
40%
50%
60%
70%
80%
90%
100%
38 43 45 43 38 39 40
40 3336 35 38 36 36
16 2117 20 22 23 22
Rental MgrAgent/BrokerOtherRenterBuyer
Christmas: Who were the poll respondents?
23-Dec 24-Dec 25-Dec 26-Dec 27-Dec 28-Dec0%
10%
20%
30%
40%
50%
60%
70%
80%
90%
100%
Rental MgrAgent/BrokerOtherRenterBuyer

Christmas: Who were the poll respondents?
23-Dec 24-Dec 25-Dec 26-Dec 27-Dec 28-Dec0
10
20
30
40
50
60
70
80
90
100
OtherRenterBuyer

Can we deduce who the “others” are?
67%
28%
4% 1%
(n = 2365)
Sale SRP Rental SRP HV SRP
Source page - respondents identifying as “Other”
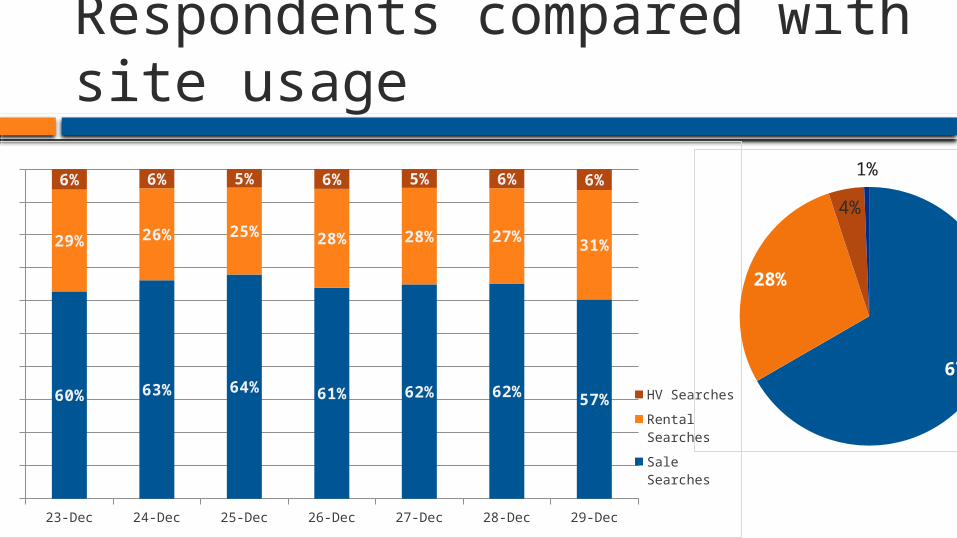
Respondents compared with site usage
23-Dec 24-Dec 25-Dec 26-Dec 27-Dec 28-Dec 29-Dec0%
10 %
20 %
30 %
40 %
50 %
60 %
70 %
80 %
90 %
10 0%
60% 63% 64% 61% 62% 62% 57%
29% 26% 25% 28% 28% 27% 31%
6% 6% 5% 6% 5% 6% 6%
HV Searches
Rental Searches
Sale Searches
67%
28%
4% 1%

For sale SRPs and respondent’s ID
68%6%
24%
1% 1%
Buyer Renter Other Agent/Broker Rental Mgr

For rent SRPs and respondent’s ID
4%
80%
14%
1%1%
Buyer Renter Other Agent/Broker Rental Mgr

• If we just looked at the survey, looks like there are slightly more buyers than renters.
• Might also think that the volatility in the other category can help explain trends
• Looking at the data in context shows that there’s was a strong surge in for sale traffic that probably accounts for the bulk of the traffic.
• This comports with other data such as national surveys.
Conclusion

• Now we can look at what cause the NY traffic spike
• First, look at traffic and conversion rate patterns
New Year Traffic spike

NY: Unique visitors
31-Dec 1-Jan 2-Jan 3-Jan 4-Jan 5-Jan0
100,000
200,000
300,000
400,000
500,000
600,000
NY Unique visitors

2012 – 2014: unique visitor pattern YoY
31-Dec 1-Jan 2-Jan 3-Jan 4-Jan 5-Jan0
100,000
200,000
300,000
400,000
500,000
600,000
Unique visitors 2014-5Unique visitors 2013-4Unique visitors 2012-3

NY for sale lead conversion rate
31-Dec 1-Jan 2-Jan 3-Jan 4-Jan 5-Jan0.00%
0.05%
0.10%
0.15%
0.20%
0.25%
0.30%
0.35%
0.40%
0.45%
0.50%
NY For sale conversion rate

NY rental home lead conversion rate
31-Dec 1-Jan 2-Jan 3-Jan 4-Jan 5-Jan0.00%
0.20%
0.40%
0.60%
0.80%
1.00%
1.20%
1.40%
1.60%
NY Rental conversion rate

Apartment.com lead conversion rate
31-Dec 1-Jan 2-Jan 3-Jan 4-Jan 5-Jan0.00%
0.05%
0.10%
0.15%
0.20%
0.25%
0.30%
0.35%
NY Forrent conversion rate

Which is the best performer?
1.12 1.51% = +.39 / +35%
4,156 8015 = +3859 / +93%
.32 .43% = +.11 / +34%
1189 2,287 = +1098 / +92%
0.22 .31% = +.09 / 41%
845 1620= +775 / +92%
31-Dec 1-Jan 2-Jan 3-Jan 4-Jan 5-Jan0.00%0.05%0.10%0.15%0.20%0.25%0.30%0.35%0.40%0.45%0.50%
For sale Rental homes Apartment.com
31-Dec 1-Jan 2-Jan 3-Jan 4-Jan 5-Jan0.00%0.20%0.40%0.60%0.80%1.00%1.20%1.40%1.60%
31-Dec 1-Jan 2-Jan 3-Jan 4-Jan 5-Jan0.00%
0.05%
0.10%
0.15%
0.20%
0.25%
0.30%
0.35%

For sale leads + unique visitors + for sale conversions

NY rental lead conversion rate
31-Dec 1-Jan 2-Jan 3-Jan 4-Jan 5-Jan0.00%
0.20%
0.40%
0.60%
0.80%
1.00%
1.20%
1.40%
1.60%
NY Rental conversion rate

NY rental leads + unique visitors + conversion rate
rate

Apartment.com lead conversion rate (NY)
31-Dec 1-Jan 2-Jan 3-Jan 4-Jan 5-Jan0.00%
0.05%
0.10%
0.15%
0.20%
0.25%
0.30%
0.35%
NY Forrent conversion rate

NY Apartment leads + unique visitors + conversion rate
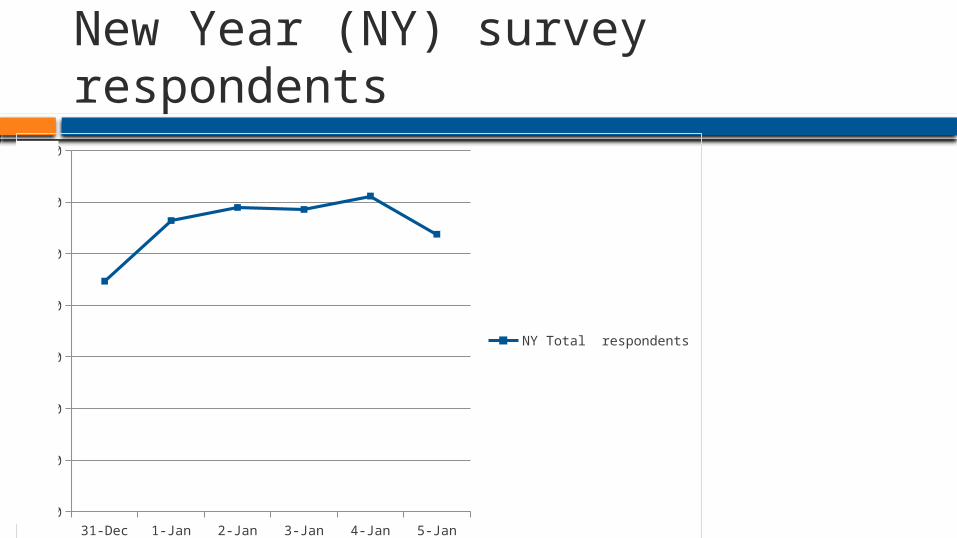
New Year (NY) survey respondents
31-Dec 1-Jan 2-Jan 3-Jan 4-Jan 5-Jan0
200
400
600
800
1000
1200
1400
NY Total respondents

NY survey respondents + unique visitors

Given all this context, let’s look at the poll
Who visited during the New Year holiday?

Respondents’ self-ID, New Year poll
31-Dec 1-Jan 2-Jan 3-Jan 4-Jan 5-Jan
Buyer 45 37 35 37 37 35
Renter 35 36 38 40 39 41
Other 18 26 25 21 22 22
Agent/Broker 1 0 1 1 2 2
Rental Mgr 1 1 1 1 1 1

Respondent’s self-ID (Xmas v NY)
23-Dec 24-Dec 25-Dec 26-Dec 27-Dec 28-Dec 29-Dec
Buyer 38 43 45 43 38 39 40
Renter 40 33 36 35 38 36
36
Other 16 21 17 20 22 23 22
Agent/Broker 1 2 1 2 1 1 2
Rental Mgr 1 1 1 1 1 1 1
31-Dec 1-Jan 2-Jan 3-Jan 4-Jan 5-Jan
Buyer 45 37 35 37 37 35
Renter 35 36 38 40 39 41
Other 18 26 25 21 22 22
Agent/Broker 1 0 1 1 2 2
Rental Mgr 1 1 1 1 1 1

Who were the poll respondents (NY)
12/31/14 01/01/15 01/02/15 01/03/15 01/04/15 01/05/150%
10%
20%
30%
40%
50%
60%
70%
80%
90%
100%
4537 35 37 37 35
3536 38 40 39 41
18 26 25 21 22 22
Rental MgrAgent/BrokerOtherRenterBuyer

Comparing poll respondents
12/31/14 01/01/15 01/02/15 01/03/15 01/04/15 01/05/150%
10%
20%
30%
40%
50%
60%
70%
80%
90%
100%
4537 35 37 37 35
3536 38 40 39 41
18 26 25 21 22 22
Rental MgrAgent/BrokerOtherRenterBuyer
23-Dec 24-Dec 25-Dec 26-Dec 27-Dec 28-Dec 29-Dec0%
10%
20%
30%
40%
50%
60%
70%
80%
90%
100%
38 43 45 43 38 39 40
40 3336 35 38 36 36
16 21 17 20 22 23 22
Rental MgrAgent/BrokerOtherRenterBuyer

Who were the poll respondents (NY)
12/31/14 01/01/15 01/02/15 01/03/15 01/04/15 01/05/150
10
20
30
40
50
60
70
80
90
100
OtherRenterBuyer
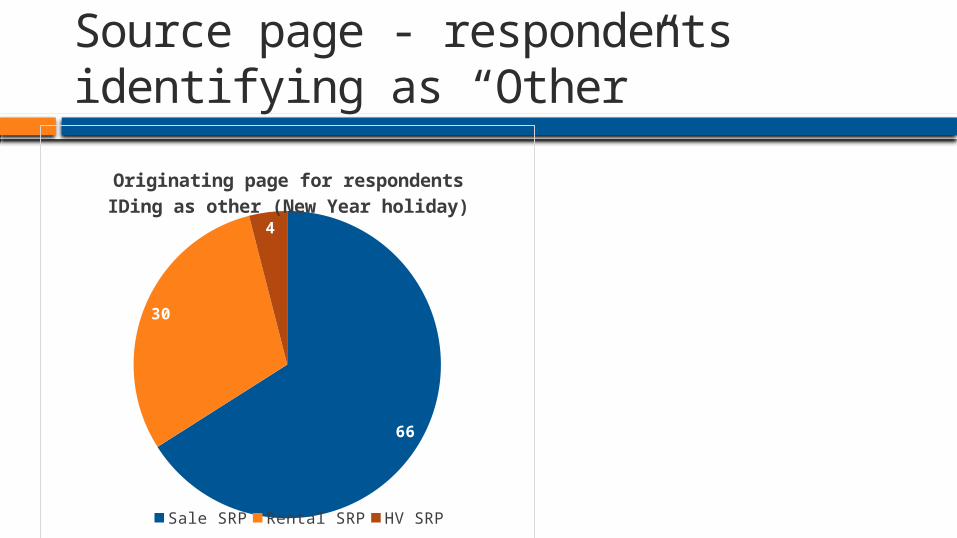
Source page - respondents identifying as “Other”
66
30
4
Originating page for respondents IDing as other (New Year holiday)
Sale SRP Rental SRP HV SRP

What users do Analytics is the discovery and
communication of meaningful patterns in data
Analytics can tell us what is happening on a web site or in an application
Analytics are a form of descriptive statistics. They tell us what visitors do.

What about who and why? Analytics: what users do, not who they
are How can we know who they are? What about their motivations?
