unicredit group 4q16 and fy16 results · decisive actions taken on legacy and operational issues to...
TRANSCRIPT

UniCredit Group 4Q16 and FY16 results
Milan February 09th, 2017
Disclaimer
2
This Presentation may contain written and oral 'forward-looking statements', which includes all statements that do not relate solely to historical or current facts and which are therefore inherently uncertain. All forward-looking statements rely on a number of assumptions, expectations, projections and provisional data concerning future events and are subject to a number of uncertainties and other factors, many of which are outside the control of UniCredit S.p.A. (the 'Company'). There are a variety of factors that may cause actual results and performance to be materially different from the explicit or implicit contents of any forward-looking statements and thus, such forward-looking statements are not a reliable indicator of future performance. The Company undertakes no obligation to publicly update or revise any forward-looking statements, whether as a result of new information, future events or otherwise, except as may be required by applicable law. The information and opinions contained in this Presentation are provided as at the date hereof and are subject to change without notice. Neither this Presentation nor any part of it nor the fact of its distribution may form the basis of, or be relied on or in connection with, any contract or investment decision. The information, statements and opinions contained in this Presentation are for information purposes only and do not constitute a public offer under any applicable legislation or an offer to sell or solicitation of an offer to purchase or subscribe for securities or financial instruments or any advice or recommendation with respect to such securities or other financial instruments. None of the securities referred to herein have been, or will be, registered under the U.S. Securities Act of 1933, as amended, or the securities laws of any state or other jurisdiction of the United States or in Australia, Canada or Japan or any other jurisdiction where such an offer or solicitation would be unlawful (the 'Other Countries'), and there will be no public offer of any such securities in the United States. This Presentation does not constitute or form a part of any offer or solicitation to purchase or subscribe for securities in the United States or the Other Countries. Pursuant the consolidated law on financial intermediation of 24 February 1998 (article 154-bis, paragraph 2) Francesco Giordano, in his capacity as manager responsible for the preparation of the Company’s financial reports declares that the accounting information contained in this Presentation reflects the UniCredit Group’s documented results, financial accounts and accounting records. Neither the Company nor any member of the UniCredit Group nor any of its or their respective representatives, directors or employees accept any liability whatsoever in connection with this Presentation or any of its contents or in relation to any loss arising from its use or from any reliance placed upon it. Data hereby presented considers Pioneer and Pekao classified under IFRS5, which differs from the one presented during Capital Markets Day (“CMD”) where both Pioneer and Pekao, inter alia other assets under disposal, were excluded from the perimeter of consolidation. In addition, Fino portfolio has been classified as Held for Sale and none of the figures reported in this presentation include loans related to the Fino portfolio. The Fino portfolio, as communicated during the Capital Markets Day, originally amounted to 17.7bn gross loans, which decreased to 17bn as at 31.12.16 thanks to work out activity. The corresponding net amount as at 31.12.16 is 2.2bn. Group asset quality ratios as at 31st December 16, including the Fino portfolio correspond to: gross NPE ratio of 14.8%; net NPE ratio of 6.1%; NPE coverage ratio of 62.9%; gross bad loans ratio of 9.9%; net bad loans ratio of 2.9%; bad loans coverage ratio of 73.1%.

3
Opening remarks
Underlying core revenues and gross operating profit resilient, underpinned by ongoing cost savings
Transform 2019 – early progress achieved: - Fully underwritten 13bn rights issue underway closing by March 10 - Comprehensive agreement signed covering all 14k planned exits - Project FINO in execution phase with Pimco and Fortress - All plan targets confirmed
Fully loaded CET1 ratio post capital increase at 11.15%, above 12% including Pioneer and Pekao disposals
Decisive actions taken on legacy and operational issues to transform bank and build on existing competitive advantages
Revenues and underlying operating profit resilient, underpinned by ongoing cost savings
Transform 2019 – early progress achieved: - Fully underwritten 13bn rights issue underway closing before March 10th - Comprehensive agreement signed covering all 14,000 planned exits - Project FINO in execution phase with Pimco and Fortress - All plan targets confirmed
Decisive actions taken on legacy and operational issues to transform bank and build on existing competitive advantages

Agenda
1
2
3
4
Transform 2019 Update Group/ Non Core Concluding remarks Annex Financials
4
5

5
Execution of our five Strategic Pillars
IMPROVE ASSET QUALITY
STRENGTHEN AND OPTIMIZE
CAPITAL
• 13bn rights issue fully underwritten by syndicate of leading international banks, to be settled before March 10th
13bn rights issue
Balance sheet de-risking
• Project FINO moved into execution phase for disposal of more than 50% to Pimco and Fortress
• Balance sheet de-risking, material reduction of NPE exposure q/q from c.75bn to 56bn with a coverage ratio of about 56%
• Decisive actions on legacies resulting in a material reduction of NPE ratio to 11.8% (-3.4p.p. Q/Q)
1 2 3 4 5 Transform 2019 Update

6
Execution of our five Strategic Pillars (cont.)
TRANSFORM OPERATING
MODEL
FTE reduction
NHR cost optimization
Branch reduction
• Agreements with Trade Unions reached in every country, securing entire exit plan • 2,800 FTE reduction in 2016, 20% of planned exits • 28% of non HR cost saving measures already identified and contractually agreed
in 2016 vs 2019 target • 29% of branches closed in 2016 vs 2019 target
MAXIMIZE COMMERCIAL BANK VALUE
CIB leadership
ADOPT LEAN BUT STEERING
CENTER
• Actions for the rightsizing of central and local support functions underway • Managerial KPIs to steer the business throughout the Group and divisions
1 2 3 4 5 Transform 2019 Update
CEE client penetration
• #1 EMEA Corporate Loans EUR-denominated in 2016 • #1 top in Italy, Germany, Austria and CEE in syndicated loans activity in 2016 • #1 Best Trade Finance Provider' in CEE and Western Europe in 2017 • more than 700,000 additional customers in 2016 in CEE
Lean Corporate Center
Managerial steering
1
2
3
4
Transform 2019 Update Group/ Non Core Concluding remarks Annex Financials
7
5

Group – 4Q16 and 2016 results embedding 13.2bn one-offs related to the execution of Transform 2019 1 2 3 4 Group – Results
Net profit, m
1,694
447153
4Q15 3Q16 4Q16
-13,558
FY15 FY16
-11,790
8
Adjusted net profit FY16, bn
Integration costs
Disposal of card processing business
Additional LLP
+0.4
-1.7
Write down DTA
-0.5
1.3 Net profit
FY16 adjusted
w/d of particip. & oth. charges
-0.9 Ukrsotsbank &
Pekao(1)
-2.2
One off 9M16
-0.3
+0.1
-11.8 Net loss
FY16 stated
-8.1
Write-down of GW & other intangibles
Note: For perimeter changes following the application of IFRS5 for Pioneer and Pekao please refer to slides 24.
(1) Reclassification of Pekao under IFRS5 and the recycling through P&L of the FX reserve for the disposal of Ukrsotsbank.
5

Post capital
increase
Group – Fully loaded CET 1 ratio at 11.15% post capital increase, above 12% including Pioneer and Pekao deals. CET1 ratio transitional at 11.49% post capital increase which will close before March 10th
Group – Regulatory capital
+12bp
Other
-41bp
20% ABB of Fineco
-6bp
-316bp 10.82%
Sep-16 2H16 loss(2)
+1bp
RWA dynamics
+22bp
AFS, FX, DBO
7.54%
Dec-16 Capital increase(4)
Threshold effects(3)
3.61%
Dec-16 post cap. incr.
11.15%
Fully loaded Common Equity Tier 1 ratio
Total capital ratio transitional Basel 3 leverage ratio
11.49%
15.08%
CET 1
Tier 1
Dec-16
Tier 2 11.66%
9.04%
12.43%
8.15%
Sep-16 Dec-16
14.50%
11.00%
11.81%
Dec-15
11.50%
14.23%
10.59%
2016 Basel 3 phase-in 60%
2015 Basel 3 phase-in 40%
Transitional
Fully loaded
9
AFS -7bp FX(1) +18bp DBO +11bp
1 2 3 4 5
(1) The appreciation of Russian ruble compensate the depreciation of the Turkish lira, whilst the effect of FX reserve of Ukraine is capital neutral; (2) 2H16 loss excluding write-off of intangibles (capital neutral) and including 3Q16 profit (not included in regulatory capital in 3Q16); (3) Temporary effects of deductions from CET1 capital related to Financial participations and DTA exceeding the relevant regulatory thresholds of 10% / 15%. These effects will reverse upon completion of the capital increase. Threshold effect on CET1 ratio transitional is lower due to phase-in benefit; (4) Including the benefit of capital increase and of the reversal of thresholds related to financial participations and DTA; (5) Include full consolidation of RWA of Uksotsbank (for Sep-16), Pekao and Pioneer
Post capital increase
4.37% 4.63%
Dec-15
4.66% 4.94%
Dec-16 Dec-16
3.24%
Sep-16
3.61% 4.49% 4.70%
390.9 385.9RWA fully loaded(5)

-3.8bn
Dec-16
387.1
Other
+1.4
Market & op. risks
-1.8
Regulation
-3.3
Procyclicality
+5.6
Business actions
-5.4
Business evolution
-0.3
Sep-16
390.9
Group – RWA down Q/Q with business actions and regulation offsetting the impact of models recalibration (procyclicality, mainly in Italy)
Group – Regulatory capital
10
Credit Market
Dec-16
38.5
Sep-16
39.6
Dec-15
41.1
Dec-16
331.2
Sep-16
333.1
Dec-15
333.6
Dec-16
17.4
Sep-16
18.2
Dec-15
15.9
Credit RWA
Operational RWA
Market RWA
q/q, bn
q/q, bn
q/q, bn
Operational
Main drivers of RWA transitional
-0.8
-2.0
-1.0
1 2 3 4 5
- Ukraine disposal -2bn - One-off LLP -1.5bn - Securitizations -1.3bn
Thresholds effect, to reverse after capital increase
Note: Business evolution: changes related to business development; Business actions: initiatives to proactively decrease RWA. Mainly relates loan securitizations, changes in collaterals etc; Procyclicality: recalibration of models / change in macro-economics framework or change in specific client's credit worthiness; Regulation: temporary effects of deductions from CET1 capital related to Financial participations and DTA exceeding the relevant thresholds of 10% / 15%. These effects will reverse upon completion of the capital increase.
(1) Include full consolidation of RWA of Ukraine (for Sep-16), Pekao and Pioneer.
(2) Sep-16 figures consistent with CMD perimeter; Dec-16 based on actual data excluding Pekao and Pioneer RWA.
RWA trans.(1)
RWA CMD(2) 362 361
Group– P&L
P&L, m 3Q16
11
q/q % adj
FY16 adj
FY16 4Q16 4Q16
adj FY16 adj /
FY15 adj %
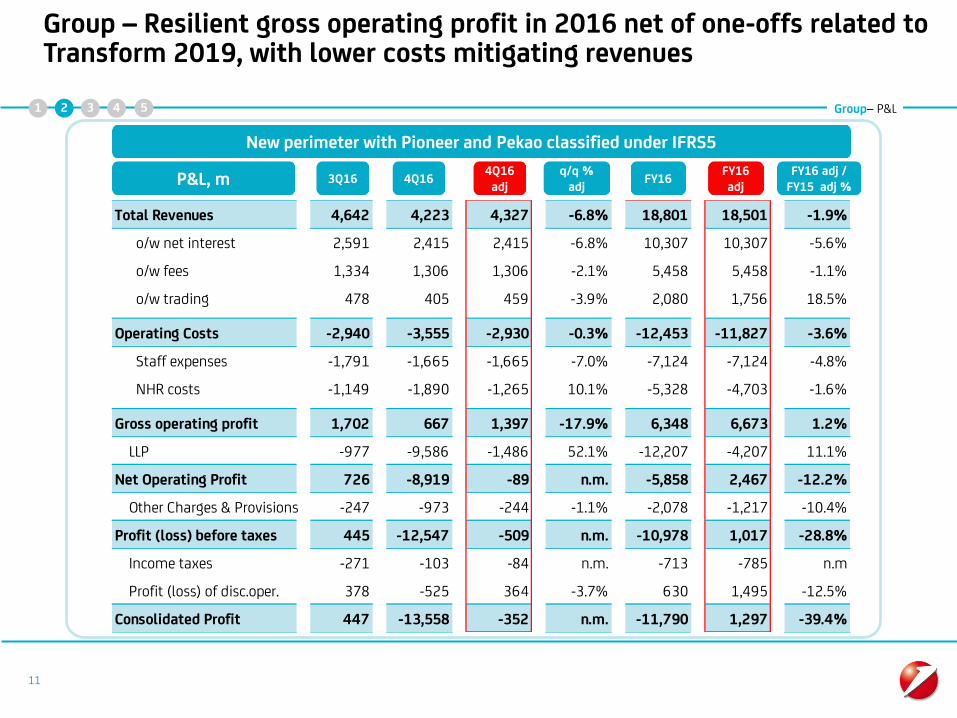
Group – Resilient gross operating profit in 2016 net of one-offs related to Transform 2019, with lower costs mitigating revenues
1 2 3 4 5
Total Revenues 4,642 4,223 4,327 -6.8% 18,801 18,501 -1.9%
o/w net interest 2,591 2,415 2,415 -6.8% 10,307 10,307 -5.6%
o/w fees 1,334 1,306 1,306 -2.1% 5,458 5,458 -1.1%
o/w trading 478 405 459 -3.9% 2,080 1,756 18.5%
Operating Costs -2,940 -3,555 -2,930 -0.3% -12,453 -11,827 -3.6%
Staff expenses -1,791 -1,665 -1,665 -7.0% -7,124 -7,124 -4.8%
NHR costs -1,149 -1,890 -1,265 10.1% -5,328 -4,703 -1.6%
Gross operating profit 1,702 667 1,397 -17.9% 6,348 6,673 1.2%
LLP -977 -9,586 -1,486 52.1% -12,207 -4,207 11.1%
Net Operating Profit 726 -8,919 -89 n.m. -5,858 2,467 -12.2%
Other Charges & Provisions -247 -973 -244 -1.1% -2,078 -1,217 -10.4%
Profit (loss) before taxes 445 -12,547 -509 n.m. -10,978 1,017 -28.8%
Income taxes -271 -103 -84 n.m. -713 -785 n.m
Profit (loss) of disc.oper. 378 -525 364 -3.7% 630 1,495 -12.5%
Consolidated Profit 447 -13,558 -352 n.m. -11,790 1,297 -39.4%
New perimeter with Pioneer and Pekao classified under IFRS5

Group - Positive loan volume, deposit repricing and lower term funding costs mitigating the impact of negative items in CBK Italy
Group– Net interest
Net interest(1) bridge q/q, m
Commercial dynamics: +7m
(1) Contribution from macro hedging strategy on non naturally hedged sight deposits in 4Q16 at 391m, 395m in 3Q16 and 369m in 4Q15.
(2) Rate effects including mix effect of loans and deposits.
(3) NII affected by charges previously booked as non operating items for c. 100m. 12
1 2 3 4 5
4Q16 stated
2,415
FY16 items (3)
-102
4Q16 baseline
2,517
Other
-30
Invest. ptf & treasury
-59
Term funding
+33
Deposits rate(2)
+26
Loans rate(2)
-79
-3.2%
-5
Loans volume
+32
3Q16 baseline
Deposits volume
FX effects
+8
3Q16
2,591 2,599
Average Euribor 3M
-0.31%
(-1bp q/q)

13 4. RateAna
Group - Investment and transactional fees increased in 4Q16, mitigating lower financing services (large tickets in CIB in 3Q16 and Non Core fees)
352330
370402420487
573573563
553
Transactional fees
Financing fees
Investment fees
4Q16 stated
1,306
363
Securitization expenses
-6
Outsourced workout costs
-26
Baseline 4Q16
1,338
363
Financing fees
-18
Transactional
+11
Investment
+10
3Q16
1,334
4Q15
1,370
+0.3%
Fees and commission bridge in 4Q16, m
Group– Fees & Commission
Fees paid to DoBank for workout activities
1 2 3 4 5
1,578 1,529Fees excluding IFRS5 effects(1) 1,530
(1) Managerial data excluding the effect of Pioneer classified under IFRS5 and representing a perimeter consistent with CMD.

Group –Trading benefitting from positive one-offs in 2016. Dividends increased in 2016, with higher contribution from Turkey.
Dividends(1), m Trading income, m
1,485
405478261
2,080
+40.0%
-15.2%
+55.0%
FY16 FY15 4Q16 3Q16 4Q15
34911887
472
102129
378
58
465
90
+2.7%
-21.8%
-40.3%
FY16
844
FY15
822
4Q16
148
3Q16
189
4Q15
248
(1) Figures include dividends and equity investments. Turkey contribution based on a divisional view. Balance of other operating income/ expenses equal to -51m in 4Q16 (-100m Q/Q).
(2) Mainly related to Visa Europe and one-off trading gain booked in 2Q16.
Turkey
Other revenues
Group– P&L
14
o.w. 0.3bn one-offs(2)
o.w. 0.14bn value adj.
1 2 3 4 5
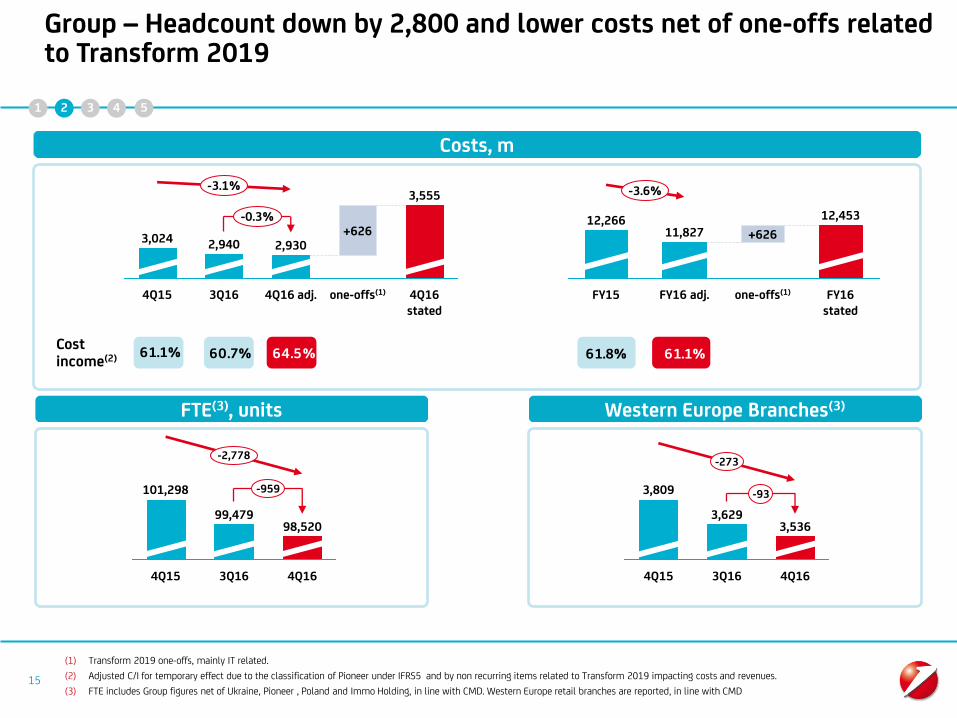
Group – Headcount down by 2,800 and lower costs net of one-offs related to Transform 2019
(1) Transform 2019 one-offs, mainly IT related.
(2) Adjusted C/I for temporary effect due to the classification of Pioneer under IFRS5 and by non recurring items related to Transform 2019 impacting costs and revenues.
(3) FTE includes Group figures net of Ukraine, Pioneer , Poland and Immo Holding, in line with CMD. Western Europe retail branches are reported, in line with CMD
Costs, m
15
1 2 3 4 5
Cost income(2)
FTE(3), units
-2,778
-959
4Q16
98,520
3Q16
99,479
4Q15
101,298
4Q16 stated
+626
4Q16 adj.
2,930
one-offs(1)
3,024
3Q16
2,940
4Q15
-3.1%
-0.3%
3,555
one-offs(1)
-3.6%
FY16 stated
FY16 adj.
11,827
12,453
FY15
12,266 +626
Western Europe Branches(3)
3,536
4Q16
-93
3Q16
3,629
-273
3,809
4Q15
61.1% 60.7% 64.5% 61.8% 61.1%
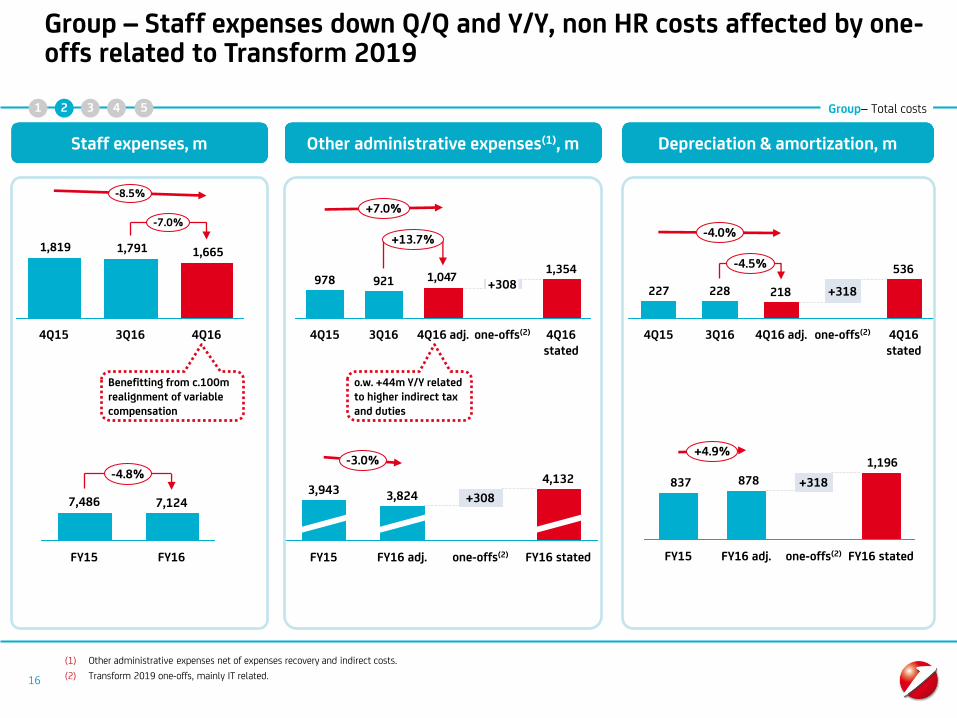
Group – Staff expenses down Q/Q and Y/Y, non HR costs affected by one-offs related to Transform 2019
Group– Total costs
(1) Other administrative expenses net of expenses recovery and indirect costs.
(2) Transform 2019 one-offs, mainly IT related.
Staff expenses, m
16
1 2 3 4 5
Other administrative expenses(1), m Depreciation & amortization, m
1,6651,7911,819
-8.5%
-7.0%
4Q16 3Q16 4Q15
-4.8%
FY16
7,124
FY15
7,486
1,3541,047921978
+13.7%
+7.0%
4Q16 stated
one-offs(2)
+308
4Q16 adj. 3Q16 4Q15
4,132
one-offs(2) FY16 stated
-3.0%
+308
FY16 adj.
3,824
FY15
3,943
536
218228227 +318
4Q16 adj. one-offs(2) 3Q16 4Q15
-4.0%
4Q16 stated
-4.5%
1,196
878837
+4.9%
FY16 stated
+318
FY16 adj. FY15 one-offs(2)
Benefitting from c.100m realignment of variable compensation
o.w. +44m Y/Y related to higher indirect tax and duties
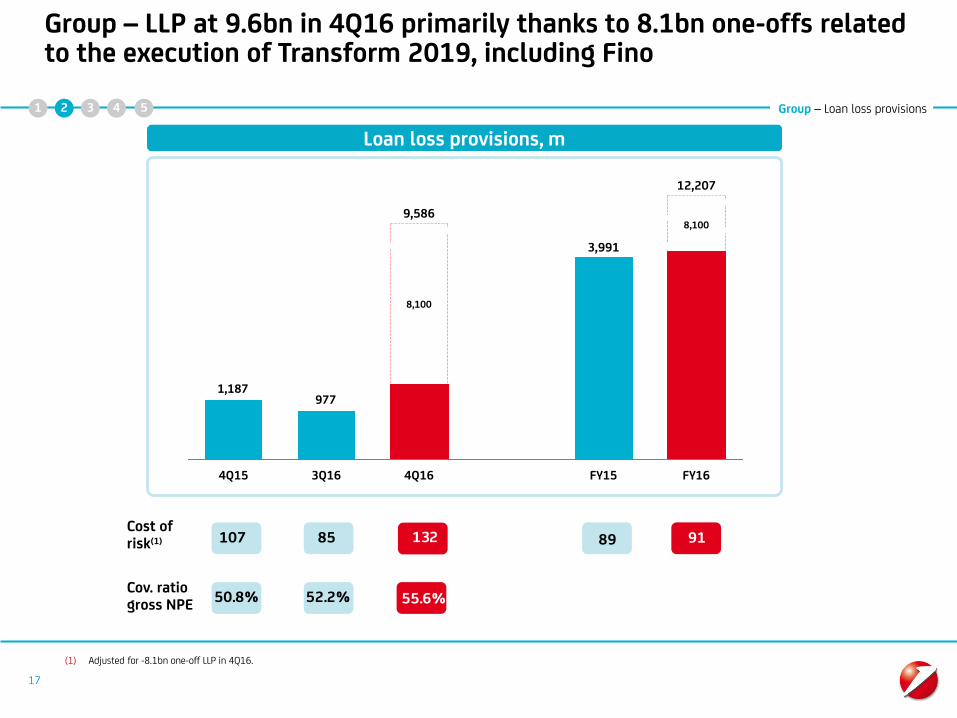
Group – LLP at 9.6bn in 4Q16 primarily thanks to 8.1bn one-offs related to the execution of Transform 2019, including Fino
Group – Loan loss provisions
Loan loss provisions, m
9771,187
FY16
12,207
8,100
FY15
3,991
4Q16
9,586
8,100
3Q16 4Q15
17
Cost of risk(1)
Cov. ratio gross NPE 50.8% 52.2% 55.6%
(1) Adjusted for -8.1bn one-off LLP in 4Q16.
1 2 3 4 5
107 85 132 89 91
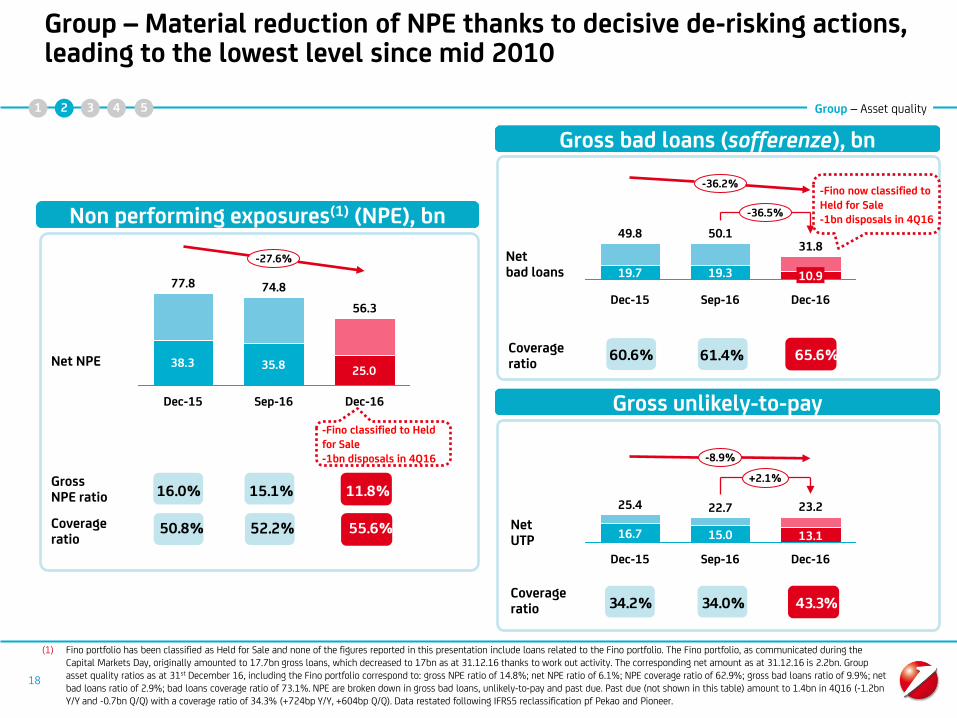
Group – Material reduction of NPE thanks to decisive de-risking actions, leading to the lowest level since mid 2010
Group – Asset quality
Non performing exposures(1) (NPE), bn
Gross bad loans (sofferenze), bn
38.325.035.8
-27.6%
56.3
Dec-16
77.8
Sep-16 Dec-15
74.8
31.8
19.3
Dec-15 Sep-16
50.1
19.7
-36.2%
10.9
49.8
-36.5%
Dec-16
Coverage ratio
Gross unlikely-to-pay
13.1
Sep-16
+2.1%
15.0
-8.9%
Dec-16
22.7
Dec-15
23.2
16.7
25.4
Coverage ratio
Net UTP
(1) Fino portfolio has been classified as Held for Sale and none of the figures reported in this presentation include loans related to the Fino portfolio. The Fino portfolio, as communicated during the Capital Markets Day, originally amounted to 17.7bn gross loans, which decreased to 17bn as at 31.12.16 thanks to work out activity. The corresponding net amount as at 31.12.16 is 2.2bn. Group asset quality ratios as at 31st December 16, including the Fino portfolio correspond to: gross NPE ratio of 14.8%; net NPE ratio of 6.1%; NPE coverage ratio of 62.9%; gross bad loans ratio of 9.9%; net bad loans ratio of 2.9%; bad loans coverage ratio of 73.1%. NPE are broken down in gross bad loans, unlikely-to-pay and past due. Past due (not shown in this table) amount to 1.4bn in 4Q16 (-1.2bn Y/Y and -0.7bn Q/Q) with a coverage ratio of 34.3% (+724bp Y/Y, +604bp Q/Q). Data restated following IFRS5 reclassification pf Pekao and Pioneer.
Gross NPE ratio
Net bad loans
Net NPE
1 2 3 4
18
Coverage ratio
52.2%
61.4%
34.0%
11.8%15.1%16.0%
55.6%50.8%
60.6% 65.6%
34.2% 43.3%
5
-Fino classified to Held for Sale -1bn disposals in 4Q16
-Fino now classified to Held for Sale -1bn disposals in 4Q16
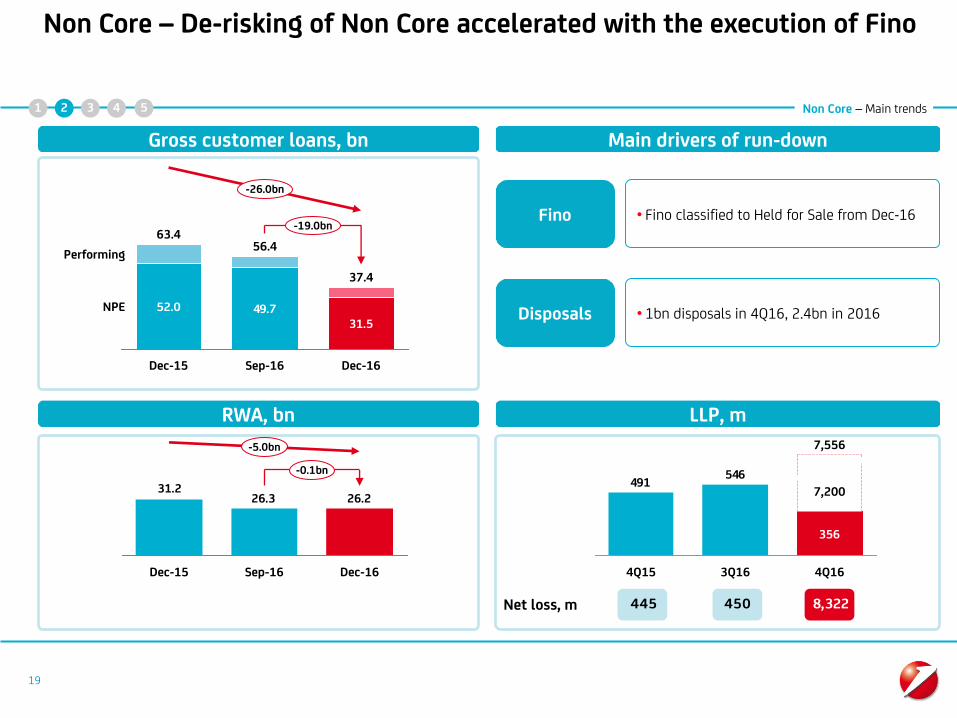
Non Core – De-risking of Non Core accelerated with the execution of Fino
Non Core – Main trends
Gross customer loans, bn Main drivers of run-down
52.0 49.731.5
-19.0bn
-26.0bn
NPE
Performing
Dec-16
37.4
Sep-16
56.4
Dec-15
63.4
RWA, bn LLP, m
26.226.331.2
-0.1bn
-5.0bn
Dec-16 Sep-16 Dec-15
• Fino classified to Held for Sale from Dec-16 Fino
546491
356
4Q16
7,556
3Q16 4Q15
7,200
Net loss, m
19
450445 8,322
1 2 3 4
• 1bn disposals in 4Q16, 2.4bn in 2016 Disposals
5
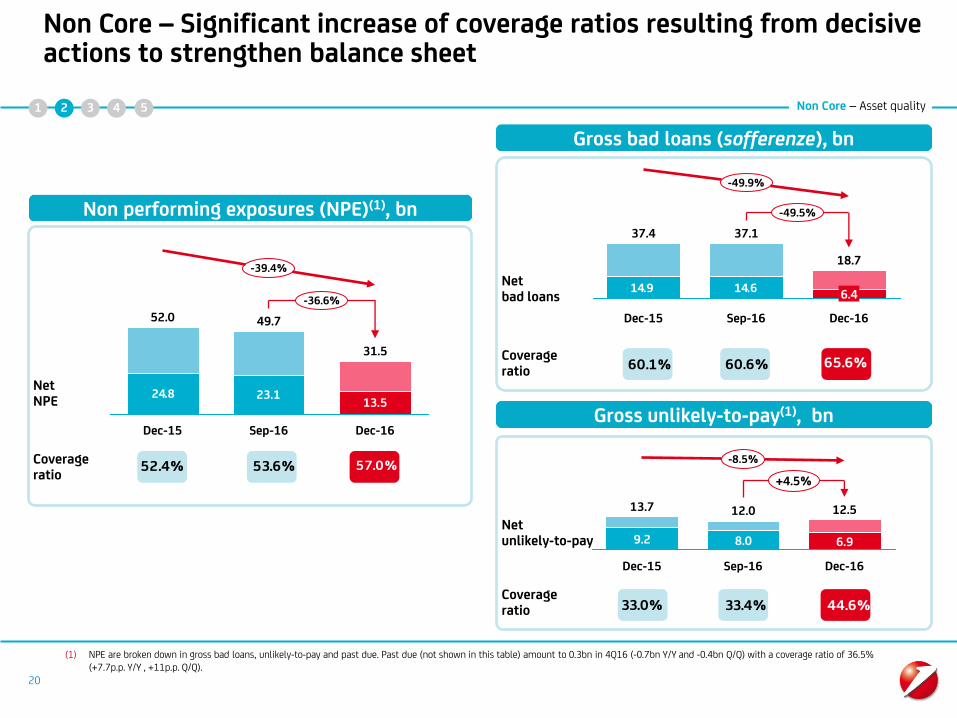
Non Core – Significant increase of coverage ratios resulting from decisive actions to strengthen balance sheet
Non performing exposures (NPE)(1), bn
Gross bad loans (sofferenze), bn
24.8 23.113.5
-36.6%
-39.4%
Dec-16
31.5
Sep-16
49.7
Dec-15
52.0
Net NPE
Coverage ratio
Gross unlikely-to-pay(1), bn
14.614.9
-49.5%
-49.9%
Dec-16
18.7
6.4
Sep-16
37.1
Dec-15
37.4
Coverage ratio
Net bad loans
-8.5%
Dec-16
12.5
6.9
Sep-16
12.0
8.0
Dec-15
13.7
9.2
+4.5%
Coverage ratio
(1) NPE are broken down in gross bad loans, unlikely-to-pay and past due. Past due (not shown in this table) amount to 0.3bn in 4Q16 (-0.7bn Y/Y and -0.4bn Q/Q) with a coverage ratio of 36.5% (+7.7p.p. Y/Y , +11p.p. Q/Q).
20
53.6%
60.6%
33.4%
Net unlikely-to-pay
52.4% 57.0%
60.1% 65.6%
33.0% 44.6%
1 2 3 4 Non Core – Asset quality 5

Transform 2019 Update Group/ Non Core Concluding remarks
Annex Financials
1
2
3
Agenda
4
21
5

Concluding remarks
Concluding remarks Transform 2019 up and running
22
Asset quality trends continue to improve, confirming the sound fundamentals of UniCredit's franchise
CET1 ratio fully loaded at 11.15% after the ongoing capital increase
Resilient gross operating profit in 2016 excluding one-offs, with lower costs offsetting revenues
1 2 3 4 5
Fully underwritten capital increase already launched and to be settled before March 10th 2017

Agenda
23
Transform 2019 Update Group/ Non Core Concluding remarks
Annex Financials
1
2
3
4
5

17.1 14.6 -2.5 -1.9
8.6 7.9 -0.8 -0.8
5.7 4.2 -1.6 -1.0 -0.6
-9.8 -8.9 0.9 0.9
-2.7 -2.6 0.1 0.1
-2.8 -2.4 0.4 0.4
0.0 1.2 1.1 0.5 +0.6
1.8 1.8 - -
24
Group – Perimeter change due to Pioneer and Pekao reclassified under IFRS5. Intercompanies temporarily affect fees, until Pioneer disposal is fully effective
9M2016, bn Actual Post
IFRS5
Revenues
Costs
Fees
Actual Ante IFRS5(1) DELTA
LLP
Profit from disc. op.
Net Profit
o.w. Pioneer & Pekao
Net interest
Other
Following the reclassification of Pioneer under IFRS5, the intercompany elision of fees paid by Pioneer to the Network is split in two lines: - the negative portion is booked under 'fees' - the positive portion is booked 'discontinued operations' After the closing of Pioneer disposal, its contribution from 'discontinued operations' will cease to exist, as well as the negative impact on ‘fees’
1 2 3 4 5 Annex - Group
(1) IFRS5 accounting principle condensates the results from assets under disposal in the Income Statement line "Profit from non current asset held for sale, after tax".
o.w. I/C IFRS5

25
Group - 2015 - 2016 One-offs(1)
2015 2016
1Q
2Q
3Q
4Q
Post tax
DTA fee
Ukraine one-off
Tax one-off
DBO Austria
Restructuring costs
DTA fee
DTA fee
Ukraine impairment
CHF conversion in Croatia
DTA fee
1 2 3 4 Annex - Group 5
Post tax
1Q
2Q
3Q
4Q
BTP trading gain
LLP release
Restructuring cost
DBO Austria
DTA fee
-
"Transform 2019" one-offs (see next slide for details)
+22m
-78m
-116m
-276m
FY FY
-0.2bn
+0.3bn
-13.2bn
Visa Europe gain
Bank rescue Italy & Poland
-448m -13.1bn
(1) Items to be excluded from stated figures.
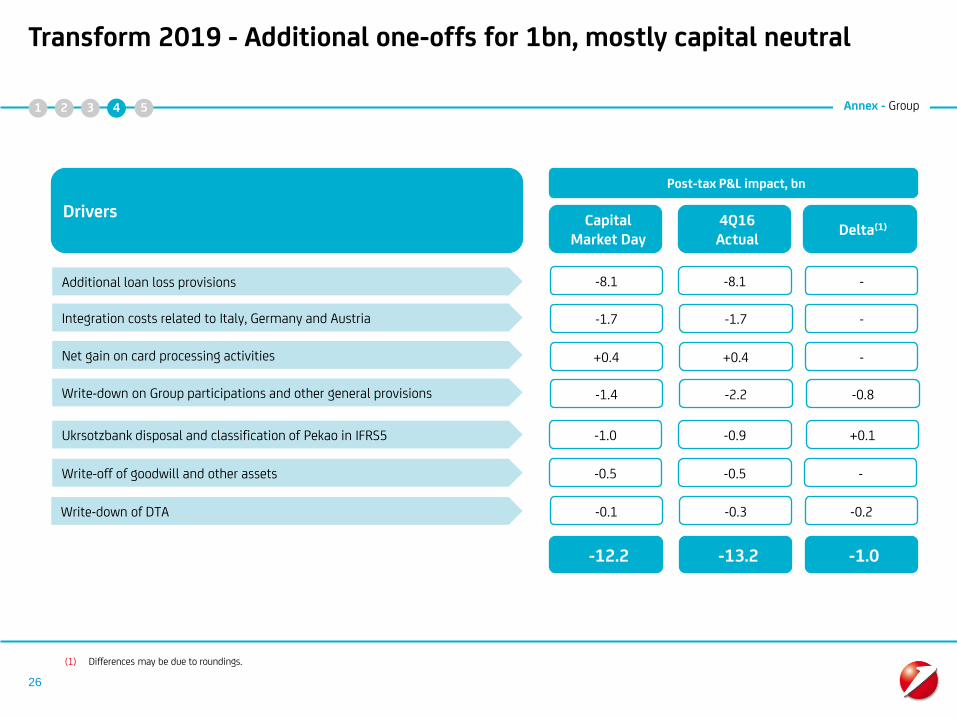
Integration costs related to Italy, Germany and Austria -1.7
Additional loan loss provisions -8.1
Net gain on card processing activities +0.4
Drivers
Post-tax P&L impact, bn
-0.9
Write-down on Group participations and other general provisions -2.2
-0.5
26
-1.7
-8.1
+0.4
-1.0
-1.4
-0.5
Capital Market Day
4Q16 Actual
-0.3 -0.1
-12.2 -13.2
Transform 2019 - Additional one-offs for 1bn, mostly capital neutral
Ukrsotzbank disposal and classification of Pekao in IFRS5
Write-off of goodwill and other assets
Write-down of DTA
-
-
-
-
Delta(1)
-0.2
-1.0
+0.1
-0.8
1 2 3 4 Annex - Group 5
(1) Differences may be due to roundings.
+2.7%
+0.6%
+0.3%
+4.7%
+14.6%
+29.0%
+16.1%
-47.0%
-1.5%
-0.1%
+1.1%
+0.5%
+4.9%
+11.8%
-0.3%
-35.7%
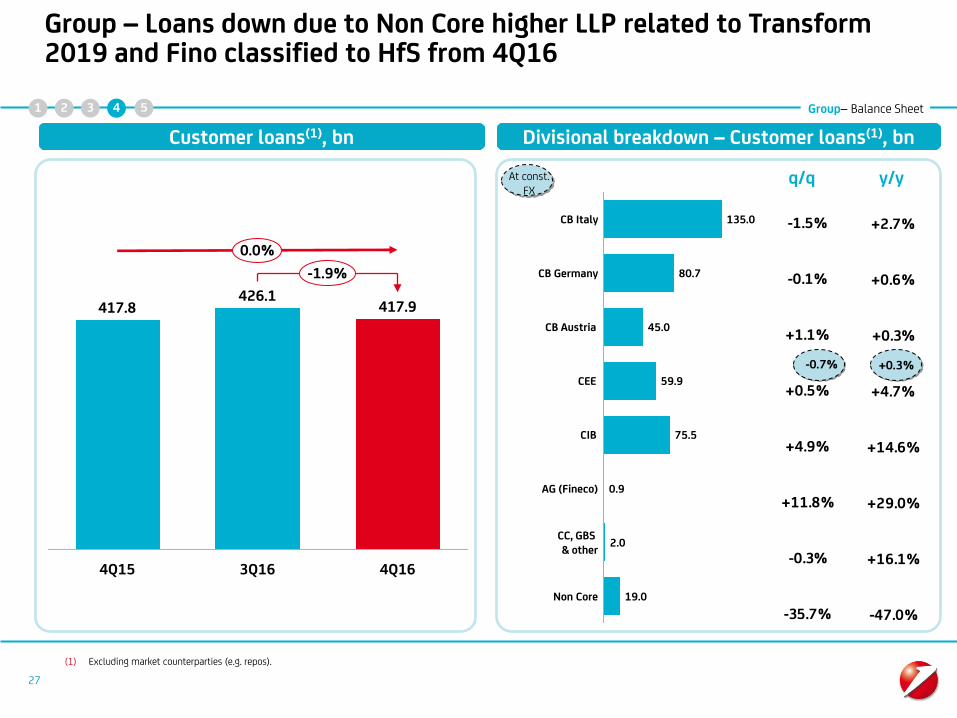
Group – Loans down due to Non Core higher LLP related to Transform 2019 and Fino classified to HfS from 4Q16
Group– Balance Sheet
(1) Excluding market counterparties (e.g. repos).
-1.9%
0.0%
4Q16
417.9
3Q16
426.1
4Q15
417.8
Non Core 19.0
CC, GBS & other
2.0
AG (Fineco) 0.9
CIB 75.5
CEE 59.9
CB Austria 45.0
CB Germany 80.7
CB Italy 135.0
Divisional breakdown – Customer loans(1), bn Customer loans(1), bn
q/q y/y At const. FX
27
-0.7% +0.3%
1 2 3 4 5

+4.5%
-1.0%
-0.5%
+2.9%
+3.2%
+9.1%
+21.4%
-8.3%
+10.3%
+4.9%
+3.1%
+6.8%
+6.0%
+18.9%
+4.0%
-38.9%
Group – Customer deposits increase in 2016, confirming the strength of UniCredit's franchise
Group– Balance Sheet
(1) Excluding market counterparties (e.g. repos).
386.1
369.0
4Q15
396.0
+7.3%
4Q16 3Q16
+2.5%
134.8
CIB
86.6
AG (Fineco) 18.6
1.0 Non Core
59.2 CEE
CB Austria
3.3
47.1
45.5
CC, GBS & other
CB Italy(2)
CB Germany
Divisional breakdown – Customer deposits(1), bn Customer deposits(1), bn
q/q y/y At const. FX
28
+1.3% +1.6%
1 2 3 4 5

Annex – P&L
29
Group – Resilient operating profitability in 2016 net of one-offs related to Transform 2019
1 2 3 4 5
3Q16 4Q16 4Q16 Adj Ch absq/q4Q Adj
Ch % q/qFY15 FY16 FY16 Adj Ch absy/y
FY16 Adj
Ch % vs.
FY15 Adj
Total Revenues 4,642 4,223 4,327 -9.0% -6.8% 18,866 18,801 18,501 -0.3% -1.9%
Net Interest Margin 2,591 2,415 2,415 -6.8% -6.8% 10,922 10,307 10,307 -5.6% -5.6%
Dividends 189 148 148 -21.8% -21.8% 822 844 817 2.7% -0.6%
Net Commissions 1,334 1,306 1,306 -2.1% -2.1% 5,518 5,458 5,458 -1.1% -1.1%
Trading Profit 478 405 459 -15.2% -3.9% 1,485 2,080 1,756 40.0% 18.5%
Balance income 49 -51 -1 n.m n.m 118 112 162 -5.1% 37.1%
Operating Costs -2,940 -3,555 -2,930 20.9% -0.3% -12,266 -12,453 -11,827 1.5% -3.6%
Staff expenses -1,791 -1,665 -1,665 -7.0% -7.0% -7,486 -7,124 -7,124 -4.8% -4.8%
NHR costs -1,149 -1,890 -1,265 64.5% 10.1% -4,780 -5,328 -4,703 11.5% -1.6%
Gross operating profit 1,702 667 1,397 -60.8% -17.9% 6,600 6,348 6,673 -3.8% 1.2%
Net Write Downs on Loans -977 -9,586 -1,486 n.m 52.1% -3,991 -12,207 -4,207 n.m 11.1%
Net Operating Profit 726 -8,919 -89 n.m n.m 2,609 -5,858 2,467 n.m -12.2%
Other Charges & Provisions -247 -973 -244 n.m -1.1% -1,447 -2,078 -1,217 43.6% -10.4%
Integration Costs -26 -1,771 -23 n.m -14.0% -386 -2,132 -53 n.m n.m
POI -8 -885 -154 n.m n.m -27 -910 -179 n.m n.m
Profit (loss) before taxes 445 -12,547 -509 n.m n.m 749 -10,978 1,017 n.m -28.8%
Income taxes -271 -103 -84 -62.2% -69.2% 99 -713 -785 n.m n.m
Profit (loss) of disc.oper. 378 -525 364 n.m -3.7% 1,377 630 1,495 -54.3% -12.5%
PPA -1 -2 -2 n.m n.m -179 -5 -5 -97.1% -97.1%
Minorities interest -103 -120 -120 17.2% 17.2% -352 -464 -424 31.9% 12.9%
Goodwill Impairment -261
Consolidated Profit 447 -13,558 -352 n.m n.m 1,694 -11,790 1,297 n.m -39.4%

Agenda
30
Transform 2019 Update Group Concluding remarks
Annex Financials
1
2
3
4
5

Group – P&L and volumes
1 2 3 4 Financials
31
5
Euro (m) 1Q15 2Q15 3Q15 4Q15 1Q16 2Q16 3Q16 4Q16 ∆ % vs. ∆ % vs. FY15 FY16 ∆ % vs.
3Q16 4Q15 FY15
Total Revenues 4,854 4,817 4,471 4,724 4,674 5,262 4,642 4,223 -9.0% ▼ -10.6% ▼ 18,866 18,801 -0.3% ▼
Operating Costs -3,095 -3,089 -3,057 -3,024 -2,976 -2,982 -2,940 -3,555 +20.9% ▲ +17.6% ▲ -12,266 -12,453 +1.5% ▲
Gross Operating Profit 1,759 1,728 1,414 1,699 1,698 2,280 1,702 667 -60.8% ▼ -60.7% ▼ 6,600 6,348 -3.8% ▼
LLP -948 -881 -975 -1,187 -760 -884 -977 -9,586 n.m. n.m. -3,991 -12,207 n.m.
Profit Before Taxes 567 525 301 -644 288 837 445 -12,547 n.m. n.m. 749 -10,978 n.m.
Net Profit from
discontinued 385 333 457 202 398 379 378 -525 n.m. n.m. 1,377 630 -54.3% ▼
Net Profit 512 522 507 153 406 916 447 -13,558 n.m. n.m. 1,694 -11,790 n.m. ▼
Cost / Income Ratio, % 64% 64% 68% 64% 64% 57% 63% 84% +20.9pp ▲ +20.2pp ▲ 65% 66% +1.2pp ▲
Cost of Risk, bp 84 78 88 107 67 77 85 855 n.m. n.m. 89bp 269bp n.m.
Customer Loans 421,569 421,564 417,780 417,793 421,077 428,459 426,150 417,868 -1.9% +0.0% 417,793 417,868 +0.0%
Customer Deposits 339,018 346,597 357,971 369,045 379,626 380,401 386,139 395,979 +2.5% +7.3% 369,045 395,979 +7.3%
Total RWA 420,637 405,897 400,480 390,599 394,359 399,260 390,901 387,136 -1.0% -0.89% 390,599 387,136 -0.9%
N.B. Loans and deposits excluding repos and intercompany.

Core – P&L and volumes
Financials 1 2 3 4
32
Euro (m) 1Q15 2Q15 3Q15 4Q15 1Q16 2Q16 3Q16 4Q16 ∆ % vs. ∆ % vs. FY15 FY16 ∆ % vs.
3Q16 4Q15 FY15
Total Revenues 4,809 4,799 4,466 4,765 4,685 5,325 4,713 4,354 -7.6% ▼ -8.6% ▼ 18,838 19,077 +1.3% ▲
Operating Costs -3,020 -3,067 -3,007 -2,995 -2,933 -2,962 -2,903 -3,504 +20.7% ▲ +17.0% ▲ -12,088 -12,303 +1.8% ▲
Gross Operating Profit 1,789 1,732 1,458 1,771 1,752 2,363 1,809 850 -53.0% ▼ -52.0% ▼ 6,750 6,774 +0.4% ▲
LLP -543 -564 -515 -695 -418 -483 -431 -2,030 n.m. n.m. -2,317 -3,361 +45.1% ▲
Profit Before Taxes 1,015 895 807 15 714 1,344 1,106 -4,759 n.m. n.m. 2,732 -1,596 n.m. ▼
Net Profit 821 771 848 598 694 1,228 897 -5,237 n.m. n.m. 3,040 -2,418 n.m. ▼
Cost / Income Ratio, % 63% 64% 67% 63% 63% 56% 62% 80% +18.9pp ▲ +17.6pp ▲ +64% +64% +0.3pp ▲
Cost of Risk, bp 54 55 51 68 40 45 40 191 n.m. ▼ n.m. ▲ +57bp +79bp +22bp ▲
Customer Loans 379,326 380,539 380,165 381,991 387,774 397,701 396,650 398,899 +0.6% +4.4% 381,991 398,899 +4.4%
Customer Deposits 337,357 344,973 356,549 367,462 378,295 379,352 385,085 395,012 +2.6% +7.5% 367,462 395,012 +7.5%
Total RWA 384,385 370,873 367,820 359,425 365,114 371,829 364,649 360,938 -1.0% +0.4% 359,425 360,938 +0.4%
5
N.B. Loans and deposits excluding repos and intercompany.
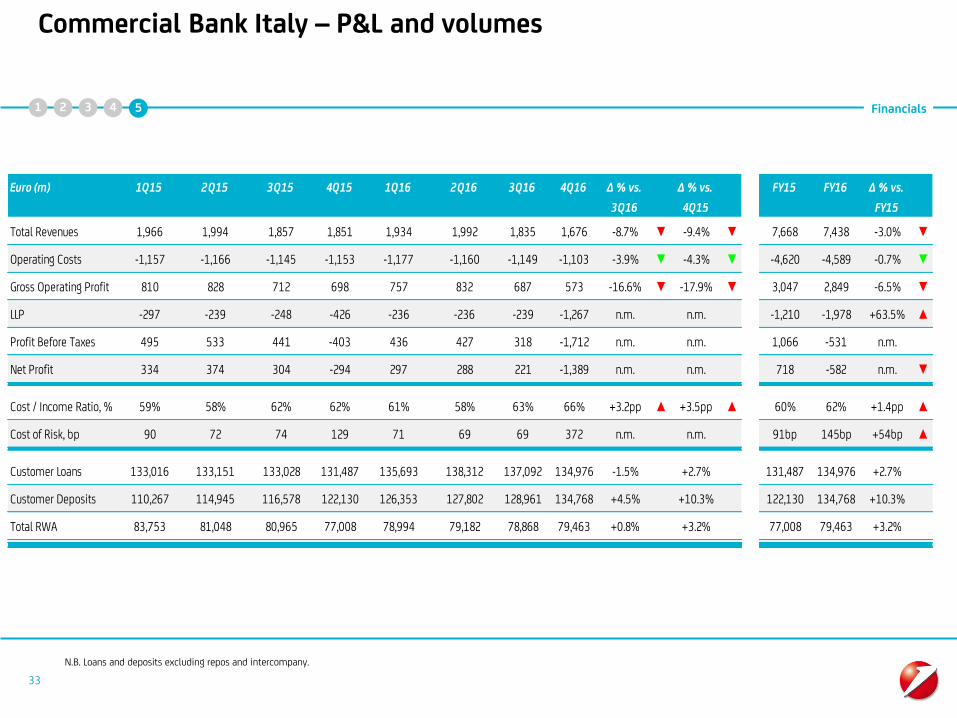
Commercial Bank Italy – P&L and volumes
Financials
33
Euro (m) 1Q15 2Q15 3Q15 4Q15 1Q16 2Q16 3Q16 4Q16 ∆ % vs. ∆ % vs. FY15 FY16 ∆ % vs.
3Q16 4Q15 FY15
Total Revenues 1,966 1,994 1,857 1,851 1,934 1,992 1,835 1,676 -8.7% ▼ -9.4% ▼ 7,668 7,438 -3.0% ▼
Operating Costs -1,157 -1,166 -1,145 -1,153 -1,177 -1,160 -1,149 -1,103 -3.9% ▼ -4.3% ▼ -4,620 -4,589 -0.7% ▼
Gross Operating Profit 810 828 712 698 757 832 687 573 -16.6% ▼ -17.9% ▼ 3,047 2,849 -6.5% ▼
LLP -297 -239 -248 -426 -236 -236 -239 -1,267 n.m. n.m. -1,210 -1,978 +63.5% ▲
Profit Before Taxes 495 533 441 -403 436 427 318 -1,712 n.m. n.m. 1,066 -531 n.m.
Net Profit 334 374 304 -294 297 288 221 -1,389 n.m. n.m. 718 -582 n.m. ▼
Cost / Income Ratio, % 59% 58% 62% 62% 61% 58% 63% 66% +3.2pp ▲ +3.5pp ▲ 60% 62% +1.4pp ▲
Cost of Risk, bp 90 72 74 129 71 69 69 372 n.m. n.m. 91bp 145bp +54bp ▲.-
Customer Loans 133,016 133,151 133,028 131,487 135,693 138,312 137,092 134,976 -1.5% +2.7% 131,487 134,976 +2.7%
Customer Deposits 110,267 114,945 116,578 122,130 126,353 127,802 128,961 134,768 +4.5% +10.3% 122,130 134,768 +10.3%
Total RWA 83,753 81,048 80,965 77,008 78,994 79,182 78,868 79,463 +0.8% +3.2% 77,008 79,463 +3.2%
1 2 3 4 5
N.B. Loans and deposits excluding repos and intercompany.
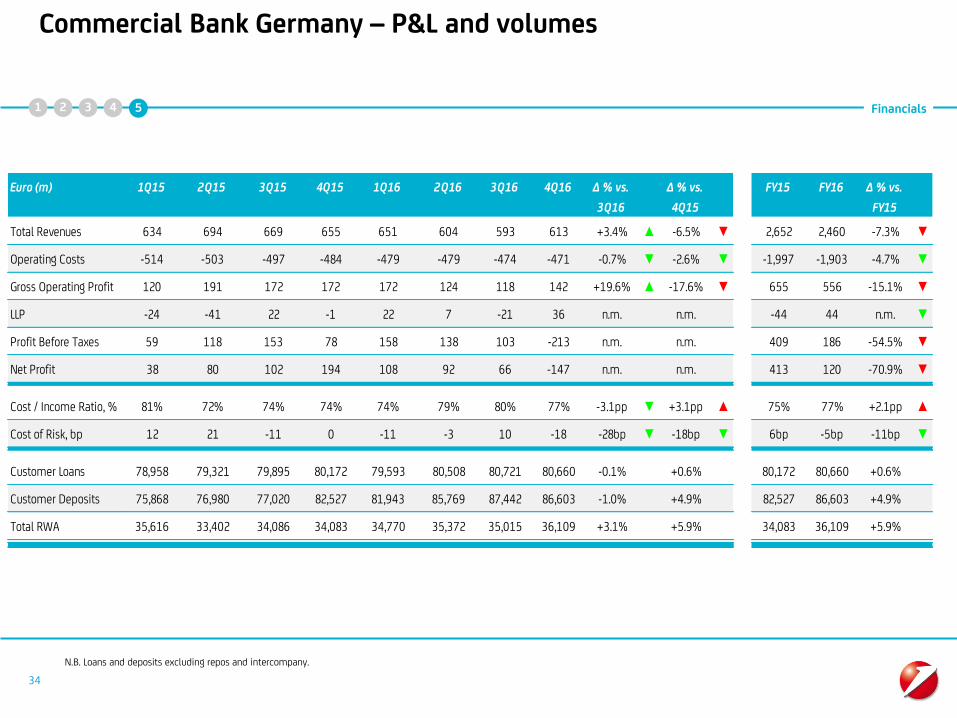
Commercial Bank Germany – P&L and volumes
Financials 1 2 3 4
34
Euro (m) 1Q15 2Q15 3Q15 4Q15 1Q16 2Q16 3Q16 4Q16 ∆ % vs. ∆ % vs. FY15 FY16 ∆ % vs.
3Q16 4Q15 FY15
Total Revenues 634 694 669 655 651 604 593 613 +3.4% ▲ -6.5% ▼ 2,652 2,460 -7.3% ▼
Operating Costs -514 -503 -497 -484 -479 -479 -474 -471 -0.7% ▼ -2.6% ▼ -1,997 -1,903 -4.7% ▼
Gross Operating Profit 120 191 172 172 172 124 118 142 +19.6% ▲ -17.6% ▼ 655 556 -15.1% ▼
LLP -24 -41 22 -1 22 7 -21 36 n.m. n.m. -44 44 n.m. ▼
Profit Before Taxes 59 118 153 78 158 138 103 -213 n.m. n.m. 409 186 -54.5% ▼
Net Profit 38 80 102 194 108 92 66 -147 n.m. n.m. 413 120 -70.9% ▼
Cost / Income Ratio, % 81% 72% 74% 74% 74% 79% 80% 77% -3.1pp ▼ +3.1pp ▲ 75% 77% +2.1pp ▲
Cost of Risk, bp 12 21 -11 0 -11 -3 10 -18 -28bp ▼ -18bp ▼ 6bp -5bp -11bp ▼
Customer Loans 78,958 79,321 79,895 80,172 79,593 80,508 80,721 80,660 -0.1% +0.6% 80,172 80,660 +0.6%
Customer Deposits 75,868 76,980 77,020 82,527 81,943 85,769 87,442 86,603 -1.0% +4.9% 82,527 86,603 +4.9%
Total RWA 35,616 33,402 34,086 34,083 34,770 35,372 35,015 36,109 +3.1% +5.9% 34,083 36,109 +5.9%
5
N.B. Loans and deposits excluding repos and intercompany.

Commercial Bank Austria – P&L and volumes
Financials
35
\Euro (m) 1Q15 2Q15 3Q15 4Q15 1Q16 2Q16 3Q16 4Q16 ∆ % vs. ∆ % vs. FY15 FY16 ∆ % vs.
3Q16 4Q15 FY15
Total Revenues 422 395 397 455 377 442 408 397 -2.7% ▼ -12.7% ▼ 1,669 1,624 -2.7% ▼
Operating Costs -337 -337 -327 -332 -313 -319 -295 -309 +4.7% ▲ -7.0% ▼ -1,332 -1,235 -7.3% ▼
Gross Operating Profit 86 57 70 123 65 123 113 88 -21.9% ▼ -28.2% ▼ 336 389 +15.7% ▲
LLP -27 31 -7 -9 -4 10 21 -60 n.m. ▲ n.m. ▲ -12 -32 n.m. ▲
Profit Before Taxes 19 54 -7 365 -208 108 97 -345 n.m. ▼ n.m. ▼ 431 -348 n.m. ▼
Net Profit 37 73 32 550 -209 86 95 -367 n.m. ▼ n.m. ▼ 692 -395 n.m. ▼
Cost / Income Ratio, % 80% 85% 82% 73% 83% 72% 72% 78% +5.5pp ▲ +4.8pp ▲ 80% 76% -3.8pp ▼
Cost of Risk, bp 22 -26 6 8 3 -9 -17 49 +67bp ▲ +42bp ▲ 3bp 7bp +4bp ▲
Customer Loans 45,465 44,239 44,008 44,867 44,708 44,383 44,512 44,984 +1.1% +0.3% 44,867 44,984 +0.3%
Customer Deposits 46,895 46,890 47,093 45,664 47,251 47,060 47,322 47,096 -0.5% +3.1% 45,664 47,096 +3.1%
Total RWA 27,535 26,550 25,451 24,969 24,735 23,685 23,536 23,675 +0.6% -5.2% 24,969 23,675 -5.2%
1 2 3 4 5
N.B. Loans and deposits excluding repos and intercompany.

CIB – P&L and volumes
Financials
36
Euro (m) 1Q15 2Q15 3Q15 4Q15 1Q16 2Q16 3Q16 4Q16 ∆ % vs. ∆ % vs. FY15 FY16 ∆ % vs.
3Q16 4Q15 FY15
Total Revenues 1,120 1,060 866 928 1,080 1,129 1,068 974 -8.8% ▼ +5.0% ▲ 3,974 4,252 +7.0% ▲
Operating Costs -448 -462 -438 -424 -424 -438 -435 -426 -2.0% ▼ +0.5% ▲ -1,772 -1,723 -2.7% ▼
Gross Operating Profit 672 599 428 504 656 691 634 548 -13.5% ▼ +8.8% ▲ 2,202 2,529 +14.8% ▲
LLP -17 -95 78 19 -54 -74 -29 -437 n.m. ▲ n.m. ▲ -16 -595 n.m. ▲
Profit Before Taxes 583 440 496 359 458 570 579 -261 n.m. ▼ n.m. ▼ 1,879 1,346 -28.3% ▼
Net Profit 407 296 336 336 312 374 381 110 -71.2% ▼ -67.3% ▼ 1,374 1,176 -14.4% ▼
Cost / Income Ratio, % 40% 44% 51% 46% 39% 39% 41% 44% +3.0pp ▲ -2.0pp ▼ 45% 41% -4.1pp ▼
Cost of Risk, bp 7 41 -34 -8 21 28 11 168 n.m. ▲ n.m. ▲ 2bp 57bp +55bp ▲
Customer Loans 61,654 62,333 62,865 65,850 67,541 72,922 71,922 75,463 +4.9% +14.6% 65,850 75,463 +14.6%
Customer Deposits 36,831 36,746 43,685 42,939 45,168 42,515 44,090 45,501 +3.2% +6.0% 42,939 45,501 +6.0%
Total RWA 77,960 73,206 73,601 70,754 72,923 80,082 74,370 74,733 +0.5% +5.6% 70,754 74,733 +5.6%
1 2 3 4 5
N.B. Loans and deposits excluding repos and intercompany.

CEE division – P&L and volumes
Financials
37
Euro (m) 1Q15 2Q15 3Q15 4Q15 1Q16 2Q16 3Q16 4Q16 ∆ % vs. ∆ % vs. FY15 FY16 ∆ % vs.
3Q16 4Q15 FY15
Total Revenues 975 1,044 946 1,045 941 1,168 1,055 999 -6.2% ▼ -5.3% ▼ 4,010 4,162 +6.3% ▲
Operating Costs -353 -375 -362 -402 -361 -379 -383 -371 -3.8% ▼ -8.5% ▼ -1,491 -1,495 +1.4% ▲
Gross Operating Profit 623 669 584 643 579 788 672 627 -7.5% ▼ -3.3% ▼ 2,519 2,667 +9.1% ▲
LLP -175 -220 -360 -261 -139 -187 -151 -313 +105.8% ▲ +19.1% ▲ -1,016 -791 -20.5% ▼
Profit Before Taxes 387 416 194 322 372 568 502 268 -46.2% ▼ -16.9% ▼ 1,319 1,709 +34.2% ▲
Net Profit 242 211 180 90 315 458 436 199 -50.1% ▼ +104.5% ▲ 723 1,408 +104.7% ▲
Cost / Income Ratio, % 36% 36% 38% 38% 38% 32% 36% 37% +4pp ▲ -1.9pp ▼ 37% 36% -1.3pp ▼
Cost of Risk, bp 120 148 246 181 96 128 102 209 -26bp -144bp 174 134 -40bp ▼
Customer Loans 57,788 58,910 57,802 57,151 57,721 58,919 59,541 59,865 -0.7% +0.3% 57,151 59,865 +0.3%
Customer Deposits 50,581 52,550 54,248 55,405 57,874 56,524 57,522 59,175 +1.3% +1.6% 55,405 59,175 +1.6%
Total RWA 94,002 94,014 93,213 92,859 92,452 94,277 93,421 91,210 -0.9% -0.6% 92,859 91,210 -0.6%.
1 2 3 4 5
N.B. Loans and deposits excluding repos and intercompany.
N.B. Percentage variations at constant FX.

Asset gathering (Fineco) – P&L and volumes
Financials
38
Euro (m) 1Q15 2Q15 3Q15 4Q15 1Q16 2Q16 3Q16 4Q16 ∆ % vs. ∆ % vs. FY15 FY16 ∆ % vs.
3Q16 4Q15 FY15
Total Revenues 136 131 140 137 140 149 132 138 +5.0% ▲ +1.1% ▲ 543 558 +2.7% ▲
Operating Costs -60 -60 -54 -59 -60 -58 -53 -55 +3.7% ▲ -6.2% ▼ -233 -226 -2.6% ▼
Gross Operating Profit 77 71 85 78 80 91 78 83 +5.9% ▲ +6.7% ▲ 311 332 +6.7% ▲
LLP -1.58 -1.11 -1.44 -2.58 -1.44 -1.36 -0.72 -0.68 -5.8% ▼ -73.7% ▼ -6.71 -4.20 -37.4% ▼
Profit Before Taxes 72 69 83 63 77 89 66 74 +11.7% ▲ +16.5% ▲ 287 305 +6.3% ▲
Net Profit 31 30 36 28 33 43 25 17 -30.4% ▼ -38.1% ▼ 125 118 -5.0% ▼
Cost / Income Ratio, % 44% 46% 39% 43% 43% 39% 41% 40% -0.5pp ▼ -3.1pp ▼ 43% 41% -2.2pp ▼
Cost of Risk, bp 85 54 67 114 66 64 31 27 -4bp ▼ -87bp ▼ 81bp 46bp -35bp ▼
Customer Loans 587 637 645 706 701 781 815 910 +11.8% +29.0% 706 910 +29.0%
Customer Deposits 14,304 14,982 14,811 15,623 16,513 16,981 17,029 18,570 +9.1% +18.9% 15,623 18,570 +18.9%
Total RWA 1,813 1,800 1,781 1,804 1,838 1,805 1,778 1,890 +6.3% +4.8% 1,804 1,890 +4.8%
1 2 3 4 5
N.B. Loans and deposits excluding repos and intercompany.

Non Core – P&L and volumes
Financials
39
Euro (m) 1Q15 2Q15 3Q15 4Q15 1Q16 2Q16 3Q16 4Q16 ∆ % vs. ∆ % vs. FY15 FY16 ∆ % vs.
3Q16 4Q15 FY15
Total Revenues 46 18 5 -42 -11 -62 -71 -132 +85.5% ▼ n.m. ▼ 28 -276 n.m. ▼
Operating Costs -75 -23 -50 -30 -42 -20 -36 -51 +41.3% ▲ +71.8% ▲ -177 -150 -15.6% ▼
Gross Operating Profit -29 -5 -44 -71 -53 -83 -107 -182 +70.6% ▼ n.m. ▼ -150 -426 n.m. ▼
LLP -405 -317 -460 -491 -342 -401 -546 -7,556 n.m. n.m. -1,674 -8,845 n.m. ▼
Profit Before Taxes -448 -370 -506 -659 -426 -506 -661 -7,789 n.m. n.m. -1,983 -9,382 n.m. ▼
Net Loss -309 -249 -341 -445 -288 -312 -450 -8,322 n.m. n.m. -1,345 -9,372 n.m. ▼
Cost / Income Ratio, % n.m. n.m. n.m. n.m. n.m. n.m. n.m. n.m. n.a. n.a. n.m. n.m. n.a.
Cost of Risk, bp 361 304 468 535 396 500 725 12,417 n.m. n.m. 412bp n.m. n.m ▲
Customer Loans 42,244 41,025 37,615 35,802 33,304 30,757 29,500 18,969 -35.7% -47.0% 35,802 18,969 -47.0%
Customer Deposits 1,661 1,624 1,422 1,584 1,331 1,049 1,054 967 -8.3% -38.9% 1,584 967 -38.9%
Total RWA 36,252 35,024 32,660 31,174 29,245 27,431 26,252 26,198 -0.2% -16.0% 31,174 26,198 -16.0%
1 2 3 4 5
N.B. Loans and deposits excluding repos and intercompany.

Corporate Center & Other – P&L and volumes
Financials
40
1 2 3 4 5
N.B. Loans and deposits excluding repos and intercompany.
Euro (m) 1Q15 2Q15 3Q15 4Q15 1Q16 2Q16 3Q16 4Q16 ∆ % vs. ∆ % vs. FY15 FY16 ∆ % vs.
3Q16 4Q15 FY15
Total Revenues -446 -519 -409 -305 -437 -159 -378 -443 +17.1% ▼ +45.2% ▼ -1,679 -1,417 -15.6% ▲
Operating Costs -152 -165 -184 -142 -120 -128 -114 -769 n.m. ▲ n.m. ▲ -643 -1,131 +75.9% ▲
Gross Operating Profit -598 -683 -593 -447 -557 -287 -493 -1,211 n.m. ▼ n.m. ▼ -2,321 -2,548 +9.8% ▼
LLP 0 1 1 -14 -6 -1 -11 12 n.m. ▼ n.m. ▼ -13 -5 -57.5% ▼
Profit Before Taxes -601 -736 -554 -769 -579 -556 -560 -2,568 n.m. ▼ n.m. ▼ -2,659 -4,263 +60.3% ▼
Net Profit -267 -293 -141 -305 -163 -114 -328 -3,660 n.m. ▼ n.m. ▼ -1,006 -4,265 n.m. ▼
Cost / Income Ratio,
%n.m. n.m. n.m. n.m. n.m. n.m. n.m. n.m. n.a. n.a. n.m. n.m. n.a.
Cost of Risk, bp n.m. n.m. n.m. n.m. n.m. n.m. n.m. n.m. n.a. n.a. n.m. n.m. n.a.
Customer Deposits 2,611 1,880 3,114 3,173 3,192 2,702 2,719 3,300 +21.4% +4.0% 3,173 3,300 +4.0%
Total RWA 63,706 60,852 58,724 57,948 59,402 57,426 57,661 53,859 -6.6% -7.1% 57,948 53,859 -7.1%