uniform calibration of night vision goggles and test sets
TRANSCRIPT
Uniform calibration of night vision goggles and test sets
George P. Eppeldauer Optical Technology Division
National Institute of Standards and Technology Gaithersburg, Maryland 20899-8441
ABSTRACT
There are orders of magnitude differences between the ~0.1 % (k=2) uncertainty of NIST reference detector calibrations and the uncertainty of night vision (NV) goggle measurements. NIST developed a night vision radiometer calibration facility and NV radiometer transfer standards. The transfer standards, that propagate the radiance responsivity scale to the military primary standards laboratories, are calibrated against a NIST reference radiometer. The reference radiometer has been calibrated on the NIST Spectral Comparator Facility (SCF) for spectral power and irradiance responsivities. Spectral considerations are discussed to lower the uncertainties of the radiance responsivity scale transfer to the test sets and then to the goggles. Since direct determination of the final uncertainties in goggle calibrations and measurements is difficult, models have been made to estimate the most important uncertainty components based on individual spectral measurements of the source distributions and radiometer spectral responsivities. It is also shown, that because of source spectral mismatch problems, the goggle measurement uncertainty at applications can be much higher than at calibration. A suggestion is being made to mimic the no-moon (stars only) night sky radiation distribution using several LEDs in the test-sets to decrease the large spectral mismatch errors. A broad-band correction factor has been developed to further decrease calibration uncertainty when the goggles to be used have different spectral responsivities than the standard. Geometrical considerations to optimize the radiance measurement angle and the out-of-target blocking are also discussed to decrease the uncertainty in the radiance responsivity transfer. Keywords: calibration, night vision goggle, radiance, radiometer, scale transfer, spectral responsivity, test-set
1. INTRODUCTION The night vision (NV) goggles are the key sensors for human beings for night operations. The goggles have several technical parameters that can be used to characterize them. The most important parameters are spatial resolution, field-of-view, image distortion, transfer-gain (output luminance / input radiance), and spectral responsivity. The spectral responsivity is one of the most critical parameter for flying safety. The MIL-STD-3009 [1], written in 2001, shows the assumed night vision imaging system (NVIS) spectral response characteristics that shall be used to define NVIS compatibility criteria with aircraft lighting. The standard extends the NVIS radiance requirements from the previous defining document [2]. Though a full framework would be necessary for NVIS radiance measurement requirements, the new (2001) document does not address calibration aspects of the new NVIS technology. Because of the lack of standardized goggle calibrations, individually applied maintenance actions are performed, such as pass/fail tests to determine whether the goggle will perform as expected when it is used (or as it has performed in the past). At present, there are no standard criteria that state the goggle gain must be higher than some specified value. The users are tasked to locally establish a value based on past performance of the goggles that will satisfy their needs. There are some initial recommendations for each goggle type, but it is still the responsibility of the users to establish their own test methods. Also, in the past two decades, different source distributions have been applied in different test-sets. The earlier used tungsten lamps were replaced with LEDs. Some manufacturers use an 815 nm (peak) light emitting diode (LED) irradiating source in the test-sets when determining the transfer gain of the goggles. The transfer gain is the luminance at the eye-piece of the goggle divided by the radiance viewed by the goggle. The luminance is a photometric quantity that can be measured easily. However, the radiance viewed by the goggle has a spectral distribution and it is measured by the goggle which has a spectral responsivity different from the human visual system (the CIE standard photometric observer). Accordingly, the radiance viewed by the goggle needs a (broad-band) radiometric measurement
Electro-Optical and Infrared Systems: Technology and Applications IV, edited by David A. Huckridge, Reinhard R. Ebert,Proc. of SPIE Vol. 6737, 67370M, (2007) · 0277-786X/07/$18 · doi: 10.1117/12.737814
Proc. of SPIE Vol. 6737 67370M-1
Downloaded from SPIE Digital Library on 12 Feb 2010 to 129.6.147.88. Terms of Use: http://spiedl.org/terms

where photometric units cannot be used. The spectral distribution of the viewed radiance (in the test-sets) has not been standardized. The manufacturers claim that the calibration of the goggles using either a tungsten (close to Planckian) distribution or a narrow-band source distribution is satisfactory because the responsivity of the goggles is constant versus wavelength. They do not examine the errors when the broad-band night sky radiation is measured (at application) as compared to the narrow-band distribution of the LED (at calibration). According to the relative spectral responsivity characteristics of Classes A, B, and C in the MIL-STD-3009, the responsivity curves look flat (constant versus wavelength) because of the logarithmic responsivity scale used for illustration. However, as shown in Fig. 1, the spectral responsivity of different generation Gen-3 goggles can change significantly [3]. As an example, the Class-A standard and realized filter transmittance (cut-on) curves are also shown that will limit the goggle responsivities at the short wavelength side. A model is shown below to show the errors that the 815 nm LED source application and the constant goggle responsivity assumption can produce in night sky radiation measurements. The night sky irradiance distributions for full moon and no moon (only stars) [4] and the normalized spectral power distribution of a test set LED are shown in Fig. 2a on a logarithmic scale and in Fig. 2b on a linear scale (the full moon distribution is not shown here) to illustrate the difference in the wavelength coverage for the spectral range where the goggles are sensitive.
0
40
80
120
160
200
240
280
320
0
0.2
0.4
0.6
0.8
1
400 500 600 700 800 900
Gen-3 early 1990
Gen-3 mid 1990
Gen-3 present
Class-A transmittance
Class-A 625 nm transm ITT
Wavelength [nm]
Fig. 1. Spectral responsivity curves of different generation Gen-3 goggles and the transmittance curves of the standardized Class-A and realized ITT [5] minus-blue filter.
A recently published work examined the impact of goggle spectral responsivity changes on NVIS compatibility to aircraft interior lighting [6]. The goggle responsivity changes are caused by the changes introduced in image tube parameters and objective lens coatings. In the referenced publication, the authors believed it is necessary to develop and offer a more complete framework for NVIS related radiometric calculations. They started to explore the cockpit lighting compatibility issues associated with differing night-vision goggle spectral responsivity distributions. In addition to the relative spectral responsivity curves of the Class A and B goggles standardized in the MIL-STD-3009, they calculated the Class C relative spectral responsivity curve, using the transmission of the (“leaky green”) objective lens (from MIL-STD-3009), and the spectral responsitivity of an ITT image intensifier (“hot”) tube responsive from 450 nm to 950 nm. In spectrally broad-band measurements, such as goggle calibrations, the detector spectral responsivities are to be standardized to perform uniform integrated responsivity (INR) measurements. Similarly to the standardized V(λ) function in photometry, the Class A, B, and C spectral responsivity curves can be used as reference goggle spectral
Proc. of SPIE Vol. 6737 67370M-2
Downloaded from SPIE Digital Library on 12 Feb 2010 to 129.6.147.88. Terms of Use: http://spiedl.org/terms

Nig
ht s
ky i
rrad
ianc
e LW
/cm
distributions. The goggle signals can be calculated as the product of the goggle spectral responsivity and the source spectral distribution seen by the goggle. If the realized (manufactured) detector spectral responsivity is different than the
10-9
10-8
10-7
10-6
0.1
1
500 600 700 800 900
No moon irradiance
Full moon irradiance
normalized LED distribution
Wavelength [nm]
0
2 10-9
4 10-9
6 10-9
8 10-9
1 10-8
0.2
0.4
0.6
0.8
1
500 600 700 800 900Wavelength [nm]
Fig. 2a. Spectral distribution curves of night sky Fig. 2b. Spectral distribution curves of night sky (no
irradiance and a test-set LED on logarithmic scales. moon) irradiance and a test-set LED on linear scales. standardized responsivity, large systematic measurement errors can be obtained if the source distribution to be measured is very different than the distribution of the source used at calibration. To avoid these large errors, in addition to the standardization of the detector spectral responsivity, the spectral power distribution of the source at calibration can be standardized (similarly to the CIE Illuminant A, D65, and other distribution functions) as well. In NV goggle calibrations, frequently an LED light source is used in the test-set. Since, the LED spectral power distribution is very different from the night sky distributions (during goggle applications), large goggle measurement errors can be obtained. The measurement uncertainties can be decreased if the source spectral distribution in the test-sets is standardized (at calibration) and the standardized spectral distribution is similar to the night sky radiation (at application). This standard source distribution function does not have to be equal to the different night sky radiation curves. It can be similar to those to obtain low calibration uncertainties. Similar considerations have been made in detector-based photometric and colorimetric calibrations [7]. This idea can be realized using several LEDs [8, 9] in a test-set instead of using one LED (that usually peaks around 815 nm). Also, a broad-band correction factor (similar to the color correction factor in photometry [7]) that can be easily applied for goggle spectral responsivities that are different than the standard curve, can be developed to decrease goggle calibration uncertainty. Applying the above discussed INR measurement considerations, the goggle transfer-gain calibrations can be made in a uniform way with low uncertainties. The suggested goggle calibration system is based on the standardized goggle responsivity functions in the MIL-STD-3009 and it is traceable to the SI units through the NIST detector responsivity scales. The suggested uniform calibration system could significantly improve the goggle measurement uncertainties.
2. THE NIST REFERENCE DETECTORS AND RESPONSIVITY SCALES Participation of NIST in the night vision goggle calibration program started in the late 1980s after NIST developed the high sensitivity silicon radiometers [10]. The noise equivalent photocurrent of these radiometers was 10-16 A, similar to
Proc. of SPIE Vol. 6737 67370M-3
Downloaded from SPIE Digital Library on 12 Feb 2010 to 129.6.147.88. Terms of Use: http://spiedl.org/terms

FO V limiter
Aperture
Diffrsé
Thermoelectriccooler
Siliconphotodiode
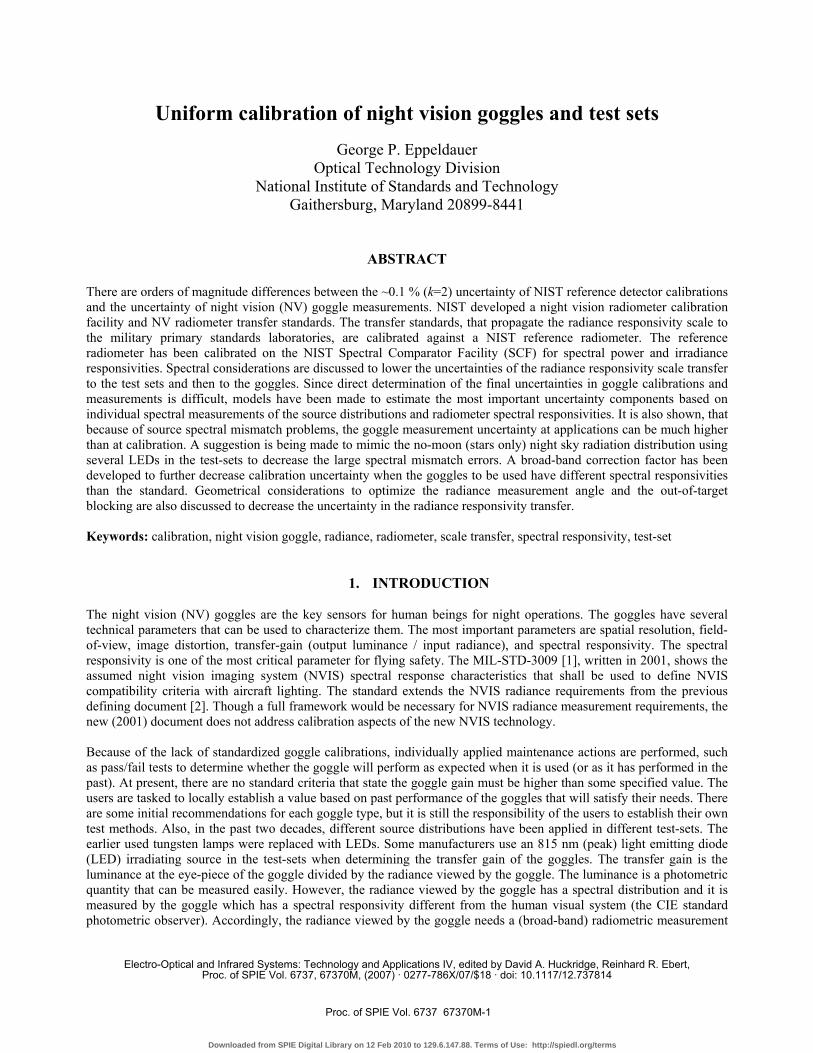
the photomultiplier tubes the Army used for goggle calibrations before acquiring the NIST radiometer standards. A few years later NIST developed a night vision detector (radiometer) calibration facility (NVRCF) funded by the Navy. The NIST responsivity scale is derived from electrical-substitution cryogenic radiometers. Silicon trap-detector transfer standards are calibrated against these primary standards in radiant power measurement mode. The trap detectors are equipped with precision apertures to convert the power responsivity into irradiance responsivity. The trap detectors have relative combined expanded uncertainties of less than 0.1 % (k=2) [11]. The trap detectors propagate the reference responsivity scale to two other NIST responsivity calibration facilities. The first one, the Spectral Irradiance and Radiance Responsivity Calibration using Uniform Sources (SIRCUS) facility [11] is an extended version of the NVRCF and it can be used for general purpose detector irradiance and radiance responsivity calibrations. The other facility is the Spectral Comparator Facility (SCF) [12] which was used to calibrate the NIST night vision reference radiometer for both power and irradiance responsivity [13]. Several NV radiometer transfer standards were also developed at NIST for the Army, Navy, and the Air Force, to propagate the NIST radiance responsivity scale to the military primary standards laboratories. The radiance responsivity of these radiometers is typically determined at the NVRCF. The NIST luminance scale is transferred separately to the three services [14]. 2.1 The NIST Reference Radiometer The NIST reference radiometer operates in irradiance measurement mode. The cross-section of the radiometer front is shown in Fig. 3. In front of the radiant power measuring silicon photodiode, there is a diffuser and a thin aperture attached to the front of the diffuser. The aperture determines the reference plane of irradiance measurements. The diffuser dominates the directional responsivity of the radiometer. The input geometry was optimized experimentally to obtain an angular responsivity close to the theoretical cosine function [13]. The field-of-view (FOV) limiter rejects optical radiation outside the radiometer FOV. The detector is temperature stabilized with a thermoelectric (TE) cooler at
Fig. 3. The cross-section of the NIST night vision reference radiometer 25 oC. The angular responsivity was measured using a small incandescent lamp at a separation of about 3 m and the radiometer was rotated around the center of the aperture. The measurement results are shown on Fig. 4. The solid line is the cosine function and the open circles are the measured data points. The results show, that the irradiance meter has an angular responsivity very close to the cosine function in a FOV of 11.6o (full angle).
Proc. of SPIE Vol. 6737 67370M-4
Downloaded from SPIE Digital Library on 12 Feb 2010 to 129.6.147.88. Terms of Use: http://spiedl.org/terms
rela
tive
irrad
ianc
e re
spon
se
0.994
0.995
0.996
0.997
0.998
0.999
1.000
-5.8 -4.35 -2.9 -1.45 0 1.45 2.9 4.35 5.8
cosinemeter
angle [degree]
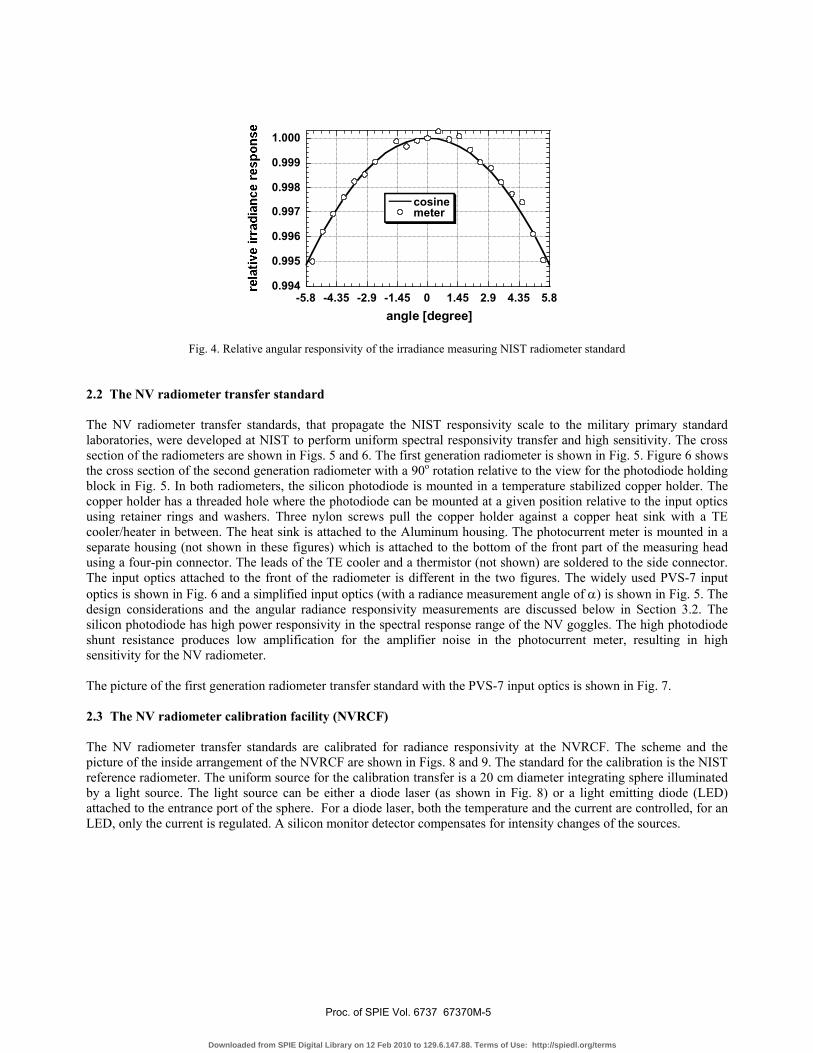
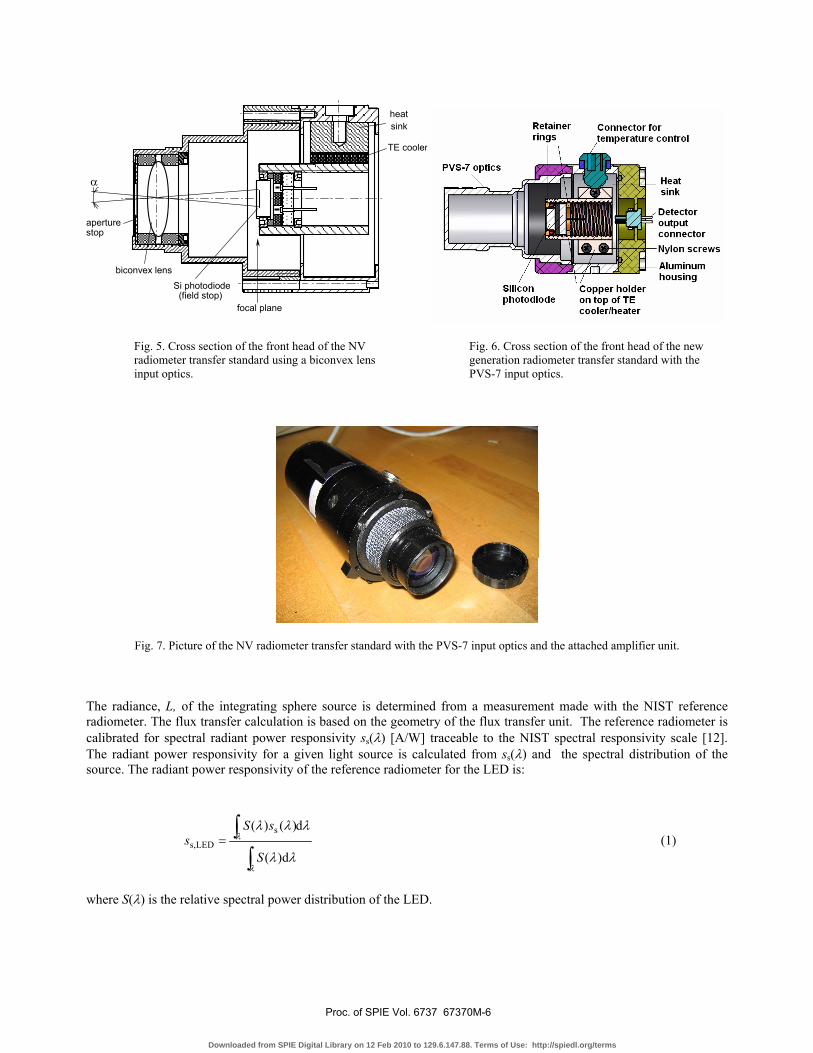
Fig. 4. Relative angular responsivity of the irradiance measuring NIST radiometer standard 2.2 The NV radiometer transfer standard The NV radiometer transfer standards, that propagate the NIST responsivity scale to the military primary standard laboratories, were developed at NIST to perform uniform spectral responsivity transfer and high sensitivity. The cross section of the radiometers are shown in Figs. 5 and 6. The first generation radiometer is shown in Fig. 5. Figure 6 shows the cross section of the second generation radiometer with a 90o rotation relative to the view for the photodiode holding block in Fig. 5. In both radiometers, the silicon photodiode is mounted in a temperature stabilized copper holder. The copper holder has a threaded hole where the photodiode can be mounted at a given position relative to the input optics using retainer rings and washers. Three nylon screws pull the copper holder against a copper heat sink with a TE cooler/heater in between. The heat sink is attached to the Aluminum housing. The photocurrent meter is mounted in a separate housing (not shown in these figures) which is attached to the bottom of the front part of the measuring head using a four-pin connector. The leads of the TE cooler and a thermistor (not shown) are soldered to the side connector. The input optics attached to the front of the radiometer is different in the two figures. The widely used PVS-7 input optics is shown in Fig. 6 and a simplified input optics (with a radiance measurement angle of α) is shown in Fig. 5. The design considerations and the angular radiance responsivity measurements are discussed below in Section 3.2. The silicon photodiode has high power responsivity in the spectral response range of the NV goggles. The high photodiode shunt resistance produces low amplification for the amplifier noise in the photocurrent meter, resulting in high sensitivity for the NV radiometer. The picture of the first generation radiometer transfer standard with the PVS-7 input optics is shown in Fig. 7. 2.3 The NV radiometer calibration facility (NVRCF) The NV radiometer transfer standards are calibrated for radiance responsivity at the NVRCF. The scheme and the picture of the inside arrangement of the NVRCF are shown in Figs. 8 and 9. The standard for the calibration is the NIST reference radiometer. The uniform source for the calibration transfer is a 20 cm diameter integrating sphere illuminated by a light source. The light source can be either a diode laser (as shown in Fig. 8) or a light emitting diode (LED) attached to the entrance port of the sphere. For a diode laser, both the temperature and the current are controlled, for an LED, only the current is regulated. A silicon monitor detector compensates for intensity changes of the sources.
Proc. of SPIE Vol. 6737 67370M-5
Downloaded from SPIE Digital Library on 12 Feb 2010 to 129.6.147.88. Terms of Use: http://spiedl.org/terms
Retainer Connector for
Detectoroutputconnector
—Nylon screws— Aluminum
housing
temperature control/
ISilicon Copper holderphotodiode on top of TE
cooler/heater
Fig. 5. Cross section of the front head of the NV Fig. 6. Cross section of the front head of the new radiometer transfer standard using a biconvex lens generation radiometer transfer standard with the input optics. PVS-7 input optics.
Fig. 7. Picture of the NV radiometer transfer standard with the PVS-7 input optics and the attached amplifier unit. The radiance, L, of the integrating sphere source is determined from a measurement made with the NIST reference radiometer. The flux transfer calculation is based on the geometry of the flux transfer unit. The reference radiometer is calibrated for spectral radiant power responsivity ss(λ) [A/W] traceable to the NIST spectral responsivity scale [12]. The radiant power responsivity for a given light source is calculated from ss(λ) and the spectral distribution of the source. The radiant power responsivity of the reference radiometer for the LED is:
∫∫
=
λ
λ
λλ
λλλ
d)(
d)()( sLEDs,
S
sSs (1)
where S(λ) is the relative spectral power distribution of the LED.
aperture stop
α
biconvex lens Si photodiode (field stop)
focal plane
TE cooler
heat sink
Proc. of SPIE Vol. 6737 67370M-6
Downloaded from SPIE Digital Library on 12 Feb 2010 to 129.6.147.88. Terms of Use: http://spiedl.org/terms

Heatsink
£JTransfer
- - standardradiometer
F,
Fig. 8. Scheme of the NV transfer standard radiometer calibration at the NVRCF.
Fig. 9. Picture of the NIST Night Vision Radiometer Calibration Facility.
The cosine-corrected reference radiometer has a sufficiently large acceptance angle for the flux transfer. The irradiance responsivity of the reference radiometer is obtained from spatial responsivity integrals determined by a raster scanning procedure. The effective area of the radiometer aperture is given by the ratio of its total irradiance responsivity to the radiant power responsivity in the center of the aperture. The radiance L of the sphere exit port is determined from the radiant power P from the source incident on the detector, and the geometric extent G:
Proc. of SPIE Vol. 6737 67370M-7
Downloaded from SPIE Digital Library on 12 Feb 2010 to 129.6.147.88. Terms of Use: http://spiedl.org/terms
GPL = (2)
where
G = 2
2π ( ) ( )⎥⎥⎦
⎤
⎢⎢⎣
⎡
⎭⎬⎫
⎩⎨⎧ −++−++
2/1222222222 4 DSDSDS rrrrdrrd (3)
The rS is the radius of the source (sphere) exit port aperture (≈ 27 mm), rD is the radius determined from the effective area of the radiometer aperture (≈ 4 mm), and d is the distance between the source aperture and the radiometer aperture (≈ 22.6 cm). In our case, the units are W for P, W cm-2 sr-1 for L, and cm2 sr for G. As the second step, the NV radiometer transfer standard, with the attached PVS-7 input optics, is calibrated for the exit port radiance. The transfer standard radiometer (as shown in Fig. 8) is placed and aimed at the center of the sphere exit port. The separation between the sphere aperture and the front of the PVS-7 optics is only 50 mm because of the poor out-of-target rejection of the PVS-7 equipped radiometer (see below in Fig. 13). At this separation, the sphere radiation overfills the radiance measurement angle of the transfer standard and the surrounding angular region where the device has undue sensitivity. The radiance responsivity of the transfer standard is determined as the ratio of its output current to the radiance of the sphere exit port calibrated against the reference radiometer. The improvement of the out-of-target rejection using a simplified (biconvex) input optics (discussed in Section 3.2) decreased the 2.4 % (k=2) uncertainty component of the distance dependent radiance responsivity of the PVS-7 equipped radiometer to less than 1 % (k=2). The combined relative expanded uncertainty of the radiance responsivity calibrations using the PVS-7 input optics is 3.0 % (k=2).
3. SCALE TRANSFER The military calibration laboratories further transfer the radiance responsivity from the NV radiometer transfer standard to their field NV radiometers. The field radiometers are similar to the construction of the above discussed NV radiometer transfer standard. The radiance responsivity transfer for the field radiometers is made using integrating sphere sources illuminated possibly with the same LED type used in the test sets. The field NV radiometers are used to calibrate the radiance of the test-sets. The goggles are calibrated against the test-set radiance. The spectral distribution of the test-set radiance is dominated by the LED spectral power distribution which is much narrower than both the night sky radiation and the goggle spectral responsivity range. In order to decrease calibration and measurement uncertainties it is necessary to analyze the spectral and geometrical issues during the radiance scale transfer from the NIST NVRCF to the military primary standard laboratories. The results and conclusions of the analysis below can be applied to the scale transfer from the military primary standard laboratories to the field test-sets. When the radiance scale transfer to the test-sets is performed according to the considerations discussed below smaller than 10 % (k=2) test-set radiance calibration uncertainties can be achieved. Otherwise, the uncertainties can be significantly higher. The additional uncertainties of the radiance scale propagation to goggle calibrations and goggle field measurements are also discussed below. 3.1 Spectral considerations Spectral problems during the scale propagation from the NIST reference detector to test-sets, and then from the test-sets to the night vision goggles, can significantly increase the calibration uncertainties. However, when the spectral characteristics are different at the goggle calibration compared to the follow-on goggle applications, the goggle performance can be very different. To avoid these differences, the spectral issues during the radiance responsivity scale transfer and the following goggle calibrations and applications are to be analyzed.
Proc. of SPIE Vol. 6737 67370M-8
Downloaded from SPIE Digital Library on 12 Feb 2010 to 129.6.147.88. Terms of Use: http://spiedl.org/terms
['] ApA
!suo
dsej
jope
jep
!S
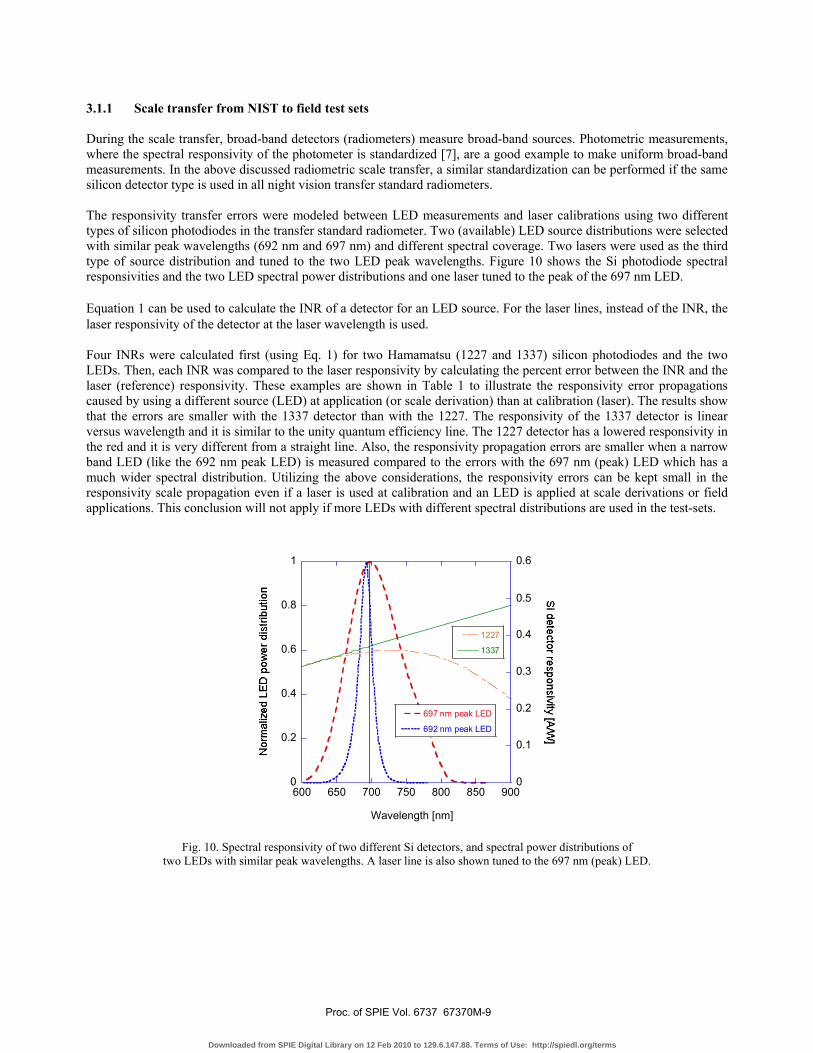
3.1.1 Scale transfer from NIST to field test sets During the scale transfer, broad-band detectors (radiometers) measure broad-band sources. Photometric measurements, where the spectral responsivity of the photometer is standardized [7], are a good example to make uniform broad-band measurements. In the above discussed radiometric scale transfer, a similar standardization can be performed if the same silicon detector type is used in all night vision transfer standard radiometers. The responsivity transfer errors were modeled between LED measurements and laser calibrations using two different types of silicon photodiodes in the transfer standard radiometer. Two (available) LED source distributions were selected with similar peak wavelengths (692 nm and 697 nm) and different spectral coverage. Two lasers were used as the third type of source distribution and tuned to the two LED peak wavelengths. Figure 10 shows the Si photodiode spectral responsivities and the two LED spectral power distributions and one laser tuned to the peak of the 697 nm LED. Equation 1 can be used to calculate the INR of a detector for an LED source. For the laser lines, instead of the INR, the laser responsivity of the detector at the laser wavelength is used. Four INRs were calculated first (using Eq. 1) for two Hamamatsu (1227 and 1337) silicon photodiodes and the two LEDs. Then, each INR was compared to the laser responsivity by calculating the percent error between the INR and the laser (reference) responsivity. These examples are shown in Table 1 to illustrate the responsivity error propagations caused by using a different source (LED) at application (or scale derivation) than at calibration (laser). The results show that the errors are smaller with the 1337 detector than with the 1227. The responsivity of the 1337 detector is linear versus wavelength and it is similar to the unity quantum efficiency line. The 1227 detector has a lowered responsivity in the red and it is very different from a straight line. Also, the responsivity propagation errors are smaller when a narrow band LED (like the 692 nm peak LED) is measured compared to the errors with the 697 nm (peak) LED which has a much wider spectral distribution. Utilizing the above considerations, the responsivity errors can be kept small in the responsivity scale propagation even if a laser is used at calibration and an LED is applied at scale derivations or field applications. This conclusion will not apply if more LEDs with different spectral distributions are used in the test-sets.
0
0.2
0.4
0.6
0.8
1
0
0.1
0.2
0.3
0.4
0.5
0.6
600 650 700 750 800 850 900
697 nm peak LED
692 nm peak LED
1227
1337
Wavelength [nm]
Fig. 10. Spectral responsivity of two different Si detectors, and spectral power distributions of two LEDs with similar peak wavelengths. A laser line is also shown tuned to the 697 nm (peak) LED.
Proc. of SPIE Vol. 6737 67370M-9
Downloaded from SPIE Digital Library on 12 Feb 2010 to 129.6.147.88. Terms of Use: http://spiedl.org/terms
Table 1. Percent errors between LED integrated responsivity and laser responsivity measurements
for two different LEDs and two different silicon photodiodes.
INR (697 nm LED & 1227) --------------------------------- 697 nm laser resp. of 1227
INR (692 nm LED & 1227)---------------------------------692 nm laser resp. of 1227
INR (697 nm LED & 1337)---------------------------------697 nm laser resp. of 1337
INR(692 nm LED & 1337)---------------------------------692 nm laser resp. of 1337
4.6 %
0.6 %
2.8 %
1 %
3.1.2 Scale transfer from test-sets to goggles
It is not enough to determine the radiance responsivity scale propagation uncertainties from the NIST NVRCF to the test-sets. When the radiance scale is propagated from the test-sets to the goggles, the spectral bandwidth of the test-set source distribution and the deviation of that from the source distributions at the goggle applications will have a major influence to the uncertainties of goggle calibrations and applications. The transfer-gain is one of the most important goggle characteristics that should be determined. It is the ratio of the output luminance (at the eye piece) to the input radiance viewed by the goggle. The luminance is usually transferred from the NIST photometric scale [14]. The luminance at the output depends on the goggle signal which depends not only on the test-set radiance but also on the radiance spectral distribution. In order to obtain the same (or similar) goggle transfer gains at both calibration and application(s), the test-set source distribution should be similar to the source distributions at night vision applications. Third generation (Gen-3) goggles are being used for military applications because of the high resolution and gain produced by improved image intensifier tubes and the Gallium Arsenide coated photocathode that enhanced the sensitivity (responsivity). These goggles can measure very low-level radiation from the visible to about 900 nm. Filters with a cut-on edge of about 600 nm and 630 nm are deposited on the input optics of Class-A and B goggles. The Class-C goggles have a cut-on edge of about 660 nm, that allows the use of red cockpit lights without causing large goggle signals or saturation, and also a decreased narrow-band transmittance at about 550 nm (called leaky green) that allows the goggle user to see a green display (monitor) through the goggle. The radiance scale is transferred to the goggles from test-sets. A frequently used test-set light-source that irradiates the reticle-plane, is an LED that peaks around 815 nm. There are other test sets using a different LED type that peaks at about 690 nm. In both cases, the spectral power distribution of the LED covers only part of the wavelength range where the goggle is responsive. Also, in applications, where the goggles measure reflections under night sky irradiance, the spectral power distribution is much broader than that of a test-set LED. According to the present calibration considerations, if one LED distribution is used (as a reference distribution) for all Gen-3 goggle calibrations, then the calibration results (the transfer gain of the goggle) will be uniform. The assumption here is that the individual goggle responsivities will not change significantly within the wavelength interval of the LED (of the test-set). Another problem is that the spectral distribution of the source to be measured by the goggle at applications is ignored. As an example, the night sky radiation is very different from the spectral power distribution of an LED. The night sky radiation has a very broad distribution that will cover the overall responsivity range of the goggle resulting in a much larger signal than the goggle signal for a given LED distribution (for normalized distributions). The larger goggle signal at application does not mean that the produced systematic error is in the good direction (that the transfer gain of the goggle will be much higher in field applications than at calibration) because in a correct goggle calibration, the source distribution should be similar to the distribution at applications. The goggle transfer-gain at calibration should be very similar to that at applications. A modeling is described below to estimate the errors for an LED source at calibration and the broad-band night sky radiation at application. The model shows the errors what an 815 nm LED source application (during calibration in the test sets) and the “constant goggle responsivity versus wavelength” assumption can produce in night sky irradiated measurements (applications). In the calculations, the night sky irradiance distributions for full-moon and no-moon (only stars) are used as source distributions during goggle applications. The normalized spectral power distribution of an 815 nm (peak) LED
Proc. of SPIE Vol. 6737 67370M-10
Downloaded from SPIE Digital Library on 12 Feb 2010 to 129.6.147.88. Terms of Use: http://spiedl.org/terms
with the two different night sky distributions (already shown in Figs. 2a and 2b) are used. In this model, the wavelength coverage for the calibration-source and application-source distributions is very different in the shown spectral range where the goggles are responsive. The different spectral resposivities of Gen-3 night vision goggles from the early 1990, the mid 1990, and present, have also been shown in Fig. 1. Figure 1 also shows that the Class-A (standard and realized) filter transmittance (cut-on) curves that limit the goggle responsivities at the short wavelength end. All three goggles in Fig. 1 used in the modeling are used as Class-A goggles. Their responsivities are calculated as the product of the cut-on filter transmittance (the ITT filter curve) and the real spectral responsivity of the three Gen-3 goggles as shown in Fig. 1. The goggle responsivities are normalized at their peaks. Also, the spectral distributions of the night sky radiation in Figs. 2a and 2b are normalized at their peaks to make the spectral products. First, the signal, which is the product of the goggle spectral responsivity and the source spectral distribution, was calculated for the (same) “Gen-3 present” responsivity and the three source distributions (the 815 nm LED, the full-moon irradiance, and the no-moon (stars only) irradiance). Then, the three different signals were compared by making two signal ratios to the reference signal (using the LED). The ratios in Table 2 show how large the goggle signal errors can be between calibration and (two) applications (using the “Gen-3 present” goggle). Following that, the “Gen-3 mid 1990” and then the “Gen-3 early 1990” goggle responsivities were substituted for the spectral products in the numerators (for both the full-moon and no-moon source distributions) and the denominator of the ratios was the spectral product of the “Gen-3 present” goggle and the 815 nm LED (used at calibration in the model).
Table 2. Calculated ratios (systematic measurement errors) of the “Gen-3 present” goggle signals (when measuring two different night sky radiation distributions) to its reference signal (when measuring the 815 nm LED).
INR (Gen-3 present & full-moon) ------------------------------------------
INR (Gen-3 present & 815 nm LED)
INR (Gen-3 present & no-moon) ------------------------------------------
INR (Gen-3 present & 815 nm LED)
6.00
1.41 The calculation results show that a factor of six (equal to 500 %) error can be obtained with the “Gen-3 present” goggle when it is calibrated using an 815 nm LED and then applied to measure full-moon night sky radiation. When it measures no-moon (stars only) radiation distribution, the error (ratio) decreases to 1.41 which means a 41 % measurement error. This error is much smaller because of the very different distribution of the two night sky radiation curves as shown in Fig. 2a. The linear Y scale of Fig. 2b better illustrates that the no-moon radiation is much lower at the short wavelength range of the goggle than the full-moon radiation. In the second part of this model, the spectral responsivities of the two other Gen-3 goggles were substituted for the “Gen-3 present” goggle to model the errors caused by different goggle spectral responsivities. The INRs were calculated for both full moon and no-moon source distributions and were referenced again to the INR of “Gen-3 present” and the 815 nm LED (as in Table 2). The ratios, that show the measurement errors using these other two goggles instead of the “Gen-3 present” goggle (with the assumption that only the “Gen-3 present” goggle was calibrated using the 815 nm LED source), are shown in Tables 3 and 4.
Table 3. Calculated ratios (systematic measurement errors) of the “Gen-3 mid 1990” goggle signals (when measuring two different night sky source distributions) to the reference signal (the “Gen-3 present” measures the 815 nm LED).
INR (Gen-3 mid 1990 & full-moon) ------------------------------------------
INR (Gen-3 present & 815 nm LED)
INR (Gen-3 mid 1990 & no-moon) ------------------------------------------
INR (Gen-3 present & 815 nm LED)
5.88
1.26
Proc. of SPIE Vol. 6737 67370M-11
Downloaded from SPIE Digital Library on 12 Feb 2010 to 129.6.147.88. Terms of Use: http://spiedl.org/terms

Table 4. Calculated ratios (systematic measurement errors) of the “Gen-3 early 1990” goggle signals (when measuring two different night sky source distributions) to the reference signal (the “Gen-3 present” measures the 815 nm LED).
INR (Gen-3 early 1990 & full-moon) ------------------------------------------
INR (Gen-3 present & 815 nm LED)
INR (Gen-3 early 1990 & no-moon) -----------------------------------------
INR (Gen-3 present & 815 nm LED)
6.54
1.21 The ratios, in Tables 3 and 4, show that substituting the “Gen-3 present” goggle (used for calibration) with two other Gen-3 goggles (of different spectral responsivities), the goggle measurement errors can change up to 20 % for no-moon and 54 % for full-moon distributions (related to the 6.00 and 1.41 ratios in Table 2 where the errors are caused by the different source distributions). All the errors calculated in Tables 2 to 4 are caused by spectral mismatch errors. In Table 2, the spectral mismatch of the applied night sky source distributions is large relative to the spectral distribution of the 815 nm LED (used at calibration). In Tables 3 and 4, the spectral mismatch is between the “Gen-3 early 1990” and “Gen-3 mid 1990” goggles relative to the “Gen-3 present” goggle (that represents the standard goggle spectral responsivity in this model). The above measurement errors can be lowered if the spectral mismatch is less. For Table 2, the errors can be drastically decreased if several LEDs are used in the test sets instead of the 815 nm LED. Since the full-moon and no-moon night sky distributions are very different, and any distribution can happen between these two extreme distributions, the best results can be obtained if the LED distributions in the test sets (using several LEDs) will mimic (roughly) the no-moon distribution. The no-moon distribution is the best choice for reference source distribution because it has the lowest irradiance where large measurement uncertainties are not allowed (to perform safe goggle operations). The goggle measurement uncertainties can be higher at full moon (or between no-moon and full-moon) radiation where the signals are much higher and the measurement uncertainty is less of a problem. For Tables 3 and 4, the measurement errors can be decreased if goggles are used with spectral responsivities similar to the standards Class A, B, or C. In field applications, the individual measurements of goggle relative spectral responsivities cannot be expected. If possible, goggles should be used with known typical relative spectral responsivities that are similar to each other (e.g. from the same fabrication batch). In this case, a broad-band correction factor can be used to further decrease the errors. This correction factor can be determined as shown below. The goggle (NVIS) radiance is:
λλλλ
dNGR s )()(∫= (4)
where )(λsG is the normalized standard spectral radiance responsivity of the goggle, )(λN is the spectral radiance of the source measured, and λ is the wavelength. The signal of the goggle is:
∫=λ
λλλ dNGS )()( (5)
where )(λG is the (realized/fabricated) absolute spectral radiance responsivity of the goggle that measures the )(λN spectral radiance. The absolute radiance responsivity can be written as
Proc. of SPIE Vol. 6737 67370M-12
Downloaded from SPIE Digital Library on 12 Feb 2010 to 129.6.147.88. Terms of Use: http://spiedl.org/terms

)()()( λλ nGpeakGG ⋅= (6) where )( peakG is the absolute radiance responsivity of the goggle at the peak and )(λnG is the normalized relative responsivity of the realized/fabricated goggle. The goggle broadband responsivity is the ratio of Eq. 5 to Eq. 4:
∫∫
==
λ
λ
λλλ
λλλ
dNG
dNGpeakG
RSs
s
n
)()(
)()()( (7)
The goggle calibration factor is the reciprocal of s and the broad-band (spectral mismatch) correction factor is:
∫∫
==
λ
λ
λλλ
λλλ
dNG
dNG
speakG
Cn
s
)()(
)()()( (8)
In practice, a broad-band correction factor can be calculated from the typical normalized spectral responsivity curve of the goggle relative to the normalized spectral responsivity curve of the standard (such as Class-A). The source can be the no-moon (stars only) night sky distribution. If the realized/fabricated goggle spectral responsivity is equal to the standardized spectral responsivity of a goggle type (from Class A, B, or C), the correction factor is unity. In case, the relative spectral responsivity of the goggle is known (e.g. measured), the correction factor will compensate for the spectral mismatch errors. The correction factor also can be used when goggles that belong to two different classes (such as Class A or B) are used to measure similar source distributions and uniform measurement results are needed. While the errors calculated above have not been measured directly, the individual characteristics and functions, such as source distributions and spectral responsivities used in the calculations, were measured. The described modeling was the best approach to estimate the main goggle calibration and measurement uncertainties. 3.2 Geometrical considerations In order to lower uncertainty in both the radiance responsivity calibration of the transfer standard radiometers (described in Section 2.3) and in the following radiance responsivity scale propagations, the traditionally used PVS-7 input optics was tested. This input optics which is a multi-element objective lens, was originally used for goggles where spatial distortions (aberrations) could lower the image quality. The PVS-7 input optics is also used at the front of the transfer standard radiometer where a good out-of-target rejection (radiation attenuation outside of the radiance measurement angle) would be more important than high image quality. An analysis has been made to improve the out-of-target blocking of the PVS-7 equipped radiometer using a simplified input optics of improved angular responsivity. The PVS-7 input optics is still needed for the goggles. The radiance measurement angle depends on the front geometry of the radiometer. Figure 11 shows the radiance measurement scheme of the biconvex lens equipped radiometer. The solid angle Ωo of the S source as viewed (subtended) by the radiance measuring radiometer is usually not measured. Instead, the radiometer should have a well defined radiance measurement angle α. A radiance meter is usually a modified irradiance meter. At the output of the input optics, either the Si photodiode itself or an aperture can be used as a field stop (L). In the shown example, there is an aperture of diameter D1 at the front of the Si photodiode. The diameter of the objective lens is D2 and f is the focal length of the biconvex lens. There is an aperture stop A with a diameter of D3 in front of the lens to limit the viewing field. This way, the input optics has a constant f#, equal to f/D3. The objective (biconvex) lens can be moved along the optical axis, relative to L to form an image of the (D4 diameter) measured area of source S in the plane of L. S must be larger than D4 to overfill L. According to the scheme on Fig. 11, the radiance measurement half-angle is:
Proc. of SPIE Vol. 6737 67370M-13
Downloaded from SPIE Digital Library on 12 Feb 2010 to 129.6.147.88. Terms of Use: http://spiedl.org/terms
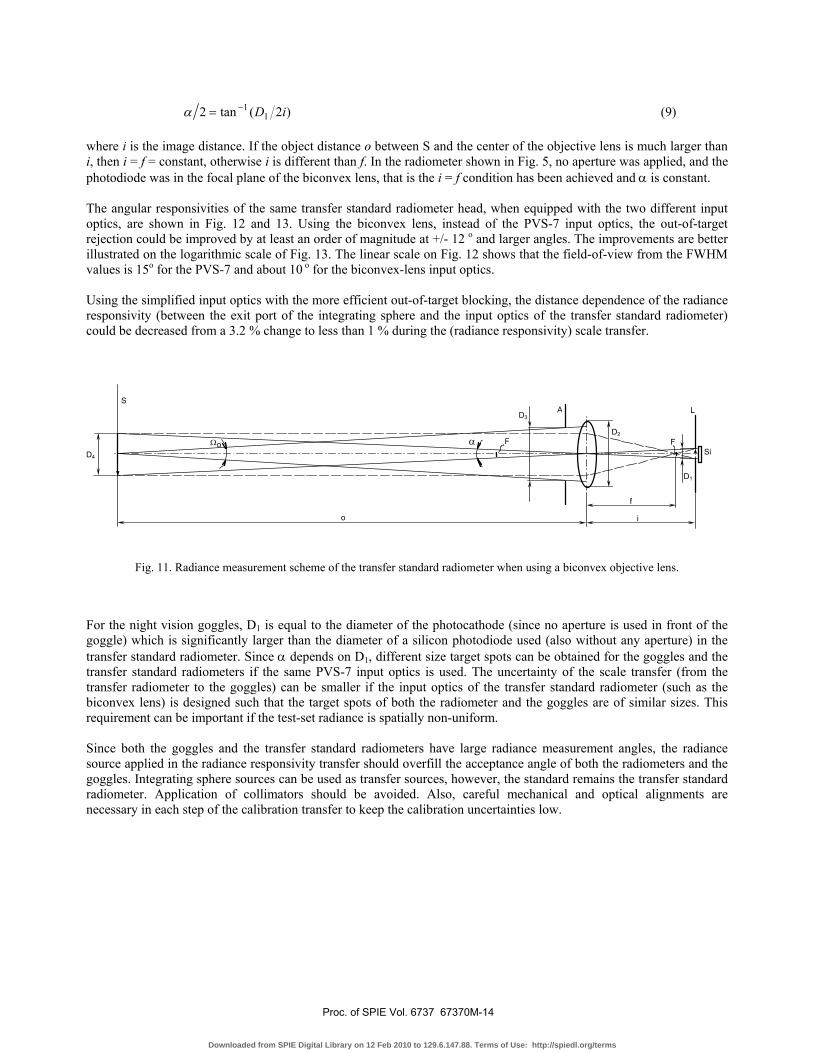
)2(tan2 11 iD−=α (9)
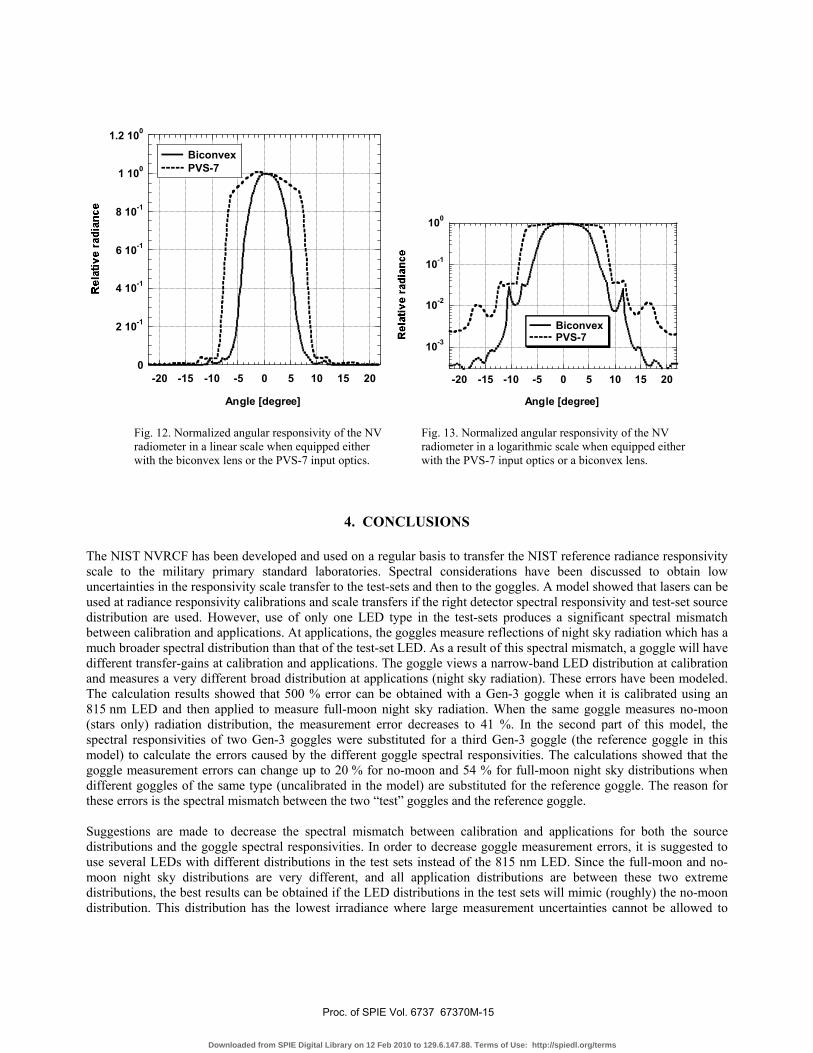
where i is the image distance. If the object distance o between S and the center of the objective lens is much larger than i, then i = f = constant, otherwise i is different than f. In the radiometer shown in Fig. 5, no aperture was applied, and the photodiode was in the focal plane of the biconvex lens, that is the i = f condition has been achieved and α is constant. The angular responsivities of the same transfer standard radiometer head, when equipped with the two different input optics, are shown in Fig. 12 and 13. Using the biconvex lens, instead of the PVS-7 input optics, the out-of-target rejection could be improved by at least an order of magnitude at +/- 12 o and larger angles. The improvements are better illustrated on the logarithmic scale of Fig. 13. The linear scale on Fig. 12 shows that the field-of-view from the FWHM values is 15o for the PVS-7 and about 10 o for the biconvex-lens input optics. Using the simplified input optics with the more efficient out-of-target blocking, the distance dependence of the radiance responsivity (between the exit port of the integrating sphere and the input optics of the transfer standard radiometer) could be decreased from a 3.2 % change to less than 1 % during the (radiance responsivity) scale transfer.
Fig. 11. Radiance measurement scheme of the transfer standard radiometer when using a biconvex objective lens.
For the night vision goggles, D1 is equal to the diameter of the photocathode (since no aperture is used in front of the goggle) which is significantly larger than the diameter of a silicon photodiode used (also without any aperture) in the transfer standard radiometer. Since α depends on D1, different size target spots can be obtained for the goggles and the transfer standard radiometers if the same PVS-7 input optics is used. The uncertainty of the scale transfer (from the transfer radiometer to the goggles) can be smaller if the input optics of the transfer standard radiometer (such as the biconvex lens) is designed such that the target spots of both the radiometer and the goggles are of similar sizes. This requirement can be important if the test-set radiance is spatially non-uniform. Since both the goggles and the transfer standard radiometers have large radiance measurement angles, the radiance source applied in the radiance responsivity transfer should overfill the acceptance angle of both the radiometers and the goggles. Integrating sphere sources can be used as transfer sources, however, the standard remains the transfer standard radiometer. Application of collimators should be avoided. Also, careful mechanical and optical alignments are necessary in each step of the calibration transfer to keep the calibration uncertainties low.
α
D1
D2 F
Si
LA
F
f
i o
S
D3
D4 Ωo
Proc. of SPIE Vol. 6737 67370M-14
Downloaded from SPIE Digital Library on 12 Feb 2010 to 129.6.147.88. Terms of Use: http://spiedl.org/terms
0
2 10-1
4 10-1
6 10-1
8 10-1
1 100
1.2 100
-20 -15 -10 -5 0 5 10 15 20
Biconvex PVS-7
Angle [degree]
10-3
10-2
10-1
100
-20 -15 -10 -5 0 5 10 15 20
Biconvex PVS-7
Angle [degree]
Fig. 12. Normalized angular responsivity of the NV Fig. 13. Normalized angular responsivity of the NV radiometer in a linear scale when equipped either radiometer in a logarithmic scale when equipped either with the biconvex lens or the PVS-7 input optics. with the PVS-7 input optics or a biconvex lens.
4. CONCLUSIONS
The NIST NVRCF has been developed and used on a regular basis to transfer the NIST reference radiance responsivity scale to the military primary standard laboratories. Spectral considerations have been discussed to obtain low uncertainties in the responsivity scale transfer to the test-sets and then to the goggles. A model showed that lasers can be used at radiance responsivity calibrations and scale transfers if the right detector spectral responsivity and test-set source distribution are used. However, use of only one LED type in the test-sets produces a significant spectral mismatch between calibration and applications. At applications, the goggles measure reflections of night sky radiation which has a much broader spectral distribution than that of the test-set LED. As a result of this spectral mismatch, a goggle will have different transfer-gains at calibration and applications. The goggle views a narrow-band LED distribution at calibration and measures a very different broad distribution at applications (night sky radiation). These errors have been modeled. The calculation results showed that 500 % error can be obtained with a Gen-3 goggle when it is calibrated using an 815 nm LED and then applied to measure full-moon night sky radiation. When the same goggle measures no-moon (stars only) radiation distribution, the measurement error decreases to 41 %. In the second part of this model, the spectral responsivities of two Gen-3 goggles were substituted for a third Gen-3 goggle (the reference goggle in this model) to calculate the errors caused by the different goggle spectral responsivities. The calculations showed that the goggle measurement errors can change up to 20 % for no-moon and 54 % for full-moon night sky distributions when different goggles of the same type (uncalibrated in the model) are substituted for the reference goggle. The reason for these errors is the spectral mismatch between the two “test” goggles and the reference goggle. Suggestions are made to decrease the spectral mismatch between calibration and applications for both the source distributions and the goggle spectral responsivities. In order to decrease goggle measurement errors, it is suggested to use several LEDs with different distributions in the test sets instead of the 815 nm LED. Since the full-moon and no-moon night sky distributions are very different, and all application distributions are between these two extreme distributions, the best results can be obtained if the LED distributions in the test sets will mimic (roughly) the no-moon distribution. This distribution has the lowest irradiance where large measurement uncertainties cannot be allowed to
Proc. of SPIE Vol. 6737 67370M-15
Downloaded from SPIE Digital Library on 12 Feb 2010 to 129.6.147.88. Terms of Use: http://spiedl.org/terms

perform safe goggle operations. The goggle measurement uncertainties can be allowed to be higher at other night sky radiations where the signals are much higher and increased measurement uncertainty is less of a problem. A broad-band correction factor was introduced for goggle calibrations (to further decrease measurement uncertainties) for applications where the spectral responsivity of the applied (test) goggle is different than that of the standard. Geometrical considerations have also been discussed to decrease uncertainties in the radiance responsivity transfer. The design of a simplified radiance measuring input optics was discussed with improved out-of-target rejection. The results of angular responsivity measurements illustrate the optimum radiance measurement angles and the improved radiance measuring characteristics of the NIST developed transfer standard radiometers.
5. ACKNOWLEDGEMENTS
The author thanks the U.S. Navy for funding the development of the NV Radiometer Calibration Facility, C. Randy Lustenberger for making the drawing of the NV radiometer front-head, Irena Fryc for participating in the model spread-sheet calculations, and Joe Velasquez for his fruitful discussions on goggle and test-set calibrations.
REFERENCES 1. MIL-STD-3009, Department of Defense Interface standard for Lighting, Aircraft, Night Vision Imaging
System (NVIS) Compatible, 2 February, 2001. 2. MIL-L-85762A, Military specification for Lighting, Aircraft, Interior, Night Vision Imaging System (NVIS)
Compatible, 26 August, 1988. 3. Bender, E.J., Personal communication, U.S. Army Night Vision and Electronic Sensors Directorate, Imaging
Technology Branch, Science and Technology Division, Fort Belvoir, VA 22060-5806, 2007. 4. Littleton, R., Personal communication, Night Vision and Electronic Sensors Directorate, Fort Belvoir, VA
22060-5806, 2007. 5. Disclaimer, The mention of certain commercial products in this paper is for information purposes only and
does not constitute an endorsement of the product by the author or his institution. 6. Task, H.L. and Marasco, P.L., The impact of changing night-vision goggle spectral response on night-vision
imaging system lighting compatibility. SPIE proceedings, 2004. 5442. 7. Eppeldauer, G.P., et al., Improved accuracy photometric and tristimulus-color scales based on spectral
irradiance responsivity. Proc. of 25th Session of the CIE, 2003. 1: p. D2-30 to D2-33. 8. U.S.patent 20050194516, , Programmable LED spectral light source. 2007. 9. Brown, S.W., Santana, C., and Eppeldauer, G.P., Development of a Tunable LED-based Colorimetric Source.
J. Res. NIST, 2002. 107(4): p. 363-371. 10. Eppeldauer, G. and Hardis, J.E., Fourteen-decade photocurrent measurements with large-area silicon
photodiodes at room temperature. Applied Optics, 1991. 30: p. 3091-3099. 11. Brown, S.W., Eppeldauer, G.P., and Lykke, K.R., Facility for Spectral Irradiance and Radiance Responsivity
Calibrations using Uniform Sources (SIRCUS), Applied Optics, 2006. 32: p. 8218-8237. 12. Larason, T.C., Bruce, S.S., and Parr, A.C., Spectroradiometric detector measurements. NIST Special
Publication, 1998. 250-41. 13. Eppeldauer, G., Racz, M., and Larason, T., Optical Characterization of Diffuser-input Standard Irradiance
Meters. SPIE proceedings, 1998. 3573: p. 220-224. 14. Ohno, Y., NIST measurement services: Photometric calibrations. NIST Spec. Publ., 1997. 250-37.
Proc. of SPIE Vol. 6737 67370M-16
Downloaded from SPIE Digital Library on 12 Feb 2010 to 129.6.147.88. Terms of Use: http://spiedl.org/terms