unilever pakistan foods limited annual report 2012 · 2020-03-08 · fatima jinnah road karachi -...
TRANSCRIPT

Unilever Pakistan Foods LimitedAvari Plaza, Fatima Jinnah Road, Karachi-75530, T: +92 21 35660062-9 F: +92 21 35681705www.unileverpakistan.com.pkwww.unileverpakistanfoods.com.pk
Creating a better future every day
ANNUAL REPORTUnilever Pakistan Foods Limited
2012
J W T

At Unilever all business activities are carried out in a socially and environmentally responsible manner. To promote a greener Pakistan and as a tangible demonstration of our commitment, this annual report has been printed on 100% recycled paper and the information has been limited to financial statements only. Further information on our brands, business and corporate social responsibil ity init iatives is available on our website. www.unileverpakistanfoods.com.pk
Knorr
Unilever Food Solutions
Rafhan
Examples of OurBrands DeliveringSustainable Growth
Goes to extraordinary lengths to provide great-tasting products which help people to prepare delicious and nutritious meals for their families every day.
Uses ingredients and packaging that are sustainably sourced, generate less waste and consume less energy as part of our environmentally responsible way of doing business.
From the highly nutritious and healthy Corn Oil to the lip smacking Desserts, Rafhan offers a complete meal package to the consumers.

Contents
Vision
We work to create a better future every day.
We help people feel good, look good and get more out of life with brands and services that are good for them and good for others. We will inspire people to take small every day actions that can add up to a big difference in the world. We will develop new ways of doing business with the aim of doubling the size of our company while reducing our environmental impact.
Unilever Pakistan Foods Limited Annual Report 2012 3
VisionCore ValuesCompany InformationDirectors’ ProfileMajor Events and LaunchesDirectors’ ReportBoard Meetings AttendanceBoard Committee MeetingsPerformance Indicators for 6 yearsBalance Sheet - Analysis for 6 yearsProfit & Loss - Analysis for 6 yearsStatement of Value Addition and its Distribution Pattern of ShareholdingStatement of Compliance with the Code of Corporate GovernanceAuditors’ Review Report Financial StatementsNotice of Annual General MeetingForm of Proxy
0304050608132021232628
3031
34363977

Company InformationBoard of DirectorsMr. Ehsan A. MalikChairman
Ms. Fariyha SubhaniChief Executive Officer
Mr. Imran HusainExecutive Director / Chief Financial Officer
Mian Zulfikar H. MannooNon-Executive Director
Mian M. Adil MannooNon-Executive Director
Mr. Kamal MonnooNon-Executive Director
Mr. Badaruddin F. VellaniNon-Executive Director
Ms. Shazia SyedExecutive Director
Mr. Noman A. LutfiExecutive Director
Audit CommitteeMian Zulfikar H. MannooChairman
Mian M. Adil MannooMember
Mr. Noman A. LutfiMember
Mr. Azhar ShahidSecretary & Head of Internal Audit
Share Registration OfficeFamco Associates (Pvt) LimitedState Life Building No. 1-AI.I. Chundrigar RoadKarachi.
Website Addresswww.unileverpakistan.com.pkwww.unileverpakistanfoods.com.pk
AuditorsMessrs A. F. Ferguson & Co.Chartered AccountantsState Life Building No. 1-CI.I. Chundrigar RoadKarachi.
Registered OfficeAvari PlazaFatima Jinnah RoadKarachi - 75530
Company SecretaryMr. Amar Naseer
Bringing out the Best in All of Us
We are empowered leaders,who are inspired by new
challenges and have a biasfor action.
Wowing ourConsumers & CustomersWe win the hearts and minds of ourconsumers and customers.
ImpeccableIntegrityWe are honest, transparentand ethical in our dealingsat all times.
Demonstrating aPassion for WinningWe deliver what we promise.
Living anEnterprise CultureWe believe in trust, truth and outstanding teamwork. We value a creative & fun environment.
Making a Better World
We care about and activelycontribute to the community in
which we live.
Core Values
Unilever Pakistan Foods Limited Annual Report 2012 5

Directors’ Profile
Ehsan joined the Board on August 31, 2006 and is also the Chairman and CEO of Unilever Pakistan Limited. Prior to this, Ehsan was Chairman and CEO of Unilever Sri Lanka Limited. His earlier international appointments covered Unilever’s regional business in Egypt, Lebanon, Jordan, Syria and Sudan as well as Unilever’s Head Office in the UK. Ehsan is a Fellow of the Institute of Chartered Accountants in England and Wales and alumni of the Wharton and Harvard Business Schools.
1 Ehsan A. Malik Chairman
Fariyha joined the Board on January 31, 2009 as Chief Executive Officer. She also holds Directorship of Unilever Pakistan Limited. Fariyha joined Unilever as a management trainee in 1989 and later worked with several Home and Personal Care categories. Before being deputed as Marketing Director Foods including Beverages and Ice Cream, she spent 4 years in Bangkok working for Unilever Asia.
2 Fariyha Subhani CEO
Adil joined the Board on May 5, 2002 as a Non-Executive Director. He is also the Member of the Audit Committee of Unilever Pakistan Foods Limited. He holds directorship in Rafhan Maize Products Limited and is in the business of textile trade as the sole proprietor of HN Enterprises.
5 M. Adil Mannoo
Imran joined the Board on April 20, 2008 and is currently Vice President (VP) Finance and Chief Financial Officer of Unilever Pakistan Limited and Unilever Pakistan Foods Limited. He also holds Directorship in Lever Chemicals (Private) Limited, Lever Associated Pakistan Trust (Private) Limited and Unilever Birds Eye Foods Pakistan (Private) Limited. Previously Imran has served as Corporate Finance Head, Treasurer and Commercial Manager for Ice Cream.
3 Imran Husain CFO
Badaruddin joined the Board on May 5, 2002. Currently, he is enrolled as an Advocate of the Supreme Court of Pakistan and is a partner in the law firm ‘Vellani & Vellani’. In addition to his legal practice, Badaruddin is a member of the Board of Directors in several multinational companies covering the FMCG, manufacturing, medical and philanthropy sectors.
7 Badaruddin F. Vellani
Shazia joined the Board on January 21, 2010 and is also a Director of Unilever Pakistan Limited. During her tenure in Unilever she was seconded to Vietnam in December 2000 for three years where she worked as a Business Unit Leader in the Personal Care Unit. In 2004, she returned to Pakistan as VP Home and Personal Care, before she took up her current position as VP Customer Development in 2009.
8 Shazia Syed
Noman joined the Board in June 2012 as Manufacturing Director Supply Chain. In his 20 year stint with the Company, Noman has spent 11 years in factories of HPC and Foods in various roles and spent 9 years in different roles at the Head Office. The sub functions covered for Supply Chain by Noman are Quality, Operations, Manufacturing, Safety and Environment, Research and Development, Planning, Customer Service and Logistics.
9 Noman A. Lutfi
Kamal joined the Board on December 19, 2006 as a Non-Executive Director. He is also the Member of the Human Resource & Remuneration Committee of Unilever Pakistan Foods Limited. He holds directorships in Samira Fabrics (Pvt) Limited, Pakland Chemical Industries (Pvt) Limited, Kaarvan Crafts Foundation and Institute of Public Policy and Islamabad Policy Research Institute.
6 Kamal Monnoo
Zulfikar Joined the Board when the Company was formed. He is also the Chairman of the Audit Committee and the Human Resource & Remuneration Committee of Unilever Pakistan Foods Limited. He is a Director in Rafhan Maize Products Limited and is also the Chief Executive of Pakwest Industries (Private) Ltd., Lahore.
4 Zulfikar H. Mannoo
2
4
1
3
5 6
7
8
Unilever Pakistan Foods Limited Annual Report 2012 76 Unilever Pakistan Foods Limited Annual Report 2012
9

Major Events & Launches
Unilever Food SoutionsProfessional Competetion
Unilever Food Solutions“Wise up on Waste”
Knorr - New Packaging
Knorr Noodle Gang kay Adventures
For a mother, the dinner table becomes a battleground to ensure her child not only eats the meal, but also enjoys it. Her children love the taste of chicken but she can’t afford to make it every day. Keeping this in mind, Chef Testimonials on making every day dishes special with Knorr Chicken Cubes were developed through short quick recipes. This aimed to provide mothers the inspiration to create great tasting regular home dishes by showing her how simple and easy it is.
Unilever Food Solutions (UFS) hosted the professional competition among the Food Service Industry for the 4th consecutive year with Chef of the Year 2012. The title was won by Muzzamil Hussain, Executive Chef, Marriott Hotel, Islamabad. He also represented Pakistan in UFS South Africa Chef competition held in September 2012.
UFS focused on the Service Brand - Your kitchen in 2012 with the message of “Wise up on Waste”. Working sessions were conducted with customers across the Hotel Restaurant and Catering channel in Karachi, Lahore & Islamabad helping the participants understand the significance of managing their waste wisely and its impact on their business’ profitability.
Unilever Food Solutions launched its Knorr portfolio in Eurocontainers in 2012. The new packaging offers tamper proof seal that ensures quality and flavor retention while providing better shelf visibility. The on pack communication also includes recipe hints, nutritional table and yields and servings providing professional products and services to Chefs to deliver their best every day.
Staying true to its fun proposition, Knorr Noodles launched ‘Knorr Noodle Gang kay Adventures’ in 2012. This is a locally produced animation series taking kids into an adventure filled world through dramatic story telling and out of the box education. The compelling characters with celebrity voiceovers and exciting animations make Knorr Noodles a distinctively fun brand for children.
Rafhan - New PackagingIn 2012 Rafhan was relaunched with a complete packaging renovation. The idea was to give the brand a premium look and improve its visibility on shelf. The new packaging was communicated to consumers through a TVC built on the birthday platform reinforcing the brand’s positioning, ‘Rafhan makes birthday special’.
Knorr Chicken Cubes

Directors’ Report

Directors’ Report

We have some of the world’s best known and most trusted brands, with
leadership positions in many of the fast moving consumer
goods’ categories in which we compete. Committed to
enhancing the quality of life of the people of Pakistan, we aim to offer a broad portfolio
that appeals to diverse consumers year on year.
Winning with Brandsand Innovations
Directors’ Report
Key Financial Indicators
Key Non-financial Indicators
Underlying sales growth
19%
Total recordable accident frequency rate (per 1m hours worked)
0.21
Gross margin downby
96 bps
Earning per Share
16%
2011: 0.48
Sulphur oxides per ton of production
(Kg)
0.222011: 0.31
Energy per ton of production (GJ)
2.232011: 2.48
Waste per ton of production (Kg)
0.412011: 0.91
Water wasted per metric ton
2.892011: 3.30
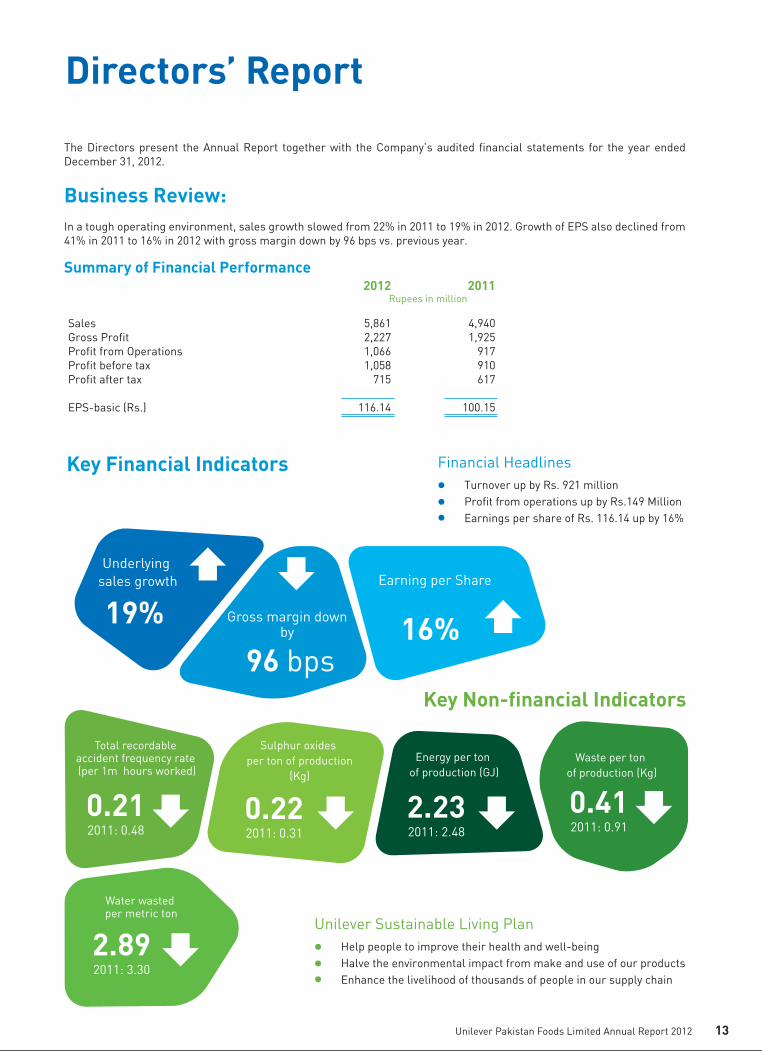
Turnover up by Rs. 921 millionProfit from operations up by Rs.149 MillionEarnings per share of Rs. 116.14 up by 16%
Financial Headlines
Help people to improve their health and well-beingHalve the environmental impact from make and use of our products Enhance the livelihood of thousands of people in our supply chain
Unilever Sustainable Living Plan
The Directors present the Annual Report together with the Company’s audited financial statements for the year ended December 31, 2012.
Business Review:In a tough operating environment, sales growth slowed from 22% in 2011 to 19% in 2012. Growth of EPS also declined from 41% in 2011 to 16% in 2012 with gross margin down by 96 bps vs. previous year.
Summary of Financial Performance
SalesGross ProfitProfit from OperationsProfit before taxProfit after tax
EPS-basic (Rs.)
5,8612,2271,0661,058
715
116.14
4,9401,925
917910617
100.15
2012 2011Rupees in million
Unilever Pakistan Foods Limited Annual Report 2012 13
We have some of the world’s best known and most trusted brands, with
leadership positions in many of the fast moving consumer
goods’ categories in which we compete. Committed to
enhancing the quality of life of the people of Pakistan, we aim to offer a broad portfolio
that appeals to diverse consumers year on year.
Winning with Brandsand Innovations
Directors’ Report
Key Financial Indicators
Key Non-financial Indicators
Underlying sales growth
19%
Total recordable accident frequency rate (per 1m hours worked)
0.21
Gross margin downby
96 bps
Earning per Share
16%
2011: 0.48
Sulphur oxides per ton of production
(Kg)
0.222011: 0.31
Energy per ton of production (GJ)
2.232011: 2.48
Waste per ton of production (Kg)
0.412011: 0.91
Water wasted per metric ton
2.892011: 3.30
Turnover up by Rs. 921 millionProfit from operations up by Rs.149 MillionEarnings per share of Rs. 116.14 up by 16%
Financial Headlines
Help people to improve their health and well-beingHalve the environmental impact from make and use of our products Enhance the livelihood of thousands of people in our supply chain
Unilever Sustainable Living Plan
The Directors present the Annual Report together with the Company’s audited financial statements for the year ended December 31, 2012.
Business Review:In a tough operating environment, sales growth slowed from 22% in 2011 to 19% in 2012. Growth of EPS also declined from 41% in 2011 to 16% in 2012 with gross margin down by 96 bps vs. previous year.
Summary of Financial Performance
SalesGross ProfitProfit from OperationsProfit before taxProfit after tax
EPS-basic (Rs.)
5,8612,2271,0661,058
715
116.14
4,9401,925
917910617
100.15
2012 2011Rupees in million
Unilever Pakistan Foods Limited Annual Report 2012 13

DividendsThe Board of Directors has recommended a final cash dividend of Rs 66 per share. With the interim dividend of Rs. 50 per share already paid during the year, the total dividend for the year 2012 amounts to Rs. 116 (2011: Rs. 100) per ordinary share of Rs. 10 each.
The key business milestones for 2012 were:
Knorr, Unilever’s largest selling global brand grew by 46% - one of the highest growth rates in recent years. This was primarily led by Cubes and Noodles. The re-launch of Soupy Noodles “khao peo, peo khao” campaign helped increase the brand’s penetration among kids. Soups and Sauces also continued their growth momentum in 2012.
Rafhan, Unilever Pakistan Foods Limited’s largest local jewel with strong brand equity and a rich heritage grew steadily on the back of its desserts portfolio. The desserts portfolio was re-launched in a new carton format to allow for more convenience and an even better quality to its loyal consumer base. The advertising campaign continued to leverage its celebration platform which has proved to be popular with children as it focused on birthday celebrations of loved ones.
Energile, a local brand, is a flavored glucose based powder drink which has been in the market for several decades. It addresses the need for instant energy in active kids and sportsmen. The brand remained under pressure in 2012 as the market for powder drinks struggles to maintain its relevance in the evolving beverages market.
Glaxose-D is a fifty year old brand that has been a source of rapidly absorbed energy fortified with Vitamin-D, Calcium and Phosphorus. The brand has a strong positioning in the health and wellness segment of the market. The year 2012 saw the brand increase its penetration reaching out to many additional towns by several promotional activities. However, it faces stiff challenges amid declining market.
Exports segment of the business continued to expand its base as it explored new markets for categories offering ethnic taste and ‘Halal’ food. It served markets in mainly North America, Europe & Asia with quality products including Noodles, Cooking Aids, Soups and Desserts.
Our PeopleUnilever Pakistan Foods Limited takes pride in the courage and ability of its people to deliver ambitious results in a consistent manner. The Company continues to hold the “Employer of the Year Award” for past 5 years in a row.
The Standards of Leadership (SOL) of the Company, i.e. a set of behaviours that are deemed vital to be a good leader, are ingrained strongly in our people. Personal development is facilitated through empowering people with bigger as well as challenging assignments, coaching, mentoring and the appraisal system. This investment in our people is what will set us apart in the industry and drive us towards our goals with the right people on board.
The Company encourages its employees to work from agile locations and offer flexi-work hours. Diversity is at the heart of our agenda with females performing various roles across different functions in the Organization. In order to cater to the needs of the female employees, the Unilever Day Care centre was started in 2003 and is now also used by male employees, whose spouses work elsewhere.
There is continued focus on encouraging healthy life and work life balance among the employees. The Company has taken several initiatives in this regard e.g. vitality health passport, gym facility and healthy eating options available in the office.
Unilever Pakistan Foods Limited is a learning organization where employees are continuously groomed to challenge themselves and make real time decisions. The Company leverages the global Unilever Network to develop talent in Marketing, Sales, Supply Chain, Finance and Human Resource Management through our E-learning programmes.
Corporate Social Responsibility (CSR) Unilever Pakistan Foods Limited is a multi-local multinational which believes that the highest standards of corporate behaviour are essential to long term success. To achieve our sustainability targets we launched the Unilever Foundation in 2012, which has been working alongside the Unilever Sustainable Living Plan launched in 2011.
The Unilever Foundation is a key action we are taking to help meet our ambitious goal of helping more than one billion people improve their health and well-being and, in turn, create a sustainable future with our 5 global partners; UNICEF, United Nations World Food Programme, Save the Children, Population Services International and Oxfam. Unilever Pakistan partners with both local and global partners in order to execute its sustainability agenda.
During 2012, our main initiatives included:
i. Energy Conservation:
The Company Head Office achieved “WWF Green Office” certification based on its sustainability initiatives through a structured program of measuring, monitoring and reducing energy, paper consumption and waste segregation. The program delivered 24% energy reduction in 2012 as compared to last year.
Additionally a number of initiatives have been taken in factories, depots and in transportation to conserve energy. Some of these are:
a. Using day light in production hall.
b. Phasing out window air conditioners and use of eco-efficient lighting at the offices.
c. Engineering improvements in manufacturing for reducing energy waste.
d. Shut down of ketchup chillers in winter season & temperature optimisation in compressors.
e. Department wise energy measurement.
ii. Environmental Protection Measures:
Unilever Sustainable Living Plan (USLP), launched in 2011, has been a key enabler across the entire value chain for pursuing Company’s audacious growth ambition in an environmentally responsible manner. The key environmental protection initiatives include:
a. Distribution Centre rationalization & cross docking
b. Using the ‘right sized’ vehicles for each route.
c. Optimization of vehicle routes as per vehicle load.
d. Reducing travel related environmental footprint by investment in technology e.g. teleconferencing, live meetings & Skype etc.
e. Installing MEK recovery unit to reduce hazardous waste by re-using ink from inkjet printers.
f. Dry floor initiatives for reducing water waste in floor wash.
g. Recycling treated water for watering factory green belts & wash rooms.
h. Eliminating 47 tons packaging material through structure optimisation & right sizing of packs.
iii. Community Investment and Welfare Schemes: Rs. 3.6 million
a. Unilever Pakistan Foods Limited factory started a Rs. 5 million safe drinking water project in partnership with Pakistan Poverty Alleviation Funds in Purnawan, Bhai Pheru (Rs. 1.6 million
Unilever Pakistan Foods Limited Annual Report 2012 1514 Unilever Pakistan Foods Limited Annual Report 2012

contributed in 2012 towards the completion of the project and community mobilization).
b. Knorr partnered with Idara-e-Taleem-O-Aagahi to create awareness about healthy eating habits amongst 200,000 school-going children across Pakistan. Knorr also held activities in these schools through their interactive books for primary students, developed in partnership with Zindagy Trust in their effort of making education fun. During the year, Rs. 2 million has been contributed to this scheme.
iv. Consumer Protection Measures:
The Company operates a complaints call centre called Raabta to receive consumer feedback. It is engaged in raising awareness of and addressing the growing menace of counterfeiting.
v. Occupational Safety and Health:
Unilever Pakistan Foods Limited places Safety, Health and Environment (SHE) at the heart of its business agenda. Unilever Pakistan Foods Ltd’s management has been continually improving its management system & standards not only at workplace but also through “Off-The-Job Safety” initiative to inculcate this consciousness amongst its employees round the clock.
The management has instituted Central Safety Health & Environment Committee (CSHEC) structure, represented by all MC members, to review performance and provide policy guidelines.
Key initiatives are “Safety Programmes for Transport and Market Activation Service Providers” & “SEDEX” certification audits for key suppliers and co-packers. Internally it also initiated the motivational drives i.e. “Family Safety Mela”, “Safety Week” and the
“Wellness Week” for employee engagement and to raise awareness of key issues.
Road Safety remains a key pillar of Company’s safety systems and initiatives of “Defensive Driving”, “Behavioural Risk Assessment” and “Route Risk Assessments” were the key building blocks to pro-actively identify and manage driving-related risks. Based on these initiatives, Pakistan was given a leadership role to drive Unilever’s “Safe Travel Programme” across South Asia.
All above initiatives are paying dividends, the Company has been a significant contributor in the South Asia cluster by achieving 56% reduction in injury rate in 2012 as compared to 2011 and achieved the best safety performance for the second consecutive year in the cluster.
vi. Business Ethics and Anti-Corruption Measures:
Unilever Pakistan Foods Limited holds frequent activities to ensure that the employees are working within the Code of Business Principles (CoBP). The CoBP is rigorously followed throughout the organization. Employees are also required to sign off compliance of CoBP annually.
vii. Contribution to National Exchequer:
Unilever Pakistan Foods Limited contributed Rs. 1,317 million (2011: Rs. 1,321 million) of its value added to the national exchequer by way of import duties, general sales tax, income tax and other government levies.
Employee Involvement Community and environment support at Unilever Pakistan Foods Limited is extended through Company initiatives for its people. Our employees work with various organizations giving monetary as well as skill support. Contributions through the Employee Payroll Programme were collected for Aga Khan University Hospital, The Citizens Foundation and UN World Food Programme. Value of Investments of Employees in Retirement Funds Unilever Pakistan Foods Limited contributed Rs. 51.5 million to the staff retirement funds during the year. The cost of investments made by the staff retirement funds operated by the Company as at December 31, 2012 is as follows:
Corporate GovernanceThe management of Unilever Pakistan Foods Limited is committed to good corporate governance and complying with the best practices. As required under the Code of Corporate Governance, the Directors are pleased to state as follows:
• The financial statements prepared by the management of the Company present fairly its state of affairs, the result of its operations, cash flows and changes in equity.
• Proper books of account of the listed Company have been maintained.
• Appropriate accounting policies have been consistently applied in preparation of financial statements and accounting estimates are based on reasonable and prudent judgement.
• International Financial Reporting Standards have been followed in preparation of financial statements and any departure there from has been adequately disclosed.
• The system of internal control is sound in design and has been effectively implemented and monitored. The Audit Committee comprises of three directors including two non-executive directors representing minority interest.
• There are no significant doubts upon the Company's ability to continue as a going concern.
• There has been no departure from the best practices of corporate governance, as detailed in the listing regulations.
• Statements regarding the following are annexed or are disclosed in the notes to the financial statements:
• Number o f Board meet ings he ld and attendance by directors.
• Key financial data for the last six years.
• Pattern of shareholding.
• Dealing in shares of the Company by its Directors, Chief Executive, Chief Financial Officer and Company Secretary and their spouses and minor children.
DirectorsThe election of directors was held in AGM of 2011. During the year 2012, Mr. M. Qaysar Alam retired and Mr. Noman Amjad Lutfi was appointed in his place. The term of present directors will expire on April 19, 2014.
AuditorsThe retiring auditors A. F. Ferguson & Co. Chartered Accountants being eligible offer themselves for reappointment.
Audit CommitteeThe Board of Directors has established an Audit Committee in compliance with the Code of Corporate Governance.The Audit Committee reviewed the quarterly, half-yearly and annual financial statements before submission to the Board and their publication. The Audit Committee had detailed discussions with the external auditors on various issues, including their letter to the management. The Audit Committee also reviewed internal auditors’ findings and held separate meetings with internal and external auditors as required under the Code of Corporate Governance.
Holding CompanyThrough its wholly owned subsidiary M/s Conopco Inc. USA, Unilever N.V., a company incorporated in Holland, has a holding of 75.85% of the shares in Unilever Pakistan Foods Limited.
Rs. in million
110.230.1
Provident Fund Superannuation FundTotalTotal - 2011
Unilever Pakistan Foods Limited Annual Report 2012 1716 Unilever Pakistan Foods Limited Annual Report 2012
140.3199.9

Reserve Appropriations
Balance as at January 01, 2012 Total comprehensive income for the year Final dividend for the year ended December 31, 2011 @ Rs. 50 per share Interim dividend for the year ended December 31, 2012 @ Rs. 25 per share
Second Interim dividend for the year ended December 31, 2012 @ Rs. 25 per share Balance as at December 31, 2012
61,576
-
-
-
- 61,576
24,630
-
-
-
-
24,630
628
- -
-
-
628
138
-
-
-
-
138
404,563
715,172
(307,880)
(153,941)
(153,941)
503,973
491,535
715,172
(307,880)
(153,941)
(153,941)
590,945
Capital
Share Premium
Special General Unappropriatedprofit
Revenue
Reserves TotalShare Capital
Acknowledgement
Our people are the key drivers behind the sustained growth of Unilever Pakistan Foods Limited. The Directors acknowledge the contribution of each and every employee of the Company. We would also like to express our thanks to our consumers for the trust shown in our products. We are also grateful to our shareholders for their support and confidence in our management.
Future OutlookThe business aims to continue on its journey of profitable growth. This will not be easy due to various external challenges i.e. law and order conditions, currency depreciation, inflationary pressure, employee attrition, poor GDP growth and competitive intensity. Our understanding of consumers, access to Unilever’s global expertise, R&D Capability / Innovations and better customer service will help us to counter the aforementioned challenges. Besides, we will continue to provide our consumers with better value products driven by strong brand equity. As a means to achieve this, we will also leverage our ability to attract, develop and retain the best talent in the country.
Thanking you allOn behalf of the Board
Fariyha SubhaniChief Executive
KarachiFebruary 21, 2013
Unilever Pakistan Foods Limited Annual Report 2012 1918 Unilever Pakistan Foods Limited Annual Report 2012
(Rupees in thousand)

Notes :* Meetings held during the period when concerned Director was on the Board.** Resigned in May 2012.*** Appointed in June 2012, against casual vacancy on the Board.
Board Meetings Attendance
During the year 2012, four Board Meetings were held and the attendance of each director is given below:
Mr. Ehsan A. Malik
Ms. Fariyha Subhani Mr. Imran Husain
Mian Zulfikar H. Mannoo Mian M. Adil Mannoo
Mr. Kamal Monnoo
Mr. Badaruddin F. Vellani
Mr. M. Qaysar Alam **
Ms. Shazia Syed Mr. Noman A. Lutfi ***
Directors Total No. of Meetings Held * No. of Meetings attended
4
4
4
3
4
4
3
2
4
2
4
4
4
4
4
4
4
2
4
2
Unilever Pakistan Foods Limited Annual Report 2012 2120 Unilever Pakistan Foods Limited Annual Report 2012
Board Committee Meetings Held During The Year
4
4
2
2
4
3
4
2
2
4
Mian Zulfikar H. MannooChairman
Mian M. Adil MannooMember
Mr. M. Qaysar Alam **Member
Mr. Noman A. Lutfi ***Member
Mr. Azhar ShahidSecretary
Committee has been constituted by the Board in compliance with Listing Regulations. The Committee oversees the Internal Audit function, and also reviews audit plans and reports. The Committee conducts its meetings as and when required. The Committee appraises the Board about the significant discussions and decisions at its meetings and recommendations in respect of Company’s operations and financial results.
The Committee comprises of three members, two of whom are Non-Executive Directors. All employees of the Company have access to the Committee. The Committee met four times during 2012. Minutes of the meetings are drawn up expeditiously and circulated for the information and consideration of the Board.
Audit Committee
Terms of Reference
Name of Member Total No. of Meetings Held * No. of Meetings Attended
Notes:* Meetings held during the period when concerned Member was in the Committee.** Resigned in May 2012.*** Appointed in June 2012.
Notes:* Meetings held during the period when concerned Member was in the Committee.** During the year Mr. Noman A. Lutfi has been appointed in place of Mr. M. Qaysar Alam.
Committee of Directors
Ms. Fariyha SubhaniChairperson
Mr. Imran HusainMember
Mr. M. Qaysar Alam **Member
Ms. Shazia SyedMember
Mr. Noman A. Lutfi **Member
Mr. Amar NaseerSecretary
Name of Member Total No. of Meetings Held * No. of Meetings Attended
8
8
4
8
4
8
8
8
4
8
4
8
Property, plant and equipmentOther non-current assetsCurrent assets Total assets
Share capital - ordinaryReserves Total equity
Non-current liabilitiesCurrent liabilities Total liabilities
Total equity and liabilities
Net current (liabilities) / assets
649,333 107,574
1,248,575 2,005,482
61,576 529,369 590,945
111,822 1,302,715 1,414,537 2,005,482
(54,140)
620,702 110,152
1,036,314 1,767,168
61,576 429,959 491,535
104,529 1,171,104 1,275,633
1,767,168
(134,790)
300,726 83,922
704,825 1,089,473
61,576 342,819 404,395
38,182 646,896 685,078
1,089,473
57,929
288,872 85,281
600,683 974,836
61,576 207,080 268,656
25,497 680,683 706,180
974,836
(80,000)
307,707 191,469 516,437
1,015,613
61,576 239,647 301,223
42,079 672,311 714,390
1,015,613
(155,874)
196,350 197,780 552,418 946,548
61,576 137,406 198,982
13,926 733,640 747,566
946,548
(181,222)
Net salesCost of salesGross profitOperating profitProfit before taxProfit after taxCash ordinary dividends
5,861,096 (3,633,950)
2,227,146 1,066,432 1,058,366
715,172 614,356
4,940,251 (3,015,502)
1,924,749 916,995 910,132 616,695 529,800
4,040,887 (2,506,003)
1,534,884 658,308 645,859 437,463 301,517
3,376,511 (2,122,144)
1,254,367 264,173 241,656 176,792 208,610
3,081,879 (1,874,921)
1,206,958 552,544 530,311 348,546 246,250
2,376,408 (1,489,985)
886,423 352,872 346,074 224,492 584,295
Operating activitiesInvesting activitiesFinancing activitiesCash and cash equivalents at the end of the year
806,912 (54,237)
(614,356)137,005
964,204 (345,950) (529,800)
(1,314)
368,273 (48,445)
(301,517)(89,768)
351,377 (16,277)
(208,610)(108,079)
483,313 (125,416) (246,250)(234,569)
167,192 (100,579) (584,925)(346,216)
Performance Indicators for 6 years
2012 2011 2010
(Rupees in Thousand)
2009 2008 2007
Unilever Pakistan Foods Limited Annual Report 2012 2322 Unilever Pakistan Foods Limited Annual Report 2012
The Committee comprises of four members and is chaired by the CEO. Periodic meetings are held to facilitate handling ofoperational matters, share transfer and any other significant matters arising during the normal course of businessoperations.
Terms of Reference
The Committee has been constituted by the Board to recommend human resource management policies to the Board and fulfill the requirements of the Code of Corporate Governance. It comprises of three members, two of whom are Non-Executive Directors. The Chairman of the Company is also a member of the Committee.
Terms of Reference
Mian Zulfikar H. MannooChairman
Mr. Kamal MonnooMember
Mr. Ehsan A. MalikMember
Mr. Amar NaseerSecretary
Human Resource & Remuneration Committee
Name of Member Total No. of Meetings Held * No. of Meetings Attended
Note:* Meeting held subsequently, prior to the Meeting of the Board of Directors.
1
1
1
1
1
1
1
1
FINANCIAL POSITION
Balance sheet
Profit and loss
Cash flows
OPERATING AND FINANCIAL TRENDS

Unilever Pakistan Foods Limited Annual Report 2012 2524 Unilever Pakistan Foods Limited Annual Report 2012
Gross profit ratioNet profit to salesEBITDA margin to salesOperating leverage ratioPre Tax return on equityPost tax return on equityReturn on capital employed
Times%%%%%%
0.3812.2018.99
0.86179.10121.02101.77
0.3912.4819.40
1.72185.00125.00103.00
0.3811.0017.00
7.45160.00108.00
88.20
0.375.24
12.00(5.20)89.9565.8137.00
0.3911.3119.00
1.90176.05115.71
63.00
0.379.45
16.001.00
173.92113.00
40.00
Liquidity Ratios
Current RatioQuick / Acid test ratioCash to current liabilitiesCash flow from operations to sales
TimesTimesTimesTimes
0.960.380.150.14
0.880.360.080.20
1.090.510.120.09
0.880.370.060.10
0.770.220.010.16
0.750.220.020.07
Capital Structure Ratios
Financial leverage ratioInterest cover ratio
TimesTimes
0.10544.03
0.19271.00
0.4271.00
0.5513.00
0.8130.14
-70.31
Investment / Market Ratios
Earnings per share (EPS)Price earning ratioDividend yield ratioDividend payout ratio - earnings Dividend payout ratio - par valueDividend Cover ratioCash dividendMarket Value - lowMarket Value - highMarket Value - year endBreakup value per share without surplus on revaluation of fixed assets
Rs.TimesTimesTimesTimesTimes
Rs.Rs.Rs.Rs.
Rs.
116.1437.02
0.031.00
11.601.00116
1,6154,4104,300
95.96
100.1517.07
0.061.00
10.001.00100
1,0451,8501,710
79.83
71.0415.56
0.061.007.101.00
71816
1,4841,105
65.67
28.7145.82
0.031.183.400.84
341,1401,5771,300
43.63
56.6029.31
0.020.643.601.57
361,3891,8581,659
48.92
36.4636.34
0.072.559.300.39
93516
1,3251,325
32.31
Activity / Operating Performance Ratios
Inventory turnover ratioDebtor turnover ratioCreditor turnover ratioTotal assets turnover ratioFixed assets turnover ratioOperating cycle
DaysDaysDays
TimesTimesDays
6710
11339
35
581189
38
(20)
508
694
13(11)
597
803
12(14)
718
763
103
811280
31213
Unit 2012 2011 2010 2009 2008 2007
Performance Indicators for 6 years Performance Indicators for 6 years
Share Price Trend
516
1389
1140
816 1045
1615 1325
1858
1577 1484
1850
4410
1325
1659
1300
1105
1710
4300
0
500
1000
1500
2000
2500
3000
3500
4000
4500
2007 2008 2009 2010 2011 2012
Rupe
es
Share price-Low Share price-High Share price year end
Comparison of PBT and PAT
346
530
242
646
910
1058
224 349
177
437
617
715
-100
100
300
500
700
900
1100
1300
2007 2008 2009 2010 2011 2012
Rs. i
n M
illio
ns
Profit before tax Profit after tax
Comparison of EPS and DPS
93
36 34
71
100
116
36.4656.60 28.71
71.04
100.15
116.14
0
20
40
60
80
100
120
140
2007 2008 2009 2010 2011 2012
EPS DPS
Rupe
es
%
FINANCIAL RATIOS
Profitability Ratios

Balance Sheet Analysis - Equity & Liabilities Balance Sheet Analysis - Assets
- 500 1,000 1500 2000 2500
2007
2008
2009
2010
2011
2012
Equity
Non-current Liability
Current Liability
- 500 1,000 1500 2000 2500
2007
2008
2009
2010
2011
2012
Fixed assets
Other long term assets
Current assets
Balance Sheet Vertical Analysis for 6 years
2012Rs. %
2011Rs. %
2009Rs. %
2008Rs. %
2007Rs. %
61,576 529,369 590,945
3,922 107,900 111,822
1,213,083 7,508
895 11,692
4,640 64,897
1,302,715 2,005,482
649,333 81,637 22,477
- 3,460
756,907
16,983
750,374 146,113
12,682
39,603 80,918
- 201,902
- -
1,248,575 2,005,482
- 23.1220.22
(77.61)24.01
6.98
17.73(70.92)492.72100.00(77.06)(31.34)
11.2413.49
4.610.00
(12.27)(100.00)
100.003.56
1.6926.50
(22.51)(34.51)
(24.98)180.30
(100.00)116.61100.00100.00
20.4813.49
61,576 429,959 491,535
17,519 87,010
104,529
1,030,383 25,817
151 -
20,227 94,526
1,171,104 1,767,168
620,702 81,637 25,621 2,894
- 730,854
16,700
593,162 188,563 19,366
52,793 28,868 43,650 93,212
- -
1,036,314 1,767,168
- 25.42 21.55
95.98 197.54 173.77
137.94 158.17 (92.52)
- (36.04) (44.46)
81.03 62.20
106.40
- 1,087.81 2,160.94
- 90.01
(4.34) 65.64 95.19 31.66
160.96 199.52 (59.45)
15.88 - -
47.03 62.20
61,576 342,819 404,395
8,939 29,243 38,182
433,047 10,000 2,020
- 31,625
170,204 646,896
1,089,473
300,726 81,637 2,157
128 -
384,648
17,458
358,094 96,606 14,709
20,230 9,638
107,654 80,436
- -
704,825 1,089,473
- 65.55 50.53
11.82 67.07 49.75
(15.45) 100.00 113.08
- 68.42 14.40 (4.96) 11.76
4.10
- (34.42) (63.94)
- 2.81
19.28 7.27
21.29 22.95
12.15
(36.95) 24.35 97.65
- -
17.34 11.76
61,576 207,080 268,656
7,994 17,503 25,497
512,182 -
948 -
18,778 148,775 680,683 974,836
288,872 81,637 3,289
355 -
374,153
14,636
333,840 79,649 11,963
18,039 15,287 86,573 40,696
- -
600,683 974,836
- (13.59) (10.81)
63.51 (52.94) (39.41)
23.22 -
(87.05) -
179.06 (38.67)
1.25 (4.02)
(6.12)
(54.93) (31.99) (93.53)
- (25.05)
6.03
(5.27) 59.37
(36.69)
(47.15) 506.87 135.94 407.30
- -
16.31 (4.02)
61,576 239,647 301,223
4,889 37,190 42,079
415,673 -
7,318 -
6,729 242,591 672,311
1,015,613
307,707 181,145
4,836 5,488
- 499,176
13,804
352,394 49,976 18,897
34,132 2,519
36,693 8,022
- -
516,437 1,015,613
- 74.41 51.38
(14.99) 354.92 202.16
14.36 -
1.44 (100.00) (98.14)
- (8.36)
7.30
56.71
- (18.98) (32.13)
- 26.65
37.70 (6.77)
(43.27) 23.77
122.88 (73.25)
- (50.33)
(100.00) (100.00)
(6.51) 7.30
61,576 137,406 198,982
5,751 8,175
13,926
363,467 -
7,214 592
362,367 -
733,640 946,548
196,350 181,145
5,969 8,086 2,580
394,130
10,025
378,002 88,101 15,268
15,314 9,418
- 16,151 7,994
12,145 552,418 946,548
- (72.40) (64.43)
(18.86) 48.15 10.47
24.64 -
153.84 (97.03)
- -
133.36 6.78
91.92
- 6,682.95 1,130.75
(50.73) 36.17
1.83 35.07 37.06 10.41
23.08
(65.67) -
(90.62) (21.37)
71.90 (7.47)
6.78
Balance Sheet Horizontal Analysis for 6 years
EQUITY AND LIABILITIES
Capital and reserves
Share capitalReserves
Non-current liabilities
Retirement benefits - obligationDeferred taxation
Current liabilities
Trade and other payablesProvisionAccrued interest / mark up Taxation - provision less paymentsSales tax payableShort term borrowings
ASSETS
Non-current assets
Property, plant and equipmentIntangible assetsLong term loansLong term prepaymentRetirement benefit - prepayment
Current assets
Stores and sparesStock in tradeTrade debtsLoans and advancesTrade deposits and short term prepaymentsOther receivablesTaxation - payments less provisionCash and bank balancesAccrued interest / mark up Sales tax refundable
2012 12 Vs.11 2011 11 Vs.10 2010 10 Vs.09 2009 09 Vs.08 2008 08 Vs.07 2007 07 Vs.06 2010Rs. %Rs. Rs. Rs. Rs. Rs. Rs.% % % % % %
61,576 529,369 590,945
3,922 107,900 111,822
1,213,083 7,508
895 11,692
4,640 64,897
1,302,715 2,005,482
649,333 81,637 22,477
- 3,460
756,907
16,983 750,374 146,113
12,682
39,603 80,918
- 201,902
- -
1,248,575 2,005,482
3.07 26.40 29.47
0.20 5.38 5.58
60.49 0.37 0.04 0.58 0.23 3.24
64.96 100.00
32.38 4.07 1.12
- 0.17
37.74
0.85 37.42
7.29 0.63
1.97 4.03
- 10.07
- -
62.26 100.00
61,576 429,959 491,535
17,519 87,010
104,529
1,030,383 25,817
151 -
20,227 94,526
1,171,104 1,767,168
620,702 81,637 25,621 2,894
- 730,854
16,700
593,162 188,563 19,366
52,793 28,868 43,650 93,212
- -
1,036,314 1,767,168
3.48 24.33 27.81
0.99 4.92 5.92
58.31 1.46 0.01
- 1.14 5.35
66.27 100.00
35.12 4.62 1.45 0.16
- 41.36
0.95 33.57 10.67
1.10
2.99 1.63 2.47 5.27
- -
58.64 100.00
61,576 342,819 404,395
8,939 29,243 38,182
433,047 10,000 2,020
- 31,625
170,204 646,896
1,089,473
300,726 81,637 2,157
128 -
384,648
17,458 358,094 96,606 14,709
20,230 9,638
107,654 80,436
- -
704,825 1,089,473
5.65 31.47 37.12
0.82 2.68 3.50
39.75 0.92 0.19
- 2.90
15.62 59.38
100.00
27.60 7.49 0.20 0.01
- 35.31
1.60 32.87 8.87 1.35
1.86 0.88 9.88 7.38
- -
64.69 100.00
61,576 207,080 268,656
7,994 17,503 25,497
512,182 -
948 -
18,778 148,775 680,683 974,836
288,872 81,637 3,289
355 -
374,153
14,636 333,840 79,649 11,963
18,039 15,287 86,573 40,696
- -
600,683 974,836
6.32 21.24 27.56
0.82 1.80 2.62
52.54 -
0.10 -
1.93 15.26 69.83
100.00
29.63 8.37 0.34 0.04
- 38.38
1.50 34.25 8.17 1.23
1.85 1.57 8.88 4.17
- -
61.62 100.00
61,576 239,647 301,223
4,889 37,190 42,079
415,673 -
7,318 -
6,729 242,591 672,311
1,015,613
307,707 181,145
4,836 5,488
- 499,176
13,804 352,394 49,976 18,897
34,132 2,519
36,693 8,022
- -
516,437 1,015,613
6.06 23.60 29.66
0.48 3.66 4.14
40.93 -
0.72 -
0.66 23.89 66.20
100.00
30.30 17.84 0.48 0.54
- 49.15
1.36 34.70 4.92 1.86
3.36 0.25 3.61 0.79
- -
50.85 100.00
61,576 137,406 198,982
5,751 8,175
13,926
363,467 -
7,214 592
362,367 -
733,640 946,548
196,350 181,145
5,969 8,086 2,580
394,130
10,025 378,002 88,101 15,268
15,314 9,418
- 16,151 7,994
12,145 552,418 946,548
6.51 14.52 21.02
0.61 0.86 1.47
38.40 -
0.76 0.06
38.28 -
77.51 100.00
20.74 19.14 0.63 0.85 0.27
41.64
1.06 39.93 9.31 1.61
1.62 0.99
- 1.71 0.84 1.28
58.36 100.00
EQUITY AND LIABILITIES
Capital and reserves
Share capitalReserves
Non-current liabilities
Retirement benefits - obligationDeferred taxation
Current liabilities
Trade and other payablesProvisionAccrued interest / mark up Taxation - provision less paymentsSales tax payableShort term borrowings
ASSETS
Non-current assets
Property, plant and equipmentIntangible assetsLong term loansLong term prepaymentRetirement benefit - prepayment
Current assets
Stores and sparesStock in tradeTrade debtsLoans and advancesTrade deposits and short term prepaymentsOther receivablesTaxation - payments less provisionCash and bank balancesAccrued interest / mark up Sales tax refundable
Rs. in Million
Year
Rs. in Million
Year
Unilever Pakistan Foods Limited Annual Report 2012 2726 Unilever Pakistan Foods Limited Annual Report 2012
(Rs. in thousand) (Rs. in thousand)

Unilever Pakistan Foods Limited Annual Report 2012 2928 Unilever Pakistan Foods Limited Annual Report 2012
Profit and Loss Account Horizontal Analysis for 6 years
Graphical Analysis
100.00
(62.85)
37.15
(23.61)
(1.49)
(3.56)
0.89
9.38
(1.56)
7.82
(0.67)
7.16
(1.92)
5.24
-
5.24
3,081,879
(1,874,921)
1,206,958
(575,726)
(58,021)
(41,603)
20,936
552,544
-
552,544
(22,233)
530,311
(181,765)
348,546
-
348,546
100.00
(60.84)
39.16
(18.68)
(1.88)
(1.35)
0.68
17.93
-
17.93
(0.72)
17.21
(5.90)
11.31
-
11.31
2,376,408
(1,488,073)
888,335
(477,416)
(47,004)
(28,873)
19,742
354,784
-
354,784
(8,710)
346,074
(121,582)
224,492
-
224,492
100.00
(62.62)
37.38
(20.09)
(1.98)
(1.21)
0.83
14.93
-
14.93
(0.37)
14.56
(5.12)
9.45
-
9.45
Sales
Cost of sales
Gross profit
Distribution cost
Administrative expenses
Other operating expenses
Other operating income
Restructuring cost
Profit from operations
Finance cost
Profit before taxation
Taxation
Profit after taxation
Other comprehensive income
Total comprehensive income
5,861,096
(3,633,950)
2,227,146
(1,004,044)
(149,174)
(81,316)
73,820
1,066,432
-
1,066,432
(8,066)
1,058,366
(343,194)
715,172
-
715,172
100.00
(62.00)
38.00
(17.13)
(2.55)
(1.39)
1.26
18.20
-
18.20
(0.14)
18.06
(5.86)
12.20
-
12.20
4,940,251
(3,015,502)
1,924,749
(850,012)
(139,198)
(70,767)
82,582
947,354
(30,359)
916,995
(6,863)
910,132
(293,437)
616,695
-
616,695
100.00
(61.04)
38.96
(17.21)
(2.82)
(1.43)
1.67
19.18
(0.61)
18.56
(0.14)
18.42
(5.94)
12.48
-
12.48
4,040,887
(2,506,003)
1,534,884
(786,593)
(51,547)
(51,810)
23,576
668,510
(10,202)
658,308
(12,449)
645,859
(208,396)
437,463
-
437,463
100.00
(62.02)
37.98
(19.47)
(1.28)
(1.28)
0.58
16.54
(0.25)
16.29
(0.31)
15.98
(5.16)
10.83
-
10.83
3,376,511
(2,122,144)
1,254,367
(797,304)
(50,219)
(120,275)
30,161
316,730
(52,557)
264,173
(22,517)
241,656
(64,864)
176,792
-
176,792
Vertical Analysis for 6 years2012
Rs. %2011
Rs. %2010
Rs. %2009
Rs. %2008
Rs. %2007
Rs. %
(Rs. in thousand)
9.56
13.19
3.93
38.49
(13.45)
189.10
44.06
(42.68)
100.00
(52.19)
1.28
(54.43)
(64.31)
(49.28)
-
(49.28)
3,081,879
(1,874,921)
1,206,958
(575,726)
(58,021)
(41,603)
20,936
552,544
-
552,544
(22,233)
530,311
(181,765)
348,546
-
348,546
29.69
26.00
35.87
20.59
23.44
44.09
6.05
55.74
-
55.74
155.26
53.24
49.50
55.26
-
55.26
2,376,408
(1,488,073)
888,335
(477,416)
(47,004)
(28,873)
19,742
354,784
-
354,784
(8,710)
346,074
(121,582)
224,492
-
224,492
Sales
Cost of sales
Gross profit
Distribution cost
Administrative expenses
Other operating expenses
Other operating income
Restructuring cost
Profit from operations
Finance cost
Profit before taxation
Taxation
Profit after taxation
Other comprehensive income
Total comprehensive income
5,861,096
(3,633,950)
2,227,146
(1,004,044)
(149,174)
(81,316)
73,820
1,066,432
-
1,066,432
(8,066)
1,058,366
(343,194)
715,172
-
715,172
18.64
20.51
15.71
18.12
7.17
14.91
(10.61)
12.57
(100.00)
16.30
17.53
16.29
16.96
15.97
-
15.97
4,940,251
(3,015,502)
1,924,749
(850,012)
(139,198)
(70,767)
82,582
947,354
(30,359)
916,995
(6,863)
910,132
(293,437)
616,695
-
616,695
22.26
20.33
25.40
8.06
170.04
36.59
250.28
41.71
197.58
39.30
(44.87)
40.92
40.81
40.97
-
40.97
4,040,887
(2,506,003)
1,534,884
(786,593)
(51,547)
(51,810)
23,576
668,510
(10,202)
658,308
(12,449)
645,859
(208,396)
437,463
-
437,463
19.68
18.09
22.36
(1.34)
2.64
(56.92)
(21.83)
111.07
(80.59)
149.20
(44.71)
167.26
221.28
147.45
-
147.45
3,376,511
(2,122,144)
1,254,367
(797,304)
(50,219)
(120,275)
30,161
316,730
(52,557)
264,173
(22,517)
241,656
(64,864)
176,792
-
176,792
(Rs. in thousand)2012 12 Vs.11 2011 11 Vs.10 2010 10 Vs.09 2009 09 Vs.08 2008 08 Vs.07 2007 07 Vs.06Rs. % Rs. % Rs. % Rs. % Rs. % Rs. %
Operating Activities
Investing Activities
Financing Activities
Cash Flow Analysis
Profit and Loss Analysis - Income
Sales
Other Income
1,000 2,000 3,000 4,000 5,000 6,000 7,000
2007
2008
2009
2010
2011
2012
Year
s
Rs. in Million
Profit and Loss Analysis - Expenses
Cost of Sales
Distribution
Other Expenses
Finance Cost
Taxation
Profit after Tax
1,000 2,000 3,000 4,000 5,000 6,000 7,000
2007
2008
2009
2010
2011
2012
Year
Rs. in Million
Rs. i
n M
illio
n
(500)
(700)
(300)
(100)
100
300
500
700
900
200720082009201020112012
22.53
23.16
21.48
17.60
21.04
25.80
(36.25)
20.49
-
20.49
100.46
19.29
19.04
19.42
-
19.42

Unilever Pakistan Foods Limited Annual Report 2012 3130 Unilever Pakistan Foods Limited Annual Report 2012
Statement of Value Addition and its Distribution
WEALTH DISTRIBUTION 2012
15.66%2.13%
28.86%
0.07%
0.08%
53.19%
To Employees
To Government
To Society
To Shareholders
To Lenders
Depreciation
WEALTH DISTRIBUTION 2011
15.24%1.79%
26.32%
0.10%
0.14%
56.41%
To Employees
To Government
To Society
To Shareholders
To Lenders
Depreciation
WEALTH GENERATED Total revenue inclusive of sales tax and other income Bought-in material and services
WEALTH DISTRIBUTION To Employees Salaries, benefits and other costs To Government Income tax, sales tax, excise duty, custom duty, WWF and WPPF To Society Donation towards education, health and environment To Providers of Capital Dividend to shareholders Mark-up/ interest expenses on borrowed funds To Company Depreciation, amortization and retained profit
2012Rs. in‘000
2011Rs. in‘000
% %
5,898,757
(3,556,109)
2,342,649
356,914
1,321,441
2,263
616,695
3,372
41,964
2,342,649
100
15.24
56.41
0.10
26.32
0.14
1.79
100
6,597,104
(4,119,399)
2,477,705
388,056
1,317,995
1,654
715,172
1,949
52,879
2,477,705
100
15.66
53.19
0.07
28.86
0.08
2.13
100
Pattern of Shareholding As at December 31, 2012
6559819
821131121211111
799
Number of Shareholders
Shareholders’ Categories Number ofShareholders
Number of Shares Held
Percentage (%)
1 101 501
1,001 20,001 25,001 35,001 40,001 60,001 65,001 75,001 90,001 95,001
110,001 130,001 150,001 200,001
4,670,001
100 500
1,000 5,000
25,000 30,000 40,000 45,000 65,000 70,000 80,000 95,000
100,000 115,000 135,000 155,000 205,000
4,675,000
22,475 18,896 12,143 19,862 44,581 28,760 37,080
131,552 61,670 67,180
153,573 94,344
191,847 113,860 134,865 153,728 200,947
4,670,255
6,157,618
ShareholdingFrom To
Total Number of Shares Held
Associated Companies, Undertakings and Related Parties Directors, CEO and their spouses and minor children Executives Banks, Development Finance Institutions, Non-Banking Finance Institutions Modarabas and Mutual Funds General Public a. Local b. Foreign Others Shareholders holding 5% or more voting rights: Conopco Inc.
1
111
11
7638
13
799
1
4,670,255
369,6992
8672,212
1,112,5988
1,977
6,157,618
4,670,255
75.85
6.00 0.00
0.01 0.04
18.07 0.00 0.03
100.00
75.85
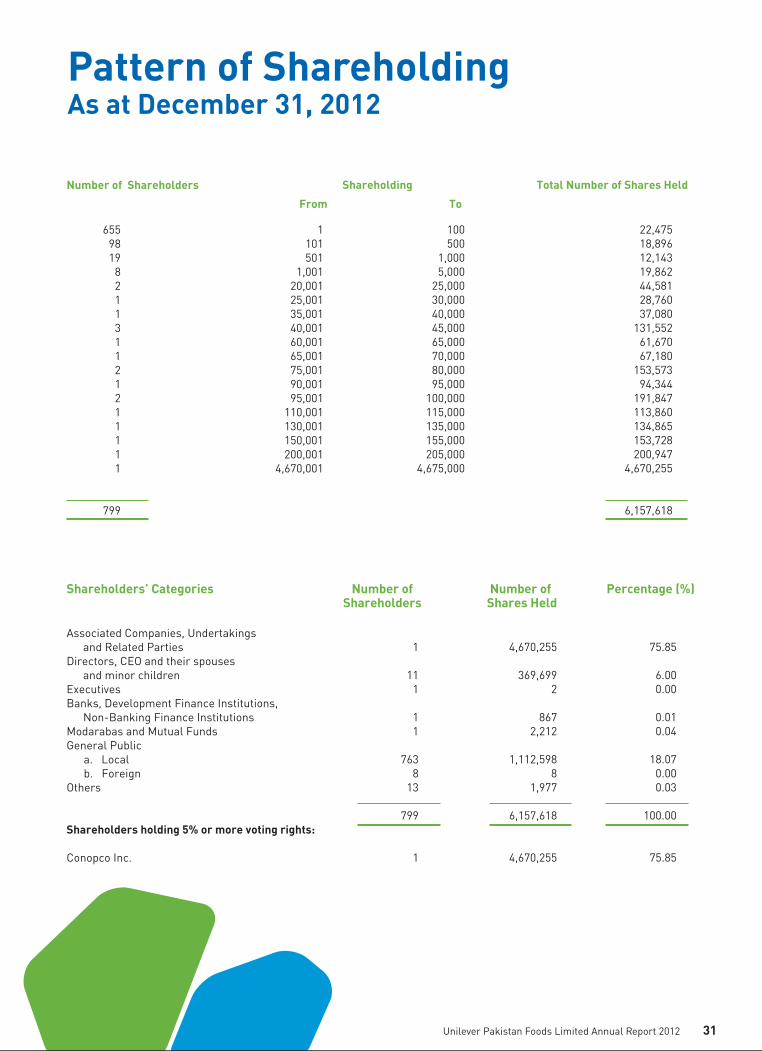

Unilever Pakistan Foods Limited Annual Report 2012 3332 Unilever Pakistan Foods Limited Annual Report 2012
Pattern of ShareholdingAdditional Information As at December 31, 2012
Shareholders’ Category Number of Shareholders
Number of Shares Held
Information on shareholding required under reporting framework of the Code of Corporate Governance is as follows:
i) Associated Companies, Undertakings and Related Parties (name wise details) Conopco Inc. ii) Mutual Funds (name wise details) iii) Directors and their spouses and minor children (name wise details) Mr. Ehsan A. Malik Ms. Fariyha Subhani Mr. Imran Husain Mian Zulfikar H. Mannoo Mrs. Sarwat Zulfikar W/o Mian Zulfikar H. Mannoo Ms. Amna Mannoo D/o Mian Zulfikar H. Mannoo Mian M. Adil Mannoo Mr. Kamal Monnoo Mr. Badaruddin F. Vellani Ms. Shazia Syed Mr. Noman A. Lutfi iv) Executives v) Public Sector Companies & Corporation vi) Banks, Development Finance Institutions, Non-Banking Finance Institutions, Insurance Companies, Takaful, Modarabas and Pension Funds vii) Shareholders holding 5% or more voting rights (name wise details) Conopco Inc.
1
-
11111111111
1
-
2
1
4,670,255
-
111
153,8285,430
2996,246
114,060101
11
2
-
3,079
4,670,255
Dealings in Shares by Directors, Executives and their spouses and minor children
During 01-01-2012 to 31-12-2012
S.No. Name Acquired during the year
1
2
1
29
Mr. Noman A. Lutfi
Ms. Amna Mannoo D/o Mian Zulfikar H. Mannoo
S.No. Name Transferred during the year
11 Mr. M. Qaysar Alam

34 Unilever Pakistan Foods Limited Annual Report 2012
Statement of Compliance with the Code of Corporate GovernanceThis statement is being presented to comply with the Code of Corporate Governance (the Code), set out in the listing regulations of Stock Exchanges in Pakistan for the purpose of establishing a framework of good governance, whereby a listed company is managed in compliance with the best practices of corporate governance.
The Company has applied the principles contained in the Code, in the following manner:
1. The Company encourages representation of directors representing minority interests on its Board of Directors. At present the Board includes:
6. The Company has a Vision Statement. The Company, traditionally, maintains and follows policies designed to align with the Unilever group of companies and global best practices. The Board considers any significant amendments to the policies, as and when required. However, a complete record of particulars of significant policies along with the dates on which these were enacted has been maintained.
7. All the powers of the Board have been duly exercised and decisions on material transactions, based on the significance of the matters involved, including appointment and determination of remuneration and terms and conditions of employment of the CEO and other Executive Directors, have been taken by the Board.
8. The meetings of the Board were presided over by the Chairman and the Board met at least once in every quarter. Written notices of the Board meetings, along with agenda and working papers, were circulated at least 7 days before the meetings. The minutes of the meetings were appropriately recorded and circulated.
9. All the Directors of the Company have completed certification program under the Directors’ Training Program.
10. The Directors' Report for this year has been prepared in compliance with the requirements of the Code and fully describes the salient matters required to be disclosed.
11. The Financial Statements of the Company were duly endorsed by CEO and CFO before approval of the Board.
2. The Directors have confirmed that none of them is serving as a director in more than seven listed companies, including this Company.
3. All the resident Directors of the Company are registered as taxpayers and none of them has defaulted in payment of any loan to a banking company, a DFI or an NBFI or, being a member of a stock exchange, has been declared as a defaulter by that stock exchange.
4. A casual vacancy in the Board of Directors occurred on May 31, 2012, which was filled up by the Directors within 7 days.
5. The Company has adopted a “Code of Conduct” and has ensured that appropriate steps have been taken to disseminate it throughout the Company along with its supporting policies and procedures.
Category
Independent Directors
Executive Directors
Non-Executive Directors
Names
None
1- Mr. Ehsan A. Malik2- Ms. Fariyha Subhani3- Mr. Imran Husain4- Ms. Shazia Syed5- Mr. Noman A. Lutfi
1- Mian Zulfikar H. Mannoo2- Mian M. Adil Mannoo3- Mr. Kamal Monnoo4- Mr. Badaruddin F. Vellani
Unilever Pakistan Foods Limited Annual Report 2012 35
12. The Directors, CEO and Executives do not hold any interest in the shares of the Company other than that disclosed in the pattern of shareholding.
13. The Company has complied with all the corporate and financial reporting requirements of the Code.
14. The Board has formed an Audit Committee. It
comprises of three members, two of whom are Non-Executive Directors.
15. The meetings of the Audit Committee were held at least once every quarter prior to approval of interim and final results of the Company and as required by the Code. The terms of reference of the Committee have been formed and advised to the Committee for compliance.
16. The Board has formed a Human Resource and Remuneration (HR&R) Committee. It comprises of three members, two of whom are Non-Executive Directors and the Chairman of the Committee is a Non-Executive Director.
17. The Internal Audit function of the Company is performed by Unilever Pakistan Limited (an associated Company) through shared service arrangements, which has employed suitably qualified and experienced audit staff for the purpose. The said audit staff are conversant with the policies and procedures of the Company and involved in the Internal Audit function on a full time basis. The Company has applied to obtain the concurrence of SECP on these arrangements,
18. The statutory auditors of the Company have confirmed that they have been given a satisfactory rating under the quality control review programme of the Institute of Chartered Accountants of Pakistan, that they or any of the partners of the firm, their spouses and minor children do not hold shares of the Company and that the firm and all its partners are in compliance with International Federation of Accountants (IFAC) guidelines on code of ethics as adopted by the Institute of Chartered Accountants of Pakistan.
19. The statutory auditors or the persons associated with them have not been appointed to provide other services except in accordance with the listing regulations and the auditors have confirmed that they have observed IFAC guidelines in this regard.
20. The “closed period”, prior to the announcement of interim and final results, and business decisions, which may materially affect the market price of Company’s Securities, was determined and intimated to directors, employees and Stock Exchanges.
21. Material/price sensitive information has been disseminated among all market participants at once through Stock Exchanges.
22. The related party transactions have been placed before the Audit Committee and approved by the Board of Directors.
23. We confirm that all material principles enshrined in the Code have been complied with except for any exception already disclosed hereinabove.
Fariyha SubhaniChief Executive
Karachi February 21, 2013

Auditors’ Review Report
Unilever Pakistan Foods Limited Annual Report 2012 3736 Unilever Pakistan Foods Limited Annual Report 2012
Review report to the members on statement of compliance with the Code of Corporate Governance
We have reviewed the Statement of Compliance with the best practices contained in the Code of Corporate Governance (the Statement) prepared by the Board of Directors of Unilever Pakistan Foods Limited to comply with the Listing Regulation No. 35 of the Karachi and Lahore Stock Exchanges where the company is listed.
The responsibility for compliance with the Code of Corporate Governance (the Code) is that of the Board of Directors of the company. Our responsibility is to review, to the extent where such compliance can be objectively verified, whether the Statement of Compliance reflects the Company’s compliance with the provisions of the Code and report if it does not, and to highlight any non-compliance with the requirements of the Code. A review is limited primarily to inquiries of the company personnel and review of various documents prepared by the company to comply with the Code.
As part of our audit of financial statements we are required to obtain an understanding of the accounting and internal control systems sufficient to plan the audit and develop an effective audit approach. We have not carried out any special review of the internal control system to enable us to express an opinion as to whether the Board’s statement on internal controls covers all controls and the effectiveness of such internal controls.
Further, the Code requires the company to place before the audit committee, and upon recommendation of the audit committee, before the board of directors for their review and approval related party transactions distinguishing between transactions carried out on terms equivalent to those that prevail in arm’s length transactions and transactions which are not executed at arm’s length price recording proper justification for using such alternate pricing mechanism. We are only required and have ensured compliance of requirement to the extent of approval of related party transactions by the board of directors upon recommendation of the audit committee. We have not carried out any procedures to determine whether the related party transactions were undertaken at arm’s length price or not.
Based on our review, nothing has come to our attention which causes us to believe that the Statement of Compliance does not appropriately reflect the company’s compliance, in all material respects, with the best practices contained in the Code of Corporate Governance as applicable to the company for the year ended December 31, 2012.
As mentioned in the Statement (point reference 17 of the Statement), the internal audit function of the company is performed by its associated company through shared services arrangements. The company has applied to obtain concurrence of SECP on this arrangement which is awaited.
A. F. Ferguson & Co.Chartered Accountants
KarachiDated: March 12, 2013

Financial Statement

Financial Statement

Unilever Pakistan Foods Limited Annual Report 2012 4140 Unilever Pakistan Foods Limited Annual Report 2012
Auditors' Report to the Members
We have audited the annexed balance sheet of Unilever Pakistan Foods Limited as at December 31, 2012 and the related profit and loss account, cash flow statement and statement of changes in equity together with the notes forming part thereof, for the year then ended and we state that we have obtained all the information and explanations which, to the best of our knowledge and belief, were necessary for the purposes of our audit.
It is the responsibility of the company’s management to establish and maintain a system of internal control, and prepare and present the above said statements in conformity with the approved accounting standards and the requirements of the Companies Ordinance, 1984. Our responsibility is to express an opinion on these statements based on our audit.
We conducted our audit in accordance with the auditing standards as applicable in Pakistan. These standards require that we plan and perform the audit to obtain reasonable assurance about whether the above said statements are free of any material misstatement. An audit includes examining, on a test basis, evidence supporting the amounts and disclosures in the above said statements. An audit also includes assessing the accounting policies and significant estimates made by management, as well as, evaluating the overall presentation of the above said statements. We believe that our audit provides a reasonable basis for our opinion and, after due verification, we report that:
(a) in our opinion, proper books of accounts have been kept by the company as required by the Companies Ordinance, 1984;
(b) in our opinion:
(i) the balance sheet and profit and loss account together with the notes thereon have been drawn up in conformity with the Companies Ordinance, 1984, and are in agreement with the books of accounts and are further in accordance with accounting policies consistently applied;
(ii) the expenditure incurred during the year was for the purpose of the company's business; and
(iii) the business conducted, investments made and the expenditure incurred during the year were in accordance with the objects of the company;
(c) in our opinion and to the best of our information and according to the explanations given to us, the balance sheet, profit and loss account, cash flow statement and statement of changes in equity together with the notes forming part thereof conform with approved accounting standards as applicable in Pakistan, and, give the information required by the Companies Ordinance, 1984, in the manner so required and respectively give a true and fair view of the state of the company's affairs as at December 31, 2012 and of the profit, its cash flows and changes in equity for the year then ended; and
(d) in our opinion, Zakat deductible at source under the Zakat and Ushr Ordinance, 1980 (XVIII of 1980), was deducted by the company and deposited in the Central Zakat Fund established under section 7 of that Ordinance.
A. F. Ferguson & Co.Chartered Accountants
KarachiDated: March 12, 2013Name of Engagement Partner: Farrukh Rehman

Balance Sheetas at December 31, 2012
2012 2011(Rupees in thousand)
Note
ASSETS Non-current assets Property, plant and equipment Intangible assets Long term loans Long term prepayment Retirement benefit - prepayment
Current assets
Stores and spares Stock in trade Trade debts Loans and advances Trade deposits and short term prepayments Other receivables Taxation - payments less provision Cash and bank balances
Total assets
4567
17
89
10111213
14
649,333 81,637 22,477
- 3,460
756,907
16,983
750,374 146,113
12,682 39,603 80,918
- 201,902
1,248,575
2,005,482
620,702 81,637 25,621 2,894
- 730,854
16,700 593,162 188,563
19,366 52,793 28,868 43,650 93,212
1,036,314
1,767,168
2012 2011(Rupees in thousand)
Note
Balance Sheetas at December 31, 2012
EQUITY AND LIABILITIES Capital and reserves Share capital Reserves
LIABILITIES Non-current liabilities
Retirement benefit - obligation Deferred taxation Current liabilities Trade and other payables Provisions Accrued interest / mark up Short term borrowings Sales tax payable Taxation - provision less payments Total liabilities Contingency and commitments Total equity and liabilities
61,576 529,369 590,945
3,922 107,900 111,822
1,213,083 7,508
895 64,897
4,640 11,692
1,302,715 1,414,537
2,005,482
1516
1718
1920
2122
23
The annexed notes 1 to 40 form an integral part of these financial statements.
Fariyha Subhani Imran HusainChief Executive Director and Chief Financial Officer
Unilever Pakistan Foods Limited Annual Report 2012 4342 Unilever Pakistan Foods Limited Annual Report 2012
61,576 429,959 491,535
17,519 87,010
104,529
1,030,383 25,817
151 94,526 20,227
- 1,171,104 1,275,633
1,767,168

Balance Sheetas at December 31, 2012
2012 2011(Rupees in thousand)
Note
ASSETS Non-current assets Property, plant and equipment Intangible assets Long term loans Long term prepayment Retirement benefit - prepayment
Current assets
Stores and spares Stock in trade Trade debts Loans and advances Trade deposits and short term prepayments Other receivables Taxation - payments less provision Cash and bank balances
Total assets
4567
17
89
10111213
14
649,333 81,637 22,477
- 3,460
756,907
16,983
750,374 146,113
12,682 39,603 80,918
- 201,902
1,248,575
2,005,482
620,702 81,637 25,621 2,894
- 730,854
16,700 593,162 188,563
19,366 52,793 28,868 43,650 93,212
1,036,314
1,767,168
2012 2011(Rupees in thousand)
Note
Balance Sheetas at December 31, 2012
EQUITY AND LIABILITIES Capital and reserves Share capital Reserves
LIABILITIES Non-current liabilities
Retirement benefit - obligation Deferred taxation Current liabilities Trade and other payables Provisions Accrued interest / mark up Short term borrowings Sales tax payable Taxation - provision less payments Total liabilities Contingency and commitments Total equity and liabilities
61,576 529,369 590,945
3,922 107,900 111,822
1,213,083 7,508
895 64,897
4,640 11,692
1,302,715 1,414,537
2,005,482
1516
1718
1920
2122
23
The annexed notes 1 to 40 form an integral part of these financial statements.
Fariyha Subhani Imran HusainChief Executive Director and Chief Financial Officer
Unilever Pakistan Foods Limited Annual Report 2012 4342 Unilever Pakistan Foods Limited Annual Report 2012
61,576 429,959 491,535
17,519 87,010
104,529
1,030,383 25,817
151 94,526 20,227
- 1,171,104 1,275,633
1,767,168

44 Unilever Pakistan Foods Limited Annual Report 2012
Profit and Loss Accountfor the year ended December 31, 2012
2012 2011(Rupees in thousand)
Note 2012 2011(Rupees in thousand)
Note
Cash Flow Statementfor the year ended December 31, 2012
1819
209
21
22
23
24
Sales
Cost of sales
Gross profit
Distribution cost
Administrative expenses
Other operating expenses
Other operating income
Restructuring cost
Profit from operations
Finance cost
Profit before taxation
Taxation
Profit after taxation
Other comprehensive income
Total comprehensive income
Basic and diluted earnings per share (Rupees)
24
25
26
27
28
29
30
31
32
The annexed notes 1 to 40 form an integral part of these financial statements.
Cash flows from operating activities Profit before taxation Adjustments for non-cash charges and other items Depreciation Gain on disposal of property, plant and equipment Provision for retirement benefits - obligation Mark-up on short term borrowings Return on savings accounts
Effect on cash flows due to working capital changes
(Increase) / Decrease in current assets Stores and spares Stock in trade Trade debts Loans and advances Trade deposits and short term prepayments Other receivables Increase / (Decrease) in current liabilities Trade and other payables Provisions Sales tax payable Cash generated from operations Mark up paid Income tax paid Retirement benefits - obligation paid Decrease / (Increase) in long term loans Decrease / (Increase) in long term prepayment
Net cash from operating activities (carried forward)
Fariyha Subhani Imran HusainChief Executive Director and Chief Financial Officer
Note
5,861,096
(3,633,950)
2,227,146
(1,004,044)
(149,174)
(81,316)
73,820
1,066,432
-
1,066,432
(8,066)
1,058,366
(343,194)
715,172
-
715,172
116
4,940,251
(3,015,502)
1,924,749
(850,012)
(139,198)
(70,767)
82,582
947,354
(30,359)
916,995
(6,863)
910,132
(293,437)
616,695
-
616,695
100
1,058,366
52,879 (11,614) 21,796
1,949 (15,659)
49,3511,107,717
(283) (157,212)
42,450 6,684
13,190 (52,050)
(147,221)
181,294 (18,309) (15,587) 147,398
1,107,894
(1,205) (266,962)
(38,853) 3,144 2,894
806,912
910,132
41,964 (1,826) 20,269
3,372 (14,164) 49,615
959,747
758
(235,068) (91,957)
(4,657) (32,563) (19,230)
(382,717)
597,581 15,817
(11,398) 602,000
1,179,030
(5,241) (171,666)
(11,689) (23,464)
(2,766)
964,204
Unilever Pakistan Foods Limited Annual Report 2012 45
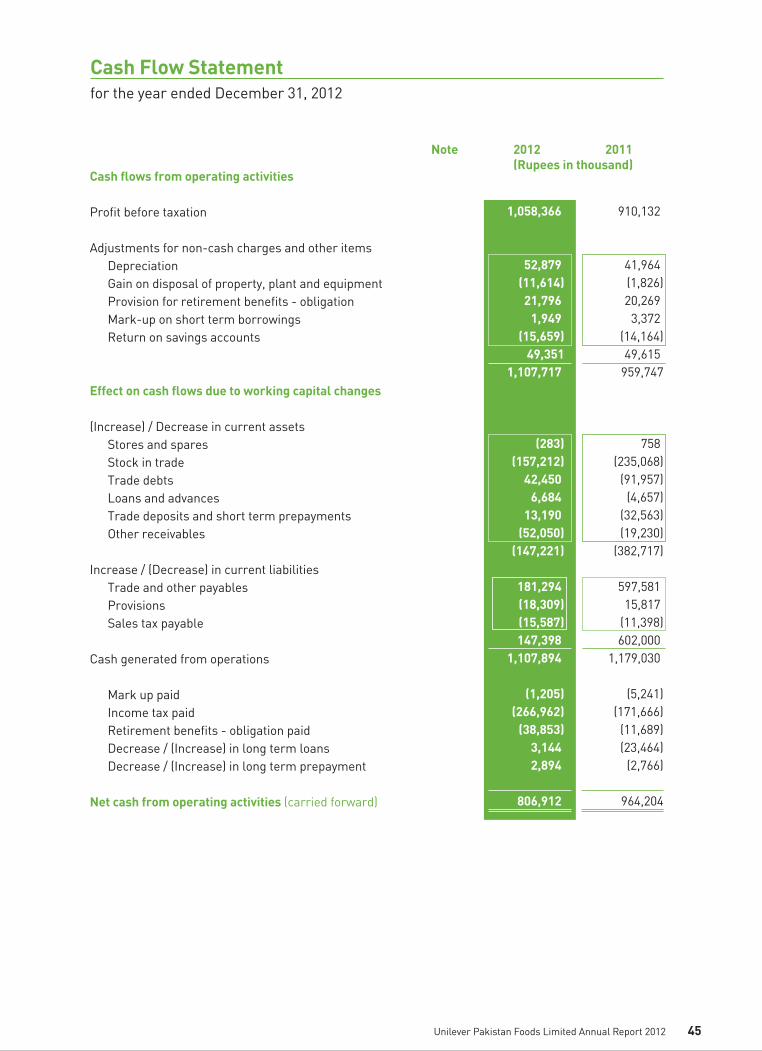

46 Unilever Pakistan Foods Limited Annual Report 2012
Cash Flow Statement for the year ended December 31, 2012
2012 2011(Rupees in thousand)
Note Note
Statement of Changes in Equity for the year ended December 31, 2012
Cash used in investing activities Purchase of property, plant and equipment Sale proceeds on property, plant and equipment Return received on savings accounts
Net cash used in investing activities Cash used in financing activities Dividends paid Net increase in cash and cash equivalents Cash and cash equivalents at the beginning of the year Cash and cash equivalents at the end of the year 38
The annexed notes 1 to 40 form an integral part of these financial statements.
Fariyha Subhani Imran HusainChief Executive Director and Chief Financial Officer
Fariyha Subhani Imran HusainChief Executive Director and Chief Financial Officer
SHARECAPITAL
RESERVES TOTAL
SharePremium
Special General UnappropriatedProfit
SUB TOTAL
(Rupees in thousand)
CAPITAL REVENUE
The annexed notes 1 to 40 form an integral part of these financial statements.
Balance as at January 1, 2011 61,576 24,630 628 138 317,423 342,819 404,395 Total comprehensive income for the year - - - - 616,695 616,695 616,695 Final dividend for the year ended
December 31, 2010 @ Rs. 36 per share - - - - (221,674) (221,674) (221,674) Interim dividend for the year ended December 31, 2011 @ Rs. 50 per share - - - - (307,881) (307,881) (307,881)
Balance as at December 31, 2011 61,576 24,630 628 138 404,563 429,959 491,535
Total comprehensive income forthe year - - - - 715,172 715,172 715,172
Final dividend for the year ended December 31, 2011 @ Rs. 50 per share - - - - (307,880) (307,880) (307,880)
First interim dividend for the year ended December 31, 2012 @ Rs. 25 per share - - - - (153,941) (153,941) (153,941)
Second interim dividend for the year ended December 31, 2012 @ Rs. 25 per share - - - - (153,941) (153,941) (153,941)
Balance as at December 31, 2012 61,576 24,630 628 138 503,973 529,369 590,945
(366,684) 6,570
14,164
(345,950)
(529,800) 88,454 (89,768) (1,314)
(82,050)12,154 15,659
(54,237)
(614,356)138,319 (1,314)
137,005
Net cash from operating activities (brought forward) 806,912 964,204
Unilever Pakistan Foods Limited Annual Report 2012 47

48 Unilever Pakistan Foods Limited Annual Report 2012
Notes to and Forming Part of the Financial Statements for the year ended December 31, 2012
1. THE COMPANY AND ITS OPERATIONS
The Company is a limited liability company incorporated in Pakistan and is listed on the Karachi and Lahore Stock Exchanges. It manufactures and sells consumer and commercial food products under brand names of Rafhan, Knorr, Energile, Glaxose-D and Foodsolutions. The registered office of the Company is situated at Avari Plaza, Fatima Jinnah Road, Karachi.
The Company is a subsidiary of Conopco Inc. USA, whereas its ultimate parent company is Unilever N.V. Holland.
2. SIGNIFICANT ACCOUNTING POLICIES
The principal accounting policies applied in the preparation of these financial statements are set out below. These policies have been consistently applied to all the years presented, unless otherwise stated.
2.1 Basis of preparation 2.1.1 Statement of compliance These financial statements have been prepared in accordance with approved accounting
standards as applicable in Pakistan. Approved accounting standards comprise of such International Financial Reporting Standards (IFRS) issued by the International Accounting Standards Board and Islamic Financial Accounting Standards (IFAS) issued by the Institute of Chartered Accountants of Pakistan as are notified under the Companies Ordinance, 1984, provisions of and directives issued under the Companies Ordinance, 1984. In case requirements differ, the provisions or directives of the Companies Ordinance, 1984 shall prevail.
The preparation of financial statements in conformity with IFRS requires the use of certain critical accounting estimates. It also requires management to exercise its judgement in the process of applying the Company’s accounting policies. The areas involving a higher degree of judgement or complexity, or areas where assumptions and estimates are significant to the financial statements are disclosed in note 3.
2.1.2 Changes in accounting standards, interpretations and pronouncements
i) Standards, interpretations and amendments to published approved accounting standards that are effective and relevant
There are no amended standards and interpretations that are effective for the first time in
the current year that would be expected to have a material impact on the Company.
ii) Standards, interpretations and amendments to published approved accounting standards that are effective but not relevant
The other new standards, amendments and interpretations that are mandatory for accounting periods beginning on or after January 1, 2012 are considered not to be relevant for the Company's financial statements and hence have not been detailed here.
iii) Standards, interpretations and amendments to published approved accounting standards that are not yet effective but relevant
IAS 19 (Amendment) - 'Employee benefits' is applicable for the periods beginning on or
after January 1, 2013. It eliminates the corridor approach and recognises all actuarial gains and losses in other comprehensive income as they occur, immediately recognises all past service costs and replaces interest cost and expected return on plan assets with a net interest amount that is calculated by applying the discount rate to the net defined benefit liability / asset. The change is not expected to have material impact on the Company's financial statements.
2.2 Overall valuation policy
These financial statements have been prepared under the historical cost convention except as disclosed in the accounting policy notes.
2.3 Property, plant and equipment and depreciation
Property, plant and equipment is stated at cost less depreciation except capital work in progress which is stated at cost. Depreciation is calculated using the straight-line method on all assets in use at the beginning of each quarter to charge off their cost excluding residual value, if not insignificant, over their estimated useful lives.
The Company accounts for impairment, where indication exists, by reducing assets' carrying value to the assessed recoverable amount.
The assets' residual values and useful lives are reviewed, and adjusted if appropriate, at each balance sheet date.
Maintenance and normal repairs are charged to income as and when incurred; also individual
assets costing up to Rs. 10,000 are charged to income. Major renewals and improvements are capitalised only when it is probable that future economic benefits associated with the item will flow to the Company and the cost of the item can be measured reliably.
Gains and losses on disposal of property, plant and equipment are recognised in the profit and loss
account. 2.4 Intangible assets and amortisation
Intangible assets having indefinite useful life are stated at cost less accumulated amortisation and impairment. Carrying amounts of intangibles are subject to impairment review at each balance sheet date and where conditions exist, impairment is recognised. The determination of recoverable amount is based on value-in-use calculations that require use of judgment to determine net cash flows arising from continuing use and applicable discount rate.
The useful lives of intangible assets are reviewed at each balance sheet date to determine whether events and circumstances continue to support an indefinite useful life assessment for the asset.
Unilever Pakistan Foods Limited Annual Report 2012 49

50 Unilever Pakistan Foods Limited Annual Report 2012
2.5 Taxation
Income tax expense comprises current and deferred tax. Income tax expense is recognised in the profit and loss account, except to the extent that it relates to items recognised directly in equity in which case it is recognised in equity.
2.5.1 Current Provision for current taxation is based on taxable income at the enacted or substantively enacted
rates of taxation after taking into account available tax credits and rebates, if any, or one-half percent of turnover, whichever is higher. The charge for current tax includes adjustments to charge for prior years, if any.
2.5.2 Deferred Deferred tax is recognised using the balance sheet method, providing for temporary differences
between the carrying amounts of assets and liabilities for financial reporting purposes and the amounts used for taxation purposes. Deferred tax is not recognised on the initial recognition of assets or liabilities in a transaction that is not a business combination and that affects neither accounting nor taxable profit at the time of the transaction. Deferred tax is measured at the tax rates that are expected to be applied to the temporary differences when they reverse, based on the laws that have been enacted or substantively enacted by the reporting date.
A deferred tax asset is recognised to the extent that it is probable that future taxable profits will be available against which temporary differences can be utilised. Deferred tax assets are reviewed at each reporting date and are reduced to the extent that it is no longer probable that the related tax benefit will be realised.
2.6 Staff retirement benefits 2.6.1 Defined contribution plans i) Provident fund The Company operates an approved contributory provident fund for all employees. Equal
monthly contributions are made, both by the Company and the employees, to the fund at the rate of 6% per annum of the base salary and 10% of basic salary plus cost of living allowance in respect of management employees and unionised staff respectively. Obligation for contributions to defined contribution plan is recognised as an expense in the profit and loss account as and when incurred.
ii) DC Pension fund The Company has established a defined contribution plan - DC Pension Fund for the following
management employees: a) permanent employees who joined on or after April 1, 2012; and
b) permanent employees who joined on or before March 31, 2012 and opted for DC Pension
plan in lieu of future benefits under the existing pension and management gratuity.
Contributions are made by the Company to the plan at the rate of 9% per annum of the base salary. Obligation for contributions to defined contribution plan is recognised as an expense in the profit and loss account as and when incurred.
2.6.2 Defined benefit plans The Company operates the following schemes:
i) Funded pension scheme for management employees of the Company. Contributions are
made on the basis of the actuarial valuation. The latest actuarial valuation was carried out as at December 31, 2012, using the ‘Projected Unit Credit Method’.
ii) Funded gratuity scheme for management and non-management employees of the Company. Contributions are made on the basis of the actuarial valuation. The latest actuarial valuation was carried out as at December 31, 2012, using the ‘Projected Unit Credit Method’.
Actuarial gains and losses are changes in present value of defined benefit obligation and fair value of plan assets due to differences between long term actuarial assumptions and actual short term experience. The Company amortises such gains and losses each year by dividing the unrecognised balance at the beginning of the year by the average expected remaining service of current members.
Amounts recognised in the balance sheet represent the present value of defined benefit obligation
as adjusted for unrecognised actuarial gains and losses and unrecognised past service costs, if any, and as reduced by the fair value of plan assets. Any asset resulting from the calculation is limited to the unrecognised actuarial losses and unrecognised past service cost plus the present value of available refunds and reduction in future contribution to the plan.
2.7 Stores and spares These are valued at average cost and provision is made for slow moving and obsolete stores and
spares. Items in transit are valued at cost comprising invoice values plus other charges incurred thereon.
2.8 Stock in trade Stock in trade is valued at the lower of cost and net realisable value. Cost is determined using the
weighted average method except for those in transit where it represents invoice value and other charges paid thereon. Cost of work in process and finished goods include cost of raw and packing materials, direct labour and related production overheads. Net realisable value is the estimated selling price in the ordinary course of business less cost necessarily to be incurred in order to make the sale.
2.9 Trade and other receivables Trade and other receivables are recognised at fair value of consideration receivable. Debts
considered irrecoverable are written off and provision is made against those considered doubtful of recovery.
Unilever Pakistan Foods Limited Annual Report 2012 51

52 Unilever Pakistan Foods Limited Annual Report 2012
2.10 Cash and cash equivalents Cash and cash equivalents are carried in the balance sheet at cost. For the purposes of the cash
flow statement, cash and cash equivalents comprise cash in hand, with banks on current and savings accounts and short term running finance.
2.11 Impairment 2.11.1 Financial assets A financial asset is assessed at each reporting date to determine whether there is any objective
evidence that it is impaired. A financial asset is considered to be impaired if objective evidence indicates that one or more events have had a negative effect on the estimated future cash flows of that asset.
The Company considers evidence of impairment for receivable and other financial assets at specific asset levels. Losses are recognised as an expense in the profit and loss account. When a subsequent event causes the amount of impairment loss to decrease, this reduction is reversed through the profit and loss account.
2.11.2 Non-financial assets The carrying amounts of non-financial assets are assessed at each reporting date to ascertain
whether there is any indication of impairment. If any such indication exists, then the asset's recoverable amount is estimated. An impairment loss is recognised as an expense in the profit and loss account for the amount by which the asset's carrying amount exceeds its recoverable amount. The recoverable amount is the higher of an asset's fair value less cost to sell and value in use. Value in use is ascertained through discounting of the estimated future cash flows using a discount rate that reflects current market assessment of the time value of money and the risk specific to the assets. For the purpose of assessing impairment, assets are grouped at the lowest levels for which there are separately identifiable cash flows (cash-generating units).
An impairment loss is reversed if there has been a change in the estimates used to determine the recoverable amount. An impairment loss is reversed only to the extent that the asset's carrying amount does not exceed the carrying amount that would have been determined, net of depreciation or amortisation, if no impairment loss had been recognised.
2.12 Operating leases Leases in which a significant portion of the risks and rewards of ownership is retained by the lessor
are classified as operating leases. Payments made under operating leases / Ijarah contracts are charged to profit and loss on a straight-line basis over the period of the lease.
2.13 Trade and other payables Liabilities for trade and other amounts payable are carried at cost which is the fair value of the
consideration to be paid in future for goods and services.
2.14 Borrowings and their cost Borrowings are recorded initially at fair value, net of transaction cost incurred.
Borrowing costs are recognised as an expense in the period in which these are incurred except to the extent of borrowing costs that are directly attributable to the acquisition, construction or production of a qualifying asset. Such borrowing costs, if any, are capitalised as part of the cost of that asset.
2.15 Provisions Provisions, if any, are recognised when the Company has a present legal or constructive obligation
as a result of past events, it is probable that an outflow of resources will be required to settle the obligation and a reliable estimate of the amount can be made.
Restructuring cost provisions comprise staff redundancy payments, relocation and dismantling of factory and are recognised in the period in which the Company becomes legally or constructively committed to incur.
2.16 Financial assets and liabilities All financial assets and liabilities are initially measured at cost, which is the fair value of the
consideration given and received respectively. These financial assets and liabilities are subsequently measured at fair value, amortised cost or cost, as the case may be.
2.17 Earnings per share The Company presents earnings per share (EPS) data for its ordinary shares. EPS is calculated by
dividing the profit or loss attributable to ordinary shareholders of the Company by the weighted average number of ordinary shares outstanding during the period.
2.18 Foreign currency transactions and translation
Foreign currency transactions are converted into Pakistan Rupees using the exchange rates prevailing at the dates of the transactions. All monetary assets and liabilities in foreign currencies are translated into Pakistan Rupees at the rates of exchange prevailing at the balance sheet date. Foreign exchange gains and losses are taken to income.
Unilever Pakistan Foods Limited Annual Report 2012 53

4. PROPERTY, PLANT AND EQUIPMENT Operating assets - note 4.1 Capital work in progress - note 4.3 4.1 Operating assets
Net carrying value basis
Year ended December 31, 2012
Opening Net Book Value (NBV)
Additions (at cost)
Disposals (at NBV)
Depreciation charge
Closing NBV
Gross carrying value basis
At December 31, 2012
Cost
Accumulated depreciation
and impairment
NBV
Net carrying value basis
Year ended December 31, 2011
Opening NBV
Additions (at cost)
Disposals (at NBV)
Depreciation charge
Closing NBV
Gross carrying value basis
At December 31, 2011
Cost
Accumulated depreciation
and impairment
NBV
Depreciation rate % per annum
54 Unilever Pakistan Foods Limited Annual Report 2012
2.19 Functional and presentation currency
These financial statements are presented in Pakistan Rupees which is the functional currency of the Company and figures are rounded off to the nearest thousands of Rupees.
2.20 Revenue recognition Revenue is recognised to the extent it is probable that the economic benefits will flow to the
Company and the revenue can be measured reliably. Revenue is measured at the fair value of the consideration received or receivable and is recognised on the following basis:
- sale is recognised when the product is dispatched to customers; and - return on savings account is recognised on accrual basis.
2.21 Dividend Dividend distribution to the Company's shareholders is recognised as a liability in the period in
which the dividend is approved.
3. CRITICAL ACCOUNTING ESTIMATES AND JUDGEMENTS
Estimates and judgements are continually evaluated and are based on historical experience and other factors, including expectations of future events that are believed to be reasonable under the circumstances.
3.1 The Company makes estimates and assumptions concerning the future. The resulting accounting estimates will, by definition, seldom equal the related actual results. The estimates and assumptions that have a significant risk of causing a material adjustment to the carrying amounts of assets and liabilities within the next financial year are addressed below.
3.1.1 Income taxes In making the estimates for income taxes, the Company takes into account the current income tax
law and decisions taken by appellate authorities on certain issues in the past. There may be various matters where the Company's view differs with the view taken by the income tax department at the assessment stage and where the Company considers that its view on items of a material nature is in accordance with the law. The difference between the potential and actual tax charge, if any, is disclosed as a contingent liability.
3.1.2 Defined benefit plans Significant estimates relating to post employment benefits are disclosed in note 17.
3.2 No critical judgement has been used in applying accounting policies.
2012 2011(Rupees in thousand)
Freeholdland
Building onfreehold
land
Leasehold improve-
ments
Plant and machinery
Electrical, mechanical and office equipment
Furniture
and fittings
Motorvehicles
Total
593,548 27,154
620,702
609,403 39,930
649,333
(Rupees in thousand)
593,548
69,274
(540)
(52,879)
609,403
1,151,861
(542,458)
609,403
297,151
343,105
(4,744)
(41,964)
593,548
1,100,287
(506,739)
593,548
4,120
-
(402)
(2,440)
1,278
12,118
(10,840)
1,278
12,792
-
(3,445)
(5,227)
4,120
27,154
(23,034)
4,120
20
3,746
1,647
-
(818)
4,575
18,707
(14,132)
4,575
2,813
1,706
-
(773)
3,746
17,211
(13,465)
3,746
20
48,997
11,986
(11)
(3,120)
57,852
140,447
(82,595)
57,852
53,167
1,817
-
(5,987)
48,997
128,595
(79,598)
48,997
10 to 25
400,067
36,604
(127)
(40,979)
395,565
715,549
(319,984)
395,565
169,219
260,517
(1,299)
(28,370)
400,067
681,324
(281,257)
400,067
7 to 10
-
-
-
-
-
14,918
(14,918)
-
-
-
-
-
-
14,918
(14,918)
-
25
128,439
19,037
-
(5,522)
141,954
241,943
(99,989)
141,954
50,981
79,065
-
(1,607)
128,439
222,906
(94,467)
128,439
2.5
8,179
-
-
-
8,179
8,179
-
8,179
8,179
-
-
-
8,179
8,179
-
8,179
-
Unilever Pakistan Foods Limited Annual Report 2012 55

56 Unilever Pakistan Foods Limited Annual Report 2012
4.3 Capital work in progress – at cost
Civil work Plant and machinery
5. INTANGIBLE ASSETS
Gross carrying value basis Cost - Goodwill - Agreement in restraint of trade - Trademark
Accumulated amortisation and impairment Net book value
The above represents amount paid for the acquisition of Glaxose-D in 1999 to Glaxo Wellcome Pakistan Limited (now GlaxoSmithKline Pakistan Limited).
2012 2011(Rupees in thousand)
2012 2011(Rupees in thousand)
2012 2011(Rupees in thousand)
6. LONG TERM LOANS - considered good
Executives Other employees
Recoverable within one year - note 11
6.1 Reconciliation of carrying amount of loans to executives:
- opening balances - transfers - disbursements - repayments
6.2 Loans to employees have been provided to facilitate purchase of houses, vehicles and computers in accordance with the Company's policy and are repayable over a period of five years. These loans are interest free and secured against retirement benefits of the employees. 6.3 The maximum aggregate amount of loans due from executives at the end of any month during the year was Rs. 36.17 million (2011: Rs. 32.8 million).
7. LONG TERM PREPAYMENT
Prepaid rent Current portion - note 12
8. STORES AND SPARES
Stores Spares (including in transit Rs. 1.14 million; 2011: nil)
Provision for obsolescence
18,153 9,001
27,154
94,578
139,661 20,000
254,239 (172,602)
81,637
831 39,099
39,930
94,578 139,661
20,000 254,239
(172,602) 81,637
30,559 - 30,559 (8,082) 22,477
32,841 -
7,823 (10,105)30,559
1,803 (1,803)
-
9,003 10,314 19,317 (2,334) 16,983
32,841 469
33,310 (7,689) 25,621
2,621 274
34,111 (4,165)32,841
12,865 (9,971) 2,894
7,563 10,601 18,164 (1,464) 16,700
Mr. Shahzad Sattar-Executive Mr. M. Owais Siddiqui-Executive Mr. M. Hafeez-Executive Mr. M. Basit Rasheed-Executive New Jubilee Insurance Company Ltd.
Company policy"""
Insurance claim
170 170 170 170 425
1,105
4
205 10,815
25 12,154
85 85 85 85 62
402
11
127 - -
540
339 339 339 339 362
1,718
123
2,252 12,916
151 17,160
424 424 424 424 424
2,120
134 2,379
12,916 151
17,700
Motor Vehicles
Assets having book value of less than Rs.50,000 each
Electrical, mechanical and office equipmentPlant and machineryMotor VehiclesFurniture and fittings
Description Cost Accumulateddepreciation
Bookvalue
Saleproceeds
Mode ofdisposal
Particulars of purchaser
4.2 Details of operating assets disposed off during the year
The details of fixed assets disposed off during the year are as follows:
(Rupees in thousand)
Unilever Pakistan Foods Limited Annual Report 2012 57

58 Unilever Pakistan Foods Limited Annual Report 2012
10.1 The Company has reversed provision of Rs. 0.62 million as compared to a charge of Rs. 1.53 million in 2011 and has written off debts by utilising the provision amounting to Rs. 0.31 million (2011: Rs. 0.32 million).
10.2 As of December 31, 2012 trade debts of Rs. 14.67 million (2011: Rs. 34.73 million) were past due but not impaired. These relate to a number of independent customers for whom there is no recent history of default. The age analysis of these trade debts is as follows:
2012 2011(Rupees in thousand)
2012 2011(Rupees in thousand)
11.1 The advances to executives are given to meet business expenses and are settled as and when theexpenses are incurred. Further, the Company provides advance house rent to its employees.
12. TRADE DEPOSITS AND SHORT TERM PREPAYMENTS Trade deposits Prepayments Current portion of prepaid rent - note 7
13. OTHER RECEIVABLES Due from associated undertakings Workers' Profits Participation Fund - note 13.1 Rafhan Best Foods Gratuity Fund Rafhan Best Foods Provident Fund Rafhan Best Foods Superannuation Fund Receivable from Defined Contribution Pension Fund Duties refundable Others 13.1 Workers' Profits Participation Fund Balance as at January 1 Allocation for the year Paid to trustees of the fund Balance as at December 31
10. TRADE DEBTS Considered good Considered doubtful Provision for doubtful debts - note 10.1
9. STOCK IN TRADE Raw and packing materials (including in transit Rs. 92.08 million; 2011: Rs. 62.13 million) Provision for obsolescence Work in process Provision for obsolescence Finished goods Provision for obsolescence
2012 2011(Rupees in thousand)
405,260 (18,715) 386,545
10,833 -
10,833 204,850
(9,066) 195,784 593,162
548,029 (28,668)519,361
22,143 (5,725)16,418
226,318 (11,723)214,595 750,374
188,563 14,147
202,710 (14,147) 188,563
146,113 13,218
159,331 (13,218) 146,113
9.1 Stock in trade includes Rs. 273.55 million (2011: Rs. 202.82 million) held with third parties.
9.2 The above balances include items costing Rs. 313.57 million (2011: Rs. 174.06 million) valued at net realisable value of Rs. 267.48 million (2011: Rs. 146.35 million).
9.3 The Company made a provision of Rs. 34.52 million (2011: Rs. 33.86 million) for obsolescence and has written off inventory of Rs. 16.18 million (2011: Rs. 28.3 million) by utilising the provision during the year.
2012 2011(Rupees in thousand)
Up to 3 months 3 to 6 months More than 6 months
14,938 17,257
2,531 34,726
11,042 2,567 1,060
14,669
11. LOANS AND ADVANCES - considered good Current portion of loans to employees - note 6 Advances to: Executives - note 11.1 Other employees Suppliers and others
2012 2011(Rupees in thousand)
7,689
3,084 626
7,967 11,677 19,366
8,082
864 1,855 1,881 4,600
12,682
4,492 33,308
1,803 39,603
31,240 2,234
- 1,453
237
18,357 25,482
1,915 80,918
16,193 (56,901) (40,708) 42,942
2,234
5,362 37,460
9,971 52,793
4,599 16,193
3,395 1,272
-
- -
3,409 28,868
5,124 (48,931) (43,807) 60,000 16,193
Unilever Pakistan Foods Limited Annual Report 2012 59

Pension Fund Gratuity Fund 2012 2011 2012 2011
(Rupees in thousand)
60 Unilever Pakistan Foods Limited Annual Report 2012
Ordinary shares of Rs. 10 each
Ordinary shares of Rs. 10 each allotted: for consideration paid in cash for consideration other than cash as bonus shares
2012 2011(Rupees in thousand)
2012 2011(Rupees in thousand)
17.2 Balance Sheet Reconciliation Fair value of plan assets Present value of defined benefit obligations Funded status Unrecognised net actuarial (gain) / loss Recognised (liability) / asset Actual return on plan assets 17.3 Movement in the fair value of plan assets Fair value as at January 1 Expected return on plan assets Actuarial (losses) / gains Employer contributions Benefits paid Transferred to defined contribution Fund Fair value as at December 31 17.4 Movement in the defined benefit obligation Obligation as at January 1 Service cost Interest cost Actuarial (gain) / loss Transferred to defined contribution Fund Benefits paid Obligation as at December 31 17.5 Cost Current service cost Interest cost Expected return on plan assets Settlement and curtailment Recognition of actuarial (gain) / loss Expense
14. CASH AND BANK BALANCES With banks on: savings accounts - note 14.1 current accounts Cash in hand
14.1 The mark up on savings accounts was at rates ranging from 5% to 10.2% per annum (2011: 5% to 9.58% per annum).
15. SHARE CAPITAL Authorised share capital Number of shares 20,000,000 Issued, subscribed and paid up capital Number of shares 1,239,327 24,196 4,894,095 6,157,618
15.1 As at December 31, 2012 and 2011 Conopco Inc. USA, subsidiary of Unilever N.V. Holland, held 4,670,271 ordinary shares of Rs. 10 each.
2012 2011(Rupees in thousand)
16. RESERVES Capital reserves Share premium Special Revenue reserves General Unappropriated profit
17. RETIREMENT BENEFITS
17.1 The disclosures made are based on the information included in the actuarial valuation as of December 31, 2012.
201,077 704
201,781 121
201,902
81,609 11,047 92,656
556 93,212
200,000
12,393 242
48,941 61,576
200,000
12,393 242
48,941 61,576
24,630 628
25,258
138 503,973 504,111 529,369
24,630 628
25,258
138 404,563 404,701 429,959
26,993 (30,915)
(3,922) -
(3,922) 9,173
70,261 8,632
541 -
(2,620) (49,821) 26,993
72,935 867
8,733 821
(49,821) (2,620) 30,915
867 8,733
(8,632) -
(4,603) (3,635)
70,261 (72,935)
(2,674) (4,883) (7,557) 6,929
62,272 7,722 (793)
3,607 (2,547)
- 70,261
67,097 3,424 9,620
(4,659) -
(2,547) 72,935
3,424 9,620
(7,722) - (53)
5,269
14,195 (10,735)
3,460 -
3,460 4,873
49,963 5,498
(625) 38,853 (1,794)
(77,700) 14,195
79,998 2,915 9,602
(2,286) (77,700)
(1,794) 10,735
2,915 9,602
(5,498) -
18,412 25,431
49,963 (79,998) (30,035) 20,073 (9,962) 5,280
45,301 5,956 (676)
8,082 (8,700)
- 49,963
69,277 6,038 9,978 (494)
3,899 (8,700) 79,998
6,038 9,978
(5,956) 3,899 1,041
15,000
Unilever Pakistan Foods Limited Annual Report 2012 61

62 Unilever Pakistan Foods Limited Annual Report 2012
19.1 Bills payable represents inland letters of credit under vendor financing arrangements which includes interest cost as per Company's negotiated rates.
2012 2011(Rupees in thousand)
110,650 24,561
135,211
(15,818) (158) (801)
(4,544) (520)
(5,470) (27,311)
107,900
215,340 157,767 695,387
42,110 49,995
164 17,541 22,761
2,724 9,294
1,213,083
100,754 20,553
121,307
(9,723) (6,132)
(512) (4,951) (9,036) (3,943)
(34,297)
87,010
157,774 132,407 646,668
18,814 45,433
2,041 -
19,573 1,318 6,355
1,030,383
18. DEFERRED TAXATION
Credit balance arising in respect of: - accelerated tax depreciation allowance - amortisation of intangible assets
Debit balance arising in respect of: - provision for stock in trade - provision for retirement benefits - provision for stores and spares - provision for doubtful debts - provision for restructuring - other provisions
19. TRADE AND OTHER PAYABLES Creditors Bills payable - note 19.1 Accrued liabilities Royalty and technology fee Advances from customers Income tax deducted at source Rafhan Best Foods Gratuity Fund Workers' Welfare Fund Unclaimed dividend Others
17.11 Expected contributions to retirement benefit plans for the year ending December 31, 2013 are Rs. 2.4 million (2012: Rs. 14 million). 17.12 During the year the Company contributed Rs. 12.6 million (2011: Rs. 5.9 million) to defined contribution funds.
Unilever Pakistan Foods Limited Annual Report 2012 63
17.7 Comparison for five years:
As at December 31
Fair value of plan assets Present value of defined benefit obligation Deficit
Experience adjustments
(Loss) / gain on plan assets - as percentage of plan assets
(Gain) / loss on obligation - as percentage of obligations
13.00%10.75%
7.25%
17.6 Principal actuarial assumptions used are as follows:
Discount rate & expected return on plan assets Future salary increases Future pension increases
17.9 The expected return on plan assets was determined by considering the expected returns available on the assets underlying the current investment policy. Expected yields on fixed interest investments are based on gross redemption yields as at the balance sheet date. 17.10 The actuary conducts separate valuations for calculating contribution rates and the Company contributes to the pension and gratuity funds according to the actuary's advice. Expense of the defined benefit plans is calculated by the actuary.
2012 2011
11.50%9.00%5.75%
77
23100
31,611
9,57741,188
90
10100
108,202
12,022120,224
%Rupees inthousand
2012 2011
%Rupees inthousand
17.8 Plan assets are comprised as follows:
Fixed interest bonds
Others (include cash and bank balances)
(Rupees in thousand)2012 2011 2010 2009 2008
107,255
(121,949)(14,694)
9.5%
7.5%
93,368
(114,484)(21,116)
0.4%
3.6%
107,573
(136,374)(28,801)
0.8%
6.0%
120,224
(152,933)(32,709)
(1.2)%
(3.4)%
41,188
(41,650)(462)
(0.2)%
(3.5)%

64 Unilever Pakistan Foods Limited Annual Report 2012
19.2 Amounts due to related parties included in trade and other payables are as follows:
20.1 The amount represents provision made during the year.
20.2 During the year, the Company made a provision for restructuring amounting to nil (2011: Rs. 30.36 million). During the year Rs. 24.3 million (2011: Rs. 14.54 million) has been paid to staff.
21. SHORT TERM BORROWINGS
Running finance under markup arrangements - secured
The facilities for running finance available from various banks amount to Rs. 950 million (2011: Rs. 950 million). The rates of mark up range between KIBOR to KIBOR + 1% per annum (2011: KIBOR to KIBOR + 1% per annum).
The arrangements are secured by way of hypothecation over the Company's current assets.
The facilities for opening letters of credit and guarantees as at December 31, 2012 amounted to Rs. 2.19 billion (2011: Rs. 975 million) of which the amount remaining unutilised at year end was Rs. 1.85 billion (2011: Rs. 812.03 million).
22. SALES TAX PAYABLE
This includes provision for doubtful sales tax refund amounting to Rs. 2.6 million (2011: Rs. 2.6 million). 23. CONTINGENCY AND COMMITMENTS
23.1 Contingency
23.1.1 The Officer of Inland Revenue while finalising the assessments for the tax years 2009 and 2010, disallowed tax payments of Rs. 35.73 million.
The Company has filed appeals before the Commissioner of Inland Revenue - Appeals.
The Company’s management is of the view that the disallowances were erroneous and, therefore, the ultimate decision in appeals will likely be in the Company’s favour. No provision has, therefore, been made in the financial statements.
2012 2011(Rupees in thousand)
27,782 62,789
5,993 1,515 7,508
8,905 40,119
- 25,817
25,817
Holding company Other related parties
20. PROVISIONS
Sindh Infrastructure Cess - note 20.1 Restructuring - note 20.2
23.2 Commitments
23.2.1 Aggregate commitments outstanding for capital expenditure as at December 31, 2012 amounted to Rs. 13.54 million (2011: Rs. 27 million).
23.2.2 Commitments for rentals under operating lease agreements / Ijarah contracts as at December 31, 2012 are as follows:
2012 2011(Rupees in thousand)
2012 2011(Rupees in thousand)
688 516
1,204
7,242,870 (949,746)
- (949,746)
6,293,124 (432,028)
5,861,096
1,151 1,727 2,878
6,215,524 (832,118)
(43,807) (875,925)
5,339,599 (399,348)
4,940,251
Not later than one year Over one year to five years
24. SALES Gross sales Sales tax Excise duty
Returns, rebates and allowances
24.1 The Company analyses its net revenue by the following product groups:
24.2 Sales to domestic customers in Pakistan are 96.4% (2011: 97.5%) and to customers outside Pakistan are 3.6% (2011: 2.5%) of the revenue during the year.
24.3 The Company's customer base is diverse. Sales to one distributor exceed 10 percent of the net sales during the year, amounting to Rs. 707.4 million.
Products used by end consumers Products used by entities
4,070,149 870,102
4,940,251
4,883,781 977,315
5,861,096
Unilever Pakistan Foods Limited Annual Report 2012 65

66 Unilever Pakistan Foods Limited Annual Report 2012
2012 2011(Rupees in thousand)
3,059,125 72,809 17,374
232,154 129,113 51,489 26,780 8,675
251 3,103 2,813 1,000 5,182
48,478 3,658,346
10,833 (16,418)
3,652,761 195,784
(214,595) 3,633,950
220,439 2,897 (872)
6,103 3,587
232,154
2,646,778 38,572 24,892
199,103 79,984 40,861 20,046
8,949 451
2,232 1,285 4,719
5,396 17,317
3,090,585 1,792
(10,833)3,081,544
129,742 (195,784)
3,015,502
190,072 2,996 1,488 3,146 1,401
199,103
25. COST OF SALES Raw and packing materials consumed Manufacturing charges paid to third party Stores and spares consumed Staff costs - note 25.1 Utilities Depreciation Repairs and maintenance Rent, rates and taxes Ujrah payments Travelling and entertainment Insurance Stationery and office expenses Other expenses Charges by related party Opening work in process Closing work in process Cost of goods manufactured Opening stock of finished goods Closing stock of finished goods 25.1 Staff costs Salaries and wages Medical expenses Pension cost - defined benefit plan Gratuity cost - defined benefit plan Cost of defined contribution plan
2012 2011(Rupees in thousand)
26. DISTRIBUTION COST Staff costs - note 26.1 Advertisement and sales promotion Outward freight and handling Royalty, technology fee and related duties Travelling and entertainment Rent, rates and taxes Ujrah payments Depreciation Repairs and maintenance Stationery and office expenses Other expenses Charges by related party
112,166 426,058 142,598
86,168 19,965 10,662
2,844 876
2,151 4,094 5,264
37,166 850,012
140,036 468,322 147,498 126,188
22,465 10,483
2,594 1,104 2,344 4,135 4,532
74,343 1,004,044
26.1 Staff costs Salaries and wages Medical expenses Pension cost - defined benefit plan Gratuity cost - defined benefit plan Cost of defined contribution plan
94,968 1,464 3,671 7,725 4,338
112,166
105,340 9,757
(2,690) 18,819
8,810 140,036
15,286 338 227
1,025 1,809 1,928 1,534 4,305 2,987
109,759 139,198
15,866 326 286
1,176 888
2,097 (619)
3,495 3,373
122,286 149,174
27.1 Staff costs Salaries and wages Pension cost - defined benefit plan Gratuity cost - defined benefit plan Cost of defined contribution plan
27.2 Auditors' remuneration Audit fee Limited review, audit of pension, provident and gratuity funds, certification for regulatory authorities and others Out of pocket expenses
14,771 110 230 175
15,286
1,000
803 125
1,928
15,225 (73) 509 205
15,866
1,000
698 399
2,097
27. ADMINISTRATIVE EXPENSES Staff costs - note 27.1 Rent, rates and taxes Depreciation Travelling and entertainment Insurance Auditors' remuneration - note 27.2 Provision for doubtful debts Legal and professional charges Other expenses Charges by related party - note 27.3
27.3 This represents amount charged to the Company for certain management and other services received from its associated undertaking - Unilever Pakistan Limited.
Unilever Pakistan Foods Limited Annual Report 2012 67

68 Unilever Pakistan Foods Limited Annual Report 2012
2012 2011(Rupees in thousand)
28. OTHER OPERATING EXPENSES Donations - note 28.1 Workers' Profits Participation Fund - note 13.1 Workers' Welfare Fund
2,263 48,931 19,573 70,767
1,654 56,901 22,761 81,316
28.1 None of the directors or their spouses had any interest in the donee.
2012 2011(Rupees in thousand)
14,164
5,443 1,826 2,064 9,333
58,848 237
82,582
15,659
16,552 11,614
7,614 35,780
22,381 -
73,820
29. OTHER OPERATING INCOME Income from financial assets Return on savings accounts Income from non-financial assets Scrap sales Gain on disposal of property, plant and equipment Sundries Others Service fee from related parties - note 29.1 Liabilities no longer payable written back
29.1 This includes amount charged by the Company for certain management and other services rendered to its related party - Unilever Pakistan Limited, in accordance with the Service Agreement between the two companies.
2012 2011(Rupees in thousand)
31. TAXATION - charge Current - for the year - for prior years Deferred
224,670 11,000 57,767
293,437
322,304 -
20,890 343,194
2012 2011(Rupees in thousand)
30. FINANCE COST Mark up on short term borrowings Bank charges
3,372 3,491 6,863
1,949 6,117 8,066
31.1 Reconciliation between tax expense and accounting profit
Accounting profit before tax Tax at the applicable tax rate of 35% Tax effect of permanent differences Tax effect of prior periods Tax effect of credits Tax effect of final tax Tax expense for the year
910,132
318,546 12,079 11,000
(32,601) (15,587) 293,437
1,058,366
370,428 2,113
- (11,953) (17,394) 343,194
32. BASIC AND DILUTED EARNINGS PER SHARE Profit after taxation attributable to ordinary shareholders Weighted average number of shares in issue during the year - in thousand Basic earnings per share (Rupees)
616,695
6,158
100
715,172
6,158
116
There is no dilutive effect on the basic earnings per share of the Company.
Unilever Pakistan Foods Limited Annual Report 2012 69

70 Unilever Pakistan Foods Limited Annual Report 2012
33. RELATED PARTY DISCLOSURES The following transactions were carried out with related parties during the year:
i) Holding company ii) Other related parties
iii) Key management personnel
Royalty Technology feePurchase of goods Sale of goodsFee for receiving of services from related parties Fee for providing of services to related parties Contribution to: - Defined Contribution plans - Defined Benefit plans Settlement on behalf of: - Defined Contribution plans - Defined Benefit plans Receipts from Defined Benefit plans Salaries and other short-term employee benefits
2012 2011(Rupees in thousand)
36,912
39,714 1,031,079
40,457
164,254
58,848
6,280 11,690
1,272 3,395
-
3,968
48,815
64,894 1,252,797
32,845
245,107
22,381
12,602 38,853
19,706 -
16,709
4,653
Relationship with the Company
Nature of transactions
Royalty and technology fee are paid in accordance with the agreements duly acknowledged by the State Bank of Pakistan. The purchase of goods and services from related parties are made on agreed terms and conditions.
The Company has entered into agreements with its associate, Unilever Pakistan Limited to share
various administrative and other resources. The charges by the associate have been disclosed in notes 25, 26 and 27. Service fee from the associate have been disclosed in note 29.
The related party status of outstanding balances as at December 31, 2012 is included in other
receivables and trade and other payables respectively. These are settled in ordinary course of business.
34. REMUNERATION OF DIRECTORS, CHIEF EXECUTIVE AND EXECUTIVES The aggregate amounts charged in the financial statements of the year for remuneration including
all benefits to director, chief executive and executives of the Company are as follows:
Managerial remuneration and allowances Retirement benefits - note 34.1 Medical expenses Other expenses Number of persons
105,574
17,248 1,659
183 124,664
91
104,765
13,420 2,687
777 121,649
89
1,762
- - -
1,762 1
2,494
- - -
2,494 1
978
- - -
978 2
1,204
- - -
1,204 1
Chief ExecutiveExecutive Directors Executives2012 2011 2012 20112012 2011
(Rupees in thousand)
In addition to this, a lump sum amount of Rs. 23.38 million (2011: Rs. 14.82 million) on account of variable pay has been accounted for in financial statements for the current year payable in 2013 after verification of target achievement.
Out of the variable pay recognised for 2011 and 2010 following payments were made:
Aggregate amount charged in these financial statements for the year for fee to four non-executive directors was Rs. 150 thousand (2011: four non executive directors Rs. 150 thousand). Certain executives of the Company are also provided with the Company maintained cars. In respect of full time working Director, Chief Executive and Company Secretary, the Company is charged monthly by an associated undertaking (Unilever Pakistan Limited) on agreed basis. Aggregate amount charged in these financial statements for the year for remuneration of directors is Rs. 4.65 million (2011: Rs. 3.97 million).
34.1 Retirement benefits represent amount contributed towards various retirement benefit plans.
(Rupees in thousand)
Paid in 2012relating to
2011
Paid in 2011relating to
2010
275434
12,436386
13,531
497581
13,746661
15,485
Executive Director Chief Executive Executives Other employees
Unilever Pakistan Foods Limited Annual Report 2012 71

72 Unilever Pakistan Foods Limited Annual Report 2012
35.1 The capacity of the plant is indeterminable as it is a multiproduct plant capable of producing several interchangeable products.
2012 2011(Rupees in thousand)
23,789 20,737
35. PLANT CAPACITY AND PRODUCTION Actual production of the plant in metric tons
36. FINANCIAL RISK MANAGEMENT OBJECTIVES AND POLICIES
36.1 Financial risk factors
The Company's activities expose it to variety of financial risks: credit risk, liquidity risk and market risk (including currency risk and interest rate risk). The Company's overall risk management programme focuses on having cost effective funding as well as manage financial risk to minimise earnings volatility and provide maximum return to shareholders.
Financial assets and liabilities by category and their respective maturities
FINANCIAL ASSETS Loans and advances Trade debts Trade deposits Other receivables Cash and bank balances December 31, 2012 December 31, 2011 FINANCIAL LIABILITIES Trade and other payables Short term borrowings Accrued interest / mark up December 31, 2012 December 31, 2011 ON BALANCE SHEET GAP December 31, 2012 December 31, 2011 OFF BALANCE SHEET ITEMS Letters of credit / guarantee: December 31, 2012 December 31, 2011
35,159 146,113
4,492 78,684
201,902 466,350 344,799
1,140,163
64,897 895
1,205,955 1,058,013 (739,605) (713,214)
342,058 162,696
35,159 146,113
4,492 78,684
825 265,273 263,190
982,396 -
895 983,291 831,080
(718,018) (567,890)
22,477 - - - -
22,477 25,621
- - - - -
22,477 25,621
12,682 146,113
4,492 78,684
825 242,796 237,569
982,396 - 895
983,291 831,080
(740,495) (593,511)
- - - -
201,077 201,077
81,609
157,767 64,897
- 222,664 226,933
(21,587) (145,324)
- - - - - - -
- - - - -
- -
- - - -
201,077 201,077
81,609
157,767 64,897
- 222,664 226,933
(21,587) (145,324)
The carrying values of all financial assets and liabilities reflected in the financial statements approximate their fair values.
(i) Credit risk Credit risk represents the accounting loss that would be recognised at the reporting date if
counter parties failed completely to perform as contracted. The maximum exposure to credit risk is equal to the carrying amount of financial assets. Out of total financial assets of Rs. 466.35 million (2011: Rs. 344.8 million), the financial assets which are subject to credit risk amount to Rs.146.11 million (2011: Rs. 188.56 million).
For trade debts, internal risk assessment process determines the credit quality of the customers, taking into account their financial positions, past experiences and other factors. Individual risk limits are set based on internal or external credit worthiness ratings in accordance with limits set by the management. As of December 31, 2012 trade debts of Rs. 14.67 million (2011: Rs. 34.73 million) were past due but not impaired. The carrying amount of trade debts relates to a number of independent customers for whom there is no recent history of default.
Deposits have been placed mainly against shipping guarantees and letters of credit, hence exposed to no significant credit risk.
Loans and advances to employees are not exposed to any material credit risk since these are secured against their retirement benefits.
Other receivables constitute mainly receivables from the related parties, therefore, are not exposed to any significant credit risk.
The bank balances represent low credit risk as they are placed with banks having good credit ratings assigned by credit rating agencies.
The management does not expect any losses from non-performance by these counterparties. (ii) Liquidity risk Liquidity risk reflects the Company's inability in raising funds to meet commitments. The Company
manages liquidity risk by maintaining sufficient cash and bank balances and the availability of financing through banking arrangements.
(iii) Market risk a) Foreign exchange risk Foreign exchange risk arises mainly where receivables and payables exist in foreign currency. As
at December 31, 2012, financial assets of Rs. 8.44 million (2011: Rs. 5.29 million) and financial liabilities of Rs. 116.41 million (2011: Rs. 46.54 million) were in foreign currency which were exposed to foreign currency risk.
Unilever Pakistan Foods Limited Annual Report 2012 73
(Rupees in thousand)
Interest / Mark-up bearing Non-interest / Non mark-up bearingMaturity up
to one year
Maturityafter one
year
Sub-total Maturity upto one
year
Maturityafter one
year
Sub-totalTotal

74 Unilever Pakistan Foods Limited Annual Report 2012
As at December 31, 2012, if the Pakistan Rupee had weakened / strengthened by 8% against Euro with all other variables held constant, profit before tax for the year would have been lower / higher by Rs. 2.19 million (2011: Rs. 0.48 million), mainly as a result of foreign exchange losses / gains on translation of Euro denominated financial assets and liabilities.
As at December 31, 2012, if the Pakistan Rupee had weakened / strengthened by 10% against US Dollar with all other variables held constant, profit before tax for the year would have been
lower / higher by Rs. 7.17 million (2011: Rs. 3.46 million), mainly as a result of foreign exchange losses / gains on translation of US Dollar denominated financial assets and liabilities.
As at December 31, 2012, if the Pakistan Rupee had weakened / strengthened by 17% against Japanese Yen with all other variables held constant, profit before tax for the year would have been lower / higher by Rs. 1.16 million (2011: nil), mainly as a result of foreign exchange losses / gains on translation of Japanese Yen denominated financial liabilities.
The sensitivity of foreign exchange rate looks at the outstanding foreign exchange balances of the Company only as at the balance sheet date and assumes this is the position for a full twelve-month period. The volatility percentages for movement in foreign exchange rates have been used due to the fact that historically (5 years) rates have moved on average basis by the mentioned percentages per annum.
b) Interest rate risk
The Company’s interest rate risk arises from borrowings as the Company has no significant interest-bearing assets. Borrowings availed at variable rates expose the Company to cash flow interest rate risk.
At December 31, 2012, the Company had variable interest bearing financial assets of Rs. 201.1 million (2011: Rs. 81.6 million) and liabilities of Rs. 222.7 million (2011: Rs. 226.9 million), and had the interest rate varied by 200 basis points with all the other variables held constant, profit before tax for the year would have been approximately Rs. 0.43 million (2011: Rs. 2.91 million)
lower / higher, mainly as a result of higher / lower interest expense on floating rate borrowings.
37. CAPITAL RISK MANAGEMENT
The Company's objectives when managing capital are to safeguard the Company's ability to continue as a going concern in order to provide returns for shareholders and benefit for other stakeholders and to maintain an optimal capital structure to reduce the cost of capital.
The gearing ratios as at December 31, 2012 and 2011 were as follows:
The Company finances its operations through equity, borrowings and management of working capital with a view to maintaining an appropriate mix between various sources of finance.
2012 2011(Rupees in thousand)
64,897 (201,902) (137,005) 590,945 590,945
-
94,526 (93,212)
1,314 491,535 492,849
0.27
Total borrowings Cash and bank Net (cash surplus) / debt Total equity Total capital Gearing ratio - %
2012 2011(Rupees in thousand)
201,902
(64,897) 137,005
93,212
(94,526) (1,314)
38. CASH AND CASH EQUIVALENTS Cash and bank balances Short term borrowings - running finance under mark up arrangements
Unilever Pakistan Foods Limited Annual Report 2012 75

76 Unilever Pakistan Foods Limited Annual Report 2012
39. PROPOSED AND DECLARED DIVIDENDS At the Board of Directors' meeting held on February 21, 2013, a final dividend in respect of 2012 of
Rs. 66 per share amounting to a total dividend of Rs. 406.40 million is proposed (2011: Rs. 50 per share amounting to a total dividend of Rs. 307.88 million).
Interim dividend declared and already paid in respect of half year ended June 30, 2012 was Rs. 25 per share amounting to Rs. 153.94 million (Half year ended June 30, 2011: Rs. 50 per share amounting to Rs. 307.88 million) in addition to first interim cash dividend declared and already paid in respect of quarter ended March 31, 2012 of Rs. 25 per share amounting to Rs. 153.94 million (Quarter ended March 31, 2011: nil).
These financial statements do not reflect the proposed final dividend as payable, which will be accounted for in the statement of changes in equity as an appropriation from the unappropriated profit in the year ending December 31, 2013.
40. DATE OF AUTHORISATION
These financial statements were authorised for issue on February 21, 2013 by the Board of Directors of the Company.
Fariyha Subhani Imran HusainChief Executive Director and Chief Financial Officer
Unilever Pakistan Foods Limited Annual Report 2012 77
Notice of Annual General Meeting
Karachi March 22, 2013
By Order of the Board
Amar NaseerCompany Secretary
Notice is hereby given that the 15th Annual General Meeting of Unilever Pakistan Foods Limited will be held at Pearl Continental Hotel, Club Road, Karachi, on Thursday, April 18, 2013, at 3:00 p.m. to transact the following business:
A. Ordinary Business
1. To receive and consider the Company’s Financial Statements for the year ended 31 December 2012, together with the Reports of the Auditors and Directors thereon.
2. To approve and declare dividend (2012) on the Ordinary Shares of the Company. The Directors have recommended a final cash dividend of 660% (or Rs.66.00 per share) on the
Ordinary Shares. Together with the first interim dividend of 250% (or Rs.25.00 per share) and second interim dividend of 250% (or Rs.25.00 per share) already paid, the total dividend for 2012 will thus amount to 1,160% (or Rs.116.00 per share).
3. To appoint Auditors for the ensuing year, and to fix their remuneration. (Messrs A. F. Ferguson & Co., Chartered Accountants, retire and being eligible have offered
themselves for re-appointment)
B. Special Business
4. To approve the remuneration of Executive Directors including the Chief Executive.

Unilever Pakistan Foods Limited Annual Report 2012 7978 Unilever Pakistan Foods Limited Annual Report 2012
Notice of Annual General Meeting
Notes:
1. The Individual Members who have not yet submitted photocopy of their valid Computerised National Identity Card (CNIC) to the Company / Share Registrar, are once again reminded to send the same at the earliest directly to Company’s Share Registrar, M/s Famco Associates (Private) Limited, State Life Building, 1-A, 1st Floor, I.I. Chundrigar Road, Karachi. The Corporate Entities are requested to provide their National Tax Number (NTN). Please give Folio Number with the copy of CNIC / NTN details. Reference is also made to the Securities and Exchange Commission of Pakistan (SECP) Notifications SRO 779 (I) dated August 18, 2011, and SRO 831 (I) 2012 dated July 5, 2012, which mandates that the dividend warrants should bear CNIC number of the registered member or the authorized person, except in case of minor(s) and corporate members.
2. Share Transfer Books will be closed from April 12, 2013 to April 18, 2013 (both days inclusive) when no transfer of shares will be accepted for registration. Transfers in good order, received at the office of Company’s Share Registrar M/s Famco Associates (Private) Limited, State Life Building No. 1-A, 1st Floor, I.I. Chundrigar Road, Karachi-74000 by the close of business on April 11, 2013 will be treated in time for the purpose of payment of Final Dividend to the transferees.
3. All Members / Shareholders are entitled to attend and vote at the meeting. A Member may appoint a proxy who need not be a Member of the Company.
4. Duly completed instrument of proxy, and the other authority under which it is signed, or a notarially certified copy thereof, must be lodged with the Company Secretary at the Company’s Registered Office (1st Floor, Avari Plaza, Fatima Jinnah Road, Karachi) at least 48 hours before the time of the meeting.
5. Any change of address of Members should be immediately notified to the Company’s Share Registrars, M/s Famco Associates (Private) Limited, State Life Building 1-A, 1st Floor, I. I. Chundrigar Road, Karachi.
CDC Account Holders will further have to follow the under-mentioned guidelines as laid down by the Securities and Exchange Commission of Pakistan:
A. For Attending the Meeting:
i) In case of individuals, the account holder or sub-account holder and / or the person whose securities are in group account and their registration details are uploaded as per the Regulations, shall authenticate his / her identity by showing his / her original Computerised National Identity Card (CNIC) or original passport at the time of attending the meeting.
ii) In case of corporate entity, the Board of Directors’ resolution / power of attorney with specimen signature of the nominee shall be produced (unless it has been provided earlier) at the time of the meeting.
B. For Appointing Proxies:
i) In case of individuals, the account holder or sub-account holder and / or the person whose securities are in group account and their registration details are uploaded as per the Regulations, shall submit the proxy form accordingly.
ii) The proxy form shall be witnessed by two persons whose names, addresses and CNIC numbers shall be mentioned on the form.
iii) Attested copies of CNIC or the passport of the beneficial owners and the proxy shall be furnished with the proxy form.
Notice of Annual General Meeting
Statement Under Section 160 (1) (b) of the Companies Ordinance, 1984
Statement in respect of Special Business and related Draft Resolution
This Statement sets out the material facts concerning the Special Business to be transacted at the 15th Annual General Meeting and the proposed Resolution related thereto:
Item 4 of the Agenda – Remuneration of Executive Directors and Chief Executive
The Chief Executive and the Executive Directors are also employees of Unilever Pakistan Limited and are providing services to the Company under the shared services arrangements between both the Companies.
For the year 2012: Rs.2.93 million to the Chief Executive, and Rs.1.48 million to the Executive Directors as remuneration for their services.
Estimated for the year 2013: Rs.3.20 million to the Chief Executive and Rs.1.60 million to the Executive Directors as remuneration for their services.
Estimated for January 2014 to March 2014: Rs.1.60 million to the Chief Executive and Rs.0.70 million to the Executive Directors as remuneration for their services.
Executive Directors and CEO are also entitled to use Company car.
Approval of the Members is required for remuneration for holding their respective offices of profit in respect of the CEO and Executive Directors. For this purpose it is proposed that, the following resolution be passed as an Ordinary Resolution:
“RESOLVED THAT approval be and is hereby granted for the holding of offices of profit in the Company by the Executive Directors and the Chief Executive, and the payment of remuneration to them for their respective periods of service in accordance with the shared service arrangements, their individual contracts and the rules of the Company; amounting in the aggregate to Rs.4.41 million approximately, actual for the year January-December 2012; Rs.4.80 million approximately estimated for January to December 2013 which includes variable pay for the year 2012; and Rs.2.30 million approximately estimated for January to March 2014.”
iv) The proxy shall produce his/her original CNIC or original passport at the time of meeting.
v) In case of corporate entity, the Board of Directors’ resolution / power of attorney with specimen signature of the person nominated to represent and vote on behalf of the corporate entity, shall be submitted along with proxy form to the Company.

80 Unilever Pakistan Foods Limited Annual Report 2012
Form of ProxyThe SecretaryUnilever Pakistan Foods LimitedAvari Plaza, Fatima Jinnah RoadKarachi-75530, Pakistan.
(Signature should agree with the specimen signature registered with the Company)
Sign across Rs. 5/-Revenue Stamp
Signature of Member(s)
Shareholder’s Folio No.:
and / or CDC Participant I.D. No.:
and Sub-Account No.:
Shareholder’s CNIC #:
I/We ________________________________ son/daughter/wife of ___________________________ shareholder of Unilever Pakistan Foods Limited, holding ________________ ordinary shares hereby appoint ________________________________________ who is my _______________________ [state relationship (if any) with the proxy; required by Government regulations] and the son/daughter/wife of ______________________, (holding _____________________ ordinary shares in the Company under Folio No. ____________________ ) [required by Government; delete if proxy is not the Company’s shareholder] as my / our proxy, to attend and vote for me / us on my / our behalf at the 15th Annual General Meeting of the Company to be held on April 18, 2013 and / or any adjournment thereof.
Signed this __________ day of __________________ 2013.
Witness 1:
Signature:
Name:
CNIC #:
Address:
Witness 2 :
Signature:
Name:
CNIC #:
Address:
Note:
1. The Member is requested: (a) to affix Revenue Stamp of Rs. 5/- at the place indicated above. (b) to sign across the Revenue Stamp in the same style of signature as is registered with the
Company. (c) to write down his/her Folio Number. (d) to attach an attested photocopy of their valid Computerised National Identity Card/ Passport/
Board Resolution and the copy of CNIC of the proxy, with this proxy form before submission.
2. In order to be valid, this Proxy must be received at the Registered Office of the Company at least 48 hours before the time fixed for the Meeting, duly completed in all respects.
3. CDC Shareholders or their Proxies should bring their original Computerised National Identity Card or original Passport along with the Participant’s ID Number and their Account Number to facilitate their identification. Detailed procedure is given in the Notes to the Notice of AGM.

Unilever Pakistan Foods LimitedAvari Plaza, Fatima Jinnah Road, Karachi-75530, T: +92 21 35660062-9 F: +92 21 35681705www.unileverpakistan.com.pkwww.unileverpakistanfoods.com.pk
Creating a better future every day
ANNUAL REPORTUnilever Pakistan Foods Limited
2012
J W T