external
TRANSCRIPT

2 0 1 0 A N N U A L R E P O R T
E X P A N D I N G O U R G L O B A L P R E S E N C E
ARUBA
BAHAMAS
CANADA
CAYMAN ISLANDS
COSTA RICA
CURACAO
DOMINICAN REPUBLIC
EL SALVADOR
GUAM
GUATEMALA
HONDURAS
INDONESIA
JAMAICA
MALAYSIA
MEXICO
NEW ZEALAND
PANAMA
PHILIPPINES
PUERTO RICO
QATAR
SINGAPORE
TRINIDAD & TOBAGO
TURKEY
UNITED ARAB EMIRATES
UNITED STATES
U.S. VIRGIN ISLANDS
VENEZUELA

2010 was a productive year for the Company as we strength-
ened Wendy’s® core business for future growth, made progress
on the early stages of Arby’s® turnaround and produced
$396.9 million in adjusted earnings before interest, taxes,
depreciation and amor ti zation (EBITDA).1
Our adjusted EBITDA fell about 4% on a comparable basis
and our stock price traded in a range of $3.83 to $5.55 during
the year. To improve our ability to grow both earnings and
stockholder value, we made the strategic decision to focus our
resources on continuing to build the Wendy’s brand. As a
result, on January 20, 2011, we announced that we are explor-
ing strategic alternatives for Arby’s, including a sale of the
brand. We believe in the long-term success of Arby’s, but we
also believe that the Wendy’s brand, given its relative size and
scope, will be our key driver of earnings growth and stock-
holder return.
Wendy’s currently has more than 6,500 restaurants worldwide
and is one of the most attractive growth stories in the quick-
service restaurant (QSR) industry. We will focus our energies
on growing the Wendy’s brand via new store growth both in
North American and international markets and with increased
same-store sales through the introduction of new dayparts and
core menu innovation.
In 2010, we focused on brand building and strengthening
Wendy’s ’Real’ positioning with innovative, great-tasting, high-
quality premium and value products that are made with real
and fresh ingredients. We also invested in initiatives such as the
launch of our new breakfast menu and restaurant remodels,
and we added to our pipeline for international expansion by
signing significant new development agreements.
WENDY’S UPGRADING CORE MENU
During 2010, we upgraded our core menu to reinforce our qual-
ity reputation with consumers:
• We introduced four premium entree salads—Apple Pecan
Chicken, BLT Cobb, Spicy Chicken Caesar and Baja—each
with 11 different greens. We also paired smaller sizes
of the salads with Wendy’s classic sides such as baked
potatoes, chili and fries.
• We launched new natural-cut, skin-on fries, made from
premium Russet potatoes, with sea salt.
• We introduced a new everyday value platform called
“My 99,” which offers consumers the choice of several of
our great products at a value price of 99 cents each.
• To further enhance our core hamburger product, we
began testing a new premium cheeseburger line called
“Dave’s Hot ‘N Juicy Cheeseburgers,” which consists of a
40% thicker patty made from fresh beef, melted cheese,
crinkle-cut pickles, red onions and a butter-toasted bun. We
believe these will be the best cheeseburgers in the QSR
industry and plan to introduce this product line in the
second half of 2011.
D E A R F E L L O W S T O C K H O L D E R S :
Wendy’s/Arby’s Group, Inc. is the third largest quick-service restau-
rant company in the United States and includes Wendy’s International, Inc., the
franchisor of the Wendy’s® restaurant system, and Arby’s Restaurant Group, Inc.,
the franchisor of the Arby’s® restaurant system. The combined restaurant systems
include more than 10,000 restaurants in the U.S. and 26 other countries and U.S. territories worldwide as of March 2011.
1See Selected Financial Data and Reconciliation of EBITDA to adjusted EBITDA following this letter to stockholders.
Wendy’s/Arby’s Group, Inc. 2010 Annual Report

Wendy’s/Arby’s Group, Inc. 2010 Annual Report
We are also testing a premium line of chicken sandwiches and
plan to introduce these new sandwiches later in 2011.
WENDY’S FOCUSING ON BREAKFAST, REMODELING AND
NEW RESTAURANT GROWTH
Although Wendy’s already has one of the highest average unit
volumes (AUVs) in the QSR industry, it is the only major QSR
hamburger chain not currently serving breakfast. In 2010, we
introduced a new breakfast menu in four markets, and we’re
encouraged with the early results. Our goal is to win market
share in this fast-growing daypart, which accounts for roughly
25% of total QSR transactions, and thereby grow our AUVs.
We are offering a differentiated and high-quality menu con-
sistent with our ‘Real’ positioning, including an artisan egg
sandwich, grilled breakfast paninis, a warm oatmeal bar and a
premium coffee program developed exclusively for our restau-
rants. We plan to expand breakfast to about 1,000 company
and franchise restaurants by the end of 2011.
We plan to take a more aggressive approach to remodeling and
new store development to drive earnings growth. We remod-
eled approximately 100 Wendy’s restaurants in 2010 and have
plans to continue remodeling restaurants in 2011 featuring a
new design. Additionally, Wendy’s has considerable new store
growth opportunities in North America where the brand is
under-penetrated in certain markets compared to our key com-
petitors. As we grow our AUVs, improve profit margins and add
new dayparts, we believe the system can add approximately
1,000 new stores in North America.
Over the past two years, we aggressively laid the groundwork
for international expansion of Wendy’s with new restaurant
development agreements in Singapore, portions of the Middle
East and North Africa, the Russian Federation, portions of the
Eastern Caribbean, Argentina and the Philippines and a joint
venture agreement to develop restaurants in Japan.
Our international presence would grow to almost 1,000 res tau-
rants in 46 countries and U.S. territories outside of the U.S. and
Canada if all current store development commitments are
fulfilled. That number will increase as we layer on development
for additional new markets we’re targeting—Brazil and China
are the two most significant markets in terms of opportunity—
and expand agreements with existing franchisees. Ultimately,
we believe that earnings generated from international markets
will be a significant component of our ability to generate long-
term value for our stockholders.
2010 FINANCIAL RESULTS AND LONG-TERM OUTLOOK
In 2010, consolidated revenues were $3.4 billion and fell approx-
imately 3% on a comparable year-over-year basis, excluding
the effect of the 53rd week that occurred in 2009. Adjusted
EBITDA fell approximately 4% to $396.9 million on a compara-
ble basis. We reported a net loss of $4.3 million, or $0.01 per
share, including net after-tax special charges of $64.7 million,
or $0.15 per share compared to net income of $3.5 million, or
$0.01 per share, including net after-tax special charges of
$84.7 million or $0.18 per share in 2009. Our performance was
certainly affected by the weak economy, intense competition
and rising commodity prices, but we are committed to deliver-
ing stronger results going forward.
As a strong cash flow generator, we also believe in the impor-
tance of returning capital to our stockholders. In 2010, we
returned $201 million of capital in stock buybacks and cash
dividends, and we currently have $250 million authorized and
available for additional stock repurchases. In the fourth quarter
of 2010, our Board of Directors authorized a 33% increase in
our quarterly cash dividend, which further demonstrates a
commitment to enhancing value for our stockholders.
Looking ahead, 2011 will be a transition year as we complete
the strategic alternatives process for Arby’s, develop plans to
reduce our corporate G&A to support a single brand in the event
of a sale of Arby’s and focus our resources on growth initiatives
for Wendy’s.
Beginning in 2012, we expect Wendy’s to generate average
annual EBITDA growth of 10% to 15%, which we view as a
very attractive growth rate for generating stockholder value.
Most importantly, I appreciate the collective work ethic and
dedication of our management team, restaurant support center
employees, restaurant operators and crew and franchisees
as we prepare for an exciting future. I continue to believe in
the long-term potential of our Company and look forward to
communicating with you about our progress.
Sincerely,
Roland Smith
President and Chief Executive Officer

S E L E C T E D F I N A N C I A L D ATA(In Thousands) (Unaudited)
R E C O N C I L I AT I O N O F E B I T D A T O A D J U S T E D E B I T D A(In Thousands) (Unaudited)
Disclosure Regarding Non-GAAP Financial MeasuresEarnings before interest, taxes, depreciation and amortization (EBITDA) is used by the Company as a performance measure for benchmarking against the Company’s peers and competitors. The Company believes EBITDA is useful to investors because it is frequently used by securities analysts, investors and other interested parties to evaluate companies in the restaurant industry. The Company also uses adjusted EBITDA, which excludes certain special or non-recurring expenses, net of certain special or non-recurring benefits, detailed in the reconciliation table above, as an internal measure of business operating performance. The Company believes adjusted EBITDA provides a meaningful perspective of the underlying operating performance of the Company’s current business. EBITDA and adjusted EBITDA are not recognized terms under U.S. Generally Accepted Accounting Principles (GAAP). Because all companies do not calculate EBITDA or similarly titled financial measures in the same way, those measures as used by other companies may not be consistent with the way the Company calculates such measures and should not be considered as alternative measures of operating profit or net income (loss). The Company’s presentation of EBITDA and adjusted EBITDA is not intended to replace the presentation of the Company’s financial results in accordance with GAAP.
Wendy’s/Arby’s Group, Inc. and Subsidiaries
Wendy’s/Arby’s Group, Inc. 2010 Annual Report
2010 52 weeks
2009 53 weeks
Revenues: Sales $ 3,045,317 $ 3,198,348 Franchise revenues 371,097 382,487
$ 3,416,414 $ 3,580,835
EBITDA $ 384,037 $ 384,359 Depreciation and amortization (182,172) (190,251)Impairment of long-lived assets (69,477) (82,132)
Operating profit 132,388 111,976 Interest expense (137,229) (126,708)Loss on early extinguishment of debt (26,197) —Investment income (expense), net 5,261 (3,008)Other than temporary losses on investments — (3,916)Other income, net 3,782 1,523
Loss from continuing operations before income taxes (21,995) (20,133)Benefit from income taxes 17,670 23,649
(Loss) income from continuing operations (4,325) 3,516 Income from discontinued operations, net of income taxes — 1,546
Net (loss) income $ (4,325) $ 5,062
201052 weeks
200953 weeks
EBITDA $384,037 $384,359 Plus: Integration costs in general and administrative (G&A) 5,514 16,598 SSG purchasing co-op expenses in G&A 5,145 — Incremental advertising for Wendy’s new breakfast 7,192 — (Reversal of) pension withdrawal expense in cost of sales (4,975) 4,975 Wendy’s purchasing co-op start-up costs in G&A — 15,500 Facilities relocation and corporate restructuring — 11,024 Benefit from vacation policy standardization in G&A — (3,339) Benefit from vacation policy standardization in cost of sales — (3,925)
Adjusted EBITDA 396,913 425,192 Less: EBITDA effect of additional week in 2009 — (13,600)
Normalized 52 weeks adjusted EBITDA $396,913 $411,592
Adjusted EBITDA Growth % -3.6%
UNITED STATESSECURITIES AND EXCHANGE COMMISSION
Washington, D.C. 20549
FORM 10-KÈ ANNUAL REPORT PURSUANT TO SECTION 13 OR 15(d) OF THE SECURITIES EXCHANGE ACT OF 1934
FOR THE FISCAL YEAR ENDED JANUARY 2, 2011OR
‘ TRANSITION REPORT PURSUANT TO SECTION 13 OR 15(d) OF THE SECURITIES EXCHANGE ACT OF 1934FOR THE TRANSITION PERIOD FROM TO .
WENDY’S/ARBY’S GROUP, INC.(Exact Name of Registrant as Specified in its Charter)
Commission File Number 1-2207Delaware 38-0471180
(State or other jurisdiction ofincorporation or organization)
(I.R.S. EmployerIdentification No.)
1155 Perimeter Center West, Atlanta, Georgia 30338(Address of principal executive offices) (Zip Code)
Registrant’s Telephone Number, Including Area Code: (678) 514-4100
Securities Registered Pursuant to Section 12(b) of the Act:
Title of Each ClassName of Each Exchange on
Which RegisteredCommon Stock, $.10 par value New York Stock Exchange
Securities Registered Pursuant to Section 12(g) of the Act: None
WENDY’S/ARBY’S RESTAURANTS, LLC.(Exact Name of Registrant as Specified in its Charter)
Commission File Number 333-161613Delaware 38-0471180
(State or other jurisdiction ofincorporation or organization)
(I.R.S. EmployerIdentification No.)
1155 Perimeter Center West, Atlanta, Georgia 30338(Address of principal executive offices) (Zip Code)
Registrant’s Telephone Number, Including Area Code: (678) 514-4100
Securities Registered Pursuant to Section 12(b) of the Act:None
Securities Registered Pursuant to Section 12(g) of the Act:None
Indicate by check mark if either registrant is a well-known seasoned issuer, as defined in Rule 405 of the Securities Act.Wendy’s/Arby’s Group, Inc. È Yes ‘ NoWendy’s/Arby’s Restaurants, LLC ‘ Yes È NoIndicate by check mark if each registrant is not required to file reports pursuant to Section 13 or 15(d) of the Act.Wendy’s/Arby’s Group, Inc. ‘ Yes È NoWendy’s/Arby’s Restaurants, LLC È Yes ‘ NoIndicate by check mark whether each registrant (1) has filed all reports required to be filed by Section 13 or 15(d) of the Securities Exchange Act of 1934 during the
preceding 12 months (or for such shorter period that the registrant was required to file such reports), and (2) has been subject to such filing requirements for the past 90 days.Wendy’s/Arby’s Group, Inc. È Yes ‘ NoWendy’s/Arby’s Restaurants, LLC ‘ Yes È No*Indicate by check mark whether each registrant has submitted electronically and posted on its corporate Web site, if any, every Interactive Data File required to be
submitted and posted pursuant to Rule 405 of Regulation S-T (§ 232.405 of this chapter) during the preceding 12 months (or for such shorter period that the registrantwas required to submit and post such files).
Wendy’s/Arby’s Group, Inc. È Yes ‘ NoWendy’s/Arby’s Restaurants, LLC ‘ Yes ‘ NoIndicate by check mark if disclosure of delinquent filers pursuant to Item 405 of Regulation S-K is not contained herein, and will not be contained, to the best of
each registrant’s knowledge, in definitive proxy or information statements incorporated by reference in Part III of this Form 10-K or any amendment to this Form 10-K.ÈIndicate by check mark whether the registrants are large accelerated filers, accelerated filers, non-accelerated filers or smaller reporting companies. See the
definitions of “large accelerated filer,” “accelerated filer,” and “smaller reporting company” in Rule 12b-2 of the Exchange Act.Wendy’s/Arby’s Group, Inc.Large accelerated filerÈ Accelerated filer‘ Non-accelerated filer‘ Smaller reporting company ‘Wendy’s/Arby’s Restaurants, LLCLarge accelerated filer‘ Accelerated filer‘ Non-accelerated filerÈ Smaller reporting company ‘
Indicate by check mark whether either registrant is a shell company (as defined in Rule 12b-2 of the Act). ‘ Yes È NoThe aggregate market value of common equity held by non-affiliates of Wendy’s/Arby’s Group, Inc. as of July 2, 2010 was approximately $1,250,922,364. As of
February 25, 2011, there were 419,005,869 shares of Wendy’s/Arby’s Group, Inc. Common Stock outstanding.As a limited liability company, Wendy’s/Arby’s Restaurants, LLC does not issue common stock but has one member’s interest issued and outstanding. Wendy’s/
Arby’s Restaurants, LLC’s sole member is Wendy’s/Arby’s Group, Inc. There is no aggregate market value for Wendy’s/Arby’s Restaurants, LLC member’s interest as ofFebruary 25, 2011.
Wendy’s/Arby’s Restaurants, LLC meets the conditions set forth in General Instruction (I)(1)(a) and (b) of Form 10-K and is therefore filing this Form 10-Kwith the reduced disclosure format.
* Wendy’s/Arby’s Restaurants, LLC has filed all reports required to be filed by Section 13 or 15(d) of the Securities Exchange Act of 1934 during the period it wasrequired to file such reports.
DOCUMENTS INCORPORATED BY REFERENCEThe information required by Part III of this Form 10-K, to the extent not set forth herein, is incorporated herein by reference from Wendy’s/Arby’s Group, Inc.’s
definitive proxy statement to be filed with the Securities and Exchange Commission pursuant to Regulation 14A not later than 120 days after January 2, 2011.

[THIS PAGE INTENTIONALLY LEFT BLANK]

Explanatory Note
This Annual Report on Form 10-K is a combined report being filed separately by Wendy’s/Arby’s Group, Inc.(“Wendy’s/Arby’s”) and Wendy’s/Arby’s Restaurants, LLC (“Wendy’s/Arby’s Restaurants”), a direct 100% ownedsubsidiary holding company of Wendy’s/Arby’s. Unless the context indicates otherwise, any reference in this report tothe “Companies,” “we,” “us” and “our” refers to Wendy’s/Arby’s together with its direct and indirect subsidiaries,including Wendy’s/Arby’s Restaurants. Each registrant hereto is filing on its own behalf all of the informationcontained in this annual report that relates to such registrant. Each registrant hereto is not filing any information thatdoes not relate to such registrant, and therefore makes no representation as to any such information.
The principal subsidiaries of Wendy’s/Arby’s Restaurants are Wendy’s International, Inc. (“Wendy’s”) andArby’s Restaurant Group, Inc. (“Arby’s”) and their subsidiaries. Substantially all of the operating results of Wendy’s/Arby’s are derived from the operating results of Wendy’s/Arby’s Restaurants, except expenses of Wendy’s/Arby’s. Where information or an explanation is provided that is substantially the same for each company, suchinformation or explanation has been combined in the Annual Report on Form 10-K. Where information or anexplanation is not substantially the same for each company, we have provided separate information andexplanation. In addition, separate financial statements for each company are included in Item 8, “FinancialStatements and Supplementary Data.”
PART 1Special Note Regarding Forward-Looking Statements and Projections
This Annual Report on Form 10-K and oral statements made from time to time by representatives of theCompanies may contain or incorporate by reference certain statements that are not historical facts, including, mostimportantly, information concerning possible or assumed future results of operations of the Companies. Thosestatements, as well as statements preceded by, followed by, or that include the words “may,” “believes,” “plans,”“expects,” “anticipates,” or the negation thereof, or similar expressions, constitute “forward-looking statements”within the meaning of the Private Securities Litigation Reform Act of 1995 (the “Reform Act”). All statements thataddress future operating, financial or business performance; strategies or expectations; future synergies, efficiencies oroverhead savings; anticipated costs or charges; future capitalization; and anticipated financial impacts of recent orpending transactions are forward-looking statements within the meaning of the Reform Act. The forward-lookingstatements are based on our expectations at the time such statements are made, speak only as of the dates they aremade and are susceptible to a number of risks, uncertainties and other factors. Our actual results, performance andachievements may differ materially from any future results, performance or achievements expressed or implied by ourforward-looking statements. For all of our forward-looking statements, we claim the protection of the safe harbor forforward-looking statements contained in the Reform Act. Many important factors could affect our future results andcould cause those results to differ materially from those expressed in, or implied by the forward-looking statementscontained herein. Such factors, all of which are difficult or impossible to predict accurately, and many of which arebeyond our control, include, but are not limited to, the following:
• uncertainty regarding the outcome of the Companies’ exploration of strategic alternatives for the Arby’sbrand and its impact on the Companies’ businesses;
• competition, including pricing pressures, aggressive marketing and the potential impact of competitors’new unit openings on sales of Wendy’s® and Arby’s® restaurants;
• consumers’ perceptions of the relative quality, variety, affordability and value of the food products we offer;
• food safety events, including instances of food-borne illness (such as salmonella or E. coli) involvingWendy’s or Arby’s or their respective supply chains;
• consumer concerns over nutritional aspects of beef, poultry, French fries or other products we sell, orconcerns regarding the effects of disease outbreaks such as “mad cow disease” and avian influenza or “birdflu”;
• success of operating and marketing initiatives, including advertising and promotional efforts and newproduct and concept development by us and our competitors;
• the impact of general economic conditions and high unemployment rates on consumer spending,particularly in geographic regions that contain a high concentration of Wendy’s or Arby’s restaurants;
1
• changes in consumer tastes and preferences, and in discretionary consumer spending;
• changes in spending patterns and demographic trends, such as the extent to which consumers eat mealsaway from home;
• certain factors affecting our franchisees, including the business and financial viability of franchisees, with asignificant number of Arby’s franchisees having experienced a prolonged period of declining sales andprofitability, the timely payment of such franchisees’ obligations due to us or to national or localadvertising organizations, and the ability of our franchisees to open new restaurants in accordance withtheir development commitments, including their ability to finance restaurant development and remodels;
• changes in commodity costs (including beef and chicken), labor, supply, fuel, utilities, distribution andother operating costs;
• availability, location and terms of sites for restaurant development by us and our franchisees;
• development costs, including real estate and construction costs;
• delays in opening new restaurants or completing remodels of existing restaurants;
• the timing and impact of acquisitions and dispositions of restaurants;
• our ability to successfully integrate acquired restaurant operations;
• anticipated or unanticipated restaurant closures by us and our franchisees;
• our ability to identify, attract and retain potential franchisees with sufficient experience and financialresources to develop and operate Wendy’s and Arby’s restaurants successfully;
• availability of qualified restaurant personnel to us and to our franchisees, and the ability to retain suchpersonnel;
• our ability, if necessary, to secure alternative distribution of supplies of food, equipment and otherproducts to Wendy’s and Arby’s restaurants at competitive rates and in adequate amounts, and thepotential financial impact of any interruptions in such distribution;
• availability and cost of insurance;
• adverse weather conditions;
• availability, terms (including changes in interest rates) and deployment of capital;
• changes in, and our ability to comply with, legal, regulatory or similar requirements, including franchisinglaws, accounting standards, payment card industry rules, overtime rules, minimum wage rates, wage andhour laws, government-mandated health care benefits, tax legislation and menu-board labelingrequirements;
• the costs, uncertainties and other effects of legal, environmental and administrative proceedings;
• the effects of charges for impairment of goodwill or for the impairment of other long-lived assets due todeteriorating operating results;
• the effects of war or terrorist activities; and
• other risks and uncertainties affecting us and our subsidiaries referred to in this Form 10-K (see especially“Item 1A. Risk Factors” and “Item 7. Management’s Discussion and Analysis of Financial Condition andResults of Operations”) and in our other current and periodic filings with the Securities and ExchangeCommission.
All future written and oral forward-looking statements attributable to us or any person acting on our behalf areexpressly qualified in their entirety by the cautionary statements contained or referred to in this section. New risks anduncertainties arise from time to time, and it is impossible for us to predict these events or how they may affect us. Weassume no obligation to update any forward-looking statements after the date of this Form 10-K as a result of newinformation, future events or developments, except as required by federal securities laws. In addition, it is our policygenerally not to endorse any projections regarding future performance that may be made by third parties.
2

Item 1. Business.
Introduction
Wendy’s/Arby’s Group, Inc. (“Wendy’s/Arby’s”) is the parent company of its 100% owned subsidiary holdingcompany Wendy’s/Arby’s Restaurants, LLC (“Wendy’s/Arby’s Restaurants”). Wendy’s/Arby’s Restaurants is theparent company of Wendy’s International, Inc. (“Wendy’s”) and Arby’s Restaurant Group, Inc. (“Arby’s”), which arethe owners and franchisors of the Wendy’s® and Arby’s® restaurant systems, respectively. As used in this report,unless the context requires otherwise, the term “Companies” refers to Wendy’s/Arby’s and its direct and indirectsubsidiaries, including Wendy’s/Arby’s Restaurants.
As of January 2, 2011, the Wendy’s restaurant system was comprised of 6,576 restaurants, of which 1,394 wereowned and operated by the Companies. As of January 2, 2011, the Arby’s restaurant system was comprised of 3,649restaurants, of which 1,144 were owned and operated by the Companies. References in this Form 10-K to restaurantsthat we “own” or that are “company-owned” include owned and leased restaurants. Wendy’s/Arby’s corporatepredecessor was incorporated in Ohio in 1929 and was reincorporated in Delaware in June1994. Effective September 29, 2008, in conjunction with the merger with Wendy’s, Wendy’s/Arby’s corporate namewas changed from Triarc Companies, Inc. (“Triarc”) to Wendy’s/Arby’s Group, Inc. The Companies’ principalexecutive offices are located at 1155 Perimeter Center West, Atlanta, Georgia 30338, and their telephone number is(678) 514-4100. We make our annual reports on Form 10-K, quarterly reports on Form 10-Q, current reports onForm 8-K, and amendments to such reports, as well as the Wendy’s/Arby’s annual proxy statement, available, free ofcharge, on our website as soon as reasonably practicable after such reports are electronically filed with, or furnished to,the Securities and Exchange Commission. Our website address is www.wendysarbys.com. Information contained onthat website is not part of this Annual Report on Form 10-K.
Merger with Wendy’s
On September 29, 2008, Triarc and Wendy’s completed their previously announced merger (the “Wendy’sMerger”) in an all-stock transaction in which Wendy’s shareholders received 4.25 shares of Wendy’s/Arby’s Class Acommon stock for each Wendy’s common share owned.
In the Wendy’s Merger, approximately 377,000,000 shares of Wendy’s/Arby’s Class A common stock wereissued to Wendy’s shareholders. The merger value of approximately $2.5 billion for financial reporting purposes isbased on the 4.25 conversion factor of the Wendy’s outstanding shares as well as previously issued restricted stockawards, both at a value of $6.57 per share which represented the average closing market price of Triarc Class Acommon stock two days before and after the merger announcement date of April 24, 2008. Wendy’s shareholdersheld approximately 80%, in the aggregate, of Wendy’s/Arby’s outstanding Class A common stock immediatelyfollowing the Wendy’s Merger. In addition, effective on the date of the Wendy’s Merger, Wendy’s/Arby’s Class Bcommon stock was converted into Class A common stock. In connection with the May 28, 2009 amendment andrestatement of Wendy’s/Arby’s Certificate of Incorporation, Class A common stock was redesignated as “CommonStock.”
The Wendy’s and Arby’s brands continue to operate independently, with headquarters in Dublin, Ohio andAtlanta, Georgia, respectively. A consolidated support center is based in Atlanta, Georgia and oversees all publiccompany responsibilities, as well as other shared service functions.
Fiscal Year
The Companies use a 52/53 week fiscal year convention whereby their fiscal year ends each year on the Sundaythat is closest to December 31 of that year. Each fiscal year generally is comprised of four 13-week fiscal quarters,although in the years with 53 weeks, including 2009, the fourth quarter represents a 14-week period.
Business Segments
We operate in two business segments, Wendy’s and Arby’s. See Note 27 of the Financial Statements andSupplementary Data included in Item 8 herein, for financial information attributable to our business segments andgeographic areas.
3

The Wendy’s Restaurant System
Wendy’s is the third largest restaurant franchising system in the United States specializing in the hamburgersandwich segment of the quick service restaurant industry. According to Nation’s Restaurant News, Wendy’s is thefourth largest quick service restaurant chain in the United States.
Wendy’s is primarily engaged in the business of operating, developing and franchising a system of distinctivequick-service restaurants serving high quality food. At January 2, 2011, there were 6,576 Wendy’s restaurants inoperation in North America and in 22 foreign countries (other than Canada) and United States territories. Of theserestaurants, 1,394 were operated by Wendy’s and 5,182 by a total of 490 franchisees. See “Item 2. Properties” for alisting of the number of company-owned and franchised locations in the United States and in foreign countries andUnited States territories.
The revenues from our restaurant business are derived from three principal sources: (1) sales at company-ownedrestaurants; (2) sales of bakery items and kids’ meal promotional items to franchisees and others; and (3) franchiseroyalties received from all Wendy’s franchised restaurants.
Wendy’s is also a 50% partner in a Canadian restaurant real estate joint venture with Tim Hortons Inc. Thejoint venture owns Wendy’s/Tim Hortons combo units in Canada. As of January 2, 2011, there were 105 Wendy’srestaurants in operation that were owned by the joint venture. The Tim Hortons menu includes premium coffee,flavored cappuccinos, specialty teas, home-style soups, fresh sandwiches and fresh baked goods.
Wendy’s Restaurants
Wendy’s opened its first restaurant in Columbus, Ohio in 1969. During 2010, Wendy’s opened 9 newcompany-owned restaurants and closed 4 generally underperforming company-owned restaurants. In addition,Wendy’s sold 2 company-owned restaurants to its franchisees. During 2010, Wendy’s franchisees opened 69 newrestaurants and closed 39 generally underperforming restaurants. In 2009, 71 franchised restaurants were closed inJapan at year-end upon the expiration of the related franchise agreement.
The following table sets forth the number of Wendy’s restaurants at the beginning and end of each year from2008 to 2010:
2010 2009 2008
Restaurants open at beginning of period . . . . . . . . . . . . . . . . . . . . . 6,541 6,630 6,645Restaurants opened during period . . . . . . . . . . . . . . . . . . . . . . . . . . 78 63 97Restaurants closed during period . . . . . . . . . . . . . . . . . . . . . . . . . . . (43) (152) (112)
Restaurants open at end of period . . . . . . . . . . . . . . . . . . . . . . . . . . 6,576 6,541 6,630
During the period from December 31, 2007, through January 2, 2011, 238 Wendy’s restaurants were openedand 307 generally underperforming Wendy’s restaurants were closed.
Operations
Each Wendy’s restaurant offers a relatively standard menu featuring hamburgers and filet of chicken breastsandwiches, which are prepared to order with the customer’s choice of condiments. Wendy’s menu also includeschicken nuggets, chili, baked and French fried potatoes, freshly prepared salads, soft drinks, milk, Frosty™ desserts,floats and kids’ meals. In addition, the restaurants sell a variety of promotional products on a limited basis. Wendy’shas tested breakfast in certain markets and plans to expand its breakfast initiative in 2011.
Free-standing Wendy’s restaurants generally include a pick-up window in addition to a dining room. Thepercentage of sales at company-owned Wendy’s restaurants through the pick-up window was 64.9%, 64.6%, and63.8% in 2010, 2009, and 2008 respectively.
Wendy’s strives to maintain quality and uniformity throughout all restaurants by publishing detailedspecifications for food products, preparation and service, continual in-service training of employees, restaurantoperational audits and field visits from Wendy’s supervisors. In the case of franchisees, field visits are made byWendy’s personnel who review operations, including quality, service and cleanliness and make recommendations toassist in compliance with Wendy’s specifications.
4

Generally, Wendy’s does not sell food or supplies, other than sandwich buns and kids’ meal toys, to itsfranchisees. However, prior to 2010, Wendy’s arranged for volume purchases of many food and supplyproducts. Commencing in 2010, the purchasing function was transferred to a new purchasing co-op as describedbelow in “Raw Materials and Purchasing.”
The New Bakery Co. of Ohio, Inc. (the “Bakery”), a 100% owned subsidiary of Wendy’s, is a producer of bunsfor some Wendy’s restaurants, and to a lesser extent for other outside parties, including one distributor to the Arby’ssystem. At January 2, 2011, the Bakery supplied 709 restaurants operated by Wendy’s and 2,551 restaurants operatedby franchisees. As of that date, the Bakery also directly supplied 10 Arby’s restaurants on a test basis. The Bakery alsomanufactures and sells some products to customers in the grocery and other food service businesses.
Raw Materials and Purchasing
As of January 2, 2011, 5 independent processors (6 total production facilities) supplied all of Wendy’shamburger in the United States. In addition, 5 independent processors (7 total production facilities) supplied all ofWendy’s chicken in the United States.
Wendy’s and its franchisees have not experienced any material shortages of food, equipment, fixtures or otherproducts that are necessary to maintain restaurant operations. Wendy’s anticipates no such shortages of products andbelieves that alternate suppliers are available. Suppliers to the Wendy’s system must comply with United StatesDepartment of Agriculture (“USDA”) and United States Food and Drug Administration (“FDA”) regulationsgoverning the manufacture, packaging, storage, distribution and sale of all food and packaging products.
During the 2009 fourth quarter, Wendy’s entered into a purchasing co-op relationship agreement (the “Co-opAgreement”) to establish a new Wendy’s purchasing co-op, Quality Supply Chain Co-op, Inc. (“QSCC”). QSCCmanages food and related product purchases and distribution services for the Wendy’s system in the United Statesand Canada. Through QSCC, Wendy’s and Wendy’s franchisees purchase food, proprietary paper and operatingsupplies under national contracts with pricing based upon total system volume.
QSCC’s supply chain management facilitates the continuity of supply and provides consolidated purchasingefficiencies while monitoring and seeking to minimize possible obsolete inventory throughout the Wendy’s NorthAmerica supply chain. The system’s purchasing function for 2009 and prior was performed and paid for byWendy’s. In order to facilitate the orderly transition of the 2010 purchasing function for North America operations,Wendy’s transferred certain contracts, assets and certain Wendy’s purchasing employees to QSCC in the first quarterof 2010. Pursuant to the terms of the Co-op Agreement, Wendy’s was required to pay $15.5 million to QSCC overan 18 month period through May 2011 in order to provide funding for start-up costs, operating expenses and cashreserves. In addition to the initial funding by Wendy’s, since the third quarter of 2010 all QSCC members (includingWendy’s) began paying sourcing fees on products sourced through QSCC. Such sourcing fees will be the primarymeans of funding QSCC’s operations after the initial funding by Wendy’s is completed.
During the 2010 second quarter, QSCC and ARCOP, Inc. (“ARCOP”), Arby’s independent purchasingcooperative, in consultation with Wendy’s/Arby’s Restaurants, established the Strategic Sourcing Group Co-op, LLC(“SSG”). SSG was formed to manage and operate purchasing programs which combine the purchasing power of bothWendy’s and Arby’s company-owned and franchised restaurants to create buying efficiencies for certainnon-perishable goods, equipment and services.
In order to facilitate the orderly transition of this purchasing function for the Companies’ North Americaoperations, Wendy’s/Arby’s Restaurants transferred certain contracts, assets and certain Wendy’s/Arby’s Restaurantspurchasing employees to SSG in the second quarter of 2010. Wendy’s/Arby’s Restaurants had committed to payapproximately $5.2 million of SSG expenses, which was expensed in 2010 and was to be paid over a 24 month periodthrough March 2012. We made payments of $2.0 million in 2010.
Should a sale of Arby’s occur as discussed in “The Arby’s Restaurant System” herein, under the change ofcontrol provisions in the agreement that established SSG, the activities of SSG would be wound up. In the wind upprocess, the assets, personnel and functions of SSG would be transferred to QSCC and ARCOP as such parties andWendy’s/Arby’s Restaurants agree. In contemplation of a possible sale, the parties are in discussion regarding thedissolution of SSG and transferring SSG’s assets, personnel and functions to QSCC and ARCOP.
5

Trademarks and Service Marks
Wendy’s or its subsidiaries have registered certain trademarks and service marks in the United States Patent andTrademark Office and in international jurisdictions, some of which include Wendy’s®, Old Fashioned Hamburgers®
and Quality Is Our Recipe®. Wendy’s believes that these and other related marks are of material importance to itsbusiness. Domestic trademarks and service marks expire at various times from 2011 to 2020, while internationaltrademarks and service marks have various durations of 10 to 15 years. Wendy’s generally intends to renewtrademarks and service marks that are scheduled to expire.
Wendy’s entered into an Assignment of Rights Agreement with the company’s founder, R. David Thomas, andhis wife dated as of November 5, 2000 (the “Assignment”). Wendy’s had used Mr. Thomas, who was SeniorChairman of the Board until his death on January 8, 2002, as a spokesperson and focal point for its products andservices for many years. With the efforts and attributes of Mr. Thomas, Wendy’s has, through its extensive investmentin the advertising and promotional use of Mr. Thomas’ name, likeness, image, voice, caricature, endorsement rightsand photographs (the “Thomas Persona”), made the Thomas Persona well known in the United States andthroughout North America and a valuable asset for both Wendy’s and Mr. Thomas’ estate. Under the terms of theAssignment, Wendy’s acquired the entire right, title, interest and ownership in and to the Thomas Persona, includingthe sole and exclusive right to commercially use the Thomas Persona.
Seasonality
Wendy’s restaurant operations are moderately seasonal. Wendy’s average restaurant sales are normally higherduring the summer months than during the winter months. Because the business is moderately seasonal, results forany quarter are not necessarily indicative of the results that may be achieved for any other quarter or for the full fiscalyear.
Competition
Each Wendy’s restaurant is in competition with other food service operations within the same geographicalarea. The quick-service restaurant segment is highly competitive and includes well-established competitors such asMcDonald’s®, Burger King®, Taco Bell®, Kentucky Fried Chicken® and Arby’s®. Wendy’s competes with otherrestaurant companies and food outlets, primarily through the quality, variety, convenience, price, and valueperception of food products offered. The number and location of units, quality and speed of service, attractiveness offacilities, effectiveness of marketing and new product development by Wendy’s and its competitors are also importantfactors. The price charged for each menu item may vary from market to market (and within markets) depending oncompetitive pricing and the local cost structure. Wendy’s also competes within the food service industry and the quickservice restaurant sector not only for customers, but also for personnel, suitable real estate sites and qualifiedfranchisees.
Wendy’s competitive position is differentiated by a focus on quality, its use of fresh, never frozen ground beef inthe United States and Canada and certain other countries, its unique and diverse menu, its promotional products, itschoice of condiments and the atmosphere and decor of its restaurants.
Many of the leading restaurant chains have focused on new unit development as one strategy to increase marketshare through increased consumer awareness and convenience. This has led to increased competition for availabledevelopment sites and higher development costs for those sites, although the recent decline in commercial real estatevalues has somewhat offset those costs. Competitors also employ marketing strategies such as frequent use of pricediscounting, frequent promotions and heavy advertising expenditures. Continued price discounting in the quickservice restaurant industry and the emphasis on value menus has had and could continue to have an adverse impact onWendy’s. In addition, the growth of fast casual chains and other in-line competitors could cause some fast foodcustomers to “trade up” to a more traditional dining out experience while keeping the benefits of quick service dining.
Other restaurant chains have also competed by offering high quality sandwiches made with fresh ingredientsand artisan breads and there are several emerging restaurant chains featuring high quality food served at in-linelocations. Several chains have also sought to compete by targeting certain consumer groups, such as capitalizing ontrends toward certain types of diets (e.g., low carbohydrate or low trans fat) by offering menu items that are promotedas being consistent with such diets.
6

Additional competitive pressures for prepared food purchases come from operators outside the restaurantindustry. A number of major grocery chains offer fresh deli sandwiches and fully prepared food and meals to go aspart of their deli sections. Some of these chains also have in-store cafes with service counters and tables whereconsumers can order and consume a full menu of items prepared especially for that portion of theoperation. Additionally, convenience stores and retail outlets at gas stations frequently offer sandwiches and otherfoods.
Quality Assurance
Wendy’s quality assurance program is designed to verify that the food products supplied to our restaurants areprocessed in a safe, sanitary environment and in compliance with our food safety and quality standards. Wendy’squality assurance personnel conduct multiple on-site sanitation and production audits throughout the year at all ofour core menu product processing facilities, which include beef, poultry, pork, buns, French fries, Frosty™ dessertingredients, and produce. Animal welfare audits are also conducted every year at all beef, poultry, and pork facilities toconfirm compliance with our required animal welfare and handling policies and procedures. In addition to our facilityaudit program, weekly samples of beef, poultry, and other core menu products from our distribution centers arerandomly sampled and analyzed by a third party laboratory to test conformance to our quality specifications. Eachyear, Wendy’s representatives conduct unannounced inspections of all company and franchise restaurants to testconformance to our sanitation, food safety, and operational requirements. Wendy’s has the right to terminatefranchise agreements if franchisees fail to comply with quality standards.
Acquisitions and Dispositions of Wendy’s Restaurants
Wendy’s has from time to time acquired the interests of and sold Wendy’s restaurants to franchisees, and it isanticipated that the company may have opportunities for such transactions in the future. Wendy’s generally retains aright of first refusal in connection with any proposed sale of a franchisee’s interest. Wendy’s will continue to sell andacquire restaurants in the future where prudent.
Franchised Restaurants
As of January 2, 2011, Wendy’s franchisees operated 5,182 Wendy’s restaurants in 49 states, Canada and 22other countries and United States territories.
The rights and obligations governing the majority of franchised restaurants operating in the United States areset forth in the Wendy’s Unit Franchise Agreement. This document provides the franchisee the right to construct,own and operate a Wendy’s restaurant upon a site accepted by Wendy’s and to use the Wendy’s system in connectionwith the operation of the restaurant at that site. The Unit Franchise Agreement provides for a 20-year term and a10-year renewal subject to certain conditions. Wendy’s has in the past franchised under different agreements on amulti-unit basis; however, Wendy’s now generally grants new Wendy’s franchises on a unit-by-unit basis.
The Wendy’s Unit Franchise Agreement requires that the franchisee pay a royalty of 4% of sales, as defined inthe agreement, from the operation of the restaurant. The agreement also typically requires that the franchisee payWendy’s a technical assistance fee. In the United States, the standard technical assistance fee required under a newlyexecuted Unit Franchise Agreement is currently $25,000 for each restaurant.
The technical assistance fee is used to defray some of the costs to Wendy’s in providing technical assistance inthe development of the Wendy’s restaurant, initial training of franchisees or their operator and in providing otherassistance associated with the opening of the Wendy’s restaurant. In certain limited instances (like the regranting offranchise rights or the relocation of an existing restaurant), Wendy’s may charge a reduced technical assistance fee ormay waive the technical assistance fee. Wendy’s does not select or employ personnel on behalf of franchisees.
Wendy’s has announced a program to encourage the development of new restaurants in the UnitedStates. Under the program, provided certain conditions are met, the technical assistance fee for franchised restaurantsopened from April 2011 through December 2013 will be reduced to $15,000, and royalties paid on sales from thoserestaurants will be reduced to 2% for the first 12 months and to 3% for the second 12 months. After 24 months, themonthly royalty rate reverts to the prevailing 4% rate for the remaining term of the franchise agreement.
7
Wendy’s currently does not offer any financing arrangements, or enter into guarantees of financingarrangements, to franchisees seeking to build new franchised units. However, Wendy’s had previously made suchfinancing available to qualified franchisees and Wendy’s had guaranteed payment on a portion of the loans made bythird-party lenders to those franchisees.
Effective February 2011, certain lenders are offering financing to Wendy’s United States franchisees to purchasenew equipment and smallwares and modify other equipment needed to implement Wendy’s new hamburger productroll out. Wendy’s has agreed to subsidize a portion of the interest that would otherwise be payable by the franchiseesparticipating in this financing program. The financing program is expected to end in September 2011.
See “Management Discussion and Analysis—Liquidity and Capital Resources—Guarantees and OtherContingencies” in Item 7 herein, for further information regarding guarantee obligations.
Franchised restaurants are required to be operated under uniform operating standards and specifications relatingto the selection, quality and preparation of menu items, signage, decor, equipment, uniforms, suppliers, maintenanceand cleanliness of premises and customer service. Wendy’s monitors franchisee operations and inspects restaurantsperiodically to ensure that required practices and procedures are being followed.
See Note 5 and Note 23 of the Financial Statements and Supplementary Data included in Item 8 herein, andthe information under “Management’s Discussion and Analysis” in Item 7 herein, for further information regardingreserves, commitments and contingencies involving franchisees.
Advertising and Marketing
In the United States and Canada, Wendy’s advertises nationally on network and cable television programs,including nationally televised events. Locally in the United States and Canada, Wendy’s primarily advertises throughregional network and cable television, radio and newspapers. Wendy’s participates in two national advertising fundsestablished to collect and administer funds contributed for use in advertising through television, radio, newspapers,the Internet and a variety of promotional campaigns. Separate national advertising funds are administered forWendy’s United States and Canadian locations. Contributions to the national advertising funds are required to bemade from both company-owned and franchised restaurants and are based on a percent of restaurant retail sales. Inaddition to the contributions to the national advertising funds, Wendy’s requires additional contributions to be madefor both company-owned and franchised restaurants based on a percent of restaurant retail sales for the purpose oflocal and regional advertising programs. Required franchisee contributions to the national advertising funds and forlocal and regional advertising programs are governed by the Wendy’s Unit Franchise Agreement. Requiredcontributions by company-owned restaurants for advertising and promotional programs are at the same percent ofretail sales as franchised restaurants within the Wendy’s system. Currently the contribution rate for United States andCanadian restaurants is generally 3% of retail sales for national advertising and 1% of retail sales for local and regionaladvertising.
See Note 26 of the Financial Statements and Supplementary Data included in Item 8 herein, for furtherinformation regarding advertising.
International Operations and Franchising
As of January 2, 2011, Wendy’s had 136 company-owned and 232 franchised restaurants in Canada and 325franchised restaurants in 22 other countries and U.S. territories. Wendy’s is aggressively pursuing internationaldevelopment opportunities. Since the second quarter of 2009, new development agreements have been announced forWendy’s locations in Singapore, Trinidad and Tobago and 8 other eastern Caribbean countries, Argentina, and thePhilippines and dual branded Wendy’s and Arby’s locations in the United Arab Emirates and 11 other countries inthe Middle East and North Africa, and the Russian Federation. In March 2011, Wendy’s also announced that it hadentered into a joint venture to develop Wendy’s restaurants in Japan. Wendy’s has granted development rights in thecertain countries and U. S. territories listed under Item 2 of this Form 10-K.
Wendy’s Restaurants of Canada Inc. (“WROC”), a 100% owned subsidiary of Wendy’s, holds master franchiserights for Canada. The rights and obligations governing the majority of franchised restaurants operating in Canada areset forth in a Single Unit Sub-Franchise Agreement. This document provides the franchisee the right to construct,own and operate a Wendy’s restaurant upon a site accepted by WROC and to use the Wendy’s system in connection
8

with the operation of the restaurant at that site. The Single Unit Sub-Franchise Agreement provides for a 20-yearterm and a 10-year renewal subject to certain conditions. The sub-franchisee pays to WROC a monthly royalty of 4%of sales, as defined in the agreement, from the operation of the restaurant or C$1,000, whichever is greater. Theagreement also typically requires that the franchisee pay WROC a technical assistance fee. The standard technicalassistance fee is currently C$35,000 for each restaurant.
Franchisees who wish to operate Wendy’s restaurants outside the United States and Canada enter intoagreements with Wendy’s that generally provide franchise rights for each restaurant for an initial term of 10 years or20 years, depending on the country, and typically include a 10-year renewal provision, subject to certainconditions. The agreements license the franchisee to use the Wendy’s trademarks and know-how in the operation of aWendy’s restaurant at a specified location. Generally, the franchisee pays Wendy’s a technical assistance fee or another per restaurant fee and monthly fees based on a percentage of gross monthly sales of each restaurant. In certainforeign markets, Wendy’s may grant the franchisee exclusivity to develop a territory in exchange for the franchiseeundertaking to develop a specified number of new Wendy’s restaurants in the territory based on a negotiatedschedule. In these instances, the franchisee generally pays Wendy’s an upfront development fee, annual developmentfees or a per restaurant fee. In certain circumstances, Wendy’s may grant a franchisee the right to sub-franchise in astated territory, subject to certain conditions.
Wendy’s also continually evaluates non-franchise opportunities for development of Wendy’s restaurants ininternational markets, including through joint ventures with third parties and opening company-owned restaurants.
The Arby’s Restaurant System
Arby’s is the largest restaurant franchising system specializing in the roast beef sandwich segment of the quickservice restaurant industry. According to Nation’s Restaurant News, Arby’s is the second largest sandwich chainrestaurant in the United States. In January 2011, Wendy’s/Arby’s announced that it is exploring strategic alternativesfor the Arby’s brand, including a sale of the brand.
As the franchisor of the Arby’s restaurant system, Arby’s, through its subsidiaries, owns and licenses the right touse the Arby’s brand name and trademarks in the operation of Arby’s restaurants. Arby’s provides Arby’s franchiseeswith services designed to increase both the revenue and profitability of their Arby’s restaurants. The most importantof these services are providing strategic leadership for the brand, product development, quality control, operationaltraining and counseling regarding site selection.
At January 2, 2011, there were 3,649 Arby’s restaurants in operation in North America and in 3 foreigncountries (other than Canada). Of these restaurants, 1,144 were operated by Arby’s and 2,505 by a total of 460franchisees. See “Item 2. Properties” for a listing of the number of company-owned and franchised locations in theUnited States and in foreign countries.
The revenues from the Arby’s restaurant business are derived from two principal sources: sales at company-owned restaurants and franchise royalties received from all Arby’s franchised restaurants.
Arby’s also owns the T.J. Cinnamons® concept, which consists of gourmet cinnamon rolls, gourmet coffees andother related products. As of January 2, 2011, there were a total of 90 T.J. Cinnamons outlets, 82 of which are dual-branded with domestic Arby’s restaurants.
Arby’s Restaurants
Arby’s opened its first restaurant in Boardman, Ohio in 1964. During 2010, Arby’s closed 17 generallyunderperforming company-owned restaurants. In addition, Arby’s sold 8 company-owned restaurants to itsfranchisees. During 2010, Arby’s franchisees opened 44 new Arby’s restaurants and closed 96 generallyunderperforming Arby’s restaurants. In addition, during 2010, Arby’s franchisees closed 18 T.J. Cinnamons outlets14 of which were located in Arby’s units and 4 others not dual-branded with Arby’s units.
9

The following table sets forth the number of Arby’s restaurants at the beginning and end of each year from2008 to 2010:
2010 2009 2008
Restaurants open at beginning of period . . . . . . . . . . . . . . . . . . . . . 3,718 3,756 3,688Restaurants opened during period . . . . . . . . . . . . . . . . . . . . . . . . . . 44 59 127Restaurants closed during period . . . . . . . . . . . . . . . . . . . . . . . . . . . (113) (97) (59)
Restaurants open at end of period . . . . . . . . . . . . . . . . . . . . . . . . . . 3,649 3,718 3,756
During the period from December 31, 2007, through January 2, 2011, 230 Arby’s restaurants were opened and269 generally underperforming Arby’s restaurants were closed.
Operations
In addition to various slow-roasted roast beef sandwiches, Arby’s offers an extensive menu of chicken, turkeyand ham sandwiches, snack items and salads, including its Market Fresh® line of premium sandwiches and freshsalads made with premium ingredients, and Toasted Subs. In 2010, Arby’s implemented its everyday value menu. Inaddition, the restaurants sell a variety of promotional products on a limited basis.
Free-standing Arby’s restaurants generally include a pick-up window in addition to a dining room. Thepercentage of sales at company-owned Arby’s restaurants through the pick-up window was 58.2%, 57.2%, and 57.7%in 2010, 2009, and 2008 respectively.
Generally, Arby’s does not sell food or supplies to Arby’s franchisees.
Raw Materials and Purchasing
As of January 2, 2011, 3 independent meat processors (5 total production facilities) supplied all of Arby’s beeffor roasting in the United States. Franchise operators are required to obtain beef for roasting from these approvedsuppliers.
Arby’s and its franchisees have not experienced any material shortages of food, equipment, fixtures or otherproducts that are necessary to maintain restaurant operations. Arby’s anticipates no such shortages of products andbelieves that alternate suppliers are available.
ARCOP negotiates contracts with approved suppliers on behalf of Arby’s and Arby’s franchisees. Suppliers tothe Arby’s system must comply with USDA and FDA regulations governing the manufacture, packaging, storage,distribution and sale of all food and packaging products. Generally, franchisees may obtain other products, includingfood, ingredients, paper goods, equipment and signs, from any source that meets Arby’s specifications andapproval. Through ARCOP, Arby’s and Arby’s franchisees purchase food, beverage, proprietary paper and operatingsupplies under national contracts with pricing based upon total system volume.
During the 2010 second quarter, ARCOP and QSCC, in consultation with Wendy’s/Arby’s Restaurants,established the SSG. SSG was formed to manage and operate purchasing programs which combine the purchasingpower of both Wendy’s and Arby’s company-owned and franchised restaurants to create buying efficiencies for certainnon-perishable goods, equipment and services.
In order to facilitate the orderly transition of this purchasing function for the Companies’ North Americaoperations, Wendy’s/Arby’s Restaurants transferred certain contracts, assets and certain Wendy’s/Arby’s Restaurantspurchasing employees to SSG in the second quarter of 2010. Wendy’s/Arby’s Restaurants had committed to payapproximately $5.2 million of SSG expenses, which was expensed in 2010 and was to be paid over a 24 month periodthrough March 2012. We paid payments of $2.0 million in 2010.
Should a sale of Arby’s occur as discussed in “The Arby’s Restaurant System” herein, under the change ofcontrol provisions in the agreement that established SSG, the activities of the SSG would be wound up. In the windup process, the assets, personnel and functions of SSG would be transferred to QSCC and ARCOP as such partiesand Wendy’s/Arby’s Restaurants agree. In contemplation of a possible sale, the parties are in discussion regarding thedissolution of SSG and transferring SSG’s assets, personnel and functions to QSCC and ARCOP.
10

Trademarks and Service Marks
Arby’s, through its subsidiaries, owns several trademarks that it considers to be material to its restaurantbusiness, including Arby’s®, Arby’s Market Fresh®, Market Fresh®, Horsey Sauce®, Arby’s Sauce®, andSidekickers®. Arby’s believes that these and other related marks are of material importance to its business. Domestictrademarks and service marks expire at various times from 2011 to 2020, while international trademarks and servicemarks have various durations of 10 to 15 years. Arby’s generally intends to renew trademarks and service marks thatare scheduled to expire.
Seasonality
Arby’s restaurant operations are not significantly impacted by seasonality. However, Arby’s restaurant revenuesare somewhat lower in the first quarter.
Competition
Arby’s faces direct and indirect competition from numerous well-established competitors, including nationaland regional non-burger sandwich chains, such as Panera Bread®, Subway® and Quiznos®, as well as hamburgerchains, such as McDonald’s®, Burger King® and Wendy’s®, and other quick service restaurant chains, such as TacoBell®, Chick-Fil-A® and Kentucky Fried Chicken®. In addition, Arby’s competes with locally owned restaurants,drive-ins, diners and other similar establishments. Key competitive factors in the quick service restaurant industry areprice, quality of products, convenience, quality and speed of service, advertising, brand awareness, restaurant location,and attractiveness of facilities. Arby’s also competes within the food service industry and the quick service restaurantsector not only for customers, but also for personnel, suitable real estate sites and qualified franchisees.
Many of the leading restaurant chains have focused on new unit development as one strategy to increase marketshare through increased consumer awareness and convenience. This has led to increased competition for availabledevelopment sites and higher development costs for those sites, although the recent decline in commercial real estatevalues has somewhat offset those costs. Competitors also employ marketing strategies such as frequent use of pricediscounting, frequent promotions, and heavy advertising expenditures. Continued price discounting in the quickservice restaurant industry and the emphasis on value menus has had and could continue to have an adverse impact onArby’s. In addition, the growth of fast casual chains and other in-line competitors could cause some fast foodcustomers to “trade up” to a more traditional dining out experience while keeping the benefits of quick service dining.
Other restaurant chains have also competed by offering high quality sandwiches made with fresh ingredientsand artisan breads, and there are several emerging restaurant chains featuring high quality food served at in-linelocations. Several chains have also sought to compete by targeting certain consumer groups, such as capitalizing ontrends toward certain types of diets (e.g., low carbohydrate or low trans fat) by offering menu items that are promotedas being consistent with such diets.
Additional competitive pressures for prepared food purchases come from operators outside the restaurantindustry. A number of major grocery chains offer fresh deli sandwiches and fully prepared food and meals to go aspart of their deli sections. Some of these chains also have in-store cafes with service counters and tables whereconsumers can order and consume a full menu of items prepared especially for that portion of theoperation. Additionally, convenience stores and retail outlets at gas stations frequently offer sandwiches and otherfoods.
Quality Assurance
Arby’s has developed a quality assurance program designed to maintain standards and the uniformity of menuofferings at all Arby’s restaurants. Arby’s assigns a quality assurance employee to each of the independent facilities thatprocess beef for domestic Arby’s restaurants. The quality assurance employee inspects the beef for quality, uniformityand to assure compliance with quality and safety requirements of the USDA and the FDA. In addition, Arby’speriodically evaluates randomly selected samples of beef and other products from its supply chain. Each year, Arby’srepresentatives conduct announced and unannounced inspections of operations of a number of franchisees to ensurethat required policies, practices and procedures are being followed. Arby’s field representatives also provide a variety ofon-site consulting services to franchisees. Arby’s has the right to terminate franchise agreements if franchisees fail tocomply with quality standards.
11

Acquisitions and Dispositions of Arby’s Restaurants
Arby’s has from time to time acquired the interests of and sold Arby’s restaurants to franchisees, and it isanticipated that the company may have opportunities for such transactions in the future. Arby’s will continue to selland acquire restaurants in the future where prudent.
Franchised Restaurants
As of January 2, 2011, Arby’s franchisees operated 2,505 Arby’s restaurants in 47 states, Canada and 3 othercountries.
Arby’s offers franchises for the development of both single and multiple “traditional” and “non-traditional”restaurant locations. The initial term of the typical “traditional” franchise agreement is 20 years. As compared totraditional restaurants, non-traditional restaurants generally occupy a smaller retail space, offer no or very limitedseating, may cater to a captive audience, have a limited menu, and possibly have reduced services, labor and storageand different hours of operation. Arby’s generally grants new Arby’s franchises on a unit-by-unit basis. All franchiseesare required to execute standard franchise agreements. Arby’s standard United States franchise agreement for newArby’s traditional restaurant franchises currently requires an initial $37,500 franchise fee for the first franchised unit,$25,000 for each subsequent unit and a monthly royalty payment equal to 4.0% of restaurant sales for the term of thefranchise agreement. Arby’s non-traditional restaurant franchise agreement requires an initial $12,500 franchise fee forthe first and all subsequent units, and a monthly royalty payment ranging from 4.0% to 7.0%, depending upon thenon-traditional restaurant category. Franchisees of traditional restaurants typically pay a $10,000 commitment fee,and franchisees of non-traditional restaurants typically pay a $12,500 commitment fee, which is credited against thefranchise fee during the development process for a new restaurant.
Arby’s currently does not offer any financing arrangements to franchisees seeking to build new franchised units.
In 2007, in order to increase development of traditional Arby’s restaurants in selected markets, our SelectMarket Incentive (“SMI”) program was introduced. Arby’s franchise agreement for participants in the SMI programcurrently requires an initial $27,500 franchise fee for the first franchised unit, $15,000 for each subsequent unit and amonthly royalty payment equal to 1.0% of restaurant sales for the first 36 months the unit is open. After 36 months,the monthly royalty rate reverts to the prevailing 4% rate for the remaining term of the agreement. The commitmentfee is $5,000 per restaurant, which is credited against the franchise fee during the development process. The SMIprogram remains in effect and does not have a stated expiration date. However, Arby’s has the right to discontinueoffering the program at any time.
Because royalty rates of less than 4% are still in effect under certain older franchise agreements, the averageroyalty rate paid by United States Arby’s franchisees was approximately 3.6% in each of 2010, 2009 and 2008.
Franchised restaurants are required to be operated under uniform operating standards and specifications relatingto the selection, quality and preparation of menu items, signage, decor, equipment, uniforms, suppliers, maintenanceand cleanliness of premises and customer service. Arby’s monitors franchisee operations and inspects restaurantsperiodically to ensure that required practices and procedures are being followed.
See Note 5 and Note 23 of the Financial Statements and Supplementary Data included in Item 8 herein, andthe information under “Management’s Discussion and Analysis” in Item 7 herein, for further information regardingreserves, commitments and contingencies involving franchisees.
Advertising and Marketing
Arby’s advertises nationally on cable television networks. In addition, from time to time, Arby’s will sponsor anationally televised event or participate in a promotional tie-in for a movie. Locally, Arby’s primarily advertisesthrough regional network and cable television, radio and newspapers. The AFA Service Corporation (“AFA”), anindependent membership corporation in which every domestic Arby’s franchisee is required to participate, was formedto create advertising and perform marketing for the Arby’s system. Arby’s Chief Marketing Officer currently serves aspresident of AFA. AFA is managed by Arby’s pursuant to a Management Agreement, as described below. AFA isfunded primarily through member dues. From January 2010 and through March 2010, Arby’s and most domesticArby’s franchisees paid 1.2% of sales as dues to AFA. Beginning in April 2010 and for the remainder of 2010, theAFA Board approved a dues increase based on a tiered rate structure for the payment of the advertising and marketing
12

service fee ranging between 1.4% and 3.6% of sales. As a result, the average Arby’s advertising and marketing servicefee percentage from April 2010 to the end of the 2010 fiscal year was approximately 2.3%. In addition, Arby’spartially subsidized the top two rate tiers in 2010 thereby decreasing franchisees’ effective advertising and marketingservice fee percentages. This subsidy required payments by Arby’s of approximately $2.6 million to AFA in 2010.Beginning in January 2011 and for the remainder of 2011, the AFA Board approved a modified tiered rate structurefor the payment of the advertising and marketing service fee ranging between 1.25% and 3.5%. Arby’s will partiallysubsidize the top two rate tiers in 2011 thereby decreasing franchisees’ effective advertising and marketing service feepercentages. This subsidy is expected to require payments by Arby’s of approximately $2.9 million for2011. Domestic franchisee participants in the SMI program pay an extra 1% premium on the advertising andmarketing service fee (2.2% total through March 2010 and based on the tiered rate structure, an extra 1% on theadvertising and marketing service fee through December 2011) up to a maximum of 3% as AFA dues for the first 36months of operation; their AFA dues then revert to the standard advertising and marketing service fee rate without the1% premium.
Effective October 2005, Arby’s and AFA entered into a management agreement (the “ManagementAgreement”) pursuant to which Arby’s assumed general responsibility for the day-to-day operations of AFA, includingpreparing annual operating budgets, developing the brand marketing strategy and plan, recommending advertisingand media buying agencies, and implementing all marketing/media plans. Arby’s performs these tasks subject to theapproval of AFA’s Board of Directors. Under the Management Agreement, Arby’s is obligated to pay for the generaland administrative costs of AFA, other than the cost of an annual audit of AFA and certain other expenses specificallyretained by AFA. Under the Management Agreement, Arby’s is also required to provide AFA with appropriate officespace at no cost to the AFA. The Management Agreement with AFA continues in effect until terminated by Arby’supon one year’s prior written notice or by AFA upon six months’ prior written notice. See Note 24 of the FinancialStatements and Supplementary Data included in Item 8 herein, for further information on AFA.
In addition to their contributions to AFA, Arby’s and its domestic franchisees are also required to spend areasonable amount, but not less than 3% of sales of their Arby’s restaurants, for local advertising; however, with thenew AFA tiered rate structure discussed above, any AFA dues paid above 1.2% will be credited against the localadvertising spend requirements. Most existing franchise agreements now require, and new franchise agreements willrequire, domestic franchisees to spend a minimum aggregate advertising amount of 4.2% of sales for national andlocal advertising, which includes the advertising and marketing fee. The amount of expenditures for local advertisingis divided between (i) individual local market advertising expenses and (ii) expenses of a cooperative area advertisingprogram. Contributions to the cooperative area advertising program, in which both company-owned and franchisee-owned restaurants participate, are determined by the local cooperative participants and are generally in the range of3% to 5% of sales. Domestic franchisee participants in our SMI program are not, however, required to make anyexpenditure for local advertising until their restaurants have been in operation for 36 months.
Canadian Arby’s franchisees contribute to the Arby’s Franchise Association of Canada (“AFAC”), anindependent membership corporation in which every Canadian Arby’s franchisee is required to participate, which wasformed to create advertising and perform marketing for the Arby’s system in Canada. Effective May 2006, Arby’s andAFAC entered into a management agreement (the “Canadian Management Agreement”) pursuant to which Arby’sassumed general responsibility for the day-to-day operations of AFAC, including preparing annual operating budgets,developing the brand marketing strategy and plan, recommending advertising and media buying agencies, andimplements all marketing/media plans. Arby’s performs these tasks subject to the approval of AFAC’s Board ofDirectors. Under the Canadian Management Agreement, Arby’s is obligated to pay for the general and administrativecosts of AFAC, other than the cost of an annual audit of AFAC and certain other expenses specifically retained byAFAC. AFAC is funded primarily through member dues. Through August 2010, most Canadian franchisees paid 3%of sales as dues to AFAC. Beginning in September 2010, most Canadian franchisees pay 1.25% of sales as dues toAFAC.
In addition to their contributions to AFAC, Canadian Arby’s franchisees were required through August 2010 tocontribute 2.25% of sales for local advertising. Beginning in September 2010, Canadian Arby’s franchisees are nowrequired to contribute 4% of sales for local advertising. However, Canadian franchisees participating in the CanadianIncentive Program (“CIP”) are not required to contribute to local advertising for the first 36 months after a restaurantis opened.
See Note 26 of the Financial Statements and Supplementary Data included in Item 8 herein, for furtherinformation regarding advertising.
13
International Operations and Franchising
As of January 2, 2011, Arby’s had 106 franchised restaurants in Canada and 20 franchised restaurants in 3other countries. In June 2010, Arby’s announced a new development agreement for Turkey. Arby’s has granteddevelopment rights in the countries listed under Item 2 of this Form 10-K.
Arby’s is also the franchisor for the Arby’s brand in Canada. The rights and obligations governing thefranchised restaurants operating in Canada are set forth in a franchise agreement. This document provides the licenseethe right to own and operate an Arby’s restaurant upon a site accepted by Arby’s and to use the Arby’s system inconnection with the operation of the restaurant at that site. The traditional franchise agreement provides for a 20-yearterm and offers a renewal term subject to certain conditions. The franchisee pays to Arby’s a monthly royalty of 4% ofsales, as defined in the agreement, from the operation of the restaurant. The agreement also typically requires that thefranchisee pay Arby’s a franchise fee. The standard franchise fee is currently C$42,500 for the first restaurant andC$27,500 for each subsequent restaurant.
In 2007, in order to increase development of traditional Arby’s restaurants in selected Canadian markets, theCIP was introduced. Arby’s franchise agreement for participants in the CIP currently requires an initial C$27,500franchise fee for the first franchised unit, C$12,500 for each subsequent unit, and a monthly royalty payment equal to1.0% of restaurant sales for the first 36 months the unit is open. After 36 months, the monthly royalty rate reverts tothe prevailing 4% rate for the remaining term of the agreement. The commitment fee is C$5,000 per restaurant,which is credited against the franchise fee during the development process. The CIP remains in effect and does nothave a stated expiration date. However, Arby’s has the right to discontinue offering the CIP at any time.
Our market entry strategy and terms for the development and operation of Arby’s restaurants in marketsoutside of the United States and Canada vary depending upon market conditions.
General
Governmental Regulations
Various state laws and the Federal Trade Commission regulate Wendy’s and Arby’s franchising activities. TheFederal Trade Commission requires that franchisors make extensive disclosure to prospective franchisees before theexecution of a franchise agreement. Several states require registration and disclosure in connection with franchiseoffers and sales and have “franchise relationship laws” that limit the ability of franchisors to terminate franchiseagreements or to withhold consent to the renewal or transfer of these agreements. In addition, Wendy’s and Arby’sand their respective franchisees must comply with the federal Fair Labor Standards Act and similar state and locallaws, the Americans with Disabilities Act (the “ADA”), which requires that all public accommodations andcommercial facilities meet federal requirements related to access and use by disabled persons, and various state andlocal laws governing matters that include, for example, the handling, preparation and sale of food and beverages, theprovision of nutritional information on menu boards, minimum wages, overtime and other working and safetyconditions. Compliance with the ADA requirements could require removal of access barriers and non-compliancecould result in imposition of fines by the United States government or an award of damages to private litigants. Asdescribed more fully under “Item 3. Legal Proceedings,” one of Arby’s subsidiaries was a defendant in a lawsuitalleging failure to comply with Title III of the ADA at approximately 775 company-owned restaurants acquired aspart of Arby’s July 2005 acquisition of the RTM Restaurant Group (“RTM”). Under a court approved settlement ofthat lawsuit, we estimate that Arby’s will spend approximately $1.15 million per year of capital expenditures over aseven-year period (which commenced in 2008) to bring these restaurants into compliance with the ADA, in additionto paying certain legal fees and expenses. We do not believe that the costs related to this matter or any other costsrelating to compliance with the ADA will have a material adverse effect on the Companies’ consolidated financialposition or results of operations. We cannot predict the effect on our operations, particularly on our relationship withfranchisees, of any pending or future legislation.
Environmental Matters
Wendy’s/Arby’s and Wendy’s/Arby’s Restaurants past and present operations are governed by federal, state andlocal environmental laws and regulations concerning the discharge, storage, handling and disposal of hazardous ortoxic substances. These laws and regulations provide for significant fines, penalties and liabilities, sometimes withoutregard to whether the owner or operator of the property knew of, or was responsible for, the release or presence of the
14

hazardous or toxic substances. In addition, third parties may make claims against owners or operators of properties forpersonal injuries and property damage associated with releases of hazardous or toxic substances. We cannot predictwhat environmental legislation or regulations will be enacted in the future or how existing or future laws orregulations will be administered or interpreted. We similarly cannot predict the amount of future expenditures thatmay be required to comply with any environmental laws or regulations or to satisfy any claims relating toenvironmental laws or regulations. We believe that our operations comply substantially with all applicableenvironmental laws and regulations. Accordingly, the environmental matters in which we are involved generally relateeither to properties that our subsidiaries own, but on which they no longer have any operations, or properties that weor our subsidiaries have sold to third parties, but for which we or our subsidiaries remain liable or contingently liablefor any related environmental costs. Our company-owned Wendy’s and Arby’s restaurants have not been the subjectof any material environmental matters. Based on currently available information, including defenses available to usand/or our subsidiaries, and our current reserve levels, we do not believe that the ultimate outcome of theenvironmental matters in which we are involved will have a material adverse effect on our consolidated financialposition or results of operations.
Wendy’s/Arby’s and Wendy’s/Arby’s Restaurants are involved in litigation and claims incidental to our currentand prior businesses. As of January 2, 2011, Wendy’s/Arby’s Restaurants had reserves for all legal and environmentalmatters aggregating $3.7 million, which are included in the $3.9 million reserved by Wendy’s/Arby’s for all legal andenvironmental matters. Although the outcome of these matters cannot be predicted with certainty and some of thesematters may be disposed of unfavorably to us, based on currently available information, including legal defensesavailable to us, and given the aforementioned reserves and insurance coverage, we do not believe that the outcome ofthese legal and environmental matters will have a material adverse effect on our consolidated financial position orresults of operations.
Employees
As of January 2, 2011, the Companies and their subsidiaries had approximately 64,100 employees, includingapproximately 6,300 salaried employees and approximately 57,800 hourly employees. We believe that our employeerelations are satisfactory.
15

Item 1A.Risk Factors.
We wish to caution readers that in addition to the important factors described elsewhere in this Form 10-K, wehave included below the most significant factors that have affected, or in the future could affect, our actual results andcould cause our actual consolidated results during 2011, and beyond, to differ materially from those expressed in anyforward-looking statements made by us or on our behalf.
Risks Related to Wendy’s/Arby’s and Wendy’s/Arby’s Restaurants
The impact and results of our announcement that Wendy’s/Arby’s is exploring strategic alternatives for theArby’s brand, including a sale of the brand, are uncertain and cannot be determined.
In January 2011, Wendy’s/Arby’s announced that it is exploring strategic alternatives for the Arby’s brand,including a sale of the brand. There can be no assurance that the review of strategic alternatives will result in anyagreement or transaction, or that if an agreement is executed, that a transaction will be consummated. We do notintend to disclose developments with respect to this review (whether or not material) unless and until the Board ofDirectors has approved a specific course of action or terminated the exploration of strategic alternatives. In connectionwith our exploration of strategic alternatives, we expect to incur expenses, including expenses in connection with theretention of key personnel and consultants. The process of exploring strategic alternatives may be disruptive to ourbusiness. The inability to effectively manage the process and any resulting agreement or transaction could materiallyand adversely affect our business, financial condition or results of operations.
Our success depends in part upon the continued retention of certain key personnel.
We believe that over time our success has been dependent to a significant extent upon the efforts and abilities ofour senior management team. The failure by us to retain members of our senior management team could adverselyaffect our ability to build on the efforts we have undertaken to increase the efficiency and profitability of ourbusinesses. The retention of members of our senior management team may be more difficult following Wendy’s/Arby’s announcement that it is exploring strategic alternatives for the Arby’s brand, including the sale of the brand.
Growth of our restaurant businesses is significantly dependent on new restaurant openings, which may beaffected by factors beyond our control.
Our restaurant businesses derive earnings from sales at company-owned restaurants, franchise royalties receivedfrom franchised restaurants and franchise fees from franchise restaurant operators for each new unit opened. Growthin our restaurant revenues and earnings is significantly dependent on new restaurant openings. Numerous factorsbeyond our control may affect restaurant openings. These factors include but are not limited to:
• our ability to attract new franchisees;
• the availability of site locations for new restaurants;
• the ability of potential restaurant owners to obtain financing;
• the ability of restaurant owners to hire, train and retain qualified operating personnel;
• construction and development costs of new restaurants, particularly in highly-competitive markets;
• the ability of restaurant owners to secure required governmental approvals and permits in a timely manner,or at all; and
• adverse weather conditions.
Wendy’s and Arby’s franchisees could take actions that could harm our business.
Wendy’s and Arby’s franchisees are contractually obligated to operate their restaurants in accordance with thestandards set forth in agreements with them. Each brand also provides training and support to franchisees. However,franchisees are independent third parties that we do not control, and the franchisees own, operate and oversee thedaily operations of their restaurants. As a result, the ultimate success and quality of any franchise restaurant rests withthe franchisee. If franchisees do not successfully operate restaurants in a manner consistent with required standards,royalty payments to us will be adversely affected and the brand’s image and reputation could be harmed, which inturn could hurt our business and operating results.
16
Our success depends on franchisees’ participation in brand strategies.
Wendy’s and Arby’s franchisees are an integral part of our business. Each brand may be unable to successfullyimplement brand strategies that it believes are necessary for further growth if franchisees do not participate in thatimplementation. Our business and operating results could be adversely affected if a significant number of franchiseesdo not participate in brand strategies.
Our financial results are affected by the operating results of franchisees.
As of January 2, 2011, approximately 79% of the Wendy’s system and 69% of the Arby’s system were franchiserestaurants. We receive revenue in the form of royalties, which are generally based on a percentage of sales atfranchised restaurants, rent and fees from franchisees. Accordingly, a substantial portion of our financial results is to alarge extent dependent upon the operational and financial success of our franchisees. If sales trends or economicconditions worsen for franchisees, their financial results may worsen and our royalty, rent and other fee revenues maydecline. In addition, accounts receivable and related allowance for doubtful accounts may increase. When company-owned restaurants are sold, one of our subsidiaries is often required to remain responsible for lease payments for theserestaurants to the extent that the purchasing franchisees default on their leases. During periods of declining sales andprofitability of franchisees, such as have been recently experienced by a significant number of Arby’s franchisees and aminimal number of Wendy’s franchisees, the incidence of franchisee defaults for these lease payments increases andwe are then required to make those payments and seek recourse against the franchisee or agree to repaymentterms. Additionally, if franchisees fail to renew their franchise agreements, or if we decide to restructure franchiseagreements in order to induce franchisees to renew these agreements, then our royalty revenues may decrease. Further,we may decide from time to time to acquire restaurants from franchisees that experience significant financial hardship,which may reduce our cash and equivalents.
As of January 2, 2011, there were approximately 350 Arby’s franchised restaurants with amounts payable toArby’s for royalties, rent and/or other fees that were at least 60 days past due. The financial condition of a number ofArby’s franchisees was one of the factors that resulted in a net decrease of 44 and 31 in the number of franchisedrestaurants for fiscal 2010 and 2009, respectively. During those periods 96 and 74 franchised Arby’s restaurants wereclosed, respectively. The trend of declining sales at franchised Arby’s restaurants has resulted in decreases in royaltiesand other franchise revenues. In addition, Arby’s franchisee accounts receivable and related allowance for doubtfulaccounts have increased significantly, and may continue to grow as a result of the deteriorating financial condition ofsome of our franchisees. Franchisees’ financial difficulties and the closure of franchised restaurants have also causedreductions in the contributions to and extent of advertising programs. Continuation of these trends would affect ourrevenues and may have a material adverse effect on our results of operations and financial condition.
In December 2009, and as amended in February and August 2010, AFA entered into a revolving loanagreement with Arby’s. The terms of this agreement allow AFA to have revolving loans of up to $14.0 millionoutstanding with an expiration date of March 2012 and bearing interest at 7.5% per annum. In February 2011, themaximum principal amount was reduced to $11.0 million. As of January 2, 2011, the outstanding balance under thisagreement was $4.5 million and there were no amounts past due. Due to declining sales and profitability of Arby’sfranchisees, it is possible that our ability in the future to collect principal and interest payments from AFA could beadversely affected.
Each brand may be unable to manage effectively the acquisition and disposition of restaurants, which couldadversely affect our business and financial results.
Each brand acquires restaurants from franchisees and in some cases “re-franchises” these restaurants by sellingthem to new or existing franchisees. The success of these transactions is dependent upon the availability of sellers andbuyers, the availability of financing, and the brand’s ability to negotiate transactions on terms deemed acceptable. Inaddition, the operations of restaurants that each brand acquires may not be integrated successfully, and the intendedbenefits of such transactions may not be realized. Acquisitions of franchised restaurants pose various risks to brandoperations, including:
• diversion of management attention to the integration of acquired restaurant operations;
• increased operating expenses and the inability to achieve expected cost savings and operating efficiencies;
17

• exposure to liabilities arising out of sellers’ prior operations of acquired restaurants; and
• incurrence or assumption of debt to finance acquisitions or improvements and/or the assumption of long-term, non-cancelable leases.
In addition, engaging in acquisitions and dispositions places increased demands on the brand’s operational andfinancial management resources and may require us to continue to expand these resources. If either brand is unable tomanage the acquisition and disposition of restaurants effectively, its business and financial results could be adverselyaffected.
Arby’s does not exercise ultimate control over advertising for its restaurant system, which could harm sales andthe brand.
Arby’s franchisees control the provision of national advertising and marketing services to the Arby’s franchisesystem through AFA, a company controlled by Arby’s franchisees. Subject to Arby’s right to protect its trademarks,AFA has the right to approve all significant decisions regarding national marketing and advertising strategies and thecreative content of advertising for the Arby’s system. Although Arby’s has entered into a management agreementpursuant to which Arby’s, on behalf of AFA, manages the day-to-day operations of the AFA, many areas are stillsubject to ultimate approval by AFA’s independent board of directors, and the management agreement may beterminated for any reason by Arby’s upon one year’s prior notice or by AFA upon six months prior notice. See “Item1. Business—The Arby’s Restaurant System—Advertising and Marketing.” In addition, local cooperatives run byoperators of Arby’s restaurants in a particular local area (including Arby’s) make their own decisions regarding localadvertising expenditures, subject to the requirement to spend at least the specified minimum amounts. Arby’s lack ofcontrol over advertising could hurt sales and the Arby’s brand.
Neither Wendy’s nor Arby’s exercises ultimate control over purchasing for their respective restaurant system,which could harm sales or profitability and the brand.
Although Wendy’s and Arby’s ensure that all suppliers to their respective systems meet quality controlstandards, each brand’s franchisees control the purchasing of food, proprietary paper, equipment and other operatingsupplies from such suppliers through purchasing co-ops controlled by each brand’s franchisees. The co-ops negotiatenational contracts for such food, equipment and supplies. Wendy’s is entitled to appoint two representatives on theboard of directors of QSCC and participates in QSCC through its company-owned restaurants, but otherwise doesnot control the decisions and activities of QSCC except to ensure that all suppliers satisfy Wendy’s quality controlstandards. Arby’s is entitled to appoint one representative on the board of directors of ARCOP and participates inARCOP through its company-owned restaurants, but otherwise does not control the decisions and activities ofARCOP except to ensure that all suppliers satisfy Arby’s quality control standards. During the 2010 second quarter,QSCC and ARCOP, in consultation with Wendy’s/Arby’s Restaurants, established SSG to manage and operatepurchasing programs which combine the purchasing power of both Wendy’s and Arby’s company-owned andfranchised restaurants to create buying efficiencies for certain non-perishable goods, equipment and services. If any ofthese co-ops does not properly estimate the product needs of its respective system, makes poor purchasing decisions,or decides to cease its operations, system sales and operating costs could be adversely affected and the financialcondition of Wendy’s or Arby’s or the financial condition of each system’s franchisees could be hurt.
Should a sale of Arby’s occur as discussed in “Business—The Arby’s Restaurant System” in Item 1 herein,under the change of control provisions in the agreement that established SSG, the activities of SSG would be woundup. In the wind up process, the assets, personnel and functions of SSG would be transferred to QSCC and ARCOP assuch parties and Wendy’s/Arby’s Restaurants agree. In contemplation of a possible sale, the parties are in discussionregarding the dissolution of SSG and transferring SSG’s assets, personnel and functions to QSCC and ARCOP. Thedissolution of SSG could be disruptive to our business and the operations of QSCC and ARCOP, result in the loss ofexperienced personnel and adversely affect the financial condition of Wendy’s or Arby’s or the financial condition ofeach system’s franchisees.
Shortages or interruptions in the supply or delivery of perishable food products could damage the Wendy’sand/or Arby’s brand reputation and adversely affect our operating results.
Each brand and its franchisees are dependent on frequent deliveries of perishable food products that meet brandspecifications. Shortages or interruptions in the supply of perishable food products caused by unanticipated demand,
18

problems in production or distribution, disease or food-borne illnesses, inclement weather or other conditions couldadversely affect the availability, quality and cost of ingredients, which could lower our revenues, increase operatingcosts, damage brand reputation and otherwise harm our business and the businesses of our franchisees.
Food safety events, including instances of food-borne illness (such as salmonella or E. Coli) involving Wendy’s orArby’s or their respective supply chains, could create negative publicity and adversely affect sales at either or bothbrands.
Food safety is a top priority, and we dedicate substantial resources to ensure that our customers enjoy safe,quality food products. However, food safety events, including instances of food-borne illness (such as salmonella orE. Coli), have occurred in the food industry in the past, and could occur in the future.
Food safety events could adversely affect the price and availability of beef, poultry or other meats. As a result,Wendy’s and/or Arby’s restaurants could experience a significant increase in food costs if there are food safety eventswhether or not such events involve Wendy’s or Arby’s restaurants or restaurants of competitors.
In addition, food safety events, whether or not involving Wendy’s or Arby’s, could result in negative publicityfor Wendy’s and/or Arby’s or for the industry or market segments in which we operate. This negative publicity, aswell as any other negative publicity concerning types of food products Wendy’s or Arby’s serves, may reduce demandfor Wendy’s and/or Arby’s food and could result in a decrease in guest traffic to our restaurants as consumers shifttheir preferences to other products or food types. A decrease in guest traffic to our restaurants as a result of thesehealth concerns or negative publicity could result in a decline in sales at company-owned restaurants or in royaltiesfrom sales at franchised restaurants.
Consumer concerns regarding the nutritional aspects of beef, poultry, French fries or other products we sell orconcerns regarding the effects of disease outbreaks such as “mad cow disease” and avian influenza or “bird flu,”could affect demand for our products.
Consumer concerns regarding the nutritional aspects of beef, poultry, French fries or other products we sell orconcerns regarding the effects of disease outbreaks such as “mad cow disease” and avian influenza or “bird flu,” couldresult in less demand for our products and a decline in sales at company-owned restaurants and in the royalties thatwe receive from franchisees.
Changes in consumer tastes and preferences, and in discretionary consumer spending, could result in a decline insales at company-owned restaurants and in the royalties that we receive from franchisees.
The quick service restaurant industry is often affected by changes in consumer tastes, national, regional andlocal economic conditions, discretionary spending priorities, demographic trends, traffic patterns and the type,number and location of competing restaurants. Our success depends to a significant extent on discretionary consumerspending, which is influenced by general economic conditions and the availability of discretionaryincome. Accordingly, we may experience declines in sales during economic downturns. Any material decline in theamount of discretionary spending or a decline in consumer food-away-from-home spending could hurt our revenues,results of operations, business and financial condition.
If company-owned and franchised restaurants are unable to adapt to changes in consumer preferences andtrends, company-owned and franchised restaurants may lose customers and the resulting revenues from company-owned restaurants and the royalties that we receive from franchisees may decline.
The disruptions in the national and global economies and the financial markets may adversely impact ourrevenues, results of operations, business and financial condition.
The disruptions in the national and global economies and financial markets, and the related reductions in theavailability of credit, have resulted in high unemployment rates and declines in consumer confidence and spending,and have made it more difficult for businesses to obtain financing. If such conditions persist, then they may result insignificant declines in consumer food-away-from-home spending and customer traffic in our restaurants and those ofour franchisees. Such conditions may also adversely impact the ability of franchisees to build or purchase restaurants,remodel existing restaurants, renew expiring franchise agreements and make timely royalty and other payments. Therecan be no assurance that government responses to the disruptions in the financial markets will restore consumer
19

confidence, stabilize the markets or increase liquidity and the availability of credit. If we or our franchisees are unableto obtain borrowed funds on acceptable terms, or if conditions in the economy and the financial markets do notimprove, our revenues, results of operations, business and financial condition could be adversely affected.
Additionally, we have entered into interest rate swaps and other derivative contracts as described in Note 12 tothe Financial Statements and Supplementary Data included in Item 8 herein, and we may enter into additional swapsin the future. We are exposed to potential losses in the event of nonperformance by counterparties on theseinstruments, which could adversely affect our results of operations, financial condition and liquidity.
Changes in commodity costs (including beef and chicken), supply, fuel, utilities, distribution and otheroperating costs could harm results of operations.
Our profitability depends in part on our ability to anticipate and react to changes in commodity costs(including beef and chicken), supply, fuel, distribution and other operating costs. Any increase in these costs,especially beef or chicken prices, could harm operating results. In addition, each brand is susceptible to increases inthese costs as a result of other factors beyond its control, such as weather conditions, global demand, food safetyconcerns, product recalls and government regulations. Additionally, prices for feed ingredients used to produce beefand chicken could be adversely affected by changes in global weather patterns, which are inherentlyunpredictable. Increases in gasoline prices would result in the imposition of fuel surcharges by our distributors, whichwould increase our costs. Significant increases in gasoline prices could also result in a decrease in customer traffic atour restaurants, which could adversely affect our business. We cannot predict whether we will be able to anticipateand react to changing food costs by adjusting our purchasing practices and menu prices, and a failure to do so couldadversely affect our operating results. In addition, we may not seek to or be able to pass along price increases to ourcustomers.
Competition from other restaurant companies, or poor customer experience at Wendy’s or Arby’s restaurants,could hurt our brands.
The market segments in which company-owned and franchised Wendy’s and Arby’s restaurants compete arehighly competitive with respect to, among other things, price, food quality and presentation, service, location,convenience, and the nature and condition of the restaurant facility. If customers have a poor experience at a Wendy’sor Arby’s restaurant, whether at a company-owned or franchised restaurant, we may experience a decrease in guesttraffic. Further, Wendy’s and Arby’s restaurants compete with a variety of locally-owned restaurants, as well ascompetitive regional and national chains and franchises. Several of these chains compete by offering menu items thatare targeted at certain consumer groups or dietary trends. Additionally, many of our competitors have introducedlower cost, value meal menu options. Our revenues and those of our franchisees may be hurt by this product andprice competition.
Moreover, new companies, including operators outside the quick service restaurant industry, may enter ourmarket areas and target our customer base. For example, additional competitive pressures for prepared food purchaseshave come from deli sections and in-store cafes of a number of major grocery store chains, as well as from conveniencestores and casual dining outlets. Such competitors may have, among other things, lower operating costs, betterlocations, better facilities, better management, better products, more effective marketing and more efficientoperations. Many of our competitors have substantially greater financial, marketing, personnel and other resourcesthan we do, which may allow them to react to changes in pricing and marketing strategies in the quick servicerestaurant industry better than we can. Many of our competitors spend significantly more on advertising andmarketing than we do, which may give them a competitive advantage through higher levels of brand awareness amongconsumers. All such competition may adversely affect our revenues and profits by reducing revenues of company-owned restaurants and royalty payments from franchised restaurants.
Current restaurant locations may become unattractive, and attractive new locations may not be available for areasonable price, if at all.
The success of any restaurant depends in substantial part on its location. There can be no assurance that ourcurrent restaurant locations will continue to be attractive as demographic patterns change. Neighborhood oreconomic conditions where our restaurants are located could decline in the future, thus resulting in potentiallyreduced sales in those locations. In addition, rising real estate prices in some areas may restrict our ability and theability of franchisees to purchase or lease new desirable locations. If desirable locations cannot be obtained atreasonable prices, each brand’s ability to execute its growth strategies will be adversely affected.
20

Wendy’s and Arby’s business could be hurt by increased labor costs or labor shortages.
Labor is a primary component in the cost of operating our company-owned restaurants. Each brand devotessignificant resources to recruiting and training its managers and hourly employees. Increased labor costs due tocompetition, increased minimum wage or employee benefits costs (including government-mandated health carebenefits) or other factors would adversely impact our cost of sales and operating expenses. In addition, each brand’ssuccess depends on its ability to attract, motivate and retain qualified employees, including restaurant managers andstaff. If either brand is unable to do so, our results of operations could be adversely affected.
Each brand’s leasing and ownership of significant amounts of real estate exposes it to possible liabilities andlosses, including liabilities associated with environmental matters.
As of January 2, 2011, Wendy’s leased or owned the land and/or the building for 1,394 Wendy’s restaurantsand Arby’s leased or owned the land and/or the building for 1,144 Arby’s restaurants. Accordingly, each brand issubject to all of the risks associated with leasing and owning real estate. In particular, the value of our real propertyassets could decrease, and costs could increase, because of changes in the investment climate for real estate,demographic trends, supply or demand for the use of the restaurants, which may result from competition from similarrestaurants in the area, and liability for environmental matters.
Each brand is subject to federal, state and local environmental, health and safety laws and regulationsconcerning the discharge, storage, handling, release and disposal of hazardous or toxic substances. Theseenvironmental laws provide for significant fines, penalties and liabilities, sometimes without regard to whether theowner, operator or occupant of the property knew of, or was responsible for, the release or presence of the hazardousor toxic substances. Third parties may also make claims against owners, operators or occupants of properties forpersonal injuries and property damage associated with releases of, or actual or alleged exposure to, such substances. Anumber of our restaurant sites were formerly gas stations or are adjacent to current or former gas stations, or wereused for other commercial activities that can create environmental impacts. We may also acquire or lease these typesof sites in the future. We have not conducted a comprehensive environmental review of all of our properties. We maynot have identified all of the potential environmental liabilities at our leased and owned properties, and any suchliabilities identified in the future could cause us to incur significant costs, including costs associated with litigation,fines or clean-up responsibilities. In addition, we cannot predict what environmental legislation or regulations will beenacted in the future or how existing or future laws or regulations will be administered or interpreted. We cannotpredict the amount of future expenditures that may be required in order to comply with any environmental laws orregulations or to satisfy any such claims. See “Item 1. Business-General-Environmental Matters.”
Each brand leases real property generally for initial terms of 20 years with two to four additional options toextend the term of the leases in consecutive five-year increments. Many leases provide that the landlord may increasethe rent over the term of the lease and any renewals thereof. Most leases require us to pay all of the costs of insurance,taxes, maintenance and utilities. We generally cannot cancel these leases. If an existing or future restaurant is notprofitable, and we decide to close it, we may nonetheless be committed to perform our obligations under theapplicable lease including, among other things, paying the base rent for the balance of the lease term. In addition, aseach lease expires, we may fail to negotiate additional renewals or renewal options, either on commercially acceptableterms or at all, which could cause us to close stores in desirable locations.
Complaints or litigation may hurt each brand.
Wendy’s and Arby’s customers file complaints or lawsuits against us alleging that we are responsible for anillness or injury they suffered at or after a visit to a Wendy’s or Arby’s restaurant, or alleging that there was a problemwith food quality or operations at a Wendy’s or Arby’s restaurant. We are also subject to a variety of other claimsarising in the ordinary course of our business, including personal injury claims, contract claims, claims fromfranchisees (which tend to increase when franchisees experience declining sales and profitability) and claims allegingviolations of federal and state law regarding workplace and employment matters, discrimination and similar matters,including class action lawsuits related to these matters. Regardless of whether any claims against us are valid orwhether we are found to be liable, claims may be expensive to defend and may divert management’s attention awayfrom operations and hurt our performance. A judgment significantly in excess of our insurance coverage for anyclaims could materially adversely affect our financial condition or results of operations. Further, adverse publicityresulting from these claims may hurt us and our franchisees.
21

Additionally, the restaurant industry has been subject to a number of claims that the menus and actions ofrestaurant chains have led to the obesity of certain of their customers. Adverse publicity resulting from theseallegations may harm the reputation of our restaurants, even if the allegations are not directed against our restaurantsor are not valid, and even if we are not found liable or the concerns relate only to a single restaurant or a limitednumber of restaurants. Moreover, complaints, litigation or adverse publicity experienced by one or more of Wendy’sor Arby’s franchisees could also hurt our business as a whole.
Our current insurance may not provide adequate levels of coverage against claims that may be filed.
We currently maintain insurance we believe is adequate for businesses of our size and type. However, there aretypes of losses we may incur that cannot be insured against or that we believe are not economically reasonable toinsure, such as losses due to natural disasters or acts of terrorism. In addition, we currently self-insure a significantportion of expected losses under workers compensation, general liability and property insuranceprograms. Unanticipated changes in the actuarial assumptions and management estimates underlying our reserves forthese losses could result in materially different amounts of expense under these programs, which could harm ourbusiness and adversely affect our results of operations and financial condition.
Changes in legal or regulatory requirements, including franchising laws, accounting standards, payment cardindustry rules, overtime rules, minimum wage rates, government-mandated health care benefits, tax legislationand menu-board labeling requirements, may hurt our ability to open new restaurants or otherwise hurt ourexisting and future operations and results.
Each Wendy’s and Arby’s restaurant is subject to licensing and regulation by health, sanitation, safety and otheragencies in the state and/or municipality in which the restaurant is located, as well as to Federal laws, rules andregulations and requirements of non-governmental entities such as payment card industry rules. State and localgovernment authorities may enact laws, rules or regulations that impact restaurant operations and the cost ofconducting those operations. For example, recent efforts to require the listing of specified nutritional information onmenus and menu boards could adversely affect consumer demand for our products, could make our menu boards lessappealing and could increase our costs of doing business. There can be no assurance that we and/or our franchiseeswill not experience material difficulties or failures in obtaining the necessary licenses or approvals for new restaurants,which could delay the opening of such restaurants in the future. In addition, more stringent and varied requirementsof local governmental bodies with respect to tax, zoning, land use and environmental factors could delay or preventdevelopment of new restaurants in particular locations.
Federal laws, rules and regulations address many aspects of our business, such as franchising, minimum wagesand taxes. We and our franchisees are also subject to the Fair Labor Standards Act, which governs such matters asminimum wages, overtime and other working conditions, along with the ADA, family leave mandates and a variety ofother laws enacted by the states that govern these and other employment law matters. As described more fully under“Item 3. Legal Proceedings,” one of our subsidiaries was a defendant in a lawsuit alleging failure to comply with TitleIII of the ADA at approximately 775 company-owned restaurants acquired as part of the RTM acquisition by Arby’sin July 2005. Under a court approved settlement of that lawsuit, Arby’s estimates that it will spend approximately$1.15 million per year of capital expenditures over a seven-year period (which commenced in 2008) to bring theserestaurants into compliance with the ADA, in addition to paying certain legal fees and expenses. We cannot predictthe amount of any other future expenditures that may be required in order to permit company-owned restaurants tocomply with any changes in existing regulations or to comply with any future regulations that may become applicableto our businesses.
Recent Federal legislation regarding changes in government-mandated health care benefits are also anticipatedto increase our costs and the costs of our franchisees and may result in significant modifications to our employmentand hiring practices. Because of the absence of implementing regulations, we currently cannot predict the timing oramount of those cost increases or modifications to our business practices. However, the cost increases may be materialand such modifications to our business practices may be disruptive to our operations and impact our ability to attractand retain personnel.
Our operations are influenced by adverse weather conditions.
Weather, which is unpredictable, can impact Wendy’s and Arby’s restaurant sales. Harsh weather conditionsthat keep customers from dining out result in lost opportunities for our restaurants. A heavy snowstorm in theNortheast or Midwest or a hurricane in the Southeast can shut down an entire metropolitan area, resulting in a
22
reduction in sales in that area. Our first quarter includes winter months and historically has a lower level of sales atcompany-owned restaurants. Because a significant portion of our restaurant operating costs is fixed or semi-fixed innature, the loss of sales during these periods hurts our operating margins, and can result in restaurant operatinglosses. For these reasons, a quarter-to-quarter comparison may not be a good indication of either brand’s performanceor how it may perform in the future.
Due to the concentration of Wendy’s and Arby’s restaurants in particular geographic regions, our businessresults could be impacted by the adverse economic conditions prevailing in those regions regardless of the state ofthe national economy as a whole.
As of January 2, 2011, we and our franchisees operated Wendy’s or Arby’s restaurants in 50 states and 24foreign countries. As of January 2, 2011 as detailed in “Item 2. Properties,” the 8 leading states by number ofoperating units were: Ohio, Florida, Texas, Michigan, Georgia, Pennsylvania, California, and North Carolina. Thisgeographic concentration can cause economic conditions in particular areas of the country to have a disproportionateimpact on our overall results of operations. It is possible that adverse economic conditions in states or regions thatcontain a high concentration of Wendy’s and Arby’s restaurants could have a material adverse impact on our results ofoperations in the future.
Wendy’s/Arby’s Restaurants and its subsidiaries are subject to various restrictions, and substantially all of theirnon-real estate assets are pledged and subject to certain restrictions, under a Credit Agreement.
On May 24, 2010, Wendy’s/Arby’s Restaurants entered into a $650,000 Credit Agreement which includes a$500,000 senior secured term loan facility and a $150,000 senior secured revolving credit facility. The obligationsunder the Credit Agreement are secured by substantially all of the non-real estate assets of Wendy’s/Arby’sRestaurants and its domestic subsidiaries (other than certain unrestricted subsidiaries), the stock of its domesticsubsidiaries (other than certain unrestricted subsidiaries), 65% of the stock of certain of its foreign subsidiaries, as wellas by mortgages on certain restaurant properties. The affirmative and negative covenants in the Credit Agreementinclude, among others, preservation of corporate existence; payment of taxes; and maintenance of insurance; andlimitations on: indebtedness (including guarantee obligations of other indebtedness); liens; mergers, consolidations,liquidations and dissolutions; sales of assets; dividends and other payments in respect of capital stock; investments;payments of certain indebtedness; transactions with affiliates; changes in fiscal year; negative pledge clauses andclauses restricting subsidiary distributions; and material changes in lines of business. The financial covenantscontained in the Credit Agreement are (i) a consolidated interest coverage ratio, (ii) a consolidated senior securedleverage ratio and (iii) a consolidated senior secured lease adjusted leverage ratio. The covenants generally do notrestrict Wendy’s/Arby’s or any of Wendy’s/Arby’s subsidiaries that are not subsidiaries of Wendy’s/Arby’sRestaurants. If the Borrowers are unable to generate sufficient cash flow or otherwise obtain the funds necessary tomake required payments of interest or principal under, or are unable to comply with covenants of, the CreditAgreement, then they would be in default under the terms of the agreement, which would preclude the payment ofdividends to Wendy’s/Arby’s, restrict access to the revolving credit facility, and, under certain circumstances, permitthe lenders to accelerate the maturity of the indebtedness. See Note 11 of the Financial Statements andSupplementary Data included in Item 8 herein, for further information regarding the Credit Agreement.
Wendy’s/Arby’s Restaurants and its subsidiaries have a significant amount of debt outstanding. Suchindebtedness, along with the other contractual commitments of our subsidiaries, could adversely affect ourbusiness, financial condition and results of operations, as well as the ability of certain of our subsidiaries to meetpayment obligations under the Senior Notes and other debt.
Certain of Wendy’s/Arby’s subsidiaries have a significant amount of debt and debt service requirements. As ofJanuary 2, 2011, on a consolidated basis, there was approximately $1.6 billion of outstanding debt.
This level of debt could have significant consequences on our future operations, including:
• making it more difficult to meet payment and other obligations under the Senior Notes and otheroutstanding debt;
• resulting in an event of default if our subsidiaries fail to comply with the financial and other restrictivecovenants contained in debt agreements, which event of default could result in all of our subsidiaries’ debtbecoming immediately due and payable;
23
• reducing the availability of our cash flow to fund working capital, capital expenditures, acquisitions andother general corporate purposes, and limiting our ability to obtain additional financing for these purposes;
• subjecting us to the risk of increased sensitivity to interest rate increases on our indebtedness with variableinterest rates, including borrowings under the Credit Agreement;
• limiting our flexibility in planning for, or reacting to, and increasing our vulnerability to, changes in ourbusiness, the industry in which we operate and the general economy; and
• placing us at a competitive disadvantage compared to our competitors that are less leveraged.
In addition, certain of our subsidiaries also have significant contractual requirements for the purchase of softdrinks. Wendy’s has also provided loan guarantees to various lenders on behalf of franchisees entering into pooleddebt facility arrangements for new store development and equipment financing. Certain subsidiaries also guarantee orare contingently liable for certain leases of their respective franchisees for which they have been indemnified. Inaddition, certain subsidiaries also guarantee or are contingently liable for certain leases of their respective franchiseesfor which they have not been indemnified. These commitments could have an adverse effect on our liquidity and theability of our subsidiaries to meet payment obligations under the Senior Notes and other debt.
The ability to meet payment and other obligations under the debt instruments of our subsidiaries depends ontheir ability to generate significant cash flow in the future. This, to some extent, is subject to general economic,financial, competitive, legislative and regulatory factors as well as other factors that are beyond our control. We cannotassure you that our business will generate cash flow from operations, or that future borrowings will be available to usunder existing or any future credit facilities or otherwise, in an amount sufficient to enable our subsidiaries to meettheir payment obligations under the Senior Notes and other debt and to fund other liquidity needs. If our subsidiariesare not able to generate sufficient cash flow to service their debt obligations, they may need to refinance or restructuredebt, including the Senior Notes, sell assets, reduce or delay capital investments, or seek to raise additional capital. Ifour subsidiaries are unable to implement one or more of these alternatives, they may not be able to meet paymentobligations under the Senior Notes and other debt and other obligations.
We and our subsidiaries may still be able to incur substantially more debt. This could exacerbate further therisks associated with our substantial leverage.
We and our subsidiaries may be able to incur substantial additional indebtedness, including additionalsecured indebtedness, in the future. The terms of the Senior Notes indenture and the Credit Agreement restrict, butdo not completely prohibit, us or our subsidiaries from doing so. In addition, the Senior Notes indenture allowsWendy’s/Arby’s Restaurants to issue additional Senior Notes under certain circumstances, which will also beguaranteed by the guarantors of the Senior Notes. The indenture also allows Wendy’s/Arby’s Restaurants to incurcertain secured debt and allows our foreign subsidiaries to incur additional debt, which would be effectively senior tothe Senior Notes. In addition, the indenture does not prevent Wendy’s/Arby’s Restaurants from incurring otherliabilities that do not constitute indebtedness. If new debt or other liabilities are added to our current consolidateddebt levels, the related risks that we now face could intensify.
To service debt and meet its other cash needs, Wendy’s/Arby’s Restaurants will require a significant amount ofcash, which may not be generated or available to it.
The ability of Wendy’s/Arby’s Restaurants to make payments on, or repay or refinance, its debt, including theSenior Notes and the Credit Agreement, and to fund planned capital expenditures, dividends and other cash needswill depend largely upon its future operating performance. Future performance, to a certain extent, is subject togeneral economic, financial, competitive, legislative, regulatory and other factors that are beyond our control. Inaddition, the ability of Wendy’s/Arby’s Restaurants to borrow funds in the future to make payments on its debt willdepend on the satisfaction of the covenants in its credit facilities and other debt agreements, including the indenturegoverning the Senior Notes, the Credit Agreement and other agreements it may enter into in the future. Specifically,Wendy’s/Arby’s Restaurants will need to maintain specified financial ratios and satisfy financial condition tests. Thereis no assurance that the Wendy’s/Arby’s Restaurants business will generate sufficient cash flow from operations or thatfuture borrowings will be available under its credit facilities or from other sources in an amount sufficient to enable itto pay its debt, including the Senior Notes and Credit Agreement, or to fund its or Wendy’s/Arby’s dividend andother liquidity needs.
24

We may not be able to adequately protect our intellectual property, which could harm the value of our brandsand hurt our business.
Our intellectual property is material to the conduct of our business. We rely on a combination of trademarks,copyrights, service marks, trade secrets and similar intellectual property rights to protect our brands and otherintellectual property. The success of our business strategy depends, in part, on our continued ability to use ourexisting trademarks and service marks in order to increase brand awareness and further develop our branded productsin both existing and new markets. If our efforts to protect our intellectual property are not adequate, or if any thirdparty misappropriates or infringes on our intellectual property, either in print or on the Internet, the value of ourbrands may be harmed, which could have a material adverse effect on our business, including the failure of our brandsto achieve and maintain market acceptance. This could harm our image, brand or competitive position and, if wecommence litigation to enforce our rights, cause us to incur significant legal fees.
We franchise our restaurant brands to various franchisees. While we try to ensure that the quality of our brandsis maintained by all of our franchisees, we cannot assure you that these franchisees will not take actions that hurt thevalue of our intellectual property or the reputation of the Wendy’s and/or Arby’s restaurant system.
We have registered certain trademarks and have other trademark registrations pending in the United States andcertain foreign jurisdictions. The trademarks that we currently use have not been registered in all of the countriesoutside of the United States in which we do business or may do business in the future and may never be registered inall of these countries. We cannot assure you that all of the steps we have taken to protect our intellectual property inthe United States and foreign countries will be adequate. The laws of some foreign countries do not protectintellectual property rights to the same extent as the laws of the United States.
In addition, we cannot assure you that third parties will not claim infringement by us in the future. Any suchclaim, whether or not it has merit, could be time-consuming, result in costly litigation, cause delays in introducingnew menu items, require costly modifications to advertising and promotional materials or require us to enter intoroyalty or licensing agreements. As a result, any such claim could harm our business and cause a decline in our resultsof operations and financial condition.
Wendy’s plans to expand its new breakfast initiative in 2011. The breakfast daypart remains competitive andmarkets may prove difficult to penetrate.
The roll out of breakfast at Wendy’s has been accompanied by challenging competitive conditions, variedconsumer tastes and discretionary spending patterns that differ from lunch, snack, dinner and late night hours. Inaddition, breakfast sales can cannibalize sales during other parts of the day and may have negative impacts on foodand labor costs, advertising, and restaurant margins. Wendy’s plans to expand its breakfast initiative in 2011. Capitalinvestments will be required at company-owned restaurants that are added to the breakfast initiative. In addition,franchisees will be required to make capital investments in their restaurants that participate in the breakfastinitiative. As a result of all of these factors, breakfast sales and resulting profits may take longer than expected to reachtargeted levels or the planned rollout of breakfast may be delayed or may not occur.
Our international operations are subject to various factors of uncertainty and there is no assurance thatinternational operations will be profitable.
In addition to many of the risk factors described throughout this Item 1A, each brand’s business outside of theUnited States is subject to a number of additional factors, including international economic and political conditions,differing cultures and consumer preferences, the inability to adapt to international customer preferences, inadequatebrand infrastructure within foreign countries to support our international activities, inability to obtain adequatesupplies meeting our quality standards and product specifications or interruptions in obtaining such supplies,currency regulations and fluctuations, diverse government regulations and tax systems, uncertain or differinginterpretations of rights and obligations in connection with international franchise agreements and the collection ofroyalties from international franchisees, the availability and cost of land, construction costs, other legal, financial orregulatory impediments to the development and/or operation of new restaurants, and the availability of experiencedmanagement, appropriate franchisees, and joint venture partners. Although we believe we have developed the supportstructure required for international growth, there is no assurance that such growth will occur or that internationaloperations will be profitable.
25
We rely on computer systems and information technology to run our business. Any material failure, interruptionor security breach of our computer systems or information technology may adversely affect the operation of ourbusiness and results of operations.
We are significantly dependent upon our computer systems and information technology to properly conductour business. A failure or interruption of computer systems or information technology could result in the loss of data,business interruptions or delays in business operations. Also, despite our considerable efforts and technologicalresources to secure our computer systems and information technology, security breaches, such as unauthorized accessand computer viruses, may occur resulting in system disruptions, shutdowns or unauthorized disclosure ofconfidential information. Any security breach of our computer systems or information technology may result inadverse publicity, loss of sales and profits, penalties, competitive disadvantage, or loss resulting from misappropriationof information.
We may be required to recognize additional asset impairment and other asset-related charges.
We have significant amounts of long-lived assets, goodwill and intangible assets and have incurred impairmentcharges in the past with respect to those assets. In accordance with applicable accounting standards, we test forimpairment generally annually, or more frequently, if there are indicators of impairment, such as:
• significant adverse changes in the business climate;
• current period operating or cash flow losses combined with a history of operating or cash flow losses or aprojection or forecast that demonstrates continuing losses associated with long-lived assets;
• a current expectation that more-likely-than-not (e.g., a likelihood that is more than 50%) long-lived assetswill be sold or otherwise disposed of significantly before the end of their previously estimated useful life;and
• a significant drop in our stock price.
Based upon future economic and capital market conditions, as well as the operating performance of ourreporting units, future impairment charges could be incurred.
Risks Related to Wendy’s/Arby’s
There can be no assurance regarding whether or to what extent Wendy’s/Arby’s will pay dividends on itsCommon Stock in the future.
Holders of Wendy’s/Arby’s Common Stock will only be entitled to receive such dividends as its Board ofDirectors may declare out of funds legally available for such payments. Any dividends will be made at the discretion ofthe Board of Directors and will depend on Wendy’s/Arby’s earnings, financial condition, cash requirements and suchother factors as the Board of Directors may deem relevant from time to time.
Because Wendy’s/Arby’s is a holding company, its ability to declare and pay dividends is dependent upon cash,cash equivalents and short-term investments on hand and cash flows from its subsidiaries. The ability of its subsidiaries topay cash dividends and/or make loans or advances to the holding company will be dependent upon their respectiveabilities to achieve sufficient cash flows after satisfying their respective cash requirements, including subsidiary-level debtservice and revolving credit agreements, to enable the payment of such dividends or the making of such loans oradvances. The ability of any of its subsidiaries to pay cash dividends or other payments to Wendy’s/Arby’s will also belimited by restrictions in debt instruments currently existing or subsequently entered into by such subsidiaries, includingthe Credit Agreement and the Senior Notes indenture, which are described earlier in this Item 1A.
A substantial amount of Wendy’s/Arby’s Common Stock is concentrated in the hands of certain stockholders.
Nelson Peltz, Wendy’s/Arby’s Chairman and former Chief Executive Officer, and Peter May, Wendy’s/Arby’sVice Chairman and former President and Chief Operating Officer, beneficially own shares of Wendy’s/Arby’soutstanding Common Stock that collectively constitute approximately 24% of its total voting power.
Messrs. Peltz and May may, from time to time, acquire beneficial ownership of additional shares of CommonStock. On November 5, 2008, in connection with the tender offer of Trian Fund Management, L.P. and certainaffiliates thereof for up to 40 million shares of our Class A common stock, Wendy’s/Arby’s entered into an agreement(such agreement, as amended, the “Trian Agreement”) with Messrs. Peltz and May and several of their affiliates (the
26

“Covered Persons”) which provides, among other things, that: (i) to the extent the Covered Persons acquire any rightsin respect of our common stock so that the effect of such acquisition would increase their aggregate beneficialownership in Wendy’s/Arby’s common stock to greater than 25%, the Covered Persons may not engage in a businesscombination (within the meaning of Section 203 of the Delaware General Corporation Law ) for a period of threeyears following the date of such occurrence unless such transaction would be subject to one of the exceptions set forthin Section 203(b)(3) through (7) (assuming for these purposes that 15% in the definition of interested stockholdercontained in Section 203 was deemed to be 25%); (ii) for so long as Wendy’s/Arby’s has a class of equity securitiesthat is listed for trading on the New York Stock Exchange or any other national securities exchange, none of theCovered Persons shall solicit proxies or submit any proposal for the vote of its stockholders or recommend or requestor induce any other person to take any such actions or seek to advise, encourage or influence any other person withrespect to Wendy’s/Arby’s common stock, in each case, if the result of such action would be to cause the Board ofDirectors to be comprised of less than a majority of independent directors; and (iii) for so long as Wendy’s/Arby’s hasa class of equity securities that is listed for trading on the New York Stock Exchange or any other national securitiesexchange, none of the Covered Persons shall engage in certain affiliate transactions with Wendy’s/Arby’s without theprior approval of a majority of the Audit Committee or other committee of the Board of Directors that is comprisedof independent directors. The Trian Agreement will terminate upon the earliest to occur of (i) the Covered Personsbeneficially owning less than 15% of Wendy’s/Arby’s common stock, (ii) November 5, 2011 (with respect to clauses(ii) and (iii) of the preceding sentence), and (iii) at such time as any person not affiliated with the Covered Personsmakes an offer to purchase an amount of Wendy’s/Arby’s common stock which when added to Wendy’s/Arby’scommon stock already beneficially owned by such person and its affiliates and associates equals or exceeds 50% ormore of outstanding Wendy’s/Arby’s common stock or all or substantially all of Wendy’s/Arby’s assets or solicitsproxies with respect to a majority slate of directors.
This concentration of ownership gives Messrs. Peltz and May significant influence over the outcome of actionsrequiring stockholder approval. If in the future Messrs. Peltz and May were to acquire more than a majority ofWendy’s/Arby’s outstanding voting power, they would be able to determine the outcome of the election of membersof the Board of Directors and the outcome of corporate actions requiring majority stockholder approval, includingmergers, consolidations and the sale of all or substantially all of Wendy’s/Arby’s assets. They would also be in aposition to prevent or cause a change in control of Wendy’s/Arby’s.
Wendy’s/Arby’s certificate of incorporation contains certain anti-takeover provisions and permits our Board ofDirectors to issue preferred stock without stockholder approval and limits its ability to raise capital fromaffiliates.
Certain provisions in Wendy’s/Arby’s certificate of incorporation are intended to discourage or delay a hostiletakeover of control of Wendy’s/Arby’s. Wendy’s/Arby’s certificate of incorporation authorizes the issuance of shares of“blank check” preferred stock, which will have such designations, rights and preferences as may be determined fromtime to time by its Board of Directors. Accordingly, its Board of Directors is empowered, without stockholderapproval, to issue preferred stock with dividend, liquidation, conversion, voting or other rights that could adverselyaffect the voting power and other rights of the holders of its common stock. The preferred stock could be used todiscourage, delay or prevent a change in control of Wendy’s/Arby’s that is determined by its Board of Directors to beundesirable. Although Wendy’s/Arby’s has no present intention to issue any shares of preferred stock, it cannot assureyou that it will not do so in the future.
Wendy’s/Arby’s certificate of incorporation prohibits the issuance of preferred stock to affiliates, unless offeredratably to the holders of Wendy’s/Arby’s common stock, subject to an exception in the event that Wendy’s/Arby’s isin financial distress and the issuance is approved by its audit committee. This prohibition limits the ability to raisecapital from affiliates.
Risks Related to Wendy’s/Arby’s Restaurants
Wendy’s/Arby’s Restaurants is dependent on dividends and/or loans or advances from its subsidiaries to meet itsdebt service obligations.
The ability of Wendy’s/Arby’s Restaurants’ subsidiaries to pay cash dividends and/or make loans or advances toWendy’s/Arby’s Restaurants will be dependent upon their respective abilities to achieve sufficient cash flows aftersatisfying their respective cash requirements, including subsidiary-level debt service and revolving credit agreements,to enable the payment of such dividends or the making of such loans or advances. The ability of any of its subsidiaries
27
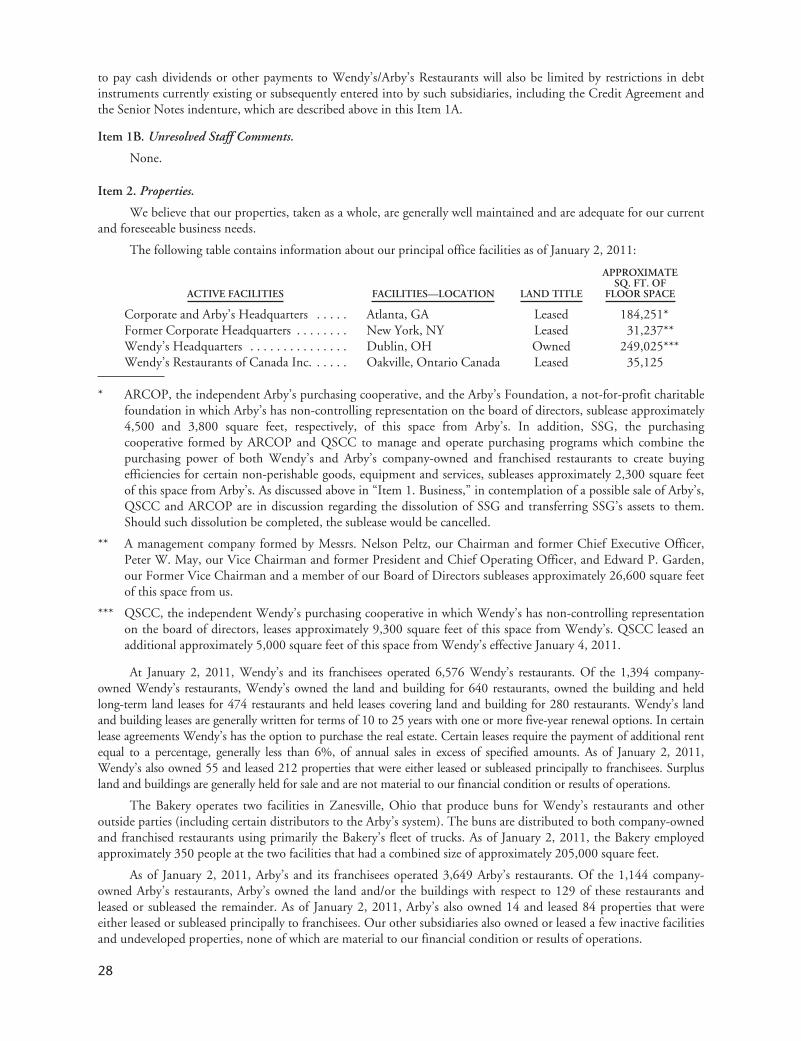
to pay cash dividends or other payments to Wendy’s/Arby’s Restaurants will also be limited by restrictions in debtinstruments currently existing or subsequently entered into by such subsidiaries, including the Credit Agreement andthe Senior Notes indenture, which are described above in this Item 1A.
Item 1B. Unresolved Staff Comments.
None.
Item 2. Properties.
We believe that our properties, taken as a whole, are generally well maintained and are adequate for our currentand foreseeable business needs.
The following table contains information about our principal office facilities as of January 2, 2011:
ACTIVE FACILITIES FACILITIES—LOCATION LAND TITLE
APPROXIMATESQ. FT. OF
FLOOR SPACE
Corporate and Arby’s Headquarters . . . . . Atlanta, GA Leased 184,251*Former Corporate Headquarters . . . . . . . . New York, NY Leased 31,237**Wendy’s Headquarters . . . . . . . . . . . . . . . Dublin, OH Owned 249,025***Wendy’s Restaurants of Canada Inc. . . . . . Oakville, Ontario Canada Leased 35,125
* ARCOP, the independent Arby’s purchasing cooperative, and the Arby’s Foundation, a not-for-profit charitablefoundation in which Arby’s has non-controlling representation on the board of directors, sublease approximately4,500 and 3,800 square feet, respectively, of this space from Arby’s. In addition, SSG, the purchasingcooperative formed by ARCOP and QSCC to manage and operate purchasing programs which combine thepurchasing power of both Wendy’s and Arby’s company-owned and franchised restaurants to create buyingefficiencies for certain non-perishable goods, equipment and services, subleases approximately 2,300 square feetof this space from Arby’s. As discussed above in “Item 1. Business,” in contemplation of a possible sale of Arby’s,QSCC and ARCOP are in discussion regarding the dissolution of SSG and transferring SSG’s assets to them.Should such dissolution be completed, the sublease would be cancelled.
** A management company formed by Messrs. Nelson Peltz, our Chairman and former Chief Executive Officer,Peter W. May, our Vice Chairman and former President and Chief Operating Officer, and Edward P. Garden,our Former Vice Chairman and a member of our Board of Directors subleases approximately 26,600 square feetof this space from us.
*** QSCC, the independent Wendy’s purchasing cooperative in which Wendy’s has non-controlling representationon the board of directors, leases approximately 9,300 square feet of this space from Wendy’s. QSCC leased anadditional approximately 5,000 square feet of this space from Wendy’s effective January 4, 2011.
At January 2, 2011, Wendy’s and its franchisees operated 6,576 Wendy’s restaurants. Of the 1,394 company-owned Wendy’s restaurants, Wendy’s owned the land and building for 640 restaurants, owned the building and heldlong-term land leases for 474 restaurants and held leases covering land and building for 280 restaurants. Wendy’s landand building leases are generally written for terms of 10 to 25 years with one or more five-year renewal options. In certainlease agreements Wendy’s has the option to purchase the real estate. Certain leases require the payment of additional rentequal to a percentage, generally less than 6%, of annual sales in excess of specified amounts. As of January 2, 2011,Wendy’s also owned 55 and leased 212 properties that were either leased or subleased principally to franchisees. Surplusland and buildings are generally held for sale and are not material to our financial condition or results of operations.
The Bakery operates two facilities in Zanesville, Ohio that produce buns for Wendy’s restaurants and otheroutside parties (including certain distributors to the Arby’s system). The buns are distributed to both company-ownedand franchised restaurants using primarily the Bakery’s fleet of trucks. As of January 2, 2011, the Bakery employedapproximately 350 people at the two facilities that had a combined size of approximately 205,000 square feet.
As of January 2, 2011, Arby’s and its franchisees operated 3,649 Arby’s restaurants. Of the 1,144 company-owned Arby’s restaurants, Arby’s owned the land and/or the buildings with respect to 129 of these restaurants andleased or subleased the remainder. As of January 2, 2011, Arby’s also owned 14 and leased 84 properties that wereeither leased or subleased principally to franchisees. Our other subsidiaries also owned or leased a few inactive facilitiesand undeveloped properties, none of which are material to our financial condition or results of operations.
28

The location of company-owned and franchised restaurants as of January 2, 2011 is set forth below.Wendy’s Arby’s
State Company Franchise Company Franchise
Alabama . . . . . . . . . . . . . . . . . . . . . . . . . . . . . . . . . . . . . . . . . . . . . . . . . — 96 70 32Alaska . . . . . . . . . . . . . . . . . . . . . . . . . . . . . . . . . . . . . . . . . . . . . . . . . . . — 7 — 9Arizona . . . . . . . . . . . . . . . . . . . . . . . . . . . . . . . . . . . . . . . . . . . . . . . . . . 46 55 — 83Arkansas . . . . . . . . . . . . . . . . . . . . . . . . . . . . . . . . . . . . . . . . . . . . . . . . . — 64 — 44California . . . . . . . . . . . . . . . . . . . . . . . . . . . . . . . . . . . . . . . . . . . . . . . . 56 216 28 92Colorado . . . . . . . . . . . . . . . . . . . . . . . . . . . . . . . . . . . . . . . . . . . . . . . . . 47 80 — 62Connecticut . . . . . . . . . . . . . . . . . . . . . . . . . . . . . . . . . . . . . . . . . . . . . . . 5 45 12 2Delaware . . . . . . . . . . . . . . . . . . . . . . . . . . . . . . . . . . . . . . . . . . . . . . . . . — 15 — 17Florida . . . . . . . . . . . . . . . . . . . . . . . . . . . . . . . . . . . . . . . . . . . . . . . . . . . 186 299 90 80Georgia . . . . . . . . . . . . . . . . . . . . . . . . . . . . . . . . . . . . . . . . . . . . . . . . . . 55 241 92 55Hawaii . . . . . . . . . . . . . . . . . . . . . . . . . . . . . . . . . . . . . . . . . . . . . . . . . . . 7 — — 9Idaho . . . . . . . . . . . . . . . . . . . . . . . . . . . . . . . . . . . . . . . . . . . . . . . . . . . . — 30 — 21Illinois . . . . . . . . . . . . . . . . . . . . . . . . . . . . . . . . . . . . . . . . . . . . . . . . . . . 98 94 5 125Indiana . . . . . . . . . . . . . . . . . . . . . . . . . . . . . . . . . . . . . . . . . . . . . . . . . . 5 173 99 80Iowa . . . . . . . . . . . . . . . . . . . . . . . . . . . . . . . . . . . . . . . . . . . . . . . . . . . . — 45 — 54Kansas . . . . . . . . . . . . . . . . . . . . . . . . . . . . . . . . . . . . . . . . . . . . . . . . . . . 11 63 — 52Kentucky . . . . . . . . . . . . . . . . . . . . . . . . . . . . . . . . . . . . . . . . . . . . . . . . . 3 140 48 84Louisiana . . . . . . . . . . . . . . . . . . . . . . . . . . . . . . . . . . . . . . . . . . . . . . . . . 56 73 — 27Maine . . . . . . . . . . . . . . . . . . . . . . . . . . . . . . . . . . . . . . . . . . . . . . . . . . . 5 15 — 8Maryland . . . . . . . . . . . . . . . . . . . . . . . . . . . . . . . . . . . . . . . . . . . . . . . . . — 115 17 32Massachusetts . . . . . . . . . . . . . . . . . . . . . . . . . . . . . . . . . . . . . . . . . . . . . 71 22 — 5Michigan . . . . . . . . . . . . . . . . . . . . . . . . . . . . . . . . . . . . . . . . . . . . . . . . . 21 249 107 78Minnesota . . . . . . . . . . . . . . . . . . . . . . . . . . . . . . . . . . . . . . . . . . . . . . . . — 67 83 3Mississippi . . . . . . . . . . . . . . . . . . . . . . . . . . . . . . . . . . . . . . . . . . . . . . . . 8 88 3 21Missouri . . . . . . . . . . . . . . . . . . . . . . . . . . . . . . . . . . . . . . . . . . . . . . . . . 35 56 4 81Montana . . . . . . . . . . . . . . . . . . . . . . . . . . . . . . . . . . . . . . . . . . . . . . . . . — 17 — 19Nebraska . . . . . . . . . . . . . . . . . . . . . . . . . . . . . . . . . . . . . . . . . . . . . . . . . — 34 — 50Nevada . . . . . . . . . . . . . . . . . . . . . . . . . . . . . . . . . . . . . . . . . . . . . . . . . . — 46 — 30New Hampshire . . . . . . . . . . . . . . . . . . . . . . . . . . . . . . . . . . . . . . . . . . . 4 21 — —New Jersey . . . . . . . . . . . . . . . . . . . . . . . . . . . . . . . . . . . . . . . . . . . . . . . 22 118 17 10New Mexico . . . . . . . . . . . . . . . . . . . . . . . . . . . . . . . . . . . . . . . . . . . . . . — 38 — 30New York . . . . . . . . . . . . . . . . . . . . . . . . . . . . . . . . . . . . . . . . . . . . . . . . 63 156 — 86North Carolina . . . . . . . . . . . . . . . . . . . . . . . . . . . . . . . . . . . . . . . . . . . . 40 217 60 78North Dakota . . . . . . . . . . . . . . . . . . . . . . . . . . . . . . . . . . . . . . . . . . . . . — 9 — 14Ohio . . . . . . . . . . . . . . . . . . . . . . . . . . . . . . . . . . . . . . . . . . . . . . . . . . . . 76 349 102 178Oklahoma . . . . . . . . . . . . . . . . . . . . . . . . . . . . . . . . . . . . . . . . . . . . . . . . — 38 — 95Oregon . . . . . . . . . . . . . . . . . . . . . . . . . . . . . . . . . . . . . . . . . . . . . . . . . . 19 33 21 16Pennsylvania . . . . . . . . . . . . . . . . . . . . . . . . . . . . . . . . . . . . . . . . . . . . . . 78 178 88 57Rhode Island . . . . . . . . . . . . . . . . . . . . . . . . . . . . . . . . . . . . . . . . . . . . . . 9 11 — —South Carolina . . . . . . . . . . . . . . . . . . . . . . . . . . . . . . . . . . . . . . . . . . . . — 131 13 64South Dakota . . . . . . . . . . . . . . . . . . . . . . . . . . . . . . . . . . . . . . . . . . . . . — 9 — 15Tennessee . . . . . . . . . . . . . . . . . . . . . . . . . . . . . . . . . . . . . . . . . . . . . . . . — 180 52 58Texas . . . . . . . . . . . . . . . . . . . . . . . . . . . . . . . . . . . . . . . . . . . . . . . . . . . . 73 321 68 104Utah . . . . . . . . . . . . . . . . . . . . . . . . . . . . . . . . . . . . . . . . . . . . . . . . . . . . 57 30 33 35Vermont . . . . . . . . . . . . . . . . . . . . . . . . . . . . . . . . . . . . . . . . . . . . . . . . . — 5 — —Virginia . . . . . . . . . . . . . . . . . . . . . . . . . . . . . . . . . . . . . . . . . . . . . . . . . . 53 160 2 107Washington . . . . . . . . . . . . . . . . . . . . . . . . . . . . . . . . . . . . . . . . . . . . . . . 27 45 24 40West Virginia . . . . . . . . . . . . . . . . . . . . . . . . . . . . . . . . . . . . . . . . . . . . . 22 51 1 35Wisconsin . . . . . . . . . . . . . . . . . . . . . . . . . . . . . . . . . . . . . . . . . . . . . . . . — 62 4 87Wyoming . . . . . . . . . . . . . . . . . . . . . . . . . . . . . . . . . . . . . . . . . . . . . . . . — 14 1 15District of Columbia . . . . . . . . . . . . . . . . . . . . . . . . . . . . . . . . . . . . . . . . — 4 — —
Domestic Subtotal . . . . . . . . . . . . . . . . . . . . . . . . . . . . . . . . . . . . . . . . . . 1,258 4,625 1,144 2,379Canada . . . . . . . . . . . . . . . . . . . . . . . . . . . . . . . . . . . . . . . . . . . . . . . . . . 136 232 — 106
North America Subtotal . . . . . . . . . . . . . . . . . . . . . . . . . . . . . . . . . . . . . 1,394 4,857 1,144 2,485
29

Wendy’s Arby’s
Country/Territory Company Franchise Company Franchise
Aruba . . . . . . . . . . . . . . . . . . . . . . . . . . . . . . . . . . . . . . . . . . . . . . . . . . . — 3 — —Bahamas . . . . . . . . . . . . . . . . . . . . . . . . . . . . . . . . . . . . . . . . . . . . . . . . . — 9 — —Cayman Islands . . . . . . . . . . . . . . . . . . . . . . . . . . . . . . . . . . . . . . . . . . . . — 3 — —Costa Rica . . . . . . . . . . . . . . . . . . . . . . . . . . . . . . . . . . . . . . . . . . . . . . . . — 7 — —Curacao . . . . . . . . . . . . . . . . . . . . . . . . . . . . . . . . . . . . . . . . . . . . . . . . . . — 1 — —Dominican Republic . . . . . . . . . . . . . . . . . . . . . . . . . . . . . . . . . . . . . . . . — 5 — —El Salvador . . . . . . . . . . . . . . . . . . . . . . . . . . . . . . . . . . . . . . . . . . . . . . . — 14 — —Guam . . . . . . . . . . . . . . . . . . . . . . . . . . . . . . . . . . . . . . . . . . . . . . . . . . . — 3 — —Guatemala . . . . . . . . . . . . . . . . . . . . . . . . . . . . . . . . . . . . . . . . . . . . . . . . — 9 — —Honduras . . . . . . . . . . . . . . . . . . . . . . . . . . . . . . . . . . . . . . . . . . . . . . . . — 29 — —Indonesia . . . . . . . . . . . . . . . . . . . . . . . . . . . . . . . . . . . . . . . . . . . . . . . . . — 27 — —Jamaica . . . . . . . . . . . . . . . . . . . . . . . . . . . . . . . . . . . . . . . . . . . . . . . . . . — 3 — —Malaysia . . . . . . . . . . . . . . . . . . . . . . . . . . . . . . . . . . . . . . . . . . . . . . . . . — 8 — —Mexico . . . . . . . . . . . . . . . . . . . . . . . . . . . . . . . . . . . . . . . . . . . . . . . . . . — 25 — —New Zealand . . . . . . . . . . . . . . . . . . . . . . . . . . . . . . . . . . . . . . . . . . . . . . — 16 — —Panama . . . . . . . . . . . . . . . . . . . . . . . . . . . . . . . . . . . . . . . . . . . . . . . . . . — 6 — —Philippines . . . . . . . . . . . . . . . . . . . . . . . . . . . . . . . . . . . . . . . . . . . . . . . — 31 — —Puerto Rico . . . . . . . . . . . . . . . . . . . . . . . . . . . . . . . . . . . . . . . . . . . . . . . — 72 — —Singapore . . . . . . . . . . . . . . . . . . . . . . . . . . . . . . . . . . . . . . . . . . . . . . . . — 8 — —Qatar . . . . . . . . . . . . . . . . . . . . . . . . . . . . . . . . . . . . . . . . . . . . . . . . . . . . — — — 1Turkey . . . . . . . . . . . . . . . . . . . . . . . . . . . . . . . . . . . . . . . . . . . . . . . . . . — — — 14United Arab Emirates . . . . . . . . . . . . . . . . . . . . . . . . . . . . . . . . . . . . . . . — 5 — 5Venezuela . . . . . . . . . . . . . . . . . . . . . . . . . . . . . . . . . . . . . . . . . . . . . . . . — 39 — —U. S. Virgin Islands . . . . . . . . . . . . . . . . . . . . . . . . . . . . . . . . . . . . . . . . . — 2 — —
International Subtotal . . . . . . . . . . . . . . . . . . . . . . . . . . . . . . . . . . . . . . . — 325 — 20
Grand Total . . . . . . . . . . . . . . . . . . . . . . . . . . . . . . . . . . . . . . . . . . . . . . 1,394 5,182 1,144 2,505
Item 3. Legal Proceedings.
In November 2002, Access Now, Inc. and Edward Resnick, later replaced by Christ Soter Tavantzis, on theirown behalf and on the behalf of all those similarly situated, brought an action in the United States District Court forthe Southern District of Florida against RTM Operating Company (“RTM”), which became a subsidiary of Arby’sfollowing Arby’s acquisition of the RTM Restaurant Group in July 2005. The complaint alleged that theapproximately 775 Arby’s restaurants owned by RTM and its affiliates failed to comply with Title III of theADA. The plaintiffs requested class certification and injunctive relief requiring RTM and such affiliates to complywith the ADA in all of their restaurants. The complaint did not seek monetary damages, but did seek attorneys’fees. Without admitting liability, RTM entered into a settlement agreement with the plaintiffs on a class-wide basis,which was approved by the court on August 10, 2006. The settlement agreement calls for the restaurants owned byRTM and certain of its affiliates to be brought into ADA compliance over an eight year period at a rate ofapproximately 100 restaurants per year. The settlement agreement also applies to restaurants subsequently acquired byRTM and such affiliates. Arby’s estimates that it will spend approximately $1.15 million per year of capitalexpenditures over a seven-year period (which commenced in 2008) to bring the restaurants into compliance under thesettlement agreement, in addition to paying certain legal fees and expenses.
In addition to the legal matter described above, we are involved in other litigation and claims incidental to ourcurrent and prior businesses. As of January 2, 2011, Wendy’s/Arby’s Restaurants had reserves for all legal andenvironmental matters aggregating $3.7 million, which are included in the $3.9 million reserved by Wendy’s/Arby’sfor all legal and environmental matters. Although the outcome of these matters cannot be predicted with certainty andsome of these matters may be disposed of unfavorably to us, based on our currently available information, includinglegal defenses available to us, and given the aforementioned reserves and insurance coverages, we do not believe thatthe outcome of these legal and environmental matters will have a material adverse effect on our consolidated financialposition or results of operations.
Item 4. (Removed and Reserved).
30

PART II
Item 5. Market for Registrant’s Common Equity, Related Stockholder Matters and Issuer Purchases of EquitySecurities.
(Wendy’s/Arby’s)
The principal market for Wendy’s/Arby’s Common Stock is the New York Stock Exchange (symbol: WEN).The high and low market prices for Wendy’s/Arby’s Common Stock, as reported in the consolidated transactionreporting system, are set forth below:
Fiscal Quarters
Market PriceCommon Stock
High Low
2010First Quarter ended April 4 . . . . . . . . . . . . . . . . . . . . . . . . . . . . . . . . . . . . . . . . . . $5.22 $4.26Second Quarter ended July 4 . . . . . . . . . . . . . . . . . . . . . . . . . . . . . . . . . . . . . . . . . 5.55 3.95Third Quarter ended October 3 . . . . . . . . . . . . . . . . . . . . . . . . . . . . . . . . . . . . . . . 4.73 3.83Fourth Quarter ended January 2 . . . . . . . . . . . . . . . . . . . . . . . . . . . . . . . . . . . . . . . 5.09 4.28
2009First Quarter ended March 29 . . . . . . . . . . . . . . . . . . . . . . . . . . . . . . . . . . . . . . . . $5.80 $3.86Second Quarter ended June 28 . . . . . . . . . . . . . . . . . . . . . . . . . . . . . . . . . . . . . . . . 5.78 3.55Third Quarter ended September 27 . . . . . . . . . . . . . . . . . . . . . . . . . . . . . . . . . . . . 5.54 3.80Fourth Quarter ended January 3 . . . . . . . . . . . . . . . . . . . . . . . . . . . . . . . . . . . . . . . 5.04 3.95
Wendy’s/Arby’s Common Stock is entitled to one vote per share on all matters on which stockholders areentitled to vote. Wendy’s/Arby’s has no class of equity securities currently issued and outstanding except for itsCommon Stock. However, it is currently authorized to issue up to 100 million shares of preferred stock.
During its 2010 fiscal year, Wendy’s/Arby’s paid quarterly cash dividends of $0.015 per share on its CommonStock on March 15, 2010, June 15, 2010 and September 15, 2010. The quarterly cash dividend paid onDecember 15, 2010 was $0.02 per share of Common Stock.
During its 2009 fiscal year, Wendy’s/Arby’s paid regular quarterly cash dividends of $0.015 per share ofCommon Stock.
During the 2011 first quarter, Wendy’s/Arby’s declared dividends of $0.02 per share to be paid on March 15,2011 to shareholders of record as of March 1, 2011. Although Wendy’s/Arby’s currently intends to continue todeclare and pay quarterly cash dividends, there can be no assurance that any additional quarterly cash dividends willbe declared or paid or the amount or timing of such dividends, if any. Any future dividends will be made at thediscretion of their Board of Directors and will be based on such factors as Wendy’s/Arby’s earnings, financialcondition, cash requirements and other factors.
As of February 25, 2011, there were approximately 46,206 holders of record of Wendy’s/Arby’s CommonStock.
31
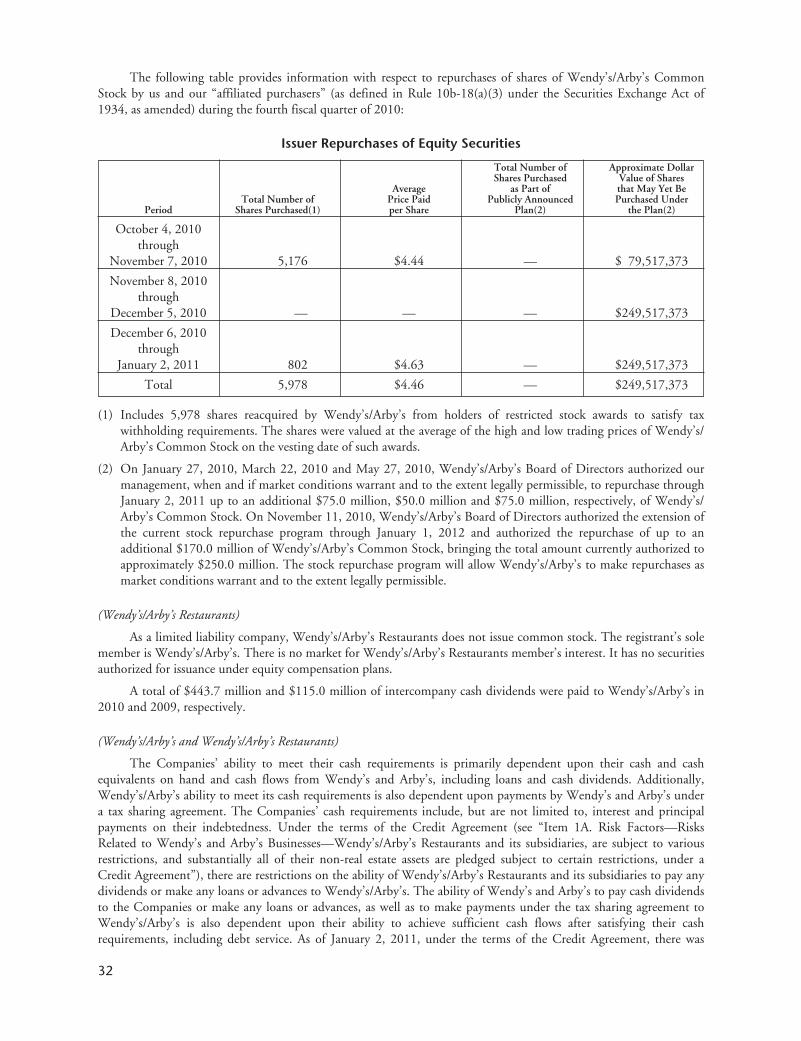
The following table provides information with respect to repurchases of shares of Wendy’s/Arby’s CommonStock by us and our “affiliated purchasers” (as defined in Rule 10b-18(a)(3) under the Securities Exchange Act of1934, as amended) during the fourth fiscal quarter of 2010:
Issuer Repurchases of Equity Securities
PeriodTotal Number of
Shares Purchased(1)
AveragePrice Paidper Share
Total Number ofShares Purchased
as Part ofPublicly Announced
Plan(2)
Approximate DollarValue of Sharesthat May Yet BePurchased Under
the Plan(2)
October 4, 2010through
November 7, 2010 5,176 $4.44 — $ 79,517,373
November 8, 2010through
December 5, 2010 — — — $249,517,373
December 6, 2010through
January 2, 2011 802 $4.63 — $249,517,373
Total 5,978 $4.46 — $249,517,373
(1) Includes 5,978 shares reacquired by Wendy’s/Arby’s from holders of restricted stock awards to satisfy taxwithholding requirements. The shares were valued at the average of the high and low trading prices of Wendy’s/Arby’s Common Stock on the vesting date of such awards.
(2) On January 27, 2010, March 22, 2010 and May 27, 2010, Wendy’s/Arby’s Board of Directors authorized ourmanagement, when and if market conditions warrant and to the extent legally permissible, to repurchase throughJanuary 2, 2011 up to an additional $75.0 million, $50.0 million and $75.0 million, respectively, of Wendy’s/Arby’s Common Stock. On November 11, 2010, Wendy’s/Arby’s Board of Directors authorized the extension ofthe current stock repurchase program through January 1, 2012 and authorized the repurchase of up to anadditional $170.0 million of Wendy’s/Arby’s Common Stock, bringing the total amount currently authorized toapproximately $250.0 million. The stock repurchase program will allow Wendy’s/Arby’s to make repurchases asmarket conditions warrant and to the extent legally permissible.
(Wendy’s/Arby’s Restaurants)
As a limited liability company, Wendy’s/Arby’s Restaurants does not issue common stock. The registrant’s solemember is Wendy’s/Arby’s. There is no market for Wendy’s/Arby’s Restaurants member’s interest. It has no securitiesauthorized for issuance under equity compensation plans.
A total of $443.7 million and $115.0 million of intercompany cash dividends were paid to Wendy’s/Arby’s in2010 and 2009, respectively.
(Wendy’s/Arby’s and Wendy’s/Arby’s Restaurants)
The Companies’ ability to meet their cash requirements is primarily dependent upon their cash and cashequivalents on hand and cash flows from Wendy’s and Arby’s, including loans and cash dividends. Additionally,Wendy’s/Arby’s ability to meet its cash requirements is also dependent upon payments by Wendy’s and Arby’s undera tax sharing agreement. The Companies’ cash requirements include, but are not limited to, interest and principalpayments on their indebtedness. Under the terms of the Credit Agreement (see “Item 1A. Risk Factors—RisksRelated to Wendy’s and Arby’s Businesses—Wendy’s/Arby’s Restaurants and its subsidiaries, are subject to variousrestrictions, and substantially all of their non-real estate assets are pledged subject to certain restrictions, under aCredit Agreement”), there are restrictions on the ability of Wendy’s/Arby’s Restaurants and its subsidiaries to pay anydividends or make any loans or advances to Wendy’s/Arby’s. The ability of Wendy’s and Arby’s to pay cash dividendsto the Companies or make any loans or advances, as well as to make payments under the tax sharing agreement toWendy’s/Arby’s is also dependent upon their ability to achieve sufficient cash flows after satisfying their cashrequirements, including debt service. As of January 2, 2011, under the terms of the Credit Agreement, there was
32

$25.6 million available for the payment of dividends directly to Wendy’s/Arby’s from Wendy’s/Arby’s Restaurants,Wendy’s, or Arby’s. See Note 11 of the Financial Statements and Supplementary Data included in Item 8 herein, and“Management’s Discussion and Analysis—Results of Operations and Liquidity and Capital Resources” in Item 7herein, for further information on the Credit Agreement.
Item 6. Selected Financial Data.
(Wendy’s/Arby’s)
Year Ended (1)
January 2,2011
January 3,2010
December 28,2008(2)
December 30,2007(2)
December 31,2006(2)
(In Millions, except per share amounts)
Sales . . . . . . . . . . . . . . . . . . . . . . . . . . . . . . . . . . . . $3,045.3 $3,198.3 $1,662.3 $1,113.4 $1,073.3Franchise revenues . . . . . . . . . . . . . . . . . . . . . . . . . 371.1 382.5 160.5 87.0 82.0Asset management and related fees . . . . . . . . . . . . . — — — 63.3 88.0
Revenues . . . . . . . . . . . . . . . . . . . . . . . . . . . . . . . . . 3,416.4 3,580.8 1,822.8 1,263.7 1,243.3Operating profit (loss) . . . . . . . . . . . . . . . . . . . . . . . 132.4(5) 112.0(6) (413.6)(7) 19.9(8) 44.6(Loss) income from continuing operations . . . . . . . (4.3)(5) 3.5(6) (482.0)(7) 15.1(8) 0.7(9)Income from discontinued operations . . . . . . . . . . . — 1.6 2.2 1.0 —Net (loss) income . . . . . . . . . . . . . . . . . . . . . . . . . . (4.3)(5) 5.1(6) (479.8)(7) 16.1(8) (10.9)(9)Basic and diluted income (loss) per share (3):
Continuing operations:Common stock . . . . . . . . . . . . . . . . . . . . . . . . (.01) .01 (3.06) .15 (.13)Class B common stock . . . . . . . . . . . . . . . . . . N/A N/A (1.26) .17 (.13)
Discontinued operations:Common stock . . . . . . . . . . . . . . . . . . . . . . . . N/A — .01 .01 N/AClass B common stock . . . . . . . . . . . . . . . . . . N/A N/A .02 .01 N/A
Net (loss) incomeCommon stock . . . . . . . . . . . . . . . . . . . . . . . . (.01) .01 (3.05) .16 (.13)Class B common stock . . . . . . . . . . . . . . . . . . N/A N/A (1.24) .18 (.13)
Cash dividends per share:Common stock . . . . . . . . . . . . . . . . . . . . . . . . . . .07 .06 .26 .32 .77Class B common stock . . . . . . . . . . . . . . . . . . . . N/A N/A .26 .36 .81
Weighted average shares outstanding (4):Common stock . . . . . . . . . . . . . . . . . . . . . . . . . . 426.3 466.2 137.7 28.8 27.3Class B common stock . . . . . . . . . . . . . . . . . . . . N/A N/A 48.0 63.5 59.3
January 2,2011
January 3,2010
December 28,2008(2)
December 30,2007(2)
December 31,2006(2)
(In Millions)
Working capital (deficiency) . . . . . . . . . . . . . . . . . . $ 333.3 $ 403.8 $ (121.7) $ (36.9) $ 161.2Properties . . . . . . . . . . . . . . . . . . . . . . . . . . . . . . . . 1,551.3 1,619.2 1,770.4 504.9 488.5Total assets . . . . . . . . . . . . . . . . . . . . . . . . . . . . . . . 4,732.7 4,975.4 4,645.6 1,454.6 1,560.4Long-term debt, including current portion . . . . . . . 1,572.4 1,522.9 1,111.6 739.3 720.0Stockholders’ equity . . . . . . . . . . . . . . . . . . . . . . . . 2,163.2 2,336.3 2,383.4 449.8 492.0
(1) Wendy’s/Arby’s reports on a fiscal year consisting of 52 or 53 weeks ending on the Sunday closest toDecember 31. Except for the 2009 fiscal year, which contained 53 weeks, each of Wendy’s/Arby’s fiscal yearspresented above contained 52 weeks. All references to years relate to fiscal years rather than calendar years. Thefinancial position and results of operations of Wendy’s are included commencing with the date of the Wendy’sMerger, September 29, 2008. Immediately prior to the Wendy’s Merger, each share of our Class B commonstock was converted into Class A common stock on a one for one basis. In connection with the May 28, 2009amendment and restatement of Wendy’s/Arby’s Certificate of Incorporation, Wendy’s/Arby’s former Class Acommon stock is now referred to as “Common Stock.” Deerfield & Company LLC (“Deerfield”), in whichWendy’s/Arby’s held a 63.6% capital interest from July 22, 2004 through its sale on December 21, 2007,
33

Deerfield Opportunities Fund, LLC, which commenced on October 4, 2004 and in which our investment waseffectively redeemed on September 29, 2006, and DM Fund LLC, which commenced on March 1, 2005 and inwhich Wendy’s/Arby’s investment was effectively redeemed on December 31, 2006, reported on a calendar yearending on December 31 through their respective sale or redemption dates.
(2) Selected financial data reflects the changes related to the adoption of the following accounting standards:
(a) As of December 29, 2008, Wendy’s/Arby’s adopted new accounting guidance related to non-controllinginterests (formerly referred to as minority interests). This adoption resulted in the retrospective reclassification ofminority interests from its former presentation as a liability to “Stockholders’ equity.” The reclassifications were$0.l million, $0.9 million, and $14.2 million for 2008, 2007 and 2006 respectively. Additionally, in accordancewith the new guidance, the loss from continuing operations in 2006 excludes the effect of income attributable tonon-controlling interests of $11.5 million. Income attributable to non-controlling interests in 2008 and 2007 wasnot material.
(b) As of January 1, 2007, Wendy’s/Arby’s utilized a recognition threshold and measurement attribute forfinancial statement recognition and measurement of potential tax benefits associated with tax positions taken orexpected to be taken in income tax returns. Wendy’s/Arby’s utilized a two-step process of evaluating a taxposition, whereby an entity first determines if it is more likely than not that a tax position will be sustained uponexamination, including resolution of any related appeals or litigation processes, based on the technical merits ofthe position. A tax position that meets the more-likely-than-not recognition threshold is then measured forpurposes of financial statement recognition as the largest amount of benefit that is greater than 50 percent likelyof being realized upon being effectively settled. There was no effect on the 2007 or prior period statements ofoperations. However, there was a net reduction of $2.3 million in stockholders’ equity as of January 1, 2007.
(3) For the purposes of calculating income per share amounts for 2007, net income was allocated between the sharesof Wendy’s/Arby’s Class A common stock and Wendy’s/Arby’s Class B common stock based on the actualdividend payment ratio. For the purposes of calculating loss per share, the net loss for all years through 2008 wasallocated equally between Class A common stock and Class B common stock.
(4) The number of shares used in the calculation of diluted income per share in 2009 and 2007 consist of theweighted average common shares outstanding for each class of common stock and potential shares of commonstock reflecting the effect of 483 dilutive stock options and nonvested restricted shares for 2009 and 129 forWendy’s/Arby’s Class A common stock and 759 for Wendy’s/Arby’s Class B common stock for 2007. Thenumber of shares used in the calculation of diluted income (loss) per share is the same as basic income (loss) pershare for 2010, 2008 and 2006 since all potentially dilutive securities would have had an antidilutive effect basedon the loss from continuing operations for these years.
(5) Reflects certain significant charges recorded during 2010 as follows: $69.4 million charged to operating profit forimpairment of long-lived assets other than goodwill; $43.0 million charged to loss from continuing operationsand net loss related to these charges; and $16.2 million charged to loss from continuing operations and net lossrelated to costs incurred for the early extinguishment of debt, which was comprised of a premium paymentrequired to redeem the Wendy’s 6.25% senior notes, the write-off of the unaccreted discount of the Wendy’s6.25% senior notes, and the write-off of deferred costs associated with the repayment of the Wendy’s/Arby’sRestaurants prior senior secured term loan.
(6) Reflects significant charges recorded in 2009 of $82.1 million charged to operating profit for impairment of long-lived assets other than goodwill and $50.9 million charged to income from continuing operations and net incomerelated to these charges.
(7) Reflects certain significant charges and credits recorded during 2008 as follows: $460.1 million charged tooperating loss consisting of a goodwill impairment for the Arby’s company-owned restaurant reporting unit;$484.0 million charged to loss from continuing operations and net loss representing the aforementioned $460.1million charged to operating loss and other than temporary losses on investments of $112.7 million partiallyoffset by $88.8 million of income tax benefit related to the above charges.
(8) Reflects certain significant charges and credits recorded during 2007 as follows: $45.2 million charged tooperating profit, consisting of facilities relocation and restructuring costs of $85.4 million less $40.2 million fromthe gain on sale of Wendy’s/Arby’s interest in Deerfield; $16.6 million charged to income from continuingoperations and net income representing the aforementioned $45.2 million charged to operating profit offset by
34

$15.8 million of income tax benefit related to the above charge, and a $12.8 million previously unrecognizedprior year contingent tax benefit related to certain severance obligations to certain of Wendy’s/Arby’s formerexecutives.
(9) Reflects a significant charge recorded during 2006 as follows: $9.0 million charged to loss from continuingoperations and net loss representing a $14.1 million loss on early extinguishments of debt related to conversionsor effective conversions of Wendy’s/Arby’s 5% convertible notes due 2023 and prepayments of term loans underWendy’s/Arby’s senior secured term loan facility, partially offset by an income tax benefit of $5.1 million relatedto the above charge.
(Wendy’s/Arby’s Restaurants)
Omitted pursuant to General Instruction I of Form 10-K.
Item 7. Management’s Discussion and Analysis of Financial Condition and Results of Operations.
This “Management’s Discussion and Analysis of Financial Condition and Results of Operations” of Wendy’s/Arby’s Group, Inc. (“Wendy’s/Arby’s”) and Wendy’s/Arby’s Restaurants, LLC (“Wendy’s/Arby’s Restaurants”)should be read in conjunction with the consolidated financial statements and the related notes that appear elsewherewithin this report. Certain statements we make under this Item 7 constitute “forward-looking statements” under thePrivate Securities Litigation Reform Act of 1995. See “Special Note Regarding Forward-Looking Statements andProjections” in “Part 1” preceding “Item 1—Business.” You should consider our forward-looking statements in lightof the risks discussed under the heading “Risk Factors” in Item 1A above, as well as our consolidated financialstatements, related notes, and other financial information appearing elsewhere in this report and our other filings withthe Securities and Exchange Commission.
Except where otherwise indicated, this discussion relates to the consolidated financial statements for bothWendy’s/Arby’s and Wendy’s/Arby’s Restaurants (the “Companies”). References herein to Wendy’s/Arby’s corporate(“Corporate”) represents Wendy’s/Arby’s parent company functions only and their effect on the consolidated resultsof operations and financial condition.
Wendy’s/Arby’s is the parent company of its 100% owned subsidiary holding company Wendy’s/Arby’sRestaurants. Wendy’s/Arby’s Restaurants is the parent company of Wendy’s International, Inc. (“Wendy’s”) andArby’s Restaurant Group, Inc. (“Arby’s”), which are the owners and franchisors of the Wendy’s® and Arby’s®
restaurant systems, respectively. On September 29, 2008, Wendy’s/Arby’s (formerly Triarc Companies, Inc. or“Triarc”) completed the merger (the “Wendy’s Merger”) with Wendy’s described below under “Introduction andExecutive Overview—Merger with Wendy’s International, Inc.”
Wendy’s/Arby’s Restaurants sole asset at formation consisted of the contribution by Wendy’s/Arby’s of itsinvestment in Wendy’s. In March 2009, Wendy’s/Arby’s contributed its longstanding investment in Arby’s toWendy’s/Arby’s Restaurants. Wendy’s/Arby’s Restaurants has no operations other than those of Wendy’s and Arby’sand their respective subsidiaries.
The Wendy’s Merger was completed on the first day of our 2008 fourth quarter and the results of operations ofWendy’s are included in our results beginning in the fourth quarter of 2008. The results of operations discussedbelow for 2008 are not indicative of future results due to the consummation of the Wendy’s Merger.
Introduction and Executive Overview
Our Business
We currently manage and internally report our operations as two business segments: the operation andfranchising of Wendy’s restaurants, including its wholesale bakery operations, and the operation and franchising ofArby’s restaurants. As of January 2, 2011, the Wendy’s restaurant system was comprised of 6,576 restaurants, ofwhich 1,394 were owned and operated by the Companies. As of January 2, 2011, the Arby’s restaurant system wascomprised of 3,649 restaurants, of which 1,144 were owned and operated by the Companies. The 2,538 Wendy’s andArby’s company-owned restaurants are located principally in the United States and to a lesser extent in Canada (the“North America Restaurants”). In January 2011, we announced that we are exploring strategic alternatives for Arby’s,including a sale of the brand.
35
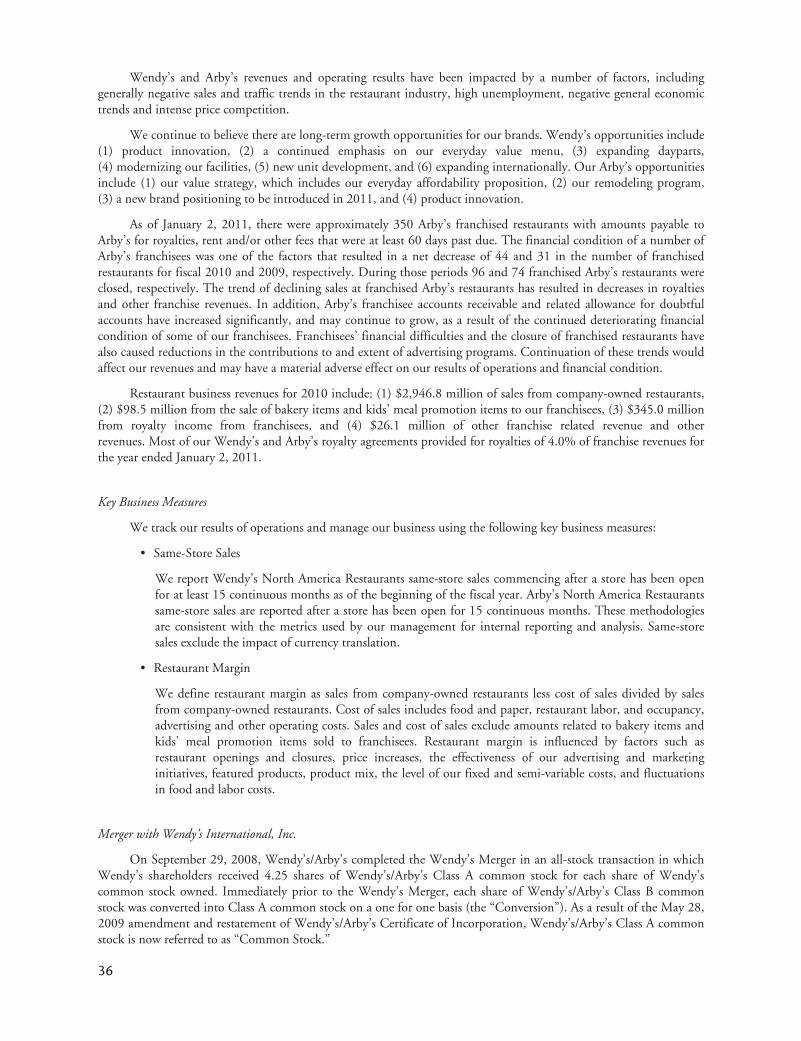
Wendy’s and Arby’s revenues and operating results have been impacted by a number of factors, includinggenerally negative sales and traffic trends in the restaurant industry, high unemployment, negative general economictrends and intense price competition.
We continue to believe there are long-term growth opportunities for our brands. Wendy’s opportunities include(1) product innovation, (2) a continued emphasis on our everyday value menu, (3) expanding dayparts,(4) modernizing our facilities, (5) new unit development, and (6) expanding internationally. Our Arby’s opportunitiesinclude (1) our value strategy, which includes our everyday affordability proposition, (2) our remodeling program,(3) a new brand positioning to be introduced in 2011, and (4) product innovation.
As of January 2, 2011, there were approximately 350 Arby’s franchised restaurants with amounts payable toArby’s for royalties, rent and/or other fees that were at least 60 days past due. The financial condition of a number ofArby’s franchisees was one of the factors that resulted in a net decrease of 44 and 31 in the number of franchisedrestaurants for fiscal 2010 and 2009, respectively. During those periods 96 and 74 franchised Arby’s restaurants wereclosed, respectively. The trend of declining sales at franchised Arby’s restaurants has resulted in decreases in royaltiesand other franchise revenues. In addition, Arby’s franchisee accounts receivable and related allowance for doubtfulaccounts have increased significantly, and may continue to grow, as a result of the continued deteriorating financialcondition of some of our franchisees. Franchisees’ financial difficulties and the closure of franchised restaurants havealso caused reductions in the contributions to and extent of advertising programs. Continuation of these trends wouldaffect our revenues and may have a material adverse effect on our results of operations and financial condition.
Restaurant business revenues for 2010 include: (1) $2,946.8 million of sales from company-owned restaurants,(2) $98.5 million from the sale of bakery items and kids’ meal promotion items to our franchisees, (3) $345.0 millionfrom royalty income from franchisees, and (4) $26.1 million of other franchise related revenue and otherrevenues. Most of our Wendy’s and Arby’s royalty agreements provided for royalties of 4.0% of franchise revenues forthe year ended January 2, 2011.
Key Business Measures
We track our results of operations and manage our business using the following key business measures:
• Same-Store Sales
We report Wendy’s North America Restaurants same-store sales commencing after a store has been openfor at least 15 continuous months as of the beginning of the fiscal year. Arby’s North America Restaurantssame-store sales are reported after a store has been open for 15 continuous months. These methodologiesare consistent with the metrics used by our management for internal reporting and analysis. Same-storesales exclude the impact of currency translation.
• Restaurant Margin
We define restaurant margin as sales from company-owned restaurants less cost of sales divided by salesfrom company-owned restaurants. Cost of sales includes food and paper, restaurant labor, and occupancy,advertising and other operating costs. Sales and cost of sales exclude amounts related to bakery items andkids’ meal promotion items sold to franchisees. Restaurant margin is influenced by factors such asrestaurant openings and closures, price increases, the effectiveness of our advertising and marketinginitiatives, featured products, product mix, the level of our fixed and semi-variable costs, and fluctuationsin food and labor costs.
Merger with Wendy’s International, Inc.
On September 29, 2008, Wendy’s/Arby’s completed the Wendy’s Merger in an all-stock transaction in whichWendy’s shareholders received 4.25 shares of Wendy’s/Arby’s Class A common stock for each share of Wendy’scommon stock owned. Immediately prior to the Wendy’s Merger, each share of Wendy’s/Arby’s Class B commonstock was converted into Class A common stock on a one for one basis (the “Conversion”). As a result of the May 28,2009 amendment and restatement of Wendy’s/Arby’s Certificate of Incorporation, Wendy’s/Arby’s Class A commonstock is now referred to as “Common Stock.”
36
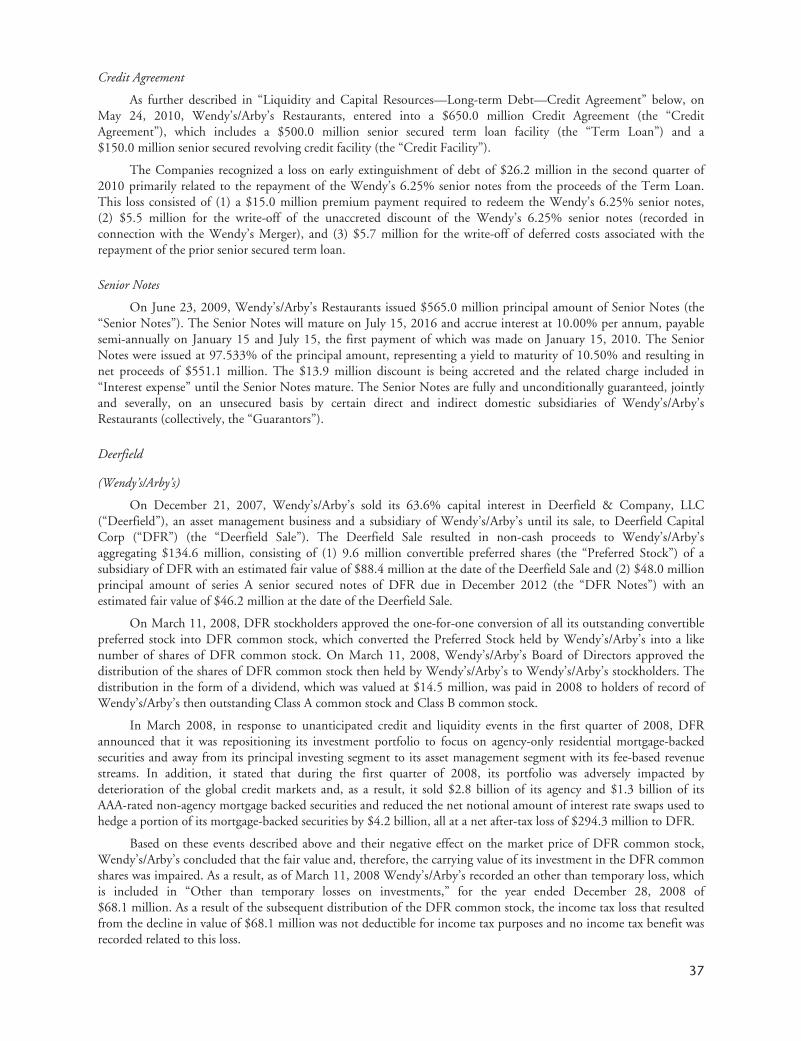
Credit Agreement
As further described in “Liquidity and Capital Resources—Long-term Debt—Credit Agreement” below, onMay 24, 2010, Wendy’s/Arby’s Restaurants, entered into a $650.0 million Credit Agreement (the “CreditAgreement”), which includes a $500.0 million senior secured term loan facility (the “Term Loan”) and a$150.0 million senior secured revolving credit facility (the “Credit Facility”).
The Companies recognized a loss on early extinguishment of debt of $26.2 million in the second quarter of2010 primarily related to the repayment of the Wendy’s 6.25% senior notes from the proceeds of the Term Loan.This loss consisted of (1) a $15.0 million premium payment required to redeem the Wendy’s 6.25% senior notes,(2) $5.5 million for the write-off of the unaccreted discount of the Wendy’s 6.25% senior notes (recorded inconnection with the Wendy’s Merger), and (3) $5.7 million for the write-off of deferred costs associated with therepayment of the prior senior secured term loan.
Senior Notes
On June 23, 2009, Wendy’s/Arby’s Restaurants issued $565.0 million principal amount of Senior Notes (the“Senior Notes”). The Senior Notes will mature on July 15, 2016 and accrue interest at 10.00% per annum, payablesemi-annually on January 15 and July 15, the first payment of which was made on January 15, 2010. The SeniorNotes were issued at 97.533% of the principal amount, representing a yield to maturity of 10.50% and resulting innet proceeds of $551.1 million. The $13.9 million discount is being accreted and the related charge included in“Interest expense” until the Senior Notes mature. The Senior Notes are fully and unconditionally guaranteed, jointlyand severally, on an unsecured basis by certain direct and indirect domestic subsidiaries of Wendy’s/Arby’sRestaurants (collectively, the “Guarantors”).
Deerfield
(Wendy’s/Arby’s)
On December 21, 2007, Wendy’s/Arby’s sold its 63.6% capital interest in Deerfield & Company, LLC(“Deerfield”), an asset management business and a subsidiary of Wendy’s/Arby’s until its sale, to Deerfield CapitalCorp (“DFR”) (the “Deerfield Sale”). The Deerfield Sale resulted in non-cash proceeds to Wendy’s/Arby’saggregating $134.6 million, consisting of (1) 9.6 million convertible preferred shares (the “Preferred Stock”) of asubsidiary of DFR with an estimated fair value of $88.4 million at the date of the Deerfield Sale and (2) $48.0 millionprincipal amount of series A senior secured notes of DFR due in December 2012 (the “DFR Notes”) with anestimated fair value of $46.2 million at the date of the Deerfield Sale.
On March 11, 2008, DFR stockholders approved the one-for-one conversion of all its outstanding convertiblepreferred stock into DFR common stock, which converted the Preferred Stock held by Wendy’s/Arby’s into a likenumber of shares of DFR common stock. On March 11, 2008, Wendy’s/Arby’s Board of Directors approved thedistribution of the shares of DFR common stock then held by Wendy’s/Arby’s to Wendy’s/Arby’s stockholders. Thedistribution in the form of a dividend, which was valued at $14.5 million, was paid in 2008 to holders of record ofWendy’s/Arby’s then outstanding Class A common stock and Class B common stock.
In March 2008, in response to unanticipated credit and liquidity events in the first quarter of 2008, DFRannounced that it was repositioning its investment portfolio to focus on agency-only residential mortgage-backedsecurities and away from its principal investing segment to its asset management segment with its fee-based revenuestreams. In addition, it stated that during the first quarter of 2008, its portfolio was adversely impacted bydeterioration of the global credit markets and, as a result, it sold $2.8 billion of its agency and $1.3 billion of itsAAA-rated non-agency mortgage backed securities and reduced the net notional amount of interest rate swaps used tohedge a portion of its mortgage-backed securities by $4.2 billion, all at a net after-tax loss of $294.3 million to DFR.
Based on these events described above and their negative effect on the market price of DFR common stock,Wendy’s/Arby’s concluded that the fair value and, therefore, the carrying value of its investment in the DFR commonshares was impaired. As a result, as of March 11, 2008 Wendy’s/Arby’s recorded an other than temporary loss, whichis included in “Other than temporary losses on investments,” for the year ended December 28, 2008 of$68.1 million. As a result of the subsequent distribution of the DFR common stock, the income tax loss that resultedfrom the decline in value of $68.1 million was not deductible for income tax purposes and no income tax benefit wasrecorded related to this loss.
37
During the fourth quarter of 2008, Wendy’s/Arby’s recognized an allowance for collectability of $21.2 millionto reduce the then carrying amount of the DFR Notes to $25.0 million. On June 9, 2010, pursuant to a March 2010agreement between Wendy’s/Arby’s and DFR, Wendy’s/Arby’s received cash proceeds of $31.3 million, includinginterest, in consideration for the repayment and cancellation of the DFR Notes. The proceeds represented 64.1% ofthe $48.0 million aggregate principal amount of the DFR Notes. Wendy’s/Arby’s recognized income of $4.9 millionduring the year ended January 2, 2011 as the repayment proceeds exceeded the carrying value of the DFR Notes. Thisgain is included in “Investment income (expense), net.”
Related Party Transactions
Supply Chain Relationship Agreement
During the 2009 fourth quarter, Wendy’s entered into a purchasing co-op relationship agreement (the “Co-opAgreement”) to establish a new Wendy’s purchasing co-op, Quality Supply Chain Co-op, Inc. (“QSCC”). QSCCmanages food and related product purchases and distribution services for the Wendy’s system in the United Statesand Canada. Through QSCC, Wendy’s and Wendy’s franchisees purchase food, proprietary paper and operatingsupplies under national contracts with pricing based upon total system volume.
QSCC’s supply chain management facilitates the continuity of supply and provides consolidated purchasingefficiencies while monitoring and seeking to minimize possible obsolete inventory throughout the Wendy’s NorthAmerica supply chain. The system’s purchasing function for 2009 and prior was performed and paid for by Wendy’s.In order to facilitate the orderly transition of the 2010 purchasing function for North America operations, Wendy’stransferred certain contracts, assets and certain Wendy’s purchasing employees to QSCC in the first quarter of2010. Pursuant to the terms of the Co-op Agreement, Wendy’s was required to pay $15.5 million to QSCC over an18 month period through May 2011 in order to provide funding for start-up costs, operating expenses and cashreserves. The required payments by Wendy’s under the Co-op Agreement were expensed in the fourth quarter of2009 and included in “General and administrative.” Wendy’s made payments of $15.2 million in 2010. In additionto the initial funding by Wendy’s, since the third quarter of 2010, all QSCC members (including Wendy’s) beganpaying sourcing fees on products sourced through QSCC. Such sourcing fees will be the primary means of fundingQSCC’s operations after the initial funding by Wendy’s is completed. In connection with the ongoing operations ofQSCC during 2010, QSCC reimbursed Wendy’s $0.9 million for amounts Wendy’s had paid primarily for payroll-related expenses for certain Canadian QSCC purchasing employees. Effective January 4, 2010, the QSCC leased9,333 square feet of office space from Wendy’s for a two year period for an average annual rental of $0.1 million withfive one-year renewal options.
ARCOP, Inc. (“ARCOP”), a not-for-profit purchasing cooperative, negotiates contracts with approvedsuppliers on behalf of Arby’s and Arby’s franchisees and operates under a previously established agreement similar tothe Wendy’s Co-op Agreement.
Revolving credit facilities
In December 2009, and as amended in February and August 2010, AFA Service Corporation (“AFA”) enteredinto a revolving loan agreement with Arby’s. The terms of this agreement allow AFA to have revolving loans of up to$14.0 million outstanding with an expiration date of March 2012 and bearing interest at 7.5% per annum. InFebruary 2011, the maximum principal amount of revolving loans was reduced to $11.0 million. As of January 2,2011, the outstanding revolving loan balance was $4.5 million.
Strategic Sourcing Group Agreement
On April 5, 2010, QSCC and ARCOP, in consultation with Wendy’s/Arby’s Restaurants, established StrategicSourcing Group Co-op, LLC (“SSG”). SSG was formed to manage and operate purchasing programs which combinethe purchasing power of both Wendy’s and Arby’s company-owned and franchised restaurants to create buyingefficiencies for certain non-perishable goods, equipment and services.
In order to facilitate the orderly transition of this purchasing function for the Companies’ North Americaoperations, Wendy’s/Arby’s Restaurants transferred certain contracts, assets and certain Wendy’s/Arby’s Restaurantspurchasing employees to SSG in the second quarter of 2010. Wendy’s/Arby’s Restaurants had committed to pay
38

approximately $5.2 million of SSG expenses, which were expensed in 2010 and included in “General andadministrative,” and was to be paid over a 24 month period through March 2012. We made payments of $2.0 millionin 2010. Effective April 5, 2010, the SSG leased 2,300 square feet of office space from Arby’s until December 31,2016, unless terminated earlier, for an annual base rental of $51 thousand.
Should a sale of Arby’s occur as discussed in “Introduction and Executive Overview—Our Business” herein,under the change of control provisions in the agreement that established SSG, the activities of SSG would be woundup. In the wind up process, the assets, personnel and functions of SSG would be transferred to QSCC and ARCOP assuch parties and Wendy’s/Arby’s Restaurants agree. In contemplation of a possible sale, the parties are in discussionregarding the dissolution of SSG and transferring SSG’s assets, personnel and functions to QSCC and ARCOP.
(Wendy’s/Arby’s)
Equities Account
In 2005, Wendy’s/Arby’s invested $75.0 million in brokerage accounts (the “Equities Account”), which weremanaged by a management company (the “Management Company”) formed by the Chairman and then ChiefExecutive Officer and the Vice Chairman and then President and Chief Operating Officer of Wendy’s/Arby’s (the“Former Executives”) and a director, who is Wendy’s/Arby’s former Vice Chairman (collectively with the FormerExecutives, the “Principals”). The Equities Account was invested principally in equity securities, cash equivalents andequity derivatives of a limited number of publicly-traded companies. In addition, the Equities Account sold securitiesshort and invested in market put options in order to lessen the impact of significant market downturns.
On June 10, 2009, Wendy’s/Arby’s and the Management Company entered into a withdrawal agreement (the“Withdrawal Agreement”) which provided that Wendy’s/Arby’s would be permitted to withdraw all amounts in theEquities Account on an accelerated basis (the “Early Withdrawal”) effective no later than June 26, 2009. Prior to theWithdrawal Agreement and as a result of an investment management agreement with the Management Company,which was terminated on June 26, 2009, Wendy’s/Arby’s had not been permitted to withdraw any amounts from theEquities Account until December 31, 2010, although $47.0 million was released from the Equities Account in 2008subject to an obligation to return that amount to the Equities Account by a specified date. In consideration forobtaining such Early Withdrawal right, Wendy’s/Arby’s agreed to pay the Management Company $5.5 million (the“Withdrawal Fee”), was not required to return the $47.0 million referred to above and was no longer obligated to payinvestment management and incentive fees to the Management Company. The Equities Account investments wereliquidated in June 2009 for $37.4 million (the “Equities Sale”), of which $31.9 million was received by Wendy’s/Arby’s, net of the Withdrawal Fee, and for which Wendy’s/Arby’s realized a gain of $2.3 million in 2009, which areboth included in “Investment income (expense), net.”
Sublease of New York Office Space
In July 2008 and July 2007, Wendy’s/Arby’s entered into agreements under which the Management Companyis subleasing office space on two of the floors of Wendy’s/Arby’s former New York headquarters. During the secondquarter of 2010, Wendy’s/Arby’s and the Management Company entered into an amendment to the sublease,effective April 1, 2010, pursuant to which the Management Company’s early termination right was cancelled inexchange for a reduction in rent. Under the terms of the amended sublease, the sublease is not cancelable prior to theexpiration of the prime lease and the Management Company pays rent to Wendy’s/Arby’s in an amount that coverssubstantially all of Wendy’s/Arby’s rent obligations under the prime lease for the subleased space.
Services Agreements
Wendy’s/Arby’s and the Management Company entered into a new services agreement (the “New ServicesAgreement”), which commenced on July 1, 2009 and will continue until June 30, 2011, unless sooner terminated.Under the New Services Agreement, the Management Company assists Wendy’s/Arby’s with strategic merger andacquisition consultation, corporate finance and investment banking services and related legal matters. Pursuant to theterms of this agreement, Wendy’s/Arby’s is paying the Management Company a service fee of $0.25 million perquarter, payable in advance commencing July 1, 2009. In addition, in the event the Management Company providessubstantial assistance to Wendy’s/Arby’s in connection with a merger or acquisition, corporate finance and/or similar
39

transaction that is consummated at any time during the period commencing on the date the New Services Agreementwas executed and ending six months following the expiration of its term, Wendy’s/Arby’s will negotiate a success feeto be paid to the Management Company which is reasonable and customary for such transactions.
Under a prior services agreement which commenced on June 30, 2007 and expired on June 30, 2009, (the“Services Agreement”) the Management Company provided a broader range of professional and strategic services toWendy’s/Arby’s in connection with its 2007 restructuring and the related transition of executive managementresponsibilities.
The Companies paid approximately $2.5 million and $5.4 million in 2010 and 2009, respectively, in fees forcorporate finance advisory services under the New Services Agreement in connection with the negotiation andexecution of the Credit Agreement in 2010 and the issuance of the Senior Notes in 2009.
Liquidation Services Agreement
On June 10, 2009, Wendy’s/Arby’s and the Management Company entered into a liquidation servicesagreement (the “Liquidation Services Agreement”) pursuant to which the Management Company assists Wendy’s/Arby’s in the sale, liquidation or other disposition of its cost investments and DFR Notes (the “Legacy Assets”), whichare not related to the Equities Account. As of the date of the Liquidation Services Agreement, the Legacy Assets werevalued at $36.6 million (the “Target Amount”), of which $5.1 million was owned by Wendy’s/Arby’sRestaurants. The Liquidation Services Agreement, which expires June 30, 2011, required Wendy’s/Arby’s to pay theManagement Company a fee of $0.9 million in two installments in June 2009 and 2010, which is being amortizedover the term of the agreement and included in “General and administrative.” In addition, in the event that any or allof the Legacy Assets are sold, liquidated or otherwise disposed of and the aggregate net proceeds to us are in excess ofthe Target Amount, Wendy’s/Arby’s would be required to pay the Management Company a success fee equal to 10%of the aggregate net proceeds in excess of the Target Amount. Assuming a current liquidation of all remaining LegacyAssets, the aggregate proceeds ($32.2 million as of January 2, 2011 primarily related to the cancellation andrepayment of the DFR Notes) would not be expected to be in excess of the Target Amount.
Aircraft Agreement
In August 2007, Wendy’s/Arby’s entered into time share agreements under which the Former Executives andthe Management Company used two Wendy’s/Arby’s corporate aircraft in exchange for payment of certainincremental flight and related costs of such aircraft. Those time share agreements expired during the second quarter of2009 and, in the third quarter of 2009, one of the aircraft was sold to an unrelated third party.
In June 2009, Wendy’s/Arby’s and TASCO, LLC (an affiliate of the Management Company) (“TASCO”)entered into an aircraft lease agreement (the “Aircraft Lease Agreement”) for the other aircraft that was previouslyunder a time share agreement. The Aircraft Lease Agreement originally provided that Wendy’s/Arby’s would leasesuch corporate aircraft to TASCO from July 1, 2009 until June 30, 2010. On June 24, 2010, Wendy’s/Arby’s andTASCO renewed the Aircraft Lease Agreement for an additional one year period (expiring June 30, 2011). Under theAircraft Lease Agreement, TASCO pays $10 thousand per month for such aircraft plus substantially all operatingcosts of the aircraft including all costs of fuel, inspection, servicing and storage, as well as operational and flight crewcosts relating to the operation of the aircraft, and all transit maintenance costs and other maintenance costs requiredas a result of TASCO’s usage of the aircraft. Wendy’s/Arby’s continues to be responsible for calendar-basedmaintenance and any extraordinary and unscheduled repairs and/or maintenance for the aircraft, as well as insuranceand other costs. The Aircraft Lease Agreement may be terminated by Wendy’s/Arby’s without penalty in the event itsells the aircraft to a third party, subject to a right of first refusal in favor of the Management Company with respectto such a sale.
Presentation of Financial Information
The Companies’ fiscal reporting periods consist of 52 or 53 weeks ending on the Sunday closest toDecember 31 and are referred to herein as (1) “the year ended January 2, 2011” or “2010”, which consisted of 52weeks, (2) “the year ended January 3, 2010” or “2009”, which consisted of 53 weeks and (3) “the year endedDecember 28, 2008” or “2008” which consisted of 52 weeks. All references to years and quarters relate to fiscalperiods rather than calendar periods. Certain percentage changes between these years are considered not measurable ornon meaningful (“n/m”).
40
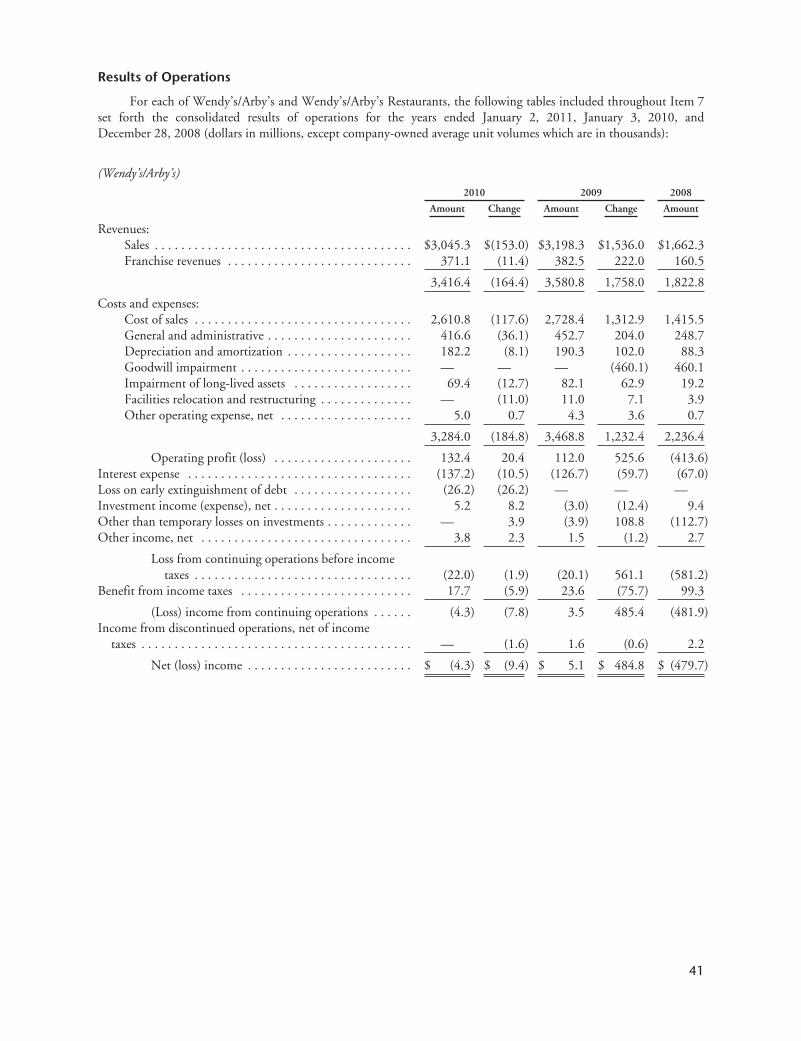
Results of Operations
For each of Wendy’s/Arby’s and Wendy’s/Arby’s Restaurants, the following tables included throughout Item 7set forth the consolidated results of operations for the years ended January 2, 2011, January 3, 2010, andDecember 28, 2008 (dollars in millions, except company-owned average unit volumes which are in thousands):
(Wendy’s/Arby’s)2010 2009 2008
Amount Change Amount Change Amount
Revenues:Sales . . . . . . . . . . . . . . . . . . . . . . . . . . . . . . . . . . . . . . . $3,045.3 $(153.0) $3,198.3 $1,536.0 $1,662.3Franchise revenues . . . . . . . . . . . . . . . . . . . . . . . . . . . . 371.1 (11.4) 382.5 222.0 160.5
3,416.4 (164.4) 3,580.8 1,758.0 1,822.8
Costs and expenses:Cost of sales . . . . . . . . . . . . . . . . . . . . . . . . . . . . . . . . . 2,610.8 (117.6) 2,728.4 1,312.9 1,415.5General and administrative . . . . . . . . . . . . . . . . . . . . . . 416.6 (36.1) 452.7 204.0 248.7Depreciation and amortization . . . . . . . . . . . . . . . . . . . 182.2 (8.1) 190.3 102.0 88.3Goodwill impairment . . . . . . . . . . . . . . . . . . . . . . . . . . — — — (460.1) 460.1Impairment of long-lived assets . . . . . . . . . . . . . . . . . . 69.4 (12.7) 82.1 62.9 19.2Facilities relocation and restructuring . . . . . . . . . . . . . . — (11.0) 11.0 7.1 3.9Other operating expense, net . . . . . . . . . . . . . . . . . . . . 5.0 0.7 4.3 3.6 0.7
3,284.0 (184.8) 3,468.8 1,232.4 2,236.4
Operating profit (loss) . . . . . . . . . . . . . . . . . . . . . 132.4 20.4 112.0 525.6 (413.6)Interest expense . . . . . . . . . . . . . . . . . . . . . . . . . . . . . . . . . . (137.2) (10.5) (126.7) (59.7) (67.0)Loss on early extinguishment of debt . . . . . . . . . . . . . . . . . . (26.2) (26.2) — — —Investment income (expense), net . . . . . . . . . . . . . . . . . . . . . 5.2 8.2 (3.0) (12.4) 9.4Other than temporary losses on investments . . . . . . . . . . . . . — 3.9 (3.9) 108.8 (112.7)Other income, net . . . . . . . . . . . . . . . . . . . . . . . . . . . . . . . . 3.8 2.3 1.5 (1.2) 2.7
Loss from continuing operations before incometaxes . . . . . . . . . . . . . . . . . . . . . . . . . . . . . . . . . (22.0) (1.9) (20.1) 561.1 (581.2)
Benefit from income taxes . . . . . . . . . . . . . . . . . . . . . . . . . . 17.7 (5.9) 23.6 (75.7) 99.3
(Loss) income from continuing operations . . . . . . (4.3) (7.8) 3.5 485.4 (481.9)Income from discontinued operations, net of income
taxes . . . . . . . . . . . . . . . . . . . . . . . . . . . . . . . . . . . . . . . . . — (1.6) 1.6 (0.6) 2.2
Net (loss) income . . . . . . . . . . . . . . . . . . . . . . . . . $ (4.3) $ (9.4) $ 5.1 $ 484.8 $ (479.7)
41

(Wendy’s/Arby’s Restaurants)2010 2009 2008
Amount Change Amount Change Amount
Revenues:Sales . . . . . . . . . . . . . . . . . . . . . . . . . . . . . . . . . . . . . . . $3,045.3 $(153.0) $3,198.3 $1,536.0 $1,662.3Franchise revenues . . . . . . . . . . . . . . . . . . . . . . . . . . . . 371.1 (11.4) 382.5 222.0 160.5
3,416.4 (164.4) 3,580.8 1,758.0 1,822.8
Costs and expenses:Cost of sales . . . . . . . . . . . . . . . . . . . . . . . . . . . . . . . . . 2,610.8 (117.6) 2,728.4 1,312.9 1,415.5General and administrative . . . . . . . . . . . . . . . . . . . . . . 408.4 (34.3) 442.7 229.5 213.2Depreciation and amortization . . . . . . . . . . . . . . . . . . . 180.3 (8.2) 188.5 103.5 85.0Goodwill impairment . . . . . . . . . . . . . . . . . . . . . . . . . . — — — (460.1) 460.1Impairment of long-lived assets . . . . . . . . . . . . . . . . . . 69.4 (10.6) 80.0 70.4 9.6Facilities relocation and restructuring . . . . . . . . . . . . . . — (8.0) 8.0 4.8 3.2Other operating expense, net . . . . . . . . . . . . . . . . . . . . 5.2 2.0 3.2 2.5 0.7
3,274.1 (176.7) 3,450.8 1,263.5 2,187.3
Operating profit (loss) . . . . . . . . . . . . . . . . . . . . . 142.3 12.3 130.0 494.5 (364.5)Interest expense . . . . . . . . . . . . . . . . . . . . . . . . . . . . . . . . . . (136.2) (10.8) (125.4) (58.5) (66.9)Loss on early extinguishment of debt . . . . . . . . . . . . . . . . . . (26.2) (26.2) — — —Other income (expense), net . . . . . . . . . . . . . . . . . . . . . . . . . 2.7 5.7 (3.0) (6.2) 3.2
(Loss) income before income taxes . . . . . . . . . . . . (17.4) (19.0) 1.6 429.8 (428.2)Benefit from income taxes . . . . . . . . . . . . . . . . . . . . . . . . . . 14.8 6.8 8.0 (55.1) 63.1
Net (loss) income . . . . . . . . . . . . . . . . . . . . . . . . . $ (2.6) $ (12.2) $ 9.6 $ 374.7 $ (365.1)
Sales: 2010 2009 2008
Wendy’s (a) . . . . . . . . . . . . . . . . . . . . . . . . . . . . . . . . $1,980.6 $2,035.2 $ 504.7Arby’s . . . . . . . . . . . . . . . . . . . . . . . . . . . . . . . . . . . . 966.2 1,064.1 1,131.4Bakery and kids’ meal promotion items sold to
franchisees . . . . . . . . . . . . . . . . . . . . . . . . . . . . . . . 98.5 99.0 26.2
Total sales . . . . . . . . . . . . . . . . . . . . . . . . . . . . . $3,045.3 $3,198.3 $1,662.3
Cost of sales:% ofSales
% ofSales
% ofSales
Wendy’s (a)Food and paper . . . . . . . . . . . . . . . . . . . . . . . . . $ 638.8 32.2% $ 654.1 32.2% $ 175.6 34.8%Restaurant labor . . . . . . . . . . . . . . . . . . . . . . . . 590.0 29.8% 615.2 30.2% 152.7 30.2%Occupancy, advertising, and other operating
costs . . . . . . . . . . . . . . . . . . . . . . . . . . . . . . . . 458.6 23.2% 462.2 22.7% 117.4 23.3%
Total Wendy’s cost of sales . . . . . . . . . . . . 1,687.4 85.2% 1,731.5 85.1% 445.7 88.3%
Arby’sFood and paper . . . . . . . . . . . . . . . . . . . . . . . . . 265.1 27.4% 290.6 27.3% 322.8 28.5%Restaurant labor . . . . . . . . . . . . . . . . . . . . . . . . 317.7 32.9% 332.8 31.3% 339.6 30.0%Occupancy, advertising, and other operating
costs . . . . . . . . . . . . . . . . . . . . . . . . . . . . . . . . 271.0 28.1% 293.0 27.5% 287.3 25.4%
Total Arby’s cost of sales . . . . . . . . . . . . . . 853.8 88.4% 916.4 86.1% 949.7 83.9%
Bakery and kids’ meal promotion items sold tofranchisees . . . . . . . . . . . . . . . . . . . . . . . . . . . . . . . 69.6 n/m 80.5 n/m 20.1 n/m
Total cost of sales . . . . . . . . . . . . . . . . . . . . $2,610.8 85.7% $2,728.4 85.3% $1,415.5 85.2%
42
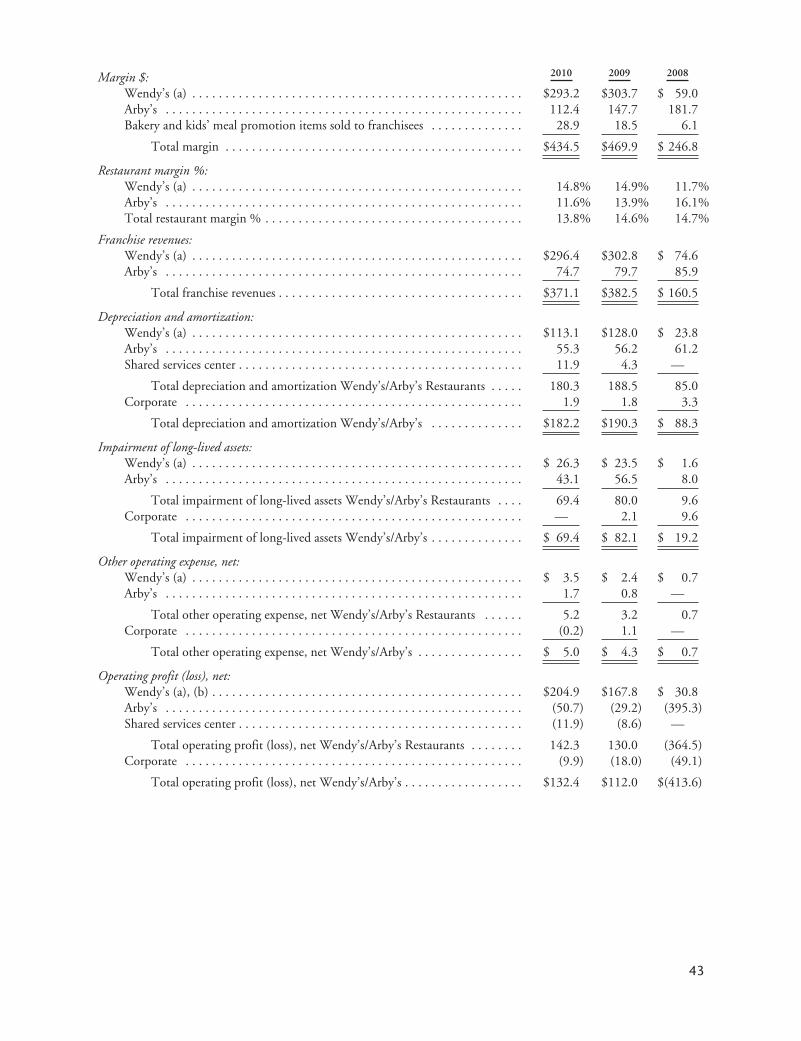
Margin $: 2010 2009 2008
Wendy’s (a) . . . . . . . . . . . . . . . . . . . . . . . . . . . . . . . . . . . . . . . . . . . . . . . . . . $293.2 $303.7 $ 59.0Arby’s . . . . . . . . . . . . . . . . . . . . . . . . . . . . . . . . . . . . . . . . . . . . . . . . . . . . . . 112.4 147.7 181.7Bakery and kids’ meal promotion items sold to franchisees . . . . . . . . . . . . . . 28.9 18.5 6.1
Total margin . . . . . . . . . . . . . . . . . . . . . . . . . . . . . . . . . . . . . . . . . . . . . $434.5 $469.9 $ 246.8
Restaurant margin %:Wendy’s (a) . . . . . . . . . . . . . . . . . . . . . . . . . . . . . . . . . . . . . . . . . . . . . . . . . . 14.8% 14.9% 11.7%Arby’s . . . . . . . . . . . . . . . . . . . . . . . . . . . . . . . . . . . . . . . . . . . . . . . . . . . . . . 11.6% 13.9% 16.1%Total restaurant margin % . . . . . . . . . . . . . . . . . . . . . . . . . . . . . . . . . . . . . . . 13.8% 14.6% 14.7%
Franchise revenues:Wendy’s (a) . . . . . . . . . . . . . . . . . . . . . . . . . . . . . . . . . . . . . . . . . . . . . . . . . . $296.4 $302.8 $ 74.6Arby’s . . . . . . . . . . . . . . . . . . . . . . . . . . . . . . . . . . . . . . . . . . . . . . . . . . . . . . 74.7 79.7 85.9
Total franchise revenues . . . . . . . . . . . . . . . . . . . . . . . . . . . . . . . . . . . . . $371.1 $382.5 $ 160.5
Depreciation and amortization:Wendy’s (a) . . . . . . . . . . . . . . . . . . . . . . . . . . . . . . . . . . . . . . . . . . . . . . . . . . $113.1 $128.0 $ 23.8Arby’s . . . . . . . . . . . . . . . . . . . . . . . . . . . . . . . . . . . . . . . . . . . . . . . . . . . . . . 55.3 56.2 61.2Shared services center . . . . . . . . . . . . . . . . . . . . . . . . . . . . . . . . . . . . . . . . . . . 11.9 4.3 —
Total depreciation and amortization Wendy’s/Arby’s Restaurants . . . . . 180.3 188.5 85.0Corporate . . . . . . . . . . . . . . . . . . . . . . . . . . . . . . . . . . . . . . . . . . . . . . . . . . . 1.9 1.8 3.3
Total depreciation and amortization Wendy’s/Arby’s . . . . . . . . . . . . . . $182.2 $190.3 $ 88.3
Impairment of long-lived assets:Wendy’s (a) . . . . . . . . . . . . . . . . . . . . . . . . . . . . . . . . . . . . . . . . . . . . . . . . . . $ 26.3 $ 23.5 $ 1.6Arby’s . . . . . . . . . . . . . . . . . . . . . . . . . . . . . . . . . . . . . . . . . . . . . . . . . . . . . . 43.1 56.5 8.0
Total impairment of long-lived assets Wendy’s/Arby’s Restaurants . . . . 69.4 80.0 9.6Corporate . . . . . . . . . . . . . . . . . . . . . . . . . . . . . . . . . . . . . . . . . . . . . . . . . . . — 2.1 9.6
Total impairment of long-lived assets Wendy’s/Arby’s . . . . . . . . . . . . . . $ 69.4 $ 82.1 $ 19.2
Other operating expense, net:Wendy’s (a) . . . . . . . . . . . . . . . . . . . . . . . . . . . . . . . . . . . . . . . . . . . . . . . . . . $ 3.5 $ 2.4 $ 0.7Arby’s . . . . . . . . . . . . . . . . . . . . . . . . . . . . . . . . . . . . . . . . . . . . . . . . . . . . . . 1.7 0.8 —
Total other operating expense, net Wendy’s/Arby’s Restaurants . . . . . . 5.2 3.2 0.7Corporate . . . . . . . . . . . . . . . . . . . . . . . . . . . . . . . . . . . . . . . . . . . . . . . . . . . (0.2) 1.1 —
Total other operating expense, net Wendy’s/Arby’s . . . . . . . . . . . . . . . . $ 5.0 $ 4.3 $ 0.7
Operating profit (loss), net:Wendy’s (a), (b) . . . . . . . . . . . . . . . . . . . . . . . . . . . . . . . . . . . . . . . . . . . . . . . $204.9 $167.8 $ 30.8Arby’s . . . . . . . . . . . . . . . . . . . . . . . . . . . . . . . . . . . . . . . . . . . . . . . . . . . . . . (50.7) (29.2) (395.3)Shared services center . . . . . . . . . . . . . . . . . . . . . . . . . . . . . . . . . . . . . . . . . . . (11.9) (8.6) —
Total operating profit (loss), net Wendy’s/Arby’s Restaurants . . . . . . . . 142.3 130.0 (364.5)Corporate . . . . . . . . . . . . . . . . . . . . . . . . . . . . . . . . . . . . . . . . . . . . . . . . . . . (9.9) (18.0) (49.1)
Total operating profit (loss), net Wendy’s/Arby’s . . . . . . . . . . . . . . . . . . $132.4 $112.0 $(413.6)
43

(Wendy’s/Arby’s and Wendy’s/Arby’s Restaurants)FourthQuarter
Restaurant statistics: 2010 2009 2008
Wendy’s same-store sales:North America company-owned restaurants . . . . . . . . . . . . . . . . . . . . . . (1.7)% (1.7)% 3.6%North America franchised restaurants . . . . . . . . . . . . . . . . . . . . . . . . . . . (0.3)% (0.3)% 3.8%North America system wide . . . . . . . . . . . . . . . . . . . . . . . . . . . . . . . . . . . (0.6)% (0.7)% 3.7%
Arby’s same-store sales: 2010 2009 2008
North America company-owned restaurants . . . . . . . . . . . . . . . . . . . . . . (7.1)% (8.2)% (5.8)%North America franchised restaurants . . . . . . . . . . . . . . . . . . . . . . . . . . . (5.2)% (9.0)% (3.6)%North America system wide . . . . . . . . . . . . . . . . . . . . . . . . . . . . . . . . . . . (5.8)% (8.8)% (4.3)%
Restaurant count: Company-owned Franchised Systemwide
Wendy’s restaurant count:Restaurant count at December 28, 2008 . . . . . . . . . 1,406 5,224 6,630Opened . . . . . . . . . . . . . . . . . . . . . . . . . . . . . . . . . . 10 53 63Closed . . . . . . . . . . . . . . . . . . . . . . . . . . . . . . . . . . . (13) (139) (152)Net (sold to) purchased by franchisees . . . . . . . . . . . (12) 12 —
Restaurant count at January 3, 2010 . . . . . . . . 1,391 5,150 6,541
Opened . . . . . . . . . . . . . . . . . . . . . . . . . . . . . . . . . . 9 69 78Closed . . . . . . . . . . . . . . . . . . . . . . . . . . . . . . . . . . . (4) (39) (43)Net (sold to) purchased by franchisees . . . . . . . . . . . (2) 2 —
Restaurant count at January 2, 2011 . . . . . . . . 1,394 5,182 6,576
Arby’s restaurant count:Restaurant count at December 28, 2008 . . . . . . . . . 1,176 2,580 3,756Opened . . . . . . . . . . . . . . . . . . . . . . . . . . . . . . . . . . 5 54 59Closed . . . . . . . . . . . . . . . . . . . . . . . . . . . . . . . . . . . (23) (74) (97)Net purchased from (sold by) franchisees . . . . . . . . . 11 (11) —
Restaurant count at January 3, 2010 . . . . . . . . 1,169 2,549 3,718
Opened . . . . . . . . . . . . . . . . . . . . . . . . . . . . . . . . . . — 44 44Closed . . . . . . . . . . . . . . . . . . . . . . . . . . . . . . . . . . . (17) (96) (113)Net (sold to) purchased by franchisees . . . . . . . . . . . (8) 8 —
Restaurant count at January 2, 2011 . . . . . . . . 1,144 2,505 3,649
Total restaurant count at January 2,2011 . . . . . . . . . . . . . . . . . . . . . . . . . . 2,538 7,687 10,225
2010 2009 2008
Company-owned average unit volumes: (52 weeks)Wendy’s—North America (a) . . . . . . . . . . . . . . . . . . . . . . . . . $1,417.8 $1,421.9 $1,452.9Arby’s—North America . . . . . . . . . . . . . . . . . . . . . . . . . . . . . $ 838.4 $ 896.7 $ 966.9
(a) Wendy’s data for 2008, other than average unit volumes, is only for the period commencing with theSeptember 29, 2008 merger date through the end of the fiscal year.
(b) Wendy’s “Operating profit (loss), net” includes the margin dollars for the bakery and kids’ meal promotion itemssold to franchisees.
44

SalesChange
2010 2009
Wendy’s . . . . . . . . . . . . . . . . . . . . . . . . . . . . . . . . . . . . . . . . . . . . . . . . . $ (54.6) $1,530.5Arby’s . . . . . . . . . . . . . . . . . . . . . . . . . . . . . . . . . . . . . . . . . . . . . . . . . . . (97.9) (67.3)Bakery and kids’ meal promotion items sold to franchisees . . . . . . . . . . . (0.5) 72.8
$(153.0) $1,536.0
The decrease in sales in 2010 was primarily driven by one less week of sales when compared to 2009. Sales forthe 53rd week in 2009 for Wendy’s and Arby’s were $35.3 million and $15.9 million, respectively. In addition, salesin 2010 were negatively impacted by the decline in Wendy’s and Arby’s North America company-owned same-storesales of 1.7% and 7.1%, respectively. Wendy’s and Arby’s North America company-owned same-store sales for both2010 and 2009 were impacted by the generally negative economic trends and competitive pressures described in“Introduction and Executive Overview—Our Business.”
Wendy’s North America company-owned same-store sales for 2010 decreased primarily due to a 1.9% declinein the number of customer transactions in 2010 as compared to 2009. Wendy’s Canada company-owned same-storesales decreased $5.9 million primarily due to an increase in value added sales tax in certain Canadian provinces in thethird quarter of 2010. The negative factors impacting Wendy’s sales were partially offset by (1) a $22.4 millionpositive impact from foreign currency translation for the year ended January 2, 2011 as compared to the prior year,and (2) an approximate 1% blended price increase taken primarily in late 2009. Wendy’s locations sold or closedduring or subsequent to the year ended January 3, 2010 resulted in a reduction in sales of $16.7 million for 2010,which was partially offset by incremental sales of $11.0 million in the year ended January 2, 2011 from new storesopened during fiscal 2009 and 2010.
The increase in sales in 2009 was primarily due to the Wendy’s Merger. Wendy’s North America company-owned same-store sales for 2009, excluding the impact of fewer restaurants serving breakfast in 2009 as compared to2008 and the effect of the 53rd week in 2009, would have decreased approximately 0.3%.
Arby’s North America company-owned same-store sales for 2010 were impacted by the effects of (1) a decreaseof 8.3% in our average per customer check amount primarily as a result of the expansion in 2010 of Arby’s everydayvalue strategy, (2) a decrease of approximately 1.2% due to certain in-store promotional discounts that increasedcustomer traffic during 2009, which did not recur in 2010, and (3) a reduction in advertising expenditures during2010. These negative factors were somewhat mitigated by a 1.2% increase in the number of customer transactions in2010 as compared to 2009 primarily driven by expansion of our everyday value strategy. Transaction trends haveimproved since the end of 2009, with the most significant increase in the fourth quarter of 2010 as compared to thesame period in 2009. Arby’s locations sold or closed during or subsequent to the 12 months ended January 3, 2010generated $10.4 million of sales in that period, which was partially offset by sales of $8.0 million in the year endedJanuary 2, 2011 from stores acquired from a franchisee during the first quarter of 2010.
In 2009, Arby’s company-owned same-store sales decreased 8.2% primarily due to (1) a 7.0% decline in thenumber of customer transactions in 2009 as compared to 2008, (2) a decrease of 1.2% in our average per customercheck amount, and (3) a reduction in the number of national advertising campaigns, which was somewhat mitigatedby certain aggressive in-store promotional discounts. These negative factors were partially offset by sales for the 53rdweek in 2009 of $15.9 million.
Franchise RevenuesChange
2010 2009
Wendy’s . . . . . . . . . . . . . . . . . . . . . . . . . . . . . . . . . . . . . . . . . . . . . . . . . . . $ (6.4) $228.2Arby’s . . . . . . . . . . . . . . . . . . . . . . . . . . . . . . . . . . . . . . . . . . . . . . . . . . . . . (5.0) (6.2)
$(11.4) $222.0
45

The decrease in franchise revenues for 2010 was primarily due to the decline in Wendy’s and Arby’s NorthAmerica franchised restaurant same-store sales of 0.3% and 5.2%, respectively. The increase in franchise revenues in2009 was primarily due to the Wendy’s Merger. Franchise revenues for the 53rd week in 2009 for Wendy’s andArby’s were approximately $4.8 million and $1.3 million, respectively.
Wendy’s North America franchised restaurant same-store sales for 2010 were impacted by the same factorsdescribed above for Wendy’s company-owned restaurants, although we believe price increases taken by certainfranchised restaurants, which were not taken by Wendy’s company-owned restaurants, mitigated some of the declinein same-store sales. Wendy’s franchised restaurant closings include 71 restaurants in Japan which closed at theexpiration of the franchise agreement on December 31, 2009.
Arby’s North America franchised restaurant same-store sales for 2010 were impacted by the same factorsdiscussed above for Arby’s company-owned restaurants, although Arby’s North America franchised restaurants in2010 (1) were comparing to weaker 2009 sales levels than at company-owned restaurants as a result of fewer in-storepromotional discounts offered by franchisees during 2009, and (2) had a higher check average as a result of pricingand menu mix as compared to company-owned restaurants.
The decrease in Arby’s franchise revenues in 2009 was primarily attributable to the 9.0% decrease in same-storesales for North America franchised restaurants. In addition, the franchised restaurants were disproportionatelynegatively affected by less national media advertising as certain underpenetrated franchise markets did not havesufficient local media advertising to offset the decrease in national advertising.
Cost of Sales
Change
2010 2009
Wendy’s . . . . . . . . . . . . . . . . . . . . . . . . . . . . . . . . . . . . . . . . . . 0.1% points (3.2)% pointsArby’s . . . . . . . . . . . . . . . . . . . . . . . . . . . . . . . . . . . . . . . . . . . . 2.3% points 2.2 % pointsConsolidated . . . . . . . . . . . . . . . . . . . . . . . . . . . . . . . . . . . . . . 0.4% points 0.1 % points
Wendy’s North America company-owned restaurant cost of sales remained relatively flat as a percentage of salesin 2010 as compared to 2009. The increase in occupancy, advertising, and other operating expenses of 0.5% points in2010 as compared to 2009, was mostly offset by a decrease in restaurant labor costs of 0.4% points for the samecomparable periods. The increase in occupancy, advertising, and other operating expenses was due to increases inutilities, credit and debit card fees, and insurance expenses, combined with an increase in advertising expensesassociated with the launch of the brand’s breakfast daypart in certain test markets. The decrease in Wendy’s restaurantlabor costs in 2010 as compared to 2009 was primarily due to a 0.5% point decrease in incentive compensationexpense and a 0.3% point decrease in salaries and wages which was the result of the approximate 1% blended priceincrease taken primarily in late 2009, partially offset by a 0.4% point increase due to the deleverage effect of thedecline in Wendy’s same-store sales without similar reductions in fixed and semi-variable costs. Food and paper costswere unchanged as a percent of sales in 2010 as compared to 2009. These costs were impacted by a 0.6% pointincrease in commodity costs primarily in the second half of 2010, which was offset by a 0.3% point decline in foodcosts from the approximate 1% blended price increase taken primarily late in 2009 and by 0.3% points from otherindividually insignificant factors which comprised the remainder of the offset.
The percentage decrease in Wendy’s North America company-owned restaurant cost of sales in 2009 ascompared to the fourth quarter of 2008 was primarily attributable to improvements in restaurant labor costs andcertain occupancy, advertising, and other operating expenses, partially due to ongoing operational improvements andthe effect of price increases in 2009. As a percent of sales, the impact of the 53rd week in 2009 on cost of sales wasnot material.
As a percentage of sales, Arby’s North America company-owned restaurant cost of sales increased in 2010 ascompared to 2009 primarily due to higher restaurant labor costs and occupancy, advertising, and other operatingexpenses, and to a lesser extent an increase in food and paper costs. Restaurant labor costs and occupancy, advertising,and other operating expenses were mainly affected by increases of 1.3% points and 1.0% points, respectively, due tothe deleverage effect of the decline in Arby’s same-store sales without similar reductions in fixed and semi-variablecosts excluding advertising. These increases were offset, in part, by a 0.5% point decrease in advertising
46
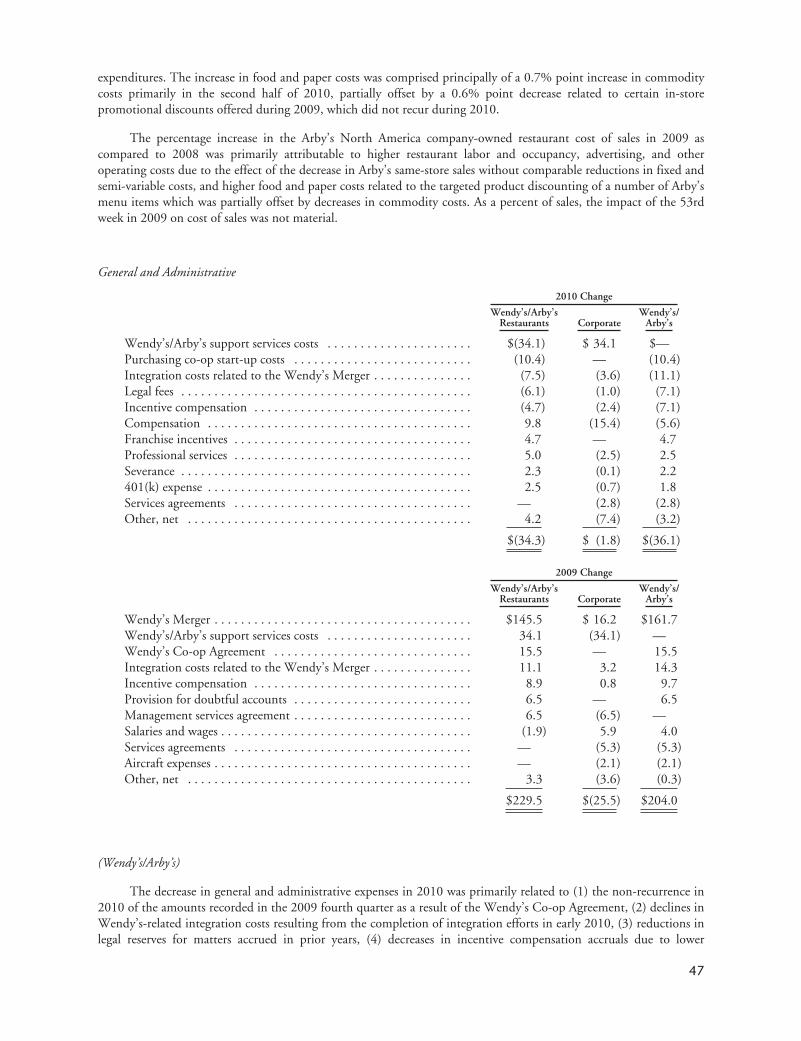
expenditures. The increase in food and paper costs was comprised principally of a 0.7% point increase in commoditycosts primarily in the second half of 2010, partially offset by a 0.6% point decrease related to certain in-storepromotional discounts offered during 2009, which did not recur during 2010.
The percentage increase in the Arby’s North America company-owned restaurant cost of sales in 2009 ascompared to 2008 was primarily attributable to higher restaurant labor and occupancy, advertising, and otheroperating costs due to the effect of the decrease in Arby’s same-store sales without comparable reductions in fixed andsemi-variable costs, and higher food and paper costs related to the targeted product discounting of a number of Arby’smenu items which was partially offset by decreases in commodity costs. As a percent of sales, the impact of the 53rdweek in 2009 on cost of sales was not material.
General and Administrative
2010 Change
Wendy’s/Arby’sRestaurants Corporate
Wendy’s/Arby’s
Wendy’s/Arby’s support services costs . . . . . . . . . . . . . . . . . . . . . . $(34.1) $ 34.1 $—Purchasing co-op start-up costs . . . . . . . . . . . . . . . . . . . . . . . . . . . (10.4) — (10.4)Integration costs related to the Wendy’s Merger . . . . . . . . . . . . . . . (7.5) (3.6) (11.1)Legal fees . . . . . . . . . . . . . . . . . . . . . . . . . . . . . . . . . . . . . . . . . . . . (6.1) (1.0) (7.1)Incentive compensation . . . . . . . . . . . . . . . . . . . . . . . . . . . . . . . . . (4.7) (2.4) (7.1)Compensation . . . . . . . . . . . . . . . . . . . . . . . . . . . . . . . . . . . . . . . . 9.8 (15.4) (5.6)Franchise incentives . . . . . . . . . . . . . . . . . . . . . . . . . . . . . . . . . . . . 4.7 — 4.7Professional services . . . . . . . . . . . . . . . . . . . . . . . . . . . . . . . . . . . . 5.0 (2.5) 2.5Severance . . . . . . . . . . . . . . . . . . . . . . . . . . . . . . . . . . . . . . . . . . . . 2.3 (0.1) 2.2401(k) expense . . . . . . . . . . . . . . . . . . . . . . . . . . . . . . . . . . . . . . . . 2.5 (0.7) 1.8Services agreements . . . . . . . . . . . . . . . . . . . . . . . . . . . . . . . . . . . . — (2.8) (2.8)Other, net . . . . . . . . . . . . . . . . . . . . . . . . . . . . . . . . . . . . . . . . . . . 4.2 (7.4) (3.2)
$(34.3) $ (1.8) $(36.1)
2009 Change
Wendy’s/Arby’sRestaurants Corporate
Wendy’s/Arby’s
Wendy’s Merger . . . . . . . . . . . . . . . . . . . . . . . . . . . . . . . . . . . . . . . $145.5 $ 16.2 $161.7Wendy’s/Arby’s support services costs . . . . . . . . . . . . . . . . . . . . . . 34.1 (34.1) —Wendy’s Co-op Agreement . . . . . . . . . . . . . . . . . . . . . . . . . . . . . . 15.5 — 15.5Integration costs related to the Wendy’s Merger . . . . . . . . . . . . . . . 11.1 3.2 14.3Incentive compensation . . . . . . . . . . . . . . . . . . . . . . . . . . . . . . . . . 8.9 0.8 9.7Provision for doubtful accounts . . . . . . . . . . . . . . . . . . . . . . . . . . . 6.5 — 6.5Management services agreement . . . . . . . . . . . . . . . . . . . . . . . . . . . 6.5 (6.5) —Salaries and wages . . . . . . . . . . . . . . . . . . . . . . . . . . . . . . . . . . . . . . (1.9) 5.9 4.0Services agreements . . . . . . . . . . . . . . . . . . . . . . . . . . . . . . . . . . . . — (5.3) (5.3)Aircraft expenses . . . . . . . . . . . . . . . . . . . . . . . . . . . . . . . . . . . . . . . — (2.1) (2.1)Other, net . . . . . . . . . . . . . . . . . . . . . . . . . . . . . . . . . . . . . . . . . . . 3.3 (3.6) (0.3)
$229.5 $(25.5) $204.0
(Wendy’s/Arby’s)
The decrease in general and administrative expenses in 2010 was primarily related to (1) the non-recurrence in2010 of the amounts recorded in the 2009 fourth quarter as a result of the Wendy’s Co-op Agreement, (2) declines inWendy’s-related integration costs resulting from the completion of integration efforts in early 2010, (3) reductions inlegal reserves for matters accrued in prior years, (4) decreases in incentive compensation accruals due to lower
47

operating performance as compared to plan in 2010 versus 2009, (5) reductions in staffing at our shared servicescenter in Atlanta, Georgia, and the formation of the Wendy’s Co-Op in 2009, and (6) declines in fees under ourrelated party services agreement that was renegotiated in June 2009. The decreases were partially offset by (1) the costsincurred in 2010 related to the formation of SSG, (2) increases in franchise incentives offered in conjunction with theWendy’s remodeling program, (3) increases in professional services fees associated primarily with informationtechnology projects, (4) increases in severance costs related to the termination of certain senior Arby’s executives, and(5) increased 401(k) expense associated with certain legacy Wendy’s plans that have since been merged into theWendy’s/Arby’s plan.
The increases for 2009 were primarily due to the effects of the Wendy’s Merger, as well as increases in(1) integration costs related to the Wendy’s Merger and (2) salaries and wages due to staffing and other expensesassociated with the establishment of the shared services center in Atlanta, Georgia. Our 2009 general andadministrative expenses were also significantly impacted by (1) required future payments expensed in the 2009 fourthquarter as a result of the Wendy’s Co-op Agreement, (2) increases in incentive compensation accruals due to strongeroperating performance versus plan in 2009 than in 2008, and (3) an increase in the provision for doubtful accountsprimarily associated with the collectability of Arby’s franchise receivables. The 2009 increases in general andadministrative expenses were partially offset by (1) a decrease in fees under the services agreement with theManagement Company and (2) a decrease in costs associated with our corporate aircraft agreements with thePrincipals and the Management Company and the sale of one of the aircraft in 2009.
(Wendy’s/Arby’s Restaurants)
The decrease in general and administrative expenses in 2010 was primarily related to (1) Wendy’s/Arby’ssupport services costs charged to Wendy’s/Arby’s Restaurants during the first quarter of 2009, which were incurreddirectly by Wendy’s/Arby’s Restaurants after the 2009 first quarter, (2) the non-recurrence in 2010 of the amountsrecorded in the 2009 fourth quarter as a result of the Wendy’s Co-op Agreement, (3) declines in Wendy’s-relatedintegration costs resulting from the completion of integration efforts in early 2010, (4) reductions in legal reserves forlegal matters accrued in prior years, and (5) decreases in incentive compensation accruals due to lower operatingperformance as compared to plan in 2010 versus 2009. The decreases were partially offset by (1) the costs incurred in2010 related to the formation of SSG, (2) increases in compensation costs as 2009 first quarter compensation costswere included in the Wendy’s/Arby’s support services charge, (3) increases in franchise incentives offered inconjunction with the Wendy’s remodeling program, (4) increases in professional services fees associated primarilywith information technology projects, (5) increases in severance costs related to the termination of certain seniorArby’s executives, and (6) increased 401(k) expense associated with certain legacy Wendy’s plans that have since beenmerged into the Wendy’s/Arby’s plan.
The increases for 2009 were primarily due to the Wendy’s Merger. Our 2009 general and administrativeexpenses were also significantly impacted by (1) Wendy’s/Arby’s support services costs charged to Wendy’s/Arby’sRestaurants during the first quarter of 2009, which were incurred directly by Wendy’s/Arby’s Restaurants after the2009 first quarter, (2) required future payments expensed in the 2009 fourth quarter as a result of the Wendy’s Co-opAgreement, (3) integration costs related to the Wendy’s Merger, (4) increases in incentive compensation accruals dueto stronger operating performance versus plan in 2009 than in 2008, (5) an increase in the provision for doubtfulaccounts primarily associated with the collectability of Arby’s franchise receivables, and (6) a 2009 increase in feesrelated to the 2005 Arby’s management services agreement with Wendy’s/Arby’s as compared to a net credit in fees inthe prior year due to the reimbursement of certain costs from Wendy’s/Arby’s to Wendy’s/Arby’s Restaurants.
Depreciation and Amortization
Change
2010 2009
Wendy’s restaurants, primarily properties . . . . . . . . . . . . . . . . . . . . . . . . . . . . . . . . . . $(14.9) $104.2Arby’s restaurants, primarily properties . . . . . . . . . . . . . . . . . . . . . . . . . . . . . . . . . . . . (0.9) (5.0)Shared services center assets . . . . . . . . . . . . . . . . . . . . . . . . . . . . . . . . . . . . . . . . . . . . . 7.6 4.3
Total Wendy’s/Arby’s Restaurants . . . . . . . . . . . . . . . . . . . . . . . . . . . . . . . . . . . . (8.2) 103.5Corporate . . . . . . . . . . . . . . . . . . . . . . . . . . . . . . . . . . . . . . . . . . . . . . . . . . . . . . . . . . 0.1 (1.5)
Total Wendy’s/Arby’s . . . . . . . . . . . . . . . . . . . . . . . . . . . . . . . . . . . . . . . . . . . . . $ (8.1) $102.0
48
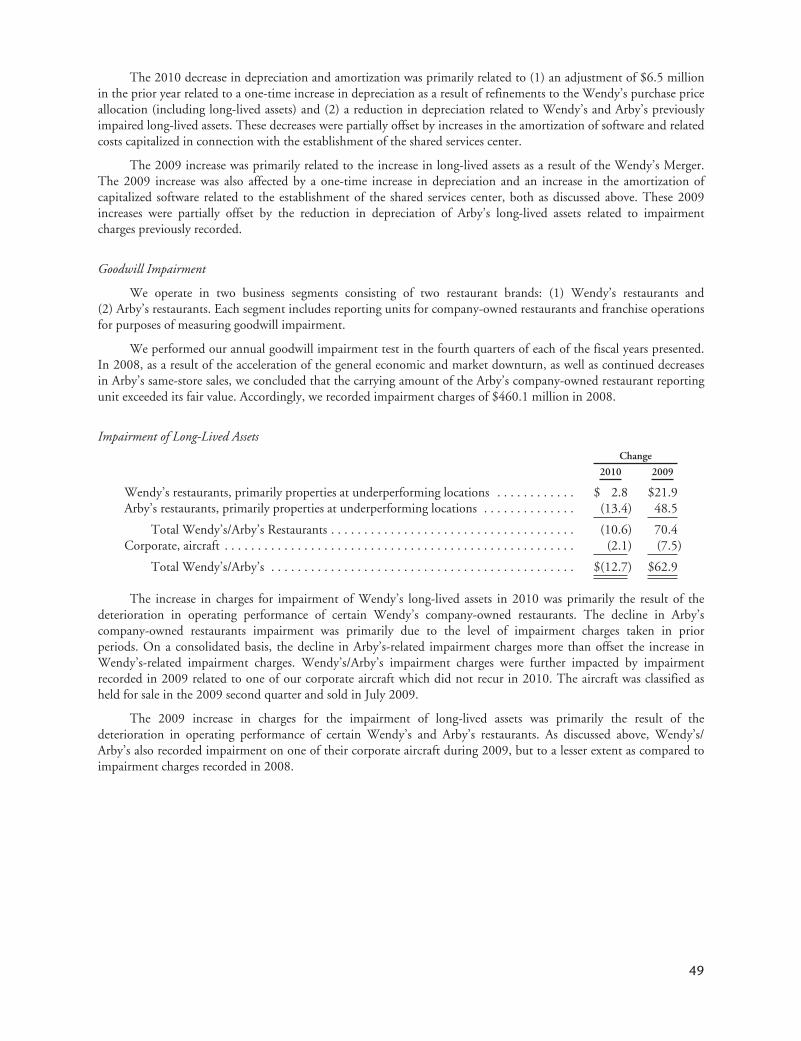
The 2010 decrease in depreciation and amortization was primarily related to (1) an adjustment of $6.5 millionin the prior year related to a one-time increase in depreciation as a result of refinements to the Wendy’s purchase priceallocation (including long-lived assets) and (2) a reduction in depreciation related to Wendy’s and Arby’s previouslyimpaired long-lived assets. These decreases were partially offset by increases in the amortization of software and relatedcosts capitalized in connection with the establishment of the shared services center.
The 2009 increase was primarily related to the increase in long-lived assets as a result of the Wendy’s Merger.The 2009 increase was also affected by a one-time increase in depreciation and an increase in the amortization ofcapitalized software related to the establishment of the shared services center, both as discussed above. These 2009increases were partially offset by the reduction in depreciation of Arby’s long-lived assets related to impairmentcharges previously recorded.
Goodwill Impairment
We operate in two business segments consisting of two restaurant brands: (1) Wendy’s restaurants and(2) Arby’s restaurants. Each segment includes reporting units for company-owned restaurants and franchise operationsfor purposes of measuring goodwill impairment.
We performed our annual goodwill impairment test in the fourth quarters of each of the fiscal years presented.In 2008, as a result of the acceleration of the general economic and market downturn, as well as continued decreasesin Arby’s same-store sales, we concluded that the carrying amount of the Arby’s company-owned restaurant reportingunit exceeded its fair value. Accordingly, we recorded impairment charges of $460.1 million in 2008.
Impairment of Long-Lived AssetsChange
2010 2009
Wendy’s restaurants, primarily properties at underperforming locations . . . . . . . . . . . . $ 2.8 $21.9Arby’s restaurants, primarily properties at underperforming locations . . . . . . . . . . . . . . (13.4) 48.5
Total Wendy’s/Arby’s Restaurants . . . . . . . . . . . . . . . . . . . . . . . . . . . . . . . . . . . . . (10.6) 70.4Corporate, aircraft . . . . . . . . . . . . . . . . . . . . . . . . . . . . . . . . . . . . . . . . . . . . . . . . . . . . . (2.1) (7.5)
Total Wendy’s/Arby’s . . . . . . . . . . . . . . . . . . . . . . . . . . . . . . . . . . . . . . . . . . . . . . $(12.7) $62.9
The increase in charges for impairment of Wendy’s long-lived assets in 2010 was primarily the result of thedeterioration in operating performance of certain Wendy’s company-owned restaurants. The decline in Arby’scompany-owned restaurants impairment was primarily due to the level of impairment charges taken in priorperiods. On a consolidated basis, the decline in Arby’s-related impairment charges more than offset the increase inWendy’s-related impairment charges. Wendy’s/Arby’s impairment charges were further impacted by impairmentrecorded in 2009 related to one of our corporate aircraft which did not recur in 2010. The aircraft was classified asheld for sale in the 2009 second quarter and sold in July 2009.
The 2009 increase in charges for the impairment of long-lived assets was primarily the result of thedeterioration in operating performance of certain Wendy’s and Arby’s restaurants. As discussed above, Wendy’s/Arby’s also recorded impairment on one of their corporate aircraft during 2009, but to a lesser extent as compared toimpairment charges recorded in 2008.
49
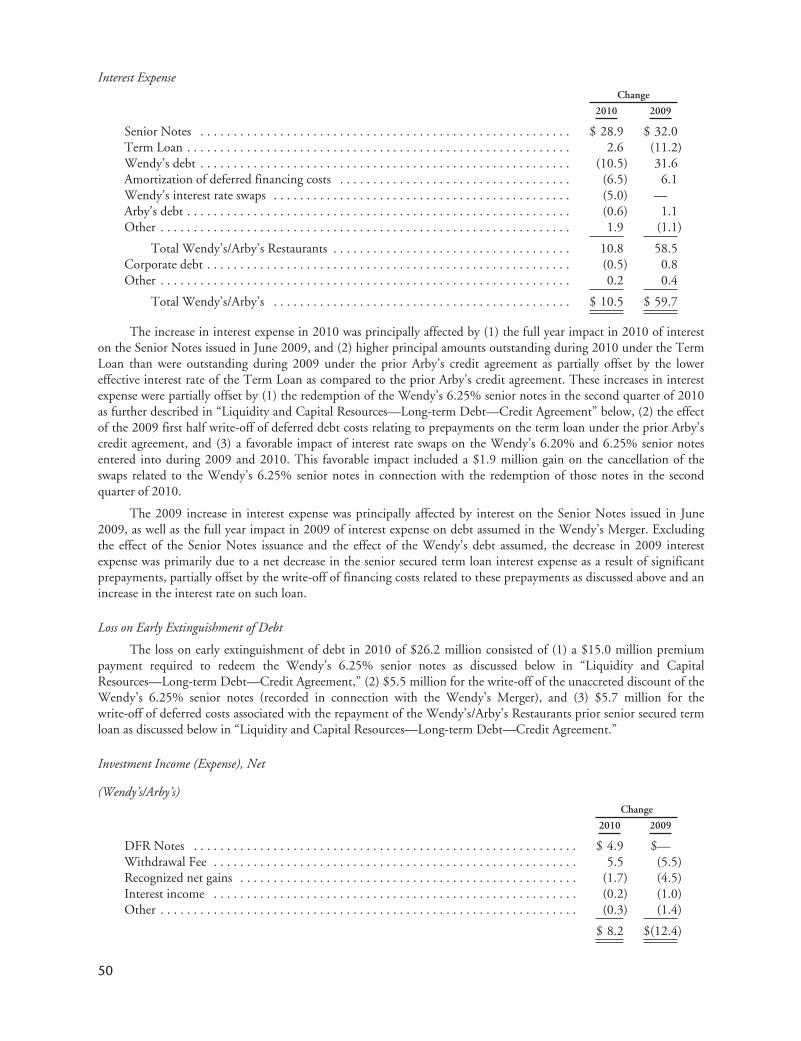
Interest ExpenseChange
2010 2009
Senior Notes . . . . . . . . . . . . . . . . . . . . . . . . . . . . . . . . . . . . . . . . . . . . . . . . . . . . . . . . $ 28.9 $ 32.0Term Loan . . . . . . . . . . . . . . . . . . . . . . . . . . . . . . . . . . . . . . . . . . . . . . . . . . . . . . . . . . 2.6 (11.2)Wendy’s debt . . . . . . . . . . . . . . . . . . . . . . . . . . . . . . . . . . . . . . . . . . . . . . . . . . . . . . . . (10.5) 31.6Amortization of deferred financing costs . . . . . . . . . . . . . . . . . . . . . . . . . . . . . . . . . . . (6.5) 6.1Wendy’s interest rate swaps . . . . . . . . . . . . . . . . . . . . . . . . . . . . . . . . . . . . . . . . . . . . . (5.0) —Arby’s debt . . . . . . . . . . . . . . . . . . . . . . . . . . . . . . . . . . . . . . . . . . . . . . . . . . . . . . . . . . (0.6) 1.1Other . . . . . . . . . . . . . . . . . . . . . . . . . . . . . . . . . . . . . . . . . . . . . . . . . . . . . . . . . . . . . . 1.9 (1.1)
Total Wendy’s/Arby’s Restaurants . . . . . . . . . . . . . . . . . . . . . . . . . . . . . . . . . . . . 10.8 58.5Corporate debt . . . . . . . . . . . . . . . . . . . . . . . . . . . . . . . . . . . . . . . . . . . . . . . . . . . . . . . (0.5) 0.8Other . . . . . . . . . . . . . . . . . . . . . . . . . . . . . . . . . . . . . . . . . . . . . . . . . . . . . . . . . . . . . . 0.2 0.4
Total Wendy’s/Arby’s . . . . . . . . . . . . . . . . . . . . . . . . . . . . . . . . . . . . . . . . . . . . . $ 10.5 $ 59.7
The increase in interest expense in 2010 was principally affected by (1) the full year impact in 2010 of intereston the Senior Notes issued in June 2009, and (2) higher principal amounts outstanding during 2010 under the TermLoan than were outstanding during 2009 under the prior Arby’s credit agreement as partially offset by the lowereffective interest rate of the Term Loan as compared to the prior Arby’s credit agreement. These increases in interestexpense were partially offset by (1) the redemption of the Wendy’s 6.25% senior notes in the second quarter of 2010as further described in “Liquidity and Capital Resources—Long-term Debt—Credit Agreement” below, (2) the effectof the 2009 first half write-off of deferred debt costs relating to prepayments on the term loan under the prior Arby’scredit agreement, and (3) a favorable impact of interest rate swaps on the Wendy’s 6.20% and 6.25% senior notesentered into during 2009 and 2010. This favorable impact included a $1.9 million gain on the cancellation of theswaps related to the Wendy’s 6.25% senior notes in connection with the redemption of those notes in the secondquarter of 2010.
The 2009 increase in interest expense was principally affected by interest on the Senior Notes issued in June2009, as well as the full year impact in 2009 of interest expense on debt assumed in the Wendy’s Merger. Excludingthe effect of the Senior Notes issuance and the effect of the Wendy’s debt assumed, the decrease in 2009 interestexpense was primarily due to a net decrease in the senior secured term loan interest expense as a result of significantprepayments, partially offset by the write-off of financing costs related to these prepayments as discussed above and anincrease in the interest rate on such loan.
Loss on Early Extinguishment of Debt
The loss on early extinguishment of debt in 2010 of $26.2 million consisted of (1) a $15.0 million premiumpayment required to redeem the Wendy’s 6.25% senior notes as discussed below in “Liquidity and CapitalResources—Long-term Debt—Credit Agreement,” (2) $5.5 million for the write-off of the unaccreted discount of theWendy’s 6.25% senior notes (recorded in connection with the Wendy’s Merger), and (3) $5.7 million for thewrite-off of deferred costs associated with the repayment of the Wendy’s/Arby’s Restaurants prior senior secured termloan as discussed below in “Liquidity and Capital Resources—Long-term Debt—Credit Agreement.”
Investment Income (Expense), Net
(Wendy’s/Arby’s)Change
2010 2009
DFR Notes . . . . . . . . . . . . . . . . . . . . . . . . . . . . . . . . . . . . . . . . . . . . . . . . . . . . . . . . . . $ 4.9 $—Withdrawal Fee . . . . . . . . . . . . . . . . . . . . . . . . . . . . . . . . . . . . . . . . . . . . . . . . . . . . . . . 5.5 (5.5)Recognized net gains . . . . . . . . . . . . . . . . . . . . . . . . . . . . . . . . . . . . . . . . . . . . . . . . . . . (1.7) (4.5)Interest income . . . . . . . . . . . . . . . . . . . . . . . . . . . . . . . . . . . . . . . . . . . . . . . . . . . . . . . (0.2) (1.0)Other . . . . . . . . . . . . . . . . . . . . . . . . . . . . . . . . . . . . . . . . . . . . . . . . . . . . . . . . . . . . . . . (0.3) (1.4)
$ 8.2 $(12.4)
50

The increase in investment income primarily related to (1) the recognition of income on the DFR Notes asdiscussed above in “Introduction and Executive Overview—Deerfield,” and (2) an early withdrawal fee incurred in2009 that did not recur in 2010. These increases were partially offset by net investment gains recognized in the prioryear that did not recur in 2010. As of January 2, 2011, our remaining investments include a joint venture investmentand certain cost investments.
Our 2009 net gains included realized gains on available-for-sale securities and cost method investments andunrealized and realized gains on derivative instruments. The change in our recognized net gains in 2009 was primarilydue to: (1) $2.8 million of net unrealized and realized losses on swap derivatives held in 2008, (2) $2.3 million of netgains that were realized upon the Equities Sale, and (3) a $2.2 million decrease in net realized losses on available forsale securities held in 2008, as offset by (1) a $9.0 million decrease in net unrealized and realized gains on securitiessold short which were held in 2008, (2) $1.2 million of realized losses on securities sold short in 2009, (3) $0.8million decrease in unrealized gains on put and call option derivatives that were sold in 2009, and (4) $0.8 milliondecrease in gains from the sale of cost method investments. The Withdrawal Fee relates to the fee paid to theManagement Company for the Equities Sale as discussed in “Introduction and Executive Overview—Related PartyTransactions—Equities Account.”
Other Than Temporary Losses on Investments
(Wendy’s/Arby’s)Change
2010 2009
Cost method investments . . . . . . . . . . . . . . . . . . . . . . . . . . . . . . . . . . . . . . . . . . . $(3.1) $ (7.2)Available-for-sale securities, including CDOs . . . . . . . . . . . . . . . . . . . . . . . . . . . . (0.8) (12.3)DFR common stock . . . . . . . . . . . . . . . . . . . . . . . . . . . . . . . . . . . . . . . . . . . . . . . — (68.1)DFR Notes . . . . . . . . . . . . . . . . . . . . . . . . . . . . . . . . . . . . . . . . . . . . . . . . . . . . . — (21.2)
$(3.9) $(108.8)
We did not recognize any other than temporary losses on our remaining investments during 2010. As such the2010 change reflects 2009 other than temporary losses on investments which did not recur in 2010. Due to marketconditions and other factors present during 2009 and 2008, we recorded other than temporary losses of $3.9 millionand $112.7 million, respectively. The following discussion highlights the activity related to changes in other thantemporary losses on investments in 2009 as compared to 2008.
• Losses due to the reduction in value of our investments
Based on a review of our unrealized investment losses, we determined that the decreases in the fair valueof certain of our investments in 2009 and 2008 were other than temporary due to the severity of thedecline, the financial condition of the investee and the prospect for future recovery in the market value ofthe investment. Accordingly, we recorded other than temporary losses on certain common stock, certainavailable-for-sale securities, and certain cost method investments.
The 2009 decrease in losses due to the reduction in value of our investments was principally impacted bythe non-recurring 2008 loss on our DFR common stock discussed in “Introduction and ExecutiveOverview—Deerfield.” In addition, 2009 losses on certain available-for-sale securities were not assignificant due primarily to the Equities Sale in June 2009. Losses in 2009 related to cost methodinvestments were not as significant due to improved market conditions as compared to 2008.
• Losses due to investment collectability
The 2009 decrease in losses due to investment collectability was impacted by the non-recurring allowancefor doubtful collectability on the DFR Notes recorded in 2008, discussed above in “Introduction andExecutive Overview—Deerfield.”
• Losses due to illiquidity
The 2009 decrease in losses due to illiquidity was due to the 2008 write-down of $8.5 million on ourthen entire cost method investment in Jurlique International Pty Ltd, a privately-held Australian upscaleskin care company (“Jurlique”) that did not recur in 2009.
51

Benefit from Income TaxesChange
Wendy’s/Arby’sWendy’s/Arby’s
Restaurants
2010 2009 2010 2009
Federal and state benefit (provision) on variance in (loss) income fromcontinuing operations before tax . . . . . . . . . . . . . . . . . . . . . . . . . . . . . . . . . . . $(3.3) $(200.8) $ 7.3 $(156.7)
Foreign tax credits net of tax on distribution of foreign earnings . . . . . . . . . . . . . 6.6 (9.2) 6.6 (9.2)Recognition of tax benefit of state net operating losses as a result of dissolution of
our captive insurance company . . . . . . . . . . . . . . . . . . . . . . . . . . . . . . . . . . . . (9.6) 9.6 (9.6) 9.6Goodwill impairment . . . . . . . . . . . . . . . . . . . . . . . . . . . . . . . . . . . . . . . . . . . . . — 99.7 — 99.7DFR common stock . . . . . . . . . . . . . . . . . . . . . . . . . . . . . . . . . . . . . . . . . . . . . . — 20.3 — —Other . . . . . . . . . . . . . . . . . . . . . . . . . . . . . . . . . . . . . . . . . . . . . . . . . . . . . . . . . 0.4 4.7 2.5 1.5
$(5.9) $ (75.7) $ 6.8 $ (55.1)
Our income taxes in 2010, 2009 and 2008 were impacted by variations in (loss) income from continuingoperations before tax adjusted for recurring items, such as non-deductible expenses, state income taxes andadjustments related to prior year tax matters, as well as non-recurring, discrete items. Discrete items may occur in anygiven year, but are not consistent from year to year. Taxes changed as a result of discrete items of (1) the 2010 and2008 tax benefit of foreign tax credits net of related taxes on the distribution of foreign earnings, (2) the 2009 taxbenefit on recognizing previously unrecognized state net operating losses, net of valuation allowances, in connectionwith the dissolution of our captive insurance company, (3) the 2008 tax provision on the impairment of goodwill asdescribed above in “Goodwill Impairment” as a result of non-deductible financial reporting goodwill in excess of taxgoodwill and (4) the 2008 tax provision on a loss which is not deductible for tax purposes in connection with thedecline in value of our investment in the common stock of DFR and related declared dividend as described in“Introduction and Executive Overview—Deerfield”.
Income from Discontinued Operations, Net of Income Taxes
(Wendy’s/Arby’s)Change
2010 2009
Income from discontinued operations before income taxes . . . . . . . . . . . . . . . . . . . . . . . . $(0.7) $ 0.5Income tax changes due to settlements of income tax matters . . . . . . . . . . . . . . . . . . . . . . (1.1) (0.6)
(Provision for) benefit from income taxes . . . . . . . . . . . . . . . . . . . . . . . . . . . . . . . . . 0.2 (0.5)
$(1.6) $(0.6)
The changes in the income from discontinued operations for 2010 and 2009 represent transactions in 2009 and2008, respectively, related to the settlement of income tax and other matters from our former premium beverage andsoft drink concentrate business and our former utility and municipal services and refrigeration business segments.
Outlook for 2011
Sales
We anticipate that certain of the factors described above which affected our 2010 company-owned same-storesales, including current restaurant industry-wide sales trends, the uncertain economic environment, highunemployment and competitive discounting, will continue to have an impact on sales for 2011. We expect thatWendy’s sales will be favorably impacted by (1) product innovation, (2) expanding dayparts, and (3) modernizing ourfacilities. We anticipate that Arby’s sales in 2011 will be favorably impacted by (1) our new brand positioninghighlighted by a new marketing campaign, (2) the introduction of new premium products, and (3) continued focuson everyday value. For 2011, the net impact of new store openings and closings is not expected to have a significantimpact on consolidated sales.
52

Franchise Revenues
We expect that the sales trends for franchised restaurants at Wendy’s and Arby’s will continue to be generallyimpacted by many of the same factors described above under “Sales.” Arby’s franchise revenues may also be impactedby certain franchisees’ financial difficulties and the closure of franchised restaurants.
Cost of Sales
We expect that the factors described above which affected cost of sales for company-owned restaurants in 2010for the Wendy’s and Arby’s brand will continue to impact cost of sales in 2011. In addition, we expect both Wendy’sand Arby’s cost of sales to be negatively impacted due to an overall increase in commodity costs.
Depreciation and Amortization
We expect that our depreciation and amortization expenses will increase in 2011 primarily due to the effect ondepreciation of (1) capital expenditures at Wendy’s related to our continued remodeling of company-ownedrestaurants and the opening of new company-owned restaurants and (2) various capital projects.
Interest Expense
We expect our interest expense for 2011 will decrease slightly compared to 2010 primarily as a result of theeffect of the redemption of the Wendy’s 6.25% senior notes and cancellation of related interest rate swaps in May2010, partially offset by an increase in interest expense due to higher principal amounts outstanding during 2011under the Term Loan than were outstanding during 2010 under the Term Loan issued in May 2010 and the priorArby’s credit agreement prior to May 2010, and by the lower effective interest rate of the Term Loan as compared tothe prior Arby’s credit agreement.
Arby’s Strategic Alternatives
In January 2011, Wendy’s/Arby’s announced that it is exploring strategic alternatives for Arby’s, including asale of the brand. This process is in its early phases and there is no assurance as to any particular outcome. To addressuncertainties for our employees created by this process, Wendy’s/Arby’s has implemented a retention program; thepayment of a portion of which is conditioned on the sale of Arby’s. While the process is pending, Arby’s will continueto execute its growth initiatives.
53

Liquidity and Capital Resources
For each of Wendy’s/Arby’s and Wendy’s/Arby’s Restaurants, the following tables included throughoutLiquidity and Capital Resources present dollars in millions.
Net Cash Provided by Operating Activities
2010 Compared with 2009
Net cash provided by operating activities for Wendy’s/Arby’s was $226.3 million for the year ended January 2,2011 as compared to $298.8 million for the year ended January 3, 2010. Net cash provided by operating activities forWendy’s/Arby’s Restaurants was $231.3 million for the year ended January 2, 2011 as compared to $321.7 millionfor the year ended January 3, 2010. The significant components, which accounted for the overall decreases in net cashprovided by operating activities of $72.5 million and $90.4 million for Wendy’s/Arby’s and Wendy’s/Arby’sRestaurants, respectively, for the year ended January 2, 2011 as compared to the year ended January 3, 2010 were asfollows:
Change
Wendy’s/Arby’sRestaurants Corporate Wendy’s/Arby’s
Accrued expenses and other current liabilities:Incentive compensation . . . . . . . . . . . . . . . . . . . . . . . . . $(32.7) $ 0.2 $(32.5)QSCC Co-op Agreement . . . . . . . . . . . . . . . . . . . . . . . (30.5) — (30.5)Interest . . . . . . . . . . . . . . . . . . . . . . . . . . . . . . . . . . . . . (29.8) 0.4 (29.4)Income taxes . . . . . . . . . . . . . . . . . . . . . . . . . . . . . . . . . 4.5 (1.0) 3.5
Accounts payable . . . . . . . . . . . . . . . . . . . . . . . . . . . . . . . . . 38.4 (0.7) 37.7Tax sharing agreement . . . . . . . . . . . . . . . . . . . . . . . . . . . . . (28.9) 28.9 —Net (loss) income and non-cash adjustments, net . . . . . . . . . (13.0) (16.4) (29.4)Other, net . . . . . . . . . . . . . . . . . . . . . . . . . . . . . . . . . . . . . . . 1.6 6.5 8.1
$(90.4) $ 17.9 $(72.5)
The net decrease in the comparative operating cash flow principally resulted from (1) an increase in amountspaid under incentive compensation plans in 2010 versus 2009 for fiscal 2009 and fiscal 2008, respectively, combinedwith a decrease in the amounts accrued in 2010 as compared to 2009 due to lower operating performance, (2) thepayment of start-up costs to QSCC in 2010 which were accrued in 2009, and (3) interest payments in 2010 primarilyresulting from interest payments in January and July 2010 on the Senior Notes and a decrease in interest expense dueto the redemption of the Wendy’s 6.25% senior notes in the second quarter of 2009, partially offset by an increase ininterest expense accruals on the Senior Notes issued in June 2009. The net decrease in comparative operating cashflow was partially offset by the effect of the income tax benefit recorded in 2010 as compared to the provision forincome taxes recorded in 2009 primarily due to variations in (loss) income before income taxes of our subsidiaries in2010 and 2009. These changes were partially offset by the net impact of the following, which affected accountspayable: (1) a decrease in the 2009 amounts payable for non-recurring items more typically included in accruedexpenses rather than accounts payable with no comparable amounts in 2010, (2) a decrease in the volume oftransactions processed as received from third parties, due in part to the decrease in sales in 2010 as compared to 2009,(3) a reduction in amounts paid to the Wendy’s national advertising cooperative in 2010 as compared to 2009 due tochanges in the timing of royalty payments to them and a shift of product testing to the advertising co-op, and(4) amounts paid in 2009 associated with certain outstanding 2008 lease payments which did not recur in2010. Wendy’s/Arby’s Restaurants’ comparative operating cash flow was also impacted by an increase in amountsaccrued in 2010 versus 2009 for Federal and state income taxes under a tax sharing agreement with Wendy’s/Arby’s,partially offset by 2009 tax payments under this agreement, which were settled in cash with Wendy’s/Arby’s.
Additionally, for the year ended January 2, 2011, the Companies had the following significant sources and usesof cash other than from operating activities:
• Proceeds from the term loan of $497.5 million;
• Repayments of $250.8 million of Wendy’s/Arby’s Restaurants amended senior secured term loan;
54
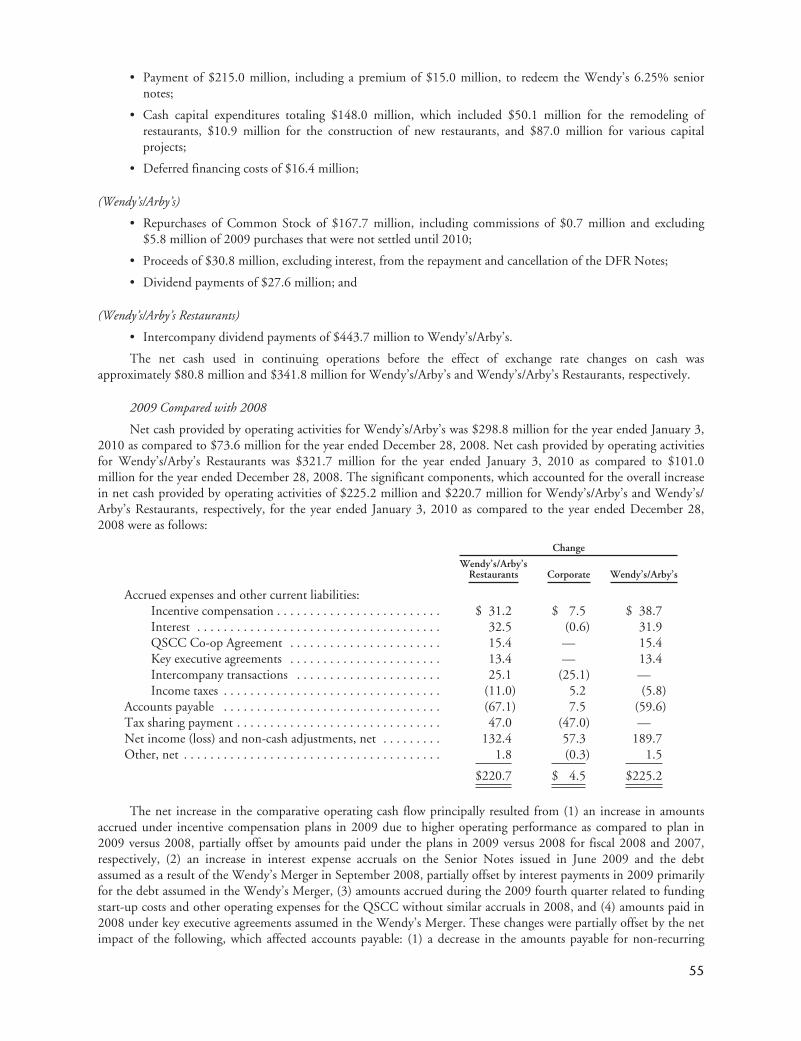
• Payment of $215.0 million, including a premium of $15.0 million, to redeem the Wendy’s 6.25% seniornotes;
• Cash capital expenditures totaling $148.0 million, which included $50.1 million for the remodeling ofrestaurants, $10.9 million for the construction of new restaurants, and $87.0 million for various capitalprojects;
• Deferred financing costs of $16.4 million;
(Wendy’s/Arby’s)
• Repurchases of Common Stock of $167.7 million, including commissions of $0.7 million and excluding$5.8 million of 2009 purchases that were not settled until 2010;
• Proceeds of $30.8 million, excluding interest, from the repayment and cancellation of the DFR Notes;
• Dividend payments of $27.6 million; and
(Wendy’s/Arby’s Restaurants)
• Intercompany dividend payments of $443.7 million to Wendy’s/Arby’s.
The net cash used in continuing operations before the effect of exchange rate changes on cash wasapproximately $80.8 million and $341.8 million for Wendy’s/Arby’s and Wendy’s/Arby’s Restaurants, respectively.
2009 Compared with 2008
Net cash provided by operating activities for Wendy’s/Arby’s was $298.8 million for the year ended January 3,2010 as compared to $73.6 million for the year ended December 28, 2008. Net cash provided by operating activitiesfor Wendy’s/Arby’s Restaurants was $321.7 million for the year ended January 3, 2010 as compared to $101.0million for the year ended December 28, 2008. The significant components, which accounted for the overall increasein net cash provided by operating activities of $225.2 million and $220.7 million for Wendy’s/Arby’s and Wendy’s/Arby’s Restaurants, respectively, for the year ended January 3, 2010 as compared to the year ended December 28,2008 were as follows:
Change
Wendy’s/Arby’sRestaurants Corporate Wendy’s/Arby’s
Accrued expenses and other current liabilities:Incentive compensation . . . . . . . . . . . . . . . . . . . . . . . . . $ 31.2 $ 7.5 $ 38.7Interest . . . . . . . . . . . . . . . . . . . . . . . . . . . . . . . . . . . . . 32.5 (0.6) 31.9QSCC Co-op Agreement . . . . . . . . . . . . . . . . . . . . . . . 15.4 — 15.4Key executive agreements . . . . . . . . . . . . . . . . . . . . . . . 13.4 — 13.4Intercompany transactions . . . . . . . . . . . . . . . . . . . . . . 25.1 (25.1) —Income taxes . . . . . . . . . . . . . . . . . . . . . . . . . . . . . . . . . (11.0) 5.2 (5.8)
Accounts payable . . . . . . . . . . . . . . . . . . . . . . . . . . . . . . . . . (67.1) 7.5 (59.6)Tax sharing payment . . . . . . . . . . . . . . . . . . . . . . . . . . . . . . . 47.0 (47.0) —Net income (loss) and non-cash adjustments, net . . . . . . . . . 132.4 57.3 189.7Other, net . . . . . . . . . . . . . . . . . . . . . . . . . . . . . . . . . . . . . . . 1.8 (0.3) 1.5
$220.7 $ 4.5 $225.2
The net increase in the comparative operating cash flow principally resulted from (1) an increase in amountsaccrued under incentive compensation plans in 2009 due to higher operating performance as compared to plan in2009 versus 2008, partially offset by amounts paid under the plans in 2009 versus 2008 for fiscal 2008 and 2007,respectively, (2) an increase in interest expense accruals on the Senior Notes issued in June 2009 and the debtassumed as a result of the Wendy’s Merger in September 2008, partially offset by interest payments in 2009 primarilyfor the debt assumed in the Wendy’s Merger, (3) amounts accrued during the 2009 fourth quarter related to fundingstart-up costs and other operating expenses for the QSCC without similar accruals in 2008, and (4) amounts paid in2008 under key executive agreements assumed in the Wendy’s Merger. These changes were partially offset by the netimpact of the following, which affected accounts payable: (1) a decrease in the amounts payable for non-recurring
55

items more typically included in accrued expenses rather than accounts payable, (2) a decrease in amounts payable forfood costs in 2009 as compared to 2008 primarily due to lower commodity costs during the end of 2009 versus theend of 2008, (3) an accumulation of certain payables associated with Arby’s lease agreements which were accrued atthe end of 2008 and paid in 2009, (4) an increase in amounts payable at the end of 2008 that were paid in 2009related to the timing of receipt of vendor invoices, and (5) an increase in amounts paid to Wendy’s nationaladvertising cooperative in 2009, combined with a decrease in amounts payable to the Wendy’s national advertisingcooperative at the end of 2009 versus 2008. In addition, the net increase in comparative operating a cash flow waspartially offset by an increase in income tax payments in 2009 as compared to 2008. Wendy’s/Arby’s Restaurants’ netincrease in comparative operating cash flow was also impacted by (1) an increase in amounts accrued in 2009 versus2008 for Federal and state income taxes under a tax sharing agreement with Wendy’s/Arby’s, combined with adecrease in tax payments made in 2008 versus 2009 under this agreement, and (2) a decrease in certain non-recurringintercompany transactions during 2008 which eliminate in the consolidation of Wendy’s/Arby’s.
Additionally, for the year ended January 3, 2010, the Companies had the following significant sources and usesof cash other than from operating activities:
• Proceeds of $607.5 million primarily from the issuance of the Senior Notes discussed below under “Long-term Debt”;
• Net repayments of other long-term debt of $209.5 million, including a prepayment of $132.5 million on oursenior secured term loan;
• Cash capital expenditures totaling $101.9 million, which included $19.1 million for the remodeling ofrestaurants, $18.1 million for the construction of new restaurants, and $64.7 million for various capitalprojects;
• Deferred financing costs of $38.4 million;
(Wendy’s/Arby’s)
• Net investment proceeds of $38.1 million;
• Repurchases of Common Stock of $72.9 million, including commissions of $0.3 million and excluding $5.8million of repurchases that were not settled until after year end;
• Dividend payments of $28.0 million; and
(Wendy’s/Arby’s Restaurants)
• Intercompany dividend payments of $115.0 million to Wendy’s/Arby’s.
The net cash provided by continuing operations before the effect of exchange rate changes on cash wasapproximately $502.6 million and $473.1 million for Wendy’s/Arby’s and Wendy’s/Arby’s Restaurants, respectively.
Sources and Uses of Cash for 2011
The Companies’ anticipated consolidated cash requirements for continuing operations for 2011, exclusive ofoperating cash flow requirements, consist principally of:
• Cash capital expenditures of approximately $184 million as discussed below in “Capital Expenditures”;
• Scheduled debt principal repayments aggregating $18 million;
• Any potential business acquisitions or dispositions; and
• The costs of any potential business acquisitions or financing activities.
(Wendy’s/Arby’s)
• Quarterly cash dividends aggregating up to approximately $33.5 million as discussed below in “Dividends”;
• Potential repurchases of Common Stock of up to $250.0 million under the currently authorized stockrepurchase program; and
56
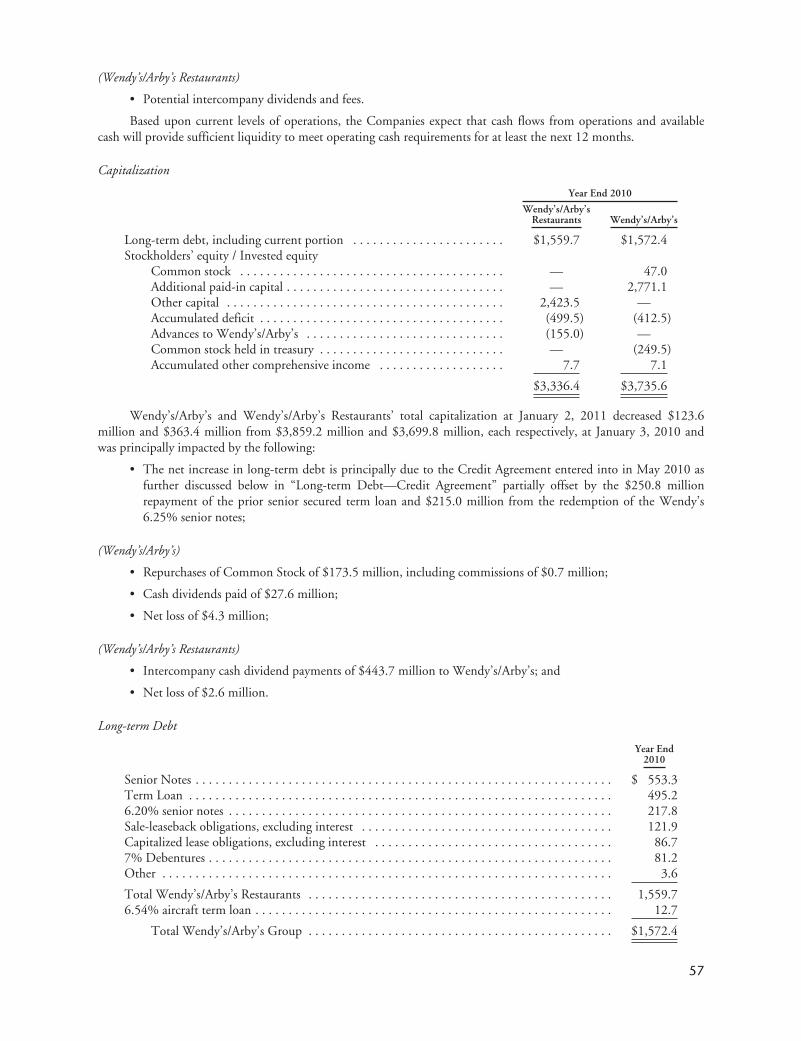
(Wendy’s/Arby’s Restaurants)
• Potential intercompany dividends and fees.
Based upon current levels of operations, the Companies expect that cash flows from operations and availablecash will provide sufficient liquidity to meet operating cash requirements for at least the next 12 months.
Capitalization
Year End 2010
Wendy’s/Arby’sRestaurants Wendy’s/Arby’s
Long-term debt, including current portion . . . . . . . . . . . . . . . . . . . . . . . $1,559.7 $1,572.4Stockholders’ equity / Invested equity
Common stock . . . . . . . . . . . . . . . . . . . . . . . . . . . . . . . . . . . . . . . . — 47.0Additional paid-in capital . . . . . . . . . . . . . . . . . . . . . . . . . . . . . . . . . — 2,771.1Other capital . . . . . . . . . . . . . . . . . . . . . . . . . . . . . . . . . . . . . . . . . . 2,423.5 —Accumulated deficit . . . . . . . . . . . . . . . . . . . . . . . . . . . . . . . . . . . . . (499.5) (412.5)Advances to Wendy’s/Arby’s . . . . . . . . . . . . . . . . . . . . . . . . . . . . . . (155.0) —Common stock held in treasury . . . . . . . . . . . . . . . . . . . . . . . . . . . . — (249.5)Accumulated other comprehensive income . . . . . . . . . . . . . . . . . . . 7.7 7.1
$3,336.4 $3,735.6
Wendy’s/Arby’s and Wendy’s/Arby’s Restaurants’ total capitalization at January 2, 2011 decreased $123.6million and $363.4 million from $3,859.2 million and $3,699.8 million, each respectively, at January 3, 2010 andwas principally impacted by the following:
• The net increase in long-term debt is principally due to the Credit Agreement entered into in May 2010 asfurther discussed below in “Long-term Debt—Credit Agreement” partially offset by the $250.8 millionrepayment of the prior senior secured term loan and $215.0 million from the redemption of the Wendy’s6.25% senior notes;
(Wendy’s/Arby’s)
• Repurchases of Common Stock of $173.5 million, including commissions of $0.7 million;
• Cash dividends paid of $27.6 million;
• Net loss of $4.3 million;
(Wendy’s/Arby’s Restaurants)
• Intercompany cash dividend payments of $443.7 million to Wendy’s/Arby’s; and
• Net loss of $2.6 million.
Long-term Debt
Year End2010
Senior Notes . . . . . . . . . . . . . . . . . . . . . . . . . . . . . . . . . . . . . . . . . . . . . . . . . . . . . . . . . . . . . . . $ 553.3Term Loan . . . . . . . . . . . . . . . . . . . . . . . . . . . . . . . . . . . . . . . . . . . . . . . . . . . . . . . . . . . . . . . . 495.26.20% senior notes . . . . . . . . . . . . . . . . . . . . . . . . . . . . . . . . . . . . . . . . . . . . . . . . . . . . . . . . . . 217.8Sale-leaseback obligations, excluding interest . . . . . . . . . . . . . . . . . . . . . . . . . . . . . . . . . . . . . . 121.9Capitalized lease obligations, excluding interest . . . . . . . . . . . . . . . . . . . . . . . . . . . . . . . . . . . . 86.77% Debentures . . . . . . . . . . . . . . . . . . . . . . . . . . . . . . . . . . . . . . . . . . . . . . . . . . . . . . . . . . . . . 81.2Other . . . . . . . . . . . . . . . . . . . . . . . . . . . . . . . . . . . . . . . . . . . . . . . . . . . . . . . . . . . . . . . . . . . . 3.6
Total Wendy’s/Arby’s Restaurants . . . . . . . . . . . . . . . . . . . . . . . . . . . . . . . . . . . . . . . . . . . . . . 1,559.76.54% aircraft term loan . . . . . . . . . . . . . . . . . . . . . . . . . . . . . . . . . . . . . . . . . . . . . . . . . . . . . . 12.7
Total Wendy’s/Arby’s Group . . . . . . . . . . . . . . . . . . . . . . . . . . . . . . . . . . . . . . . . . . . . . . $1,572.4
57

Except as described below, there were no material changes to the terms of any debt obligations since January 3,2010. See Note 11 of the Financial Statements and Supplementary Data contained in Item 8 of this document formore information related to our long-term debt obligations.
Credit Agreement
On May 24, 2010, Wendy’s/Arby’s Restaurants entered into a $650.0 million Credit Agreement (the “CreditAgreement”), which includes a $500.0 million senior secured term loan facility (the “Term Loan”) and a$150.0 million senior secured revolving credit facility (the “Credit Facility”). The Credit Agreement containsprovisions for an uncommitted increase of up to $300.0 million principal amount in the aggregate in the CreditFacility and/or Term Loan subject to the satisfaction of certain conditions. The Credit Facility includes a sub-facilityfor the issuance of up to $70.0 million of letters of credit. The obligations under the Credit Agreement are secured bysubstantially all of the non-real estate assets of Wendy’s/Arby’s Restaurants and its domestic subsidiaries (other thancertain unrestricted subsidiaries), the stock of its domestic subsidiaries (other than certain unrestricted subsidiaries),65% of the stock of certain of its foreign subsidiaries, as well as by mortgages on certain restaurant properties.
The Term Loan was issued at 99.5% of the principal amount, which represented an original issue discount of0.5% and resulted in net proceeds paid to us of $497.5 million. The $2.5 million discount is being accreted and therelated charge included in interest expense through the maturity of the Term Loan. The Term Loan will mature onMay 24, 2017 and requires quarterly principal installments which commenced on September 30, 2010 equal to1% per annum of the initial principal amount outstanding, with the balance payable on the maturity date.
Should our strategic alternatives for Arby’s result in a sale of the brand, we may be required to utilize a portionof the sale proceeds to reduce the Term Loan.
The Credit Facility expires not later than May 24, 2015. An unused commitment fee of 50 basis points perannum is payable quarterly on the average unused amount of the Credit Facility until the maturity date.
The interest rate on the Term Loan is based on (i) the Eurodollar Rate as defined in the Credit Agreement (butnot less than 1.50%), plus 3.50%, or a Base Rate, as defined in the Credit Agreement (but not less than 2.50%), plus2.50%. Since the inception of the Term Loan, we have elected to use the Eurodollar Rate, which resulted in aninterest rate on the Term Loan of 5.00% as of January 2, 2011.
The Companies incurred approximately $16.4 million in costs related to the Credit Agreement, which is beingamortized to interest expense over the Term Loan’s term utilizing the effective interest rate method.
Proceeds from the Term Loan were used to (1) repay approximately $253.8 million of existing indebtedness,including fees and interest, under the then existing Wendy’s/Arby’s Restaurants amended senior secured term loanwhich replaced the prior Arby’s credit agreement in March 2009 and which was scheduled to be due in 2012,(2) redeem the Wendy’s 6.25% senior notes scheduled to be due in 2011, and (3) pay fees and expenses related to theCredit Agreement. The remaining Term Loan proceeds were used for working capital and other general corporatepurposes.
The Companies recognized a loss on early extinguishment of debt of $26.2 million in the second quarter of2010 related to the repayment of debt from the proceeds of the Term Loan. This loss consisted of (1) a $15.0 millionpremium payment required to redeem the Wendy’s 6.25% senior notes, (2) $5.5 million for the write-off of theunaccreted discount of the Wendy’s 6.25% senior notes (recorded in connection with the Wendy’s Merger), and(3) $5.7 million for the write-off of deferred costs associated with the repayment of the prior senior secured term loan.
Debt Covenants
The affirmative and negative covenants in the Credit Agreement include, among others, preservation ofcorporate existence; payment of taxes; and maintenance of insurance; and limitations on: indebtedness (includingguarantee obligations of other indebtedness); liens; mergers, consolidations, liquidations and dissolutions; sales ofassets; dividends and other payments in respect of capital stock; investments; payments of certain indebtedness;transactions with affiliates; changes in fiscal year; negative pledge clauses and clauses restricting subsidiarydistributions; and material changes in lines of business. The financial covenants contained in the Credit Agreementare (i) a consolidated interest coverage ratio, (ii) a consolidated senior secured leverage ratio, and (iii) a consolidatedsenior secured lease adjusted leverage ratio. The covenants generally do not restrict Wendy’s/Arby’s or any of its
58
subsidiaries that are not subsidiaries of Wendy’s/Arby’s Restaurants. Wendy’s/Arby’s Restaurants was in compliancewith all covenants of the Credit Agreement as of January 2, 2011 and we expect to remain in compliance with all ofthese covenants for the next 12 months.
The indentures that govern Wendy’s 6.20% senior notes and 7% debentures contain covenants that specifylimits on the incurrence of indebtedness secured by liens and sale-leaseback transactions. We were in compliance withthese covenants as of January 2, 2011 and we expect to remain in compliance with these covenants for the next12 months.
A significant number of the underlying leases in the Arby’s restaurants segment for sale-leaseback obligationsand capitalized lease obligations, as well as operating leases, require or required periodic financial reporting of certainsubsidiary entities within Arby’s or of individual restaurants, which in many cases have not been prepared or reported.The Companies have negotiated waivers and alternative covenants with their most significant lessors which substituteconsolidated financial reporting of Arby’s for that of individual subsidiary entities and which modify restaurant levelreporting requirements for more than half of the affected leases. Nevertheless, as of January 2, 2011, we were not incompliance, and remain not in compliance, with the reporting requirements under those leases for which waivers andalternative financial reporting covenants have not been negotiated. However, none of the lessors has asserted that weare in default of any of those lease agreements. We do not believe that such non-compliance will have a materialadverse effect on our consolidated financial position or results of operations.
Derivatives
In connection with the redemption of the Wendy’s 6.25% senior notes discussed above under “CreditAgreement,” we cancelled four interest rate swaps with notional amounts totaling $175.0 million that had swappedthe fixed rate interest rates on these senior notes for floating rates. We recognized a gain on the cancellation of$1.9 million in the second quarter of 2010, which is included in “Interest expense.”
Other Revolving Credit Facilities
In December 2009, and as amended in February and August 2010, AFA entered into a revolving loanagreement with Arby’s. The terms of this agreement allow AFA to have revolving loans of up to $14.0 millionoutstanding with an expiration date of March 2012 and bearing interest at 7.5% per annum. In February 2011, themaximum principal amount was reduced to $11.0 million. As of January 2, 2011, the outstanding revolving loanbalance was $4.5 million.
Convertible Notes
(Wendy’s/Arby’s)
On June 17, 2010, Wendy’s/Arby’s repurchased the remaining 5% convertible notes for $2.1 million,including accrued interest. The convertible notes were repurchased at a price of 100% of their principal amount plusaccrued interest.
59
Contractual Obligations
The following table summarizes the expected payments under our outstanding contractual obligations atJanuary 2, 2011:
Fiscal Years
2011 2012-2013 2014-2015 After 2015 Total
Long-term debt (a) . . . . . . . . . . . . . . . . . . . . . . . . . . . . . . . . $114.9 $228.5 $438.7 $1,316.1 $2,098.2Sale-leaseback obligations (b) . . . . . . . . . . . . . . . . . . . . . . . . . 14.9 30.2 30.5 137.5 213.1Capitalized lease obligations (b) . . . . . . . . . . . . . . . . . . . . . . . 15.9 25.1 26.8 108.7 176.5Operating leases (c) . . . . . . . . . . . . . . . . . . . . . . . . . . . . . . . . 150.5 272.1 233.3 1,032.9 1,688.8Purchase obligations (d) . . . . . . . . . . . . . . . . . . . . . . . . . . . . 90.4 70.1 56.8 77.7 295.0Other (e) . . . . . . . . . . . . . . . . . . . . . . . . . . . . . . . . . . . . . . . . 4.1 0.7 — — 4.8
Total Wendy’s/Arby’s Restaurants . . . . . . . . . . . . . . . . . 390.7 626.7 786.1 2,672.9 4,476.4Corporate long-term debt (a) . . . . . . . . . . . . . . . . . . . . . . . . . 1.4 11.3 — — 12.7Corporate operating leases (c) . . . . . . . . . . . . . . . . . . . . . . . . 1.6 0.7 — — 2.3Other Corporate . . . . . . . . . . . . . . . . . . . . . . . . . . . . . . . . . . 0.2 0.1 — — 0.3
Total Wendy’s/Arby’s (f) . . . . . . . . . . . . . . . . . . . . . . . . $393.9 $638.8 $786.1 $2,672.9 $4,491.7
(a) Excludes sale-leaseback and capitalized lease obligations, which are shown separately in the table. The table aboveincludes interest of approximately $709.4 million for Wendy’s/Arby’s. We have estimated the interest on ourvariable-rate debt based on current base rates, the current interest rate margin and the amortization schedule inour Credit Agreement. The table above also reflects the effect of interest rate swaps entered into in 2009 whichlowered our interest rate on our 6.20% Wendy’s senior notes. These amounts exclude the effects of the originalissue discount on our Senior Notes and the fair value adjustments related to certain debt assumed in theWendy’s Merger.
Should our strategic alternatives for Arby’s result in a sale of the brand, we may be required to utilize a portion ofthe sale proceeds to reduce the Term Loan.
(b) Excludes related sublease rental receipts of $8.1 million on sale-leaseback obligations and $2.7 million oncapitalized lease obligations. The table above includes interest of approximately $91.2 million for sale-leasebackobligations and $89.8 million for capitalized lease obligations.
(c) Represents the minimum lease cash payments. Excludes related sublease rental receipts of $85.5 million forWendy’s/Arby’s Restaurants and additional sublease rental receipts for Wendy’s/Arby’s of $1.9 million.
(d) Includes (1) $215.0 million remaining for beverage purchase requirements for Wendy’s and Arby’s restaurants,(2) $2.8 million for advertising commitments, (3) $33.5 million for capital expenditures and (4) $43.7 millionof other purchase obligations.
(e) Represents (1) $0.3 million for funding of QSCC, (2) $3.0 million for funding related to SSG, (3) $1.4 millionfor potential additional capital investment requirements, and (4) $0.1 million and $0.3 million in severance forWendy’s/Arby’s Restaurants and Wendy’s/Arby’s, respectively.
(f) Excludes obligations for uncertain income tax positions of $26.3 million and $36.4 million for Wendy’s/Arby’sRestaurants and Wendy’s/Arby’s, respectively. We are unable to predict when, and if, cash payments on any ofthis accrual will be required.
Capital Expenditures
In 2010, cash capital expenditures amounted to $148.0 million and non-cash capital expenditures, consisting ofcapitalized leases and certain sale-leaseback obligations, amounted to $5.7 million. In 2011, we expect that cashcapital expenditures will amount to approximately $184 million, principally relating to (1) remodeling approximately100 Wendy’s company-owned restaurants, (2) ongoing maintenance capital expenditures for our company-ownedrestaurants, (3) the opening of an estimated 21 new Wendy’s company-owned restaurants, and (4) various capitalprojects. We have $18.2 million of outstanding commitments for capital expenditures as of January 2, 2011, of whichwe expect $14.5 million to be paid in 2011.
60
Dividends
(Wendy’s/Arby’s)
On March 15, 2010, June 15, 2010, and September 15, 2010, Wendy’s/Arby’s paid quarterly cash dividends of$0.015 per share on its Common Stock, aggregating $19.3 million. On December 15, 2010, Wendy’s/Arby’s paid aquarterly cash dividend of $0.02 per share on its Common Stock, aggregating to $8.3 million. During the 2011 firstquarter, Wendy’s/Arby’s declared dividends of $0.02 per share to be paid on March 15, 2011 to shareholders ofrecord as of March 1, 2011. If Wendy’s/Arby’s pays regular quarterly cash dividends for the remainder of 2011 at thesame rate as declared in our 2011 first quarter, Wendy’s/Arby’s’s total cash requirement for dividends for all of 2011would be approximately $33.5 million based on the number of shares of its Common Stock outstanding atFebruary 25, 2011. Wendy’s/Arby’s currently intends to continue to declare and pay quarterly cash dividends;however, there can be no assurance that any quarterly dividends will be declared or paid in the future or of theamount or timing of such dividends, if any.
(Wendy’s/Arby’s Restaurants)
During 2010, $443.7 million of intercompany dividends were paid to Wendy’s/Arby’s. During 2009,$115.0 million of dividends were paid to Wendy’s/Arby’s. No dividends were paid to Wendy’s/Arby’s during2008. During the fourth quarter of 2008, Wendy’s advanced an aggregate of $155.0 million to Wendy’s/Arby’s,which were used to fund $150.2 million of capital contributions to Arby’s. Arby’s used a portion of these capitalcontributions to prepay the term loan under the prior Arby’s credit agreement in an aggregate principal amount of$143.2 million. These advances do not bear interest and Wendy’s/Arby’s does not currently intend to repay suchadvances.
As of January 2, 2011, under the terms of the Credit Agreement, there was $25.6 million available for thepayment of dividends directly to Wendy’s/Arby’s.
Stock Repurchases
(Wendy’s/Arby’s)
As of January 3, 2010, our Board of Directors had authorized the repurchase of up to a total of $125.0 millionof our Common Stock through January 2, 2011, when and if market conditions warrant and to the extent legallypermissible. On January 27, 2010, March 22, 2010 and May 27, 2010, our Board of Directors authorized therepurchase of up to an additional $75.0 million, $50.0 million and $75.0 million, respectively, of our Common Stockthrough January 2, 2011, when and if market conditions warrant and to the extent legally permissible. As ofJanuary 2, 2011, Wendy’s/Arby’s had repurchased 52.3 million shares with an aggregate purchase price of$245.5 million, excluding commissions of $1.0 million.
On November 11, 2010, our Board of Directors authorized the extension of the current stock repurchaseprogram through January 1, 2012 and authorized the repurchase of up to an additional $170.0 million of ourCommon Stock, bringing the total amount currently authorized to approximately $250.0 million. The stockrepurchase program will allow Wendy’s/Arby’s to make repurchases as market conditions warrant and to the extentlegally permissible.
Guarantees and Other Contingencies
Year End2010
Lease guarantees and contingent rent on leases (1) . . . . . . . . . . . . . . . . . . . . . . . . . . . . . . . . . . . $ 81.3Loan guarantees (2) . . . . . . . . . . . . . . . . . . . . . . . . . . . . . . . . . . . . . . . . . . . . . . . . . . . . . . . . . . . 13.0Letters of credit (3) . . . . . . . . . . . . . . . . . . . . . . . . . . . . . . . . . . . . . . . . . . . . . . . . . . . . . . . . . . . 32.4
Total Wendy’s/Arby’s Restaurants . . . . . . . . . . . . . . . . . . . . . . . . . . . . . . . . . . . . . . . . . . . 126.7Letters of credit (3) . . . . . . . . . . . . . . . . . . . . . . . . . . . . . . . . . . . . . . . . . . . . . . . . . . . . . . . . . . . 0.7
Total Wendy’s/Arby’s . . . . . . . . . . . . . . . . . . . . . . . . . . . . . . . . . . . . . . . . . . . . . . . . . . . . . $127.4
61

(1) Wendy’s is contingently liable for certain leases and other obligations primarily from company-owned restaurantlocations now operated by franchises amounting to $67.3 million as of January 2, 2011. These leases extendthrough 2030. In addition, Wendy’s is contingently liable for certain leases which have been assigned to unrelatedthird parties, who have indemnified Wendy’s against future liabilities arising under the leases of $9.8 million.These leases expire on various dates through 2021. RTM, one of our subsidiaries, guarantees the lease obligationsof eight RTM restaurants formerly operated by affiliates of RTM as of January 2, 2011 (the “Affiliate LeaseGuarantees”). Certain former stockholders of RTM have indemnified us with respect to the Affiliate LeaseGuarantees. In addition, RTM remains contingently liable for 10 leases for restaurants sold by RTM prior to theacquisition of RTM in 2005 if the respective purchasers do not make the required lease payments (collectivelywith the Affiliate Lease Guarantees, the “Lease Guarantees”). The Lease Guarantees, which extend through 2020,could aggregate a maximum of approximately $4.2 million as of January 2, 2011.
(2) Wendy’s provided loan guarantees to various lenders on behalf of franchisees under debt arrangements for newstore development and equipment financing. Recourse on the majority of these loans is limited, generally to apercentage of the original loan amount or the current loan balance on individual franchisee loans or an aggregateminimum for the entire loan arrangement.
(3) Wendy’s/Arby’s Restaurants and Corporate have outstanding letters of credit of $32.4 million and $0.7 million,respectively, with various parties; however, our management does not expect any material loss to result from theseletters of credit because we do not believe performance will be required.
Universal Shelf Registration Statement
(Wendy’s/Arby’s)
In December 2008, Wendy’s/Arby’s filed a universal shelf registration statement with the Securities andExchange Commission in connection with the possible future offer and sale, from time to time, of an indeterminateamount of our Common Stock, preferred stock, debt securities and warrants to purchase any of these types ofsecurities. This registration statement became effective automatically upon filing. Unless otherwise described in theapplicable prospectus supplement relating to any offered securities, Wendy’s/Arby’s anticipates using the net proceedsof each offering for general corporate purposes, including financing of acquisitions and capital expenditures, additionsto working capital and repayment of existing debt. Wendy’s/Arby’s has not presently made any decision to issue anyspecific securities under this universal shelf registration statement.
Inflation and Changing Prices
We believe that inflation did not have a significant effect on our consolidated results of operations during thereporting periods since inflation rates generally remained at relatively low levels.
Seasonality
Our restaurant operations are moderately impacted by seasonality. Wendy’s restaurant revenues are normallyhigher during the summer months than during the winter months, and Arby’s restaurant revenues are somewhatlower in our first quarter. Because our businesses are moderately seasonal, results for any future quarter will notnecessarily be indicative of the results that may be achieved for any other quarter or for the full fiscal year.
Critical Accounting Policies and Estimates
The preparation of our consolidated financial statements in conformity with accounting principles generallyaccepted in the United States of America requires us to make estimates and assumptions in applying our criticalaccounting policies that affect the reported amounts of assets and liabilities and the disclosure of contingent assets andliabilities at the date of the consolidated financial statements and the reported amount of revenues and expensesduring the reporting period. Our estimates and assumptions concern, among other things, goodwill impairment,impairment of long-lived assets, Federal and state income tax uncertainties, and allowance for doubtful accounts. Weevaluate those estimates and assumptions on an ongoing basis based on historical experience and on various otherfactors which we believe are reasonable under the circumstances.
62

We believe that the following represent our more critical estimates and assumptions used in the preparation ofour consolidated financial statements:
• Goodwill impairment:
The Companies operate in two business segments consisting of two restaurant brands: (1) Wendy’srestaurant operations and (2) Arby’s restaurant operations. In 2010, the Arby’s segment includedcompany-owned restaurants and franchise reporting units and the Wendy’s segment included Wendy’sNorth America and international restaurant reporting units. As of January 2, 2011, substantially allWendy’s goodwill of $866.0 million was associated with its North America reporting unit and Arby’sgoodwill of $17.6 million relates entirely to the its franchise reporting unit.
We test goodwill for impairment annually, or more frequently if events or changes in circumstancesindicate that the asset may be impaired using a two-step process. Under the first step, the fair value of thereporting unit is compared with its carrying value (including goodwill). If the fair value of the reportingunit is less than its carrying value, an indication of goodwill impairment exists for the reporting unit andwe must perform step two of the impairment test (measurement). Step two of the impairment test, ifnecessary, requires the estimation of the fair value for the assets and liabilities of a reporting unit in orderto calculate the implied fair value of the reporting unit’s goodwill. Under step two, an impairment loss isrecognized to the extent the carrying amount of the reporting unit’s goodwill exceeds the implied fair valueof goodwill. The fair value of the reporting unit is determined by management and is based on the resultsof (1) estimates we made regarding the present value of the anticipated cash flows associated with eachreporting unit (the “income approach”) and (2) the indicated value of the reporting units based on acomparison and correlation of the Companies and other similar companies (the “market approach”).
The income approach, which considers factors unique to each of our reporting units and related long rangeplans that may not be comparable to other companies and that are not yet publicly available, is dependenton several critical management assumptions. These assumptions include estimates of future sales growth,gross margins, operating costs, income tax rates, terminal value growth rates, capital expenditures and theweighted average cost of capital (discount rate). Anticipated cash flows used under the income approachare developed every fourth quarter in conjunction with our annual budgeting process and also incorporateamounts and timing of future cash flows based on our long range plan.
The discount rates used in the income approach are an estimate of the rate of return that a marketparticipant would expect of each reporting unit. To select an appropriate rate for discounting the futureearnings stream, a review was made of short-term interest rate yields of long-term corporate andgovernment bonds, as well as the typical capital structure of companies in the industry. The discount ratesused for each reporting unit may vary depending on the risk inherent in the cash flow projections, as wellas the risk level that would be perceived by a market participant. A terminal value is included at the end ofthe projection period used in our discounted cash flow analyses to reflect the remaining value that eachreporting unit is expected to generate. The terminal value represents the present value in the last year of theprojection period of all subsequent cash flows into perpetuity. The terminal value growth rate is a keyassumption used in determining the terminal value as it represents the annual growth of all subsequentcash flows into perpetuity.
Under the market approach, we apply the guideline company method in estimating fair value. Theguideline company method makes use of market price data of corporations whose stock is actively tradedin a public market. The corporations we selected as guideline companies are engaged in a similar line ofbusiness or are subject to similar financial and business risks, including the opportunity for growth. Theguideline company method of the market approach provides an indication of value by relating the equityor invested capital (debt plus equity) of guideline companies to various measures of their earnings and cashflow, then applying such multiples to the business being valued. The result of applying the guidelinecompany approach is adjusted based on the incremental value associated with a controlling interest in thebusiness. This “control premium” represents the amount a new controlling shareholder would pay for thebenefits resulting from synergies and other potential benefits derived from controlling the enterprise.
We performed our annual goodwill impairment test in the fourth quarter of 2010. Our assessment ofgoodwill of the Wendy’s North America Restaurants in the fourth quarter of 2010 indicated that there hadbeen no impairment and that the fair value of this reporting unit of $3,080 million was approximately
63

12% in excess of its carrying value. Our assessment of the Arby’s franchise restaurant reporting unit in thefourth quarter of 2010 indicated that there had been no impairment and that its fair value significantlyexceeded its carrying value.
The estimated fair value of our reporting units are subject to change as a result of many factors including,among others, any changes in our business plans, changing economic conditions and the competitiveenvironment. Should actual cash flows and our future estimates vary adversely from those estimates we use,we may be required to recognize goodwill impairment charges in future years.
• Impairment of long-lived assets:
Long-lived assets include our Wendy’s and Arby’s company-owned restaurant assets, their intangible assets,which include trademarks, franchise agreements, favorable leases and reacquired rights under franchiseagreements, and certain prepaid assets.
As of January 2, 2011, the net carrying value of Wendy’s restaurant segment long-lived tangible andintangible assets were $1,145.7 million and $1,312.6 million (which includes $903.0 million associatedwith Wendy’s non-amortizing trademarks), respectively, and Arby’s restaurant segment long-lived tangibleand intangible assets were $382.4 million and $24.5 million, respectively.
We review long-lived tangible and amortizing intangible assets for impairment whenever events or changesin circumstances indicate that the carrying amount of an asset may not be recoverable. We assess therecoverability of property and equipment and finite-lived other intangible assets by comparing the carryingamount of the asset to future undiscounted net cash flows expected to be generated by the asset. If thecarrying amount of the long-lived asset is not recoverable on an undiscounted cash flow basis, thenimpairment is recognized to the extent that the carrying amount exceeds its fair value and is included in“Impairment of long-lived assets.” Our critical estimates in this review process include the anticipatedfuture cash flows of each of Wendy’s and Arby’s company-owned restaurants used in assessing therecoverability of their respective long-lived assets.
Non-amortizing intangible assets are tested for impairment at least annually by comparing their carryingvalue to fair value; any excess of carrying value over fair value would represent impairment and acorresponding charge would be recorded. Our critical estimates in the determination of the fair value ofthe non-amortizing intangible assets include the anticipated future revenues of company-owned andfranchised restaurants and the resulting cash flows.
Our restaurant impairment losses principally reflect impairment charges resulting from the deterioration inoperating performance of certain company-owned restaurants. Those estimates are or were subject tochange as a result of many factors including, among others, any changes in our business plans, changingeconomic conditions and the competitive environment. Should actual cash flows and our future estimatesvary adversely from those estimates we used, we may be required to recognize additional impairmentcharges in future years.
• Federal and state income tax uncertainties:
We measure income tax uncertainties in accordance with a two-step process of evaluating a taxposition. We first determine if it is more likely than not that a tax position will be sustained uponexamination based on the technical merits of the position. A tax position that meets the more-likely-than-not recognition threshold is then measured, for purposes of financial statement recognition, as thelargest amount that has a greater than fifty percent likelihood of being realized upon effectivesettlement. Wendy’s/Arby’s has unrecognized tax benefits of $36.4 million and $39.1 million, which ifresolved favorably would reduce their tax expense by $25.2 million and $27.1 million, at January 2, 2011and January 3, 2010, respectively. Wendy’s/Arby’s Restaurants has unrecognized tax benefits of$26.2 million and $28.4 million, which if resolved favorably would reduce their tax expense by$17.1 million and $18.5 million, at January 2, 2011 and January 3, 2010.
We recognize interest accrued related to uncertain tax positions in “Interest expense” and penalties in“General and administrative expenses.” At January 2, 2011 and January 3, 2010, Wendy’s/Arby’s had$5.0 million and $4.3 million accrued for interest and $1.5 million and $1.0 million accrued for penalties,both respectively. Wendy’s/Arby’s Restaurants had $4.7 million and $4.1 million accrued for interest and$1.2 million and $0.8 million accrued for penalties, both respectively.
64

Wendy’s/Arby’s participates in the Internal Revenue Service (the “IRS”) Compliance Assurance Program(“CAP”). As part of CAP, tax years are audited on a contemporaneous basis so that all or most issues areresolved prior to the filing of the tax return. As such, our December 28, 2008 and January 3, 2010 taxreturns, along with the Wendy’s pre-merger tax returns have been settled. Our U.S. Federal income taxreturns for 2007 and September 29, 2008 are not currently under examination. Certain of the Wendy’s/Arby’s state income tax returns from its 1998 fiscal year and forward remain subject to examination. Webelieve that adequate provisions have been made for any liabilities, including interest and penalties thatmay result from the completion of these examinations.
• Allowance for doubtful accounts
The need for an allowance for doubtful accounts on receivables related to franchisee obligations consistingprimarily of royalties, franchise fees, and rents is reviewed on a specific franchisee basis based upon pastdue balances and the financial strength of the franchisee. If average sales or the financial health offranchisees were to deteriorate, it could result in an increase to the allowance for doubtful accounts relatedto franchise receivables. In 2010, Wendy’s and Arby’s franchisee related accounts receivable and notesreceivable and estimated reserves for uncollectibility have increased significantly, and may continue toincrease, as a result of the deteriorating financial condition of some of our franchisees. For the year endedJanuary 2, 2011, the Companies recorded $9.7 million in provision for doubtful accounts, which relatedto the Wendy’s and Arby’s franchisees.
Item 7A. Quantitative and Qualitative Disclosures about Market Risk.
Certain statements the Companies make under this Item 7A constitute “forward-looking statements” under thePrivate Securities Litigation Reform Act of 1995. See “Special Note Regarding Forward-Looking Statements andProjections” in “Part I” preceding “Item 1.”
We are exposed to the impact of interest rate changes, changes in commodity prices, changes in the fair value ofour investments and foreign currency fluctuations primarily related to the Canadian dollar. In the normal course ofbusiness, we employ established policies and procedures to manage our exposure to these changes using financialinstruments we deem appropriate.
Interest Rate Risk
Our objective in managing our exposure to interest rate changes is to limit the impact on our earnings and cashflows. Our policy is to maintain a target, over time and subject to market conditions, of between 50% and 75% of“Long-term debt” as fixed rate debt. As of January 2, 2011, Wendy’s/Arby’s and Wendy’s/Arby’s Restaurants long-term debt, including current portion, aggregated $1,572.4 million and $1,559.7 million, respectively. Long-term debtconsisted of $868.6 million and $855.9 million of fixed-rate debt at Wendy’s/Arby’s and Wendy’s/Arby’sRestaurants, respectively; and $495.2 million of variable interest rate debt and $208.6 million of capitalized lease andsale-leaseback obligations for both companies. The Companies variable interest rate debt consists of $495.2 term loanborrowings under a variable-rate senior secured term loan facility due through 2017 (the “Term Loan”). The interestrate on the Term Loan is based on the Eurodollar rate, which has a floor of 1.50%, plus 3.50%, or a base rate, whichhas a floor of 2.50%, plus 2.50%. Since the inception of the Term Loan, and as of January 2, 2011, we have electedto use the Eurodollar Rate which resulted in an interest rate on the Term Loan of 5.00% as of January 2, 2011.
Consistent with our policy, we entered into several outstanding interest rate swap agreements (the “InterestRate Swaps”) during the third quarter of 2009 and the first quarter of 2010 with notional amounts totaling$186.0 million and $39.0 million, respectively, that swap the fixed rate interest rates on the Wendy’s 6.20% seniornotes for floating rates. The Interest Rate Swaps are accounted for as fair value hedges. At January 2, 2011, the fairvalue of our Interest Rate Swaps was $9.6 million and was included in “Deferred costs and other assets” and as anadjustment to the carrying amount of the Wendy’s 6.20% senior notes. Our policies prohibit the use of derivativeinstruments for trading purposes, and we have procedures in place to monitor and control their use. If any portion ofthe hedge is determined to be ineffective, any changes in fair value would be recognized in our results of operations.
65
Commodity Price Risk
In our restaurant segments, we purchase certain food products, such as beef, poultry, pork and cheese, that areaffected by changes in commodity prices and, as a result, we are subject to variability in our food costs. While pricevolatility can occur, which would impact profit margins, there are generally alternative suppliers available. Our abilityto recover increased costs through higher pricing is, at times, limited by the competitive environment in which weoperate. Management monitors our exposure to commodity price risk.
Arby’s does not enter into financial instruments to hedge commodity prices or hold any significant inventoriesof these commodities. In order to ensure favorable pricing for its major food products, as well as maintain an adequatesupply of fresh food products, we are members of a purchasing cooperative along with our franchisees that negotiatescontracts with approved suppliers on behalf of the Arby’s system. These contracts establish pricing arrangements, andhistorically have limited the variability of these commodity costs, but do not establish any firm purchasecommitments by us or our franchisees.
In 2010, Wendy’s, along with our franchisees, became members of a purchasing cooperative established in2009 that negotiates contracts with approved suppliers on behalf of the Wendy’s system in order to ensure favorablepricing for its major food products, as well as maintain an adequate supply of fresh food products. The purchasingcontracts which established pricing arrangements, and historically have limited the variability of these commoditycosts but did not establish any firm purchase commitments by us or our franchisees, were transferred to thepurchasing cooperative in January 2010.
Foreign Currency Risk
Our exposures to foreign currency risk are primarily related to fluctuations in the Canadian dollar relative to theU.S. dollar for our Canadian operations. Exposure outside of North America is limited to the effect of ratefluctuations on royalties paid by franchisees. We monitor these exposures and periodically determine our need for theuse of strategies intended to lessen or limit our exposure to these fluctuations. We have exposure to (1) our equityinvestment in a Canadian restaurant real estate joint venture (“TimWen”) with Tim Hortons Inc., (2) investments ina Canadian subsidiary, and (3) export revenues and related receivables denominated in foreign currencies which aresubject to foreign currency fluctuations. Our Canadian subsidiary exposures relate to its restaurants and administrativeoperations. The exposure to Canadian dollar exchange rates on the Companies’ cash flows primarily includes importspaid for by Canadian operations in U.S. dollars and payments from the Companies’ Canadian operations to theCompanies’ U.S. operations in U.S. dollars, and to a lesser extent royalties paid by Canadian franchisees. Revenuesfrom foreign operations for the year ended January 2, 2011 represented 10% of our total franchise revenues and 8%of our total revenues. For the year ended January 3, 2010, the same percentages were 9% and 7%,respectively. Accordingly, an immediate 10% change in foreign currency exchange rates versus the United Statesdollar from their levels at January 2, 2011 and January 3, 2010 would not have a material effect on our consolidatedfinancial position or results of operations.
Equity Market Risk
Our objective in managing our exposure to changes in the market value of our investments is to balance the riskof the impact of these changes on their earnings and cash flows with their expectations for long-term investmentreturns.
66

Overall Market Risk
Our overall market risk as of January 2, 2011 with the exception of our equity investment in TimWen was notmaterial. As of January 2, 2011 and January 3, 2010, our investment in TimWen was classified in the consolidatedbalance sheets as follows (in millions):
Year End 2010
TypeAt
Cost
At FairValue
(a)Carrying
Value
Non-current equity investment (b) . . . . . . . . . . . . . . . . . . . . . . . . . . . . . . . . $80.7 $98.6 $98.6
Year End 2009
TypeAt
Cost
At FairValue
(a)Carrying
Value
Non-current equity investment (b) . . . . . . . . . . . . . . . . . . . . . . . . . . . . . . . . $89.0 $97.5 $97.5
(a) There was no assurance at January 2, 2011 or January 3, 2010 that the Companies would have been able to sellthis investment at this amount.
(b) The Companies believe that the fair value of their equity interest in TimWen is at least equal to its carrying valueas there have been no indications of its impairment.
Wendy’s is a partner in TimWen and our 50% share of the joint venture is accounted for in accordance withthe equity method of accounting.
Sensitivity Analysis
Market risk exposure for Wendy’s/Arby’s and Wendy’s/Arby’s Restaurants is presented for each class offinancial instruments held by the Companies at January 2, 2011 and January 3, 2010 for which an immediate adversemarket movement would cause a potential material impact on their financial position or results of operations. Webelieve that the adverse market movements described below represent the hypothetical loss to our financial position orour results of operations and do not represent the maximum possible loss nor any expected actual loss, even underadverse conditions, because actual adverse fluctuations would likely differ. As of January 2, 2011, we did not hold anymarket-risk sensitive instruments, which were entered into for trading purposes. As such, the table below reflects therisk for those financial instruments entered into as of January 2, 2011 and January 3, 2010 based upon assumedimmediate adverse effects as noted below (in millions):
Year End 2010
CarryingValue
InterestRateRisk
EquityPriceRisk
ForeignCurrency
Risk
Non-current equity investment . . . . . . . . . . . . . . . . . . . . . . . . . $ 98.6 $ — $(9.9) $(9.9)Interest rate swaps . . . . . . . . . . . . . . . . . . . . . . . . . . . . . . . . . . . 9.6 (7.7) — —Long-term debt, excluding capitalized lease and sale-leaseback
obligations-variable rate . . . . . . . . . . . . . . . . . . . . . . . . . . . . . (495.2) (30.7) — —Long-term debt, excluding capitalized lease and sale-leaseback
obligations-fixed rate:Wendy’s/Arby’s Restaurants . . . . . . . . . . . . . . . . . . . . . . . (855.9) (79.0) — —Corporate . . . . . . . . . . . . . . . . . . . . . . . . . . . . . . . . . . . . . (12.7) (0.7) — —
Wendy’s/Arby’s . . . . . . . . . . . . . . . . . . . . . . . . . . . . . $(868.6) $(79.7) — —
67

Year End 2009
CarryingValue
InterestRateRisk
EquityPriceRisk
ForeignCurrency
Risk
Non-current equity investment . . . . . . . . . . . . . . . . . . . . . . . . $ 97.5 $— $(9.8) $(9.8)Interest rate swaps . . . . . . . . . . . . . . . . . . . . . . . . . . . . . . . . . . 1.6 (5.6) — —Long-term debt, excluding capitalized lease and sale-leaseback
obligations-variable rate . . . . . . . . . . . . . . . . . . . . . . . . . . . (251.5) (5.3) — —Long-term debt, excluding capitalized lease and sale-leaseback
obligations-fixed rate:Wendy’s/Arby’s Restaurants . . . . . . . . . . . . . . . . . . . . . . (1,035.3) (36.6) — —Corporate . . . . . . . . . . . . . . . . . . . . . . . . . . . . . . . . . . . . (21.0) (0.1) — —
Wendy’s/Arby’s . . . . . . . . . . . . . . . . . . . . . . . . . . . $(1,056.3) $(36.7) — —
The sensitivity analysis of financial instruments held at January 2, 2011 and January 3, 2010 assumes aninstantaneous one percentage point adverse change in market interest rates, and an instantaneous 10% adverse changein the foreign currency exchange rates versus the U.S. dollar, each from their levels at January 2, 2011 and January 3,2010, respectively, and with all other variables held constant. The equity price risk reflects the impact of a 10%decrease in the carrying value of our non-current equity investment in the tables above. The sensitivity analysis alsoassumes that the decreases in the equity markets and foreign exchange rates are other than temporary.
As of January 2, 2011, the Companies had amounts of both fixed-rate debt and variable interest rate debt. Onthe fixed-rate debt, the interest rate risk presented with respect to long-term debt, excluding capitalized lease and sale-leaseback obligations, primarily relates to the potential impact a decrease in interest rates of one percentage point hason the fair value of $868.6 million of fixed-rate debt for Wendy’s/Arby’s and $855.9 million of fixed-rate debt forWendy’s/Arby’s Restaurants and not on the Companies’ financial position or results of operations. However, asdiscussed above under “Interest Rate Risk,” the Companies have interest rate swap agreements on a portion of theirfixed-rate debt. The interest rate risk of fixed-rate debt presented in the tables above excludes the effect of the$225.0 million for which we designated interest rate swap agreements as fair value hedges for the terms of the swapagreements. As interest rates decrease, the fair market values of the interest rate swap agreements increase. The interestrate risk presented with respect to the interest rate swap agreements represents the potential impact the indicatedchange has on our results of operations. On the variable interest rate debt, the interest rate risk presented with respectto long-term debt, excluding capitalized lease and sale-leaseback obligations, represents the potential impact anincrease in interest rates of one percentage point has on our results of operations related to our $495.2 million ofvariable interest rate long-term debt outstanding as of January 2, 2011. The Companies’ variable-rate long-term debtoutstanding as of January 2, 2011 had a weighted average remaining maturity of approximately six years.
68

Item 8. Financial Statements and Supplementary Data.
INDEX TO CONSOLIDATED FINANCIAL STATEMENTS
Page
Glossary of Defined Terms . . . . . . . . . . . . . . . . . . . . . . . . . . . . . . . . . . . . . . . . . . . . . . . . . . . . . . . . . . . . . . . . . 70
Wendy’s/Arby’s Group, Inc. and subsidiariesReport of Independent Registered Public Accounting Firm . . . . . . . . . . . . . . . . . . . . . . . . . . . . . . . . . . . . . . . . 72Consolidated Balance Sheets as of January 2, 2011 and January 3, 2010 . . . . . . . . . . . . . . . . . . . . . . . . . . . . . . 73Consolidated Statements of Operations for the years ended January 2, 2011, January 3, 2010, and
December 28, 2008 . . . . . . . . . . . . . . . . . . . . . . . . . . . . . . . . . . . . . . . . . . . . . . . . . . . . . . . . . . . . . . . . . . . . 74Consolidated Statements of Stockholders’ Equity for the years ended January 2, 2011, January 3, 2010, and
December 28, 2008 . . . . . . . . . . . . . . . . . . . . . . . . . . . . . . . . . . . . . . . . . . . . . . . . . . . . . . . . . . . . . . . . . . . . 75Consolidated Statements of Cash Flows for the years ended January 2, 2011, January 3, 2010, and
December 28, 2008 . . . . . . . . . . . . . . . . . . . . . . . . . . . . . . . . . . . . . . . . . . . . . . . . . . . . . . . . . . . . . . . . . . . . 77
Wendy’s/Arby’s Restaurants, LLC and subsidiariesReport of Independent Registered Public Accounting Firm . . . . . . . . . . . . . . . . . . . . . . . . . . . . . . . . . . . . . . . . 79Consolidated Balance Sheets as of January 2, 2011 and January 3, 2010 . . . . . . . . . . . . . . . . . . . . . . . . . . . . . . 80Consolidated Statements of Operations for the years ended January 2, 2011, January 3, 2010, and
December 28, 2008 . . . . . . . . . . . . . . . . . . . . . . . . . . . . . . . . . . . . . . . . . . . . . . . . . . . . . . . . . . . . . . . . . . . . 81Consolidated Statements of Invested Equity for the years ended January 2, 2011, January 2, 2010, and
December 28, 2008 . . . . . . . . . . . . . . . . . . . . . . . . . . . . . . . . . . . . . . . . . . . . . . . . . . . . . . . . . . . . . . . . . . . . 82Consolidated Statements of Cash Flows for the years ended January 2, 2011, January 3, 2010, and
December 28, 2008 . . . . . . . . . . . . . . . . . . . . . . . . . . . . . . . . . . . . . . . . . . . . . . . . . . . . . . . . . . . . . . . . . . . . 83
Wendy’s/Arby’s Group, Inc. and subsidiaries and Wendy’s/Arby’s Restaurants, LLC and subsidiariesNotes to Consolidated Financial Statements . . . . . . . . . . . . . . . . . . . . . . . . . . . . . . . . . . . . . . . . . . . . . . . . . . . . 85
(1) Summary of Significant Accounting Policies . . . . . . . . . . . . . . . . . . . . . . . . . . . . . . . . . . . . . . . . . . . . 85(2) Acquisitions and Dispositions . . . . . . . . . . . . . . . . . . . . . . . . . . . . . . . . . . . . . . . . . . . . . . . . . . . . . . . 90(3) DFR Notes . . . . . . . . . . . . . . . . . . . . . . . . . . . . . . . . . . . . . . . . . . . . . . . . . . . . . . . . . . . . . . . . . . . . . 93(4) Income (Loss) Per Share . . . . . . . . . . . . . . . . . . . . . . . . . . . . . . . . . . . . . . . . . . . . . . . . . . . . . . . . . . . 94(5) Cash and Receivables . . . . . . . . . . . . . . . . . . . . . . . . . . . . . . . . . . . . . . . . . . . . . . . . . . . . . . . . . . . . . 95(6) Pledged Assets . . . . . . . . . . . . . . . . . . . . . . . . . . . . . . . . . . . . . . . . . . . . . . . . . . . . . . . . . . . . . . . . . . . 98(7) Investments . . . . . . . . . . . . . . . . . . . . . . . . . . . . . . . . . . . . . . . . . . . . . . . . . . . . . . . . . . . . . . . . . . . . 98(8) Properties . . . . . . . . . . . . . . . . . . . . . . . . . . . . . . . . . . . . . . . . . . . . . . . . . . . . . . . . . . . . . . . . . . . . . . 100(9) Goodwill and Other Intangible Assets . . . . . . . . . . . . . . . . . . . . . . . . . . . . . . . . . . . . . . . . . . . . . . . . 101(10) Accrued Expenses . . . . . . . . . . . . . . . . . . . . . . . . . . . . . . . . . . . . . . . . . . . . . . . . . . . . . . . . . . . . . . . . 103(11) Long-Term Debt . . . . . . . . . . . . . . . . . . . . . . . . . . . . . . . . . . . . . . . . . . . . . . . . . . . . . . . . . . . . . . . . 103(12) Fair Value of Financial Instruments . . . . . . . . . . . . . . . . . . . . . . . . . . . . . . . . . . . . . . . . . . . . . . . . . . 106(13) Income Taxes . . . . . . . . . . . . . . . . . . . . . . . . . . . . . . . . . . . . . . . . . . . . . . . . . . . . . . . . . . . . . . . . . . . 110(14) Stockholders’ Equity . . . . . . . . . . . . . . . . . . . . . . . . . . . . . . . . . . . . . . . . . . . . . . . . . . . . . . . . . . . . . . 116(15) Share-Based Compensation . . . . . . . . . . . . . . . . . . . . . . . . . . . . . . . . . . . . . . . . . . . . . . . . . . . . . . . . 116(16) Facilities Relocation and Restructuring . . . . . . . . . . . . . . . . . . . . . . . . . . . . . . . . . . . . . . . . . . . . . . . . 121(17) Impairment of Long-Lived Assets . . . . . . . . . . . . . . . . . . . . . . . . . . . . . . . . . . . . . . . . . . . . . . . . . . . . 122(18) Investment Income (Expense), Net . . . . . . . . . . . . . . . . . . . . . . . . . . . . . . . . . . . . . . . . . . . . . . . . . . . 123(19) Other Than Temporary Losses on Investments . . . . . . . . . . . . . . . . . . . . . . . . . . . . . . . . . . . . . . . . . 123(20) Discontinued Operations . . . . . . . . . . . . . . . . . . . . . . . . . . . . . . . . . . . . . . . . . . . . . . . . . . . . . . . . . . 123(21) Retirement Benefit Plans . . . . . . . . . . . . . . . . . . . . . . . . . . . . . . . . . . . . . . . . . . . . . . . . . . . . . . . . . . 124(22) Lease Commitments . . . . . . . . . . . . . . . . . . . . . . . . . . . . . . . . . . . . . . . . . . . . . . . . . . . . . . . . . . . . . . 125(23) Guarantees and Other Commitments and Contingencies . . . . . . . . . . . . . . . . . . . . . . . . . . . . . . . . . . 128(24) Transactions with Related Parties . . . . . . . . . . . . . . . . . . . . . . . . . . . . . . . . . . . . . . . . . . . . . . . . . . . . 130(25) Legal and Environmental Matters . . . . . . . . . . . . . . . . . . . . . . . . . . . . . . . . . . . . . . . . . . . . . . . . . . . . 135(26) Advertising Costs and Funds . . . . . . . . . . . . . . . . . . . . . . . . . . . . . . . . . . . . . . . . . . . . . . . . . . . . . . . 135(27) Business Segments . . . . . . . . . . . . . . . . . . . . . . . . . . . . . . . . . . . . . . . . . . . . . . . . . . . . . . . . . . . . . . . 136(28) Quarterly Financial Information (Unaudited) . . . . . . . . . . . . . . . . . . . . . . . . . . . . . . . . . . . . . . . . . . . 140(29) Guarantor/Non Guarantor . . . . . . . . . . . . . . . . . . . . . . . . . . . . . . . . . . . . . . . . . . . . . . . . . . . . . . . . . 141
69

Defined Term Footnote Where Defined
2010 Plan . . . . . . . . . . . . . . . . . . (15) Share-Based Compensation
401(k) Plan . . . . . . . . . . . . . . . . (21) Retirement Benefit Plans
Advertising Funds . . . . . . . . . . . (26) Advertising Costs and Funds
AFA . . . . . . . . . . . . . . . . . . . . . . (23) Guarantees and Other Commitments and Contingencies
Affiliate Lease Guarantees . . . . . . (23) Guarantees and Other Commitments and Contingencies
Aircraft Lease Agreement . . . . . . (24) Transactions with Related Parties
Arby’s . . . . . . . . . . . . . . . . . . . . . (1) Summary of Significant Accounting Policies
ARCOP . . . . . . . . . . . . . . . . . . . (24) Transactions with Related Parties
As Adjusted . . . . . . . . . . . . . . . . (2) Acquisitions and Dispositions
Bakery . . . . . . . . . . . . . . . . . . . . (21) Retirement Benefit Plans
Black-Scholes Model . . . . . . . . . (1) Summary of Significant Accounting Policies
CAP . . . . . . . . . . . . . . . . . . . . . . (13) Income Taxes
Class A Options . . . . . . . . . . . . . (15) Share-Based Compensation
Class B Options . . . . . . . . . . . . . (15) Share-Based Compensation
Closing Date . . . . . . . . . . . . . . . (1) Summary of Significant Accounting Policies
Companies . . . . . . . . . . . . . . . . . (1) Summary of Significant Accounting Policies
Company . . . . . . . . . . . . . . . . . . (1) Summary of Significant Accounting Policies
Contingent Rent . . . . . . . . . . . . (1) Summary of Significant Accounting Policies
Conversion . . . . . . . . . . . . . . . . . (2) Acquisitions and Dispositions
Convertible Notes . . . . . . . . . . . (4) Income (Loss) Per Share
Co-op Agreement . . . . . . . . . . . . (24) Transactions with Related Parties
Corporate . . . . . . . . . . . . . . . . . . (1) Summary of Significant Accounting Policies
Credit Agreement . . . . . . . . . . . . (11) Long-Term Debt
Credit Facility . . . . . . . . . . . . . . (11) Long-Term Debt
Deerfield . . . . . . . . . . . . . . . . . . (3) DFR Notes
Deerfield Sale . . . . . . . . . . . . . . . (3) DFR Notes
Determination Date . . . . . . . . . . (3) DFR Notes
DFR . . . . . . . . . . . . . . . . . . . . . . (1) Summary of Significant Accounting Policies
DFR Notes . . . . . . . . . . . . . . . . (1) Summary of Significant Accounting Policies
Early Withdrawal . . . . . . . . . . . . (24) Transactions with Related Parties
Eligible Arby’s Employees . . . . . (21) Retirement Benefit Plans
Equities Account . . . . . . . . . . . . (24) Transactions with Related Parties
Equities Sale . . . . . . . . . . . . . . . . (24) Transactions with Related Parties
Equity Plans . . . . . . . . . . . . . . . . (15) Share-Based Compensation
Former Executives . . . . . . . . . . . (24) Transactions with Related Parties
Foundation . . . . . . . . . . . . . . . . (24) Transactions with Related Parties
GAAP . . . . . . . . . . . . . . . . . . . . (1) Summary of Significant Accounting Policies
Grants . . . . . . . . . . . . . . . . . . . . (15) Share-Based Compensation
Guarantors . . . . . . . . . . . . . . . . . (11) Long-Term Debt
Indenture . . . . . . . . . . . . . . . . . . (11) Long-Term Debt
IRS . . . . . . . . . . . . . . . . . . . . . . . (13) Income Taxes
Jurlique . . . . . . . . . . . . . . . . . . . (7) Investments
70

Defined Term Footnote Where Defined
Lease Guarantees . . . . . . . . . . . . (23) Guarantees and Other Commitments and Contingencies
Legacy Assets . . . . . . . . . . . . . . . (24) Transactions with Related Parties
Liquidation ServicesAgreement . . . . . . . . . . . . . . . (24) Transactions with Related Parties
LIBOR . . . . . . . . . . . . . . . . . . . . (12) Fair Value of Financial Instruments
Management Company . . . . . . . (22) Lease Commitments
New CBA . . . . . . . . . . . . . . . . . (21) Retirement Benefit Plans
New Services Agreement . . . . . . (24) Transactions with Related Parties
Package Options . . . . . . . . . . . . (15) Share-Based Compensation
Parent . . . . . . . . . . . . . . . . . . . . (29) Guarantor/Non-Guarantor
Preferred Stock . . . . . . . . . . . . . . (3) DFR Notes
Prior Plans . . . . . . . . . . . . . . . . . (21) Retirement Benefit Plans
QSCC . . . . . . . . . . . . . . . . . . . . (24) Transactions with Related Parties
Rent Holiday . . . . . . . . . . . . . . . (1) Summary of Significant Accounting Policies
RSAs . . . . . . . . . . . . . . . . . . . . . (15) Share-Based Compensations
RSUs . . . . . . . . . . . . . . . . . . . . . (15) Share-Based Compensations
RTM . . . . . . . . . . . . . . . . . . . . . (23) Guarantees and Other Commitments and Contingencies
RTM Acquisition . . . . . . . . . . . . (23) Guarantees and Other Commitments and Contingencies
Senior Notes . . . . . . . . . . . . . . . (11) Long-Term Debt
SERP . . . . . . . . . . . . . . . . . . . . . (21) Retirement Benefit Plans
Services Agreement . . . . . . . . . . . (24) Transactions with Related Parties
SSG . . . . . . . . . . . . . . . . . . . . . . (24) Transactions with Related Parties
Straight-Line Rent . . . . . . . . . . . (1) Summary of Significant Accounting Policies
Subleases . . . . . . . . . . . . . . . . . . (24) Transactions with Related Parties
Syrup . . . . . . . . . . . . . . . . . . . . . (23) Guarantees and Other Commitments and Contingencies
Target Amount . . . . . . . . . . . . . (24) Transactions with Related Parties
TASCO . . . . . . . . . . . . . . . . . . . (24) Transactions with Related Parties
Term Loan . . . . . . . . . . . . . . . . . (11) Long-Term Debt
Term Loan Swap Agreements . . . (12) Fair Value of Financial Instruments
THI . . . . . . . . . . . . . . . . . . . . . . (1) Summary of Significant Accounting Policies
TimWen . . . . . . . . . . . . . . . . . . (1) Summary of Significant Accounting Policies
Triarc . . . . . . . . . . . . . . . . . . . . . (1) Summary of Significant Accounting Policies
Trustee . . . . . . . . . . . . . . . . . . . . (11) Long-Term Debt
Uncertain Tax Positions . . . . . . . (1) Summary of Significant Accounting Policies
Union Pension Fund . . . . . . . . . (21) Retirement Benefit Plans
Wendy’s . . . . . . . . . . . . . . . . . . . (1) Summary of Significant Accounting Policies
Wendy’s/Arby’s . . . . . . . . . . . . . (1) Summary of Significant Accounting Policies
Wendy’s/Arby’s Restaurants . . . . (1) Summary of Significant Accounting Policies
Wendy’s Merger . . . . . . . . . . . . . (1) Summary of Significant Accounting Policies
Wendy’s Plans . . . . . . . . . . . . . . (15) Share-Based Compensation
Wendy’s Pension Plans . . . . . . . . (21) Retirement Benefit Plans
Withdrawal Agreement . . . . . . . (24) Transactions with Related Parties
Withdrawal Fee . . . . . . . . . . . . . (24) Transactions with Related Parties
71

REPORT OF INDEPENDENT REGISTERED PUBLIC ACCOUNTING FIRM
To the Stockholders and Board of Directors ofWendy’s/Arby’s Group, Inc.Atlanta, Georgia
We have audited the accompanying consolidated balance sheets of Wendy’s/Arby’s Group, Inc. and subsidiaries (the“Company”) as of January 2, 2011 and January 3, 2010, and the related consolidated statements of operations,stockholders’ equity, and cash flows for each of the three years in the period ended January 2, 2011. Our audits alsoincluded the financial statement schedule listed in the Index at Item 15. These financial statements and financialstatement schedule are the responsibility of the Company’s management. Our responsibility is to express an opinionon these financial statements and financial statement schedule based on our audits.
We conducted our audits in accordance with the standards of the Public Company Accounting Oversight Board(United States). Those standards require that we plan and perform the audit to obtain reasonable assurance aboutwhether the financial statements are free of material misstatement. An audit includes examining, on a test basis,evidence supporting the amounts and disclosures in the financial statements. An audit also includes assessing theaccounting principles used and significant estimates made by management, as well as evaluating the overall financialstatement presentation. We believe that our audits provide a reasonable basis for our opinion.
In our opinion, such consolidated financial statements present fairly, in all material respects, the financial position ofthe Company as of January 2, 2011 and January 3, 2010, and the results of its operations and its cash flows for eachof the three years in the period ended January 2, 2011, in conformity with accounting principles generally accepted inthe United States of America. Also, in our opinion, such financial statement schedule, when considered in relation tothe basic consolidated financial statements taken as a whole, presents fairly, in all material respects, the information setforth therein.
We have also audited, in accordance with the standards of the Public Company Accounting Oversight Board (UnitedStates), the Company’s internal control over financial reporting as of January 2, 2011, based on the criteriaestablished in Internal Control—Integrated Framework issued by the Committee of Sponsoring Organizations of theTreadway Commission, and our report dated March 2, 2011 expressed an unqualified opinion on the Company’sinternal control over financial reporting.
/s/ Deloitte & Touche LLP
Atlanta, GeorgiaMarch 2, 2011
72
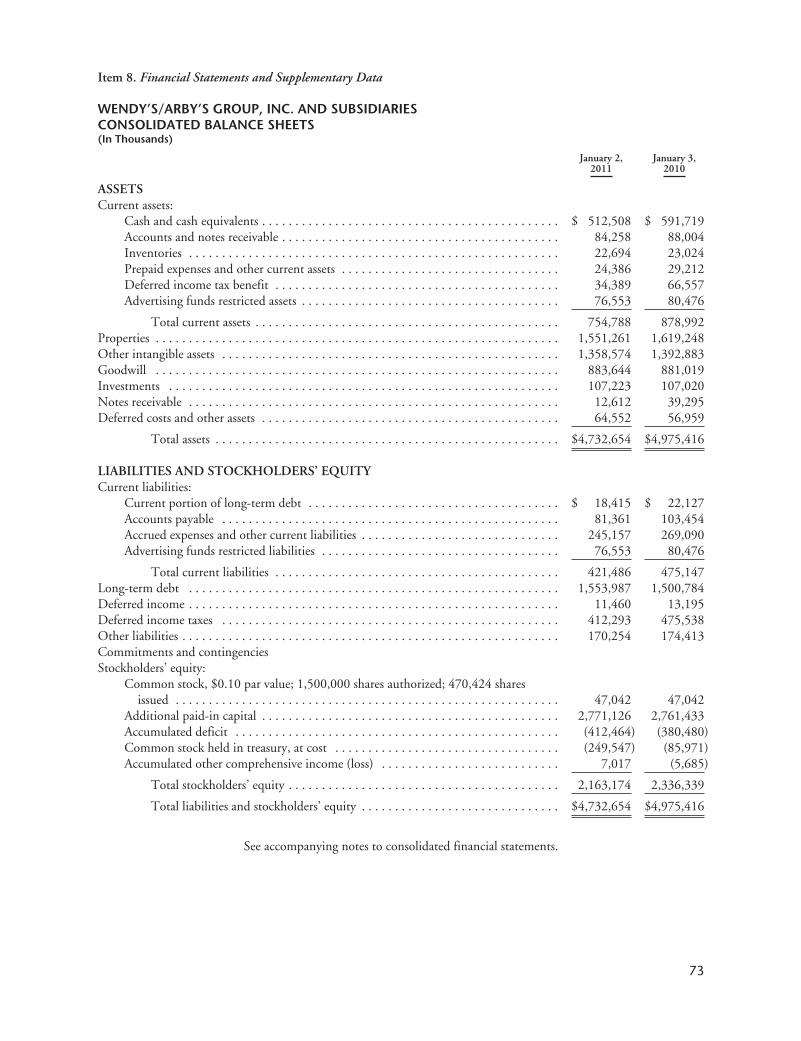
Item 8. Financial Statements and Supplementary Data
WENDY’S/ARBY’S GROUP, INC. AND SUBSIDIARIESCONSOLIDATED BALANCE SHEETS(In Thousands)
January 2,2011
January 3,2010
ASSETSCurrent assets:
Cash and cash equivalents . . . . . . . . . . . . . . . . . . . . . . . . . . . . . . . . . . . . . . . . . . . . . $ 512,508 $ 591,719Accounts and notes receivable . . . . . . . . . . . . . . . . . . . . . . . . . . . . . . . . . . . . . . . . . . 84,258 88,004Inventories . . . . . . . . . . . . . . . . . . . . . . . . . . . . . . . . . . . . . . . . . . . . . . . . . . . . . . . . 22,694 23,024Prepaid expenses and other current assets . . . . . . . . . . . . . . . . . . . . . . . . . . . . . . . . . 24,386 29,212Deferred income tax benefit . . . . . . . . . . . . . . . . . . . . . . . . . . . . . . . . . . . . . . . . . . . 34,389 66,557Advertising funds restricted assets . . . . . . . . . . . . . . . . . . . . . . . . . . . . . . . . . . . . . . . 76,553 80,476
Total current assets . . . . . . . . . . . . . . . . . . . . . . . . . . . . . . . . . . . . . . . . . . . . . . 754,788 878,992Properties . . . . . . . . . . . . . . . . . . . . . . . . . . . . . . . . . . . . . . . . . . . . . . . . . . . . . . . . . . . . . 1,551,261 1,619,248Other intangible assets . . . . . . . . . . . . . . . . . . . . . . . . . . . . . . . . . . . . . . . . . . . . . . . . . . . 1,358,574 1,392,883Goodwill . . . . . . . . . . . . . . . . . . . . . . . . . . . . . . . . . . . . . . . . . . . . . . . . . . . . . . . . . . . . . 883,644 881,019Investments . . . . . . . . . . . . . . . . . . . . . . . . . . . . . . . . . . . . . . . . . . . . . . . . . . . . . . . . . . . 107,223 107,020Notes receivable . . . . . . . . . . . . . . . . . . . . . . . . . . . . . . . . . . . . . . . . . . . . . . . . . . . . . . . . 12,612 39,295Deferred costs and other assets . . . . . . . . . . . . . . . . . . . . . . . . . . . . . . . . . . . . . . . . . . . . . 64,552 56,959
Total assets . . . . . . . . . . . . . . . . . . . . . . . . . . . . . . . . . . . . . . . . . . . . . . . . . . . . $4,732,654 $4,975,416
LIABILITIES AND STOCKHOLDERS’ EQUITYCurrent liabilities:
Current portion of long-term debt . . . . . . . . . . . . . . . . . . . . . . . . . . . . . . . . . . . . . . $ 18,415 $ 22,127Accounts payable . . . . . . . . . . . . . . . . . . . . . . . . . . . . . . . . . . . . . . . . . . . . . . . . . . . 81,361 103,454Accrued expenses and other current liabilities . . . . . . . . . . . . . . . . . . . . . . . . . . . . . . 245,157 269,090Advertising funds restricted liabilities . . . . . . . . . . . . . . . . . . . . . . . . . . . . . . . . . . . . 76,553 80,476
Total current liabilities . . . . . . . . . . . . . . . . . . . . . . . . . . . . . . . . . . . . . . . . . . . 421,486 475,147Long-term debt . . . . . . . . . . . . . . . . . . . . . . . . . . . . . . . . . . . . . . . . . . . . . . . . . . . . . . . . 1,553,987 1,500,784Deferred income . . . . . . . . . . . . . . . . . . . . . . . . . . . . . . . . . . . . . . . . . . . . . . . . . . . . . . . . 11,460 13,195Deferred income taxes . . . . . . . . . . . . . . . . . . . . . . . . . . . . . . . . . . . . . . . . . . . . . . . . . . . 412,293 475,538Other liabilities . . . . . . . . . . . . . . . . . . . . . . . . . . . . . . . . . . . . . . . . . . . . . . . . . . . . . . . . . 170,254 174,413Commitments and contingenciesStockholders’ equity:
Common stock, $0.10 par value; 1,500,000 shares authorized; 470,424 sharesissued . . . . . . . . . . . . . . . . . . . . . . . . . . . . . . . . . . . . . . . . . . . . . . . . . . . . . . . . . . 47,042 47,042
Additional paid-in capital . . . . . . . . . . . . . . . . . . . . . . . . . . . . . . . . . . . . . . . . . . . . . 2,771,126 2,761,433Accumulated deficit . . . . . . . . . . . . . . . . . . . . . . . . . . . . . . . . . . . . . . . . . . . . . . . . . (412,464) (380,480)Common stock held in treasury, at cost . . . . . . . . . . . . . . . . . . . . . . . . . . . . . . . . . . (249,547) (85,971)Accumulated other comprehensive income (loss) . . . . . . . . . . . . . . . . . . . . . . . . . . . 7,017 (5,685)
Total stockholders’ equity . . . . . . . . . . . . . . . . . . . . . . . . . . . . . . . . . . . . . . . . . 2,163,174 2,336,339
Total liabilities and stockholders’ equity . . . . . . . . . . . . . . . . . . . . . . . . . . . . . . $4,732,654 $4,975,416
See accompanying notes to consolidated financial statements.
73
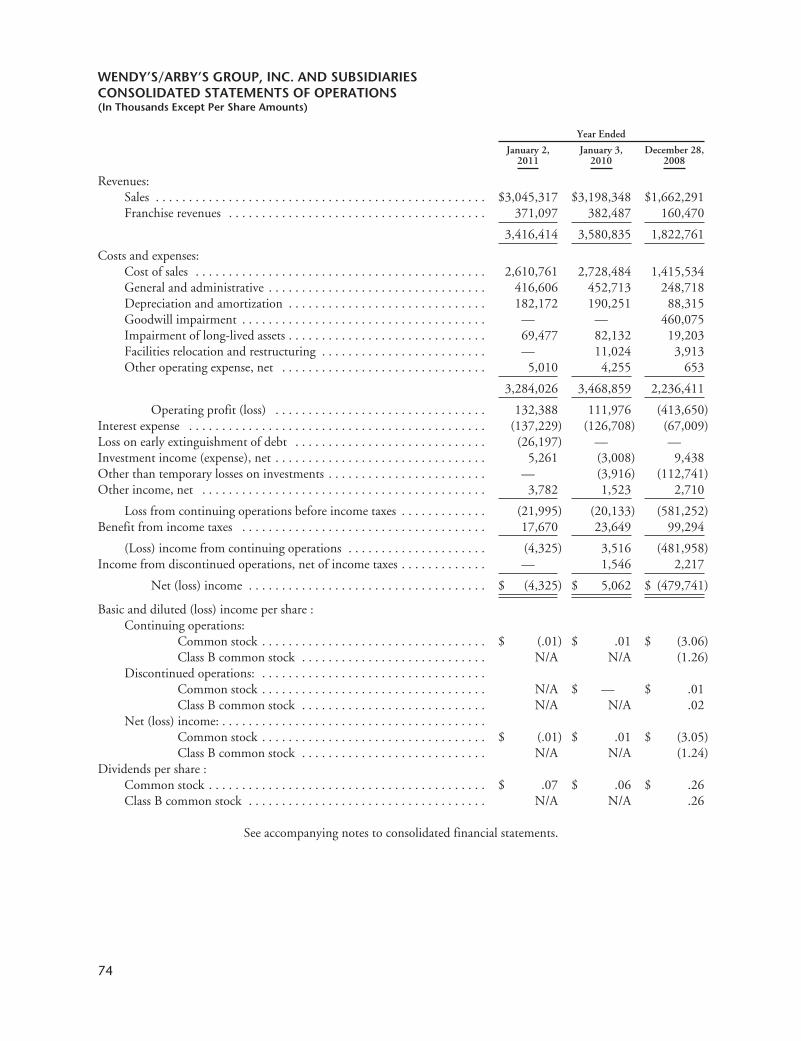
WENDY’S/ARBY’S GROUP, INC. AND SUBSIDIARIESCONSOLIDATED STATEMENTS OF OPERATIONS(In Thousands Except Per Share Amounts)
Year Ended
January 2,2011
January 3,2010
December 28,2008
Revenues:Sales . . . . . . . . . . . . . . . . . . . . . . . . . . . . . . . . . . . . . . . . . . . . . . . . . . $3,045,317 $3,198,348 $1,662,291Franchise revenues . . . . . . . . . . . . . . . . . . . . . . . . . . . . . . . . . . . . . . . 371,097 382,487 160,470
3,416,414 3,580,835 1,822,761
Costs and expenses:Cost of sales . . . . . . . . . . . . . . . . . . . . . . . . . . . . . . . . . . . . . . . . . . . . 2,610,761 2,728,484 1,415,534General and administrative . . . . . . . . . . . . . . . . . . . . . . . . . . . . . . . . . 416,606 452,713 248,718Depreciation and amortization . . . . . . . . . . . . . . . . . . . . . . . . . . . . . . 182,172 190,251 88,315Goodwill impairment . . . . . . . . . . . . . . . . . . . . . . . . . . . . . . . . . . . . . — — 460,075Impairment of long-lived assets . . . . . . . . . . . . . . . . . . . . . . . . . . . . . . 69,477 82,132 19,203Facilities relocation and restructuring . . . . . . . . . . . . . . . . . . . . . . . . . — 11,024 3,913Other operating expense, net . . . . . . . . . . . . . . . . . . . . . . . . . . . . . . . 5,010 4,255 653
3,284,026 3,468,859 2,236,411
Operating profit (loss) . . . . . . . . . . . . . . . . . . . . . . . . . . . . . . . . 132,388 111,976 (413,650)Interest expense . . . . . . . . . . . . . . . . . . . . . . . . . . . . . . . . . . . . . . . . . . . . . (137,229) (126,708) (67,009)Loss on early extinguishment of debt . . . . . . . . . . . . . . . . . . . . . . . . . . . . . (26,197) — —Investment income (expense), net . . . . . . . . . . . . . . . . . . . . . . . . . . . . . . . . 5,261 (3,008) 9,438Other than temporary losses on investments . . . . . . . . . . . . . . . . . . . . . . . . — (3,916) (112,741)Other income, net . . . . . . . . . . . . . . . . . . . . . . . . . . . . . . . . . . . . . . . . . . . 3,782 1,523 2,710
Loss from continuing operations before income taxes . . . . . . . . . . . . . (21,995) (20,133) (581,252)Benefit from income taxes . . . . . . . . . . . . . . . . . . . . . . . . . . . . . . . . . . . . . 17,670 23,649 99,294
(Loss) income from continuing operations . . . . . . . . . . . . . . . . . . . . . (4,325) 3,516 (481,958)Income from discontinued operations, net of income taxes . . . . . . . . . . . . . — 1,546 2,217
Net (loss) income . . . . . . . . . . . . . . . . . . . . . . . . . . . . . . . . . . . . $ (4,325) $ 5,062 $ (479,741)
Basic and diluted (loss) income per share :Continuing operations:
Common stock . . . . . . . . . . . . . . . . . . . . . . . . . . . . . . . . . . $ (.01) $ .01 $ (3.06)Class B common stock . . . . . . . . . . . . . . . . . . . . . . . . . . . . N/A N/A (1.26)
Discontinued operations: . . . . . . . . . . . . . . . . . . . . . . . . . . . . . . . . . .Common stock . . . . . . . . . . . . . . . . . . . . . . . . . . . . . . . . . . N/A $ — $ .01Class B common stock . . . . . . . . . . . . . . . . . . . . . . . . . . . . N/A N/A .02
Net (loss) income: . . . . . . . . . . . . . . . . . . . . . . . . . . . . . . . . . . . . . . . .Common stock . . . . . . . . . . . . . . . . . . . . . . . . . . . . . . . . . . $ (.01) $ .01 $ (3.05)Class B common stock . . . . . . . . . . . . . . . . . . . . . . . . . . . . N/A N/A (1.24)
Dividends per share :Common stock . . . . . . . . . . . . . . . . . . . . . . . . . . . . . . . . . . . . . . . . . . $ .07 $ .06 $ .26Class B common stock . . . . . . . . . . . . . . . . . . . . . . . . . . . . . . . . . . . . N/A N/A .26
See accompanying notes to consolidated financial statements.
74

WENDY’S/ARBY’S GROUP, INC. AND SUBSIDIARIESCONSOLIDATED STATEMENTS OF STOCKHOLDERS’ EQUITY(In Thousands)
Accumulated Other ComprehensiveIncome (Loss)
CommonStock
AdditionalPaid-inCapital
AccumulatedDeficit
CommonStock Heldin Treasury
UnrealizedGain on
Available-for-Sale
Securities
ForeignCurrency
TranslationAdjustment
UnrecognizedPension Loss Total
Balance at January 3, 2010 . . . . . . . . . . . $47,042 $2,761,433 $(380,480) $ (85,971) $ 59 $ (4,696) $(1,048) $2,336,339Comprehensive income:
Net loss . . . . . . . . . . . . . . . . . . . — — (4,325) — — — — (4,325)Change in unrealized gain on
available-for-sale securities . . . — — — — (59) — — (59)Change in unrecognized pension
loss . . . . . . . . . . . . . . . . . . . . . — — — — — — 95 95Foreign currency translation
adjustment . . . . . . . . . . . . . . . — — — — — 12,666 — 12,666
Comprehensive income . . . . . — — — — — — — 8,377
Cash dividends . . . . . . . . . . . . . . . . — — (27,621) — — — — (27,621)Accrued dividends on nonvested
restricted stock . . . . . . . . . . . . . . — — (38) — — — — (38)Repurchases of common stock . . . . — — — (167,743) — — — (167,743)Share-based compensation
expense . . . . . . . . . . . . . . . . . . . — 13,704 — — — — — 13,704Common stock issued upon
exercises of stock options . . . . . . — (562) — 1,840 — — — 1,278Restricted common stock issued . . . — (2,765) — 2,765 — — — —Other . . . . . . . . . . . . . . . . . . . . . . . — (684) — (438) — — — (1,122)
Balance at January 2, 2011 . . . . . . . . . . . $47,042 $2,771,126 $(412,464) $(249,547) $— $ 7,970 $ (953) $2,163,174
Accumulated Other ComprehensiveIncome (Loss)
CommonStock
AdditionalPaid-inCapital
AccumulatedDeficit
CommonStockHeld
inTreasury
UnrealizedGain on
Available-for-Sale
Securities
ForeignCurrency
TranslationAdjustment
UnrecognizedPension Loss Total
Balance at December 28, 2008 . . . . . . . . $47,042 $2,753,141 $(357,541) $(15,944) $108 $(42,313) $(1,048) $2,383,445Comprehensive income:
Net income . . . . . . . . . . . . . . . . . — — 5,062 — — — — 5,062Change in unrealized gain on
available-for-sale securities . . . . — — — — (49) — — (49)Foreign currency translation
adjustment . . . . . . . . . . . . . . . . — — — — — 37,617 — 37,617
Comprehensive income . . . . . . — — — — — — — 42,630
Cash dividends . . . . . . . . . . . . . . . . . — — (27,976) — — — — (27,976)Accrued dividends on nonvested
restricted stock . . . . . . . . . . . . . . . — — (25) — — — — (25)Repurchases of common stock . . . . . — — — (78,720) — — — (78,720)Share-based compensation
expense . . . . . . . . . . . . . . . . . . . . — 15,294 — — — — — 15,294Common stock issued upon exercises
of stock options . . . . . . . . . . . . . . — (4,720) — 6,686 — — — 1,966Restricted common stock issued . . . . — (1,777) — 1,777 — — — —Non-controlling interests, primarily
distributions . . . . . . . . . . . . . . . . . — (129) — — — — — (129)Other . . . . . . . . . . . . . . . . . . . . . . . . — (376) — 230 — — — (146)
Balance at January 3, 2010 . . . . . . . . . . . . $47,042 $2,761,433 $(380,480) $(85,971) $ 59 $ (4,696) $(1,048) $2,336,339
See accompanying notes to consolidated financial statements.
75

WENDY’S/ARBY’S GROUP, INC. AND SUBSIDIARIESCONSOLIDATED STATEMENTS OF STOCKHOLDERS’ EQUITY—CONTINUED(In Thousands)
Accumulated Other Comprehensive Income(Loss)
Class ACommon
Stock
Class BCommon
Stock
AdditionalPaid-inCapital
RetainedEarnings/
(AccumulatedDeficit)
CommonStock
Held inTreasury
Unrealized(Loss)
Gain onAvailable-for-Sale
Securities
UnrealizedLoss on
Cash FlowHedges
ForeignCurrency
TranslationAdjustment
UnrecognizedPension
Loss Total
Balance at December 30, 2007 . . . . . $ 2,955 $ 6,402 $ 292,080 $ 167,267 $(16,774) $(2,104) $(155) $ 689 $ (528) $ 449,832Comprehensive loss:
Net loss . . . . . . . . . . . . . . . . . — — — (479,741) — — — — — (479,741)Change in unrealized gain on
available-for-salesecurities . . . . . . . . . . . . . . — — — — — 2,212 — — — 2,212
Change in unrealized loss oncash flow hedges . . . . . . . . — — — — — — 155 — — 155
Foreign currency translationadjustment . . . . . . . . . . . . — — — — — — — (43,002) — (43,002)
Unrecognized pension loss . . — — — — — — — — (520) (520)
Comprehensive loss . . . . . (520,896)
Cash dividends . . . . . . . . . . . . . — — — (30,538) — — — — — (30,538)Accrued dividends on nonvested
restricted stock . . . . . . . . . . . — — — (65) — — — — — (65)Distribution of Deerfield
Capital Corp. commonstock . . . . . . . . . . . . . . . . . . . — — — (14,464) — — — — — (14,464)
Share-based compensationexpense . . . . . . . . . . . . . . . . . — 2 9,127 — — — — — — 9,129
Wendy’s International Inc.merger-related transactions:
Conversion of Class B commonstock to Class A commonstock . . . . . . . . . . . . . . . . . . . 6,410 (6,410) — — — — — — — —
Value of Wendy’s stock optionsconverted into Wendy’s/Arby’s Group, Inc.options . . . . . . . . . . . . . . . . . — — 18,495 — — — — — — 18,495
Common stock issuance relatedto merger of TriarcCompanies, Inc. andWendy’s InternationalInc. . . . . . . . . . . . . . . . . . . . . 37,678 — 2,438,519 — — — — — — 2,476,197
Common stock issued uponexercises of stock options . . . — — (45) — 60 — — — — 15
Restricted common stockissued . . . . . . . . . . . . . . . . . . — 1 (3,654) — 3,627 — — — — (26)
Common stock withheld aspayment for withholdingtaxes on capital stocktransactions . . . . . . . . . . . . . . — — — — (2,989) — — — — (2,989)
Non-controlling interests,primarily distributions . . . . . — — (804) — — — — — — (804)
Other . . . . . . . . . . . . . . . . . . . . (1) 5 (577) — 132 — — — — (441)
Balance at December 28, 2008 . . . . . $47,042 $ — $2,753,141 $(357,541) $(15,944) $ 108 $ — $(42,313) $(1,048) $2,383,445
See accompanying notes to consolidated financial statements.
76

WENDY’S/ARBY’S GROUP, INC. AND SUBSIDIARIESCONSOLIDATED STATEMENTS OF CASH FLOWS(In Thousands)
Year Ended
January 2,2011
January 3,2010
December 28,2008
Cash flows from continuing operating activities:Net (loss) income . . . . . . . . . . . . . . . . . . . . . . . . . . . . . . . . . . . . . . . . . . . . . . . . $ (4,325) $ 5,062 $(479,741)Adjustments to reconcile net (loss) income to net cash provided by continuing
operating activities:Depreciation and amortization . . . . . . . . . . . . . . . . . . . . . . . . . . . . . . . . . . 182,172 190,251 88,315Impairment of long-lived assets . . . . . . . . . . . . . . . . . . . . . . . . . . . . . . . . . 69,477 82,132 19,203Accretion of long-term debt . . . . . . . . . . . . . . . . . . . . . . . . . . . . . . . . . . . . 15,016 10,400 2,452Distributions received from joint venture . . . . . . . . . . . . . . . . . . . . . . . . . . 13,980 14,583 2,864Share-based compensation provision . . . . . . . . . . . . . . . . . . . . . . . . . . . . . 13,704 15,294 9,129Write-off and amortization of deferred financing costs . . . . . . . . . . . . . . . . 11,779 15,820 8,885Provision for doubtful accounts . . . . . . . . . . . . . . . . . . . . . . . . . . . . . . . . . 9,694 8,169 670Non-cash rent expense . . . . . . . . . . . . . . . . . . . . . . . . . . . . . . . . . . . . . . . . 9,334 12,618 3,103Net recognition of deferred vendor incentive . . . . . . . . . . . . . . . . . . . . . . . (587) (791) (6,459)Operating investment adjustments, net (see below) . . . . . . . . . . . . . . . . . . (5,201) 2,484 105,357Equity in earnings in joint venture . . . . . . . . . . . . . . . . . . . . . . . . . . . . . . . (9,459) (8,499) (1,974)Deferred income tax benefit . . . . . . . . . . . . . . . . . . . . . . . . . . . . . . . . . . . . (29,779) (40,127) (105,276)Income from discontinued operations . . . . . . . . . . . . . . . . . . . . . . . . . . . . — (1,546) (2,217)Goodwill impairment . . . . . . . . . . . . . . . . . . . . . . . . . . . . . . . . . . . . . . . . — — 460,075Other, net . . . . . . . . . . . . . . . . . . . . . . . . . . . . . . . . . . . . . . . . . . . . . . . . . (1,430) (4,317) (3,886)Changes in operating assets and liabilities:
Accounts and notes receivable . . . . . . . . . . . . . . . . . . . . . . . . . . . . . . (4,730) (6,074) (4,187)Inventories . . . . . . . . . . . . . . . . . . . . . . . . . . . . . . . . . . . . . . . . . . . . . 394 1,879 (140)Prepaid expenses and other current assets . . . . . . . . . . . . . . . . . . . . . . 1,514 3,987 8,808Accounts payable . . . . . . . . . . . . . . . . . . . . . . . . . . . . . . . . . . . . . . . . (15,795) (53,474) 6,135Accrued expenses and other current liabilities . . . . . . . . . . . . . . . . . . (29,508) 50,947 (37,511)
Net cash provided by continuing operating activities . . . . . . . . . 226,250 298,798 73,605
Cash flows from continuing investing activities:Capital expenditures . . . . . . . . . . . . . . . . . . . . . . . . . . . . . . . . . . . . . . . . . . . . . (147,969) (101,914) (106,989)Investment activities, net (see below) . . . . . . . . . . . . . . . . . . . . . . . . . . . . . . . . . 32,158 38,141 51,066Proceeds from dispositions . . . . . . . . . . . . . . . . . . . . . . . . . . . . . . . . . . . . . . . . . 5,660 10,882 1,322Cost of acquisitions, less cash acquired . . . . . . . . . . . . . . . . . . . . . . . . . . . . . . . . (3,123) (2,357) (9,622)Increase in cash from merger with Wendy’s . . . . . . . . . . . . . . . . . . . . . . . . . . . . — — 199,785Cost of merger with Wendy’s . . . . . . . . . . . . . . . . . . . . . . . . . . . . . . . . . . . . . . . — (608) (18,403)Other, net . . . . . . . . . . . . . . . . . . . . . . . . . . . . . . . . . . . . . . . . . . . . . . . . . . . . . 352 237 (228)
Net cash (used in) provided by continuing investingactivities . . . . . . . . . . . . . . . . . . . . . . . . . . . . . . . . . . . . . . . . . (112,922) (55,619) 116,931
Cash flows from continuing financing activities:Proceeds from long-term debt . . . . . . . . . . . . . . . . . . . . . . . . . . . . . . . . . . . . . . 497,661 607,507 37,753Repayments of notes payable and long-term debt . . . . . . . . . . . . . . . . . . . . . . . (474,791) (210,371) (177,883)Repurchases of common stock . . . . . . . . . . . . . . . . . . . . . . . . . . . . . . . . . . . . . . (173,537) (72,927) —Dividends paid . . . . . . . . . . . . . . . . . . . . . . . . . . . . . . . . . . . . . . . . . . . . . . . . . . (27,621) (27,976) (30,538)Deferred financing costs . . . . . . . . . . . . . . . . . . . . . . . . . . . . . . . . . . . . . . . . . . . (16,353) (38,399) —Distributions to non-controlling interests . . . . . . . . . . . . . . . . . . . . . . . . . . . . . — (156) (1,144)Other, net . . . . . . . . . . . . . . . . . . . . . . . . . . . . . . . . . . . . . . . . . . . . . . . . . . . . . 491 1,715 (1,113)
Net cash (used in) provided by continuing financingactivities . . . . . . . . . . . . . . . . . . . . . . . . . . . . . . . . . . . . . . . . . (194,150) 259,393 (172,925)
Net cash (used in) provided by continuing operations before effect of exchange ratechanges on cash . . . . . . . . . . . . . . . . . . . . . . . . . . . . . . . . . . . . . . . . . . . . . . . . . . . (80,822) 502,572 17,611
Effect of exchange rate changes on cash . . . . . . . . . . . . . . . . . . . . . . . . . . . . . . . . . . . 1,611 2,725 (4,123)
Net cash (used in) provided by continuing operations . . . . . . . . . . . . . . . . . . . . . . . . (79,211) 505,297 13,488Net cash used in operating activities of discontinued operations . . . . . . . . . . . . . . . . — (3,668) (1,514)
Net (decrease) increase in cash and cash equivalents . . . . . . . . . . . . . . . . . . . . . . . . . . (79,211) 501,629 11,974Cash and cash equivalents at beginning of year . . . . . . . . . . . . . . . . . . . . . . . . . . . . . 591,719 90,090 78,116
Cash and cash equivalents at end of year . . . . . . . . . . . . . . . . . . . . . . . . . . . . . . . . . . $ 512,508 $ 591,719 $ 90,090
77

WENDY’S/ARBY’S GROUP, INC. AND SUBSIDIARIESCONSOLIDATED STATEMENTS OF CASH FLOWS—CONTINUED(In Thousands)
Year Ended
January 2,2011
January 3,2010
December 28,2008
Detail of cash flows related to investments:Operating investment adjustments, net:
Income on collection of DFR Notes . . . . . . . . . . . . . . . . . . . . . . . . . . . . . $ (4,909) $ — $ —Other than temporary losses on investments . . . . . . . . . . . . . . . . . . . . . . . — 3,916 112,741
Other net recognized gains . . . . . . . . . . . . . . . . . . . . . . . . . . . . . . . . . . . . . . . . . . . . . (292) (1,432) (7,384)
$ (5,201) $ 2,484 $ 105,357
Investment activities, net:Proceeds from sales of investments . . . . . . . . . . . . . . . . . . . . . . . . . . . . . . . $ 1,810 $ 31,289 $ 136,748Decrease in restricted cash held for investment . . . . . . . . . . . . . . . . . . . . . — 26,681 17,724Proceeds from repayment of DFR Notes . . . . . . . . . . . . . . . . . . . . . . . . . . 30,752 — —Cost of investments purchased, and payments to cover short positions in
securities . . . . . . . . . . . . . . . . . . . . . . . . . . . . . . . . . . . . . . . . . . . . . . . . (404) (19,829) (103,406)
$ 32,158 $ 38,141 $ 51,066
Supplemental disclosures of cash flow information:Cash paid during the year in continuing operations for:
Interest . . . . . . . . . . . . . . . . . . . . . . . . . . . . . . . . . . . . . . . . . . . . . . . . . . . . $ 127,753 $ 86,439 $ 61,192
Income taxes, net of refunds . . . . . . . . . . . . . . . . . . . . . . . . . . . . . . . . . . . $ 14,262 $ 14,952 $ 5,094
Supplemental schedule of noncash investing and financing activities:Total capital expenditures . . . . . . . . . . . . . . . . . . . . . . . . . . . . . . . . . . . . . $ 153,744 $ 108,284 $ 115,419Cash capital expenditures . . . . . . . . . . . . . . . . . . . . . . . . . . . . . . . . . . . . . . (147,969) (101,914) (106,989)
Non-cash capitalized lease and certain sales-leaseback obligations . . . . . . . $ 5,775 $ 6,370 $ 8,430
Non-cash transactions:Value of equity consideration issued in merger with Wendy’s
Common stock . . . . . . . . . . . . . . . . . . . . . . . . . . . . . . . . . . . . . . . . . N/A N/A $2,476,197Stock options . . . . . . . . . . . . . . . . . . . . . . . . . . . . . . . . . . . . . . . . . . . N/A N/A $ 18,296
Assumption of debt . . . . . . . . . . . . . . . . . . . . . . . . . . . . . . . . . . . . . . . . . . N/A N/A $ 553,438
See accompanying notes to consolidated financial statements.
78
REPORT OF INDEPENDENT REGISTERED PUBLIC ACCOUNTING FIRM
To the Member ofWendy’s/Arby’s Restaurants, LLCAtlanta, Georgia
We have audited the accompanying consolidated balance sheets of Wendy’s/Arby’s Restaurants, LLC and subsidiaries(a wholly owned subsidiary of Wendy’s/Arby’s Group, Inc.) (the “Company”) as of January 2, 2011 and January 3,2010, and the related consolidated statements of operations, invested equity, and cash flows for each of the three yearsin the period ended January 2, 2011. These financial statements are the responsibility of the Company’smanagement. Our responsibility is to express an opinion on these financial statements based on our audits.
We conducted our audits in accordance with the standards of the Public Company Accounting Oversight Board(United States). Those standards require that we plan and perform the audit to obtain reasonable assurance aboutwhether the financial statements are free of material misstatement. The Company is not required to have, nor were weengaged to perform, an audit of its internal control over financial reporting. Our audits included consideration ofinternal control over financial reporting as a basis for designing audit procedures that are appropriate in thecircumstances, but not for the purpose of expressing an opinion on the effectiveness of the Company’s internalcontrol over financial reporting. Accordingly, we express no such opinion. An audit includes examining, on a testbasis, evidence supporting the amounts and disclosures in the financial statements. An audit also includes assessing theaccounting principles used and significant estimates made by management, as well as evaluating the overall financialstatement presentation. We believe that our audits provide a reasonable basis for our opinion.
In our opinion, such consolidated financial statements present fairly, in all material respects, the financial position ofthe Company as of January 2, 2011 and January 3, 2010, and the results of its operations and its cash flows for eachof the three years in the period ended January 2, 2011, in conformity with accounting principles generally accepted inthe United States of America.
/s/ Deloitte & Touche LLP
Atlanta, GeorgiaMarch 2, 2011
79

WENDY’S/ARBY’S RESTAURANTS, LLC AND SUBSIDIARIESCONSOLIDATED BALANCE SHEETS(In Thousands Except Share Information)
January 2,2011
January 3,2010
ASSETSCurrent assets:
Cash and cash equivalents . . . . . . . . . . . . . . . . . . . . . . . . . . . . . . . . . . . . . . . . . . . . . $ 198,686 $ 538,864Accounts and notes receivable . . . . . . . . . . . . . . . . . . . . . . . . . . . . . . . . . . . . . . . . . . 83,352 87,607Inventories . . . . . . . . . . . . . . . . . . . . . . . . . . . . . . . . . . . . . . . . . . . . . . . . . . . . . . . . 22,694 23,024Prepaid expenses and other current assets . . . . . . . . . . . . . . . . . . . . . . . . . . . . . . . . . 24,032 27,837Deferred income tax benefit . . . . . . . . . . . . . . . . . . . . . . . . . . . . . . . . . . . . . . . . . . . 45,067 47,556Advertising funds restricted assets . . . . . . . . . . . . . . . . . . . . . . . . . . . . . . . . . . . . . . . 76,553 80,476
Total current assets . . . . . . . . . . . . . . . . . . . . . . . . . . . . . . . . . . . . . . . . . . . . . . 450,384 805,364Properties . . . . . . . . . . . . . . . . . . . . . . . . . . . . . . . . . . . . . . . . . . . . . . . . . . . . . . . . . . . . . 1,541,853 1,607,858Other intangible assets . . . . . . . . . . . . . . . . . . . . . . . . . . . . . . . . . . . . . . . . . . . . . . . . . . . 1,358,574 1,392,883Goodwill . . . . . . . . . . . . . . . . . . . . . . . . . . . . . . . . . . . . . . . . . . . . . . . . . . . . . . . . . . . . . 888,921 886,296Investments . . . . . . . . . . . . . . . . . . . . . . . . . . . . . . . . . . . . . . . . . . . . . . . . . . . . . . . . . . . 102,406 102,140Notes receivable . . . . . . . . . . . . . . . . . . . . . . . . . . . . . . . . . . . . . . . . . . . . . . . . . . . . . . . . 12,612 13,599Deferred costs and other assets . . . . . . . . . . . . . . . . . . . . . . . . . . . . . . . . . . . . . . . . . . . . . 61,947 55,750
Total assets . . . . . . . . . . . . . . . . . . . . . . . . . . . . . . . . . . . . . . . . . . . . . . . . . . . . $4,416,697 $4,863,890
LIABILITIES AND INVESTED EQUITYCurrent liabilities:
Current portion of long-term debt . . . . . . . . . . . . . . . . . . . . . . . . . . . . . . . . . . . . . . $ 17,047 $ 16,178Accounts payable . . . . . . . . . . . . . . . . . . . . . . . . . . . . . . . . . . . . . . . . . . . . . . . . . . . 81,148 95,839Accrued expenses and other current liabilities . . . . . . . . . . . . . . . . . . . . . . . . . . . . . . 244,300 268,181Advertising funds restricted liabilities . . . . . . . . . . . . . . . . . . . . . . . . . . . . . . . . . . . . 76,553 80,476
Total current liabilities . . . . . . . . . . . . . . . . . . . . . . . . . . . . . . . . . . . . . . . . . . . 419,048 460,674Long-term debt . . . . . . . . . . . . . . . . . . . . . . . . . . . . . . . . . . . . . . . . . . . . . . . . . . . . . . . . 1,542,684 1,485,732Due to Wendy’s/Arby’s . . . . . . . . . . . . . . . . . . . . . . . . . . . . . . . . . . . . . . . . . . . . . . . . . . 30,808 42,915Deferred income . . . . . . . . . . . . . . . . . . . . . . . . . . . . . . . . . . . . . . . . . . . . . . . . . . . . . . . . 11,460 13,195Deferred income taxes . . . . . . . . . . . . . . . . . . . . . . . . . . . . . . . . . . . . . . . . . . . . . . . . . . . 478,472 502,979Other liabilities . . . . . . . . . . . . . . . . . . . . . . . . . . . . . . . . . . . . . . . . . . . . . . . . . . . . . . . . . 157,595 160,488Commitments and contingenciesInvested equity:
Member interest, $0.01 par value; 1,000 shares authorized, one share issued andoutstanding . . . . . . . . . . . . . . . . . . . . . . . . . . . . . . . . . . . . . . . . . . . . . . . . . . . . . . — —
Other capital . . . . . . . . . . . . . . . . . . . . . . . . . . . . . . . . . . . . . . . . . . . . . . . . . . . . . . 2,423,459 2,854,775Accumulated deficit . . . . . . . . . . . . . . . . . . . . . . . . . . . . . . . . . . . . . . . . . . . . . . . . . (499,500) (496,862)Advances to Wendy’s/Arby’s . . . . . . . . . . . . . . . . . . . . . . . . . . . . . . . . . . . . . . . . . . . (155,000) (155,000)Accumulated other comprehensive income (loss) . . . . . . . . . . . . . . . . . . . . . . . . . . . 7,671 (5,006)
Total invested equity . . . . . . . . . . . . . . . . . . . . . . . . . . . . . . . . . . . . . . . . . . . . 1,776,630 2,197,907
Total liabilities and invested equity . . . . . . . . . . . . . . . . . . . . . . . . . . . . . . . . . . $4,416,697 $4,863,890
See accompanying notes to consolidated financial statements.
80

WENDY’S/ARBY’S RESTAURANTS, LLC AND SUBSIDIARIESCONSOLIDATED STATEMENTS OF OPERATIONS(In Thousands)
Year Ended
January 2,2011
January 3,2010
December 28,2008
Revenues:Sales . . . . . . . . . . . . . . . . . . . . . . . . . . . . . . . . . . . . . . . . . . . . . . . . . . $3,045,317 $3,198,348 $1,662,291Franchise revenues . . . . . . . . . . . . . . . . . . . . . . . . . . . . . . . . . . . . . . . 371,097 382,487 160,470
3,416,414 3,580,835 1,822,761
Costs and expenses:Cost of sales . . . . . . . . . . . . . . . . . . . . . . . . . . . . . . . . . . . . . . . . . . . . 2,610,761 2,728,480 1,415,530General and administrative . . . . . . . . . . . . . . . . . . . . . . . . . . . . . . . . . 408,419 442,686 213,161Depreciation and amortization . . . . . . . . . . . . . . . . . . . . . . . . . . . . . . 180,310 188,506 85,058Goodwill impairment . . . . . . . . . . . . . . . . . . . . . . . . . . . . . . . . . . . . . — — 460,075Impairment of long-lived assets . . . . . . . . . . . . . . . . . . . . . . . . . . . . . . 69,477 79,956 9,580Facilities relocation and restructuring . . . . . . . . . . . . . . . . . . . . . . . . . — 8,016 3,221Other operating expense, net . . . . . . . . . . . . . . . . . . . . . . . . . . . . . . . 5,147 3,239 652
3,274,114 3,450,883 2,187,277
Operating profit (loss) . . . . . . . . . . . . . . . . . . . . . . . . . . . . . . . . 142,300 129,952 (364,516)Interest expense . . . . . . . . . . . . . . . . . . . . . . . . . . . . . . . . . . . . . . . . . . . . . (136,193) (125,392) (66,925)Loss on early extinguishment of debt . . . . . . . . . . . . . . . . . . . . . . . . . . . . . (26,197) — —Other income (expense), net . . . . . . . . . . . . . . . . . . . . . . . . . . . . . . . . . . . . 2,667 (2,973) 3,234
(Loss) income before income taxes . . . . . . . . . . . . . . . . . . . . . . . . . . . . . . . (17,423) 1,587 (428,207)Benefit from income taxes . . . . . . . . . . . . . . . . . . . . . . . . . . . . . . . . . . . . . 14,785 8,062 63,121
Net (loss) income . . . . . . . . . . . . . . . . . . . . . . . . . . . . . . . . . . . . $ (2,638) $ 9,649 $ (365,086)
See accompanying notes to consolidated financial statements.
81

WENDY’S/ARBY’S RESTAURANTS, LLC AND SUBSIDIARIESCONSOLIDATED STATEMENTS OF INVESTED EQUITY(In Thousands)
Accumulated Other ComprehensiveIncome (Loss)
MemberInterest
OtherCapital
AccumulatedDeficit
Advances toWendy’s/
Arby’s
UnrealizedGain (Loss) on
CashFlow Hedges
CurrencyTranslationAdjustment
UnrecognizedPension Loss Total
Balance at December 30,2007 . . . . . . . . . . . . . . . . . . . . $— $ 294,735 $(141,425) $ — $(153) $ 689 $(184) $ 153,662
Wendy’s International Inc.merger consideration, net oftax benefits . . . . . . . . . . . . . . . — 2,509,813 — — — — — 2,509,813
Comprehensive loss:Net loss . . . . . . . . . . . . . — — (365,086) — — — — (365,086)Change in unrealized loss
on cash flow hedges . . — — — — 153 — — 153Foreign currency
translationadjustment . . . . . . . . . — — — — — (43,002) — (43,002)
Unrecognized pensionloss . . . . . . . . . . . . . . . — — — — — — (138) (138)
Comprehensive loss . . (408,073)
Advances to Parent . . . . . . . — — — (155,000) — — — (155,000)Capital contributions from
Parent . . . . . . . . . . . . . . . — 150,177 — — — — — 150,177Share-based compensation
expense . . . . . . . . . . . . . . — 8,770 — — — — — 8,770Other . . . . . . . . . . . . . . . . . — (4,574) — — — — — (4,574)
Balance at December 28,2008 . . . . . . . . . . . . . . . . . . . . — 2,958,921 (506,511) (155,000) — (42,313) (322) 2,254,775
Comprehensive income:Net income . . . . . . . . . . — — 9,649 — — — — 9,649Foreign currency
translationadjustment . . . . . . . . . — — — — — 37,617 — 37,617
Comprehensiveincome . . . . . . — — — — — — — 47,266
Cash dividends to Parent . . — (115,000) — — — — — (115,000)Share-based compensation
expense . . . . . . . . . . . . . . — 13,570 — — — — — 13,570Other . . . . . . . . . . . . . . . . . — (2,716) — — — — 12 (2,704)
Balance at January 3, 2010 . . . . . — 2,854,775 (496,862) (155,000) — (4,696) (310) 2,197,907Comprehensive income:
Net loss . . . . . . . . . . . . . — — (2,638) — — — — (2,638)Foreign currency
translationadjustment . . . . . . . . . — — — — — 12,666 — 12,666
Comprehensiveincome . . . . . . . . . . — — — — — — — 10,028
Cash dividends to Parent . . — (443,700) — — — — — (443,700)Share-based compensation
expense . . . . . . . . . . . . . . — 12,790 — — — — — 12,790Other . . . . . . . . . . . . . . . — (406) — — — — 11 (395)
Balance at January 2, 2011 . . . . . $— $2,423,459 $(499,500) $(155,000) $ — $ 7,970 $(299) $1,776,630
See accompanying notes to consolidated financial statements.
82

WENDY’S/ARBY’S RESTAURANTS, LLC AND SUBSIDIARIESCONSOLIDATED STATEMENTS OF CASH FLOWS(In Thousands)
Year Ended
January 2,2011
January 3,2010
December 28,2008
Cash flows from continuing operating activities:Net (loss) income . . . . . . . . . . . . . . . . . . . . . . . . . . . . . . . . . . . . . . . . . . . . . . . . $ (2,638) $ 9,649 $(365,086)Adjustments to reconcile net (loss) income to net cash provided by continuing
operating activities:Depreciation and amortization . . . . . . . . . . . . . . . . . . . . . . . . . . . . . . . . . . 180,310 188,506 85,058Impairment of long-lived assets . . . . . . . . . . . . . . . . . . . . . . . . . . . . . . . . . 69,477 79,956 9,580Accretion of long-term debt . . . . . . . . . . . . . . . . . . . . . . . . . . . . . . . . . . . . 15,016 10,400 2,452Distributions received from joint venture . . . . . . . . . . . . . . . . . . . . . . . . . . 13,980 14,583 2,864Share-based compensation provision . . . . . . . . . . . . . . . . . . . . . . . . . . . . . 12,790 13,570 8,770Write-off and amortization of deferred financing costs . . . . . . . . . . . . . . . . 11,763 15,796 3,753Provision for doubtful accounts . . . . . . . . . . . . . . . . . . . . . . . . . . . . . . . . . 9,694 8,169 670Non-cash rent expense . . . . . . . . . . . . . . . . . . . . . . . . . . . . . . . . . . . . . . . . 9,334 12,618 3,103Tax sharing payable to Wendy’s/Arby’s, net . . . . . . . . . . . . . . . . . . . . . . . . 1,052 40,413 —Tax sharing payments to Wendy’s/Arby’s . . . . . . . . . . . . . . . . . . . . . . . . . — (10,417) (17,000)Net recognition of deferred vendor incentive . . . . . . . . . . . . . . . . . . . . . . . (587) (791) (6,459)Other operating transactions with Wendy’s/Arby’s . . . . . . . . . . . . . . . . . . (8,032) 14,114 5,263Equity in earnings in joint venture . . . . . . . . . . . . . . . . . . . . . . . . . . . . . . . (9,459) (8,499) (1,974)Deferred income tax benefit . . . . . . . . . . . . . . . . . . . . . . . . . . . . . . . . . . . . (25,752) (68,541) (62,723)Goodwill impairment . . . . . . . . . . . . . . . . . . . . . . . . . . . . . . . . . . . . . . . . — — 460,075Other, net . . . . . . . . . . . . . . . . . . . . . . . . . . . . . . . . . . . . . . . . . . . . . . . . . (504) 5,553 4,352Changes in operating assets and liabilities:
Accounts and notes receivable . . . . . . . . . . . . . . . . . . . . . . . . . . . . . . (4,193) (7,679) (1,367)Inventories . . . . . . . . . . . . . . . . . . . . . . . . . . . . . . . . . . . . . . . . . . . . . 394 1,879 (140)Prepaid expenses and other current assets . . . . . . . . . . . . . . . . . . . . . . 755 1,121 19,800Accounts payable . . . . . . . . . . . . . . . . . . . . . . . . . . . . . . . . . . . . . . . . (14,184) (52,560) 14,532Accrued expenses and other current liabilities . . . . . . . . . . . . . . . . . . (27,962) 53,841 (64,558)
Net cash provided by continuing operating activities . . . . . . . . . 231,254 321,681 100,965
Cash flows from continuing investing activities:Capital expenditures . . . . . . . . . . . . . . . . . . . . . . . . . . . . . . . . . . . . . . . . . . . . . (147,969) (101,914) (105,924)Proceeds from dispositions . . . . . . . . . . . . . . . . . . . . . . . . . . . . . . . . . . . . . . . . . 5,660 10,882 1,322Cost of acquisitions, less cash acquired . . . . . . . . . . . . . . . . . . . . . . . . . . . . . . . . (3,123) (2,357) (9,622)Increase in cash from merger with Wendy’s . . . . . . . . . . . . . . . . . . . . . . . . . . . . — — 199,785Other, net . . . . . . . . . . . . . . . . . . . . . . . . . . . . . . . . . . . . . . . . . . . . . . . . . . . . . 1,263 192 (129)
Net cash (used in) provided by continuing investingactivities . . . . . . . . . . . . . . . . . . . . . . . . . . . . . . . . . . . . . . . . . (144,169) (93,197) 85,432
Cash flows from continuing financing activities:Proceeds from long-term debt . . . . . . . . . . . . . . . . . . . . . . . . . . . . . . . . . . . . . . 497,661 607,507 17,753Repayments of notes payable and long-term debt . . . . . . . . . . . . . . . . . . . . . . . (466,461) (209,482) (175,521)Deferred financing costs . . . . . . . . . . . . . . . . . . . . . . . . . . . . . . . . . . . . . . . . . . . (16,353) (38,399) —Capital contributions from Wendy’s/Arby’s . . . . . . . . . . . . . . . . . . . . . . . . . . . . — — 150,177Dividends/advances to Wendy’s/Arby’s . . . . . . . . . . . . . . . . . . . . . . . . . . . . . . . (443,700) (115,000) (155,000)Other, net . . . . . . . . . . . . . . . . . . . . . . . . . . . . . . . . . . . . . . . . . . . . . . . . . . . . . (21) — (659)
Net cash (used in) provided by continuing financingactivities . . . . . . . . . . . . . . . . . . . . . . . . . . . . . . . . . . . . . . . . . (428,874) 244,626 (163,250)
Net cash (used in) provided by continuing operations before effect of exchange ratechanges on cash . . . . . . . . . . . . . . . . . . . . . . . . . . . . . . . . . . . . . . . . . . . . . . . . . . . (341,789) 473,110 23,147
Effect of exchange rate changes on cash . . . . . . . . . . . . . . . . . . . . . . . . . . . . . . . . . . . 1,611 2,725 (4,123)
Net cash (used in) provided by continuing operations . . . . . . . . . . . . . . . . . . . . . . . . (340,178) 475,835 19,024Net cash used in operating activities of discontinued operations . . . . . . . . . . . . . . . . — (51) —
Net (decrease) increase in cash and cash equivalents . . . . . . . . . . . . . . . . . . . . . . . . . . (340,178) 475,784 19,024Cash and cash equivalents at beginning of year . . . . . . . . . . . . . . . . . . . . . . . . . . . . . 538,864 63,080 44,056
Cash and cash equivalents at end of year . . . . . . . . . . . . . . . . . . . . . . . . . . . . . . . . . . $ 198,686 $ 538,864 $ 63,080
83

WENDY’S/ARBY’S RESTAURANTS, LLC AND SUBSIDIARIESCONSOLIDATED STATEMENTS OF CASH FLOWS—CONTINUED(In Thousands)
Year Ended
January 2,2011
January 3,2010
December 28,2008
Supplemental disclosures of cash flow information:Cash paid during the year in continuing operations for:
Interest . . . . . . . . . . . . . . . . . . . . . . . . . . . . . . . . . . . . . . . . . . . . . . . . . . $ 126,589 $ 84,085 $ 60,446
Income taxes, net of refunds . . . . . . . . . . . . . . . . . . . . . . . . . . . . . . . . . . $ 9,830 $ 9,529 $ 3,130
Supplemental schedule of non-cash investing and financing activities:Total capital expenditures . . . . . . . . . . . . . . . . . . . . . . . . . . . . . . . . . . . $ 153,744 $ 108,284 $ 114,354Cash capital expenditures . . . . . . . . . . . . . . . . . . . . . . . . . . . . . . . . . . . . (147,969) (101,914) (105,924)
Non-cash capitalized lease and certain sales-leaseback obligations . . . . . . $ 5,775 $ 6,370 $ 8,430
Non-cash transactions:Value of equity consideration issued in merger with Wendy’s
Common stock . . . . . . . . . . . . . . . . . . . . . . . . . . . . . . . . . . . . . . . N/A N/A $2,476,197Stock options . . . . . . . . . . . . . . . . . . . . . . . . . . . . . . . . . . . . . . . . . N/A N/A $ 18,296
Assumption of debt . . . . . . . . . . . . . . . . . . . . . . . . . . . . . . . . . . . . . . . . N/A N/A $ 553,438
See accompanying notes to consolidated financial statements.
84
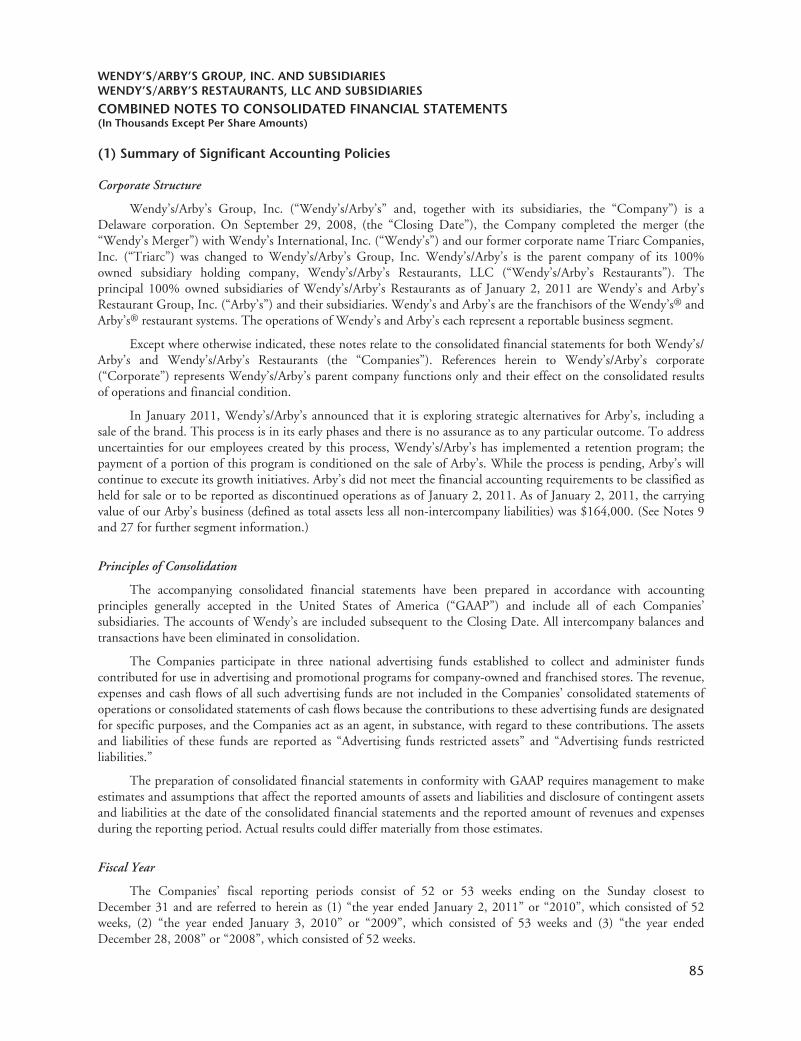
WENDY’S/ARBY’S GROUP, INC. AND SUBSIDIARIESWENDY’S/ARBY’S RESTAURANTS, LLC AND SUBSIDIARIES
COMBINED NOTES TO CONSOLIDATED FINANCIAL STATEMENTS(In Thousands Except Per Share Amounts)
(1) Summary of Significant Accounting Policies
Corporate Structure
Wendy’s/Arby’s Group, Inc. (“Wendy’s/Arby’s” and, together with its subsidiaries, the “Company”) is aDelaware corporation. On September 29, 2008, (the “Closing Date”), the Company completed the merger (the“Wendy’s Merger”) with Wendy’s International, Inc. (“Wendy’s”) and our former corporate name Triarc Companies,Inc. (“Triarc”) was changed to Wendy’s/Arby’s Group, Inc. Wendy’s/Arby’s is the parent company of its 100%owned subsidiary holding company, Wendy’s/Arby’s Restaurants, LLC (“Wendy’s/Arby’s Restaurants”). Theprincipal 100% owned subsidiaries of Wendy’s/Arby’s Restaurants as of January 2, 2011 are Wendy’s and Arby’sRestaurant Group, Inc. (“Arby’s”) and their subsidiaries. Wendy’s and Arby’s are the franchisors of the Wendy’s® andArby’s® restaurant systems. The operations of Wendy’s and Arby’s each represent a reportable business segment.
Except where otherwise indicated, these notes relate to the consolidated financial statements for both Wendy’s/Arby’s and Wendy’s/Arby’s Restaurants (the “Companies”). References herein to Wendy’s/Arby’s corporate(“Corporate”) represents Wendy’s/Arby’s parent company functions only and their effect on the consolidated resultsof operations and financial condition.
In January 2011, Wendy’s/Arby’s announced that it is exploring strategic alternatives for Arby’s, including asale of the brand. This process is in its early phases and there is no assurance as to any particular outcome. To addressuncertainties for our employees created by this process, Wendy’s/Arby’s has implemented a retention program; thepayment of a portion of this program is conditioned on the sale of Arby’s. While the process is pending, Arby’s willcontinue to execute its growth initiatives. Arby’s did not meet the financial accounting requirements to be classified asheld for sale or to be reported as discontinued operations as of January 2, 2011. As of January 2, 2011, the carryingvalue of our Arby’s business (defined as total assets less all non-intercompany liabilities) was $164,000. (See Notes 9and 27 for further segment information.)
Principles of Consolidation
The accompanying consolidated financial statements have been prepared in accordance with accountingprinciples generally accepted in the United States of America (“GAAP”) and include all of each Companies’subsidiaries. The accounts of Wendy’s are included subsequent to the Closing Date. All intercompany balances andtransactions have been eliminated in consolidation.
The Companies participate in three national advertising funds established to collect and administer fundscontributed for use in advertising and promotional programs for company-owned and franchised stores. The revenue,expenses and cash flows of all such advertising funds are not included in the Companies’ consolidated statements ofoperations or consolidated statements of cash flows because the contributions to these advertising funds are designatedfor specific purposes, and the Companies act as an agent, in substance, with regard to these contributions. The assetsand liabilities of these funds are reported as “Advertising funds restricted assets” and “Advertising funds restrictedliabilities.”
The preparation of consolidated financial statements in conformity with GAAP requires management to makeestimates and assumptions that affect the reported amounts of assets and liabilities and disclosure of contingent assetsand liabilities at the date of the consolidated financial statements and the reported amount of revenues and expensesduring the reporting period. Actual results could differ materially from those estimates.
Fiscal Year
The Companies’ fiscal reporting periods consist of 52 or 53 weeks ending on the Sunday closest toDecember 31 and are referred to herein as (1) “the year ended January 2, 2011” or “2010”, which consisted of 52weeks, (2) “the year ended January 3, 2010” or “2009”, which consisted of 53 weeks and (3) “the year endedDecember 28, 2008” or “2008”, which consisted of 52 weeks.
85

WENDY’S/ARBY’S GROUP, INC. AND SUBSIDIARIESWENDY’S/ARBY’S RESTAURANTS, LLC AND SUBSIDIARIES
COMBINED NOTES TO CONSOLIDATED FINANCIAL STATEMENTS—CONTINUED(In Thousands Except Per Share Amounts)
Cash Equivalents
All highly liquid investments with a maturity of three months or less when acquired are considered cashequivalents. The Companies’ cash equivalents principally consist of cash in bank, money market and mutual fundmoney market accounts and are primarily not in Federal Deposit Insurance Corporation insured accounts.
We believe that our vulnerability to risk concentrations in our cash equivalents is mitigated by (1) our policiesrestricting the eligibility, credit quality and concentration limits for our placements in cash equivalents and(2) insurance from the Securities Investor Protection Corporation of up to $500 per account as well as supplementalprivate insurance coverage maintained by substantially all of our brokerage firms, to the extent our cash equivalentsare held in brokerage accounts.
Accounts and Notes Receivable
Accounts and notes receivable consist primarily of royalties, franchise fees, rents due principally fromfranchisees, and credit card receivables. The need for an allowance for doubtful accounts is reviewed on a specificidentification basis based upon past due balances and the financial strength of the obligor. As of January 3, 2010,notes receivable (non-current) for Wendy’s/Arby’s also included the series A senior notes that Wendy’s/Arby’sreceived from Deerfield Capital Corp. (“DFR”) (the “DFR Notes”) in connection with the sale of our interest in DFRin 2007. See Note 3—DFR Notes for additional information.
Inventories
The Companies’ inventories are stated at the lower of cost or market, with cost determined in accordance withthe first-in, first-out method, and consist primarily of restaurant food items, kids’ meal toys and paper supplies.
Investments
Investments in which the Companies have significant influence over the investees includes their 50% share in apartnership in a Canadian restaurant real estate joint venture (“TimWen”) with Tim Hortons Inc. (“THI”). Suchinvestments are accounted for on the equity method under which results of operations include their share of theincome or loss of the investees. Investments in limited partnerships and other non-current investments in which theCompanies do not have significant influence over the investees are recorded at cost, with related realized gains andlosses reported as income or loss in the period in which the securities are sold or otherwise disposed.
The difference, if any, between the carrying value of equity investments and the underlying equity in the netassets of each investee is accounted for as if the investee were a consolidated subsidiary. Accordingly, the carryingvalue difference is amortized over the estimated lives of the assets of the investee to which such difference would havebeen allocated if the equity investment were a consolidated subsidiary. To the extent the carrying value differencerepresents goodwill, it is not amortized.
The Companies review investments with unrealized losses and recognize investment losses currently for anyunrealized losses deemed to be other than temporary. These investment losses are recognized as a component of net(loss) income. The Companies consider such factors as the length of time the market value of an investment has beenbelow its carrying value, the severity of the decline, the financial condition of the investee and the prospect for futurerecovery in the market value of the investment, including the Companies’ ability and intent to hold the investmentsfor a period of time sufficient for a forecasted recovery. The cost-basis component of investments represents originalcost less a permanent reduction for any unrealized losses that were deemed to be other than temporary.
Properties and Depreciation and Amortization
Properties are stated at cost, including internal costs of employees to the extent such employees are dedicated tospecific restaurant construction projects, less accumulated depreciation and amortization. Depreciation and
86
WENDY’S/ARBY’S GROUP, INC. AND SUBSIDIARIESWENDY’S/ARBY’S RESTAURANTS, LLC AND SUBSIDIARIES
COMBINED NOTES TO CONSOLIDATED FINANCIAL STATEMENTS—CONTINUED(In Thousands Except Per Share Amounts)
amortization of properties is computed principally on the straight-line basis using the following estimated useful livesof the related major classes of properties: 1 to 15 years for office and restaurant equipment, 5 to 15 years fortransportation equipment, 7 to 30 years for buildings and 7 to 20 years for owned site improvements. Leased assetscapitalized and leasehold improvements are amortized over the shorter of their estimated useful lives or the terms ofthe respective leases, including periods covered by renewal options that the Companies believe they are reasonablyassured of exercising.
The Companies review properties for impairment whenever events or changes in circumstances indicate that thecarrying amount of an asset group may not be recoverable. If such review indicates an asset group may not berecoverable, an impairment loss is recognized for the excess of the carrying amount over the fair value of an assetgroup to be held and used or over the fair value less cost to sell of an asset to be disposed. Asset groups are primarilycomprised of our individual restaurant properties.
Goodwill
Goodwill, representing the excess of the cost of an acquired entity over the fair value of the acquired net assets,is not amortized. For goodwill purposes, Wendy’s includes two reporting units comprised of its (i) North Americacompany-owned and franchise restaurants and (ii) international operations; Arby’s reporting units represent(i) company-owned restaurants and (ii) franchise restaurants. Substantially all goodwill at January 2, 2011 andJanuary 3, 2010 was associated with Wendy’s North America restaurants. The Companies test goodwill forimpairment annually during the fourth quarter, or more frequently if events or changes in circumstances indicate thatthe asset may be impaired, by comparing the fair value of each reporting unit, using both discounted cash flows andmarket multiples based on earnings, to the carrying value to determine if there is an indication that a potentialimpairment may exist.
If the Companies determine that impairment may exist, the amount of the impairment loss is measured as theexcess, if any, of the carrying amount of the goodwill over its implied fair value. In determining the implied fair valueof the reporting unit’s goodwill, the Companies allocate the fair value of a reporting unit to all of the assets andliabilities of that unit as if the unit had been acquired in a business combination and the fair value of the reportingunit was the price paid to acquire the reporting unit. The excess of the fair value of the unit over the amounts assignedto the assets and liabilities is the implied fair value of goodwill. If the carrying amount of a reporting unit’s goodwillexceeds the implied fair value of that goodwill, an impairment loss is recognized in an amount equal to that excess.
Our fair value estimates are subject to change as a result of many factors including, among others, any changesin our business plans, changing economic conditions and the competitive environment. Should actual cash flows andour future estimates vary adversely from those estimates we use, we may be required to recognize additional goodwillimpairment charges in future years.
Other Intangible Assets and Deferred Costs
Amortizing intangible assets are amortized on the straight-line basis using the following estimated useful lives ofthe related classes of intangibles: the terms of the respective leases, including periods covered by renewal options thatthe Companies are reasonably assured of exercising, for favorable leases; 19 to 21 years for franchise agreements; 1 to5 years for costs of computer software; 20 years for reacquired rights under franchise agreements; and 20 years fortrademarks with a definite life and distribution rights. Trademarks acquired in the Wendy’s Merger have an indefinitelife and are not amortized.
The Companies review intangible assets for impairment whenever events or changes in circumstances indicatethat the carrying amount of the intangible asset may not be recoverable. Indefinite lived intangible assets are alsoreviewed for impairment annually. If such reviews indicate the intangible asset may not be recoverable, an impairmentloss is recognized for the excess of the carrying amount over the fair value of the intangible asset.
Deferred financing costs are amortized as interest expense over the lives of the respective debt using the effectiveinterest rate method.
87

WENDY’S/ARBY’S GROUP, INC. AND SUBSIDIARIESWENDY’S/ARBY’S RESTAURANTS, LLC AND SUBSIDIARIES
COMBINED NOTES TO CONSOLIDATED FINANCIAL STATEMENTS—CONTINUED(In Thousands Except Per Share Amounts)
Derivative Instruments
The Companies’ derivative instruments are recorded at fair value. Changes in the fair value of derivativeinstruments that have been designated as fair value hedging instruments are recorded as an adjustment to theunderlying debt balance being hedged to the extent of the effectiveness of such hedging instruments. Changes in thefair value of derivative instruments that have been designated as cash flow hedging instruments are included in the“Unrealized gain (loss) on cash flow hedges” component of “Accumulated other comprehensive income (loss)” to theextent of the effectiveness of such hedging instruments. Any ineffective portion of the change in fair value of thedesignated hedging instruments is included in results of operations.
Share-Based Compensation
Wendy’s/Arby’s has granted share-based compensation to certain employees of Wendy’s/Arby’s Restaurantsunder several equity plans of Wendy’s/Arby’s. Wendy’s/Arby’s Restaurants recognizes such share-based compensationas capital contributions from Wendy’s/Arby’s. Wendy’s/Arby’s Restaurants has not granted any of its memberinterests as share-based compensation.
The Companies measure the cost of employee services received in exchange for an award of equity instruments,which include grants of employee stock options and restricted stock, based on the fair value of the award at the date ofgrant. Share-based compensation expense is recognized net of estimated forfeitures, determined based on historicalexperience. The Companies recognize compensation costs ratably over the requisite service period for each separatelyvesting portion of the award unless the awards are subject to performance conditions, in which case they recognizecompensation expense over the requisite service period to the extent performance conditions are considered probable.The Companies determine the grant-date fair value of stock options using a Black-Scholes-Merton option pricingmodel (the “Black-Scholes Model”) unless the awards are subject to market conditions, in which case we use a MonteCarlo simulation model. The Monte Carlo simulation model utilizes multiple input variables to estimate theprobability that market conditions will be achieved.
Foreign Currency Translation
Substantially all of the Companies’ foreign operations are in Canada where the functional currency is theCanadian dollar. Financial statements of foreign subsidiaries are prepared in their functional currency then translatedinto United States dollars. Assets and liabilities are translated at the exchange rate as of the balance sheet date andrevenues, costs, and expenses are translated at a monthly average exchange rate. Net gains or losses resulting from thetranslation adjustment are charged or credited directly to the “Foreign currency translation adjustment” component of“Accumulated other comprehensive income (loss).”
Income Taxes
The Companies record income tax liabilities based on known obligations and estimates of potential obligations.A deferred tax asset or liability is recognized whenever there are future tax effects from temporary differences betweenthe financial statement carrying amounts of existing assets and liabilities and their respective tax bases and operatingloss, capital loss, and tax credit carryforwards. Deferred tax assets and liabilities are measured using enacted tax ratesexpected to apply to the years in which those differences are expected to be recovered or settled. When considerednecessary, the Companies record a valuation allowance to reduce the carrying amount of deferred tax assets if it ismore likely than not all or a portion of the asset will not be realized.
The Companies apply a recognition threshold and measurement attribute for financial statement recognitionand measurement of potential tax benefits associated with tax positions taken or expected to be taken in income taxreturns (“Uncertain Tax Positions”). A two-step process of evaluating a tax position is followed, whereby we firstdetermine if it is more likely than not that a tax position will be sustained upon examination, including resolution of
88

WENDY’S/ARBY’S GROUP, INC. AND SUBSIDIARIESWENDY’S/ARBY’S RESTAURANTS, LLC AND SUBSIDIARIES
COMBINED NOTES TO CONSOLIDATED FINANCIAL STATEMENTS—CONTINUED(In Thousands Except Per Share Amounts)
any related appeals or litigation processes, based on the technical merits of the position. A tax position that meets themore-likely-than-not recognition threshold is then measured for purposes of financial statement recognition as thelargest amount of benefit that is greater than 50 percent likely of being realized upon being effectively settled.
Interest accrued for Uncertain Tax Positions is charged to “Interest expense.” Penalties accrued for UncertainTax Positions are charged to “General and administrative.”
Revenue Recognition
“Sales” includes revenues recognized upon delivery of food to the customer at company-owned restaurants andrevenues for shipments of bakery items and kids’ meal promotional items to our franchisees and others. “Sales”excludes sales taxes collected from the Companies’ customers.
“Franchise revenues” includes royalties, franchise fees, and rental income. Royalties from franchised restaurantsare based on a percentage of net sales of the franchised restaurant and are recognized as earned. Initial franchise feesare recorded as deferred income when received and are recognized as revenue when a franchised restaurant is openedas all material services and conditions related to the franchise fee have been substantially performed upon therestaurant opening. Renewal franchise fees are recognized as revenue when the license agreements are signed and thefee is paid since there are no material services and conditions related to the renewal franchise fee. Franchisecommitment fee deposits are forfeited and recognized as revenue upon the termination of the related commitments toopen new franchised restaurants. Rental income from locations owned by the Companies and leased to franchisees isrecognized on a straight-line basis over the respective operating lease terms.
Cost of Sales
Cost of sales includes food and paper, restaurant labor, and occupancy, advertising and other operating costs.
Vendor Incentives
The Companies receive incentives from their vendors. These incentives are recognized as earned and aregenerally classified as a reduction of “Cost of sales.”
Advertising Costs
The Companies incur various advertising costs, including contributions to certain advertising cooperativesbased upon a percentage of net sales by company-owned restaurants. All advertising costs are expensed as incurred,with the exception of media development costs that are expensed beginning in the month that the advertisement isfirst communicated, and are included in “Cost of sales.”
Self- insurance
We are self-insured for most workers’ compensation, health care claims, general liability and automotiveliability losses. We provide for their estimated cost to settle both known claims and claims incurred but not yetreported. Liabilities associated with these claims are estimated, in part, by considering the frequency and severity ofhistorical claims, both specific to us, as well as industry-wide loss experience, and other actuarial assumptions. Wedetermine casualty insurance obligations with the assistance of actuarial firms. Since there are many estimates andassumptions involved in recording insurance liabilities, and in the case of workers’ compensation a significant periodof time before ultimate resolution of claims, differences between actual future events and prior estimates andassumptions could result in adjustments to these liabilities.
89

WENDY’S/ARBY’S GROUP, INC. AND SUBSIDIARIESWENDY’S/ARBY’S RESTAURANTS, LLC AND SUBSIDIARIES
COMBINED NOTES TO CONSOLIDATED FINANCIAL STATEMENTS—CONTINUED(In Thousands Except Per Share Amounts)
Leases
We operate restaurants that are located on sites owned by us and sites leased by us from third parties. Atinception, each lease is evaluated to determine whether the lease will be accounted for as an operating or capital leasebased on lease terms. When determining the lease term, we include option periods for which failure to renew the leaseimposes a significant economic detriment. The primary penalty to which we may be subject is the economicdetriment associated with the existence of unamortized leasehold improvements which might be impaired if wechoose not to exercise the available renewal options.
For operating leases, minimum lease payments, including minimum scheduled rent increases, are recognized asrent expense on a straight line basis (“Straight-Line Rent”) over the applicable lease terms. Lease terms are generallyinitially for 20 years and, in most cases, provide for rent escalations and renewal options. The term used for Straight-Line Rent expense is calculated initially from the date we obtain possession of the leased premises through theexpected lease termination date. We expense rent from possession date to the restaurant opening date. There is aperiod under certain lease agreements referred to as a rent holiday (“Rent Holiday”) that generally begins on thepossession date and ends on the rent commencement date. During the Rent Holiday period, no cash rent paymentsare typically due under the terms of the lease; however, expense is recorded for that period on a straight-line basisconsistent with the Straight-Line Rent policy.
For leases that contain rent escalations, we record the rent payable during the lease term, as determined above,on the straight-line basis over the term of the lease (including the rent holiday period beginning upon possession ofthe premises), and record the excess of the Straight-Line Rent over the minimum rents paid as a deferred lease liabilityincluded in “Other liabilities.” Certain leases contain provisions, referred to as contingent rent (“Contingent Rent”),that require additional rental payments based upon restaurant sales volume. Contingent Rent is expensed each periodas the liability is incurred.
Favorable and unfavorable lease amounts, when we purchase restaurants, are recorded as components of “Otherintangible assets” and “Other liabilities,” respectively, and are amortized to “Cost of sales”—both on a straight-linebasis over the remaining term of the leases. When the expected term of a lease is determined to be shorter than theoriginal amortization period, the favorable or unfavorable lease balance associated with the lease is adjusted to reflectthe revised lease term and a gain or loss recognized.
Management makes certain estimates and assumptions regarding each new lease agreement, lease renewal, andlease amendment, including, but not limited to, property values, market rents, property lives, discount rates, andprobable term, all of which can impact (1) the classification and accounting for a lease as capital or operating, (2) therent holiday and escalations in payment that are taken into consideration when calculating straight-line rent, (3) theterm over which leasehold improvements for each restaurant are amortized, and (4) the values and lives of favorableand unfavorable leases. Different amounts of depreciation and amortization, interest and rent expense would bereported if different estimates and assumptions were used.
(2) Acquisitions and Dispositions
Merger with Wendy’s International, Inc.
On September 29, 2008, Wendy’s/Arby’s completed the Wendy’s Merger in an all-stock transaction in whichWendy’s shareholders received a fixed ratio of 4.25 shares of Wendy’s/Arby’s Class A common stock for each share ofWendy’s common stock owned.
The merger was accounted for using the purchase method of accounting and Wendy’s/Arby’s concluded that itwas the acquirer for financial accounting purposes. The total merger consideration was allocated to Wendy’s nettangible and intangible assets acquired and liabilities assumed based on their fair values with the excess recognized asgoodwill of which $42,282 is deductible for tax purposes. The total consideration included merger related costs inaccordance with the applicable guidance effective as of the Closing Date.
90

WENDY’S/ARBY’S GROUP, INC. AND SUBSIDIARIESWENDY’S/ARBY’S RESTAURANTS, LLC AND SUBSIDIARIES
COMBINED NOTES TO CONSOLIDATED FINANCIAL STATEMENTS—CONTINUED(In Thousands Except Per Share Amounts)
The computation of the total merger consideration and the allocation of the consideration to the net tangibleand intangible assets acquired and liabilities assumed was finalized during the year ended January 3, 2010 and ispresented in the table below:
Value of shares of Wendy’s/Arby’s common stock issued in exchange for Wendy’s common shares . . . . $2,476,197Value of Wendy’s stock options converted into Wendy’s/Arby’s options . . . . . . . . . . . . . . . . . . . . . . . . 18,296Wendy’s Merger costs . . . . . . . . . . . . . . . . . . . . . . . . . . . . . . . . . . . . . . . . . . . . . . . . . . . . . . . . . . . . . . . 21,028
Total merger consideration . . . . . . . . . . . . . . . . . . . . . . . . . . . . . . . . . . . . . . . . . . . . . . . . . . . . . . . . . . . 2,515,521Net book value of Wendy’s assets acquired and liabilities assumed . . . . . . . . . . . . . . . . . . . . . . . . . . . . . 712,794
Excess of merger consideration over net book value of Wendy’s assets acquired and liabilitiesassumed . . . . . . . . . . . . . . . . . . . . . . . . . . . . . . . . . . . . . . . . . . . . . . . . . . . . . . . . . . . . . . . . . . . . . . . 1,802,727
Changes to fair values of assets and liabilities and deferred income tax liability related to the merger:(Increase)/decrease in:
Current assetsAccounts and notes receivable . . . . . . . . . . . . . . . . . . . . . . . . . . . . . . . . . . . . . . . . . . . . . (694)Prepaid expenses and other current assets . . . . . . . . . . . . . . . . . . . . . . . . . . . . . . . . . . . . 985
Investments . . . . . . . . . . . . . . . . . . . . . . . . . . . . . . . . . . . . . . . . . . . . . . . . . . . . . . . . . . . . . . (64,852)Properties . . . . . . . . . . . . . . . . . . . . . . . . . . . . . . . . . . . . . . . . . . . . . . . . . . . . . . . . . . . . . . . . (46,527)Other intangible assets
Trademark . . . . . . . . . . . . . . . . . . . . . . . . . . . . . . . . . . . . . . . . . . . . . . . . . . . . . . . . . . . (900,109)Franchise agreements . . . . . . . . . . . . . . . . . . . . . . . . . . . . . . . . . . . . . . . . . . . . . . . . . . . (353,000)Favorable leases . . . . . . . . . . . . . . . . . . . . . . . . . . . . . . . . . . . . . . . . . . . . . . . . . . . . . . . . (121,620)Computer software . . . . . . . . . . . . . . . . . . . . . . . . . . . . . . . . . . . . . . . . . . . . . . . . . . . . . 9,572
Deferred costs and other assets . . . . . . . . . . . . . . . . . . . . . . . . . . . . . . . . . . . . . . . . . . . . . . . . (377)Increase/(decrease) in:
Accrued expenses and other current liabilities . . . . . . . . . . . . . . . . . . . . . . . . . . . . . . . . . . . . . 1,956Long-term debt, including current portion of $228 . . . . . . . . . . . . . . . . . . . . . . . . . . . . . . . . (56,337)Other liabilities . . . . . . . . . . . . . . . . . . . . . . . . . . . . . . . . . . . . . . . . . . . . . . . . . . . . . . . . . . . . (31,378)Unfavorable leases . . . . . . . . . . . . . . . . . . . . . . . . . . . . . . . . . . . . . . . . . . . . . . . . . . . . . . . . . . 70,762Wendy’s/Arby’s Restaurants deferred income tax liability . . . . . . . . . . . . . . . . . . . . . . . . . . . . 557,995
Wendy’s/Arby’s Restaurants total adjustments . . . . . . . . . . . . . . . . . . . . . . . . . . . . . . . . . . . . . . . . (933,624)
Wendy’s/Arby’s Restaurants goodwill . . . . . . . . . . . . . . . . . . . . . . . . . . . . . . . . . . . . . . . 869,103Decrease in Wendy’s/Arby’s deferred income tax liability . . . . . . . . . . . . . . . . . . . . . . . . . . . . (5,277)
Wendy’s/Arby’s goodwill . . . . . . . . . . . . . . . . . . . . . . . . . . . . . . . . . . . . . . . . . . . . . . . . $ 863,826
In the Wendy’s Merger, 376,776 shares of Wendy’s/Arby’s Class A common stock were issued to Wendy’sshareholders. The equity consideration was based on the 4.25 conversion factor of the Wendy’s outstanding shares ata value of $6.57 per share which represented the average closing market price of Triarc Class A common stock twodays before and after the merger announcement date of April 24, 2008. Immediately prior to the Wendy’s Merger,each share of Wendy’s/Arby’s Class B common stock was converted into Class A common stock on a one for onebasis (the “Conversion”). In connection with the May 28, 2009 amendment and restatement of Wendy’s/Arby’sCertificate of Incorporation, their former Class A common stock is now referred to as “Common Stock.”
Outstanding Wendy’s stock options were converted upon completion of the merger into stock options withrespect to Wendy’s/Arby’s Common Stock, based on the 4.25:1 exchange ratio. The value of Wendy’s stock optionsthat have been converted into Wendy’s/Arby’s stock options of $18,296 was calculated using the Black-Scholesoption pricing model as of April 24, 2008.
91

WENDY’S/ARBY’S GROUP, INC. AND SUBSIDIARIESWENDY’S/ARBY’S RESTAURANTS, LLC AND SUBSIDIARIES
COMBINED NOTES TO CONSOLIDATED FINANCIAL STATEMENTS—CONTINUED(In Thousands Except Per Share Amounts)
The acquired franchise agreements have a weighted average amortization period of approximately 21 years andthe acquired trademark has an indefinite life so there is no related amortization. The acquired favorable andunfavorable leases have a weighted average amortization period of approximately 19 and 16 years, respectively.
The following unaudited supplemental pro forma consolidated summary operating data (the “As Adjusted”) for2008 has been prepared by adjusting the historical data as set forth in the accompanying consolidated statements ofoperations for the year ended December 28, 2008 to give effect to the Wendy’s Merger and the Conversion as if theyhad been consummated as of the beginning of 2007:
2008
As Reported As Adjusted
Revenues:Sales . . . . . . . . . . . . . . . . . . . . . . . . . . . . . . . . . . . . . . . . . . . . . . . . . . . $1,662,291 $3,279,504Franchise revenues . . . . . . . . . . . . . . . . . . . . . . . . . . . . . . . . . . . . . . . . 160,470 383,137
Total revenues . . . . . . . . . . . . . . . . . . . . . . . . . . . . . . . . . . . . . . . 1,822,761 3,662,641
(Wendy’s/Arby’s)Operating loss . . . . . . . . . . . . . . . . . . . . . . . . . . . . . . . . . . . . . . . . . . . . (413,650) (392,854)Net loss . . . . . . . . . . . . . . . . . . . . . . . . . . . . . . . . . . . . . . . . . . . . . . . . (479,741) (492,026)Basic and diluted loss per share:
Common Stock . . . . . . . . . . . . . . . . . . . . . . . . . . . . . . . . . . . . . . (3.05) (1.05)Class B common stock . . . . . . . . . . . . . . . . . . . . . . . . . . . . . . . . . (1.24) N/A
(Wendy’s/Arby’s Restaurants)Operating loss . . . . . . . . . . . . . . . . . . . . . . . . . . . . . . . . . . . . . . . . . . . . (364,516) (343,719)Net loss . . . . . . . . . . . . . . . . . . . . . . . . . . . . . . . . . . . . . . . . . . . . . . . . (365,086) (377,371)
This unaudited pro forma information is provided for informational purposes only and does not purport to beindicative of the results of operations that would have occurred if the merger had been completed on the date set forthabove, nor is it necessarily indicative of the future operating results of the combined company. The As Reported andAs Adjusted amounts include the effect of $84,231 of Special Committee costs incurred by Wendy’s before the dateof the Wendy’s Merger in 2008. The As Adjusted loss per share data for 2008 assumes that the conversion of allClass B common stock to Common Stock occurred prior to 2008.
Other Restaurant Acquisitions and Dispositions
During the year ended January 2, 2011, the Companies received proceeds from dispositions of $5,660consisting of $2,332 from the sale of two company-owned Wendy’s restaurants and 11 company-owned Arby’srestaurants to franchisees of the respective brands, $1,231 from the sale of land and a building related to the exerciseof a purchase option by a franchisee, $227 from the sale of surplus properties, and $1,870 related to otherdispositions. These sales resulted in a net loss of $35, which is included in “Depreciation and amortization.”
During the year ended January 3, 2010, the Companies received proceeds from dispositions of $10,882consisting of $5,045 from the sale of twelve Wendy’s units to a franchisee, $4,529 from the sale of surplus propertiesand $1,308 related to other dispositions. These sales resulted in a net gain of $1,203 which is included as an offset to“Depreciation and amortization.”
The Companies completed the acquisitions of the operating assets, net of liabilities assumed, of 45 Arby’sfranchised restaurants, including 41 restaurants in the California market, in two separate transactions during fiscal2008. The total net consideration for acquisitions, including deal costs, was $15,861 consisting of (1) $9,622 of cashand (2) the assumption of $6,239 of debt.
Other restaurant acquisitions and dispositions during the periods presented were not significant.
92

WENDY’S/ARBY’S GROUP, INC. AND SUBSIDIARIESWENDY’S/ARBY’S RESTAURANTS, LLC AND SUBSIDIARIES
COMBINED NOTES TO CONSOLIDATED FINANCIAL STATEMENTS—CONTINUED(In Thousands Except Per Share Amounts)
(3) DFR Notes
(Wendy’s/Arby’s)
On December 21, 2007, Wendy’s/Arby’s sold its 63.6% capital interest in Deerfield & Company, LLC(“Deerfield”), an asset management business and a subsidiary of the Company until its sale, to DFR (the “DeerfieldSale”). The Deerfield Sale resulted in non-cash proceeds to the Company aggregating approximately $134,608consisting of (1) 9,629 convertible preferred shares (the “Preferred Stock”) of a subsidiary of DFR with an estimatedfair value of $88,398 at the date of the Deerfield Sale and (2) $47,986 principal amount of the DFR Notes due inDecember 2012 with an estimated fair value of $46,210 at the date of the Deerfield Sale.
A portion of the gain on the Deerfield Sale ($6,945) could not be recognized at the sale date due to theCompany’s approximate 15% (at December 31, 2007) continuing interest in DFR through its ownership in thePreferred Stock, on an as-if converted basis, and common stock of DFR it already owned. Certain former officers ofWendy’s/Arby’s had an approximate 1.5% ownership interest in DFR as of December 30, 2007. We accounted forthe DFR Preferred Stock as an available-for-sale debt security due to their mandatory redemption requirement.
On March 11, 2008, DFR stockholders approved the one-for-one conversion of all its outstanding convertiblepreferred stock into DFR common stock which converted the Preferred Stock we held into a like number of shares ofDFR common stock. On March 11, 2008, our Board of Directors approved the distribution of our shares of DFRcommon stock to our stockholders. The distribution in the form of a dividend, which was valued at $14,464, waspaid in 2008 to holders of record of our then outstanding Class A common stock and Class B common stock.
In March 2008, in response to unanticipated credit and liquidity events in the first quarter of 2008, DFRannounced that it was repositioning its investment portfolio to focus on agency-only residential mortgage-backedsecurities and away from its principal investing segment to its asset management segment with its fee-based revenuestreams. In addition, it stated that during the first quarter of 2008, its portfolio was adversely impacted bydeterioration of the global credit markets and, as a result, it sold $2,800,000 of its agency and $1,300,000 of itsAAA-rated non-agency mortgage-backed securities and reduced the net notional amount of interest rate swaps used tohedge a portion of its mortgage-backed securities by $4,200,000, all at a net after-tax loss of $294,300 to DFR.
Based on the events described above and their negative effect on the market price of DFR common stock, weconcluded that the fair value and, therefore, the carrying value of our investment in the DFR common shares wasimpaired. As a result, as of March 11, 2008 we recorded an other than temporary loss which is included in “Otherthan temporary losses on investments” for the year ended December 28, 2008 of $67,594 (without tax benefit asdescribed below) which included $11,074 of pre-tax unrealized holding losses previously recorded as of December 30,2007 and which were included in “Accumulated other comprehensive income (loss).” These common shares wereconsidered available-for-sale securities due to the limited period they were to be held as of March 11, 2008 (the“Determination Date”) before the dividend distribution of the shares to our stockholders. We also recorded anadditional impairment charge, which is also included in “Other than temporary losses on investments” fromMarch 11, 2008 through the March 29, 2008 record date of the dividend of $492. As a result of the distribution, theincome tax loss that resulted from the decline in value of $68,086 is not deductible for income tax purposes and noincome tax benefit was recorded related to this loss.
Additionally, from December 31, 2007 through the Determination Date, we recorded approximately $754 ofequity in net losses of DFR which are included in “Other income (expense), net” for the year ended December 28,2008 related to our investment in the common shares of DFR already owned discussed above which were accountedfor under the equity method through the Determination Date.
During the fourth quarter of 2008, the Company recognized an allowance for collectability of $21,227 toreduce the then carrying amount of the DFR Notes to $24,983. On June 9, 2010, pursuant to a March 2010agreement between Wendy’s/Arby’s and DFR, the Company received cash proceeds of $31,330, including interest, inconsideration for the repayment and cancellation of the DFR Notes. The proceeds represented 64.1% of the $47,986
93

WENDY’S/ARBY’S GROUP, INC. AND SUBSIDIARIESWENDY’S/ARBY’S RESTAURANTS, LLC AND SUBSIDIARIES
COMBINED NOTES TO CONSOLIDATED FINANCIAL STATEMENTS—CONTINUED(In Thousands Except Per Share Amounts)
aggregate principal amount of the DFR Notes. We recognized income of $4,909 during the year ended January 2,2011 as the repayment proceeds exceeded the carrying value of the DFR Notes. This gain is included in “Investmentincome (expense), net.”
(4) Income (Loss) Per Share
(Wendy’s/Arby’s)
Basic income (loss) per share for 2010 and 2009 was computed by dividing net income (loss) by the weightedaverage number of common shares outstanding. Prior to the Wendy’s Merger, the Company had Class B commonstock which was converted to Class A common stock and is now referred to as “Common Stock” as discussed inNote 2.
The number of shares used to calculate basic and diluted income (loss) per share was as follows:
2010 2009 2008
Common Stock:Basic shares—weighted average shares outstanding . . . . . . . . . . . 426,247 466,204 137,669Dilutive effect of stock options and restricted shares . . . . . . . . . . — 483 —
Diluted shares . . . . . . . . . . . . . . . . . . . . . . . . . . . . . . . . . . . . . . . 426,247 466,687 137,669
Class B common stock:Basic shares—weighted average shares outstanding . . . . . . . . . . . 47,965 (a)Dilutive effect of stock options and restricted shares . . . . . . . . . . —
Diluted shares . . . . . . . . . . . . . . . . . . . . . . . . . . . . . . . . . . . . . . . 47,965
(a) Represents the weighted average for the full year even though the Class B common stock was converted intoCommon Stock on September 29, 2008.
Basic loss per share for 2008 was computed by dividing the allocated loss for the Company’s Class A commonstock and the Company’s Class B common stock by the weighted average number of shares of each class. Net loss for2008 was allocated equally among each share of our Class A common stock and Class B common stock up until thedate of the Conversion; subsequent to the Conversion, net loss was only allocated to our Common Stock sinceClass B common stock no longer existed.
Diluted income per share for 2009 was computed by dividing income for our Common Stock by the weightedaverage number of shares outstanding plus the potential common share effect of dilutive stock options and ofrestricted shares, computed using the treasury stock method. Options and restricted shares to purchase 17,194 ofcommon shares were excluded from the calculation of the 2009 diluted earnings per share because they were anti-dilutive. Diluted loss per share for 2010 and 2008 was the same as basic loss per share for each share since theCompany reported a net loss and, therefore, the effect of all potentially dilutive securities on the net loss per sharewould have been antidilutive. The shares used to calculate diluted income per share exclude any effect of theCompany’s 5% convertible notes due 2023 (the “Convertible Notes”) which would have been antidilutive since theafter-tax interest on the Convertible Notes per share obtainable on conversion exceeded the reported basic incomefrom continuing operations per share.
As of January 2, 2011, our potential common shares consisted of the following: (1) outstanding stock optionswhich can be exercised into 28,074 shares of our Common Stock and (2) 3,092 restricted shares of our CommonStock.
94
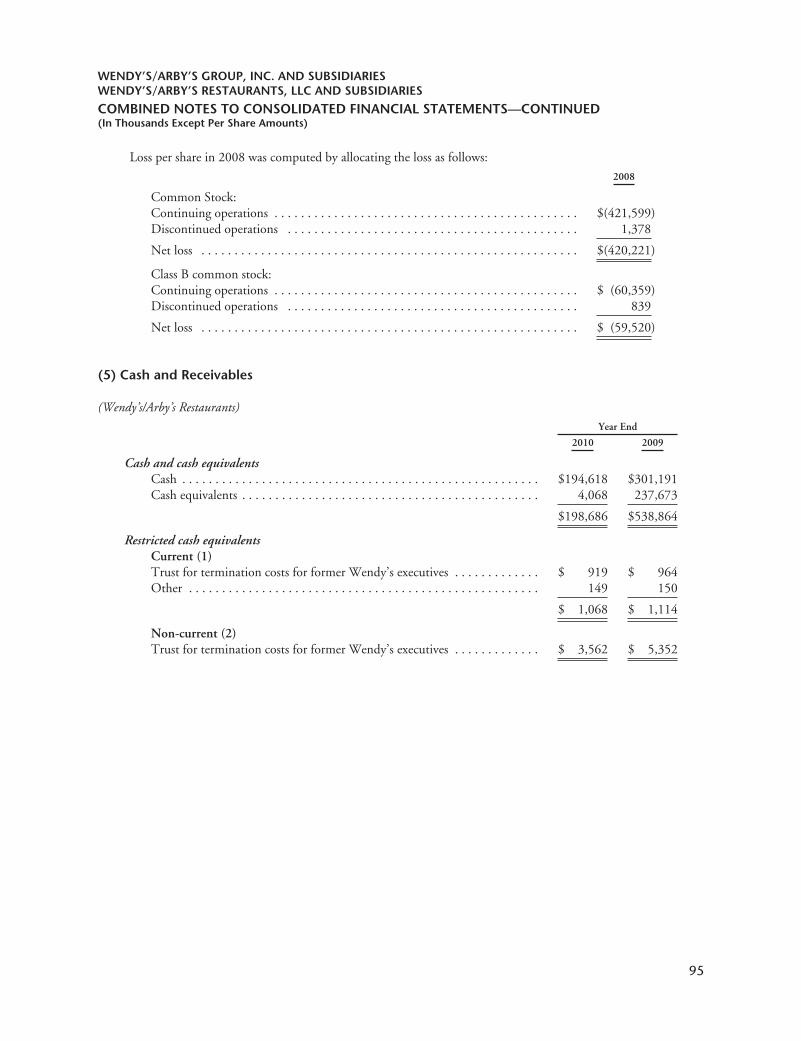
WENDY’S/ARBY’S GROUP, INC. AND SUBSIDIARIESWENDY’S/ARBY’S RESTAURANTS, LLC AND SUBSIDIARIES
COMBINED NOTES TO CONSOLIDATED FINANCIAL STATEMENTS—CONTINUED(In Thousands Except Per Share Amounts)
Loss per share in 2008 was computed by allocating the loss as follows:2008
Common Stock:Continuing operations . . . . . . . . . . . . . . . . . . . . . . . . . . . . . . . . . . . . . . . . . . . . . . $(421,599)Discontinued operations . . . . . . . . . . . . . . . . . . . . . . . . . . . . . . . . . . . . . . . . . . . . 1,378
Net loss . . . . . . . . . . . . . . . . . . . . . . . . . . . . . . . . . . . . . . . . . . . . . . . . . . . . . . . . . $(420,221)
Class B common stock:Continuing operations . . . . . . . . . . . . . . . . . . . . . . . . . . . . . . . . . . . . . . . . . . . . . . $ (60,359)Discontinued operations . . . . . . . . . . . . . . . . . . . . . . . . . . . . . . . . . . . . . . . . . . . . 839
Net loss . . . . . . . . . . . . . . . . . . . . . . . . . . . . . . . . . . . . . . . . . . . . . . . . . . . . . . . . . $ (59,520)
(5) Cash and Receivables
(Wendy’s/Arby’s Restaurants)Year End
2010 2009
Cash and cash equivalentsCash . . . . . . . . . . . . . . . . . . . . . . . . . . . . . . . . . . . . . . . . . . . . . . . . . . . . . . $194,618 $301,191Cash equivalents . . . . . . . . . . . . . . . . . . . . . . . . . . . . . . . . . . . . . . . . . . . . . 4,068 237,673
$198,686 $538,864
Restricted cash equivalentsCurrent (1)Trust for termination costs for former Wendy’s executives . . . . . . . . . . . . . $ 919 $ 964Other . . . . . . . . . . . . . . . . . . . . . . . . . . . . . . . . . . . . . . . . . . . . . . . . . . . . . 149 150
$ 1,068 $ 1,114
Non-current (2)Trust for termination costs for former Wendy’s executives . . . . . . . . . . . . . $ 3,562 $ 5,352
95
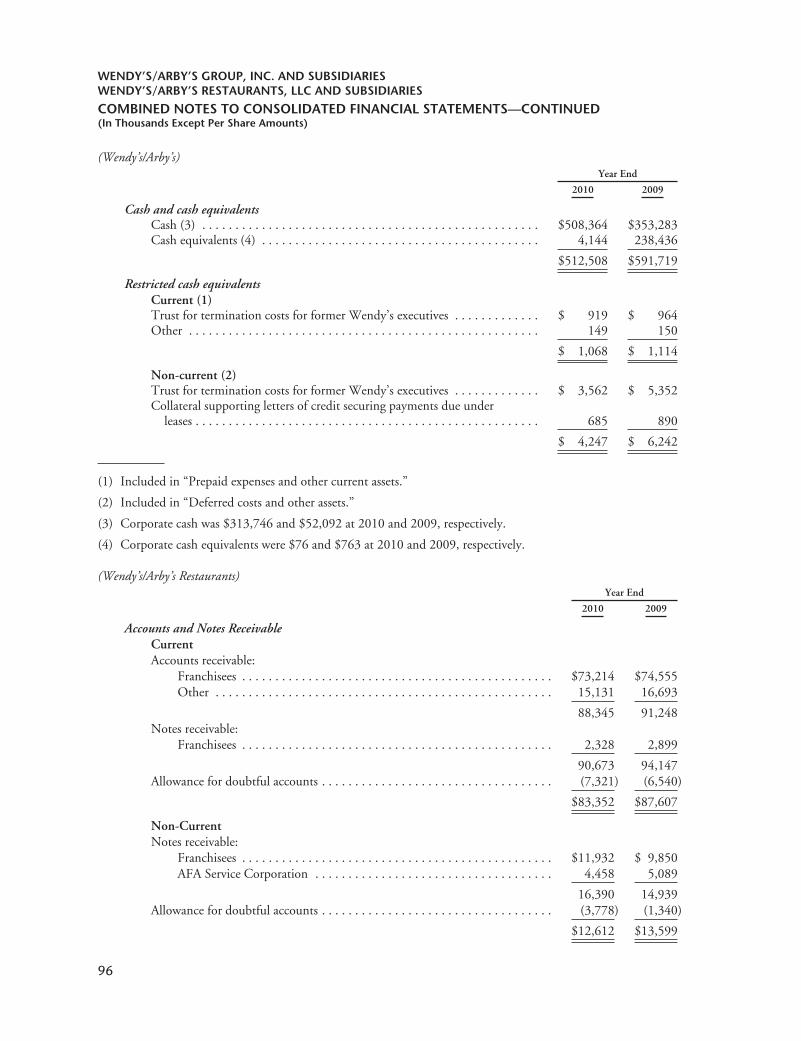
WENDY’S/ARBY’S GROUP, INC. AND SUBSIDIARIESWENDY’S/ARBY’S RESTAURANTS, LLC AND SUBSIDIARIES
COMBINED NOTES TO CONSOLIDATED FINANCIAL STATEMENTS—CONTINUED(In Thousands Except Per Share Amounts)
(Wendy’s/Arby’s)Year End
2010 2009
Cash and cash equivalentsCash (3) . . . . . . . . . . . . . . . . . . . . . . . . . . . . . . . . . . . . . . . . . . . . . . . . . . . $508,364 $353,283Cash equivalents (4) . . . . . . . . . . . . . . . . . . . . . . . . . . . . . . . . . . . . . . . . . . 4,144 238,436
$512,508 $591,719
Restricted cash equivalentsCurrent (1)Trust for termination costs for former Wendy’s executives . . . . . . . . . . . . . $ 919 $ 964Other . . . . . . . . . . . . . . . . . . . . . . . . . . . . . . . . . . . . . . . . . . . . . . . . . . . . . 149 150
$ 1,068 $ 1,114
Non-current (2)Trust for termination costs for former Wendy’s executives . . . . . . . . . . . . . $ 3,562 $ 5,352Collateral supporting letters of credit securing payments due under
leases . . . . . . . . . . . . . . . . . . . . . . . . . . . . . . . . . . . . . . . . . . . . . . . . . . . . 685 890
$ 4,247 $ 6,242
(1) Included in “Prepaid expenses and other current assets.”
(2) Included in “Deferred costs and other assets.”
(3) Corporate cash was $313,746 and $52,092 at 2010 and 2009, respectively.
(4) Corporate cash equivalents were $76 and $763 at 2010 and 2009, respectively.
(Wendy’s/Arby’s Restaurants)Year End
2010 2009
Accounts and Notes ReceivableCurrentAccounts receivable:
Franchisees . . . . . . . . . . . . . . . . . . . . . . . . . . . . . . . . . . . . . . . . . . . . . . . $73,214 $74,555Other . . . . . . . . . . . . . . . . . . . . . . . . . . . . . . . . . . . . . . . . . . . . . . . . . . . 15,131 16,693
88,345 91,248Notes receivable:
Franchisees . . . . . . . . . . . . . . . . . . . . . . . . . . . . . . . . . . . . . . . . . . . . . . . 2,328 2,899
90,673 94,147Allowance for doubtful accounts . . . . . . . . . . . . . . . . . . . . . . . . . . . . . . . . . . . (7,321) (6,540)
$83,352 $87,607
Non-CurrentNotes receivable:
Franchisees . . . . . . . . . . . . . . . . . . . . . . . . . . . . . . . . . . . . . . . . . . . . . . . $11,932 $ 9,850AFA Service Corporation . . . . . . . . . . . . . . . . . . . . . . . . . . . . . . . . . . . . 4,458 5,089
16,390 14,939Allowance for doubtful accounts . . . . . . . . . . . . . . . . . . . . . . . . . . . . . . . . . . . (3,778) (1,340)
$12,612 $13,599
96

WENDY’S/ARBY’S GROUP, INC. AND SUBSIDIARIESWENDY’S/ARBY’S RESTAURANTS, LLC AND SUBSIDIARIES
COMBINED NOTES TO CONSOLIDATED FINANCIAL STATEMENTS—CONTINUED(In Thousands Except Per Share Amounts)
(Wendy’s/Arby’s)Year End
2010 2009
Accounts and Notes ReceivableCurrentAccounts receivable:
Franchisees . . . . . . . . . . . . . . . . . . . . . . . . . . . . . . . . . . . . . . . . . . . . . . $73,214 $ 74,555Other . . . . . . . . . . . . . . . . . . . . . . . . . . . . . . . . . . . . . . . . . . . . . . . . . . 16,037 17,090
89,251 91,645Notes receivable:
Franchisees . . . . . . . . . . . . . . . . . . . . . . . . . . . . . . . . . . . . . . . . . . . . . . 2,328 2,899
91,579 94,544Allowance for doubtful accounts . . . . . . . . . . . . . . . . . . . . . . . . . . . . . . . . . . (7,321) (6,540)
$84,258 $ 88,004
Non-CurrentNotes receivable:
DFR . . . . . . . . . . . . . . . . . . . . . . . . . . . . . . . . . . . . . . . . . . . . . . . . . . . $ — $ 46,922Franchisees . . . . . . . . . . . . . . . . . . . . . . . . . . . . . . . . . . . . . . . . . . . . . . 11,932 9,850AFA Service Corporation . . . . . . . . . . . . . . . . . . . . . . . . . . . . . . . . . . . 4,458 5,089
16,390 61,861Allowance for doubtful accounts . . . . . . . . . . . . . . . . . . . . . . . . . . . . . . . . . . (3,778) (22,566)
$12,612 $ 39,295
The following is an analysis of the allowance for doubtful accounts:Wendy’s/Arby’s
2010 2009 2008
Balance at beginning of year:Current . . . . . . . . . . . . . . . . . . . . . . . . . . . . . . . . . . . . . . . . . . . $ 6,540 $ 887 $ 166Non-current . . . . . . . . . . . . . . . . . . . . . . . . . . . . . . . . . . . . . . . . 22,566 21,804 354
Provision for doubtful accounts:DFR Notes (see Notes 3 and 19) . . . . . . . . . . . . . . . . . . . . . . . . (21,227) — 21,227Franchisees . . . . . . . . . . . . . . . . . . . . . . . . . . . . . . . . . . . . . . . . . 9,694 8,342 783Other . . . . . . . . . . . . . . . . . . . . . . . . . . . . . . . . . . . . . . . . . . . . . — (173) (113)
Uncollectible accounts written off, net of recoveries . . . . . . . . . . . . . . (6,474) (1,754) 274
Balance at end of year:Current . . . . . . . . . . . . . . . . . . . . . . . . . . . . . . . . . . . . . . . . . . . 7,321 6,540 887Non-current . . . . . . . . . . . . . . . . . . . . . . . . . . . . . . . . . . . . . . . . 3,778 22,566 21,804
Total . . . . . . . . . . . . . . . . . . . . . . . . . . . . . . . . . . . . . . . . . . . . . $ 11,099 $29,106 $22,691
97
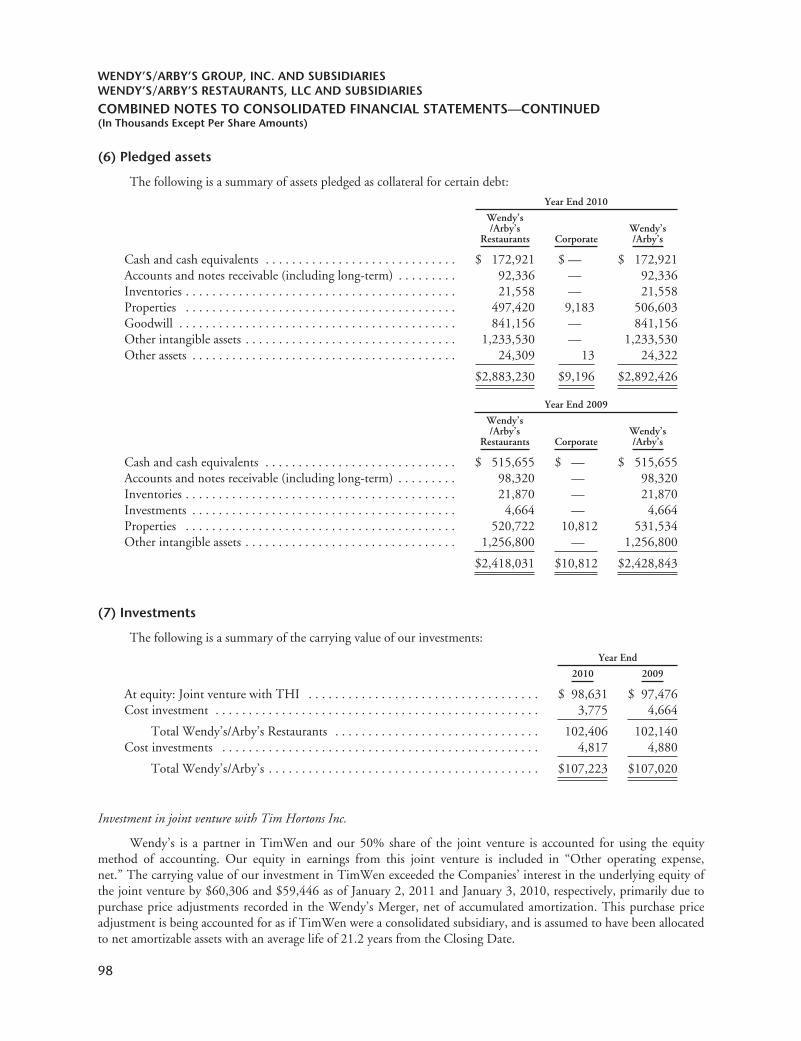
WENDY’S/ARBY’S GROUP, INC. AND SUBSIDIARIESWENDY’S/ARBY’S RESTAURANTS, LLC AND SUBSIDIARIES
COMBINED NOTES TO CONSOLIDATED FINANCIAL STATEMENTS—CONTINUED(In Thousands Except Per Share Amounts)
(6) Pledged assets
The following is a summary of assets pledged as collateral for certain debt:
Year End 2010
Wendy’s/Arby’s
Restaurants CorporateWendy’s/Arby’s
Cash and cash equivalents . . . . . . . . . . . . . . . . . . . . . . . . . . . . . $ 172,921 $ — $ 172,921Accounts and notes receivable (including long-term) . . . . . . . . . 92,336 — 92,336Inventories . . . . . . . . . . . . . . . . . . . . . . . . . . . . . . . . . . . . . . . . . 21,558 — 21,558Properties . . . . . . . . . . . . . . . . . . . . . . . . . . . . . . . . . . . . . . . . . 497,420 9,183 506,603Goodwill . . . . . . . . . . . . . . . . . . . . . . . . . . . . . . . . . . . . . . . . . . 841,156 — 841,156Other intangible assets . . . . . . . . . . . . . . . . . . . . . . . . . . . . . . . . 1,233,530 — 1,233,530Other assets . . . . . . . . . . . . . . . . . . . . . . . . . . . . . . . . . . . . . . . . 24,309 13 24,322
$2,883,230 $9,196 $2,892,426
Year End 2009
Wendy’s/Arby’s
Restaurants CorporateWendy’s/Arby’s
Cash and cash equivalents . . . . . . . . . . . . . . . . . . . . . . . . . . . . . $ 515,655 $ — $ 515,655Accounts and notes receivable (including long-term) . . . . . . . . . 98,320 — 98,320Inventories . . . . . . . . . . . . . . . . . . . . . . . . . . . . . . . . . . . . . . . . . 21,870 — 21,870Investments . . . . . . . . . . . . . . . . . . . . . . . . . . . . . . . . . . . . . . . . 4,664 — 4,664Properties . . . . . . . . . . . . . . . . . . . . . . . . . . . . . . . . . . . . . . . . . 520,722 10,812 531,534Other intangible assets . . . . . . . . . . . . . . . . . . . . . . . . . . . . . . . . 1,256,800 — 1,256,800
$2,418,031 $10,812 $2,428,843
(7) Investments
The following is a summary of the carrying value of our investments:
Year End
2010 2009
At equity: Joint venture with THI . . . . . . . . . . . . . . . . . . . . . . . . . . . . . . . . . . . $ 98,631 $ 97,476Cost investment . . . . . . . . . . . . . . . . . . . . . . . . . . . . . . . . . . . . . . . . . . . . . . . . . 3,775 4,664
Total Wendy’s/Arby’s Restaurants . . . . . . . . . . . . . . . . . . . . . . . . . . . . . . . 102,406 102,140Cost investments . . . . . . . . . . . . . . . . . . . . . . . . . . . . . . . . . . . . . . . . . . . . . . . . 4,817 4,880
Total Wendy’s/Arby’s . . . . . . . . . . . . . . . . . . . . . . . . . . . . . . . . . . . . . . . . . $107,223 $107,020
Investment in joint venture with Tim Hortons Inc.
Wendy’s is a partner in TimWen and our 50% share of the joint venture is accounted for using the equitymethod of accounting. Our equity in earnings from this joint venture is included in “Other operating expense,net.” The carrying value of our investment in TimWen exceeded the Companies’ interest in the underlying equity ofthe joint venture by $60,306 and $59,446 as of January 2, 2011 and January 3, 2010, respectively, primarily due topurchase price adjustments recorded in the Wendy’s Merger, net of accumulated amortization. This purchase priceadjustment is being accounted for as if TimWen were a consolidated subsidiary, and is assumed to have been allocatedto net amortizable assets with an average life of 21.2 years from the Closing Date.
98

WENDY’S/ARBY’S GROUP, INC. AND SUBSIDIARIESWENDY’S/ARBY’S RESTAURANTS, LLC AND SUBSIDIARIES
COMBINED NOTES TO CONSOLIDATED FINANCIAL STATEMENTS—CONTINUED(In Thousands Except Per Share Amounts)
Presented below is activity related to our portion of TimWen included in our consolidated balance sheets andconsolidated statements of operations as of and for the years ended January 2, 2011 and January 3, 2010 and thequarter ended December 28, 2008.
2010 2009 2008
Balance at beginning of period . . . . . . . . . . . . . . . . . . . . . . . . . . . . $ 97,476 $ 89,771 $ 41,649Purchase price adjustments . . . . . . . . . . . . . . . . . . . . . . . . . . . . . . . — — 65,455
97,476 89,771 107,104
Equity in net earnings for the period . . . . . . . . . . . . . . . . . . . . . . . . 12,316 11,334 2,630Amortization of purchase price adjustments . . . . . . . . . . . . . . . . . . (2,857) (2,835) (656)
9,459 8,499 1,974
Distributions . . . . . . . . . . . . . . . . . . . . . . . . . . . . . . . . . . . . . . . . . . (13,980) (14,583) (2,864)Currency translation adjustment included in “Comprehensive
income (loss)” . . . . . . . . . . . . . . . . . . . . . . . . . . . . . . . . . . . . . . . 5,676 13,789 (16,443)
Balance at end of period . . . . . . . . . . . . . . . . . . . . . . . . . . . . . . . . . $ 98,631 $ 97,476 $ 89,771
Presented below is a summary of financial information of TimWen as of and for the years and quarter endedJanuary 2, 2011, January 3, 2010 and December 28, 2008, respectively, in Canadian dollars. The summary balancesheet financial information does not distinguish between current and long-term assets and liabilities:
Year End
January 2,2011
January 3,2010
Balance sheet information:Properties . . . . . . . . . . . . . . . . . . . . . . . . . . . . . . . . . . . . . . . . . . . . . . . . . C$78,769 C$83,078Cash and cash equivalents . . . . . . . . . . . . . . . . . . . . . . . . . . . . . . . . . . . . . 1,639 75Accounts receivable . . . . . . . . . . . . . . . . . . . . . . . . . . . . . . . . . . . . . . . . . . 4,529 4,989Other . . . . . . . . . . . . . . . . . . . . . . . . . . . . . . . . . . . . . . . . . . . . . . . . . . . . 3,001 3,150
C$87,938 C$91,292
Accounts payable and accrued liabilities . . . . . . . . . . . . . . . . . . . . . . . . . . C$ 2,169 C$ 2,257Other liabilities . . . . . . . . . . . . . . . . . . . . . . . . . . . . . . . . . . . . . . . . . . . . . 9,339 9,081Partners’ equity . . . . . . . . . . . . . . . . . . . . . . . . . . . . . . . . . . . . . . . . . . . . . 76,430 79,954
C$87,938 C$91,292
Quarter endedDecember 28,
20082010 2009
Income statement information:Revenues . . . . . . . . . . . . . . . . . . . . . . . . . . . . . . . . . . . . . C$38,361 C$38,471 C$9,462Income before income taxes and net income . . . . . . . . . . . 24,976 27,532 6,325
(Wendy’s/Arby’s)
Investment in Jurlique International Pty Ltd.
We account for our approximately 11% investment in Jurlique International Pty Ltd. (“Jurlique”) (anAustralian manufacturer and multi-channel global marketer, which sells a high-end series of natural skincare productsin certain department stores, duty-free shops, company and franchised locations) under the cost method since ourvoting interest does not provide us the ability to exercise significant influence over Jurlique’s operational and financialpolicies. Jurlique was affected by the global economic recession leading to lower than anticipated sales and margins.
99
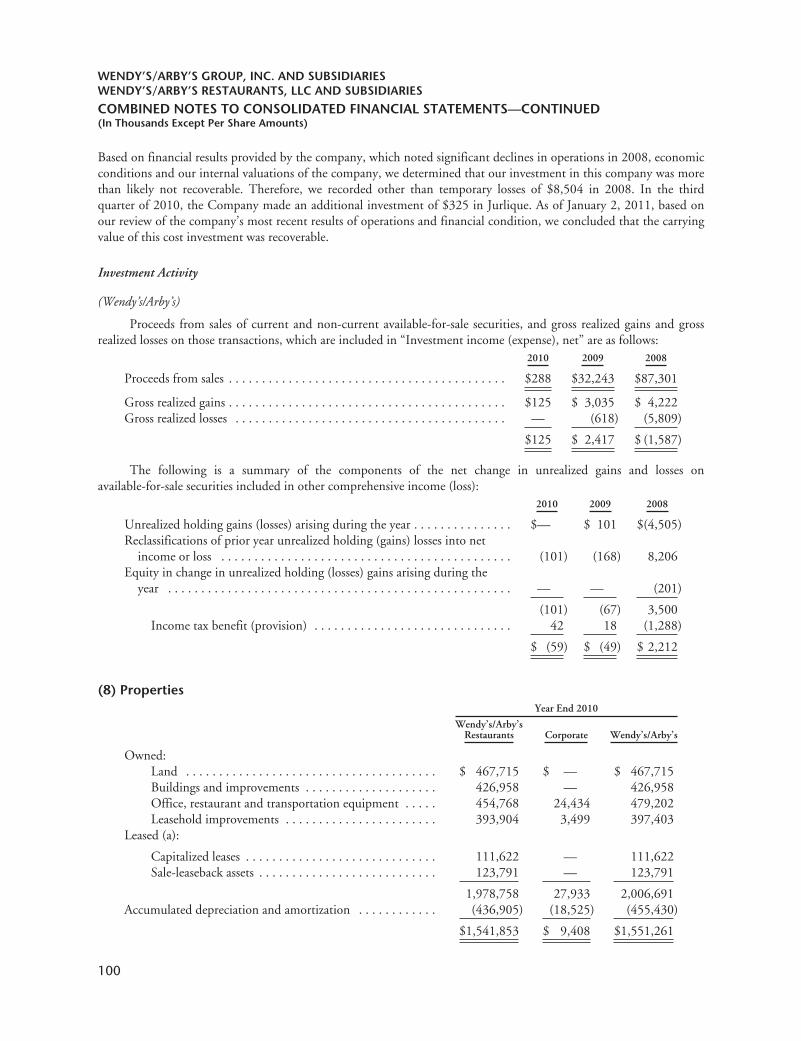
WENDY’S/ARBY’S GROUP, INC. AND SUBSIDIARIESWENDY’S/ARBY’S RESTAURANTS, LLC AND SUBSIDIARIES
COMBINED NOTES TO CONSOLIDATED FINANCIAL STATEMENTS—CONTINUED(In Thousands Except Per Share Amounts)
Based on financial results provided by the company, which noted significant declines in operations in 2008, economicconditions and our internal valuations of the company, we determined that our investment in this company was morethan likely not recoverable. Therefore, we recorded other than temporary losses of $8,504 in 2008. In the thirdquarter of 2010, the Company made an additional investment of $325 in Jurlique. As of January 2, 2011, based onour review of the company’s most recent results of operations and financial condition, we concluded that the carryingvalue of this cost investment was recoverable.
Investment Activity
(Wendy’s/Arby’s)
Proceeds from sales of current and non-current available-for-sale securities, and gross realized gains and grossrealized losses on those transactions, which are included in “Investment income (expense), net” are as follows:
2010 2009 2008
Proceeds from sales . . . . . . . . . . . . . . . . . . . . . . . . . . . . . . . . . . . . . . . . . . $288 $32,243 $87,301
Gross realized gains . . . . . . . . . . . . . . . . . . . . . . . . . . . . . . . . . . . . . . . . . . $125 $ 3,035 $ 4,222Gross realized losses . . . . . . . . . . . . . . . . . . . . . . . . . . . . . . . . . . . . . . . . . — (618) (5,809)
$125 $ 2,417 $ (1,587)
The following is a summary of the components of the net change in unrealized gains and losses onavailable-for-sale securities included in other comprehensive income (loss):
2010 2009 2008
Unrealized holding gains (losses) arising during the year . . . . . . . . . . . . . . . $— $ 101 $(4,505)Reclassifications of prior year unrealized holding (gains) losses into net
income or loss . . . . . . . . . . . . . . . . . . . . . . . . . . . . . . . . . . . . . . . . . . . . (101) (168) 8,206Equity in change in unrealized holding (losses) gains arising during the
year . . . . . . . . . . . . . . . . . . . . . . . . . . . . . . . . . . . . . . . . . . . . . . . . . . . . — — (201)
(101) (67) 3,500Income tax benefit (provision) . . . . . . . . . . . . . . . . . . . . . . . . . . . . . . 42 18 (1,288)
$ (59) $ (49) $ 2,212
(8) PropertiesYear End 2010
Wendy’s/Arby’sRestaurants Corporate Wendy’s/Arby’s
Owned:Land . . . . . . . . . . . . . . . . . . . . . . . . . . . . . . . . . . . . . . $ 467,715 $ — $ 467,715Buildings and improvements . . . . . . . . . . . . . . . . . . . . 426,958 — 426,958Office, restaurant and transportation equipment . . . . . 454,768 24,434 479,202Leasehold improvements . . . . . . . . . . . . . . . . . . . . . . . 393,904 3,499 397,403
Leased (a):
Capitalized leases . . . . . . . . . . . . . . . . . . . . . . . . . . . . . 111,622 — 111,622Sale-leaseback assets . . . . . . . . . . . . . . . . . . . . . . . . . . . 123,791 — 123,791
1,978,758 27,933 2,006,691Accumulated depreciation and amortization . . . . . . . . . . . . (436,905) (18,525) (455,430)
$1,541,853 $ 9,408 $1,551,261
100

WENDY’S/ARBY’S GROUP, INC. AND SUBSIDIARIESWENDY’S/ARBY’S RESTAURANTS, LLC AND SUBSIDIARIES
COMBINED NOTES TO CONSOLIDATED FINANCIAL STATEMENTS—CONTINUED(In Thousands Except Per Share Amounts)
Year End 2009
Wendy’s/Arby’sRestaurants Corporate Wendy’s/Arby’s
Owned:Land . . . . . . . . . . . . . . . . . . . . . . . . . . . . . . . . . . . . . . $ 467,249 $ — $ 467,249Buildings and improvements . . . . . . . . . . . . . . . . . . . . 411,671 — 411,671Office, restaurant and transportation equipment . . . . . 411,391 24,433 435,824Leasehold improvements . . . . . . . . . . . . . . . . . . . . . . . 402,755 3,499 406,254
Leased (a):Capitalized leases . . . . . . . . . . . . . . . . . . . . . . . . . . . . . 110,363 — 110,363Sale-leaseback assets . . . . . . . . . . . . . . . . . . . . . . . . . . . 134,648 — 134,648
1,938,077 27,932 1,966,009Accumulated depreciation and amortization . . . . . . . . . . . . (330,219) (16,542) (346,761)
$1,607,858 $ 11,390 $1,619,248
(a) These assets principally include buildings and improvements.
(9) Goodwill and Other Intangible Assets
The following is a summary of the components of goodwill for each business segment:2010 2009
Arby’sRestaurantSegment
Wendy’sRestaurantSegment Total
Arby’sRestaurantSegment
Wendy’sRestaurantSegment Total
Balance at beginning of year:Goodwill . . . . . . . . . . . . . . . . . . $ 499,692 $868,679 $1,368,371 $ 499,692 $841,435 $1,341,127Accumulated impairment
losses . . . . . . . . . . . . . . . . . . . (482,075) — (482,075) (482,075) — (482,075)
Total Wendy’s/Arby’sRestaurants goodwill . . . . . . . 17,617 868,679 886,296 17,617 841,435 859,052
Corporate goodwill-relateddeferred tax adjustment . . . . . — (5,277) (5,277) — (5,277) (5,277)
Total Wendy’s/Arby’sgoodwill . . . . . . . . . . . . . 17,617 863,402 881,019 17,617 836,158 853,775
Changes in goodwill:Wendy’s Merger . . . . . . . . . . . . . — — — — 18,195 18,195Currency translation
adjustment . . . . . . . . . . . . . . . — 2,625 2,625 — 9,049 9,049
Balance at end of year:Goodwill . . . . . . . . . . . . . . . . . . 499,692 871,304 1,370,996 499,692 868,679 1,368,371Accumulated impairment
losses . . . . . . . . . . . . . . . . . . . (482,075) — (482,075) (482,075) — (482,075)
Total Wendy’s/Arby’sRestaurants goodwill . . . 17,617 871,304 888,921 17,617 868,679 886,296
Corporate goodwill-relateddeferred tax adjustment . . . . . — (5,277) (5,277) — (5,277) (5,277)
Total Wendy’s/Arby’sgoodwill . . . . . . . . . . . . . $ 17,617 $866,027 $ 883,644 $ 17,617 $863,402 $ 881,019
101

WENDY’S/ARBY’S GROUP, INC. AND SUBSIDIARIESWENDY’S/ARBY’S RESTAURANTS, LLC AND SUBSIDIARIES
COMBINED NOTES TO CONSOLIDATED FINANCIAL STATEMENTS—CONTINUED(In Thousands Except Per Share Amounts)
The following is a summary of the components of other intangible assets:Year End 2010 Year End 2009
CostAccumulatedAmortization Net Cost
AccumulatedAmortization Net
Non-amortizable:Wendy’s trademarks . . . . . . $ 903,000 $ — $ 903,000 $ 903,000 $ — $ 903,000
Amortizable:Franchise agreements . . . . . 353,771 38,077 315,694 352,630 21,148 331,482Favorable leases . . . . . . . . . . 134,445 27,867 106,578 144,683 20,627 124,056Reacquired rights under
franchise agreements . . . . 15,716 4,172 11,544 17,348 3,721 13,627Computer software . . . . . . . 39,649 17,891 21,758 32,150 11,432 20,718
$1,446,581 $88,007 $1,358,574 $1,449,811 $56,928 $1,392,883
Aggregate amortization expense:Actual for fiscal year (a):
2008 (b) . . . . . . . . . . . . . . . . . . . . . . . . . . . . . . . . . . . . . . . . . . . . . . . . . $ 13,4662009 . . . . . . . . . . . . . . . . . . . . . . . . . . . . . . . . . . . . . . . . . . . . . . . . . . . . 44,8372010 . . . . . . . . . . . . . . . . . . . . . . . . . . . . . . . . . . . . . . . . . . . . . . . . . . . . 45,720
Estimate for fiscal year:2011 . . . . . . . . . . . . . . . . . . . . . . . . . . . . . . . . . . . . . . . . . . . . . . . . . . . . $ 32,6542012 . . . . . . . . . . . . . . . . . . . . . . . . . . . . . . . . . . . . . . . . . . . . . . . . . . . . 31,1982013 . . . . . . . . . . . . . . . . . . . . . . . . . . . . . . . . . . . . . . . . . . . . . . . . . . . . 30,3742014 . . . . . . . . . . . . . . . . . . . . . . . . . . . . . . . . . . . . . . . . . . . . . . . . . . . . 29,0692015 . . . . . . . . . . . . . . . . . . . . . . . . . . . . . . . . . . . . . . . . . . . . . . . . . . . . 26,364Thereafter . . . . . . . . . . . . . . . . . . . . . . . . . . . . . . . . . . . . . . . . . . . . . . . . 305,915
(a) Includes $11,012, $7,674 and $1,096 of impairment charges related to other intangible assets in 2010, 2009 and2008, respectively, which have been recorded as a reduction in the cost basis of the related intangible asset.
(b) Wendy’s/Arby’s included additional amortization expense in 2008 of $4. This additional expense did not occurin any other year presented.
102

WENDY’S/ARBY’S GROUP, INC. AND SUBSIDIARIESWENDY’S/ARBY’S RESTAURANTS, LLC AND SUBSIDIARIES
COMBINED NOTES TO CONSOLIDATED FINANCIAL STATEMENTS—CONTINUED(In Thousands Except Per Share Amounts)
(10) Accrued ExpensesYear End 2010
Wendy’s/Arby’sRestaurants Corporate Wendy’s/Arby’s
Accrued compensation and related benefits . . . . . . . . . . . . . . $ 83,036 $ 111 $ 83,147Insurance reserves . . . . . . . . . . . . . . . . . . . . . . . . . . . . . . . . . 58,811 — 58,811Accrued taxes . . . . . . . . . . . . . . . . . . . . . . . . . . . . . . . . . . . . 38,081 (1,192) 36,889Accrued interest . . . . . . . . . . . . . . . . . . . . . . . . . . . . . . . . . . 29,901 62 29,963Other . . . . . . . . . . . . . . . . . . . . . . . . . . . . . . . . . . . . . . . . . . 34,471 1,876 36,347
$244,300 $ 857 $245,157
Year End 2009
Wendy’s/Arby’sRestaurants Corporate Wendy’s/Arby’s
Accrued compensation and related benefits . . . . . . . . . . . . . . $ 81,864 $ — $ 81,864Insurance reserves . . . . . . . . . . . . . . . . . . . . . . . . . . . . . . . . . 54,924 — 54,924Accrued taxes . . . . . . . . . . . . . . . . . . . . . . . . . . . . . . . . . . . . 40,952 (2,190) 38,762Accrued interest . . . . . . . . . . . . . . . . . . . . . . . . . . . . . . . . . . 34,283 286 34,569Other . . . . . . . . . . . . . . . . . . . . . . . . . . . . . . . . . . . . . . . . . . 56,158 2,813 58,971
$268,181 $ 909 $269,090
(11) Long-Term Debt
Long-term debt consisted of the following:Year End
2010 2009
Senior Notes, due in 2016 (a) . . . . . . . . . . . . . . . . . . . . . . . . . . . . . . . . . . . . $ 553,258 $ 551,779Term Loan, due in 2017 (b) . . . . . . . . . . . . . . . . . . . . . . . . . . . . . . . . . . . . . 495,226 —Senior secured term loan (b) . . . . . . . . . . . . . . . . . . . . . . . . . . . . . . . . . . . . . — 251,4886.20% senior notes, due in 2014 (c) . . . . . . . . . . . . . . . . . . . . . . . . . . . . . . . 217,855 204,3036.25% senior notes (b) . . . . . . . . . . . . . . . . . . . . . . . . . . . . . . . . . . . . . . . . . — 193,618Sale-leaseback obligations, due through 2029 . . . . . . . . . . . . . . . . . . . . . . . . 121,884 125,176Capitalized lease obligations, due through 2040 . . . . . . . . . . . . . . . . . . . . . . 86,670 89,8867% debentures, due in 2025 (d) . . . . . . . . . . . . . . . . . . . . . . . . . . . . . . . . . . 81,204 80,081Other . . . . . . . . . . . . . . . . . . . . . . . . . . . . . . . . . . . . . . . . . . . . . . . . . . . . . . 3,634 5,579
1,559,731 1,501,910Less amounts payable within one year . . . . . . . . . . . . . . . . . . . . . . . . . . . . . . (17,047) (16,178)
Total Wendy’s/Arby’s Restaurants long-term debt . . . . . . . . . . . . . . . . 1,542,684 1,485,7326.54% aircraft term loan, due in 2013 (e) . . . . . . . . . . . . . . . . . . . . . . . . . . . 12,671 18,9015% convertible notes (f) . . . . . . . . . . . . . . . . . . . . . . . . . . . . . . . . . . . . . . . . — 2,100Less amounts payable within one year . . . . . . . . . . . . . . . . . . . . . . . . . . . . . . (1,368) (5,949)
Total Wendy’s/Arby’s long-term debt . . . . . . . . . . . . . . . . . . . . . . . . . . $1,553,987 $1,500,784
103

WENDY’S/ARBY’S GROUP, INC. AND SUBSIDIARIESWENDY’S/ARBY’S RESTAURANTS, LLC AND SUBSIDIARIES
COMBINED NOTES TO CONSOLIDATED FINANCIAL STATEMENTS—CONTINUED(In Thousands Except Per Share Amounts)
Aggregate annual maturities of long-term debt, excluding the effect of purchase accounting adjustments,discounts and interest rate swaps, as of January 2, 2011 were as follows:
Fiscal YearWendy’s/Arby’s
Restaurants Corporate Wendy’s/Arby’s
2011 . . . . . . . . . . . . . . . . . . . . . . . . . . . . . . . . . . . . . . . . . . . $ 17,047 $ 1,368 $ 18,4152012 . . . . . . . . . . . . . . . . . . . . . . . . . . . . . . . . . . . . . . . . . . . 16,261 1,460 17,7212013 . . . . . . . . . . . . . . . . . . . . . . . . . . . . . . . . . . . . . . . . . . . 15,493 9,843 25,3362014 . . . . . . . . . . . . . . . . . . . . . . . . . . . . . . . . . . . . . . . . . . . 241,057 — 241,0572015 . . . . . . . . . . . . . . . . . . . . . . . . . . . . . . . . . . . . . . . . . . . 17,591 — 17,591Thereafter . . . . . . . . . . . . . . . . . . . . . . . . . . . . . . . . . . . . . . . 1,292,240 — 1,292,240
$1,599,689 $12,671 $1,612,360
(a) On June 23, 2009, Wendy’s/Arby’s Restaurants issued $565,000 principal amount of Senior Notes (the “SeniorNotes”). The Senior Notes will mature on July 15, 2016 and accrue interest at 10.00% per annum, payable semi-annually on January 15 and July 15, the first payment of which was made on January 15, 2010. The SeniorNotes were issued at 97.533% of the principal amount, representing a yield to maturity of 10.50% and resultingin net proceeds of $551,061. The $13,939 discount is being accreted and the related charge included in “Interestexpense” until the Senior Notes mature. The Senior Notes are fully and unconditionally guaranteed, jointly andseverally, on an unsecured basis by certain direct and indirect domestic subsidiaries of Wendy’s/Arby’sRestaurants (collectively, the “Guarantors”). Wendy’s/Arby’s Restaurants incurred approximately $21,599 incosts related to the issuance of the Senior Notes which are being amortized to “Interest expense” over the term ofthe Senior Notes utilizing the effective interest rate method.
An indenture for the Senior Notes dated as of June 23, 2009 (the “Indenture”) among Wendy’s/Arby’sRestaurants, the Guarantors and U.S. Bank National Association, as trustee (the “Trustee”), includes certaincustomary covenants that, subject to a number of important exceptions and qualifications, limit the ability ofWendy’s/Arby’s Restaurants and its restricted subsidiaries to, among other things, incur debt or issue preferred ordisqualified stock, pay dividends on equity interest, redeem or repurchase equity interests or prepay or repurchasesubordinated debt, make some types of investments and sell assets, incur certain liens, engage in transactions withaffiliates (except on an arms-length basis), and consolidate, merge or sell all or substantially all of their assets. Thecovenants generally do not restrict Wendy’s/Arby’s or any of Wendy’s/Arby’s subsidiaries which are notsubsidiaries of Wendy’s/Arby’s Restaurants.
(b) On May 24, 2010, Wendy’s/Arby’s Restaurants entered into a $650,000 Credit Agreement (the “CreditAgreement”), which includes a $500,000 senior secured term loan facility (the “Term Loan”) and a $150,000senior secured revolving credit facility (the “Credit Facility”). The Credit Agreement contains provisions for anuncommitted increase of up to $300,000 principal amount in the aggregate in the Credit Facility and/or TermLoan subject to the satisfaction of certain conditions. The Credit Facility includes a sub-facility for the issuance ofup to $70,000 of letters of credit. The obligations under the Credit Agreement are secured by substantially all ofthe non-real estate assets of Wendy’s/Arby’s Restaurants and its domestic subsidiaries (other than certainunrestricted subsidiaries), the stock of its domestic subsidiaries (other than certain unrestricted subsidiaries), 65%of the stock of certain of its foreign subsidiaries, as well as by mortgages on certain restaurant properties.
The Term Loan was issued at 99.5% of the principal amount, which represented an original issue discount of0.5% and resulted in net proceeds of $497,500. The $2,500 discount is being accreted and the related chargeincluded in interest expense through the maturity of the Term Loan. The Term Loan will mature on May 24,2017 and requires quarterly principal installments which commenced on September 30, 2010 equal to 1% perannum of the initial principal amount outstanding, with the balance payable on the maturity date.
Should our strategic alternatives for Arby’s result in a sale of the brand, we may be required to utilize a portion ofthe sale proceeds to reduce the Term Loan.
104

WENDY’S/ARBY’S GROUP, INC. AND SUBSIDIARIESWENDY’S/ARBY’S RESTAURANTS, LLC AND SUBSIDIARIES
COMBINED NOTES TO CONSOLIDATED FINANCIAL STATEMENTS—CONTINUED(In Thousands Except Per Share Amounts)
The Credit Facility expires not later than May 24, 2015. An unused commitment fee of 50 basis points perannum is payable quarterly on the average unused amount of the Credit Facility until the maturity date.
The interest rate on the Term Loan is based on the Eurodollar Rate as defined in the Credit Agreement (but notless than 1.50%), plus 3.50%, or a Base Rate, as defined in the Credit Agreement (but not less than 2.50%), plus2.50%. Since the inception of the Term Loan, we have elected to use the Eurodollar Rate, which resulted in aninterest rate on the Term Loan of 5.00% as of January 2, 2011.
The Companies incurred approximately $16,353 in costs related to the Credit Agreement, which is beingamortized to interest expense over the Term Loan’s term utilizing the effective interest rate method.
Proceeds from the Term Loan were used to (1) repay approximately $253,849 of existing indebtedness, includingfees and interest, under the then existing Wendy’s/Arby’s Restaurants amended senior secured term loan whichreplaced the prior Arby’s credit agreement in March 2009 and which was scheduled to be due in 2012, (2) redeemthe Wendy’s 6.25% senior notes scheduled to be due in 2011, and (3) pay fees and expenses related to the CreditAgreement. The remaining Term Loan proceeds were used for working capital and other general corporate purposes.
The Companies recognized a loss on early extinguishment of debt of $26,197 in the second quarter of 2010related to the repayment of debt from the proceeds of the Term Loan. This loss consisted of (1) a $14,953premium payment required to redeem the Wendy’s 6.25% senior notes, (2) $5,477 for the write-off of theunaccreted discount of the Wendy’s 6.25% senior notes (recorded in connection with the Wendy’s Merger), and(3) $5,767 for the write-off of deferred costs associated with the repayment of the prior senior secured term loan.
The affirmative and negative covenants in the Credit Agreement include, among others, preservation of corporateexistence; payment of taxes; and maintenance of insurance; and limitations on: indebtedness (including guaranteeobligations of other indebtedness); liens; mergers, consolidations, liquidations and dissolutions; sales of assets;dividends and other payments in respect of capital stock; investments; payments of certain indebtedness;transactions with affiliates; changes in fiscal year; negative pledge clauses and clauses restricting subsidiarydistributions; and material changes in lines of business. The financial covenants contained in the CreditAgreement are (i) a consolidated interest coverage ratio, (ii) a consolidated senior secured leverage ratio, and (iii) aconsolidated senior secured lease adjusted leverage ratio. The covenants generally do not restrict Wendy’s/Arby’sor any of Wendy’s/Arby’s subsidiaries that are not subsidiaries of Wendy’s/Arby’s Restaurants. Wendy’s/Arby’sRestaurants was in compliance with all covenants of the Credit Agreement as of January 2, 2011.
(c) Wendy’s 6.20% senior notes were reduced to fair value at the date of and in connection with the Wendy’sMerger based on outstanding principal of $225,000 and an effective interest rates of 7.0%. The fair valueadjustment is being accreted and the related charge included in “Interest expense” until the notes mature. Thevalue of the Wendy’s senior notes is adjusted to reflect the fair value of interest rate swaps associated with thisdebt. As of January 2, 2011 and January 3, 2010, this adjustment increased the value of the 6.20% senior notesby $9,623 and $682, respectively. These notes are unsecured and are redeemable prior to maturity at our option.The Wendy’s senior notes contain covenants that restrict the incurrence of indebtedness secured by liens and sale-leaseback transactions. Wendy’s was in compliance with these covenants as of January 2, 2011.
(d) Wendy’s 7% debentures are unsecured and were reduced to fair value at the date of and in connection with theWendy’s Merger based on their outstanding principal of $100,000 and an effective interest rate of 8.6%. The fairvalue adjustment is being accreted and the related charge included in “Interest expense” until the debenturesmature. These debentures contain covenants that restrict the incurrence of indebtedness secured by liens and sale-leaseback transactions. Wendy’s was in compliance with these covenants as of January 2, 2011.
(e) During 2008, Wendy’s/Arby’s entered into a $20,000 financing facility for an aircraft. The facility requiresmonthly payments, including interest, of approximately $180 through August 2013 with a final balloon paymentof approximately $10,180 due September 2013. During the first quarter of 2010, we made a $5,000 prepaymenton the loan. This loan is secured by an aircraft with a net book value of $9,183 and $10,812 as of January 2,2011 and January 3, 2010, respectively.
105
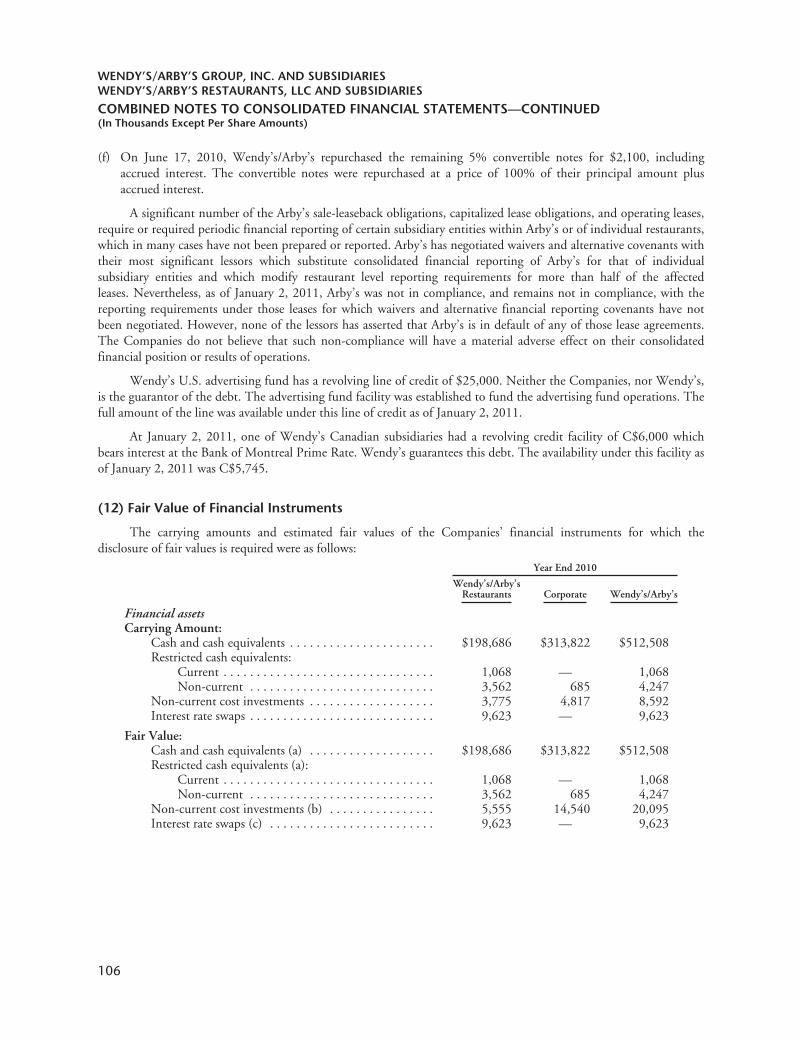
WENDY’S/ARBY’S GROUP, INC. AND SUBSIDIARIESWENDY’S/ARBY’S RESTAURANTS, LLC AND SUBSIDIARIES
COMBINED NOTES TO CONSOLIDATED FINANCIAL STATEMENTS—CONTINUED(In Thousands Except Per Share Amounts)
(f) On June 17, 2010, Wendy’s/Arby’s repurchased the remaining 5% convertible notes for $2,100, includingaccrued interest. The convertible notes were repurchased at a price of 100% of their principal amount plusaccrued interest.
A significant number of the Arby’s sale-leaseback obligations, capitalized lease obligations, and operating leases,require or required periodic financial reporting of certain subsidiary entities within Arby’s or of individual restaurants,which in many cases have not been prepared or reported. Arby’s has negotiated waivers and alternative covenants withtheir most significant lessors which substitute consolidated financial reporting of Arby’s for that of individualsubsidiary entities and which modify restaurant level reporting requirements for more than half of the affectedleases. Nevertheless, as of January 2, 2011, Arby’s was not in compliance, and remains not in compliance, with thereporting requirements under those leases for which waivers and alternative financial reporting covenants have notbeen negotiated. However, none of the lessors has asserted that Arby’s is in default of any of those lease agreements.The Companies do not believe that such non-compliance will have a material adverse effect on their consolidatedfinancial position or results of operations.
Wendy’s U.S. advertising fund has a revolving line of credit of $25,000. Neither the Companies, nor Wendy’s,is the guarantor of the debt. The advertising fund facility was established to fund the advertising fund operations. Thefull amount of the line was available under this line of credit as of January 2, 2011.
At January 2, 2011, one of Wendy’s Canadian subsidiaries had a revolving credit facility of C$6,000 whichbears interest at the Bank of Montreal Prime Rate. Wendy’s guarantees this debt. The availability under this facility asof January 2, 2011 was C$5,745.
(12) Fair Value of Financial Instruments
The carrying amounts and estimated fair values of the Companies’ financial instruments for which thedisclosure of fair values is required were as follows:
Year End 2010
Wendy’s/Arby’sRestaurants Corporate Wendy’s/Arby’s
Financial assetsCarrying Amount:
Cash and cash equivalents . . . . . . . . . . . . . . . . . . . . . . $198,686 $313,822 $512,508Restricted cash equivalents:
Current . . . . . . . . . . . . . . . . . . . . . . . . . . . . . . . . 1,068 — 1,068Non-current . . . . . . . . . . . . . . . . . . . . . . . . . . . . 3,562 685 4,247
Non-current cost investments . . . . . . . . . . . . . . . . . . . 3,775 4,817 8,592Interest rate swaps . . . . . . . . . . . . . . . . . . . . . . . . . . . . 9,623 — 9,623
Fair Value:Cash and cash equivalents (a) . . . . . . . . . . . . . . . . . . . $198,686 $313,822 $512,508Restricted cash equivalents (a):
Current . . . . . . . . . . . . . . . . . . . . . . . . . . . . . . . . 1,068 — 1,068Non-current . . . . . . . . . . . . . . . . . . . . . . . . . . . . 3,562 685 4,247
Non-current cost investments (b) . . . . . . . . . . . . . . . . 5,555 14,540 20,095Interest rate swaps (c) . . . . . . . . . . . . . . . . . . . . . . . . . 9,623 — 9,623
106
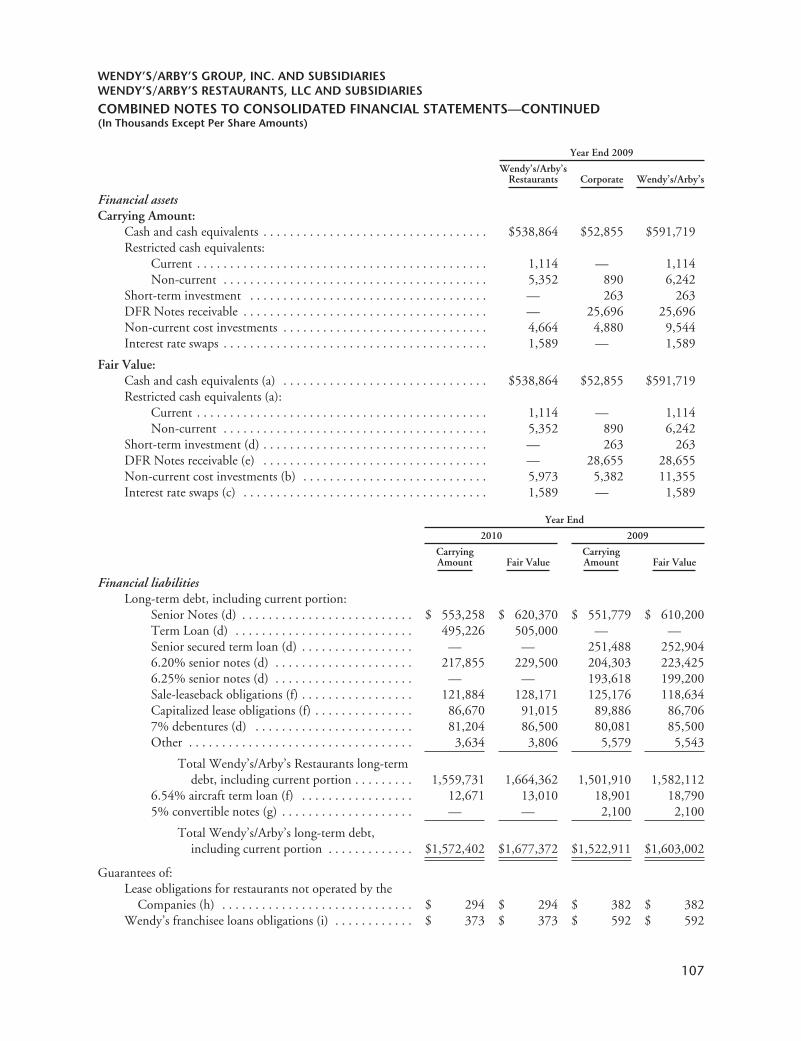
WENDY’S/ARBY’S GROUP, INC. AND SUBSIDIARIESWENDY’S/ARBY’S RESTAURANTS, LLC AND SUBSIDIARIES
COMBINED NOTES TO CONSOLIDATED FINANCIAL STATEMENTS—CONTINUED(In Thousands Except Per Share Amounts)
Year End 2009
Wendy’s/Arby’sRestaurants Corporate Wendy’s/Arby’s
Financial assetsCarrying Amount:
Cash and cash equivalents . . . . . . . . . . . . . . . . . . . . . . . . . . . . . . . . . . $538,864 $52,855 $591,719Restricted cash equivalents:
Current . . . . . . . . . . . . . . . . . . . . . . . . . . . . . . . . . . . . . . . . . . . . 1,114 — 1,114Non-current . . . . . . . . . . . . . . . . . . . . . . . . . . . . . . . . . . . . . . . . 5,352 890 6,242
Short-term investment . . . . . . . . . . . . . . . . . . . . . . . . . . . . . . . . . . . . — 263 263DFR Notes receivable . . . . . . . . . . . . . . . . . . . . . . . . . . . . . . . . . . . . . — 25,696 25,696Non-current cost investments . . . . . . . . . . . . . . . . . . . . . . . . . . . . . . . 4,664 4,880 9,544Interest rate swaps . . . . . . . . . . . . . . . . . . . . . . . . . . . . . . . . . . . . . . . . 1,589 — 1,589
Fair Value:Cash and cash equivalents (a) . . . . . . . . . . . . . . . . . . . . . . . . . . . . . . . $538,864 $52,855 $591,719Restricted cash equivalents (a):
Current . . . . . . . . . . . . . . . . . . . . . . . . . . . . . . . . . . . . . . . . . . . . 1,114 — 1,114Non-current . . . . . . . . . . . . . . . . . . . . . . . . . . . . . . . . . . . . . . . . 5,352 890 6,242
Short-term investment (d) . . . . . . . . . . . . . . . . . . . . . . . . . . . . . . . . . . — 263 263DFR Notes receivable (e) . . . . . . . . . . . . . . . . . . . . . . . . . . . . . . . . . . — 28,655 28,655Non-current cost investments (b) . . . . . . . . . . . . . . . . . . . . . . . . . . . . 5,973 5,382 11,355Interest rate swaps (c) . . . . . . . . . . . . . . . . . . . . . . . . . . . . . . . . . . . . . 1,589 — 1,589
Year End
2010 2009
CarryingAmount Fair Value
CarryingAmount Fair Value
Financial liabilitiesLong-term debt, including current portion:
Senior Notes (d) . . . . . . . . . . . . . . . . . . . . . . . . . . $ 553,258 $ 620,370 $ 551,779 $ 610,200Term Loan (d) . . . . . . . . . . . . . . . . . . . . . . . . . . . 495,226 505,000 — —Senior secured term loan (d) . . . . . . . . . . . . . . . . . — — 251,488 252,9046.20% senior notes (d) . . . . . . . . . . . . . . . . . . . . . 217,855 229,500 204,303 223,4256.25% senior notes (d) . . . . . . . . . . . . . . . . . . . . . — — 193,618 199,200Sale-leaseback obligations (f) . . . . . . . . . . . . . . . . . 121,884 128,171 125,176 118,634Capitalized lease obligations (f) . . . . . . . . . . . . . . . 86,670 91,015 89,886 86,7067% debentures (d) . . . . . . . . . . . . . . . . . . . . . . . . 81,204 86,500 80,081 85,500Other . . . . . . . . . . . . . . . . . . . . . . . . . . . . . . . . . . 3,634 3,806 5,579 5,543
Total Wendy’s/Arby’s Restaurants long-termdebt, including current portion . . . . . . . . . 1,559,731 1,664,362 1,501,910 1,582,112
6.54% aircraft term loan (f) . . . . . . . . . . . . . . . . . 12,671 13,010 18,901 18,7905% convertible notes (g) . . . . . . . . . . . . . . . . . . . . — — 2,100 2,100
Total Wendy’s/Arby’s long-term debt,including current portion . . . . . . . . . . . . . $1,572,402 $1,677,372 $1,522,911 $1,603,002
Guarantees of:Lease obligations for restaurants not operated by the
Companies (h) . . . . . . . . . . . . . . . . . . . . . . . . . . . . . $ 294 $ 294 $ 382 $ 382Wendy’s franchisee loans obligations (i) . . . . . . . . . . . . $ 373 $ 373 $ 592 $ 592
107

WENDY’S/ARBY’S GROUP, INC. AND SUBSIDIARIESWENDY’S/ARBY’S RESTAURANTS, LLC AND SUBSIDIARIES
COMBINED NOTES TO CONSOLIDATED FINANCIAL STATEMENTS—CONTINUED(In Thousands Except Per Share Amounts)
(a) The carrying amounts approximated fair value due to the short-term maturities of the cash equivalents orrestricted cash equivalents.
(b) Fair value of these investments was based entirely on statements of account received from investment managers orinvestees which were principally based on quoted market or broker/dealer prices. To the extent that some of theseinvestments, including the underlying investments in investment limited partnerships, do not have availablequoted market or broker/dealer prices, the Companies relied on valuations performed by the investmentmanagers or investees in valuing those investments or third-party appraisals.
(c) The fair values were based on information provided by the bank counterparties that is model-driven and whoseinputs were observable or whose significant value drivers were observable.
(d) The fair values were based on quoted market prices. The senior secured term loan and 6.25% senior notes wererepaid in 2010 as discussed above in Note 11—Long-term Debt.
(e) The DFR Notes were repaid during 2010 as further described in Note 3—DFR Notes.
(f) The fair values were determined by discounting the future scheduled principal payments using an interest rateassuming the same original issuance spread over a current U.S. Treasury bond yield for securities with similardurations.
(g) The convertible notes were repurchased in 2010 as discussed above in Note 11—Long-term Debt.
(h) The fair value was assumed to reasonably approximate the carrying amount. We have accrued liabilities for theselease obligations based on a weighted average risk percentage.
(i) Wendy’s provided loan guarantees to various lenders on behalf of franchisees entering into pooled debt facilityarrangements for new store development and equipment financing. Wendy’s has accrued a liability for the fairvalue of these guarantees, the calculation for which was based upon a weighed average risk percentage establishedat the inception of each program.
The carrying amounts of current accounts, notes receivable and non-current notes receivable approximated fairvalue due to the effect of related allowances for doubtful accounts and notes receivable. The carrying amounts ofaccounts payable and accrued expenses approximated fair value due to the short-term maturities of those items.
Valuation techniques under the accounting guidance related to fair value measurements were based onobservable and unobservable inputs. Observable inputs reflected readily obtainable data from independent sources,while unobservable inputs reflected our market assumptions. These inputs are classified into the following hierarchy:
Level 1 Inputs—Quoted prices for identical assets or liabilities in active markets.
Level 2 Inputs—Quoted prices for similar assets or liabilities in active markets; quoted prices for identical orsimilar assets or liabilities in markets that are not active; and model-derived valuations whose inputs areobservable or whose significant value drivers are observable.
Level 3 Inputs—Pricing inputs are unobservable for the assets or liabilities and include situations where there islittle, if any, market activity for the assets or liabilities. The inputs into the determination of fair value requiresignificant management judgment or estimation.
The following table presents the Companies’ financial assets and liabilities (other than cash and cashequivalents) measured at fair value on a recurring basis as of January 2, 2011 by the valuation hierarchy as defined inthe fair value guidance:
January 2,2011
Fair Value Measurements
Level 1 Level 2 Level 3
Interest rate swaps (included in “Deferred costs and other assets”) . . . . . . . . . . . . $9,623 $— $9,623 $—
108

WENDY’S/ARBY’S GROUP, INC. AND SUBSIDIARIESWENDY’S/ARBY’S RESTAURANTS, LLC AND SUBSIDIARIES
COMBINED NOTES TO CONSOLIDATED FINANCIAL STATEMENTS—CONTINUED(In Thousands Except Per Share Amounts)
The following table presents the fair values for those assets and liabilities measured at fair value during 2010 and2009 on a non-recurring basis. Total losses include losses recognized from all non-recurring fair value measurementsduring the year ended January 2, 2011 and January 3, 2010. The carrying value of properties presented in the tablebelow substantially represents the remaining carrying value of land for properties that were impaired related to theWendy’s and Arby’s restaurant segments. See Note 17 for more information on the impairment of our long-livedassets.
January 2,2011
Fair Value Measurements 2010Total LossesLevel 1 Level 2 Level 3
Properties . . . . . . . . . . . . . . . . . . . . . . . . . . . . . . . . . . . . . . . . . . . . $1,975 $— $— $1,975 $58,465Other intangible assets . . . . . . . . . . . . . . . . . . . . . . . . . . . . . . . . . . — — — — 11,012
Wendy’s/Arby’s Restaurants . . . . . . . . . . . . . . . . . . . . . . . . . . 1,975 — — 1,975 69,477Properties . . . . . . . . . . . . . . . . . . . . . . . . . . . . . . . . . . . . . . . . . . . . — — — — —
Wendy’s/Arby’s . . . . . . . . . . . . . . . . . . . . . . . . . . . . . . . . . . . $1,975 $— $— $1,975 $69,477
January 3,2010
Fair Value Measurements 2009Total LossesLevel 1 Level 2 Level 3
Properties . . . . . . . . . . . . . . . . . . . . . . . . . . . . . . . . . . . . . . . . . . . . $6,625 $— $— $6,625 $72,282Other intangible assets . . . . . . . . . . . . . . . . . . . . . . . . . . . . . . . . . . — — — — 7,674
Wendy’s/Arby’s Restaurants . . . . . . . . . . . . . . . . . . . . . . . . . . 6,625 — — 6,625 79,956Aircraft . . . . . . . . . . . . . . . . . . . . . . . . . . . . . . . . . . . . . . . . . . . . . . — — — — 2,176
Wendy’s/Arby’s . . . . . . . . . . . . . . . . . . . . . . . . . . . . . . . . . . . $6,625 $— $— $6,625 $82,132
Derivative instruments
The Companies’ primary objective for entering into derivative instruments is to manage their exposure tochanges in interest rates, as well as to maintain an appropriate mix of fixed and variable rate debt.
During the third quarter of 2009, we entered into eight interest rate swaps with notional amounts totaling$361,000 to swap the fixed rate interest rates on the 6.20% and 6.25% Wendy’s senior notes for floating rates. Theinterest rate swaps were designated as fair value hedges of the related debt and qualify to be accounted for under theshort-cut method according to the applicable guidance.
During the first quarter of 2010, we entered into an interest rate swap with a notional amount of $39,000 onWendy’s 6.20% senior notes. At its inception, the interest rate swap was designated as an effective fair value hedgeand is tested for effectiveness quarterly.
In connection with the redemption of the Wendy’s 6.25% senior notes, as discussed above in Note 11—Long-term Debt, we cancelled four interest rate swaps with notional amounts totaling $175,000. Upon cancellation, werecognized a gain of $1,875 in the second quarter of 2010, which is included in “Interest expense” for the year endedJanuary 2, 2011.
At January 2, 2011, the fair value of the interest rate swaps on the 6.20% Wendy’s senior notes was $9,623 andhas been included in “Deferred costs and other assets” and as an adjustment to the carrying amount of the 6.20%Wendy’s senior notes.
At December 28, 2008, Wendy’s/Arby’s also had the following derivative instruments: (1) put options onequity securities and (2) total return swaps on equity securities. Wendy’s/Arby’s did not designate these derivatives ashedging instruments, and accordingly, these derivative instruments were recorded at fair value with changes in fairvalue recorded in Wendy’s/Arby’s results of operations.
109
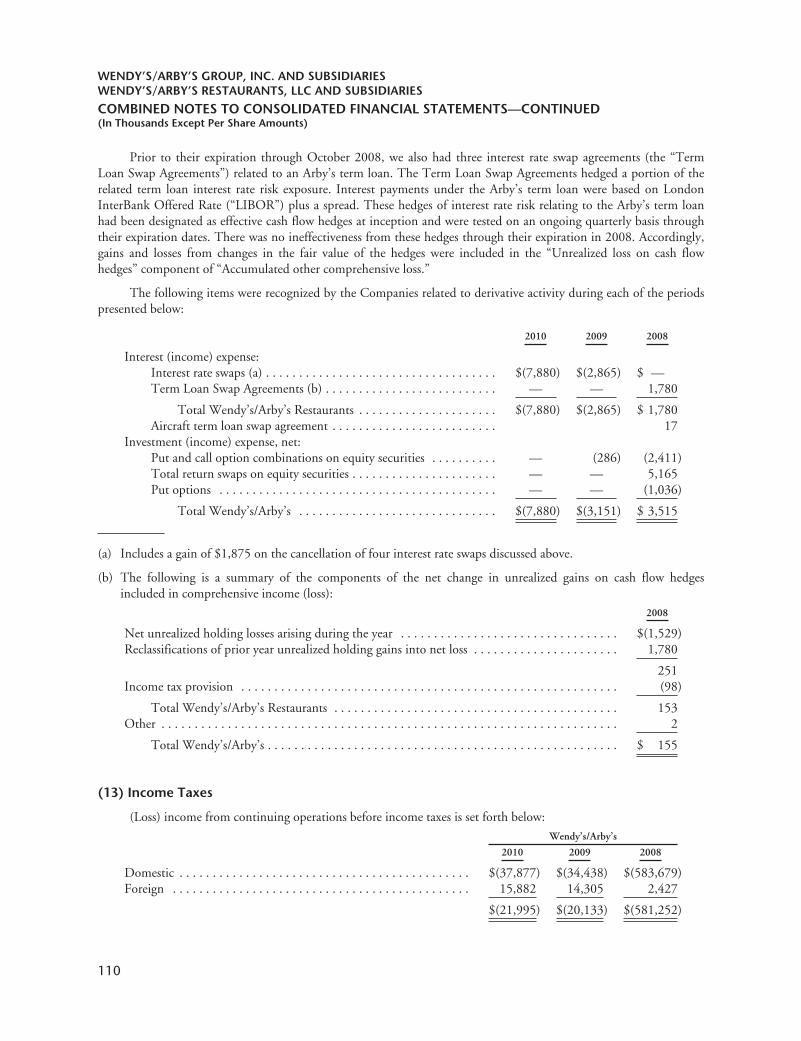
WENDY’S/ARBY’S GROUP, INC. AND SUBSIDIARIESWENDY’S/ARBY’S RESTAURANTS, LLC AND SUBSIDIARIES
COMBINED NOTES TO CONSOLIDATED FINANCIAL STATEMENTS—CONTINUED(In Thousands Except Per Share Amounts)
Prior to their expiration through October 2008, we also had three interest rate swap agreements (the “TermLoan Swap Agreements”) related to an Arby’s term loan. The Term Loan Swap Agreements hedged a portion of therelated term loan interest rate risk exposure. Interest payments under the Arby’s term loan were based on LondonInterBank Offered Rate (“LIBOR”) plus a spread. These hedges of interest rate risk relating to the Arby’s term loanhad been designated as effective cash flow hedges at inception and were tested on an ongoing quarterly basis throughtheir expiration dates. There was no ineffectiveness from these hedges through their expiration in 2008. Accordingly,gains and losses from changes in the fair value of the hedges were included in the “Unrealized loss on cash flowhedges” component of “Accumulated other comprehensive loss.”
The following items were recognized by the Companies related to derivative activity during each of the periodspresented below:
2010 2009 2008
Interest (income) expense:Interest rate swaps (a) . . . . . . . . . . . . . . . . . . . . . . . . . . . . . . . . . . . $(7,880) $(2,865) $ —Term Loan Swap Agreements (b) . . . . . . . . . . . . . . . . . . . . . . . . . . — — 1,780
Total Wendy’s/Arby’s Restaurants . . . . . . . . . . . . . . . . . . . . . $(7,880) $(2,865) $ 1,780Aircraft term loan swap agreement . . . . . . . . . . . . . . . . . . . . . . . . . 17
Investment (income) expense, net:Put and call option combinations on equity securities . . . . . . . . . . — (286) (2,411)Total return swaps on equity securities . . . . . . . . . . . . . . . . . . . . . . — — 5,165Put options . . . . . . . . . . . . . . . . . . . . . . . . . . . . . . . . . . . . . . . . . . — — (1,036)
Total Wendy’s/Arby’s . . . . . . . . . . . . . . . . . . . . . . . . . . . . . . $(7,880) $(3,151) $ 3,515
(a) Includes a gain of $1,875 on the cancellation of four interest rate swaps discussed above.
(b) The following is a summary of the components of the net change in unrealized gains on cash flow hedgesincluded in comprehensive income (loss):
2008
Net unrealized holding losses arising during the year . . . . . . . . . . . . . . . . . . . . . . . . . . . . . . . . . $(1,529)Reclassifications of prior year unrealized holding gains into net loss . . . . . . . . . . . . . . . . . . . . . . 1,780
251Income tax provision . . . . . . . . . . . . . . . . . . . . . . . . . . . . . . . . . . . . . . . . . . . . . . . . . . . . . . . . . (98)
Total Wendy’s/Arby’s Restaurants . . . . . . . . . . . . . . . . . . . . . . . . . . . . . . . . . . . . . . . . . . . 153Other . . . . . . . . . . . . . . . . . . . . . . . . . . . . . . . . . . . . . . . . . . . . . . . . . . . . . . . . . . . . . . . . . . . . . 2
Total Wendy’s/Arby’s . . . . . . . . . . . . . . . . . . . . . . . . . . . . . . . . . . . . . . . . . . . . . . . . . . . . . $ 155
(13) Income Taxes
(Loss) income from continuing operations before income taxes is set forth below:Wendy’s/Arby’s
2010 2009 2008
Domestic . . . . . . . . . . . . . . . . . . . . . . . . . . . . . . . . . . . . . . . . . . . . $(37,877) $(34,438) $(583,679)Foreign . . . . . . . . . . . . . . . . . . . . . . . . . . . . . . . . . . . . . . . . . . . . . 15,882 14,305 2,427
$(21,995) $(20,133) $(581,252)
110

WENDY’S/ARBY’S GROUP, INC. AND SUBSIDIARIESWENDY’S/ARBY’S RESTAURANTS, LLC AND SUBSIDIARIES
COMBINED NOTES TO CONSOLIDATED FINANCIAL STATEMENTS—CONTINUED(In Thousands Except Per Share Amounts)
Wendy’s/Arby’s Restaurants
2010 2009 2008
Domestic . . . . . . . . . . . . . . . . . . . . . . . . . . . . . . . . . . . . . . . . . . . . $(33,305) $(12,718) $(430,634)Foreign . . . . . . . . . . . . . . . . . . . . . . . . . . . . . . . . . . . . . . . . . . . . . 15,882 14,305 2,427
$(17,423) $ 1,587 $(428,207)
The benefit from (provision for) income taxes from continuing operations is set forth below:
Wendy’s/Arby’s
2010 2009 2008
U.S. Federal . . . . . . . . . . . . . . . . . . . . . . . . . . . . . . . . . . . . . . . . . . $ — $ — $ —State . . . . . . . . . . . . . . . . . . . . . . . . . . . . . . . . . . . . . . . . . . . . . . . . (5,009) (10,318) (4,017)Foreign, principally Canada . . . . . . . . . . . . . . . . . . . . . . . . . . . . . . (7,100) (6,160) (1,965)
Current tax provision . . . . . . . . . . . . . . . . . . . . . . . . . . . . . . . (12,109) (16,478) (5,982)
U.S. Federal . . . . . . . . . . . . . . . . . . . . . . . . . . . . . . . . . . . . . . . . . . 25,003 8,066 90,465State . . . . . . . . . . . . . . . . . . . . . . . . . . . . . . . . . . . . . . . . . . . . . . . . 2,720 28,985 14,608Foreign, principally Canada . . . . . . . . . . . . . . . . . . . . . . . . . . . . . . 2,056 3,076 203
Deferred tax benefit . . . . . . . . . . . . . . . . . . . . . . . . . . . . . . . . 29,779 40,127 105,276
Income tax benefit . . . . . . . . . . . . . . . . . . . . . . . . . . . . . . . . . $ 17,670 $ 23,649 $ 99,294
Wendy’s/Arby’s Restaurants
2010 2009 2008
U.S. Federal . . . . . . . . . . . . . . . . . . . . . . . . . . . . . . . . . . . . . . . . . . $ 3,382 $(46,062) $ 5,427State . . . . . . . . . . . . . . . . . . . . . . . . . . . . . . . . . . . . . . . . . . . . . . . . (7,249) (8,328) (3,064)Foreign, principally Canada . . . . . . . . . . . . . . . . . . . . . . . . . . . . . . (7,100) (6,089) (1,965)
Current tax (provision) benefit . . . . . . . . . . . . . . . . . . . . . . . . (10,967) (60,479) 398
U.S. Federal . . . . . . . . . . . . . . . . . . . . . . . . . . . . . . . . . . . . . . . . . . 19,896 46,919 54,299State . . . . . . . . . . . . . . . . . . . . . . . . . . . . . . . . . . . . . . . . . . . . . . . . 3,800 18,626 8,221Foreign, principally Canada . . . . . . . . . . . . . . . . . . . . . . . . . . . . . . 2,056 2,996 203
Deferred tax benefit . . . . . . . . . . . . . . . . . . . . . . . . . . . . . . . . 25,752 68,541 62,723
Income tax benefit . . . . . . . . . . . . . . . . . . . . . . . . . . . . . . . . . $ 14,785 $ 8,062 $63,121
111
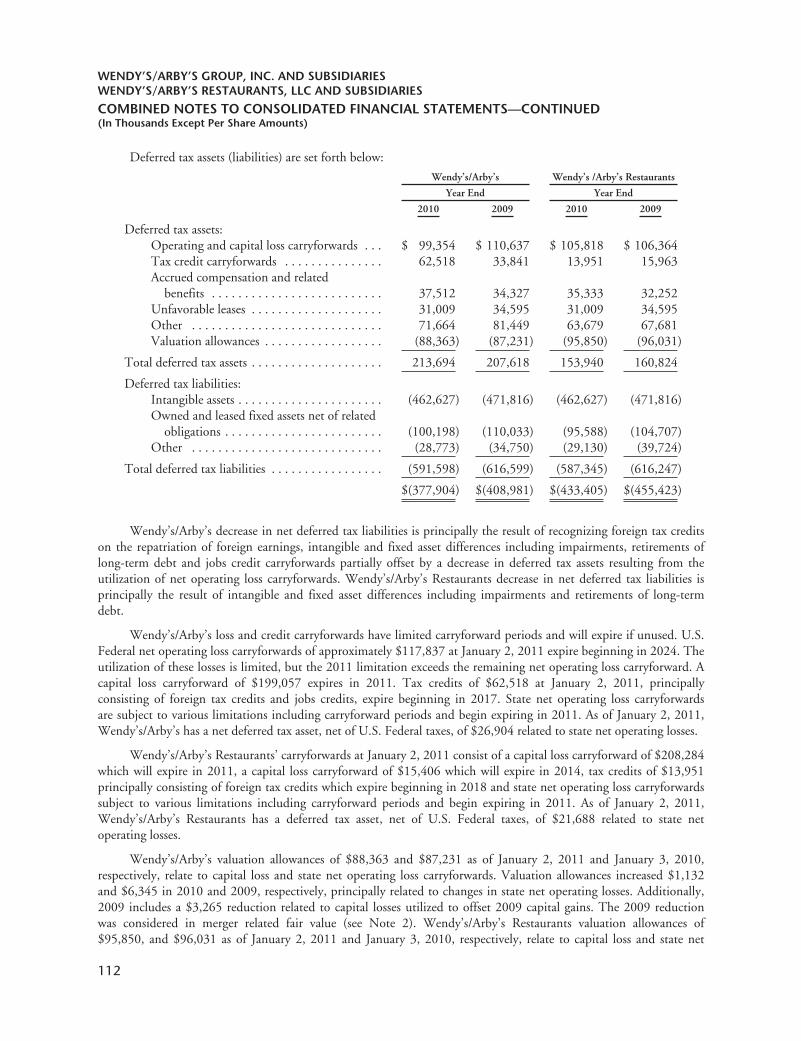
WENDY’S/ARBY’S GROUP, INC. AND SUBSIDIARIESWENDY’S/ARBY’S RESTAURANTS, LLC AND SUBSIDIARIES
COMBINED NOTES TO CONSOLIDATED FINANCIAL STATEMENTS—CONTINUED(In Thousands Except Per Share Amounts)
Deferred tax assets (liabilities) are set forth below:
Wendy’s/Arby’s Wendy’s /Arby’s Restaurants
Year End Year End
2010 2009 2010 2009
Deferred tax assets:Operating and capital loss carryforwards . . . $ 99,354 $ 110,637 $ 105,818 $ 106,364Tax credit carryforwards . . . . . . . . . . . . . . . 62,518 33,841 13,951 15,963Accrued compensation and related
benefits . . . . . . . . . . . . . . . . . . . . . . . . . . 37,512 34,327 35,333 32,252Unfavorable leases . . . . . . . . . . . . . . . . . . . . 31,009 34,595 31,009 34,595Other . . . . . . . . . . . . . . . . . . . . . . . . . . . . . 71,664 81,449 63,679 67,681Valuation allowances . . . . . . . . . . . . . . . . . . (88,363) (87,231) (95,850) (96,031)
Total deferred tax assets . . . . . . . . . . . . . . . . . . . . 213,694 207,618 153,940 160,824
Deferred tax liabilities:Intangible assets . . . . . . . . . . . . . . . . . . . . . . (462,627) (471,816) (462,627) (471,816)Owned and leased fixed assets net of related
obligations . . . . . . . . . . . . . . . . . . . . . . . . (100,198) (110,033) (95,588) (104,707)Other . . . . . . . . . . . . . . . . . . . . . . . . . . . . . (28,773) (34,750) (29,130) (39,724)
Total deferred tax liabilities . . . . . . . . . . . . . . . . . (591,598) (616,599) (587,345) (616,247)
$(377,904) $(408,981) $(433,405) $(455,423)
Wendy’s/Arby’s decrease in net deferred tax liabilities is principally the result of recognizing foreign tax creditson the repatriation of foreign earnings, intangible and fixed asset differences including impairments, retirements oflong-term debt and jobs credit carryforwards partially offset by a decrease in deferred tax assets resulting from theutilization of net operating loss carryforwards. Wendy’s/Arby’s Restaurants decrease in net deferred tax liabilities isprincipally the result of intangible and fixed asset differences including impairments and retirements of long-termdebt.
Wendy’s/Arby’s loss and credit carryforwards have limited carryforward periods and will expire if unused. U.S.Federal net operating loss carryforwards of approximately $117,837 at January 2, 2011 expire beginning in 2024. Theutilization of these losses is limited, but the 2011 limitation exceeds the remaining net operating loss carryforward. Acapital loss carryforward of $199,057 expires in 2011. Tax credits of $62,518 at January 2, 2011, principallyconsisting of foreign tax credits and jobs credits, expire beginning in 2017. State net operating loss carryforwardsare subject to various limitations including carryforward periods and begin expiring in 2011. As of January 2, 2011,Wendy’s/Arby’s has a net deferred tax asset, net of U.S. Federal taxes, of $26,904 related to state net operating losses.
Wendy’s/Arby’s Restaurants’ carryforwards at January 2, 2011 consist of a capital loss carryforward of $208,284which will expire in 2011, a capital loss carryforward of $15,406 which will expire in 2014, tax credits of $13,951principally consisting of foreign tax credits which expire beginning in 2018 and state net operating loss carryforwardssubject to various limitations including carryforward periods and begin expiring in 2011. As of January 2, 2011,Wendy’s/Arby’s Restaurants has a deferred tax asset, net of U.S. Federal taxes, of $21,688 related to state netoperating losses.
Wendy’s/Arby’s valuation allowances of $88,363 and $87,231 as of January 2, 2011 and January 3, 2010,respectively, relate to capital loss and state net operating loss carryforwards. Valuation allowances increased $1,132and $6,345 in 2010 and 2009, respectively, principally related to changes in state net operating losses. Additionally,2009 includes a $3,265 reduction related to capital losses utilized to offset 2009 capital gains. The 2009 reductionwas considered in merger related fair value (see Note 2). Wendy’s/Arby’s Restaurants valuation allowances of$95,850, and $96,031 as of January 2, 2011 and January 3, 2010, respectively, relate to capital loss and state net
112

WENDY’S/ARBY’S GROUP, INC. AND SUBSIDIARIESWENDY’S/ARBY’S RESTAURANTS, LLC AND SUBSIDIARIES
COMBINED NOTES TO CONSOLIDATED FINANCIAL STATEMENTS—CONTINUED(In Thousands Except Per Share Amounts)
operating loss carryforwards. Valuation allowances (decreased) increased ($181) and $12,494 in 2010 and 2009,respectively, principally related to changes in state net operating losses. In making our determination of the need forvaluation allowances, we reviewed available positive and negative evidence as well as prudent and feasible tax planningstrategies regarding our ability to realize the benefit of the related deferred tax assets.
For U.S. Federal income tax purposes during the years prior to 2009, we deducted $117,939 relating to theexercise of stock options and vesting of restricted stock. Wendy’s/Arby’s has not recognized the $42,661 tax benefitrelating to these deductions because it has no income taxes currently payable against which the benefits can be realizedas a result of its net operating loss and credit carryforwards. When such benefits are realized against future incometaxes payable by Wendy’s/Arby’s, it will recognize them in future periods as a reduction of current income taxespayable with an equal offsetting increase in “Additional paid-in capital.”
U.S. income taxes and foreign withholding taxes are provided on unremitted earnings of foreign subsidiaries,primarily Canadian, which are not essentially permanent in duration. As of January 2, 2011, the Companies haveunremitted earnings of $1,600 with a corresponding U.S. deferred income tax liability of $200.
The Wendy’s Merger qualified as a tax-free reorganization. Based on the merger exchange ratio, the formershareholders of Wendy’s owned approximately 80% of the total stock of Wendy’s/Arby’s outstanding immediatelyafter the Wendy’s Merger. Therefore, the Wendy’s Merger was treated as a reverse acquisition for U.S. Federal incometax purposes. As a result of the reverse acquisition, Wendy’s/Arby’s and its subsidiaries became part of the Wendy’sconsolidated group with Wendy’s/Arby’s as its new parent. In addition, Wendy’s/Arby’s had a short taxable year in2008 ending on the date of the Wendy’s Merger. Also as a result of the Wendy’s Merger, for U.S. Federal taxpurposes there was an ownership change at Wendy’s/Arby’s which places a limit on the amount of a company’s netoperating losses that can be deducted annually.
The reconciliation of income tax computed at the U.S. Federal statutory rate to reported income tax is set forthbelow:
Wendy’s/Arby’s
2010 2009 2008
Income tax benefit at the U.S. Federal statutory rate . . . . . . . . . . . . . $ 7,699 $ 7,047 $203,438State income tax (provision) benefit, net of U.S. Federal income
tax effect . . . . . . . . . . . . . . . . . . . . . . . . . . . . . . . . . . . . . . . . (1,489) 2,505 6,884Previously unrecognized state net operating losses, net of related
valuation allowance (a) . . . . . . . . . . . . . . . . . . . . . . . . . . . . . — 9,629 —Foreign and U.S. tax effects of foreign operations (b) . . . . . . . . . 7,692 623 9,241Impairment of non-deductible goodwill . . . . . . . . . . . . . . . . . . — — (99,696)Canadian tax rate changes . . . . . . . . . . . . . . . . . . . . . . . . . . . . . — 2,000 —
Loss on DFR common stock with no tax benefit . . . . . . . . . . . . — — (20,259)Jobs tax credits, net . . . . . . . . . . . . . . . . . . . . . . . . . . . . . . . . . . 3,469 3,792 1,805Valuation allowance changes . . . . . . . . . . . . . . . . . . . . . . . . . . . (198) 1,165 —Non-deductible expenses . . . . . . . . . . . . . . . . . . . . . . . . . . . . . . (1,162) (1,354) (1,921)Adjustments related to prior year tax matters . . . . . . . . . . . . . . . 1,035 (1,603) (706)Other, net . . . . . . . . . . . . . . . . . . . . . . . . . . . . . . . . . . . . . . . . . 624 (155) 508
$17,670 $23,649 $ 99,294
(a) In connection with the fourth quarter 2009 dissolution of our captive insurance company, the likelihood ofrealization of certain previously unrecognized state net operating losses is no longer remote. Accordingly, an$18,152 deferred tax asset and related $8,523 partial valuation allowance was recognized.
(b) Includes previously unrecognized benefit in 2010 and 2008 of foreign tax credits, net of foreign income andwithholding taxes on the repatriation of foreign earnings.
113
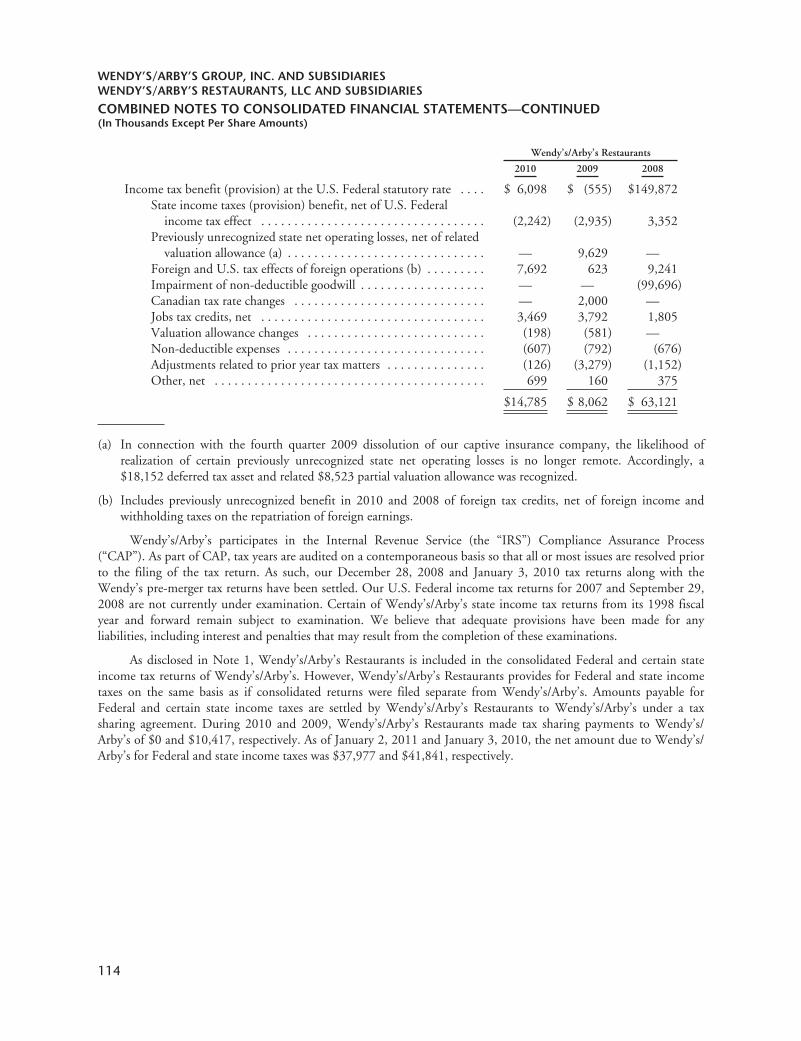
WENDY’S/ARBY’S GROUP, INC. AND SUBSIDIARIESWENDY’S/ARBY’S RESTAURANTS, LLC AND SUBSIDIARIES
COMBINED NOTES TO CONSOLIDATED FINANCIAL STATEMENTS—CONTINUED(In Thousands Except Per Share Amounts)
Wendy’s/Arby’s Restaurants
2010 2009 2008
Income tax benefit (provision) at the U.S. Federal statutory rate . . . . $ 6,098 $ (555) $149,872State income taxes (provision) benefit, net of U.S. Federal
income tax effect . . . . . . . . . . . . . . . . . . . . . . . . . . . . . . . . . . (2,242) (2,935) 3,352Previously unrecognized state net operating losses, net of related
valuation allowance (a) . . . . . . . . . . . . . . . . . . . . . . . . . . . . . . — 9,629 —Foreign and U.S. tax effects of foreign operations (b) . . . . . . . . . 7,692 623 9,241Impairment of non-deductible goodwill . . . . . . . . . . . . . . . . . . . — — (99,696)Canadian tax rate changes . . . . . . . . . . . . . . . . . . . . . . . . . . . . . — 2,000 —Jobs tax credits, net . . . . . . . . . . . . . . . . . . . . . . . . . . . . . . . . . . 3,469 3,792 1,805Valuation allowance changes . . . . . . . . . . . . . . . . . . . . . . . . . . . (198) (581) —Non-deductible expenses . . . . . . . . . . . . . . . . . . . . . . . . . . . . . . (607) (792) (676)Adjustments related to prior year tax matters . . . . . . . . . . . . . . . (126) (3,279) (1,152)Other, net . . . . . . . . . . . . . . . . . . . . . . . . . . . . . . . . . . . . . . . . . 699 160 375
$14,785 $ 8,062 $ 63,121
(a) In connection with the fourth quarter 2009 dissolution of our captive insurance company, the likelihood ofrealization of certain previously unrecognized state net operating losses is no longer remote. Accordingly, a$18,152 deferred tax asset and related $8,523 partial valuation allowance was recognized.
(b) Includes previously unrecognized benefit in 2010 and 2008 of foreign tax credits, net of foreign income andwithholding taxes on the repatriation of foreign earnings.
Wendy’s/Arby’s participates in the Internal Revenue Service (the “IRS”) Compliance Assurance Process(“CAP”). As part of CAP, tax years are audited on a contemporaneous basis so that all or most issues are resolved priorto the filing of the tax return. As such, our December 28, 2008 and January 3, 2010 tax returns along with theWendy’s pre-merger tax returns have been settled. Our U.S. Federal income tax returns for 2007 and September 29,2008 are not currently under examination. Certain of Wendy’s/Arby’s state income tax returns from its 1998 fiscalyear and forward remain subject to examination. We believe that adequate provisions have been made for anyliabilities, including interest and penalties that may result from the completion of these examinations.
As disclosed in Note 1, Wendy’s/Arby’s Restaurants is included in the consolidated Federal and certain stateincome tax returns of Wendy’s/Arby’s. However, Wendy’s/Arby’s Restaurants provides for Federal and state incometaxes on the same basis as if consolidated returns were filed separate from Wendy’s/Arby’s. Amounts payable forFederal and certain state income taxes are settled by Wendy’s/Arby’s Restaurants to Wendy’s/Arby’s under a taxsharing agreement. During 2010 and 2009, Wendy’s/Arby’s Restaurants made tax sharing payments to Wendy’s/Arby’s of $0 and $10,417, respectively. As of January 2, 2011 and January 3, 2010, the net amount due to Wendy’s/Arby’s for Federal and state income taxes was $37,977 and $41,841, respectively.
114

WENDY’S/ARBY’S GROUP, INC. AND SUBSIDIARIESWENDY’S/ARBY’S RESTAURANTS, LLC AND SUBSIDIARIES
COMBINED NOTES TO CONSOLIDATED FINANCIAL STATEMENTS—CONTINUED(In Thousands Except Per Share Amounts)
Uncertain Tax Positions
As of January 2, 2011, Wendy’s/Arby’s and Wendy’s/Arby’s Restaurants had unrecognized tax benefits of$36,434 and $26,249, respectively, of which, if resolved favorably would reduce income tax expense by $25,200 and$17,100, respectively. A reconciliation of the beginning and ending amount of unrecognized tax benefits follows:
Wendy’s/Arby’s
2010 2009 2008
Beginning balance . . . . . . . . . . . . . . . . . . . . . . . . . . . . . . . . . . . . . . . . $39,118 $38,421 $12,266Additions:
Wendy’s unrecognized tax benefits at the merger date (a) . . — — 24,916Tax positions related to the current year . . . . . . . . . . . . . . . 19 6,627 996Tax positions of prior years . . . . . . . . . . . . . . . . . . . . . . . . . 4,921 1,857 4,362
Reductions:Tax positions of prior years . . . . . . . . . . . . . . . . . . . . . . . . . (4,419) (4,241) (2,982)Settlements . . . . . . . . . . . . . . . . . . . . . . . . . . . . . . . . . . . . . (416) (1,407) (578)Lapse of statute of limitation . . . . . . . . . . . . . . . . . . . . . . . . (2,789) (2,139) (559)
Ending balance . . . . . . . . . . . . . . . . . . . . . . . . . . . . . . . . . . . . . . . . . . $36,434 $39,118 $38,421
Wendy’s/Arby’s Restaurants
2010 2009 2008
Beginning balance . . . . . . . . . . . . . . . . . . . . . . . . . . . . . . . . . . . . . . . . $28,414 $31,717 $ 5,846Additions:
Wendy’s unrecognized tax benefits at the merger date (a) . . — — 24,916Tax positions related to the current year . . . . . . . . . . . . . . . 19 613 996Tax positions of prior years . . . . . . . . . . . . . . . . . . . . . . . . . 4,921 1,651 2,357
Reductions:Tax positions of prior years . . . . . . . . . . . . . . . . . . . . . . . . . (3,900) (2,383) (1,466)Settlements . . . . . . . . . . . . . . . . . . . . . . . . . . . . . . . . . . . . . (416) (1,045) (372)Lapse of statute of limitations . . . . . . . . . . . . . . . . . . . . . . . (2,789) (2,139) (560)
Ending balance . . . . . . . . . . . . . . . . . . . . . . . . . . . . . . . . . . . . . . . . . . $26,249 $28,414 $31,717
(a) The amount included in the tables above for 2008 of $24,916 has been corrected from the prior year presentationof $16,816; such revision had no impact on the Companies’ Consolidated Financial Statements.
During 2011, we believe it is reasonably possible we will reduce unrecognized tax benefits by up to $7,022,primarily as a result of the completion of certain state tax audits.
During 2010, 2009 and 2008, Wendy’s/Arby’s recognized $1,004, $(414) and $390 of interest (reductions)expense and $425, $(888) and $1,307 of penalty (reductions) expense, respectively, related to uncertain tax positions.Wendy’s/Arby’s has approximately $5,005 and $4,262 accrued for interest and $1,451 and $1,026 accrued forpenalties as of January 2, 2011 and January 3, 2010, respectively.
During 2010, 2009 and 2008, Wendy’s/Arby’s Restaurants recognized $940, $(315) and $792 of interest(reductions) expense and $425, $(535) and $954 of penalty (reductions) expense, respectively, related to uncertain taxpositions. Wendy’s/Arby’s Restaurants has approximately $4,741 and $4,062 accrued for interest and $1,204 and$779 accrued for penalties as of January 2, 2011 and January 3, 2010, respectively.
115

WENDY’S/ARBY’S GROUP, INC. AND SUBSIDIARIESWENDY’S/ARBY’S RESTAURANTS, LLC AND SUBSIDIARIES
COMBINED NOTES TO CONSOLIDATED FINANCIAL STATEMENTS—CONTINUED(In Thousands Except Per Share Amounts)
(14) Stockholders’ Equity
(Wendy’s/Arby’s)
Our common stock and common stock held in treasury activity for 2010, 2009 and 2008 was as follows:Common Stock Treasury Stock
2010 2009 2008 2010 2009 2008
Class B prior to September 29, 2008Common Stock subsequent to
September 29, 2008Common
StockCommon
StockCommon
Stock Class B
Number of shares at beginning of year . . . . . 470,424 470,424 64,025 17,492 1,220 667 174Net effect of Class B conversion . . . . . . . . . . — — 29,551 — — 2 (2)Stock issuance related to Wendy’s
Merger . . . . . . . . . . . . . . . . . . . . . . . . . . . — — 376,776 — — — —Common shares issued:
Upon exercises of stock options, net . . — — — (383) (524) (5) —Upon grant of restricted stock and for
director’s fees . . . . . . . . . . . . . . . . . . — — 16 (470) (52) (63) (213)Repurchase of common stock for
Treasury . . . . . . . . . . . . . . . . . . . . . . . . . — — — 35,406 16,911 — —Other . . . . . . . . . . . . . . . . . . . . . . . . . . . . . . — — 56 5 (63) 619 41
Number of shares at end of year . . . . . . . . . 470,424 470,424 470,424 52,050 17,492 1,220 —
Preferred Stock
There were 100,000 shares authorized and no shares issued of preferred stock throughout the 2010, 2009 and2008 fiscal years.
Restricted Net Assets of Subsidiaries
Restricted net assets of consolidated subsidiaries were $1,776,630, representing approximately 82% ofWendy’s/Arby’s consolidated stockholders’ equity as of January 2, 2011, and consisted of net assets of Wendy’s/Arby’s restaurant business segments which were restricted as to transfer to Wendy’s/Arby’s in the form of cashdividends, loans or advances under the covenants of the Credit Agreement. As of January 2, 2011, there was $25,622available for the payment of dividends directly to Wendy’s/Arby’s from Wendy’s/Arby’s restricted subsidiaries.
(15) Share-Based Compensation
Wendy’s/Arby’s maintains several equity plans (the “Equity Plans”), including those assumed in the Wendy’sMerger discussed below, which collectively provide or provided for the grant of stock options, restricted shares ofWendy’s/Arby’s Common Stock, tandem stock appreciation rights, restricted share units and performance shares(collectively, the “Grants”) to certain officers, other key employees, non-employee directors andconsultants. Wendy’s/Arby’s has not granted any tandem stock appreciation rights. Since the establishment ofWendy’s/Arby’s Restaurants, substantially all Grants have been made to employees of Wendy’s/Arby’s Restaurants.The Equity Plans also provide for the grant of shares of Wendy’s/Arby’s common stock to non-employeedirectors. During 2010, Wendy’s/Arby’s implemented the 2010 Omnibus Award Plan (the “2010 Plan”) for theissuance of equity instruments as described above. All equity grants during 2010 were issued from the 2010 Plan andit is the only equity plan from which all future equity instruments may be granted. As of January 2, 2011 there wereapproximately 66,133 shares of Common Stock available for future grants under the 2010 Plan.
Effective with the Wendy’s Merger, Wendy’s/Arby’s also assumed the existing Wendy’s equity plans (the“Wendy’s Plans”) which collectively provided for the grant of stock options, restricted shares, stock appreciation rightsor restricted stock units for certain employees and non-employee directors to acquire common shares of
116

WENDY’S/ARBY’S GROUP, INC. AND SUBSIDIARIESWENDY’S/ARBY’S RESTAURANTS, LLC AND SUBSIDIARIES
COMBINED NOTES TO CONSOLIDATED FINANCIAL STATEMENTS—CONTINUED(In Thousands Except Per Share Amounts)
Wendy’s. Pursuant to the merger agreement, each outstanding Wendy’s option as of the merger date was convertedinto 4.25 options for one share of Wendy’s/Arby’s Common Stock. We performed valuations on the Wendy’s optionsboth before and after the Conversion and determined that the value of the options after the Conversion was $1,923higher than the pre-merger value included in the consideration in the Wendy’s Merger. As such, we recordedadditional compensation expense in 2008 for this amount.
All discussions below related to option and restricted share activity for prior years include options or restrictedshares for Class B Common Stock which, if they were still outstanding as of the date of the Wendy’s Merger,represent options exercisable into Common Stock or restricted Common Stock.
Stock Options
Prior to the date of the Conversion, Wendy’s/Arby’s outstanding stock options were exercisable for either (1) apackage (the “Package Options”) of one share of Class A Common Stock and two shares of Class B Common Stock,(2) one share of Class A Common Stock (the “Class A Options”) or (3) one share of Class B Common Stock (the“Class B Options”). As of the date of the Wendy’s Merger, Wendy’s/Arby’s converted to a single class of commonstock. As such, all stock options outstanding subsequent to the date of the Wendy’s Merger (including those underthe Wendy’s Plans) are now exercisable for one share of Common Stock (three shares of Common Stock for PackageOptions).
The tables below summarize 2010 activity and include certain additional information for Wendy’s/Arby’soutstanding stock options.
Package Options Common Stock Options
Options
WeightedAverageExercise
Price
AggregateIntrinsic
Value Options
WeightedAverageExercise
Price
AggregateIntrinsic
Value
Outstanding at January 3, 2010 . . . . . . . . . . . . . . . . . . 195 $23.82 $ — 22,880 $7.15 $2,504
Granted . . . . . . . . . . . . . . . . . . . . . . . . . . . . . . . . . . . . . — 6,617 $3.92Exercised . . . . . . . . . . . . . . . . . . . . . . . . . . . . . . . . . . . . — (409) $3.42 $ 488
Forfeited /expired . . . . . . . . . . . . . . . . . . . . . . . . . . . . . (62) $22.16 (1,414) $7.46
Outstanding at January 2, 2011 (a) . . . . . . . . . . . . . . . . 133 $24.59 $ — 27,674 $6.42 $6,063
Vested or expected to vest at January 2, 2011 (b) . . . . . 133 $24.59 $ — 26,519 $6.50 $5,586
Exercisable at January 2, 2011 (c) . . . . . . . . . . . . . . . . . 133 $24.59 $ — 15,857 $7.75 $1,190
(a) The weighted average contractual life for the Package Options and Common Stock Options that wereoutstanding at January 2, 2011 was 1.5 years and 7.5 years, respectively.
(b) The weighted average contractual life for the Package Options and Common Stock options that were vested orexpected to vest at January 2, 2011 was 1.5 years and 7.5 years, respectively.
(c) The weighted average contractual life for the Package Options and Common Stock Options that were exercisableat January 2, 2011 was 1.5 years and 6.6 years, respectively.
117

WENDY’S/ARBY’S GROUP, INC. AND SUBSIDIARIESWENDY’S/ARBY’S RESTAURANTS, LLC AND SUBSIDIARIES
COMBINED NOTES TO CONSOLIDATED FINANCIAL STATEMENTS—CONTINUED(In Thousands Except Per Share Amounts)
The weighted average fair value per share as of the grant date as calculated under the Black-Scholes Model forstock options granted during 2010, 2009 and 2008 (which were all granted at exercise prices equal to the market priceof Wendy’s/Arby’s Common Stock or Class B common stock on the grant date) were as follows:
Common StockOptions
Class BOptions
2010 . . . . . . . . . . . . . . . . . . . . . . . . . . . . . . . . . . . . . . . . . . . . . . . . . . . . . . . . . $1.47 N/A2009 . . . . . . . . . . . . . . . . . . . . . . . . . . . . . . . . . . . . . . . . . . . . . . . . . . . . . . . . . $1.83 N/A2008 . . . . . . . . . . . . . . . . . . . . . . . . . . . . . . . . . . . . . . . . . . . . . . . . . . . . . . . . . $2.12 $2.20
The fair value of stock options on the date of grant and as of the Merger Date for options assumed in 2008 wascalculated utilizing the following weighted average assumptions:
2010 2009 2008
CommonStock
Options
CommonStock
Options
CommonStock
OptionsClass BOptions
Risk-free interest rate . . . . . . . . . . . . . . . . . . . . . . . . . . . . . . . . . . . . . . . . . . . 2.01% 2.46% 2.13% 3.78%Expected option life in years . . . . . . . . . . . . . . . . . . . . . . . . . . . . . . . . . . . . . 5.4 5.1 6.2 7.5Expected volatility . . . . . . . . . . . . . . . . . . . . . . . . . . . . . . . . . . . . . . . . . . . . . 45.2% 49.6% 47.0% 36.0%Expected dividend yield . . . . . . . . . . . . . . . . . . . . . . . . . . . . . . . . . . . . . . . . . 1.53% 1.35% 1.29% 2.53%
The risk-free interest rate represents the U.S. Treasury zero-coupon bond yield approximating the expectedoption life of stock options granted during the respective years. The expected option life represents the period of timethat the stock options granted during the period are expected to be outstanding based on historical exercise trends forsimilar grants. The expected volatility is based on the historical market price volatility of the classes of common stockfor the related options granted during the years. The expected dividend yield represents Wendy’s/Arby’s annualizedaverage yield for regular quarterly dividends declared prior to the respective stock option grant dates.
The Black-Scholes Model has limitations on its effectiveness including that it was developed for use inestimating the fair value of traded options which have no vesting restrictions and are fully transferable and that themodel requires the use of highly subjective assumptions including expected stock price volatility. Employee stockoption awards have characteristics significantly different from those of traded options and changes in the subjectiveinput assumptions can materially affect the fair value estimates.
The Companies’ current outstanding stock options have maximum contractual terms of ten years and, withcertain exceptions, vest ratably over three years. All of the options under the Wendy’s Plans that were granted prior to2008 vested immediately as of the date of the Wendy’s Merger. Options granted under the Wendy’s Plans during2008, regardless of whether they were granted before or after the merger, vest ratably over three years from the date ofgrant, with certain exceptions.
Wendy’s/Arby’s reduced the exercise prices of all outstanding stock options for the DFR dividend distributed toshareholders of record as of March 29, 2008. The exercise prices were reduced by $0.39 for each of the PackageOptions and by $0.13 for each of the Common Stock Options and Class B Options.
Restricted Shares
Wendy’s/Arby’s issues restricted share awards (“RSAs”) and restricted share units (“RSUs”). For the purposes ofour disclosures, the term “Restricted Shares” applies to RSAs and RSUs collectively unless otherwise noted.
118

WENDY’S/ARBY’S GROUP, INC. AND SUBSIDIARIESWENDY’S/ARBY’S RESTAURANTS, LLC AND SUBSIDIARIES
COMBINED NOTES TO CONSOLIDATED FINANCIAL STATEMENTS—CONTINUED(In Thousands Except Per Share Amounts)
The following table summarizes the activity of Wendy’s/Arby’s non-vested restricted shares for 2010:Common Stock
Shares
WeightedAverage
Fair Value
Nonvested at January 3, 2010 . . . . . . . . . . . . . . . . . . . . . . . . . . . . . . . . . . . . . . . . . . . 1,481 $5.00Granted . . . . . . . . . . . . . . . . . . . . . . . . . . . . . . . . . . . . . . . . . . . . . . . . . . . . . . . . . . . 192 $4.44Vested . . . . . . . . . . . . . . . . . . . . . . . . . . . . . . . . . . . . . . . . . . . . . . . . . . . . . . . . . . . . (606) $5.54Forfeited . . . . . . . . . . . . . . . . . . . . . . . . . . . . . . . . . . . . . . . . . . . . . . . . . . . . . . . . . . . (14) $4.44
Nonvested at January 2, 2011 . . . . . . . . . . . . . . . . . . . . . . . . . . . . . . . . . . . . . . . . . . . 1,053 $4.59
Performance Shares
Under the 2010 Plan, Wendy’s/Arby’s grants performance-based awards to certain officers and keyemployees. The vesting of these awards is contingent upon meeting a defined operational goal (a performancecondition) or Common Stock share prices (a market condition).
The fair value of performance condition awards was determined using the average of the high and low tradingprices of our Common Stock on the date of grant. Compensation cost recorded for performance condition awards isreevaluated at each reporting period based on the probability of the achievement of the goal. There was nocompensation cost recorded during 2010 for the performance condition awards as Wendy’s/Arby’s believes that theachievement of the defined operational goal is not probable.
The fair value of market condition awards was estimated on the date of the grant using the Monte Carlosimulation model. The Monte Carlo simulation model utilizes multiple input variables to estimate the probabilitythat the market conditions will be achieved, as noted in the table below:
Risk-free interest rate . . . . . . . . . . . . . . . . . . . . . . . . . . . . . . . . . . . . . . . . . . . . . . . . . . . . 0.93%Expected life in years . . . . . . . . . . . . . . . . . . . . . . . . . . . . . . . . . . . . . . . . . . . . . . . . . . . . 2.98Expected volatility . . . . . . . . . . . . . . . . . . . . . . . . . . . . . . . . . . . . . . . . . . . . . . . . . . . . . . 55.0%Expected dividend yield (a) . . . . . . . . . . . . . . . . . . . . . . . . . . . . . . . . . . . . . . . . . . . . . . . 0.0%
(a) The Monte Carlo method assumes a reinvestment of dividends.
Compensation cost is recorded ratably for market condition awards during the vesting period and is notreversed, except for forfeitures, at the vesting date, without regard as to whether the market condition is met.
The following table summarizes the activity of Wendy’s/Arby’s non-vested performance shares for 2010:Performance Condition Awards Market Condition Awards
Shares
WeightedAverage Fair
Value Shares
WeightedAverage Fair
Value
Nonvested at January 3, 2010 . . . . . . . . . . . . . . . . . . . . . . . . . . . . . — $— — $—Granted . . . . . . . . . . . . . . . . . . . . . . . . . . . . . . . . . . . . . . . . . . . . . . 1,209 $3.91 833 $5.56Vested . . . . . . . . . . . . . . . . . . . . . . . . . . . . . . . . . . . . . . . . . . . . . . . — $— — $—Forfeited . . . . . . . . . . . . . . . . . . . . . . . . . . . . . . . . . . . . . . . . . . . . . (2) $3.91 (1) $5.56
Nonvested at January 2, 2011 . . . . . . . . . . . . . . . . . . . . . . . . . . . . . 1,207 $3.91 832 $5.56
119
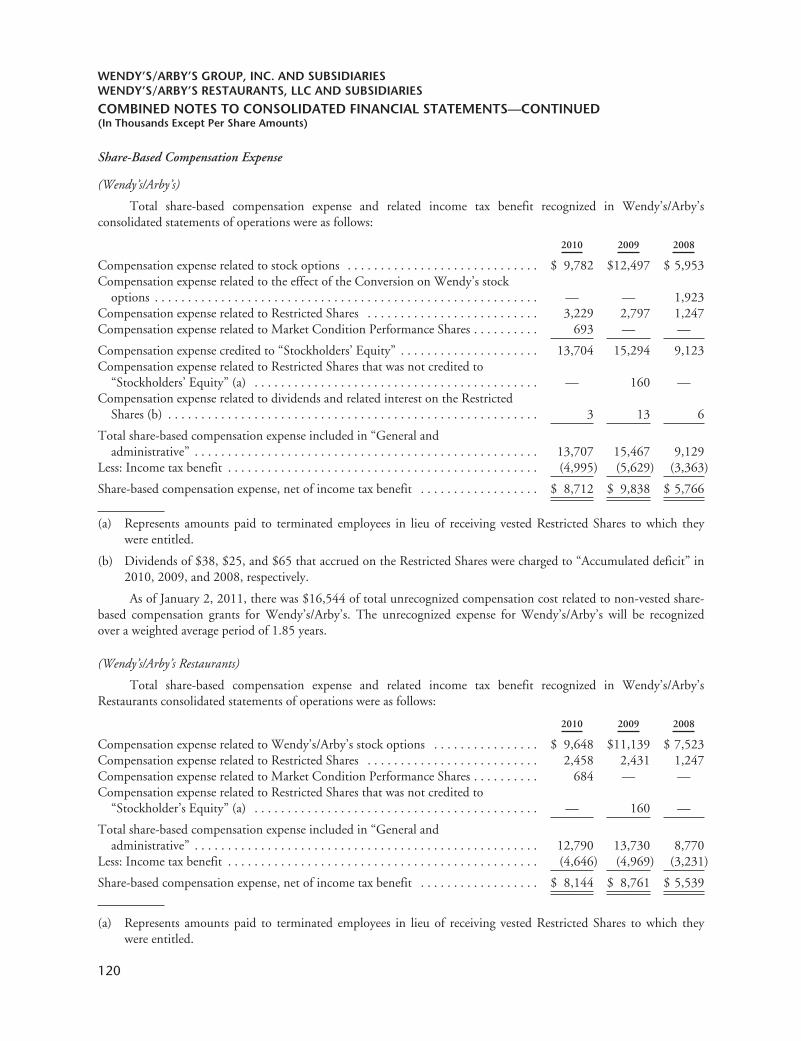
WENDY’S/ARBY’S GROUP, INC. AND SUBSIDIARIESWENDY’S/ARBY’S RESTAURANTS, LLC AND SUBSIDIARIES
COMBINED NOTES TO CONSOLIDATED FINANCIAL STATEMENTS—CONTINUED(In Thousands Except Per Share Amounts)
Share-Based Compensation Expense
(Wendy’s/Arby’s)
Total share-based compensation expense and related income tax benefit recognized in Wendy’s/Arby’sconsolidated statements of operations were as follows:
2010 2009 2008
Compensation expense related to stock options . . . . . . . . . . . . . . . . . . . . . . . . . . . . . $ 9,782 $12,497 $ 5,953Compensation expense related to the effect of the Conversion on Wendy’s stock
options . . . . . . . . . . . . . . . . . . . . . . . . . . . . . . . . . . . . . . . . . . . . . . . . . . . . . . . . . . — — 1,923Compensation expense related to Restricted Shares . . . . . . . . . . . . . . . . . . . . . . . . . . 3,229 2,797 1,247Compensation expense related to Market Condition Performance Shares . . . . . . . . . . 693 — —
Compensation expense credited to “Stockholders’ Equity” . . . . . . . . . . . . . . . . . . . . . 13,704 15,294 9,123Compensation expense related to Restricted Shares that was not credited to
“Stockholders’ Equity” (a) . . . . . . . . . . . . . . . . . . . . . . . . . . . . . . . . . . . . . . . . . . . — 160 —Compensation expense related to dividends and related interest on the Restricted
Shares (b) . . . . . . . . . . . . . . . . . . . . . . . . . . . . . . . . . . . . . . . . . . . . . . . . . . . . . . . . 3 13 6
Total share-based compensation expense included in “General andadministrative” . . . . . . . . . . . . . . . . . . . . . . . . . . . . . . . . . . . . . . . . . . . . . . . . . . . . 13,707 15,467 9,129
Less: Income tax benefit . . . . . . . . . . . . . . . . . . . . . . . . . . . . . . . . . . . . . . . . . . . . . . . (4,995) (5,629) (3,363)
Share-based compensation expense, net of income tax benefit . . . . . . . . . . . . . . . . . . $ 8,712 $ 9,838 $ 5,766
(a) Represents amounts paid to terminated employees in lieu of receiving vested Restricted Shares to which theywere entitled.
(b) Dividends of $38, $25, and $65 that accrued on the Restricted Shares were charged to “Accumulated deficit” in2010, 2009, and 2008, respectively.
As of January 2, 2011, there was $16,544 of total unrecognized compensation cost related to non-vested share-based compensation grants for Wendy’s/Arby’s. The unrecognized expense for Wendy’s/Arby’s will be recognizedover a weighted average period of 1.85 years.
(Wendy’s/Arby’s Restaurants)
Total share-based compensation expense and related income tax benefit recognized in Wendy’s/Arby’sRestaurants consolidated statements of operations were as follows:
2010 2009 2008
Compensation expense related to Wendy’s/Arby’s stock options . . . . . . . . . . . . . . . . $ 9,648 $11,139 $ 7,523Compensation expense related to Restricted Shares . . . . . . . . . . . . . . . . . . . . . . . . . . 2,458 2,431 1,247Compensation expense related to Market Condition Performance Shares . . . . . . . . . . 684 — —Compensation expense related to Restricted Shares that was not credited to
“Stockholder’s Equity” (a) . . . . . . . . . . . . . . . . . . . . . . . . . . . . . . . . . . . . . . . . . . . — 160 —
Total share-based compensation expense included in “General andadministrative” . . . . . . . . . . . . . . . . . . . . . . . . . . . . . . . . . . . . . . . . . . . . . . . . . . . . 12,790 13,730 8,770
Less: Income tax benefit . . . . . . . . . . . . . . . . . . . . . . . . . . . . . . . . . . . . . . . . . . . . . . . (4,646) (4,969) (3,231)
Share-based compensation expense, net of income tax benefit . . . . . . . . . . . . . . . . . . $ 8,144 $ 8,761 $ 5,539
(a) Represents amounts paid to terminated employees in lieu of receiving vested Restricted Shares to which theywere entitled.
120

WENDY’S/ARBY’S GROUP, INC. AND SUBSIDIARIESWENDY’S/ARBY’S RESTAURANTS, LLC AND SUBSIDIARIES
COMBINED NOTES TO CONSOLIDATED FINANCIAL STATEMENTS—CONTINUED(In Thousands Except Per Share Amounts)
As of January 2, 2011, there was $15,814 of total unrecognized compensation cost related to non-vested share-based compensation grants for Wendy’s/Arby’s Restaurants. The unrecognized expense for Wendy’s/Arby’sRestaurants will be recognized over a weighted average period of 1.87 years.
(16) Facilities Relocation and Restructuring
The facilities relocation and restructuring charges are summarized below:
2009 2008
Wendy’s Restaurants segment . . . . . . . . . . . . . . . . . . . . . . . . . . . . . . . . . . . . . . . . . . $ 8,088 $3,101Arby’s Restaurants segment . . . . . . . . . . . . . . . . . . . . . . . . . . . . . . . . . . . . . . . . . . . (72) 120
Total Wendy’s/Arby’s Restaurants . . . . . . . . . . . . . . . . . . . . . . . . . . . . . . . . . . 8,016 3,221Corporate . . . . . . . . . . . . . . . . . . . . . . . . . . . . . . . . . . . . . . . . . . . . . . . . . . . . . . . . . 3,008 692
Total Wendy’s/Arby’s . . . . . . . . . . . . . . . . . . . . . . . . . . . . . . . . . . . . . . . . $11,024 $3,913
The Companies incurred restructuring charges in 2009 and 2008 primarily related to severance as a result ofthe Wendy’s Merger. We do not expect to incur any additional restructuring charges with respect to the Wendy’sMerger. The Wendy’s/Arby’s Corporate charges for 2008 related to costs incurred under a prior restructuring planthat was completed in 2008.
The components of facilities relocation and restructuring charges in 2010 and 2009 and an analysis of relatedactivity in the facilities relocation and restructuring accrual were as follows:
2010
BalanceJanuary 3,
2010 Adjustments Payments
BalanceJanuary 2,
2011
TotalIncurredto Date
Wendy’s restaurant segment:Cash obligations:
Severance costs . . . . . . . . . . . . . . . . . . . . . . . . . . . . . . $5,630 $(111) $(5,387) $132 $ 11,189
Total Wendy’s restaurant segment . . . . . . . . . . . . . . 5,630 (111) (5,387) 132 11,189
Arby’s restaurant segment:Cash obligations:
Employee relocation costs . . . . . . . . . . . . . . . . . . . . — — — — 4,579Other . . . . . . . . . . . . . . . . . . . . . . . . . . . . . . . . . . . — — — — 7,471
— — — — 12,050Non-cash charges . . . . . . . . . . . . . . . . . . . . . . . . . . . . — — — — 719
Total Arby’s restaurant segment . . . . . . . . . . . . . . . — — — — 12,769
Total Wendy’s/Arby’s Restaurants . . . . . . . . . . . . . . . . . . . . 5,630 (111) (5,387) 132 23,958Corporate:
Cash obligations:Severance and retention incentive compensation . . . 500 (133) (92) 275 87,630
Non-cash charges . . . . . . . . . . . . . . . . . . . . . . . . . . . . . . — — — — 835
Total Corporate . . . . . . . . . . . . . . . . . . . . . . . . . . . 500 (133) (92) 275 88,465
Total Wendy’s/Arby’s . . . . . . . . . . . . . . . . . . . . . . . . . . . . . $6,130 $(244) $(5,479) $407 $112,423
121

WENDY’S/ARBY’S GROUP, INC. AND SUBSIDIARIESWENDY’S/ARBY’S RESTAURANTS, LLC AND SUBSIDIARIES
COMBINED NOTES TO CONSOLIDATED FINANCIAL STATEMENTS—CONTINUED(In Thousands Except Per Share Amounts)
2009
BalanceDecember 28,
2008 Provisions Payments
BalanceJanuary 3,
2010
TotalIncurredto Date
Wendy’s restaurant segment:Cash obligations:
Severance costs . . . . . . . . . . . . . . . . . . . . . . . . . . . $3,101 $ 8,088 $(5,559) $5,630 $ 11,189
Total Wendy’s restaurant segment . . . . . . . . . . 3,101 8,088 (5,559) 5,630 11,189
Arby’s restaurant segment:Cash obligations:
Employee relocation costs . . . . . . . . . . . . . . . . . . . 72 (72) — — 4,579Other . . . . . . . . . . . . . . . . . . . . . . . . . . . . . . . . . . — — — — 7,471
72 (72) — — 12,050Non-cash charges . . . . . . . . . . . . . . . . . . . . . . . . . . . . . — — — — 719
Total Arby’s restaurant segment . . . . . . . . . . . . 72 (72) — — 12,769
Total Wendy’s/Arby’s Restaurants . . . . . . . . . . . . . . . . . . 3,173 8,016 (5,559) 5,630 23,958
Corporate:Cash obligations:
Severance and retention incentivecompensation . . . . . . . . . . . . . . . . . . . . . . . . . . 962 3,008 (3,470) 500 87,630
Non-cash charges . . . . . . . . . . . . . . . . . . . . . . . . . — — — — 835
Total Corporate . . . . . . . . . . . . . . . . . . . . . . . . 962 3,008 (3,470) 500 88,465
Total Wendy’s/Arby’s . . . . . . . . . . . . . . . . . . . . . . . . . . . . $4,135 $11,024 $(9,029) $6,130 $112,423
(17) Impairment of Long-Lived Assets
The following is a summary of our impairment of long-lived assets losses by business segment:
2010 2009 2008
Wendy’s restaurant segment:Impairment of company-owned restaurants:
Properties . . . . . . . . . . . . . . . . . . . . . . . . . . . . . . . . . . . . . . . . . . $21,201 $21,263 $ 1,578Intangible assets . . . . . . . . . . . . . . . . . . . . . . . . . . . . . . . . . . . . . . 5,125 2,180 —
26,326 23,443 1,578
Arby’s restaurant segment:Impairment of company-owned restaurants:
Properties . . . . . . . . . . . . . . . . . . . . . . . . . . . . . . . . . . . . . . . . . . 37,264 51,019 6,906Intangible assets . . . . . . . . . . . . . . . . . . . . . . . . . . . . . . . . . . . . . . 5,887 5,494 1,096
43,151 56,513 8,002
Total Wendy’s/Arby’s Restaurants . . . . . . . . . . . . . . . . . . . . . . . . . . . . 69,477 79,956 9,580Aircraft . . . . . . . . . . . . . . . . . . . . . . . . . . . . . . . . . . . . . . . . . . . . — 2,176 9,623
Total Wendy’s/Arby’s . . . . . . . . . . . . . . . . . . . . . . . . . . . . . . . . . . . . . $69,477 $82,132 $19,203
The Wendy’s and Arby’s company-owned restaurant impairment losses in each year predominantly reflectedimpairment charges on all restaurant level assets resulting from the deterioration in operating performance of certainrestaurants, additional charges for capital improvements in restaurants impaired in a prior year which did not
122

WENDY’S/ARBY’S GROUP, INC. AND SUBSIDIARIESWENDY’S/ARBY’S RESTAURANTS, LLC AND SUBSIDIARIES
COMBINED NOTES TO CONSOLIDATED FINANCIAL STATEMENTS—CONTINUED(In Thousands Except Per Share Amounts)
subsequently recover, and write-downs in the carrying value of surplus properties and properties held for sale.Additionally, in 2010, the Wendy’s impairment losses included write-downs in the carrying value of options topurchase property.
During 2009, Wendy’s/Arby’s disposed of one of its owned aircraft and recorded additional impairment in2009 based on the sale price. At December 28, 2008, Wendy’s/Arby’s classified the aircraft as held-for-sale andrecorded an impairment charge to reflect its estimated fair value as a result of an appraisal related to its potential sale.
All of these impairment losses represented the excess of the carrying amount over the fair value of the affectedassets and are included in “Impairment of long-lived assets.” The fair values of impaired assets discussed above for theWendy’s and Arby’s restaurant segments were generally estimated based on the present values of the associated cashflows and on market value with respect to land (Level 3 inputs).
(18) Investment Income (Expense), Net
(Wendy’s/Arby’s)
2010 2009 2008
Interest income . . . . . . . . . . . . . . . . . . . . . . . . . . . . . . . . . . . . . . . . . . . . $ 14 $ 249 $ 1,285Distributions, including dividends . . . . . . . . . . . . . . . . . . . . . . . . . . . . . 248 205 2,818Gain on DFR Notes . . . . . . . . . . . . . . . . . . . . . . . . . . . . . . . . . . . . . . . . 4,909 — —Realized gains, net . . . . . . . . . . . . . . . . . . . . . . . . . . . . . . . . . . . . . . . . . . 179 2,948 8,460Unrealized losses, net . . . . . . . . . . . . . . . . . . . . . . . . . . . . . . . . . . . . . . . — — (1,128)Fee on early withdrawal of Equities Account . . . . . . . . . . . . . . . . . . . . . . — (5,500) —Other . . . . . . . . . . . . . . . . . . . . . . . . . . . . . . . . . . . . . . . . . . . . . . . . . . . (89) (910) (1,997)
$5,261 $(3,008) $ 9,438
(19) Other Than Temporary Losses on Investments
(Wendy’s/Arby’s)
2009 2008
Decline in fair value of DFR common stock . . . . . . . . . . . . . . . . . . . . . . . . . . . . . . $ — $ 68,086Allowance for doubtful accounts for DFR Notes . . . . . . . . . . . . . . . . . . . . . . . . . . — 21,227Decline in fair value of available-for-sale securities primarily held in the Equities
Account . . . . . . . . . . . . . . . . . . . . . . . . . . . . . . . . . . . . . . . . . . . . . . . . . . . . . . . 801 13,109Decline in fair value of cost method investments . . . . . . . . . . . . . . . . . . . . . . . . . . 3,115 10,319
$3,916 $112,741
(20) Discontinued Operations
(Wendy’s/Arby’s)
Prior to 2007, we sold the stock of the companies comprising our former premium beverage and soft drinkconcentrate business segments and the stock or the principal assets of the companies comprising its former utility andmunicipal services and refrigeration business segments. Wendy’s/Arby’s has accounted for all of these operations asdiscontinued operations.
123

WENDY’S/ARBY’S GROUP, INC. AND SUBSIDIARIESWENDY’S/ARBY’S RESTAURANTS, LLC AND SUBSIDIARIES
COMBINED NOTES TO CONSOLIDATED FINANCIAL STATEMENTS—CONTINUED(In Thousands Except Per Share Amounts)
Income from discontinued operations, net of taxes, for 2009 and 2008 consisted of the following:
2009 2008
Income from discontinued operations before income taxes . . . . . . . . . . . . . . . . . . . . $ 671 $ 242Reversals of tax reserves due to tax settlements . . . . . . . . . . . . . . . . . . . . . . . . . . . . . 1,143 1,701(Provision for) benefit from income taxes . . . . . . . . . . . . . . . . . . . . . . . . . . . . . . . . . (268) 274
Income from discontinued operations, net of income taxes . . . . . . . . . . . . . . . . . . . . $1,546 $2,217
(21) Retirement Benefit Plans
401(k) Plans
Subject to certain restrictions, the Companies have a 401(k) defined contribution plan (the “401(k) Plan”) forall of its employees who meet certain minimum requirements and elect to participate. Effective January 1, 2010, therewere prior existing 401(k) Plans (the “Prior Plans”) that were combined into the 401(k) Plan. The 401(k) Planpermits employees to contribute up to 75% of their compensation, subject to certain limitations and provides formatching contributions of employee contributions up to 4% of compensation and for discretionary profit sharingcontributions.
Under the Prior Plans, employees could contribute various percentages of their compensation ranging up to amaximum of 50% or 75%, depending on the respective plan, subject to certain limitations. The Prior Plans providedfor matching contributions of employee contributions up to 6% depending on the respective plan. Some of thesePrior Plans also permitted or required profit sharing contributions.
In connection with the matching and profit sharing contributions, the Companies provided compensationexpense in 2010, 2009 and 2008 as follows:
2010 2009 2008
Wendy’s/Arby’s Restaurants . . . . . . . . . . . . . . . . . . . . . . . . . . . . . . . . . $12,467 $11,796 $4,616Corporate . . . . . . . . . . . . . . . . . . . . . . . . . . . . . . . . . . . . . . . . . . . . . . . — 898 213
Wendy’s/Arby’s . . . . . . . . . . . . . . . . . . . . . . . . . . . . . . . . . . . . . . . . . . . $12,467 $12,694 $4,829
Pension Plans
Wendy’s had two domestic defined benefit plans which were assumed in connection with the Wendy’s Merger(the “Wendy’s Pension Plans”). The benefits under the Wendy’s Pension Plans were frozen prior to the Wendy’sMerger. In accordance with the terms of the Merger, Wendy’s obtained an actuarial valuation of the unfundedpension liability as of September 28, 2008. Wendy’s received approval for the termination of the Wendy’s PensionPlans by the Pension Benefit Guaranty Corporation and the Internal Revenue Service by the fourth quarter of2008. We made lump sum distributions and purchased annuities for the approved termination of the Wendy’sPension Plans in the fourth quarter of 2008 and paid $304 for certain plan settlements in the first quarter of2009. In December 2010, a final payment of $296 was made to the Pension Benefit Guaranty Corporation for one ofthe pension plans.
(Wendy’s/Arby’s)
Wendy’s/Arby’s maintains two domestic defined benefit plans, the benefits under which were frozen in 1988and for which Wendy’s/Arby’s has no unrecognized prior service cost. Arby’s employees who were eligible toparticipate through 1988 (the “Eligible Arby’s Employees”) are covered under one of these plans. The measurementdate used by Wendy’s/Arby’s in determining amounts related to its defined benefit plans is its current fiscal year endbased on the roll forward of an actuarial report.
124
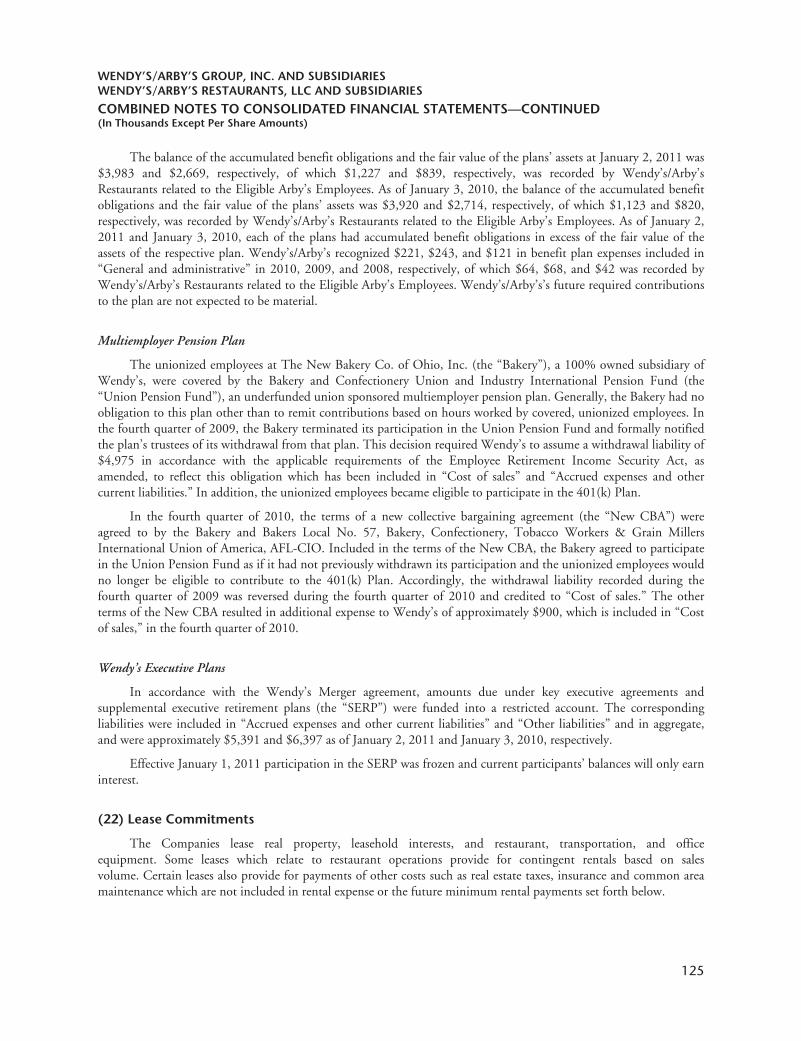
WENDY’S/ARBY’S GROUP, INC. AND SUBSIDIARIESWENDY’S/ARBY’S RESTAURANTS, LLC AND SUBSIDIARIES
COMBINED NOTES TO CONSOLIDATED FINANCIAL STATEMENTS—CONTINUED(In Thousands Except Per Share Amounts)
The balance of the accumulated benefit obligations and the fair value of the plans’ assets at January 2, 2011 was$3,983 and $2,669, respectively, of which $1,227 and $839, respectively, was recorded by Wendy’s/Arby’sRestaurants related to the Eligible Arby’s Employees. As of January 3, 2010, the balance of the accumulated benefitobligations and the fair value of the plans’ assets was $3,920 and $2,714, respectively, of which $1,123 and $820,respectively, was recorded by Wendy’s/Arby’s Restaurants related to the Eligible Arby’s Employees. As of January 2,2011 and January 3, 2010, each of the plans had accumulated benefit obligations in excess of the fair value of theassets of the respective plan. Wendy’s/Arby’s recognized $221, $243, and $121 in benefit plan expenses included in“General and administrative” in 2010, 2009, and 2008, respectively, of which $64, $68, and $42 was recorded byWendy’s/Arby’s Restaurants related to the Eligible Arby’s Employees. Wendy’s/Arby’s’s future required contributionsto the plan are not expected to be material.
Multiemployer Pension Plan
The unionized employees at The New Bakery Co. of Ohio, Inc. (the “Bakery”), a 100% owned subsidiary ofWendy’s, were covered by the Bakery and Confectionery Union and Industry International Pension Fund (the“Union Pension Fund”), an underfunded union sponsored multiemployer pension plan. Generally, the Bakery had noobligation to this plan other than to remit contributions based on hours worked by covered, unionized employees. Inthe fourth quarter of 2009, the Bakery terminated its participation in the Union Pension Fund and formally notifiedthe plan’s trustees of its withdrawal from that plan. This decision required Wendy’s to assume a withdrawal liability of$4,975 in accordance with the applicable requirements of the Employee Retirement Income Security Act, asamended, to reflect this obligation which has been included in “Cost of sales” and “Accrued expenses and othercurrent liabilities.” In addition, the unionized employees became eligible to participate in the 401(k) Plan.
In the fourth quarter of 2010, the terms of a new collective bargaining agreement (the “New CBA”) wereagreed to by the Bakery and Bakers Local No. 57, Bakery, Confectionery, Tobacco Workers & Grain MillersInternational Union of America, AFL-CIO. Included in the terms of the New CBA, the Bakery agreed to participatein the Union Pension Fund as if it had not previously withdrawn its participation and the unionized employees wouldno longer be eligible to contribute to the 401(k) Plan. Accordingly, the withdrawal liability recorded during thefourth quarter of 2009 was reversed during the fourth quarter of 2010 and credited to “Cost of sales.” The otherterms of the New CBA resulted in additional expense to Wendy’s of approximately $900, which is included in “Costof sales,” in the fourth quarter of 2010.
Wendy’s Executive Plans
In accordance with the Wendy’s Merger agreement, amounts due under key executive agreements andsupplemental executive retirement plans (the “SERP”) were funded into a restricted account. The correspondingliabilities were included in “Accrued expenses and other current liabilities” and “Other liabilities” and in aggregate,and were approximately $5,391 and $6,397 as of January 2, 2011 and January 3, 2010, respectively.
Effective January 1, 2011 participation in the SERP was frozen and current participants’ balances will only earninterest.
(22) Lease Commitments
The Companies lease real property, leasehold interests, and restaurant, transportation, and officeequipment. Some leases which relate to restaurant operations provide for contingent rentals based on salesvolume. Certain leases also provide for payments of other costs such as real estate taxes, insurance and common areamaintenance which are not included in rental expense or the future minimum rental payments set forth below.
125

WENDY’S/ARBY’S GROUP, INC. AND SUBSIDIARIESWENDY’S/ARBY’S RESTAURANTS, LLC AND SUBSIDIARIES
COMBINED NOTES TO CONSOLIDATED FINANCIAL STATEMENTS—CONTINUED(In Thousands Except Per Share Amounts)
Rental expense under operating leases consists of the following components:
2010
Wendy’s/Arby’sRestaurants Corporate Wendy’s/Arby’s
Minimum rentals . . . . . . . . . . . . . . . . . . . . . . . . . . . . . . . . . $145,955 $ 1,262 $147,217Contingent rentals . . . . . . . . . . . . . . . . . . . . . . . . . . . . . . . . 11,246 — 11,246
157,201 1,262 158,463Less sublease income . . . . . . . . . . . . . . . . . . . . . . . . . . . . . . . (18,075) (1,506) (19,581)
$139,126 $ (244) $138,882
2009
Wendy’s/Arby’sRestaurants Corporate Wendy’s/Arby’s
Minimum rentals . . . . . . . . . . . . . . . . . . . . . . . . . . . . . . . . . $151,217 $ 1,723 $152,940Contingent rentals . . . . . . . . . . . . . . . . . . . . . . . . . . . . . . . . 12,364 — 12,364
163,581 1,723 165,304Less sublease income . . . . . . . . . . . . . . . . . . . . . . . . . . . . . . . (20,089) (1,580) (21,669)
$143,492 $ 143 $143,635
2008
Wendy’s/Arby’sRestaurants Corporate Wendy’s/Arby’s
Minimum rentals . . . . . . . . . . . . . . . . . . . . . . . . . . . . . . . . . $94,069 $ 1,849 $ 95,918Contingent rentals . . . . . . . . . . . . . . . . . . . . . . . . . . . . . . . . 4,989 — 4,989
99,058 1,849 100,907Less sublease income . . . . . . . . . . . . . . . . . . . . . . . . . . . . . . . (4,771) (1,371) (6,142)
$94,287 $ 478 $ 94,765
126

WENDY’S/ARBY’S GROUP, INC. AND SUBSIDIARIESWENDY’S/ARBY’S RESTAURANTS, LLC AND SUBSIDIARIES
COMBINED NOTES TO CONSOLIDATED FINANCIAL STATEMENTS—CONTINUED(In Thousands Except Per Share Amounts)
The Companies’ future minimum rental payments and rental receipts, for non-cancelable leases, includingrental receipts for leased properties owned by the Companies, having an initial lease term in excess of one year as ofJanuary 2, 2011, are as follows:
Rental Payments Rental Receipts
Fiscal Year
Sale-Leaseback
ObligationsCapitalized
LeasesOperatingLeases (a)
Sale-Leaseback
ObligationsCapitalized
LeasesOperatingLeases (a)
OwnedProperties
2011 . . . . . . . . . . . . . . . . . . . . . . . . . . . . . $ 14,948 $ 15,856 $ 150,465 $ 966 $ 291 $12,501 $ 7,0642012 . . . . . . . . . . . . . . . . . . . . . . . . . . . . . 15,406 12,372 140,592 966 291 11,271 7,0012013 . . . . . . . . . . . . . . . . . . . . . . . . . . . . . 14,824 12,729 131,518 946 291 9,541 6,5902014 . . . . . . . . . . . . . . . . . . . . . . . . . . . . . 14,814 12,899 120,996 931 291 8,493 6,3932015 . . . . . . . . . . . . . . . . . . . . . . . . . . . . . 15,640 13,912 112,363 887 291 7,551 6,113Thereafter . . . . . . . . . . . . . . . . . . . . . . . . . 137,459 108,766 1,032,878 3,440 1,279 36,175 45,731
Total minimum payments . . . . . . . . . . . . . 213,091 176,534 $1,688,812 $8,136 $2,734 $85,532 $78,892
Less amounts representing interest, withinterest rates of between 3% and 22% . . (91,207) (89,864)
Present value of minimum sale leasebackand capitalized lease payments . . . . . . . . $121,884 $ 86,670
(a) In addition to the amounts presented in the table above, Wendy’s/Arby’s has rental payments of $1,605 and$673, and rental receipts of $1,360 and $567 in 2011 and 2012, both respectively, under the lease for Wendy’s/Arby’s former corporate headquarters and of the sublease for office space on two of the floors covered under thelease to personnel from a management company formed by our Chairman, who was our former Chief ExecutiveOfficer, and our Vice Chairman, who was our former President and Chief Operating Officer, and a director,who was our former Vice Chairman (the “Management Company”).
As of January 2, 2011, the Companies had $106,578 of “Favorable leases,” net of accumulated amortization,included in “Other intangible assets” and $82,499 of unfavorable leases included in “Other liabilities,” or $24,079 ofnet favorable leases. The future minimum rental payments set forth above reflect the rent expense to be recognizedover the lease terms and, accordingly, have been increased by the $24,079 of net favorable leases, net of (1) $40,941of Straight-Line Rent and (2) $2,207 which represents amounts advanced by landlords for improvements of leasedfacilities and reimbursed through future rent payments, less payments to lessees for the right to assume leases whichhave below market rent. Estimated sublease future rental receipts exclude sublessor rental obligations for closedlocations.
Properties leased by the Companies to third parties under capitalized leases and operating leases as of January 2,2011 and January 3, 2010 include:
Year End
2010 2009
Land . . . . . . . . . . . . . . . . . . . . . . . . . . . . . . . . . . . . . . . . . . . . . . . . . . . . . . . . . . . $ 27,434 $26,325Buildings and improvements . . . . . . . . . . . . . . . . . . . . . . . . . . . . . . . . . . . . . . . . . 64,825 58,450Office, restaurant and transportation equipment . . . . . . . . . . . . . . . . . . . . . . . . . . 4,133 4,437
96,392 89,212Accumulated depreciation and amortization . . . . . . . . . . . . . . . . . . . . . . . . . . . . . (18,344) (9,885)
$ 78,048 $79,327
The present values of minimum sale-leaseback and capitalized lease payments are included either with “Long-term debt” or “Current portion of long-term debt,” as applicable.
127
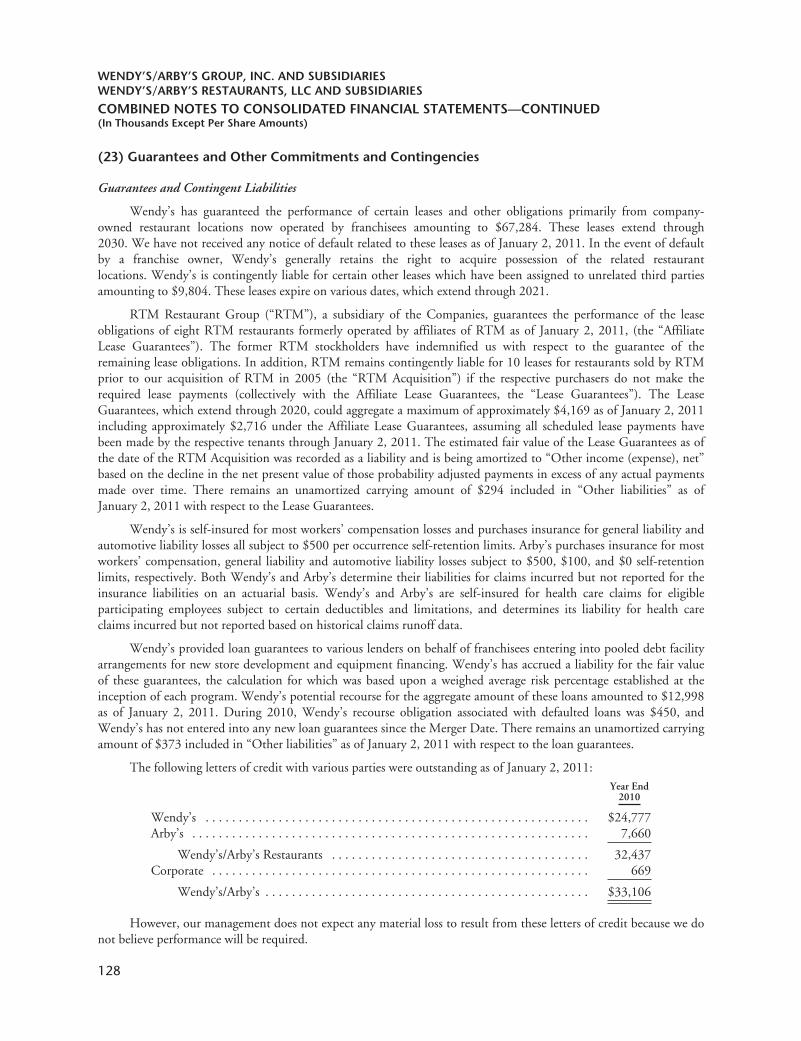
WENDY’S/ARBY’S GROUP, INC. AND SUBSIDIARIESWENDY’S/ARBY’S RESTAURANTS, LLC AND SUBSIDIARIES
COMBINED NOTES TO CONSOLIDATED FINANCIAL STATEMENTS—CONTINUED(In Thousands Except Per Share Amounts)
(23) Guarantees and Other Commitments and Contingencies
Guarantees and Contingent Liabilities
Wendy’s has guaranteed the performance of certain leases and other obligations primarily from company-owned restaurant locations now operated by franchisees amounting to $67,284. These leases extend through2030. We have not received any notice of default related to these leases as of January 2, 2011. In the event of defaultby a franchise owner, Wendy’s generally retains the right to acquire possession of the related restaurantlocations. Wendy’s is contingently liable for certain other leases which have been assigned to unrelated third partiesamounting to $9,804. These leases expire on various dates, which extend through 2021.
RTM Restaurant Group (“RTM”), a subsidiary of the Companies, guarantees the performance of the leaseobligations of eight RTM restaurants formerly operated by affiliates of RTM as of January 2, 2011, (the “AffiliateLease Guarantees”). The former RTM stockholders have indemnified us with respect to the guarantee of theremaining lease obligations. In addition, RTM remains contingently liable for 10 leases for restaurants sold by RTMprior to our acquisition of RTM in 2005 (the “RTM Acquisition”) if the respective purchasers do not make therequired lease payments (collectively with the Affiliate Lease Guarantees, the “Lease Guarantees”). The LeaseGuarantees, which extend through 2020, could aggregate a maximum of approximately $4,169 as of January 2, 2011including approximately $2,716 under the Affiliate Lease Guarantees, assuming all scheduled lease payments havebeen made by the respective tenants through January 2, 2011. The estimated fair value of the Lease Guarantees as ofthe date of the RTM Acquisition was recorded as a liability and is being amortized to “Other income (expense), net”based on the decline in the net present value of those probability adjusted payments in excess of any actual paymentsmade over time. There remains an unamortized carrying amount of $294 included in “Other liabilities” as ofJanuary 2, 2011 with respect to the Lease Guarantees.
Wendy’s is self-insured for most workers’ compensation losses and purchases insurance for general liability andautomotive liability losses all subject to $500 per occurrence self-retention limits. Arby’s purchases insurance for mostworkers’ compensation, general liability and automotive liability losses subject to $500, $100, and $0 self-retentionlimits, respectively. Both Wendy’s and Arby’s determine their liabilities for claims incurred but not reported for theinsurance liabilities on an actuarial basis. Wendy’s and Arby’s are self-insured for health care claims for eligibleparticipating employees subject to certain deductibles and limitations, and determines its liability for health careclaims incurred but not reported based on historical claims runoff data.
Wendy’s provided loan guarantees to various lenders on behalf of franchisees entering into pooled debt facilityarrangements for new store development and equipment financing. Wendy’s has accrued a liability for the fair valueof these guarantees, the calculation for which was based upon a weighed average risk percentage established at theinception of each program. Wendy’s potential recourse for the aggregate amount of these loans amounted to $12,998as of January 2, 2011. During 2010, Wendy’s recourse obligation associated with defaulted loans was $450, andWendy’s has not entered into any new loan guarantees since the Merger Date. There remains an unamortized carryingamount of $373 included in “Other liabilities” as of January 2, 2011 with respect to the loan guarantees.
The following letters of credit with various parties were outstanding as of January 2, 2011:Year End
2010
Wendy’s . . . . . . . . . . . . . . . . . . . . . . . . . . . . . . . . . . . . . . . . . . . . . . . . . . . . . . . . . . $24,777Arby’s . . . . . . . . . . . . . . . . . . . . . . . . . . . . . . . . . . . . . . . . . . . . . . . . . . . . . . . . . . . . 7,660
Wendy’s/Arby’s Restaurants . . . . . . . . . . . . . . . . . . . . . . . . . . . . . . . . . . . . . . . 32,437Corporate . . . . . . . . . . . . . . . . . . . . . . . . . . . . . . . . . . . . . . . . . . . . . . . . . . . . . . . . . 669
Wendy’s/Arby’s . . . . . . . . . . . . . . . . . . . . . . . . . . . . . . . . . . . . . . . . . . . . . . . . . $33,106
However, our management does not expect any material loss to result from these letters of credit because we donot believe performance will be required.
128

WENDY’S/ARBY’S GROUP, INC. AND SUBSIDIARIESWENDY’S/ARBY’S RESTAURANTS, LLC AND SUBSIDIARIES
COMBINED NOTES TO CONSOLIDATED FINANCIAL STATEMENTS—CONTINUED(In Thousands Except Per Share Amounts)
Purchase and Capital Commitments
Beverage Agreements
Wendy’s and Arby’s have entered into beverage agreements with certain beverage vendors to provide fountainbeverage products and certain marketing support funding to the Companies and their franchisees. These agreementsrequire minimum purchases of fountain beverage syrup (“Syrup”), by the Companies and their franchisees at certainpreferred prices until the total contractual gallon volume usage has been reached. In connection with these contracts,the Companies and their national advertising funds (on behalf of the Companies’ franchisees) received certain upfrontfees at the inception of the contract which are being amortized based on Syrup usage over the contract term. Inaddition, these agreements provide various annual fees paid to us, based on the vendor’s expectation of annual Syrupusage of the Companies, which are amortized over annual usage as a reduction of “Cost of Sales” costs. Theunamortized amounts of upfront fees are included in “Deferred income” and usage that exceeds estimated amountsare included in “Accounts and notes receivable.”
Beverage purchases made by the Companies under these various agreements during 2010, 2009 and 2008 wereapproximately $28,264, $27,932 and $13,908, respectively. Future purchases by the Companies under these beveragepurchase requirements are estimated to be approximately $28,806 per year over the next five years. Based on currentpreferred prices and the current ratio of sales at company-owned restaurants to franchised restaurants, the totalremaining Companies’ beverage requirements are approximately $227,550 over the remaining life of the contracts. Asof January 2, 2011, $1,001 is due from beverage vendors and included in “Accounts and notes receivables” for thedifference in Syrup usage in 2010 over originally estimated annual usage amounts plus other contract provisions, and$1,635 is included in “Deferred income” relating to the remaining unamortized upfront fees.
Advertising Commitments
Arby’s had purchase commitments of approximately $2,814 related to execution of advertising strategy,including agency fees and media buy obligations for 2011. Because most media purchase commitments can becanceled within 90 days of scheduled broadcast, the Companies do not believe that termination of these agreementswould have a significant impact on the Companies’ operations. All of Wendy’s advertising commitments at January 2,2011 were incurred by the Wendy’s National Advertising Program, Inc.
Capital Expenditures Commitments
As of January 2, 2011, the Companies have $18,195 of outstanding commitments for capital expenditures, ofwhich $14,542 is expected to be paid in 2011.
Effective February 2011, certain lenders are offering financing to Wendy’s United States franchisees to purchasenew equipment and smallwares and modify other equipment needed to implement Wendy’s new hamburger productroll out. Wendy’s has agreed to subsidize a portion of the interest, which is estimated to be approximately $1,500,that would otherwise be payable by the franchisees participating in this financing program. The program is expectedto end in September 2011.
AFA Dues Subsidy
The AFA Service Corporation (“AFA”), an independent membership corporation in which every domesticArby’s franchisee is required to participate, was formed to create advertising and perform marketing for the Arby’ssystem. Effective January 3, 2011 and for the remainder of 2011, the AFA Board has approved a tiered dues ratestructure for the payment of the advertising and marketing service fee ranging between 1.25% and 3.5% of grossmonthly sales. In addition, Arby’s agreed to partially subsidize the top two rate tiers in 2011 thereby decreasing thefranchisees’ effective dues contribution rate percentages to 2.6% and 3.1%. This subsidy will require payments byArby’s of approximately $2,900 to AFA for 2011. The 2010 subsidy for the top two tiers paid by Arby’s wasapproximately $2,635.
129

WENDY’S/ARBY’S GROUP, INC. AND SUBSIDIARIESWENDY’S/ARBY’S RESTAURANTS, LLC AND SUBSIDIARIES
COMBINED NOTES TO CONSOLIDATED FINANCIAL STATEMENTS—CONTINUED(In Thousands Except Per Share Amounts)
(24) Transactions with Related Parties
The following is a summary of transactions between the Companies and their related parties:2010 2009 2008
Strategic Sourcing Group agreement (a) . . . . . . . . . . . . . . . . . . . . . . . . . . . . . . . . . . $ 5,145 $ — $ —Wendy’s Co-op Agreement (b) . . . . . . . . . . . . . . . . . . . . . . . . . . . . . . . . . . . . . . . . — 15,500 —Subleases with related parties (c) . . . . . . . . . . . . . . . . . . . . . . . . . . . . . . . . . . . . . . . (346) (213) (227)Interest income on revolving credit facility (d) . . . . . . . . . . . . . . . . . . . . . . . . . . . . . (463) (4) —AFA dues subsidy (e) . . . . . . . . . . . . . . . . . . . . . . . . . . . . . . . . . . . . . . . . . . . . . . . . 2,635 — —Advisory fees (g) . . . . . . . . . . . . . . . . . . . . . . . . . . . . . . . . . . . . . . . . . . . . . . . . . . . . 2,465 5,368 —Charitable contributions to the Dave Thomas Foundation for Adoption (o) . . . . . . — — 1,000Charitable contributions to Foundation (p) . . . . . . . . . . . . . . . . . . . . . . . . . . . . . . . 500 500 500
(Wendy’s/Arby’s)Advisory fees (f) . . . . . . . . . . . . . . . . . . . . . . . . . . . . . . . . . . . . . . . . . . . . . . . . . . . . $ 1,000 $ — $ —Services Agreement (h) . . . . . . . . . . . . . . . . . . . . . . . . . . . . . . . . . . . . . . . . . . . . . . . — 3,500 9,500Sublease income (i) . . . . . . . . . . . . . . . . . . . . . . . . . . . . . . . . . . . . . . . . . . . . . . . . . (1,632) (1,886) (1,633)Executive use of corporate aircraft (j) . . . . . . . . . . . . . . . . . . . . . . . . . . . . . . . . . . . . (120) (613) (3,028)Sale of helicopter interest (k) . . . . . . . . . . . . . . . . . . . . . . . . . . . . . . . . . . . . . . . . . . — — (1,860)Equities Account (l) . . . . . . . . . . . . . . . . . . . . . . . . . . . . . . . . . . . . . . . . . . . . . . . . . — — 38Withdrawal Agreement (m) . . . . . . . . . . . . . . . . . . . . . . . . . . . . . . . . . . . . . . . . . . . — (37,401) —Liquidation Services Agreement (n) . . . . . . . . . . . . . . . . . . . . . . . . . . . . . . . . . . . . . 441 239 —Distributions to co-investment shareholders (q) . . . . . . . . . . . . . . . . . . . . . . . . . . . . — (795) (2,014)
Transactions with Purchasing Cooperatives, Foundation, and AFA
(a) On April 5, 2010, the Wendy’s independent purchasing cooperative Quality Supply Chain Co-op (“QSCC”)and the Arby’s independent purchasing cooperative (“ARCOP”), in consultation with Wendy’s/Arby’sRestaurants, established Strategic Sourcing Group Co-op, LLC (“SSG”). SSG was formed to manage and operatepurchasing programs which combine the purchasing power of both Wendy’s and Arby’s company-owned andfranchised restaurants to create buying efficiencies for certain non-perishable goods, equipment, and services.
In order to facilitate the orderly transition of this purchasing function for the Companies’ North Americaoperations, Wendy’s/Arby’s Restaurants transferred certain contracts, assets and certain Wendy’s/Arby’sRestaurants purchasing employees to SSG in the second quarter of 2010. Wendy’s/Arby’s Restaurants hadcommitted to pay approximately $5,145 of SSG expenses, which were expensed in 2010 and included in“General and administrative,” and was to be paid over a 24 month period through March 2012. We madepayments of $2,000 in 2010.
Should a sale of Arby’s occur as discussed in Note 1, under the change of control provisions in the agreement thatestablished SSG, the activities of SSG would be wound up. In the wind up process, the assets, personnel andfunctions of SSG would be transferred to QSCC and ARCOP as such parties and Wendy’s/Arby’s Restaurantsagree. In contemplation of a possible sale, the parties are in discussion regarding the dissolution of SSG andtransferring SSG’s assets, personnel and functions to QSCC and ARCOP.
(b) During the 2009 fourth quarter, Wendy’s entered into a purchasing co-op relationship agreement (the “Co-opAgreement”) to establish QSCC. QSCC manages food and related product purchases and distribution services forthe Wendy’s system in the United States and Canada. Through QSCC, Wendy’s and Wendy’s franchiseespurchase food, proprietary paper and operating supplies under national contracts with pricing based upon totalsystem volume.
QSCC’s supply chain management facilitates continuity of supply and provides consolidated purchasingefficiencies while monitoring and seeking to minimize possible obsolete inventory throughout the Wendy’s NorthAmerica supply chain. The system’s purchasing function for 2009 and prior was performed and paid for by
130

WENDY’S/ARBY’S GROUP, INC. AND SUBSIDIARIESWENDY’S/ARBY’S RESTAURANTS, LLC AND SUBSIDIARIES
COMBINED NOTES TO CONSOLIDATED FINANCIAL STATEMENTS—CONTINUED(In Thousands Except Per Share Amounts)
Wendy’s. In order to facilitate the orderly transition of the 2010 purchasing function for North Americaoperations, Wendy’s transferred certain contracts, assets and certain Wendy’s purchasing employees to QSCC inthe first quarter of 2010. Pursuant to the terms of the Co-op Agreement, Wendy’s was required to pay $15,500to QSCC over an 18 month period through May 2011 in order to provide funding for start-up costs, operatingexpenses and cash reserves. The required payments by Wendy’s under the Co-op Agreement were expensed in thefourth quarter of 2009 and included in “General and administrative.” Wendy’s made payments of $15,195 in2010. In connection with the ongoing operations of QSCC during 2010, QSCC reimbursed Wendy’s $913 foramounts Wendy’s had paid primarily for payroll-related expenses for certain Canadian QSCC purchasingemployees.
(c) ARCOP subleased approximately 4,500 square feet of the corporate headquarters office space from Arby’s in2010, and 2,680 square feet in 2009 and 2008. The Arby’s Foundation, Inc. (the “Foundation”), a not-for-profitcharitable foundation in which Arby’s has non-controlling representation on the board of directors, subleasedapproximately 3,800 square feet of the corporate headquarters office space from Arby’s in 2010, 2009 and 2008.Effective January 4, 2010, QSCC subleased approximately 9,333 square feet of office space fromWendy’s. Effective April 5, 2010, the SSG leased 2,300 square feet of office space from Arby’s. The Companiesreceived $104, $106, and $111, of sublease income from ARCOP in 2010, 2009, and 2008, respectively, $105,$107 and $116 of sublease income from Foundation in 2010, 2009, and 2008, respectively, $113 of subleaseincome from QSCC in 2010, and $24 of sublease income from SSG in 2010.
(d) In December 2009, and as amended in February and August 2010, AFA entered into a revolving loan agreementwith Arby’s. The terms of this agreement allow AFA to have revolving loans of up to $14,000 outstanding withan expiration date of March 2012 and bearing interest at 7.5% per annum. In February 2011, the maximumprincipal amount of revolving loans was reduced to $11,000. As of January 2, 2011 and January 3, 2010, theoutstanding revolving loan balance was $4,458 and $5,089, respectively. Arby’s received interest income of $463and $4 in 2010 and 2009, respectively, which is included in “Other income (expense).”
(e) Beginning in January 2010 and through March 2010, Arby’s and most domestic Arby’s franchisees paid 1.2% ofsales as member dues to AFA. Beginning in April 2010 and for the remainder of 2010, the AFA Board approveda dues increase based on a tiered rate structure for the payment of the advertising and marketing service feeranging between 1.4% and 3.6% of sales. As a result, the average Arby’s advertising and marketing service feepercentage from April 2010 to the end of the 2010 fiscal year was approximately 2.3%. In addition, Arby’spartially subsidized the top two rate tiers in 2010 thereby decreasing franchisees’ effective advertising andmarketing service fee percentages. This subsidy required payments by Arby’s of $2,635 to AFA in 2010.
Transactions with the Management Company
(f) Wendy’s/Arby’s and the Management Company entered into a new services agreement (the “New ServicesAgreement”), which commenced on July 1, 2009 and will continue until June 30, 2011, unless soonerterminated. Under the New Services Agreement, the Management Company assists us with strategic merger andacquisition consultation, corporate finance and investment banking services and related legal matters. Pursuant tothe terms of this agreement, Wendy’s/Arby’s is paying the Management Company a service fee of $250 perquarter, payable in advance commencing July 1, 2009. In addition, in the event the Management Companyprovides substantial assistance to us in connection with a merger or acquisition, corporate finance and/or similartransaction that is consummated at any time during the period commencing on the date the New ServicesAgreement was executed and ending six months following the expiration of its term, Wendy’s/Arby’s willnegotiate a success fee to be paid to the Management Company which is reasonable and customary for suchtransactions. In addition, Wendy’s/Arby’s incurred service fees of $1,000 in 2010, which are included in“General and administrative.”
(g) The Companies paid approximately $2,465 and $5,368 in 2010 and 2009, respectively, in fees for corporatefinance advisory services under the New Services Agreement in connection with the negotiation and execution ofthe Credit Agreement in 2010 and the issuance of the Senior Notes in 2009.
131

WENDY’S/ARBY’S GROUP, INC. AND SUBSIDIARIESWENDY’S/ARBY’S RESTAURANTS, LLC AND SUBSIDIARIES
COMBINED NOTES TO CONSOLIDATED FINANCIAL STATEMENTS—CONTINUED(In Thousands Except Per Share Amounts)
(h) In connection with its 2007 restructuring, Wendy’s/Arby’s entered into an agreement with the ManagementCompany for the provision of services under a two-year transition services agreement (the “Services Agreement”),effective June 30, 2007, pursuant to which the Management Company provided Wendy’s/Arby’s with a range ofprofessional and strategic services. Under the Services Agreement, which expired on June 30, 2009 and wassuperseded by the New Services Agreement, Wendy’s/Arby’s paid the Management Company $3,000 per quarterfor the first year of services and $1,750 per quarter for the second year of services. Wendy’s/Arby’s incurred$3,500 and $9,500 of such service fees for 2009 and 2008, respectively, which are included in “General andadministrative.”
(i) In July 2008 and July 2007, Wendy’s/Arby’s entered into agreements under which the Management Company issubleasing (the “Subleases”) office space on two of the floors of the Company’s former New Yorkheadquarters. Under the terms of the Subleases, the Management Company paid Wendy’s/Arby’s approximately$157 and $153 in 2009 and 2008, respectively, per month, which included an amount equal to the rentWendy’s/Arby’s pays plus a fixed amount reflecting a portion of the increase in the then fair market value ofWendy’s/Arby’s leasehold interest, as well as amounts for property taxes and the other costs related to the use ofthe space. During the second quarter of 2010, Wendy’s/Arby’s and the Management Company entered into anamendment to the sublease, effective April 1, 2010, pursuant to which the Management Company’s earlytermination right was cancelled in exchange for a reduction in rent. Under the terms of the amended sublease, thesublease is not cancelable prior to the expiration of the prime lease and the Management Company pays rent toWendy’s/Arby’s in an amount that covers substantially all of the Company’s rent obligations under the primelease for the subleased space. Wendy’s/Arby’s recognized $1,632, $1,886, and $1,633 from the ManagementCompany under the Subleases for 2010, 2009, and 2008, respectively, which has been recorded as a reduction of“General and administrative.”
(j) In August 2007, Wendy’s/Arby’s entered into time share agreements under which the Chairman and then ChiefExecutive Officer and the Vice Chairman and then President and Chief Operating Officer of Wendy’s/Arby’s(the “Former Executives”) and the Management Company used two Wendy’s/Arby’s corporate aircraft inexchange for payment of certain incremental flight and related costs of such aircraft. Those time share agreementsexpired during the second quarter of 2009 and, in the third quarter of 2009, one of the aircraft was sold to anunrelated third party. Such reimbursements for 2009 and 2008 amounted to $553 and $3,028 and have beenrecognized as a reduction of “General and administrative.”
In June 2009, Wendy’s/Arby’s and TASCO, LLC (an affiliate of the Management Company) (“TASCO”)entered into an aircraft lease agreement (the “Aircraft Lease Agreement”) for the other aircraft that was previouslyunder the time share agreement mentioned above. The Aircraft Lease Agreement originally provided thatWendy’s/Arby’s would lease such corporate aircraft to TASCO from July 1, 2009 until June 30, 2010. Under theAircraft Lease Agreement, TASCO pays $10 per month for such aircraft plus substantially all operating costs ofthe aircraft including all costs of fuel, inspection, servicing and storage, as well as operational and flight crew costsrelating to the operation of the aircraft, and all transit maintenance costs and other maintenance costs required asa result of TASCO’s usage of the aircraft. Wendy’s/Arby’s continues to be responsible for calendar-basedmaintenance and any extraordinary and unscheduled repairs and/or maintenance for the aircraft, as well asinsurance and other costs. The Aircraft Lease Agreement may be terminated by Wendy’s/Arby’s without penaltyin the event it sells the aircraft to a third party, subject to a right of first refusal in favor of the ManagementCompany with respect to such a sale.
On June 24, 2010, Wendy’s/Arby’s and TASCO renewed the Aircraft Lease Agreement for an additional oneyear period (expiring June 30, 2011). We received lease income of $120 and $60 in 2010 and 2009, respectively,under this agreement, which is included as an offset to “General and administrative.”
(k) The Management Company assumed Wendy’s/Arby’s 25% fractional interest in a helicopter on October 1, 2008for $1,860 which is the amount Wendy’s/Arby’s would have received under the relevant agreement, if it exercisedits right to sell the helicopter interest on October 1, 2008, which is equal to the then fair value, less a remarketing
132

WENDY’S/ARBY’S GROUP, INC. AND SUBSIDIARIESWENDY’S/ARBY’S RESTAURANTS, LLC AND SUBSIDIARIES
COMBINED NOTES TO CONSOLIDATED FINANCIAL STATEMENTS—CONTINUED(In Thousands Except Per Share Amounts)
fee. The Management Company paid the monthly management fee and all other costs related to the helicopterinterest to the owner on behalf of Wendy’s/Arby’s from July 1, 2007 until October 1, 2008.
(l) In 2005, the Company invested $75,000 in brokerage accounts (the “Equities Account”), which were managedby the Management Company. The Equities Account was invested principally in equity securities, cashequivalents and equity derivatives of a limited number of publicly-traded companies. In addition, the EquitiesAccount sold securities short and invested in market put options in order to lessen the impact of significantmarket downturns. On September 12, 2008, 251 shares of Wendy’s common stock, which were included in theEquities Account, were sold to the Management Company at the closing market value as of the day the Companydecided to sell the shares. The sale resulted in a loss of $38.
(m) On June 10, 2009, Wendy’s/Arby’s and the Management Company entered into a withdrawal agreement (the“Withdrawal Agreement”) which provided that Wendy’s/Arby’s would be permitted to withdraw all amounts inthe Equities Account on an accelerated basis (the “Early Withdrawal”) effective no later than June 26, 2009. Priorto the Withdrawal Agreement and as a result of an investment management agreement with the ManagementCompany which was terminated on June 26, 2009, Wendy’s/Arby’s had not been permitted to withdraw anyamounts from the Equities Account until December 31, 2010, although $47,000 was released from the EquitiesAccount in 2008 subject to an obligation to return that amount to the Equities Account by a specified date. Inconsideration for obtaining such Early Withdrawal right, Wendy’s/Arby’s agreed to pay the ManagementCompany $5,500 (the “Withdrawal Fee”), was not required to return the $47,000 referred to above and was nolonger obligated to pay investment management and incentive fees to the Management Company. The EquitiesAccount investments were liquidated in June 2009 for $37,401 (the “Equities Sale”), of which $31,901 wasreceived by Wendy’s/Arby’s, net of the Withdrawal Fee, and for which Wendy’s/Arby’s realized a gain of $2,280in 2009, which are both included in “Investment income (expense), net.”
(n) On June 10, 2009, Wendy’s/Arby’s and the Management Company entered into a liquidation services agreement(the “Liquidation Services Agreement”) pursuant to which the Management Company assists us in the sale,liquidation or other disposition of our cost investments and DFR Notes, (the “Legacy Assets”), which are not relatedto the Equities Account. As of the date of the Liquidation Services Agreement, the Legacy Assets were valued at$36,600 (the “Target Amount”), of which $5,138 was owned by Wendy’s/Arby’s Restaurants. The LiquidationServices Agreement, which expires June 30, 2011, required Wendy’s/Arby’s to pay the Management Company a feeof $900 in two installments in June 2009 and 2010, which is being amortized over the term of the agreement. $441and $239 were amortized and recorded in “General and administrative” in 2010 and 2009, respectively. In addition,in the event that any or all of the Legacy Assets are sold, liquidated or otherwise disposed of and the aggregate netproceeds to us are in excess of the Target Amount, we would be required to pay the Management Company asuccess fee equal to 10% of the aggregate net proceeds in excess of the Target Amount. Assuming a currentliquidation of all remaining Legacy Assets, the aggregate proceeds ($32,209 as of January 2, 2011 primarily relatedto the cancellation and repayment of the DFR Notes) would not be expected to be in excess of the Target Amount.
Transactions with Other Related Parties
(o) In 2008, the Companies pledged $1,000 to be paid in equal annual installments over a five year periodcommencing in 2008 to be donated to the Dave Thomas Foundation for Adoption, a related party. The amountpledged was recorded in “General and administrative” in 2008.
(p) During the 2010, 2009, and 2008, the Companies made charitable contributions of $500 to Foundation,primarily utilizing funds reimbursed to it by one of the beverage companies used by Arby’s as provided by theircontract. Such payments are included in “General and administrative.”
(q) As part of its overall retention efforts, Wendy’s/Arby’s provided certain of its Former Executives and current andformer employees, the opportunity to co-invest with Wendy’s/Arby’s in certain investments. Wendy’s/Arby’s andcertain of its former management have one remaining co-investment, 280 BT, which is a limited liability holdingcompany principally owned by Wendy’s/Arby’s and former company management that, among other things,
133

WENDY’S/ARBY’S GROUP, INC. AND SUBSIDIARIESWENDY’S/ARBY’S RESTAURANTS, LLC AND SUBSIDIARIES
COMBINED NOTES TO CONSOLIDATED FINANCIAL STATEMENTS—CONTINUED(In Thousands Except Per Share Amounts)
invested in operating companies. During 2009 and 2008, Wendy’s/Arby’s received distributions of $795 and$2,014, respectively, from the liquidation of certain of the investments owned by 280 BT. The minority portions ofthese distributions of $156 and $402 in 2009 and 2008, respectively, were further distributed to 280 BT’s minorityshareholders. No distributions were received in 2010. The ownership percentages as of January 2, 2011 were 80.1%,11.2% and 8.7% for Wendy’s/Arby’s, the former officers of Wendy’s/Arby’s and other investors, respectively.
On September 29, 2008, J. David Karam, a minority shareholder, director and former president of CedarEnterprises, Inc., which directly or through affiliates is a Wendy’s franchisee operator of 146 Wendy’s restaurants asof January 2, 2011, and 133 as of January 3, 2010 and December 28, 2008, became President of Wendy’s. Inconnection with Mr. Karam’s employment, Mr. Karam resigned as a director and president of Cedar Enterprises, Inc.but retained his minority ownership. After the Wendy’s Merger, the Companies recorded $7,315, $6,240 and $1,801in royalties and $5,471, $4,633 and $1,339 in advertising fees in 2010, 2009, and 2008, respectively, from CedarEnterprises and its affiliates as a franchisee of Wendy’s. Cedar Enterprises, Inc. and its affiliates also received $125,$175 and $75 in remodeling incentives in 2010, 2009, and 2008 (the period from September 29, 2008 throughDecember 28, 2008), respectively, from Wendy’s pursuant to a program generally available to Wendy’s franchisees,and $774 in 2010 related to funding for equipment related to their participation in product development testing.
Mr. Karam was also a minority investor in two other Wendy’s franchisee operators, Emerald Food, Inc. andDiamond Foods, L.L.C., which, at the time, were operators of 44 and 16 Wendy’s restaurants, respectively.Mr. Karam disposed of his interests in these companies effective November 5, 2008.
(Wendy’s/Arby’s Restaurants)
The following is a summary of transactions between Wendy’s/Arby’s Restaurants and Wendy’s/Arby’s:2010 2009 2008
Dividends paid (r) . . . . . . . . . . . . . . . . . . . . . . . . . . . . . . . . . . . . . . . . . . . . . . . $443,700 $115,000 $ —Cost allocation to restaurant segments (s) . . . . . . . . . . . . . . . . . . . . . . . . . . . . . . — 34,085 —Advances paid (t) . . . . . . . . . . . . . . . . . . . . . . . . . . . . . . . . . . . . . . . . . . . . . . . . — — 155,000Capital contributions received (t) . . . . . . . . . . . . . . . . . . . . . . . . . . . . . . . . . . . . — — (150,177)Other transactions:
Share-based compensation (u) . . . . . . . . . . . . . . . . . . . . . . . . . . . . . . . . . . 12,790 13,570 8,770Payments for Federal and state income tax (v) . . . . . . . . . . . . . . . . . . . . . . — 10,417 17,000Expense (net credit) under management service agreements (w) . . . . . . . . . 5,017 5,017 (1,504)
(r) Wendy’s/Arby’s Restaurants paid cash dividends to Wendy’s/Arby’s which were charged to “Investedequity.” During the 2010 second quarter, dividends paid to Wendy’s/Arby’s included $325,000 as specificallypermitted under the terms of the Credit Agreement.
(s) For the first quarter of 2009, Wendy’s/Arby’s charged the restaurant segments $34,085 for support services. Priorto that date, the restaurant segments had directly incurred such costs. These costs are included in “General andadministrative.” During 2009, we settled $20,526 of such support center costs in cash through our intercompanyaccount with Wendy’s/Arby’s.
On the first day of the second quarter of 2009, we established a shared service center in Atlanta, Georgia. As aresult, support center costs from that date have been directly incurred by Wendy’s/Arby’s Restaurants and wereallocated to the restaurant segments based on budgeted revenues.
(t) During the fourth quarter of 2008, Wendy’s/Arby’s Restaurants advanced an aggregate of $155,000 to Wendy’s/Arby’s; Wendy’s/Arby’s used such advances principally to fund $150,177 of capital contributions toArby’s. Arby’s used a portion of these capital contributions to prepay the prior Arby’s amended term loan in anaggregate principal amount of $143,200. These advances by Wendy’s/Arby’s Restaurants do not bear interest andWendy’s/Arby’s does not currently intend to repay such advances. Accordingly, the $155,000 of advances werereflected as a reduction of “Invested equity.”
134

WENDY’S/ARBY’S GROUP, INC. AND SUBSIDIARIESWENDY’S/ARBY’S RESTAURANTS, LLC AND SUBSIDIARIES
COMBINED NOTES TO CONSOLIDATED FINANCIAL STATEMENTS—CONTINUED(In Thousands Except Per Share Amounts)
(u) Wendy’s/Arby’s Restaurants provides share based compensation with respect to Wendy’s/Arby’s Common Stockto certain employees. Such compensation cost is allocated by Wendy’s/Arby’s to Wendy’s/Arby’s Restaurants andis correspondingly recorded as capital contributions from Wendy’s/Arby’s.
(v) Wendy’s/Arby’s Restaurants made payments to Wendy’s/Arby’s under a tax sharing agreement, as discussed inmore detail in Note 13, which were settled in cash with Wendy’s/Arby’s.
(w) Wendy’s/Arby’s Restaurants receives certain management services, including legal, accounting, tax, insurance,financial and other management services from Wendy’s/Arby’s. In connection with the RTM Acquisition, Arby’sentered into a management services agreement with Wendy’s/Arby’s effective July 25, 2005 that provides for aninitial annual fixed fee of $4,500 plus annual cost of living adjustments beginning January 1, 2006. Such fees areincluded in “General and administrative.” Amounts incurred under such service arrangements, and otherincidental amounts, are settled through Wendy’s/Arby’s Restaurants’ intercompany account with Wendy’s/Arby’s. As a result of the 2005 agreement with Wendy’s/Arby’s described above, Wendy’s/Arby’s Restaurants’results of operations may not be indicative of those that would be achieved if they had operated on a stand alonebasis.
In 2008, Wendy’s/Arby’s Restaurants also provided services to Wendy’s/Arby’s. Costs of the services that wereallocated to Wendy’s/Arby’s were based on actual direct costs incurred. The reimbursement of these costs totaled$6,472 for 2008 and is included as a reduction of “General and administrative.”
(25) Legal and Environmental Matters
We are involved in litigation and claims incidental to our current and prior businesses. As of January 2, 2011,Wendy’s/Arby’s Restaurants had reserves for all of its legal and environmental matters aggregating $3,739, which areincluded in the $3,855 reserved by Wendy’s/Arby’s for all legal and environmental matters. Although the outcome ofthese matters cannot be predicted with certainty and some of these matters may be disposed of unfavorably to us,based on currently available information, including legal defenses available to us, and given the aforementionedreserves and our insurance coverage, we do not believe that the outcome of these legal and environmental matters willhave a material adverse effect on our consolidated financial position or results of operations.
(26) Advertising Costs and Funds
Since the Wendy’s Merger, the Companies participate in three national advertising funds (the “AdvertisingFunds”) established to collect and administer funds contributed for use in advertising and promotional programs.Contributions to the Advertising Funds are required from both company-owned and franchise restaurants and arebased on a percentage of restaurant sales. In addition to the contributions to the various Advertising Funds, company-owned and franchise restaurants make additional contributions to other local and regional advertising programs.
Restricted assets and related liabilities of the Advertising Funds at January 2, 2011 and January 3, 2010 are asfollows:
Year End
2010 2009
Cash and cash equivalents . . . . . . . . . . . . . . . . . . . . . . . . . . . . . . . . . . . . . . . . . . . $23,102 $ 21,856Accounts and notes receivable . . . . . . . . . . . . . . . . . . . . . . . . . . . . . . . . . . . . . . . . 42,672 42,195Other assets . . . . . . . . . . . . . . . . . . . . . . . . . . . . . . . . . . . . . . . . . . . . . . . . . . . . . . 10,779 16,425
Total assets . . . . . . . . . . . . . . . . . . . . . . . . . . . . . . . . . . . . . . . . . . . . . . . . . . . . . . $76,553 $ 80,476
Accounts payable . . . . . . . . . . . . . . . . . . . . . . . . . . . . . . . . . . . . . . . . . . . . . . . . . . $ 3,724 $ 15,299Accrued expenses and other current liabilities . . . . . . . . . . . . . . . . . . . . . . . . . . . . 76,897 79,121Member’s deficit . . . . . . . . . . . . . . . . . . . . . . . . . . . . . . . . . . . . . . . . . . . . . . . . . . (4,068) (13,944)
Total liabilities and deficit . . . . . . . . . . . . . . . . . . . . . . . . . . . . . . . . . . . . . . . . . . . $76,553 $ 80,476
135
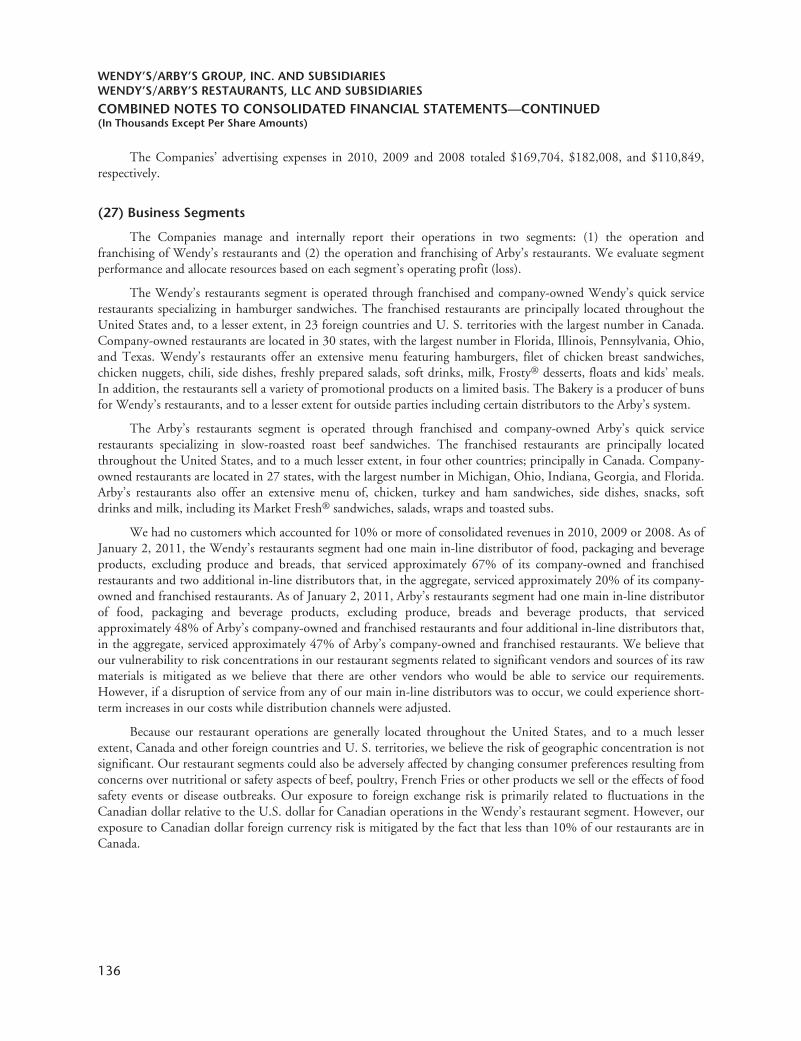
WENDY’S/ARBY’S GROUP, INC. AND SUBSIDIARIESWENDY’S/ARBY’S RESTAURANTS, LLC AND SUBSIDIARIES
COMBINED NOTES TO CONSOLIDATED FINANCIAL STATEMENTS—CONTINUED(In Thousands Except Per Share Amounts)
The Companies’ advertising expenses in 2010, 2009 and 2008 totaled $169,704, $182,008, and $110,849,respectively.
(27) Business Segments
The Companies manage and internally report their operations in two segments: (1) the operation andfranchising of Wendy’s restaurants and (2) the operation and franchising of Arby’s restaurants. We evaluate segmentperformance and allocate resources based on each segment’s operating profit (loss).
The Wendy’s restaurants segment is operated through franchised and company-owned Wendy’s quick servicerestaurants specializing in hamburger sandwiches. The franchised restaurants are principally located throughout theUnited States and, to a lesser extent, in 23 foreign countries and U. S. territories with the largest number in Canada.Company-owned restaurants are located in 30 states, with the largest number in Florida, Illinois, Pennsylvania, Ohio,and Texas. Wendy’s restaurants offer an extensive menu featuring hamburgers, filet of chicken breast sandwiches,chicken nuggets, chili, side dishes, freshly prepared salads, soft drinks, milk, Frosty® desserts, floats and kids’ meals.In addition, the restaurants sell a variety of promotional products on a limited basis. The Bakery is a producer of bunsfor Wendy’s restaurants, and to a lesser extent for outside parties including certain distributors to the Arby’s system.
The Arby’s restaurants segment is operated through franchised and company-owned Arby’s quick servicerestaurants specializing in slow-roasted roast beef sandwiches. The franchised restaurants are principally locatedthroughout the United States, and to a much lesser extent, in four other countries; principally in Canada. Company-owned restaurants are located in 27 states, with the largest number in Michigan, Ohio, Indiana, Georgia, and Florida.Arby’s restaurants also offer an extensive menu of, chicken, turkey and ham sandwiches, side dishes, snacks, softdrinks and milk, including its Market Fresh® sandwiches, salads, wraps and toasted subs.
We had no customers which accounted for 10% or more of consolidated revenues in 2010, 2009 or 2008. As ofJanuary 2, 2011, the Wendy’s restaurants segment had one main in-line distributor of food, packaging and beverageproducts, excluding produce and breads, that serviced approximately 67% of its company-owned and franchisedrestaurants and two additional in-line distributors that, in the aggregate, serviced approximately 20% of its company-owned and franchised restaurants. As of January 2, 2011, Arby’s restaurants segment had one main in-line distributorof food, packaging and beverage products, excluding produce, breads and beverage products, that servicedapproximately 48% of Arby’s company-owned and franchised restaurants and four additional in-line distributors that,in the aggregate, serviced approximately 47% of Arby’s company-owned and franchised restaurants. We believe thatour vulnerability to risk concentrations in our restaurant segments related to significant vendors and sources of its rawmaterials is mitigated as we believe that there are other vendors who would be able to service our requirements.However, if a disruption of service from any of our main in-line distributors was to occur, we could experience short-term increases in our costs while distribution channels were adjusted.
Because our restaurant operations are generally located throughout the United States, and to a much lesserextent, Canada and other foreign countries and U. S. territories, we believe the risk of geographic concentration is notsignificant. Our restaurant segments could also be adversely affected by changing consumer preferences resulting fromconcerns over nutritional or safety aspects of beef, poultry, French Fries or other products we sell or the effects of foodsafety events or disease outbreaks. Our exposure to foreign exchange risk is primarily related to fluctuations in theCanadian dollar relative to the U.S. dollar for Canadian operations in the Wendy’s restaurant segment. However, ourexposure to Canadian dollar foreign currency risk is mitigated by the fact that less than 10% of our restaurants are inCanada.
136

WENDY’S/ARBY’S GROUP, INC. AND SUBSIDIARIESWENDY’S/ARBY’S RESTAURANTS, LLC AND SUBSIDIARIES
COMBINED NOTES TO CONSOLIDATED FINANCIAL STATEMENTS—CONTINUED(In Thousands Except Per Share Amounts)
The following is a summary of the Companies’ segment information:2010 2009 2008
Revenues:Sales:
Wendy’s (1) . . . . . . . . . . . . . . . . . . . . . . . . . . . . . . . . . . . . . . . . . . . . . . . . . . . . . . $2,079,106 $2,134,242 $ 530,843Arby’s . . . . . . . . . . . . . . . . . . . . . . . . . . . . . . . . . . . . . . . . . . . . . . . . . . . . . . . . . . 966,236 1,064,106 1,131,448Corporate eliminations . . . . . . . . . . . . . . . . . . . . . . . . . . . . . . . . . . . . . . . . . . . . . (25) — —
Total . . . . . . . . . . . . . . . . . . . . . . . . . . . . . . . . . . . . . . . . . . . . . . . . . . . . . . . . . 3,045,317 3,198,348 1,662,291
Franchise revenues:Wendy’s . . . . . . . . . . . . . . . . . . . . . . . . . . . . . . . . . . . . . . . . . . . . . . . . . . . . . . . . 296,395 302,853 74,588Arby’s . . . . . . . . . . . . . . . . . . . . . . . . . . . . . . . . . . . . . . . . . . . . . . . . . . . . . . . . . . 74,739 79,634 85,882Corporate eliminations . . . . . . . . . . . . . . . . . . . . . . . . . . . . . . . . . . . . . . . . . . . . . (37) — —
Total . . . . . . . . . . . . . . . . . . . . . . . . . . . . . . . . . . . . . . . . . . . . . . . . . . . . . . . . . 371,097 382,487 160,470
Total revenues:Wendy’s . . . . . . . . . . . . . . . . . . . . . . . . . . . . . . . . . . . . . . . . . . . . . . . . . . . . . . . . 2,375,501 2,437,095 605,431Arby’s . . . . . . . . . . . . . . . . . . . . . . . . . . . . . . . . . . . . . . . . . . . . . . . . . . . . . . . . . . 1,040,975 1,143,740 1,217,330Corporate eliminations . . . . . . . . . . . . . . . . . . . . . . . . . . . . . . . . . . . . . . . . . . . . . (62) — —
Total . . . . . . . . . . . . . . . . . . . . . . . . . . . . . . . . . . . . . . . . . . . . . . . . . . . . . . . . . $3,416,414 $3,580,835 $1,822,761
Depreciation and amortization:Wendy’s . . . . . . . . . . . . . . . . . . . . . . . . . . . . . . . . . . . . . . . . . . . . . . . . . . . . . . . . $ 113,064 $ 128,048 $ 23,852Arby’s . . . . . . . . . . . . . . . . . . . . . . . . . . . . . . . . . . . . . . . . . . . . . . . . . . . . . . . . . . 55,326 56,188 61,206Shared services center . . . . . . . . . . . . . . . . . . . . . . . . . . . . . . . . . . . . . . . . . . . . . . 11,920 4,270 —
Wendy’s/Arby’s Restaurants . . . . . . . . . . . . . . . . . . . . . . . . . . . . . . . . . . . . . . . 180,310 188,506 85,058Corporate . . . . . . . . . . . . . . . . . . . . . . . . . . . . . . . . . . . . . . . . . . . . . . . . . . . . . . . 1,862 1,745 3,257
Wendy’s/Arby’s . . . . . . . . . . . . . . . . . . . . . . . . . . . . . . . . . . . . . . . . . . . . . . . . . $ 182,172 $ 190,251 $ 88,315
Impairment of long-lived assets:Wendy’s . . . . . . . . . . . . . . . . . . . . . . . . . . . . . . . . . . . . . . . . . . . . . . . . . . . . . . . . $ 26,326 $ 23,443 $ 1,578Arby’s . . . . . . . . . . . . . . . . . . . . . . . . . . . . . . . . . . . . . . . . . . . . . . . . . . . . . . . . . . 43,151 56,513 8,002
Wendy’s/Arby’s Restaurants . . . . . . . . . . . . . . . . . . . . . . . . . . . . . . . . . . . . . . . 69,477 79,956 9,580Corporate . . . . . . . . . . . . . . . . . . . . . . . . . . . . . . . . . . . . . . . . . . . . . . . . . . . . . . . — 2,176 9,623
Wendy’s/Arby’s . . . . . . . . . . . . . . . . . . . . . . . . . . . . . . . . . . . . . . . . . . . . . . . . . $ 69,477 $ 82,132 $ 19,203
Segment operating profit (loss):Wendy’s . . . . . . . . . . . . . . . . . . . . . . . . . . . . . . . . . . . . . . . . . . . . . . . . . . . . . . . . $ 204,911 $ 167,753 $ 30,788Arby’s . . . . . . . . . . . . . . . . . . . . . . . . . . . . . . . . . . . . . . . . . . . . . . . . . . . . . . . . . . (50,685) (29,248) (395,304)Corporate eliminations . . . . . . . . . . . . . . . . . . . . . . . . . . . . . . . . . . . . . . . . . . . . . (6) — —Shared services center . . . . . . . . . . . . . . . . . . . . . . . . . . . . . . . . . . . . . . . . . . . . . . (11,920) (8,553) —
Wendy’s/Arby’s Restaurants . . . . . . . . . . . . . . . . . . . . . . . . . . . . . . . . . . . . . . . 142,300 129,952 (364,516)Corporate . . . . . . . . . . . . . . . . . . . . . . . . . . . . . . . . . . . . . . . . . . . . . . . . . . . . . . . (9,912) (17,976) (49,134)
Wendy’s/Arby’s . . . . . . . . . . . . . . . . . . . . . . . . . . . . . . . . . . . . . . . . . . . . . . . . . $ 132,388 $ 111,976 $ (413,650)
Wendy’s/Arby’s Restaurants:Segment operating profit (loss) . . . . . . . . . . . . . . . . . . . . . . . . . . . . . . . . . . . . . . . . . . . $ 142,300 $ 129,952 $ (364,516)Unallocated items:
Interest expense . . . . . . . . . . . . . . . . . . . . . . . . . . . . . . . . . . . . . . . . . . . . . . . . . . . (136,193) (125,392) (66,925)Loss on early extinguishment of debt . . . . . . . . . . . . . . . . . . . . . . . . . . . . . . . . . . . (26,197) — —Other income (expense), net . . . . . . . . . . . . . . . . . . . . . . . . . . . . . . . . . . . . . . . . . 2,667 (2,973) 3,234
(Loss) income from continuing operations before income taxes . . . . . . . . . . . . . . . . . . . $ (17,423) $ 1,587 $ (428,207)
137

WENDY’S/ARBY’S GROUP, INC. AND SUBSIDIARIESWENDY’S/ARBY’S RESTAURANTS, LLC AND SUBSIDIARIES
COMBINED NOTES TO CONSOLIDATED FINANCIAL STATEMENTS—CONTINUED(In Thousands Except Per Share Amounts)
2010 2009 2008
Wendy’s/Arby’s:Segment operating profit (loss) . . . . . . . . . . . . . . . . . . . . . . . . $ 132,388 $ 111,976 $(413,650)Unallocated items:
Interest expense . . . . . . . . . . . . . . . . . . . . . . . . . . . . . . . . . (137,229) (126,708) (67,009)Loss on early extinguishment of debt . . . . . . . . . . . . . . . . . (26,197) — —Investment income (expense), net . . . . . . . . . . . . . . . . . . . . 5,261 (3,008) 9,438Other than temporary losses on investments . . . . . . . . . . . . — (3,916) (112,741)Other income, net . . . . . . . . . . . . . . . . . . . . . . . . . . . . . . . 3,782 1,523 2,710
Loss from continuing operations before income taxes . . . . . . . $ (21,995) $ (20,133) $(581,252)
Year End
2010 2009
Total assets:Wendy’s . . . . . . . . . . . . . . . . . . . . . . . . . . . . . . . . . . . . . . . $3,725,108 $3,996,371Arby’s . . . . . . . . . . . . . . . . . . . . . . . . . . . . . . . . . . . . . . . . . 522,569 562,192Wendy’s/Arby’s Restaurants corporate . . . . . . . . . . . . . . . . 169,020 305,327
Wendy’s/Arby’s Restaurants . . . . . . . . . . . . . . . . . . . . . . 4,416,697 4,863,890Corporate . . . . . . . . . . . . . . . . . . . . . . . . . . . . . . . . . . . . . . 315,957 111,526
Wendy’s/Arby’s . . . . . . . . . . . . . . . . . . . . . . . . . . . . . . . $4,732,654 $4,975,416
(Wendy’s/Arby’s Restaurants and Wendy’s/Arby’s)Equity method investment . . . . . . . . . . . . . . . . . . . . . . . . . $ 98,631 $ 97,476
2010 2009
Cash capital expenditures:Wendy’s . . . . . . . . . . . . . . . . . . . . . . . . . . . . . . . . . . . . . . . $ 73,317 $ 55,155Arby’s . . . . . . . . . . . . . . . . . . . . . . . . . . . . . . . . . . . . . . . . . 57,577 29,646Wendy’s/Arby’s Restaurants corporate (2) . . . . . . . . . . . . . 17,075 17,113
Wendy’s/Arby’s Restaurants . . . . . . . . . . . . . . . . . . . . . . 147,969 101,914Corporate . . . . . . . . . . . . . . . . . . . . . . . . . . . . . . . . . . . . . . — —
Wendy’s/Arby’s . . . . . . . . . . . . . . . . . . . . . . . . . . . . . . . $ 147,969 $ 101,914
(1) Sales include sales of bakery items and kids’ meal promotion items sold to franchisees.
(2) The Wendy’s/Arby’s Restaurants corporate capital expenditures are primarily related to our shared services center.
Income for our equity investment in TimWen is included in the Wendy’s restaurants segment.
In the first quarter of 2009, Wendy’s/Arby’s began charging the restaurant segments for support services basedupon budgeted segment revenues. Prior to that date, the restaurant segments had directly incurred such costs.Commencing with the second quarter of 2009, Wendy’s/Arby’s established a shared service center in Atlanta andallocates its operating costs to the restaurant segments based also on budgeted segment revenues.
138

WENDY’S/ARBY’S GROUP, INC. AND SUBSIDIARIESWENDY’S/ARBY’S RESTAURANTS, LLC AND SUBSIDIARIES
COMBINED NOTES TO CONSOLIDATED FINANCIAL STATEMENTS—CONTINUED(In Thousands Except Per Share Amounts)
Revenues and long-lived asset information by geographic area are as follows:
U.S CanadaOther
International Total
2010Revenues:
Wendy’s restaurants . . . . . . . . . . . . . . . . . . . . . . . . . . . . . . . $2,117,062 $244,654 $13,785 $2,375,501Arby’s restaurants . . . . . . . . . . . . . . . . . . . . . . . . . . . . . . . . . 1,037,959 2,827 189 1,040,975Corporate eliminations . . . . . . . . . . . . . . . . . . . . . . . . . . . . . (62) — — (62)
Consolidated revenue . . . . . . . . . . . . . . . . . . . . . . . . . . . . $3,154,959 $247,481 $13,974 $3,416,414
Long-lived assets:Wendy’s restaurants . . . . . . . . . . . . . . . . . . . . . . . . . . . . . . . $1,084,516 $ 61,172 $ 19 $1,145,707Arby’s restaurants . . . . . . . . . . . . . . . . . . . . . . . . . . . . . . . . . 382,392 6 — 382,398Wendy’s/Arby’s Restaurants corporate . . . . . . . . . . . . . . . . . 13,748 — — 13,748
Wendy’s/Arby’s Restaurants . . . . . . . . . . . . . . . . . . . . . . . 1,480,656 61,178 19 1,541,853Corporate . . . . . . . . . . . . . . . . . . . . . . . . . . . . . . . . . . . . . . . 9,408 — — 9,408
Wendy’s/Arby’s . . . . . . . . . . . . . . . . . . . . . . . . . . . . . . . . . $1,490,064 $ 61,178 $ 19 $1,551,261
2009Revenues:
Wendy’s restaurants . . . . . . . . . . . . . . . . . . . . . . . . . . . . . . . $2,190,003 $233,359 $13,733 $2,437,095Arby’s restaurants . . . . . . . . . . . . . . . . . . . . . . . . . . . . . . . . . 1,140,860 2,725 155 1,143,740
Consolidated revenue . . . . . . . . . . . . . . . . . . . . . . . . . . . . $3,330,863 $236,084 $13,888 $3,580,835
Long-lived assets:Wendy’s restaurants . . . . . . . . . . . . . . . . . . . . . . . . . . . . . . . $1,114,057 $ 63,393 $ 32 $1,177,482Arby’s restaurants . . . . . . . . . . . . . . . . . . . . . . . . . . . . . . . . . 419,748 7 — 419,755Wendy’s/Arby’s Restaurants corporate . . . . . . . . . . . . . . . . . 10,621 — — 10,621
Wendy’s/Arby’s Restaurants . . . . . . . . . . . . . . . . . . . . . . . 1,544,426 63,400 32 1,607,858Corporate . . . . . . . . . . . . . . . . . . . . . . . . . . . . . . . . . . . . . . . 11,390 — — 11,390
Wendy’s/Arby’s . . . . . . . . . . . . . . . . . . . . . . . . . . . . . . . . . $1,555,816 $ 63,400 $ 32 $1,619,248
2008Revenues:
Wendy’s restaurants . . . . . . . . . . . . . . . . . . . . . . . . . . . . . . . $ 548,792 $ 53,201 $ 3,438 $ 605,431Arby’s restaurants . . . . . . . . . . . . . . . . . . . . . . . . . . . . . . . . . 1,213,774 3,419 137 1,217,330
Consolidated revenue . . . . . . . . . . . . . . . . . . . . . . . . . . . . $1,762,566 $ 56,620 $ 3,575 $1,822,761
139
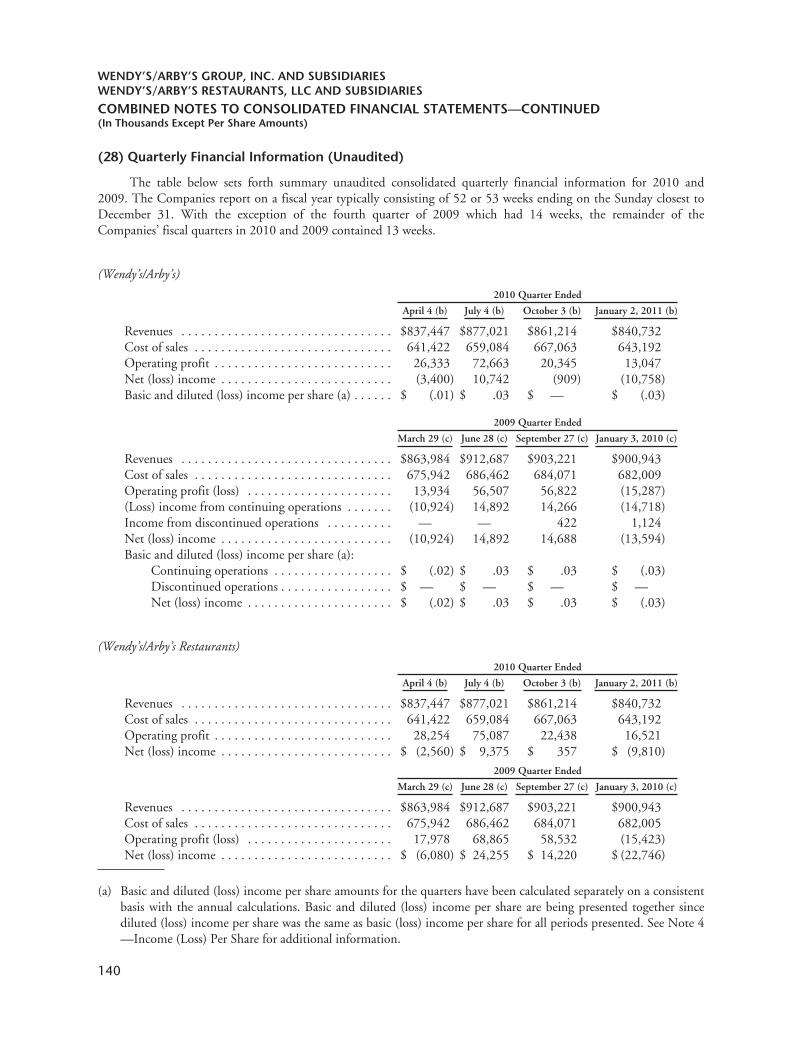
WENDY’S/ARBY’S GROUP, INC. AND SUBSIDIARIESWENDY’S/ARBY’S RESTAURANTS, LLC AND SUBSIDIARIES
COMBINED NOTES TO CONSOLIDATED FINANCIAL STATEMENTS—CONTINUED(In Thousands Except Per Share Amounts)
(28) Quarterly Financial Information (Unaudited)
The table below sets forth summary unaudited consolidated quarterly financial information for 2010 and2009. The Companies report on a fiscal year typically consisting of 52 or 53 weeks ending on the Sunday closest toDecember 31. With the exception of the fourth quarter of 2009 which had 14 weeks, the remainder of theCompanies’ fiscal quarters in 2010 and 2009 contained 13 weeks.
(Wendy’s/Arby’s)
2010 Quarter Ended
April 4 (b) July 4 (b) October 3 (b) January 2, 2011 (b)
Revenues . . . . . . . . . . . . . . . . . . . . . . . . . . . . . . . . $837,447 $877,021 $861,214 $840,732Cost of sales . . . . . . . . . . . . . . . . . . . . . . . . . . . . . . 641,422 659,084 667,063 643,192Operating profit . . . . . . . . . . . . . . . . . . . . . . . . . . . 26,333 72,663 20,345 13,047Net (loss) income . . . . . . . . . . . . . . . . . . . . . . . . . . (3,400) 10,742 (909) (10,758)Basic and diluted (loss) income per share (a) . . . . . . $ (.01) $ .03 $ — $ (.03)
2009 Quarter Ended
March 29 (c) June 28 (c) September 27 (c) January 3, 2010 (c)
Revenues . . . . . . . . . . . . . . . . . . . . . . . . . . . . . . . . $863,984 $912,687 $903,221 $900,943Cost of sales . . . . . . . . . . . . . . . . . . . . . . . . . . . . . . 675,942 686,462 684,071 682,009Operating profit (loss) . . . . . . . . . . . . . . . . . . . . . . 13,934 56,507 56,822 (15,287)(Loss) income from continuing operations . . . . . . . (10,924) 14,892 14,266 (14,718)Income from discontinued operations . . . . . . . . . . — — 422 1,124Net (loss) income . . . . . . . . . . . . . . . . . . . . . . . . . . (10,924) 14,892 14,688 (13,594)Basic and diluted (loss) income per share (a):
Continuing operations . . . . . . . . . . . . . . . . . . $ (.02) $ .03 $ .03 $ (.03)Discontinued operations . . . . . . . . . . . . . . . . . $ — $ — $ — $ —Net (loss) income . . . . . . . . . . . . . . . . . . . . . . $ (.02) $ .03 $ .03 $ (.03)
(Wendy’s/Arby’s Restaurants)
2010 Quarter Ended
April 4 (b) July 4 (b) October 3 (b) January 2, 2011 (b)
Revenues . . . . . . . . . . . . . . . . . . . . . . . . . . . . . . . . $837,447 $877,021 $861,214 $840,732Cost of sales . . . . . . . . . . . . . . . . . . . . . . . . . . . . . . 641,422 659,084 667,063 643,192Operating profit . . . . . . . . . . . . . . . . . . . . . . . . . . . 28,254 75,087 22,438 16,521Net (loss) income . . . . . . . . . . . . . . . . . . . . . . . . . . $ (2,560) $ 9,375 $ 357 $ (9,810)
2009 Quarter Ended
March 29 (c) June 28 (c) September 27 (c) January 3, 2010 (c)
Revenues . . . . . . . . . . . . . . . . . . . . . . . . . . . . . . . . $863,984 $912,687 $903,221 $900,943Cost of sales . . . . . . . . . . . . . . . . . . . . . . . . . . . . . . 675,942 686,462 684,071 682,005Operating profit (loss) . . . . . . . . . . . . . . . . . . . . . . 17,978 68,865 58,532 (15,423)Net (loss) income . . . . . . . . . . . . . . . . . . . . . . . . . . $ (6,080) $ 24,255 $ 14,220 $ (22,746)
(a) Basic and diluted (loss) income per share amounts for the quarters have been calculated separately on a consistentbasis with the annual calculations. Basic and diluted (loss) income per share are being presented together sincediluted (loss) income per share was the same as basic (loss) income per share for all periods presented. See Note 4—Income (Loss) Per Share for additional information.
140
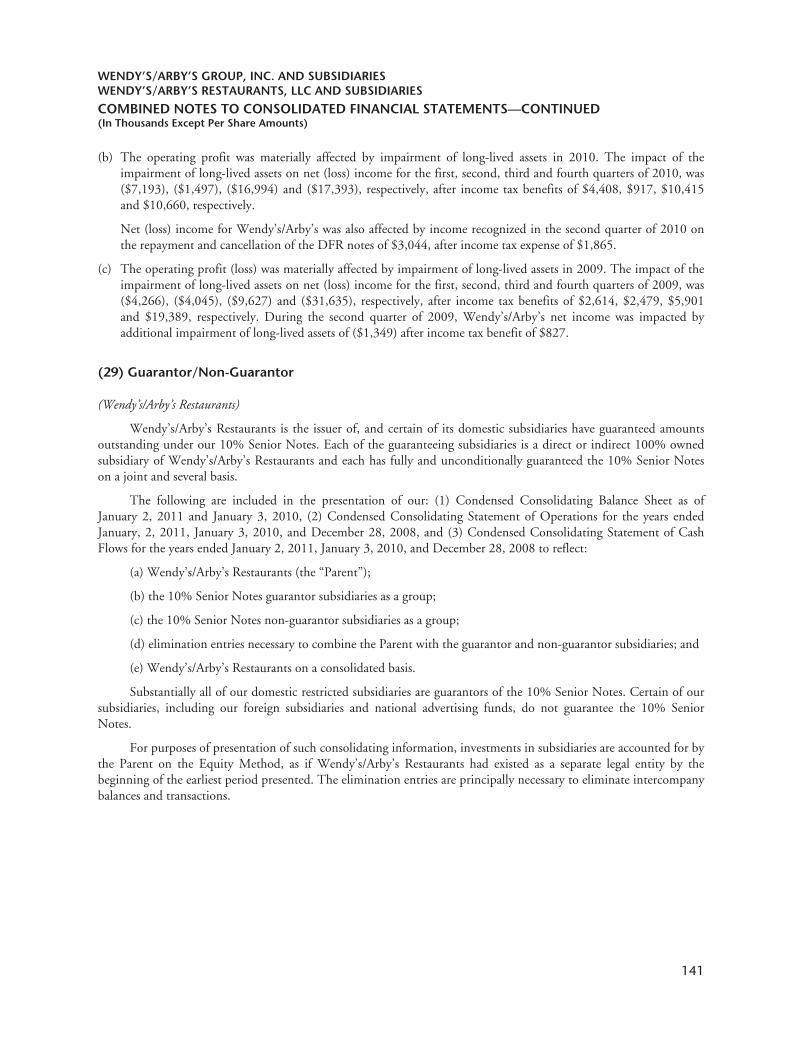
WENDY’S/ARBY’S GROUP, INC. AND SUBSIDIARIESWENDY’S/ARBY’S RESTAURANTS, LLC AND SUBSIDIARIES
COMBINED NOTES TO CONSOLIDATED FINANCIAL STATEMENTS—CONTINUED(In Thousands Except Per Share Amounts)
(b) The operating profit was materially affected by impairment of long-lived assets in 2010. The impact of theimpairment of long-lived assets on net (loss) income for the first, second, third and fourth quarters of 2010, was($7,193), ($1,497), ($16,994) and ($17,393), respectively, after income tax benefits of $4,408, $917, $10,415and $10,660, respectively.
Net (loss) income for Wendy’s/Arby’s was also affected by income recognized in the second quarter of 2010 onthe repayment and cancellation of the DFR notes of $3,044, after income tax expense of $1,865.
(c) The operating profit (loss) was materially affected by impairment of long-lived assets in 2009. The impact of theimpairment of long-lived assets on net (loss) income for the first, second, third and fourth quarters of 2009, was($4,266), ($4,045), ($9,627) and ($31,635), respectively, after income tax benefits of $2,614, $2,479, $5,901and $19,389, respectively. During the second quarter of 2009, Wendy’s/Arby’s net income was impacted byadditional impairment of long-lived assets of ($1,349) after income tax benefit of $827.
(29) Guarantor/Non-Guarantor
(Wendy’s/Arby’s Restaurants)
Wendy’s/Arby’s Restaurants is the issuer of, and certain of its domestic subsidiaries have guaranteed amountsoutstanding under our 10% Senior Notes. Each of the guaranteeing subsidiaries is a direct or indirect 100% ownedsubsidiary of Wendy’s/Arby’s Restaurants and each has fully and unconditionally guaranteed the 10% Senior Noteson a joint and several basis.
The following are included in the presentation of our: (1) Condensed Consolidating Balance Sheet as ofJanuary 2, 2011 and January 3, 2010, (2) Condensed Consolidating Statement of Operations for the years endedJanuary, 2, 2011, January 3, 2010, and December 28, 2008, and (3) Condensed Consolidating Statement of CashFlows for the years ended January 2, 2011, January 3, 2010, and December 28, 2008 to reflect:
(a) Wendy’s/Arby’s Restaurants (the “Parent”);
(b) the 10% Senior Notes guarantor subsidiaries as a group;
(c) the 10% Senior Notes non-guarantor subsidiaries as a group;
(d) elimination entries necessary to combine the Parent with the guarantor and non-guarantor subsidiaries; and
(e) Wendy’s/Arby’s Restaurants on a consolidated basis.
Substantially all of our domestic restricted subsidiaries are guarantors of the 10% Senior Notes. Certain of oursubsidiaries, including our foreign subsidiaries and national advertising funds, do not guarantee the 10% SeniorNotes.
For purposes of presentation of such consolidating information, investments in subsidiaries are accounted for bythe Parent on the Equity Method, as if Wendy’s/Arby’s Restaurants had existed as a separate legal entity by thebeginning of the earliest period presented. The elimination entries are principally necessary to eliminate intercompanybalances and transactions.
141

WENDY’S/ARBY’S GROUP, INC. AND SUBSIDIARIESWENDY’S/ARBY’S RESTAURANTS, LLC AND SUBSIDIARIES
COMBINED NOTES TO CONSOLIDATED FINANCIAL STATEMENTS—CONTINUED(In Thousands Except Per Share Amounts)
CONDENSED CONSOLIDATING BALANCE SHEET
January 2, 2011
ParentGuarantor
SubsidiariesNon-guarantor
Subsidiaries Eliminations Total
ASSETSCurrent assets:
Cash and cash equivalents . . . . . . . . . . $ 79,355 $ 88,936 $ 30,395 $ — $ 198,686Accounts and notes receivable . . . . . . . 320 79,404 3,628 — 83,352Inventories . . . . . . . . . . . . . . . . . . . . . . — 21,558 1,136 — 22,694Prepaid expenses and other current
assets . . . . . . . . . . . . . . . . . . . . . . . . 3,900 19,446 686 — 24,032Deferred income tax benefit . . . . . . . . . 17,634 27,218 215 — 45,067Advertising funds restricted assets . . . . . — — 76,553 — 76,553
Total current assets . . . . . . . . . . . . 101,209 236,562 112,613 — 450,384Properties . . . . . . . . . . . . . . . . . . . . . . . . . . . 13,748 1,466,769 61,336 — 1,541,853Other intangible assets . . . . . . . . . . . . . . . . . 21,453 1,310,092 27,029 — 1,358,574Goodwill . . . . . . . . . . . . . . . . . . . . . . . . . . . — 841,156 47,765 — 888,921Investments . . . . . . . . . . . . . . . . . . . . . . . . . — — 102,406 — 102,406Notes receivable . . . . . . . . . . . . . . . . . . . . . . — 12,612 — — 12,612Deferred costs and other assets . . . . . . . . . . . 32,610 28,662 675 — 61,947Net investment in subsidiaries . . . . . . . . . . . 2,559,526 246,578 — (2,806,104) —Deferred income tax benefit . . . . . . . . . . . . . 86,423 — 97 (86,520) —Due from affiliates . . . . . . . . . . . . . . . . . . . . 59,618 — 17,893 (77,511) —
Total assets . . . . . . . . . . . . . . . . . . $2,874,587 $4,142,431 $369,814 $(2,970,135) $4,416,697
LIABILITIES AND INVESTED EQUITYCurrent liabilities:
Current portion of long-term debt . . . . $ 5,228 $ 11,587 $ 232 $ — $ 17,047Accounts payable . . . . . . . . . . . . . . . . . 4,624 70,901 5,623 — 81,148Accrued expenses and other current
liabilities . . . . . . . . . . . . . . . . . . . . . . 38,871 195,282 10,147 — 244,300Advertising funds restricted
liabilities . . . . . . . . . . . . . . . . . . . . . . — — 76,553 — 76,553
Total current liabilities . . . . . . . . . 48,723 277,770 92,555 — 419,048Long-term debt . . . . . . . . . . . . . . . . . . . . . . 1,043,623 495,505 3,556 — 1,542,684Due to affiliates . . . . . . . . . . . . . . . . . . . . . . — 108,319 — (77,511) 30,808Deferred income . . . . . . . . . . . . . . . . . . . . . — 10,888 572 — 11,460Deferred income taxes . . . . . . . . . . . . . . . . . — 548,088 16,904 (86,520) 478,472Other liabilities . . . . . . . . . . . . . . . . . . . . . . 5,611 142,335 9,649 — 157,595Invested equity:
Member interest, $0.01 par value;1,000 shares authorized, one shareissued and outstanding . . . . . . . . . . . — — — — —
Other capital . . . . . . . . . . . . . . . . . . . . 2,423,459 3,244,488 199,014 (3,443,502) 2,423,459(Accumulated deficit) retained
earnings . . . . . . . . . . . . . . . . . . . . . . (499,500) (537,633) 39,594 498,039 (499,500)Advances to Wendy’s/Arby’s . . . . . . . . (155,000) (155,000) — 155,000 (155,000)Accumulated other comprehensive
income . . . . . . . . . . . . . . . . . . . . . . . 7,671 7,671 7,970 (15,641) 7,671
Total invested equity . . . . . . . . . . 1,776,630 2,559,526 246,578 (2,806,104) 1,776,630
Total liabilities and investedequity . . . . . . . . . . . . . . . . . . . . $2,874,587 $4,142,431 $369,814 $(2,970,135) $4,416,697
142
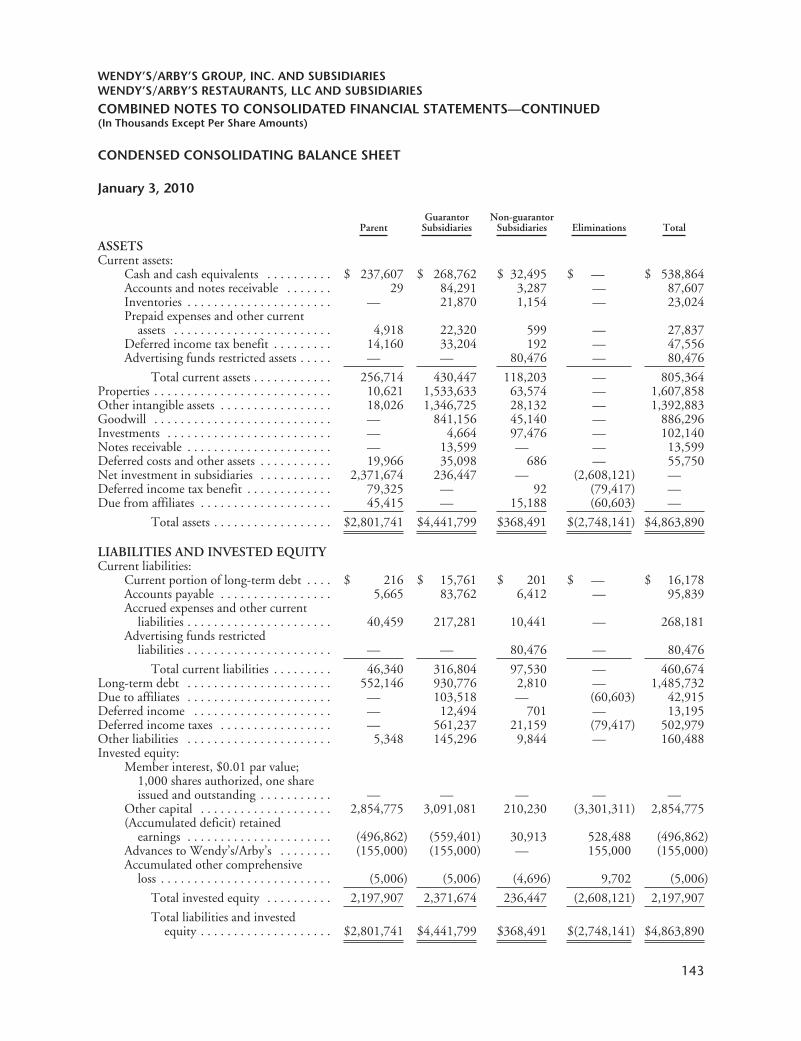
WENDY’S/ARBY’S GROUP, INC. AND SUBSIDIARIESWENDY’S/ARBY’S RESTAURANTS, LLC AND SUBSIDIARIES
COMBINED NOTES TO CONSOLIDATED FINANCIAL STATEMENTS—CONTINUED(In Thousands Except Per Share Amounts)
CONDENSED CONSOLIDATING BALANCE SHEET
January 3, 2010
ParentGuarantor
SubsidiariesNon-guarantor
Subsidiaries Eliminations Total
ASSETSCurrent assets:
Cash and cash equivalents . . . . . . . . . . $ 237,607 $ 268,762 $ 32,495 $ — $ 538,864Accounts and notes receivable . . . . . . . 29 84,291 3,287 — 87,607Inventories . . . . . . . . . . . . . . . . . . . . . . — 21,870 1,154 — 23,024Prepaid expenses and other current
assets . . . . . . . . . . . . . . . . . . . . . . . . 4,918 22,320 599 — 27,837Deferred income tax benefit . . . . . . . . . 14,160 33,204 192 — 47,556Advertising funds restricted assets . . . . . — — 80,476 — 80,476
Total current assets . . . . . . . . . . . . 256,714 430,447 118,203 — 805,364Properties . . . . . . . . . . . . . . . . . . . . . . . . . . . 10,621 1,533,633 63,574 — 1,607,858Other intangible assets . . . . . . . . . . . . . . . . . 18,026 1,346,725 28,132 — 1,392,883Goodwill . . . . . . . . . . . . . . . . . . . . . . . . . . . — 841,156 45,140 — 886,296Investments . . . . . . . . . . . . . . . . . . . . . . . . . — 4,664 97,476 — 102,140Notes receivable . . . . . . . . . . . . . . . . . . . . . . — 13,599 — — 13,599Deferred costs and other assets . . . . . . . . . . . 19,966 35,098 686 — 55,750Net investment in subsidiaries . . . . . . . . . . . 2,371,674 236,447 — (2,608,121) —Deferred income tax benefit . . . . . . . . . . . . . 79,325 — 92 (79,417) —Due from affiliates . . . . . . . . . . . . . . . . . . . . 45,415 — 15,188 (60,603) —
Total assets . . . . . . . . . . . . . . . . . . $2,801,741 $4,441,799 $368,491 $(2,748,141) $4,863,890
LIABILITIES AND INVESTED EQUITYCurrent liabilities:
Current portion of long-term debt . . . . $ 216 $ 15,761 $ 201 $ — $ 16,178Accounts payable . . . . . . . . . . . . . . . . . 5,665 83,762 6,412 — 95,839Accrued expenses and other current
liabilities . . . . . . . . . . . . . . . . . . . . . . 40,459 217,281 10,441 — 268,181Advertising funds restricted
liabilities . . . . . . . . . . . . . . . . . . . . . . — — 80,476 — 80,476
Total current liabilities . . . . . . . . . 46,340 316,804 97,530 — 460,674Long-term debt . . . . . . . . . . . . . . . . . . . . . . 552,146 930,776 2,810 — 1,485,732Due to affiliates . . . . . . . . . . . . . . . . . . . . . . — 103,518 — (60,603) 42,915Deferred income . . . . . . . . . . . . . . . . . . . . . — 12,494 701 — 13,195Deferred income taxes . . . . . . . . . . . . . . . . . — 561,237 21,159 (79,417) 502,979Other liabilities . . . . . . . . . . . . . . . . . . . . . . 5,348 145,296 9,844 — 160,488Invested equity:
Member interest, $0.01 par value;1,000 shares authorized, one shareissued and outstanding . . . . . . . . . . . — — — — —
Other capital . . . . . . . . . . . . . . . . . . . . 2,854,775 3,091,081 210,230 (3,301,311) 2,854,775(Accumulated deficit) retained
earnings . . . . . . . . . . . . . . . . . . . . . . (496,862) (559,401) 30,913 528,488 (496,862)Advances to Wendy’s/Arby’s . . . . . . . . (155,000) (155,000) — 155,000 (155,000)Accumulated other comprehensive
loss . . . . . . . . . . . . . . . . . . . . . . . . . . (5,006) (5,006) (4,696) 9,702 (5,006)
Total invested equity . . . . . . . . . . 2,197,907 2,371,674 236,447 (2,608,121) 2,197,907
Total liabilities and investedequity . . . . . . . . . . . . . . . . . . . . $2,801,741 $4,441,799 $368,491 $(2,748,141) $4,863,890
143
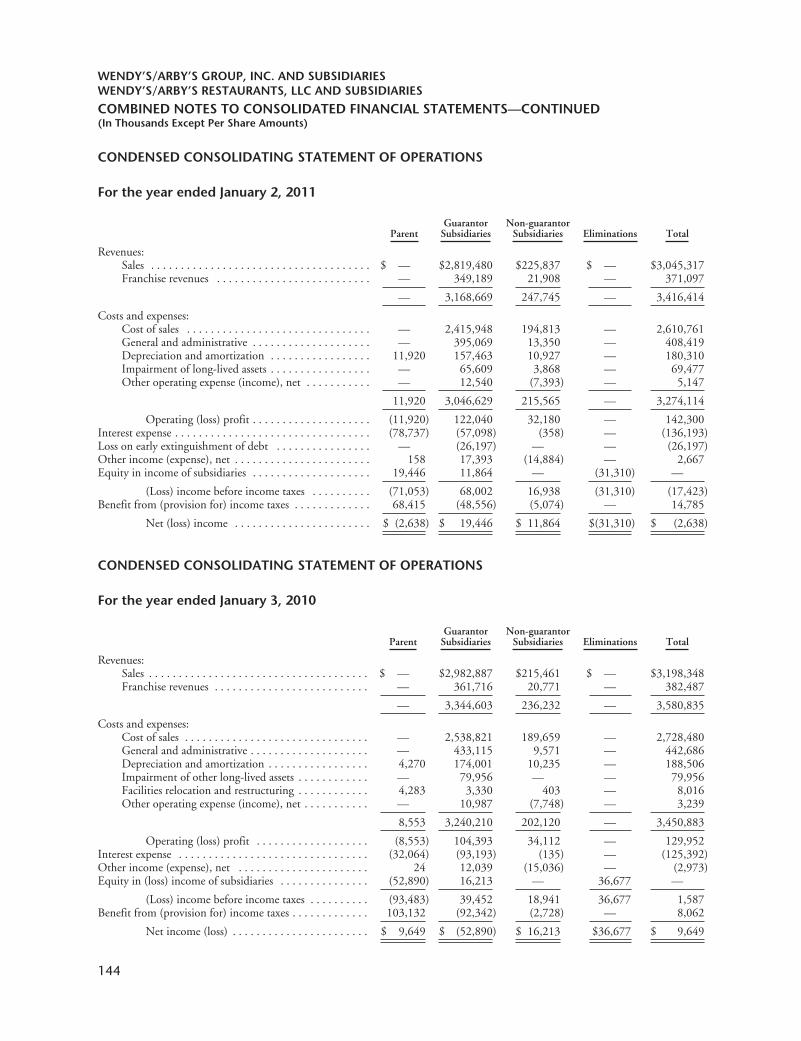
WENDY’S/ARBY’S GROUP, INC. AND SUBSIDIARIESWENDY’S/ARBY’S RESTAURANTS, LLC AND SUBSIDIARIES
COMBINED NOTES TO CONSOLIDATED FINANCIAL STATEMENTS—CONTINUED(In Thousands Except Per Share Amounts)
CONDENSED CONSOLIDATING STATEMENT OF OPERATIONS
For the year ended January 2, 2011
ParentGuarantor
SubsidiariesNon-guarantor
Subsidiaries Eliminations Total
Revenues:Sales . . . . . . . . . . . . . . . . . . . . . . . . . . . . . . . . . . . . . $ — $2,819,480 $225,837 $ — $3,045,317Franchise revenues . . . . . . . . . . . . . . . . . . . . . . . . . . — 349,189 21,908 — 371,097
— 3,168,669 247,745 — 3,416,414
Costs and expenses:Cost of sales . . . . . . . . . . . . . . . . . . . . . . . . . . . . . . . — 2,415,948 194,813 — 2,610,761General and administrative . . . . . . . . . . . . . . . . . . . . — 395,069 13,350 — 408,419Depreciation and amortization . . . . . . . . . . . . . . . . . 11,920 157,463 10,927 — 180,310Impairment of long-lived assets . . . . . . . . . . . . . . . . . — 65,609 3,868 — 69,477Other operating expense (income), net . . . . . . . . . . . — 12,540 (7,393) — 5,147
11,920 3,046,629 215,565 — 3,274,114
Operating (loss) profit . . . . . . . . . . . . . . . . . . . . (11,920) 122,040 32,180 — 142,300Interest expense . . . . . . . . . . . . . . . . . . . . . . . . . . . . . . . . . (78,737) (57,098) (358) — (136,193)Loss on early extinguishment of debt . . . . . . . . . . . . . . . . — (26,197) — — (26,197)Other income (expense), net . . . . . . . . . . . . . . . . . . . . . . . 158 17,393 (14,884) — 2,667Equity in income of subsidiaries . . . . . . . . . . . . . . . . . . . . 19,446 11,864 — (31,310) —
(Loss) income before income taxes . . . . . . . . . . (71,053) 68,002 16,938 (31,310) (17,423)Benefit from (provision for) income taxes . . . . . . . . . . . . . 68,415 (48,556) (5,074) — 14,785
Net (loss) income . . . . . . . . . . . . . . . . . . . . . . . $ (2,638) $ 19,446 $ 11,864 $(31,310) $ (2,638)
CONDENSED CONSOLIDATING STATEMENT OF OPERATIONS
For the year ended January 3, 2010
ParentGuarantor
SubsidiariesNon-guarantor
Subsidiaries Eliminations Total
Revenues:Sales . . . . . . . . . . . . . . . . . . . . . . . . . . . . . . . . . . . . . $ — $2,982,887 $215,461 $ — $3,198,348Franchise revenues . . . . . . . . . . . . . . . . . . . . . . . . . . — 361,716 20,771 — 382,487
— 3,344,603 236,232 — 3,580,835
Costs and expenses:Cost of sales . . . . . . . . . . . . . . . . . . . . . . . . . . . . . . . — 2,538,821 189,659 — 2,728,480General and administrative . . . . . . . . . . . . . . . . . . . . — 433,115 9,571 — 442,686Depreciation and amortization . . . . . . . . . . . . . . . . . 4,270 174,001 10,235 — 188,506Impairment of other long-lived assets . . . . . . . . . . . . — 79,956 — — 79,956Facilities relocation and restructuring . . . . . . . . . . . . 4,283 3,330 403 — 8,016Other operating expense (income), net . . . . . . . . . . . — 10,987 (7,748) — 3,239
8,553 3,240,210 202,120 — 3,450,883
Operating (loss) profit . . . . . . . . . . . . . . . . . . . (8,553) 104,393 34,112 — 129,952Interest expense . . . . . . . . . . . . . . . . . . . . . . . . . . . . . . . . (32,064) (93,193) (135) — (125,392)Other income (expense), net . . . . . . . . . . . . . . . . . . . . . . 24 12,039 (15,036) — (2,973)Equity in (loss) income of subsidiaries . . . . . . . . . . . . . . . (52,890) 16,213 — 36,677 —
(Loss) income before income taxes . . . . . . . . . . (93,483) 39,452 18,941 36,677 1,587Benefit from (provision for) income taxes . . . . . . . . . . . . . 103,132 (92,342) (2,728) — 8,062
Net income (loss) . . . . . . . . . . . . . . . . . . . . . . . $ 9,649 $ (52,890) $ 16,213 $36,677 $ 9,649
144

WENDY’S/ARBY’S GROUP, INC. AND SUBSIDIARIESWENDY’S/ARBY’S RESTAURANTS, LLC AND SUBSIDIARIES
COMBINED NOTES TO CONSOLIDATED FINANCIAL STATEMENTS—CONTINUED(In Thousands Except Per Share Amounts)
CONDENSED CONSOLIDATING STATEMENT OF OPERATIONS
For the year ended December 28, 2008
ParentGuarantor
SubsidiariesNon-guarantor
Subsidiaries Eliminations Total
Revenues:Sales . . . . . . . . . . . . . . . . . . . . . . . . . . . . . $ — $1,612,915 $49,376 $ — $1,662,291Franchise revenues . . . . . . . . . . . . . . . . . . — 153,143 7,327 — 160,470
— 1,766,058 56,703 — 1,822,761
Costs and expenses:Cost of sales . . . . . . . . . . . . . . . . . . . . . . . — 1,369,927 45,603 — 1,415,530General and administrative . . . . . . . . . . . . — 210,777 2,384 — 213,161Depreciation and amortization . . . . . . . . . — 82,979 2,079 — 85,058Goodwill impairment . . . . . . . . . . . . . . . . — 460,075 — — 460,075Impairment of other long-lived assets . . . . — 9,580 — — 9,580Facilities relocation and restructuring . . . . — 3,221 — — 3,221Other operating expense (income), net . . . — 2,455 (1,803) — 652
— 2,139,014 48,263 — 2,187,277
Operating (loss) profit . . . . . . . . . . . . — (372,956) 8,440 — (364,516)Interest expense . . . . . . . . . . . . . . . . . . . . . . . . . — (66,839) (86) — (66,925)Other income (expense), net . . . . . . . . . . . . . . . — 6,809 (3,575) — 3,234Equity in (loss) income of subsidiaries . . . . . . . . (365,086) 2,962 — 362,124 —
(Loss) income before income taxes . . (365,086) (430,024) 4,779 362,124 (428,207)Benefit from (provision for) income taxes . . . . . — 64,938 (1,817) — 63,121
Net (loss) income . . . . . . . . . . . . . . . $(365,086) $ (365,086) $ 2,962 $362,124 $ (365,086)
145

WENDY’S/ARBY’S GROUP, INC. AND SUBSIDIARIESWENDY’S/ARBY’S RESTAURANTS, LLC AND SUBSIDIARIES
COMBINED NOTES TO CONSOLIDATED FINANCIAL STATEMENTS—CONTINUED(In Thousands Except Per Share Amounts)
CONDENSED CONSOLIDATING STATEMENTS OF CASH FLOWS
For the year ended January 2, 2011
ParentGuarantor
Subsidiaries
Non-guarantor
Subsidiaries Eliminations Total
Cash flows from operating activities:Net (loss) income . . . . . . . . . . . . . . . . . . . . . . . . . . . . . . $ (2,638) $ 19,446 $ 11,864 $(31,310) $ (2,638)Adjustments to reconcile net (loss) income to net cash
provided by operating activities:Equity in income from operations of subsidiaries . . (19,446) (11,864) — 31,310 —Depreciation and amortization . . . . . . . . . . . . . . . . 11,920 157,463 10,927 — 180,310Impairment of long-lived assets . . . . . . . . . . . . . . . — 65,609 3,868 — 69,477Accretion of long-term debt . . . . . . . . . . . . . . . . . . 1,705 13,311 — — 15,016Distributions received from joint venture . . . . . . . . — — 13,980 — 13,980Share-based compensation provision . . . . . . . . . . . 3,951 8,839 — — 12,790Write-off and amortization of deferred financing
costs . . . . . . . . . . . . . . . . . . . . . . . . . . . . . . . . . . 4,518 7,245 — — 11,763Provision for doubtful accounts . . . . . . . . . . . . . . . — 9,932 (238) — 9,694Non-cash rent expense (credit) . . . . . . . . . . . . . . . . — 9,839 (505) — 9,334Tax sharing (receivable from) payable to affiliate,
net . . . . . . . . . . . . . . . . . . . . . . . . . . . . . . . . . . . (49,736) 50,788 — — 1,052Tax sharing receipts from (payments to) affiliate,
net . . . . . . . . . . . . . . . . . . . . . . . . . . . . . . . . . . . 56,000 (56,000) — — —Net recognition of deferred vendor incentive . . . . . — (587) — — (587)Other operating transactions with affiliates . . . . . . . (20,370) 15,140 (2,802) — (8,032)Equity in earnings in joint venture . . . . . . . . . . . . . — — (9,459) — (9,459)Deferred income tax benefit, net . . . . . . . . . . . . . . (18,351) (5,300) (2,101) — (25,752)Other, net . . . . . . . . . . . . . . . . . . . . . . . . . . . . . . . 2,406 (1,035) (1,875) — (504)Changes in operating assets and liabilities:
Accounts and notes receivable . . . . . . . . . . . . . (61) (4,190) 58 — (4,193)Inventories . . . . . . . . . . . . . . . . . . . . . . . . . . . — 311 83 — 394Prepaid expenses and other current assets . . . . 1,017 (213) (49) — 755Accounts payable . . . . . . . . . . . . . . . . . . . . . . 2,341 (15,268) (1,257) — (14,184)Accrued expenses and other current
liabilities . . . . . . . . . . . . . . . . . . . . . . . . . . . (3,808) (23,418) (736) — (27,962)
Net cash (used in) provided by operatingactivities . . . . . . . . . . . . . . . . . . . . . . . (30,552) 240,048 21,758 — 231,254
Cash flows from investing activities:Capital expenditures . . . . . . . . . . . . . . . . . . . . . . . . . . . . (17,075) (124,395) (6,499) — (147,969)Proceeds from dispositions . . . . . . . . . . . . . . . . . . . . . . . — 5,660 — — 5,660Cost of acquisitions, less cash acquired . . . . . . . . . . . . . . — (3,123) — — (3,123)Other, net . . . . . . . . . . . . . . . . . . . . . . . . . . . . . . . . . . . — 147 1,116 — 1,263
Net cash used in investing activities . . . . (17,075) (121,711) (5,383) — (144,169)
Cash flows from financing activities:Proceeds from long-term debt . . . . . . . . . . . . . . . . . . . . 497,500 161 — — 497,661Repayments of long-term debt . . . . . . . . . . . . . . . . . . . . (2,716) (463,536) (209) — (466,461)Deferred financing costs . . . . . . . . . . . . . . . . . . . . . . . . . (16,353) — — — (16,353)Capital contributions from Parent . . . . . . . . . . . . . . . . . (520,335) 520,335 — — —
Dividends paid to Parent . . . . . . . . . . . . . . . . . . . . . . . . 375,000 (375,000) — — —
Dividends paid to Wendy’s/Arby’s . . . . . . . . . . . . . . . . . (443,700) — — — (443,700)Redemption of preferred stock . . . . . . . . . . . . . . . . . . . . — 19,877 (19,877) — —Other, net . . . . . . . . . . . . . . . . . . . . . . . . . . . . . . . . . . . (21) — — — (21)
Net cash used in financing activities . . . . (110,625) (298,163) (20,086) — (428,874)
Net cash used before effect of exchange rate changes oncash . . . . . . . . . . . . . . . . . . . . . . . . . . . . . . . . . . . . . . . . . . (158,252) (179,826) (3,711) — (341,789)
Effect of exchange rate changes on cash . . . . . . . . . . . . . . . . . — — 1,611 — 1,611
Net decrease in cash and cash equivalents . . . . . . . . . . . . . . . . (158,252) (179,826) (2,100) — (340,178)Cash and cash equivalents at beginning of year . . . . . . . . . . . . 237,607 268,762 32,495 — 538,864
Cash and cash equivalents at end of year . . . . . . . . . . . . . . . . . $ 79,355 $ 88,936 $ 30,395 $ — $ 198,686
146

WENDY’S/ARBY’S GROUP, INC. AND SUBSIDIARIESWENDY’S/ARBY’S RESTAURANTS, LLC AND SUBSIDIARIES
COMBINED NOTES TO CONSOLIDATED FINANCIAL STATEMENTS—CONTINUED(In Thousands Except Per Share Amounts)
CONDENSED CONSOLIDATING STATEMENTS OF CASH FLOWS
For the year ended January 3, 2010
ParentGuarantor
Subsidiaries
Non-guarantor
Subsidiaries Eliminations Total
Cash flows from continuing operating activities:Net income (loss) . . . . . . . . . . . . . . . . . . . . . . . . . . . . . . $ 9,649 $ (52,890) $16,213 $ 36,677 $ 9,649Adjustments to reconcile net income (loss) to net cash
provided by continuing operating activities:Equity in loss (income) from continuing operations
of subsidiaries . . . . . . . . . . . . . . . . . . . . . . . . . . . 52,890 (16,213) — (36,677) —Depreciation and amortization . . . . . . . . . . . . . . . . 4,270 174,001 10,235 — 188,506Impairment of other long-lived assets . . . . . . . . . . . — 79,956 — — 79,956Tax sharing (receivable from) payable to Wendy’s/
Arby’s, net . . . . . . . . . . . . . . . . . . . . . . . . . . . . . (9,648) 50,061 — — 40,413Tax sharing payments to Wendy’s/Arby’s . . . . . . . . — (10,417) — — (10,417)Write-off and amortization of deferred financing
costs . . . . . . . . . . . . . . . . . . . . . . . . . . . . . . . . . . 1,632 14,164 — — 15,796Distributions received from joint venture . . . . . . . . — — 14,583 — 14,583Share-based compensation provision . . . . . . . . . . . 3,550 10,020 — — 13,570Non-cash rent expense . . . . . . . . . . . . . . . . . . . . . . — 12,618 — — 12,618Accretion of long-term debt . . . . . . . . . . . . . . . . . . 718 9,682 — — 10,400Provision for doubtful accounts . . . . . . . . . . . . . . . — 8,279 (110) — 8,169Deferred income tax (benefit) provision, net . . . . . . (94,686) 28,906 (2,761) — (68,541)Other operating transactions with affiliates . . . . . . . (33,506) 48,279 (659) — 14,114Equity in earnings in joint venture . . . . . . . . . . . . . — — (8,499) — (8,499)Net recognition of vendor incentive . . . . . . . . . . . . — (791) — — (791)Other, net . . . . . . . . . . . . . . . . . . . . . . . . . . . . . . . (559) 11,429 (5,317) — 5,553Changes in operating assets and liabilities:
Accounts and notes receivable . . . . . . . . . . . . . (29) (7,770) 120 — (7,679)Inventories . . . . . . . . . . . . . . . . . . . . . . . . . . . — 1,859 20 — 1,879Prepaid expenses and other current assets . . . . (4,918) 5,307 732 — 1,121Accounts payable, accrued expenses and other
current liabilities . . . . . . . . . . . . . . . . . . . . . 43,095 (42,353) 539 — 1,281
Net cash (used in) provided bycontinuing operating activities . . . . . . (27,542) 324,127 25,096 — 321,681
Cash flows from continuing investing activities:Capital expenditures . . . . . . . . . . . . . . . . . . . . . . . . (17,113) (80,458) (4,343) — (101,914)Proceeds from dispositions . . . . . . . . . . . . . . . . . . . — 10,472 410 — 10,882Cost of acquisitions, less cash acquired . . . . . . . . . . — (2,357) — — (2,357)Other, net . . . . . . . . . . . . . . . . . . . . . . . . . . . . . . . — 192 — — 192
Net cash used in continuing investingactivities . . . . . . . . . . . . . . . . . . . . . . . (17,113) (72,151) (3,933) — (93,197)
Cash flows from continuing financing activities:Proceeds from long-term debt . . . . . . . . . . . . . . . . 551,061 56,160 286 — 607,507Repayments of long-term debt . . . . . . . . . . . . . . . . (52) (209,198) (232) — (209,482)Deferred financing costs . . . . . . . . . . . . . . . . . . . . . (21,247) (17,152) — — (38,399)Capital contributions from Parent . . . . . . . . . . . . . (132,500) 132,500 — — —Dividends paid to Wendy’s/Arby’s . . . . . . . . . . . . . (115,000) — — — (115,000)
Net cash provided by (used in)continuing financing activities . . . . . . 282,262 (37,690) 54 — 244,626
Net cash provided by continuing operations . . . . . . . . . . . . . . 237,607 214,286 21,217 — 473,110Effect of exchange rate changes on cash . . . . . . . . . . . . . . . . . — 2,725 — 2,725
Net cash provided by continuing operations . . . . . . . . . . . . . . 237,607 214,286 23,942 475,835Net cash used in operating activities of discontinued
operations . . . . . . . . . . . . . . . . . . . . . . . . . . . . . . . . . . . . . . — (51) — — (51)
Net increase in cash and cash equivalents . . . . . . . . . . . . . . . . 237,607 214,235 23,942 — 475,784Cash and cash equivalents at beginning of year . . . . . . . . . . . . — 54,527 8,553 — 63,080
Cash and cash equivalents at end of year . . . . . . . . . . . . . . . . . $ 237,607 $ 268,762 $32,495 $ — $ 538,864
147

WENDY’S/ARBY’S GROUP, INC. AND SUBSIDIARIESWENDY’S/ARBY’S RESTAURANTS, LLC AND SUBSIDIARIES
COMBINED NOTES TO CONSOLIDATED FINANCIAL STATEMENTS—CONTINUED(In Thousands Except Per Share Amounts)
CONDENSED CONSOLIDATING STATEMENTS OF CASH FLOWS
For the year ended December 28, 2008
ParentGuarantor
Subsidiaries
Non-guarantor
Subsidiaries Eliminations Total
Cash flows from continuing operating activities:Net (loss) income . . . . . . . . . . . . . . . . . . . . . . . . . . . . . . $(365,086) $(365,086) $ 2,962 $ 362,124 $(365,086)Adjustments to reconcile net (loss) income to net cash
provided by continuing operating activities:Equity in loss (income) from continuing operations
of subsidiaries . . . . . . . . . . . . . . . . . . . . . . . . . . . 365,086 (2,962) — (362,124) —Depreciation and amortization . . . . . . . . . . . . . . . . — 82,979 2,079 — 85,058Impairment of other long-lived assets . . . . . . . . . . . — 9,580 — — 9,580Tax sharing payments to Wendy’s/Arby’s . . . . . . . . — (17,000) — — (17,000)Write-off and amortization of deferred financing
costs . . . . . . . . . . . . . . . . . . . . . . . . . . . . . . . . . . — 3,753 — — 3,753Distributions received from joint venture . . . . . . . . — — 2,864 — 2,864Share-based compensation provision . . . . . . . . . . . — 8,770 — — 8,770Non-cash rent expense . . . . . . . . . . . . . . . . . . . . . . — 3,103 — — 3,103Accretion of long-term debt . . . . . . . . . . . . . . . . . . — 2,452 — — 2,452Provision for doubtful accounts . . . . . . . . . . . . . . . — 556 114 — 670Deferred income tax benefit, net . . . . . . . . . . . . . . — (62,519) (204) — (62,723)Other operating transactions with affiliates . . . . . . . — 10,859 (5,596) — 5,263Equity in earnings in joint venture . . . . . . . . . . . . . — — (1,974) — (1,974)Net recognition of vendor incentive . . . . . . . . . . . . — (6,459) — — (6,459)Goodwill impairment . . . . . . . . . . . . . . . . . . . . . . . — 460,075 — — 460,075Other, net . . . . . . . . . . . . . . . . . . . . . . . . . . . . . . . — 17,163 (12,811) — 4,352Changes in operating assets and liabilities:
Accounts and notes receivable . . . . . . . . . . . . . — (2,670) 1,303 — (1,367)Inventories . . . . . . . . . . . . . . . . . . . . . . . . . . . — (70) (70) — (140)Prepaid expenses and other current assets . . . . — 14,135 5,665 — 19,800Accounts payable, accrued expenses and other
current liabilities . . . . . . . . . . . . . . . . . . . . . — (40,780) (9,246) — (50,026)
Net cash provided by (used in)continuing operating activities . . . . . . — 115,879 (14,914) — 100,965
Cash flows from continuing investing activities:Capital expenditures . . . . . . . . . . . . . . . . . . . . . . . . — (102,904) (3,020) — (105,924)Proceeds from dispositions . . . . . . . . . . . . . . . . . . . — 1,322 — — 1,322Cost of acquisitions, less cash acquired . . . . . . . . . . — (9,622) — — (9,622)Increase in cash from the Wendy’s merger . . . . . . . — 171,421 28,364 — 199,785Other, net . . . . . . . . . . . . . . . . . . . . . . . . . . . . . . . — (129) — — (129)
Net cash provided by continuinginvesting activities . . . . . . . . . . . . . . . . — 60,088 25,344 — 85,432
Cash flows from continuing financing activities:Proceeds from long-term debt . . . . . . . . . . . . . . . . — 17,753 — — 17,753Repayments of notes payable and long-term
debt . . . . . . . . . . . . . . . . . . . . . . . . . . . . . . . . . . — (175,521) — — (175,521)Capital contributions from Wendy’s/Arby’s . . . . . . — 150,177 — — 150,177Advances to Wendy’s/Arby’s . . . . . . . . . . . . . . . . . — (155,000) — — (155,000)Other, net . . . . . . . . . . . . . . . . . . . . . . . . . . . . . . . — (659) — — (659)
Net cash used in continuing financingactivities . . . . . . . . . . . . . . . . . . . . . . . — (163,250) — — (163,250)
Net cash provided by continuing operations before effect ofexchange rate changes on cash . . . . . . . . . . . . . . . . . . . . . . — 12,717 10,430 — 23,147
Effect of exchange rate changes on cash . . . . . . . . . . . . . . . . . — — (4,123) — (4,123)
Net increase in cash and cash equivalents . . . . . . . . . . . . . . . . — 12,717 6,307 — 19,024Cash and cash equivalents at beginning of year . . . . . . . . . . . . — 41,810 2,246 — 44,056
Cash and cash equivalents at end of year . . . . . . . . . . . . . . . . . $ — $ 54,527 $ 8,553 $ — $ 63,080
148

Item 9. Changes in and Disagreements with Accountants on Accounting and Financial Disclosure
Not applicable.
Item 9A. Controls and Procedures.
Evaluation of Disclosure Controls and Procedures
The management of Wendy’s/Arby’s and Wendy’s/Arby’s Restaurants, under the supervision and with theparticipation of their Chief Executive Officer and Chief Financial Officer, evaluated the effectiveness of the designand operation of their disclosure controls and procedures (as defined in Rules 13a-15(e) or 15d-15(e) under theSecurities Exchange Act of 1934, as amended (the “Exchange Act”)), as of January 2, 2011. Based on suchevaluations, the Chief Executive Officer and Chief Financial Officer concluded that as of January 2, 2011, thedisclosure controls and procedures of Wendy’s/Arby’s and Wendy’s/Arby’s Restaurants were effective in (1) recording,processing, summarizing and reporting, on a timely basis, information required to be disclosed by each company inthe reports that it files or submits under the Exchange Act and (2) ensuring that information required to be disclosedby each company in such reports is accumulated and communicated to management, including the Chief ExecutiveOfficer and our Chief Financial Officer, as appropriate to allow timely decisions regarding required disclosure.
Management’s Report on Internal Control Over Financial Reporting
The management of Wendy’s/Arby’s and Wendy’s/Arby’s Restaurants is responsible for establishing andmaintaining adequate internal control over financial reporting (as defined in Rule 13a-15(f) of the ExchangeAct). The management of Wendy’s/Arby’s and Wendy’s/Arby’s Restaurants, under the supervision and with theparticipation of the Chief Executive Officer and Chief Financial Officer, carried out an assessment of the effectivenessof our internal control over financial reporting for Wendy’s/Arby’s and Wendy’s/Arby’s Restaurants as of January 2,2011. The assessment was performed using the criteria for effective internal control reflected in the Internal Control-Integrated Framework issued by the Committee of Sponsoring Organizations of the Treadway Commission (COSO).
Based on the assessment of the system of internal control for Wendy’s/Arby’s and Wendy’s/Arby’s Restaurants,the management of each company believes that as of January 2, 2011, internal control over financial reporting ofWendy’s/Arby’s and Wendy’s/Arby’s Restaurants were effective.
(Wendy’s/Arby’s)
Our independent registered public accounting firm, Deloitte & Touche LLP, has issued an attestation reportdated March 2, 2011 on Wendy’s/Arby’s internal control over financial reporting.
Changes in Internal Control Over Financial Reporting
There were no changes in the internal control over financial reporting of Wendy’s/Arby’s and Wendy’s/Arby’sRestaurants made during the quarter that materially affected, or are reasonably likely to materially affect, their internalcontrol over financial reporting.
Inherent Limitations on Effectiveness of Controls
There are inherent limitations in the effectiveness of any control system, including the potential for humanerror and the circumvention or overriding of the controls and procedures. Additionally, judgments in decision-making can be faulty and breakdowns can occur because of simple error or mistake. An effective control system canprovide only reasonable, not absolute, assurance that the control objectives of the system are adequatelymet. Accordingly, the management of Wendy’s/Arby’s and Wendy’s/Arby’s Restaurants, including their ChiefExecutive Officer and Chief Financial Officer, does not expect that the control system can prevent or detect all erroror fraud. Finally, projections of any evaluation or assessment of effectiveness of a control system to future periods aresubject to the risks that, over time, controls may become inadequate because of changes in an entity’s operatingenvironment or deterioration in the degree of compliance with policies or procedures.
149

REPORT OF INDEPENDENT REGISTERED PUBLIC ACCOUNTING FIRM
To the Board of Directors and Stockholders ofWendy’s/Arby’s Group, Inc.Atlanta, Georgia
We have audited the internal control over financial reporting of Wendy’s/Arby’s Group, Inc. and subsidiaries(the “Company”) as of January 2, 2011, based on criteria established in Internal Control—Integrated Frameworkissued by the Committee of Sponsoring Organizations of the Treadway Commission. The Company’s management isresponsible for maintaining effective internal control over financial reporting and for its assessment of the effectivenessof internal control over financial reporting, included in Management’s Report on Internal Control over FinancialReporting. Our responsibility is to express an opinion on the Company’s internal control over financial reportingbased on our audit.
We conducted our audit in accordance with the standards of the Public Company Accounting Oversight Board(United States). Those standards require that we plan and perform the audit to obtain reasonable assurance aboutwhether effective internal control over financial reporting was maintained in all material respects. Our audit includedobtaining an understanding of internal control over financial reporting, assessing the risk that a material weaknessexists, testing and evaluating the design and operating effectiveness of internal control based on the assessed risk, andperforming such other procedures as we considered necessary in the circumstances. We believe that our audit providesa reasonable basis for our opinion.
A company’s internal control over financial reporting is a process designed by, or under the supervision of, thecompany’s principal executive and principal financial officers, or persons performing similar functions, and effectedby the company’s board of directors, management, and other personnel to provide reasonable assurance regarding thereliability of financial reporting and the preparation of financial statements for external purposes in accordance withgenerally accepted accounting principles. A company’s internal control over financial reporting includes those policiesand procedures that (1) pertain to the maintenance of records that, in reasonable detail, accurately and fairly reflectthe transactions and dispositions of the assets of the company; (2) provide reasonable assurance that transactions arerecorded as necessary to permit preparation of financial statements in accordance with generally accepted accountingprinciples, and that receipts and expenditures of the company are being made only in accordance with authorizationsof management and directors of the company; and (3) provide reasonable assurance regarding prevention or timelydetection of unauthorized acquisition, use, or disposition of the company’s assets that could have a material effect onthe financial statements.
Because of the inherent limitations of internal control over financial reporting, including the possibility ofcollusion or improper management override of controls, material misstatements due to error or fraud may not beprevented or detected on a timely basis. Also, projections of any evaluation of the effectiveness of the internal controlover financial reporting to future periods are subject to the risk that the controls may become inadequate because ofchanges in conditions, or that the degree of compliance with the policies or procedures may deteriorate.
In our opinion, the Company maintained, in all material respects, effective internal control over financialreporting as of January 2, 2011, based on the criteria established in Internal Control—Integrated Framework issued bythe Committee of Sponsoring Organizations of the Treadway Commission.
We have also audited, in accordance with the standards of the Public Company Accounting Oversight Board(United States), the Company’s consolidated financial statements and financial statement schedule as of and for theyear ended January 2, 2011 and our report dated March 2, 2011 expressed an unqualified opinion on those financialstatements and financial statement schedule.
/s/ Deloitte & Touche LLPAtlanta, GeorgiaMarch 2, 2011
150
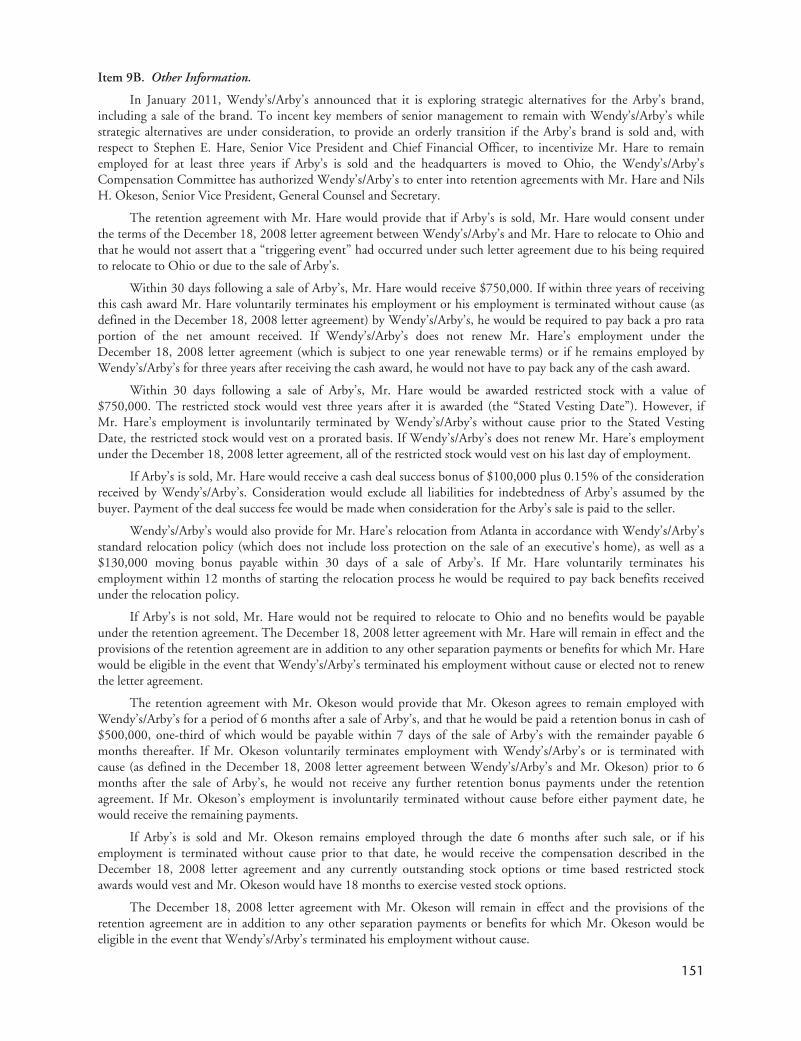
Item 9B. Other Information.
In January 2011, Wendy’s/Arby’s announced that it is exploring strategic alternatives for the Arby’s brand,including a sale of the brand. To incent key members of senior management to remain with Wendy’s/Arby’s whilestrategic alternatives are under consideration, to provide an orderly transition if the Arby’s brand is sold and, withrespect to Stephen E. Hare, Senior Vice President and Chief Financial Officer, to incentivize Mr. Hare to remainemployed for at least three years if Arby’s is sold and the headquarters is moved to Ohio, the Wendy’s/Arby’sCompensation Committee has authorized Wendy’s/Arby’s to enter into retention agreements with Mr. Hare and NilsH. Okeson, Senior Vice President, General Counsel and Secretary.
The retention agreement with Mr. Hare would provide that if Arby’s is sold, Mr. Hare would consent underthe terms of the December 18, 2008 letter agreement between Wendy’s/Arby’s and Mr. Hare to relocate to Ohio andthat he would not assert that a “triggering event” had occurred under such letter agreement due to his being requiredto relocate to Ohio or due to the sale of Arby’s.
Within 30 days following a sale of Arby’s, Mr. Hare would receive $750,000. If within three years of receivingthis cash award Mr. Hare voluntarily terminates his employment or his employment is terminated without cause (asdefined in the December 18, 2008 letter agreement) by Wendy’s/Arby’s, he would be required to pay back a pro rataportion of the net amount received. If Wendy’s/Arby’s does not renew Mr. Hare’s employment under theDecember 18, 2008 letter agreement (which is subject to one year renewable terms) or if he remains employed byWendy’s/Arby’s for three years after receiving the cash award, he would not have to pay back any of the cash award.
Within 30 days following a sale of Arby’s, Mr. Hare would be awarded restricted stock with a value of$750,000. The restricted stock would vest three years after it is awarded (the “Stated Vesting Date”). However, ifMr. Hare’s employment is involuntarily terminated by Wendy’s/Arby’s without cause prior to the Stated VestingDate, the restricted stock would vest on a prorated basis. If Wendy’s/Arby’s does not renew Mr. Hare’s employmentunder the December 18, 2008 letter agreement, all of the restricted stock would vest on his last day of employment.
If Arby’s is sold, Mr. Hare would receive a cash deal success bonus of $100,000 plus 0.15% of the considerationreceived by Wendy’s/Arby’s. Consideration would exclude all liabilities for indebtedness of Arby’s assumed by thebuyer. Payment of the deal success fee would be made when consideration for the Arby’s sale is paid to the seller.
Wendy’s/Arby’s would also provide for Mr. Hare’s relocation from Atlanta in accordance with Wendy’s/Arby’sstandard relocation policy (which does not include loss protection on the sale of an executive’s home), as well as a$130,000 moving bonus payable within 30 days of a sale of Arby’s. If Mr. Hare voluntarily terminates hisemployment within 12 months of starting the relocation process he would be required to pay back benefits receivedunder the relocation policy.
If Arby’s is not sold, Mr. Hare would not be required to relocate to Ohio and no benefits would be payableunder the retention agreement. The December 18, 2008 letter agreement with Mr. Hare will remain in effect and theprovisions of the retention agreement are in addition to any other separation payments or benefits for which Mr. Harewould be eligible in the event that Wendy’s/Arby’s terminated his employment without cause or elected not to renewthe letter agreement.
The retention agreement with Mr. Okeson would provide that Mr. Okeson agrees to remain employed withWendy’s/Arby’s for a period of 6 months after a sale of Arby’s, and that he would be paid a retention bonus in cash of$500,000, one-third of which would be payable within 7 days of the sale of Arby’s with the remainder payable 6months thereafter. If Mr. Okeson voluntarily terminates employment with Wendy’s/Arby’s or is terminated withcause (as defined in the December 18, 2008 letter agreement between Wendy’s/Arby’s and Mr. Okeson) prior to 6months after the sale of Arby’s, he would not receive any further retention bonus payments under the retentionagreement. If Mr. Okeson’s employment is involuntarily terminated without cause before either payment date, hewould receive the remaining payments.
If Arby’s is sold and Mr. Okeson remains employed through the date 6 months after such sale, or if hisemployment is terminated without cause prior to that date, he would receive the compensation described in theDecember 18, 2008 letter agreement and any currently outstanding stock options or time based restricted stockawards would vest and Mr. Okeson would have 18 months to exercise vested stock options.
The December 18, 2008 letter agreement with Mr. Okeson will remain in effect and the provisions of theretention agreement are in addition to any other separation payments or benefits for which Mr. Okeson would beeligible in the event that Wendy’s/Arby’s terminated his employment without cause.
151

PART III
Items 10, 11, 12, 13 and 14.
The information for Wendy’s/Arby’s required by Items 10, 11, 12 and 13 and for the Companies by Item 14will be furnished on or prior to May 2, 2011 (and is hereby incorporated by reference) by an amendment hereto orpursuant to a definitive proxy statement involving the election of directors pursuant to Regulation 14A that willcontain such information. Notwithstanding the foregoing, information appearing in the section “Audit CommitteeReport” shall not be deemed to be incorporated by reference in this Form 10-K.
PART IV
Item 15. Exhibits and Financial Statement Schedules.
(a) 1. Financial Statements:
See Index to Financial Statements (Item 8).
2. Financial Statement Schedules:
Schedule I–Condensed Balance Sheets (Parent Company Only)–as of January 3, 2010 and December 28, 2008;Condensed Statements of Operations (Parent Company Only)–for the fiscal years ended January 3, 2010,December 28, 2008 and December 30, 2007; Condensed Statements of Cash Flows (Parent Company Only)–for thefiscal years ended January 3, 2010, December 28, 2008 and December 30, 2007.
All other schedules have been omitted since they are either not applicable or the information is containedelsewhere in “Item 8. Financial Statements and Supplementary Data.”
152

3. Exhibits:
Copies of the following exhibits are available at a charge of $.25 per page upon written request to the Secretaryof Wendy’s/Arby’s Group, Inc. at 1155 Perimeter Center West, Atlanta, Georgia 30338. Exhibits that areincorporated by reference to documents filed previously by Wendy’s/Arby’s under the Securities Exchange Act of1934, as amended, are filed with the Securities and Exchange Commission under File No. 001-02207, FileNo. 333-161613 for documents filed by Wendy’s/Arby’s Restaurants or File No. 001-08116 for documents filed byWendy’s International, Inc. Exhibits listed below are exhibits of both Wendy’s/Arby’s and Wendy’s/Arby’sRestaurants unless otherwise noted.
EXHIBITNO. DESCRIPTION
2.1 Agreement and Plan of Merger, dated as of April 23, 2008, by and among Triarc Companies, Inc.,Green Merger Sub Inc. and Wendy’s International, Inc., incorporated herein by reference to Exhibit 2.1to Triarc’s Current Report on Form 8-K filed on April 29, 2008 (SEC file no. 001-02207).
2.2 Side Letter Agreement, dated August 14, 2008, by and among Triarc Companies, Inc., Green MergerSub, Inc. and Wendy’s International, Inc., incorporated herein by reference to Exhibit 2.3 to Triarc’sRegistration Statement on Form S-4, Amendment No. 3, filed on August 15, 2008 (Reg. no.333-151336).
2.3 Agreement and Plan of Merger, dated as of December 17, 2007, by and among Deerfield Triarc CapitalCorp., DFR Merger Company, LLC, Deerfield & Company LLC and, solely for the purposes set forththerein, Triarc Companies, Inc. (in such capacity, the Sellers’ Representative), incorporated herein byreference to Exhibit 2.1 to Triarc’s Current Report on Form 8-K filed on December 21, 2007 (SEC fileno. 001-02207). (Wendy’s/Arby’s only).
3.1 Amended and Restated Certificate of Incorporation of Wendy’s/Arby’s Group, Inc., as filed with theSecretary of State of the State of Delaware on May 28, 2009, incorporated herein by reference to Exhibit3.1 to Wendy’s/Arby’s Group’s Current Report on Form 8-K filed on June 1, 2009 (SEC file no.001-02207).
3.2 Amended and Restated By-Laws of Wendy’s/Arby’s Group, Inc., as amended and restated as of May 28,2009, incorporated herein by reference to Exhibit 3.2 to Wendy’s/Arby’s Group’s Current Report onForm 8-K filed on June 1, 2009 (SEC file no. 001-02207).
3.3 Certificate of Formation of Wendy’s/Arby’s Restaurants, LLC, as amended to date, incorporated byreference to Exhibit 3.1 to Wendy’s/Arby’s Restaurants’ Registration Statement on Form S-4 filed onAugust 28, 2009 (Reg. No. 333-161613). (Wendy’s/Arby’s Restaurants only.)
3.4 Third Amended and Restated Limited Liability Company Operating Agreement of Wendy’s/Arby’sRestaurants, LLC, incorporated by reference to Exhibit 3.2 to Wendy’s/Arby’s Restaurants’ RegistrationStatement on Form S-4 filed on August 28, 2009 (Reg. no. 333-161613). (Wendy’s/Arby’s Restaurantsonly.)
4.1 Indenture, dated as of November 13, 2001, between Wendy’s International, Inc. and Bank One,National Association, incorporated herein by reference to Exhibit 4(i) of the Wendy’s International, Inc.Form 10-K for the year ended December 30, 2001 (SEC file no. 001-08116).
4.2 Indenture, dated as of June 23, 2009, among Wendy’s/Arby’s Restaurants, LLC, the guarantors namedtherein and U.S. Bank National Association, as Trustee, incorporated herein by reference to Exhibit 4.1to Wendy’s/Arby’s Group’s Form 10-Q for the quarter ended June 28, 2009 (SEC file no. 001-02207).
4.3 Form of Exchange Note, incorporated by reference to Exhibit A of Exhibit 4.1 to Wendy’s/Arby’sRestaurants’ Registration Statement on Form S-4 filed on August 28, 2009 (Reg. no. 333-161613).
4.4 Supplemental Indenture, dated as of July 8, 2009, among Wendy’s/Arby’s Restaurants, LLC, theguarantors named therein and U.S. Bank National Association, as Trustee, incorporated herein byreference to Exhibit 4.3 to Wendy’s/Arby’s Group’s Form 10-Q for the quarter ended June 28, 2009(SEC file no. 001-02207).
153

EXHIBITNO. DESCRIPTION
4.5 Supplemental Indenture, dated as of December 21, 2009, among Wendy’s/Arby’s Restaurants, LLC, theguarantor named therein and U.S. Bank National Association, as Trustee, incorporated herein byreference to Exhibit 4.1 to Wendy’s/Arby’s Restaurants Form 10-Q for the quarter ended April 4, 2010(SEC file no. 333-161613).
4.6 Supplemental Indenture, dated as of December 3, 2010, among Wendy’s/Arby’s Restaurants, LLC, theguarantor named therein and U.S. Bank National Association, as Trustee.*
10.1 Triarc Companies, Inc. Amended and Restated 1997 Equity Participation Plan, incorporated herein byreference to Exhibit 10.2 to Triarc’s Current Report on Form 8-K filed on May 19, 2005(SEC file no. 001-02207).**
10.2 Form of Non-Incentive Stock Option Agreement under the Triarc Companies, Inc. Amended andRestated 1997 Equity Participation Plan, incorporated herein by reference to Exhibit 10.6 to Triarc’sCurrent Report on Form 8-K filed on March 16, 1998 (SEC file no. 001-02207).**
10.3 Triarc Companies, Inc. Amended and Restated 1998 Equity Participation Plan, incorporated herein byreference to Exhibit 10.3 to Triarc’s Current Report on Form 8-K filed on May 19, 2005(SEC file no. 001-02207).**
10.4 Form of Non-Incentive Stock Option Agreement under the Triarc Companies, Inc. Amended andRestated 1998 Equity Participation Plan, incorporated herein by reference to Exhibit 10.2 to Triarc’sCurrent Report on Form 8-K filed on May 13, 1998 (SEC file no. 001-02207).**
10.5 Wendy’s/Arby’s Group, Inc. Amended and Restated 2002 Equity Participation Plan, as amended,incorporated herein by reference to Exhibit 10.5 to Wendy’s/Arby’s Group’s Form 10-K for the yearended December 28, 2008 (SEC file no. 001-02207).**
10.6 Form of Non-Incentive Stock Option Agreement under the Wendy’s/Arby’s Group, Inc. Amended andRestated 2002 Equity Participation Plan, as amended, incorporated herein by reference to Exhibit 99.6to Wendy’s/Arby’s Group’s Current Report on Form 8-K filed on December 22, 2008(SEC file no. 001-02207).**
10.7 Form of Restricted Stock Agreement under the Wendy’s/Arby’s Group, Inc. Amended and Restated2002 Equity Participation Plan, as amended, incorporated herein by reference to Exhibit 10.7 toWendy’s/Arby’s Group’s Form 10-K for the year ended December 28, 2008(SEC file no. 001-02207).**
10.8 Form of Non-Employee Director Restricted Stock Award Agreement under the Wendy’s/Arby’s Group,Inc. Amended and Restated 2002 Equity Participation Plan, incorporated herein by reference to Exhibit10.7 to Wendy’s/Arby’s Group’s Form 10-Q for the quarter ended June 28, 2009(SEC file no. 001-02207).**
10.9 Form of Non-Incentive Stock Option Agreement under the Wendy’s/Arby’s Group, Inc. Amended andRestated 2002 Equity Participation Plan, as amended, incorporated herein by reference to Exhibit 10.1to Wendy’s/Arby’s Group’s Form 10-Q for the quarter ended September 27, 2009(SEC file no. 001-02207).**
10.10 Form of Restricted Share Unit Award Agreement under the Wendy’s/Arby’s Group, Inc. Amended andRestated 2002 Equity Participation Plan, as amended, incorporated herein by reference to Exhibit 10.2to Wendy’s/Arby’s Group’s Form 10-Q for the quarter ended September 27, 2009(SEC file no. 001-02207).**
10.11 Wendy’s/Arby’s Group, Inc. 2010 Omnibus Award Plan, incorporated by reference to Annex A of theWendy’s/Arby’s Group, Inc. Definitive 2010 Proxy Statement (SEC file no. 001-02207).**
10.12 Form of Non-Incentive Stock Option Award Agreement under the Wendy’s/Arby’s Group, Inc. 2010Omnibus Award Plan, incorporated by reference to Exhibit 10.5 to Wendy’s/Arby’s Group’s Form10-Q for the quarter ended July 4, 2010 (SEC file no. 001-02207).**
154
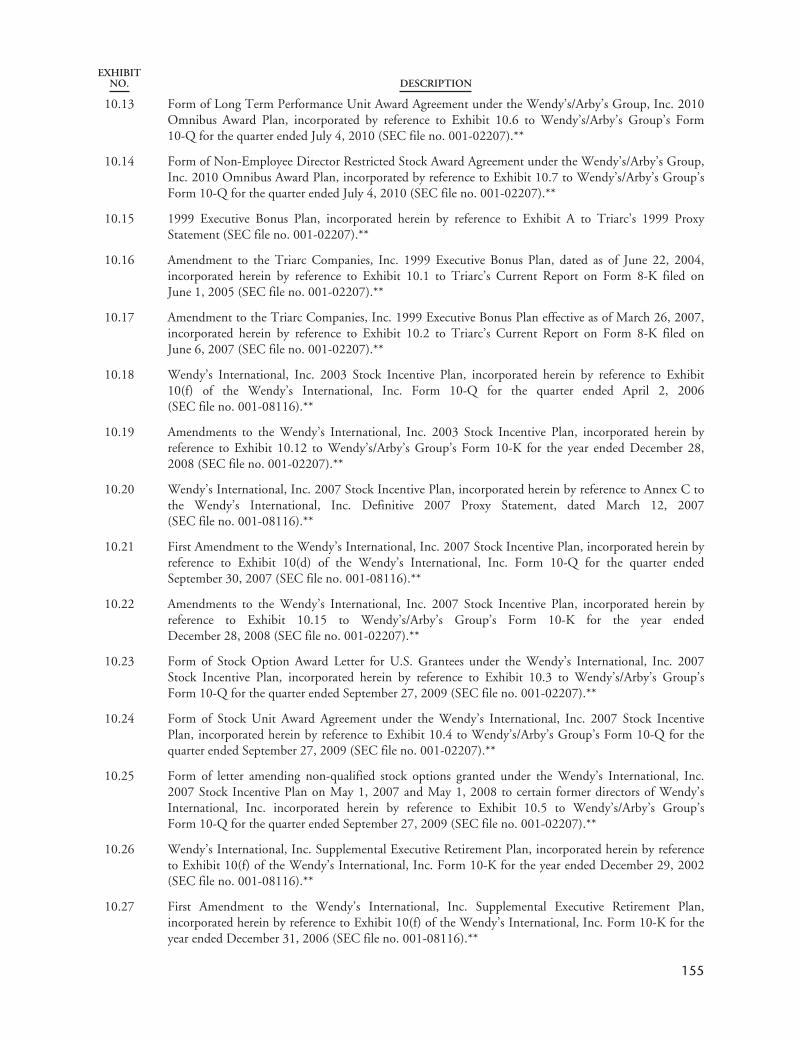
EXHIBITNO. DESCRIPTION
10.13 Form of Long Term Performance Unit Award Agreement under the Wendy’s/Arby’s Group, Inc. 2010Omnibus Award Plan, incorporated by reference to Exhibit 10.6 to Wendy’s/Arby’s Group’s Form10-Q for the quarter ended July 4, 2010 (SEC file no. 001-02207).**
10.14 Form of Non-Employee Director Restricted Stock Award Agreement under the Wendy’s/Arby’s Group,Inc. 2010 Omnibus Award Plan, incorporated by reference to Exhibit 10.7 to Wendy’s/Arby’s Group’sForm 10-Q for the quarter ended July 4, 2010 (SEC file no. 001-02207).**
10.15 1999 Executive Bonus Plan, incorporated herein by reference to Exhibit A to Triarc’s 1999 ProxyStatement (SEC file no. 001-02207).**
10.16 Amendment to the Triarc Companies, Inc. 1999 Executive Bonus Plan, dated as of June 22, 2004,incorporated herein by reference to Exhibit 10.1 to Triarc’s Current Report on Form 8-K filed onJune 1, 2005 (SEC file no. 001-02207).**
10.17 Amendment to the Triarc Companies, Inc. 1999 Executive Bonus Plan effective as of March 26, 2007,incorporated herein by reference to Exhibit 10.2 to Triarc’s Current Report on Form 8-K filed onJune 6, 2007 (SEC file no. 001-02207).**
10.18 Wendy’s International, Inc. 2003 Stock Incentive Plan, incorporated herein by reference to Exhibit10(f) of the Wendy’s International, Inc. Form 10-Q for the quarter ended April 2, 2006(SEC file no. 001-08116).**
10.19 Amendments to the Wendy’s International, Inc. 2003 Stock Incentive Plan, incorporated herein byreference to Exhibit 10.12 to Wendy’s/Arby’s Group’s Form 10-K for the year ended December 28,2008 (SEC file no. 001-02207).**
10.20 Wendy’s International, Inc. 2007 Stock Incentive Plan, incorporated herein by reference to Annex C tothe Wendy’s International, Inc. Definitive 2007 Proxy Statement, dated March 12, 2007(SEC file no. 001-08116).**
10.21 First Amendment to the Wendy’s International, Inc. 2007 Stock Incentive Plan, incorporated herein byreference to Exhibit 10(d) of the Wendy’s International, Inc. Form 10-Q for the quarter endedSeptember 30, 2007 (SEC file no. 001-08116).**
10.22 Amendments to the Wendy’s International, Inc. 2007 Stock Incentive Plan, incorporated herein byreference to Exhibit 10.15 to Wendy’s/Arby’s Group’s Form 10-K for the year endedDecember 28, 2008 (SEC file no. 001-02207).**
10.23 Form of Stock Option Award Letter for U.S. Grantees under the Wendy’s International, Inc. 2007Stock Incentive Plan, incorporated herein by reference to Exhibit 10.3 to Wendy’s/Arby’s Group’sForm 10-Q for the quarter ended September 27, 2009 (SEC file no. 001-02207).**
10.24 Form of Stock Unit Award Agreement under the Wendy’s International, Inc. 2007 Stock IncentivePlan, incorporated herein by reference to Exhibit 10.4 to Wendy’s/Arby’s Group’s Form 10-Q for thequarter ended September 27, 2009 (SEC file no. 001-02207).**
10.25 Form of letter amending non-qualified stock options granted under the Wendy’s International, Inc.2007 Stock Incentive Plan on May 1, 2007 and May 1, 2008 to certain former directors of Wendy’sInternational, Inc. incorporated herein by reference to Exhibit 10.5 to Wendy’s/Arby’s Group’sForm 10-Q for the quarter ended September 27, 2009 (SEC file no. 001-02207).**
10.26 Wendy’s International, Inc. Supplemental Executive Retirement Plan, incorporated herein by referenceto Exhibit 10(f) of the Wendy’s International, Inc. Form 10-K for the year ended December 29, 2002(SEC file no. 001-08116).**
10.27 First Amendment to the Wendy’s International, Inc. Supplemental Executive Retirement Plan,incorporated herein by reference to Exhibit 10(f) of the Wendy’s International, Inc. Form 10-K for theyear ended December 31, 2006 (SEC file no. 001-08116).**
155
EXHIBITNO. DESCRIPTION
10.28 Amended and Restated Wendy’s International, Inc. Supplemental Executive Retirement Plan No. 2,incorporated herein by reference to Exhibit 10.24 to Wendy’s/Arby’s Group’s Form 10-K for the yearended January 3, 2010 (SEC file no. 001-02207). **
10.29 Amended and Restated Wendy’s International, Inc. Supplemental Executive Retirement Plan No. 3,incorporated herein by reference to Exhibit 10.25 to Wendy’s/Arby’s Group’s Form 10-K for the yearended January 3, 2010 (SEC file no. 001-02207). **
10.30 Wendy’s/Arby’s Group, Inc. 2009 Directors’ Deferred Compensation Plan, effective as of May 28,2009, incorporated herein by reference to Exhibit 10.6 to Wendy’s/Arby’s Group’s Form 10-Q for thequarter ended June 28, 2009 (SEC file no. 001-02207).**
10.31 Amendment No. 1 to the Wendy’s/Arby’s Group, Inc. 2009 Directors’ Deferred Compensation Plan,effective as of May 27, 2010, incorporated by reference to Exhibit 10.9 to Wendy’s/Arby’s Group’sForm 10-Q for the quarter ended July 4, 2010 (SEC file no. 001-02207).**
10.32 Credit Agreement, dated as of May 24, 2010, among Wendy’s/Arby’s Restaurants, LLC, as borrower,Bank of America, N.A., as administrative agent, Citicorp North America, Inc., as syndication agent,Wells Fargo Bank, National Association, as documentation agent, and the lenders and issuers partythereto, incorporated herein by reference to Exhibit 10.1 to Wendy’s/Arby’s Group’s Current Report onForm 8-K filed on May 25, 2010 (SEC file no. 001-02207).
10.33 Amendment No. 1, dated as of July 12, 2010, to the Credit Agreement, dated as of May 24, 2010,among Wendy’s/Arby’s Restaurants, LLC, as borrower, Bank of America, N.A., as administrative agent,Citicorp North America, Inc., as syndication agent, Wells Fargo Bank, National Association, asdocumentation agent, and the lenders and issuers party thereto, incorporated herein by reference toExhibit 10.3 to Wendy’s/Arby’s Group’s Form 10-Q for the quarter ended July 4, 2010(SEC file no. 001-02207).
10.34 Security Agreement, dated as of May 24, 2010, among Wendy’s/Arby’s Restaurants, LLC, theguarantors from time to time party thereto, as pledgors, and Bank of America, N.A., as administrativeagent, incorporated herein by reference to Exhibit 10.2 to Wendy’s/Arby’s Group’s Current Report onForm 8-K filed on May 25, 2010 (SEC file no. 001-02207).
10.35 Assignment of Rights Agreement between Wendy’s International, Inc. and Mr. R. David Thomas,incorporated herein by reference to Exhibit 10(c) of the Wendy’s International, Inc. Form 10-K for theyear ended December 31, 2000 (SEC file no. 001-08116).
10.36 Form of Guaranty Agreement dated as of March 23, 1999 among National Propane Corporation,Triarc Companies, Inc. and Nelson Peltz and Peter W. May, incorporated herein by reference to Exhibit10.30 to Triarc’s Annual Report on Form 10-K for the fiscal year ended January 3, 1999(SEC file no. 001-02207). (Wendy’s/Arby’s only.)
10.37 Indemnity Agreement, dated as of October 25, 2000 between Cadbury Schweppes plc and TriarcCompanies, Inc., incorporated herein by reference to Exhibit 10.1 to Triarc’s Current Report on Form8-K filed on November 8, 2000 (SEC file no. 001-02207). (Wendy’s/Arby’s only.)
10.38 Amended and Restated Investment Management Agreement, dated as of April 30, 2007, betweenTCMG-MA, LLC and Trian Fund Management, L.P., incorporated herein by reference to Exhibit 10.2to Triarc’s Current Report on Form 8-K filed on April 30, 2007 (SEC file no. 001-02207).(Wendy’s/Arby’s only.)
10.39 Withdrawal Agreement dated June 10, 2009 between TCMG-MA, LLC and Trian Fund Management,L.P., incorporated herein by reference to Exhibit 10.3 to Wendy’s/Arby’s Group’s Current Report onForm 8-K filed on June 11, 2009 (SEC file no. 001-02207). (Wendy’s/Arby’s only.)
10.40 Separation Agreement, dated as of April 30, 2007, between Triarc Companies, Inc. and Nelson Peltz,incorporated herein by reference to Exhibit 10.3 to Triarc’s Current Report on Form 8-K filed onApril 30, 2007 (SEC file no. 001-02207).**
156
EXHIBITNO. DESCRIPTION
10.41 Letter Agreement dated as of December 28, 2007, between Triarc Companies, Inc. and Nelson Peltz.,incorporated herein by reference to Exhibit 10.2 to Triarc’s Current Report on Form 8-K filed onJanuary 4, 2008 (SEC file no. 001-02207).**
10.42 Separation Agreement, dated as of April 30, 2007, between Triarc Companies, Inc. and Peter W. May,incorporated herein by reference to Exhibit 10.4 to Triarc’s Current Report on Form 8-K filed onApril 30, 2007 (SEC file no. 001-02207).**
10.43 Letter Agreement dated as of December 28, 2007, between Triarc Companies, Inc. and Peter W. May,incorporated herein by reference to Exhibit 10.3 to Triarc’s Current Report on Form 8-K filed onJanuary 4, 2008 (SEC file no. 001-02207).**
10.44 Agreement dated June 10, 2009 between Wendy’s/Arby’s Group, Inc. and Trian Fund Management,L.P., incorporated herein by reference to Exhibit 10.1 to Wendy’s/Arby’s Group’s Current Report onForm 8-K filed on June 11, 2009 (SEC file no. 001-02207). (Wendy’s/Arby’s only.)
10.45 Liquidation Services Agreement dated June 10, 2009 between Wendy’s/Arby’s Group, Inc. and TrianFund Management, L.P., incorporated herein by reference to Exhibit 10.2 to Wendy’s/Arby’s Group’sCurrent Report on Form 8-K filed on June 11, 2009 (SEC file no. 001-02207). (Wendy’s/Arby’s only.)
10.46 Letter Agreement dated as of December 28, 2007, between Triarc Companies, Inc. and Trian FundManagement, L.P., incorporated herein by reference to Exhibit 10.1 to Triarc’s Current Report onForm 8-K filed on January 4, 2008 (SEC file no. 001-02207). (Wendy’s/Arby’s only.)
10.47 Assignment and Assumption of Lease, dated as of June 30, 2007, between Triarc Companies, Inc. andTrian Fund Management, L.P., incorporated herein by reference to Exhibit 10.1 to Triarc’s CurrentReport on Form 8-K filed on August 10, 2007 (SEC file no. 001-02207). (Wendy’s/Arby’s only.)
10.48 Bill of Sale dated July 31, 2007, by Triarc Companies, Inc. to Trian Fund Management, L.P.,incorporated herein by reference to Exhibit 10.2 to Triarc’s Current Report on Form 8-K filed onAugust 10, 2007 (SEC file no. 001-02207). (Wendy’s/Arby’s only.)
10.49 Agreement of Sublease between Triarc Companies, Inc. and Trian Fund Management, L.P.,incorporated herein by reference to Exhibit 10.4 to Triarc’s Current Report on Form 8-K filed onAugust 10, 2007 (SEC file no. 001-02207). (Wendy’s/Arby’s only.)
10.50 First Amendment to Agreement of Sublease between Wendy’s/Arby’s Group, Inc. (f/k/a TriarcCompanies, Inc.) and Trian Fund Management, L.P., incorporated herein by reference to Exhibit 10.10to Wendy’s/Arby’s Group’s Form 10-Q for the quarter ended July 4, 2010 (SEC file no. 001-02207).(Wendy’s/Arby’s only.)
10.51 Form of Aircraft Time Sharing Agreement between Triarc Companies, Inc. and each of Trian FundManagement, L.P., Nelson Peltz, Peter W. May and Edward P. Garden, incorporated herein byreference to Exhibit 10.5 to Triarc’s Current Report on Form 8-K filed on August 10, 2007 (SEC fileno. 001-02207). (Wendy’s/Arby’s only.)
10.52 Aircraft Lease Agreement dated June 10, 2009 between Wendy’s/Arby’s Group, Inc. and TASCO,LLC., incorporated herein by reference to Exhibit 10.4 to Wendy’s/Arby’s Group’s Current Report onForm 8-K filed on June 11, 2009 (SEC file no. 001-02207). (Wendy’s/Arby’s only.)
10.53 Amendment No. 1 to Aircraft Lease Agreement dated June 10, 2009 between Wendy’s/Arby’s Group,Inc. and TASCO, LLC., incorporated herein by reference to Exhibit 10.11 to Wendy’s/Arby’s Group’sForm 10-Q for the quarter ended July 4, 2010 (SEC file no. 001-02207). (Wendy’s/Arby’s only.)
10.54 Registration Rights Agreement dated as of April 23, 1993, between DWG Corporation and DWGAcquisition Group, L.P., incorporated herein by reference to Exhibit 10.36 to Wendy’s/Arby’s Group’sAnnual Report on Form 10-K for the fiscal year ended December 28, 2008 (SEC file no. 001-02207).(Wendy’s/Arby’s only.)
157
EXHIBITNO. DESCRIPTION
10.55 Letter Agreement dated August 6, 2007, between Triarc Companies, Inc. and Trian Fund Management,L.P., incorporated herein by reference to Exhibit 10.7 to Triarc’s Current Report on Form 8-K filed onAugust 10, 2007 (SEC file no. 001-02207). (Wendy’s/Arby’s only.)
10.56 Agreement dated November 5, 2008 by and between Wendy’s/Arby’s Group, Inc. and Trian Partners,L.P., Trian Partners Master Fund, L.P., Trian Partners Parallel Fund I, L.P., Trian Partners ParallelFund II, L.P., Trian Fund Management, L.P., Nelson Peltz, Peter W. May and Edward P. Garden,incorporated herein by reference to Exhibit 10.1 to Wendy’s/Arby’s Group’s Current Report on Form8-K filed on November 12, 2008 (SEC file no. 001-02207). (Wendy’s/Arby’s only.)
10.57 Amendment No. 1 to Agreement, dated as of April 1, 2009, among Wendy’s/Arby’s Group, Inc., TrianPartners, L.P., Trian Partners Master Fund, L.P., Trian Partners Parallel Fund I, L.P., Trian PartnersParallel Fund II, L.P., Trian Fund Management, L.P., Trian Fund Management GP, LLC, NelsonPeltz, Peter W. May and Edward P. Garden, incorporated herein by reference to Exhibit 10.2 toWendy’s/Arby’s Group’s Current Report on Form 8-K filed on April 2, 2009 (SEC file no. 001-02207).(Wendy’s/Arby’s only.)
10.58 Consulting and Employment Agreement dated July 25, 2008 between Triarc Companies, Inc. and J.David Karam, incorporated herein by reference to Exhibit 99.1 to Triarc’s Current Report on Form 8-Kfiled on July 25, 2008 (SEC file no. 001-02207).**
10.59 Amended and Restated Letter Agreement dated as of December 18, 2008 between Thomas A. Garrettand Arby’s Restaurant Group, Inc., incorporated herein by reference to Exhibit 99.1 to Wendy’s/Arby’sGroup’s Current Report on Form 8-K filed on December 22, 2008 (SEC file no. 001-02207).**
10.60 Amended and Restated Letter Agreement dated as of December 18, 2008 between Sharron Barton andWendy’s/Arby’s Group, Inc., incorporated herein by reference to Exhibit 99.2 to Wendy’s/Arby’sGroup’s Current Report on Form 8-K filed on December 22, 2008 (SEC file no. 001-02207).**
10.61 Amended and Restated Letter Agreement dated as of December 18, 2008 between Nils H. Okeson andWendy’s/Arby’s Group, Inc., incorporated herein by reference to Exhibit 99.3 to Wendy’s/Arby’sGroup’s Current Report on Form 8-K filed on December 22, 2008 (SEC file no. 001-02207).**
10.62 Amended and Restated Letter Agreement dated as of December 18, 2008 between Stephen E. Hare andWendy’s/Arby’s Group, Inc., incorporated herein by reference to Exhibit 99.4 to Wendy’s/Arby’sGroup’s Current Report on Form 8-K filed on December 22, 2008 (SEC file no. 001-02207).**
10.63 Amended and Restated Letter Agreement dated as of December 18, 2008 between Roland C. Smith andWendy’s/Arby’s Group, Inc., incorporated herein by reference to Exhibit 99.5 to Wendy’s/Arby’sGroup’s Current Report on Form 8-K filed on December 28, 2008 (SEC file no. 001-02207).**
10.64 Letter Agreement dated as of May 11, 2010 between Hala Moddelmog and Wendy’s/Arby’s Group,Inc., incorporated by reference to Exhibit 10.1 to Wendy’s/Arby’s Group’s Current Report on Form8-K filed on May 14, 2010 (SEC file no. 001-02207).**
10.65 Form of Indemnification Agreement, between Wendy’s/Arby’s Group, Inc. and certain officers,directors, and employees thereof, incorporated herein by reference to Exhibit 10.47 to Wendy’s/Arby’sGroup’s Annual Report on Form 10-K for the fiscal year ended December 28, 2008(SEC file no. 001-02207).**
10.66 Form of Indemnification Agreement between Arby’s Restaurant Group, Inc. and certain directors,officers and employees thereof, incorporated herein by reference to Exhibit 10.40 to Triarc’s AnnualReport on Form 10-K for the fiscal year ended December 30, 2007 (SEC file no. 001-02207).**
10.67 Form of Indemnification Agreement for officers and employees of Wendy’s International, Inc. and itssubsidiaries, incorporated herein by reference to Exhibit 10 of the Wendy’s International, Inc. CurrentReport on Form 8-K filed on July 12, 2005 (SEC file no. 001-08116).**
158

EXHIBITNO. DESCRIPTION
10.68 Form of First Amendment to Indemnification Agreement between Wendy’s International, Inc. and itsdirectors and certain officers and employees, incorporated herein by reference to Exhibit 10(b) of theWendy’s International, Inc. Form 10-Q for the quarter ended June 29, 2008(SEC file no. 001-08116).**
10.69 Tax Sharing Agreement, dated as of May 26, 2009, among Wendy’s/Arby’s Group, Inc. and certain ofits subsidiaries party thereto, incorporated by reference to Exhibit 10.40 to Wendy’s/Arby’sRestaurants’ Registration Statement on Form S-4 filed on August 28, 2009 (Reg. no. 333-161613).(Wendy’s/Arby’s Restaurants only.)
21.1 Subsidiaries of the Registrant.*
23.1 Consent of Deloitte & Touche LLP.*
23.2 Consent of PricewaterhouseCoopers, LLP.*
31.1 Certification of the Chief Executive Officer of Wendy’s/Arby’s pursuant to Section 302 of theSarbanes-Oxley Act of 2002.*
31.2 Certification of the Chief Financial Officer of Wendy’s/Arby’s pursuant to Section 302 of theSarbanes-Oxley Act of 2002.*
31.3 Certification of the Chief Executive Officer of Wendy’s/Arby’s Restaurants pursuant to Section 302 ofthe Sarbanes-Oxley Act of 2002.*
31.4 Certification of the Chief Financial Officer of Wendy’s/Arby’s Restaurants pursuant to Section 302 ofthe Sarbanes-Oxley Act of 2002.*
32.1 Certification of the Chief Executive Officer and Chief Financial Officer of Wendy’s/Arby’s pursuant toSection 906 of the Sarbanes-Oxley Act of 2002.*
99.1 Audited Financial Statements of TimWen Partnership.*
101.INS XBRL Instance Document*
101.SCH XBRL Taxonomy Extension Schema Document*
101.CAL XBRL Taxonomy Extension Calculation Linkbase Document*
101.LAB XBRL Taxonomy Extension Label Linkbase Document*
101.PRE XBRL Taxonomy Extension Presentation Linkbase Document*
101.DEF XBRL Taxonomy Extension Definition Linkbase Document*
* Filed herewith.** Identifies a management contract or compensatory plan or arrangement.*** In accordance with Regulation S-T, the XBRL-related information in Exhibit 101 to this Annual Report on
Form 10-K shall be deemed to be “furnished” and not “filed.”
Instruments defining the rights of holders of certain issues of long-term debt of the Companies and their consolidatedsubsidiaries have not been filed as exhibits to this Form 10-K because the authorized principal amount of any one ofsuch issues does not exceed 10% of the total assets of the Companies and their subsidiaries on a consolidated basis.The Companies agree to furnish a copy of each of such instruments to the Commission upon request.
159
SIGNATURES
Pursuant to the requirements of Section 13 or 15(d) of the Securities Exchange Act of 1934, the registrant hasduly caused this report to be signed on its behalf by the undersigned, thereunto duly authorized.
WENDY’S/ARBY’S GROUP, INC.(Registrant)
Dated: March 3, 2011 By: /S/ ROLAND C. SMITH
Roland C. SmithPresident and Chief Executive Officer
Pursuant to the requirements of the Securities Exchange Act of 1934, this report has been signed below onMarch 3, 2011 by the following persons on behalf of the registrant in the capacities indicated.
Signature Titles
/S/ ROLAND C. SMITH
(Roland C. Smith)
President, Chief Executive Officer and Director(Principal Executive Officer)
/S/ STEPHEN E. HARE
(Stephen E. Hare)
Senior Vice President and Chief Financial Officer(Principal Financial Officer)
/S/ STEVEN B. GRAHAM
(Steven B. Graham)
Senior Vice President and Chief Accounting Officer(Principal Accounting Officer)
/S/ NELSON PELTZ
(Nelson Peltz)
Chairman and Director
/S/ PETER W. MAY
(Peter W. May)
Vice Chairman and Director
/S/ CLIVE CHAJET
(Clive Chajet)
Director
/S/ EDWARD P. GARDEN
(Edward P. Garden)
Director
/S/ JANET HILL
(Janet Hill)
Director
/S/ JOSEPH A. LEVATO
(Joseph A. Levato)
Director
/S/ J. RANDOLPH LEWIS
(J. Randolph Lewis)
Director
/S/ PETER H. ROTHSCHILD
(Peter H. Rothschild)
Director
/S/ DAVID E. SCHWAB II(David E. Schwab II)
Director
/S/ RAYMOND S. TROUBH
(Raymond S. Troubh)
Director
/S/ JACK G. WASSERMAN
(Jack G. Wasserman)
Director
160

WENDY’S/ARBY’S RESTAURANTS, LLC(Registrant)
Dated: March 3, 2011 By: /S/ ROLAND C. SMITH
Roland C. SmithPresident and Chief Executive Officer
Pursuant to the requirements of the Securities Exchange Act of 1934, this report has been signed below onMarch 3, 2011 by the following persons on behalf of the registrant in the capacities indicated.
Signature Titles
/S/ ROLAND C. SMITH President, Chief Executive Officer, and Manager(Principal Executive Officer)(Roland C. Smith)
/S/ STEPHEN E. HARE Senior Vice President and Chief Financial Officer, andManager (Principal Financial Officer)(Stephen E. Hare)
/S/ STEVEN B. GRAHAM Senior Vice President and Chief Accounting Officer(Principal Accounting Officer)(Steven B. Graham)
/S/ NILS H. OKESON Manager(Nils H. Okeson)
/S/ JOSEPH A. LEVATO Manager(Joseph A. Levato)
/S/ DAVID E. SCHWAB II Manager(David E. Schwab II)
/S/ RAYMOND S. TROUBH Manager(Raymond S. Troubh)
/S/ JACK G. WASSERMAN Manager(Jack G. Wasserman)
161
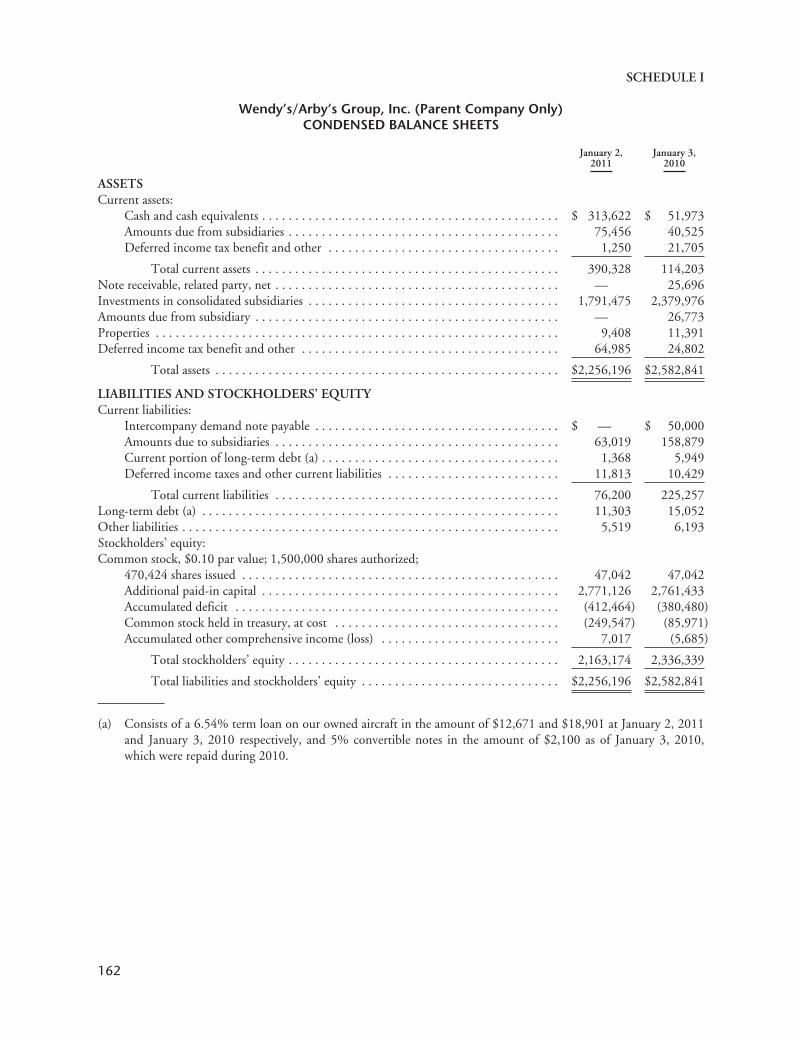
SCHEDULE I
Wendy’s/Arby’s Group, Inc. (Parent Company Only)CONDENSED BALANCE SHEETS
January 2,2011
January 3,2010
ASSETSCurrent assets:
Cash and cash equivalents . . . . . . . . . . . . . . . . . . . . . . . . . . . . . . . . . . . . . . . . . . . . . $ 313,622 $ 51,973Amounts due from subsidiaries . . . . . . . . . . . . . . . . . . . . . . . . . . . . . . . . . . . . . . . . . 75,456 40,525Deferred income tax benefit and other . . . . . . . . . . . . . . . . . . . . . . . . . . . . . . . . . . . 1,250 21,705
Total current assets . . . . . . . . . . . . . . . . . . . . . . . . . . . . . . . . . . . . . . . . . . . . . . 390,328 114,203Note receivable, related party, net . . . . . . . . . . . . . . . . . . . . . . . . . . . . . . . . . . . . . . . . . . . — 25,696Investments in consolidated subsidiaries . . . . . . . . . . . . . . . . . . . . . . . . . . . . . . . . . . . . . . 1,791,475 2,379,976Amounts due from subsidiary . . . . . . . . . . . . . . . . . . . . . . . . . . . . . . . . . . . . . . . . . . . . . . — 26,773Properties . . . . . . . . . . . . . . . . . . . . . . . . . . . . . . . . . . . . . . . . . . . . . . . . . . . . . . . . . . . . . 9,408 11,391Deferred income tax benefit and other . . . . . . . . . . . . . . . . . . . . . . . . . . . . . . . . . . . . . . . 64,985 24,802
Total assets . . . . . . . . . . . . . . . . . . . . . . . . . . . . . . . . . . . . . . . . . . . . . . . . . . . . $2,256,196 $2,582,841
LIABILITIES AND STOCKHOLDERS’ EQUITYCurrent liabilities:
Intercompany demand note payable . . . . . . . . . . . . . . . . . . . . . . . . . . . . . . . . . . . . . $ — $ 50,000Amounts due to subsidiaries . . . . . . . . . . . . . . . . . . . . . . . . . . . . . . . . . . . . . . . . . . . 63,019 158,879Current portion of long-term debt (a) . . . . . . . . . . . . . . . . . . . . . . . . . . . . . . . . . . . . 1,368 5,949Deferred income taxes and other current liabilities . . . . . . . . . . . . . . . . . . . . . . . . . . 11,813 10,429
Total current liabilities . . . . . . . . . . . . . . . . . . . . . . . . . . . . . . . . . . . . . . . . . . . 76,200 225,257Long-term debt (a) . . . . . . . . . . . . . . . . . . . . . . . . . . . . . . . . . . . . . . . . . . . . . . . . . . . . . . 11,303 15,052Other liabilities . . . . . . . . . . . . . . . . . . . . . . . . . . . . . . . . . . . . . . . . . . . . . . . . . . . . . . . . . 5,519 6,193Stockholders’ equity:Common stock, $0.10 par value; 1,500,000 shares authorized;
470,424 shares issued . . . . . . . . . . . . . . . . . . . . . . . . . . . . . . . . . . . . . . . . . . . . . . . . 47,042 47,042Additional paid-in capital . . . . . . . . . . . . . . . . . . . . . . . . . . . . . . . . . . . . . . . . . . . . . 2,771,126 2,761,433Accumulated deficit . . . . . . . . . . . . . . . . . . . . . . . . . . . . . . . . . . . . . . . . . . . . . . . . . (412,464) (380,480)Common stock held in treasury, at cost . . . . . . . . . . . . . . . . . . . . . . . . . . . . . . . . . . (249,547) (85,971)Accumulated other comprehensive income (loss) . . . . . . . . . . . . . . . . . . . . . . . . . . . 7,017 (5,685)
Total stockholders’ equity . . . . . . . . . . . . . . . . . . . . . . . . . . . . . . . . . . . . . . . . . 2,163,174 2,336,339
Total liabilities and stockholders’ equity . . . . . . . . . . . . . . . . . . . . . . . . . . . . . . $2,256,196 $2,582,841
(a) Consists of a 6.54% term loan on our owned aircraft in the amount of $12,671 and $18,901 at January 2, 2011and January 3, 2010 respectively, and 5% convertible notes in the amount of $2,100 as of January 3, 2010,which were repaid during 2010.
162

SCHEDULE I (Continued)
Wendy’s/Arby’s Group, Inc. (Parent Company Only)CONDENSED STATEMENTS OF OPERATIONS
(In Thousands)
Year Ended
January 2,2011
January 3,2010
December 28,2008
Income:Equity in (loss) income from continuing operations of subsidiaries . . . . . . . . $(2,175) $ 8,970 $(451,158)Investment income (loss) . . . . . . . . . . . . . . . . . . . . . . . . . . . . . . . . . . . . . . . 4,913 61 (21,565)
(2,738) 9,031 (472,723)
Costs and expenses:General and administrative . . . . . . . . . . . . . . . . . . . . . . . . . . . . . . . . . . . . . . 8,087 11,568 38,674Depreciation and amortization . . . . . . . . . . . . . . . . . . . . . . . . . . . . . . . . . . . 1,863 1,745 2,212Impairment of long-lived assets . . . . . . . . . . . . . . . . . . . . . . . . . . . . . . . . . . . — — 2,671Facilities relocation and restructuring . . . . . . . . . . . . . . . . . . . . . . . . . . . . . . — 3,008 692Intercompany interest expense . . . . . . . . . . . . . . . . . . . . . . . . . . . . . . . . . . . — 420 1,392Other (income) expense, net . . . . . . . . . . . . . . . . . . . . . . . . . . . . . . . . . . . . . (517) (1,141) 1,789
(9,433) 15,600 47,430
Loss from continuing operations before benefit from income taxes . . . . (6,695) (6,569) (520,153)Benefit from income taxes . . . . . . . . . . . . . . . . . . . . . . . . . . . . . . . . . . . . . . . . . . 2,370 10,085 38,195
(Loss) income from continuing operations . . . . . . . . . . . . . . . . . . . . . . (4,325) 3,516 (481,958)Equity in income from discontinued operations of subsidiaries . . . . . . . . . . . . . . . — 1,546 2,217
Net (loss) income . . . . . . . . . . . . . . . . . . . . . . . . . . . . . . . . . . . . . . . . . $(4,325) $ 5,062 $(479,741)
163

SCHEDULE I (Continued)
Wendy’s/Arby’s Group, Inc. (Parent Company Only)CONDENSED STATEMENTS OF CASH FLOWS
Year Ended
January 2,2011
January 3,2010
December 28,2008
Cash flows from continuing operating activities:Net (loss) income . . . . . . . . . . . . . . . . . . . . . . . . . . . . . . . . . . . . . . . . . . . . $ (4,325) $ 5,062 $(479,741)Adjustments to reconcile net (loss) income to net cash provided by (used
in) continuing operating activities:Dividends from subsidiaries . . . . . . . . . . . . . . . . . . . . . . . . . . . . . . . . 443,700 115,000 —Equity in loss (income) from continuing operations of subsidiaries . . . 2,175 (8,970) 451,158Other operating transactions with Wendy’s/Arby’s Restaurants,
LLC . . . . . . . . . . . . . . . . . . . . . . . . . . . . . . . . . . . . . . . . . . . . . . . . 8,032 (14,114) —Tax sharing payments received from subsidiaries . . . . . . . . . . . . . . . . — 10,417 17,000Depreciation and amortization . . . . . . . . . . . . . . . . . . . . . . . . . . . . . . 1,863 1,745 2,212Share-based compensation provision . . . . . . . . . . . . . . . . . . . . . . . . . . 914 1,555 358Write-off and amortization of deferred financing costs . . . . . . . . . . . . 16 25 5,132Cancellation of intercompany debts, net . . . . . . . . . . . . . . . . . . . . . . . (23,212) — —Operating investment adjustments, net (see below) . . . . . . . . . . . . . . (4,909) — 22,838Deferred income tax benefit, net . . . . . . . . . . . . . . . . . . . . . . . . . . . . . (4,027) 67,241 (21,359)Tax sharing receivable from subsidiaries, net . . . . . . . . . . . . . . . . . . . . (1,052) (65,366) —Equity in income from discontinued operations of subsidiaries . . . . . . — (1,546) (2,217)Impairment of long-lived assets . . . . . . . . . . . . . . . . . . . . . . . . . . . . . . — — 2,671Other, net . . . . . . . . . . . . . . . . . . . . . . . . . . . . . . . . . . . . . . . . . . . . . . (8) (2,200) (5,772)Changes in assets and liabilities:
Other current assets . . . . . . . . . . . . . . . . . . . . . . . . . . . . . . . . . . 231 1,467 797Other current liabilities . . . . . . . . . . . . . . . . . . . . . . . . . . . . . . . . (4,033) (5,381) (20,355)
Net cash provided by (used in) continuing operatingactivities . . . . . . . . . . . . . . . . . . . . . . . . . . . . . . . . . . . . . 438,577 104,935 (27,278)
Cash flows from continuing investing activities:Net repayments from subsidiaries . . . . . . . . . . . . . . . . . . . . . . . . . . . . . . . . 987 31,901 10,577Investment activities (see below) . . . . . . . . . . . . . . . . . . . . . . . . . . . . . . . . . 30,752 — —Cost of merger with Wendy’s . . . . . . . . . . . . . . . . . . . . . . . . . . . . . . . . . . . — (608) (18,403)Capital expenditures . . . . . . . . . . . . . . . . . . . . . . . . . . . . . . . . . . . . . . . . . . — — (1,065)Other, net . . . . . . . . . . . . . . . . . . . . . . . . . . . . . . . . . . . . . . . . . . . . . . . . . . 205 165 884
Net cash provided by (used in) continuing investingactivities . . . . . . . . . . . . . . . . . . . . . . . . . . . . . . . . . . . . . 31,944 31,458 (8,007)
Cash flows from continuing financing activities:Repurchases of common stock . . . . . . . . . . . . . . . . . . . . . . . . . . . . . . . . . . (173,537) (72,927) —Dividends paid . . . . . . . . . . . . . . . . . . . . . . . . . . . . . . . . . . . . . . . . . . . . . . (27,621) (27,976) (30,538)Repayments of long-term debt . . . . . . . . . . . . . . . . . . . . . . . . . . . . . . . . . . (8,330) (889) (2,361)Proceeds from long-term debt . . . . . . . . . . . . . . . . . . . . . . . . . . . . . . . . . . . — — 20,000Advances from Wendy’s/Arby’s Restaurants, LLC . . . . . . . . . . . . . . . . . . . — — 155,000Capital contribution to Wendy’s/Arby’s Restaurants, LLC . . . . . . . . . . . . . — — (150,177)Proceeds from intercompany loan . . . . . . . . . . . . . . . . . . . . . . . . . . . . . . . . — — 47,000Other . . . . . . . . . . . . . . . . . . . . . . . . . . . . . . . . . . . . . . . . . . . . . . . . . . . . . 616 (5,918) (152)
Net cash (used in) provided by continuing financingactivities . . . . . . . . . . . . . . . . . . . . . . . . . . . . . . . . . . . . . (208,872) (107,710) 38,772
Net cash provided by continuing operations . . . . . . . . . . . . . . . . . . . . . . . . . . . . 261,649 28,683 3,487Net cash used in operating activities of discontinued operations . . . . . . . . . . . . . — (3,570) (1,318)
Net increase in cash and cash equivalents . . . . . . . . . . . . . . . . . . . . . . . . . . . . . . 261,649 25,113 2,169Cash and cash equivalents at beginning of year . . . . . . . . . . . . . . . . . . . . . . . . . . 51,973 26,860 24,691
Cash and cash equivalents at end of year . . . . . . . . . . . . . . . . . . . . . . . . . . . . . . . $ 313,622 $ 51,973 $ 26,860
164

SCHEDULE I (Continued)
Wendy’s/Arby’s Group, Inc. (Parent Company Only)CONDENSED STATEMENTS OF CASH FLOWS – (Continued)
Year Ended
January 2,2011
January 3,2010
December 28,2008
Detail of cash flows related to investments:Operating investment adjustments:
Income on collection of notes receivable . . . . . . . . . . . . . . . . . . . . . . . . $ (4,909) $— $ —Net recognized losses, including other than temporary losses . . . . . . . . — — 22,838
$ (4,909) $— $23,838
Investing investment activities, net:Proceeds from repayment of notes receivable . . . . . . . . . . . . . . . . . . . . $30,752 $— $ —
$30,752 $— $ —
165

[THIS PAGE INTENTIONALLY LEFT BLANK]
EXHIBIT 4.6
SUPPLEMENTAL INDENTURE
dated as of December 3, 2010
among
Wendy’s/Arby’s Restaurants, LLC,
The Guarantor Party Hereto
and
U.S. Bank National Association,as Trustee
10.00%Senior Notes due
2016

THIS SUPPLEMENTAL INDENTURE (this “Supplemental Indenture”), entered into as of December 3,2010, among Wendy’s/Arby’s Restaurants, LLC, a Delaware limited liability company (the “Company”), Wendy’sRestaurants of New York, LLC, a Delaware limited liability company (the “Undersigned”), and U.S. Bank NationalAssociation, as trustee (the “Trustee”).
RECITALS
WHEREAS, the Company, the Guarantors party thereto and the Trustee entered into the Indenture, dated asof June 23, 2009, as supplemented by the Supplemental Indenture, dated as of July 8, 2009, and the SupplementalIndenture, dated as of December 21, 2009 (as so supplemented, the “Indenture”), relating to the Company’s 10.00%Senior Notes due 2016 (the “Notes”);
WHEREAS, as a condition to the Trustee entering into the Indenture and the purchase of the Notes by theHolders, the Company agreed pursuant to the Indenture to cause any newly acquired or created Restricted Subsidiary(other than, except in certain circumstances, a Regulated Subsidiary) that guarantees or is a borrower under the CreditAgreement to provide Guarantees in certain circumstances.
AGREEMENT
NOW, THEREFORE, in consideration of the premises and mutual covenants herein contained and intendingto be legally bound, the parties to this Supplemental Indenture hereby agree as follows:
Section 1. Capitalized terms used herein and not otherwise defined herein are used as defined in the Indenture.
Section 2. The Undersigned, by its execution of this Supplemental Indenture, agrees to be a Guarantor underthe Indenture and to be bound by the terms of the Indenture applicable to Guarantors, including, but not limited to,Article 10 thereof.
Section 3. This Supplemental Indenture shall be governed by and construed in accordance with the laws of theState of New York.
Section 4. This Supplemental Indenture may be signed in various counterparts which together will constituteone and the same instrument.
Section 5. This Supplemental Indenture is an amendment supplemental to the Indenture and the Indentureand this Supplemental Indenture will henceforth be read together.

IN WITNESS WHEREOF, the parties hereto have caused this Supplemental Indenture to be duly executed asof the date first above written.
Wendy’s/Arby’s Restaurants, LLC, as IssuerBy: /s/ Daniel T. Collins
Name: Daniel T. CollinsTitle: Senior Vice President,
Treasurer & Assistant Secretary
Wendy’s Restaurants of New York, LLC, as a GuarantorBy: /s/ Daniel T. Collins
Name: Daniel T. CollinsTitle: Senior Vice President,
Treasurer & Assistant Secretary
U.S. Bank National Association, as TrusteeBy: /s/ Jack Ellerin
Name: Jack EllerinTitle: Vice President
[Signature Page to Supplemental Indenture]

[THIS PAGE INTENTIONALLY LEFT BLANK]

EXHIBIT 21.1
WENDY’S/ARBY’S GROUP, INC.LIST OF SUBSIDIARIES AS OF
January 2, 2011
SubsidiaryState or Jurisdiction
Under Which Organized
Wendy’s/Arby’s Restaurants, LLC (formerly Wendy’s International Holdings, LLC) DelawareArby’s Restaurant Group, Inc. Delaware
RTM Acquisition Company, LLC GeorgiaWendy’s/Arby’s Support Center, LLC DelawareSybra, LLC Michigan
RTM Partners, LLC GeorgiaRTM Development Company, LLC DelawareRTM Operating Company, LLC Delaware
RTM Operating Company of Canada, Inc. OntarioArby’s Restaurant, LLC Delaware
RTM, LLC GeorgiaRTMSC, LLC South Carolina
RTM Savannah, LLC GeorgiaRTM Georgia, LLC GeorgiaFranchise Associates, LLC MinnesotaRTM Alabama, LLC AlabamaRTM West, LLC CaliforniaRTM Sea-Tac, LLC WashingtonRTM Mid-America, LLC IndianaRTM Indianapolis, LLC OhioRTM Gulf Coast, LLC AlabamaRTM Portland, LLC OregonARG Resources, LLC Georgia
ARG Services, Inc. ColoradoArby’s, LLC Delaware
Arby’s of Canada, Inc. OntarioArby’s IP Holder Trust Delaware
Wendy’s International, Inc. OhioWendy’s/Arby’s International, Inc. Delaware
Wendy’s/Arby’s International Services, Inc. DelawareWendy’s Restaurants (Asia) Limited Hong KongWendy’s Old Fashioned Hamburger Restaurants Pty. Ltd. AustraliaRestaurant Finance Corporation Ohio
Café Express, LLC DelawareBDJ 71112, LLC OhioWendy Restaurant, Inc. DelawareWendy’s Old Fashioned Hamburgers of New York, Inc. Ohio
Wendy’s Restaurants of New York, LLC DelawareOldemark LLC VermontWendy’s of Denver, Inc. ColoradoThe New Bakery Co. of Ohio, Inc. OhioWendy’s of N.E. Florida, Inc. FloridaWendy’s Restaurants of Canada Inc. Ontario
Wendy’s Canadian Advertising Program, Inc. OntarioTIMWEN Partnership (1) Ontario
The Wendy’s National Advertising Program, Inc. Ohio256 Gift Card Inc. Colorado

SubsidiaryState or Jurisdiction
Under Which Organized
SEPSCO, LLC DelawareHome Furnishing Acquisition Corporation DelawareTriarc Acquisition, LLC Delaware
Jurl Holdings, LLC (2) DelawareRCAC, LLC DelawareMadison West Associates Corp. Delaware
280 BT Holdings LLC (3) New YorkCitrus Acquisition Corporation Florida
Adams Packing Association, Inc. DelawareTXL Corp. South Carolina
(1) 50% owned by Wendy’s Restaurants of Canada Inc.
(2) 99.7% capital interest owned by Wendy’s/Arby’s Group, Inc. (the “Company”). Certain members ofmanagement of the Company have been granted an equity interest in Jur Holdings, LLC (“Jurl”) representing inthe aggregate a 0.30% capital interest in Jurl and up to a 15% profits interest in Jurl’s interest in Jurlique.
(3) 80.1% owned by Madison West Associates Corp. (“Madison West”), 11.3% owned by affiliates of the Companyand 8.6% owned by unaffiliated third parties.
EXHIBIT 23.1
CONSENT OF INDEPENDENT REGISTERED PUBLIC ACCOUNTING FIRM
We consent to the incorporation by reference in Registration Statement Nos. 333-50051, 333-82069,333-97569, 333-155273 and 333-167170 on Form S-8 and Registration Statement No. 333-155272 on Form S-3 ofWendy’s/Arby’s Group, Inc. (the “Company”) of our reports dated March 2, 2011, relating to the consolidatedfinancial statements and financial statement schedule of Wendy’s/Arby’s Group, Inc. and the effectiveness of theCompany’s internal control over financial reporting appearing in this Annual Report on Form 10-K of Wendy’s/Arby’s Group, Inc. for the year ended January 2, 2011.
/s/ Deloitte & Touche LLPAtlanta, GeorgiaMarch 2, 2011

EXHIBIT 23.2
CONSENT OF INDEPENDENT REGISTERED PUBLIC ACCOUNTING FIRM
We hereby consent to the incorporation by reference in the Registration Statement Nos. 333-50051,333-82069, 333-97569, 333-155273 and 333-167170 on Form S-8 and Registration Statement No. 333-155272 onForm S-3 of Wendy’s/Arby’s Group, Inc. of our report dated March 3, 2011 relating to the financial statements ofTIMWEN Partnership, which appears in this Annual Report on Form 10-K of Wendy’s/Arby’s Group, Inc.
/s/ PricewaterhouseCoopers LLPChartered Accountants, Licensed Public AccountantsToronto, CanadaMarch 3, 2011
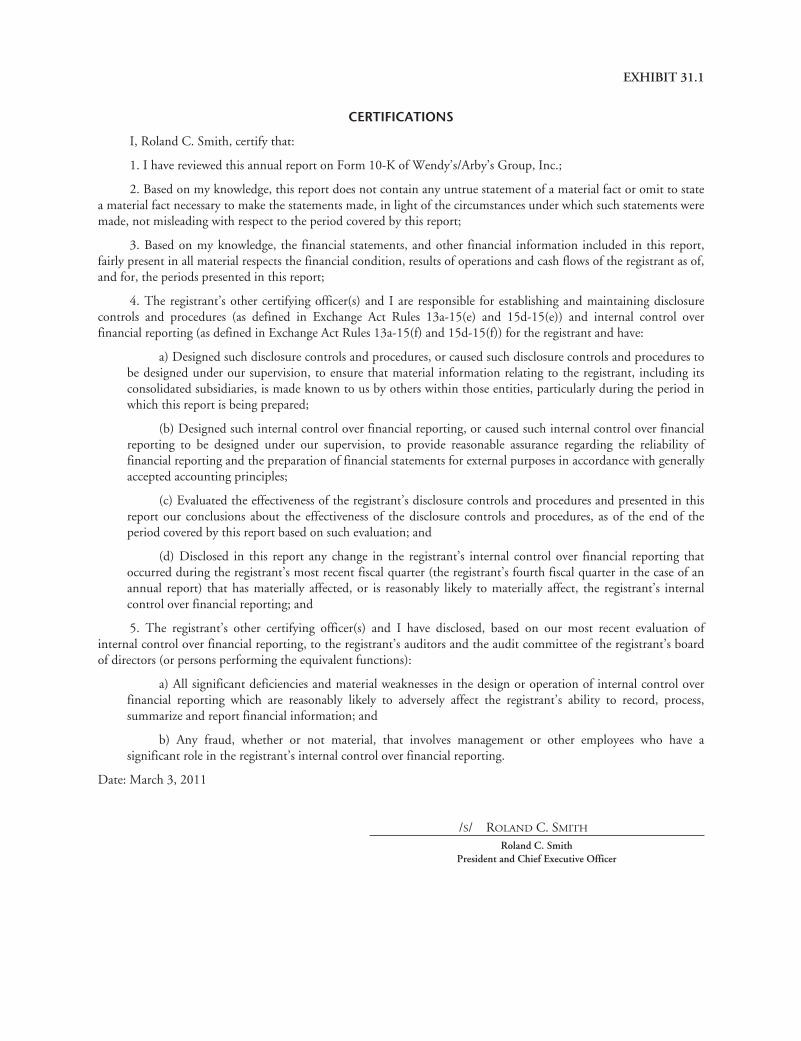
EXHIBIT 31.1
CERTIFICATIONS
I, Roland C. Smith, certify that:
1. I have reviewed this annual report on Form 10-K of Wendy’s/Arby’s Group, Inc.;
2. Based on my knowledge, this report does not contain any untrue statement of a material fact or omit to statea material fact necessary to make the statements made, in light of the circumstances under which such statements weremade, not misleading with respect to the period covered by this report;
3. Based on my knowledge, the financial statements, and other financial information included in this report,fairly present in all material respects the financial condition, results of operations and cash flows of the registrant as of,and for, the periods presented in this report;
4. The registrant’s other certifying officer(s) and I are responsible for establishing and maintaining disclosurecontrols and procedures (as defined in Exchange Act Rules 13a-15(e) and 15d-15(e)) and internal control overfinancial reporting (as defined in Exchange Act Rules 13a-15(f) and 15d-15(f)) for the registrant and have:
a) Designed such disclosure controls and procedures, or caused such disclosure controls and procedures tobe designed under our supervision, to ensure that material information relating to the registrant, including itsconsolidated subsidiaries, is made known to us by others within those entities, particularly during the period inwhich this report is being prepared;
(b) Designed such internal control over financial reporting, or caused such internal control over financialreporting to be designed under our supervision, to provide reasonable assurance regarding the reliability offinancial reporting and the preparation of financial statements for external purposes in accordance with generallyaccepted accounting principles;
(c) Evaluated the effectiveness of the registrant’s disclosure controls and procedures and presented in thisreport our conclusions about the effectiveness of the disclosure controls and procedures, as of the end of theperiod covered by this report based on such evaluation; and
(d) Disclosed in this report any change in the registrant’s internal control over financial reporting thatoccurred during the registrant’s most recent fiscal quarter (the registrant’s fourth fiscal quarter in the case of anannual report) that has materially affected, or is reasonably likely to materially affect, the registrant’s internalcontrol over financial reporting; and
5. The registrant’s other certifying officer(s) and I have disclosed, based on our most recent evaluation ofinternal control over financial reporting, to the registrant’s auditors and the audit committee of the registrant’s boardof directors (or persons performing the equivalent functions):
a) All significant deficiencies and material weaknesses in the design or operation of internal control overfinancial reporting which are reasonably likely to adversely affect the registrant’s ability to record, process,summarize and report financial information; and
b) Any fraud, whether or not material, that involves management or other employees who have asignificant role in the registrant’s internal control over financial reporting.
Date: March 3, 2011
/S/ ROLAND C. SMITH
Roland C. SmithPresident and Chief Executive Officer
EXHIBIT 31.2
CERTIFICATIONS
I, Stephen E. Hare, certify that:
1. I have reviewed this annual report on Form 10-K of Wendy’s/Arby’s Group, Inc.;
2. Based on my knowledge, this report does not contain any untrue statement of a material fact or omit to statea material fact necessary to make the statements made, in light of the circumstances under which such statements weremade, not misleading with respect to the period covered by this report;
3. Based on my knowledge, the financial statements, and other financial information included in this report,fairly present in all material respects the financial condition, results of operations and cash flows of the registrant as of,and for, the periods presented in this report;
4. The registrant’s other certifying officer(s) and I are responsible for establishing and maintaining disclosurecontrols and procedures (as defined in Exchange Act Rules 13a-15(e) and 15d-15(e)) and internal control overfinancial reporting (as defined in Exchange Act Rules 13a-15(f) and 15d-15(f)) for the registrant and have:
a) Designed such disclosure controls and procedures, or caused such disclosure controls and procedures tobe designed under our supervision, to ensure that material information relating to the registrant, including itsconsolidated subsidiaries, is made known to us by others within those entities, particularly during the period inwhich this report is being prepared;
(b) Designed such internal control over financial reporting, or caused such internal control over financialreporting to be designed under our supervision, to provide reasonable assurance regarding the reliability offinancial reporting and the preparation of financial statements for external purposes in accordance with generallyaccepted accounting principles;
(c) Evaluated the effectiveness of the registrant’s disclosure controls and procedures and presented in thisreport our conclusions about the effectiveness of the disclosure controls and procedures, as of the end of theperiod covered by this report based on such evaluation; and
(d) Disclosed in this report any change in the registrant’s internal control over financial reporting thatoccurred during the registrant’s most recent fiscal quarter (the registrant’s fourth fiscal quarter in the case of anannual report) that has materially affected, or is reasonably likely to materially affect, the registrant’s internalcontrol over financial reporting; and
5. The registrant’s other certifying officer(s) and I have disclosed, based on our most recent evaluation ofinternal control over financial reporting, to the registrant’s auditors and the audit committee of the registrant’s boardof directors (or persons performing the equivalent functions):
a) All significant deficiencies and material weaknesses in the design or operation of internal control overfinancial reporting which are reasonably likely to adversely affect the registrant’s ability to record, process,summarize and report financial information; and
b) Any fraud, whether or not material, that involves management or other employees who have asignificant role in the registrant’s internal control over financial reporting.
Date: March 3, 2011
/S/ STEPHEN E. HARE
Stephen E. HareSenior Vice President and
Chief Financial Officer
EXHIBIT 31.3
CERTIFICATIONS
I, Roland C. Smith, certify that:
1. I have reviewed this annual report on Form 10-K of Wendy’s/Arby’s Restaurants, LLC;
2. Based on my knowledge, this report does not contain any untrue statement of a material fact or omit to statea material fact necessary to make the statements made, in light of the circumstances under which such statements weremade, not misleading with respect to the period covered by this report;
3. Based on my knowledge, the financial statements, and other financial information included in this report,fairly present in all material respects the financial condition, results of operations and cash flows of the registrant as of,and for, the periods presented in this report;
4. The registrant’s other certifying officer(s) and I are responsible for establishing and maintaining disclosurecontrols and procedures (as defined in Exchange Act Rules 13a-15(e) and 15d-15(e)) and internal control overfinancial reporting (as defined in Exchange Act Rules 13a-15(f) and 15d-15(f)) for the registrant and have:
a) Designed such disclosure controls and procedures, or caused such disclosure controls and procedures tobe designed under our supervision, to ensure that material information relating to the registrant, including itsconsolidated subsidiaries, is made known to us by others within those entities, particularly during the period inwhich this report is being prepared;
(b) Designed such internal control over financial reporting, or caused such internal control over financialreporting to be designed under our supervision, to provide reasonable assurance regarding the reliability offinancial reporting and the preparation of financial statements for external purposes in accordance with generallyaccepted accounting principles;
(c) Evaluated the effectiveness of the registrant’s disclosure controls and procedures and presented in thisreport our conclusions about the effectiveness of the disclosure controls and procedures, as of the end of theperiod covered by this report based on such evaluation; and
(d) Disclosed in this report any change in the registrant’s internal control over financial reporting thatoccurred during the registrant’s most recent fiscal quarter (the registrant’s fourth fiscal quarter in the case of anannual report) that has materially affected, or is reasonably likely to materially affect, the registrant’s internalcontrol over financial reporting; and
5. The registrant’s other certifying officer(s) and I have disclosed, based on our most recent evaluation ofinternal control over financial reporting, to the registrant’s auditors and the audit committee of the registrant’s boardof directors (or persons performing the equivalent functions):
a) All significant deficiencies and material weaknesses in the design or operation of internal control overfinancial reporting which are reasonably likely to adversely affect the registrant’s ability to record, process,summarize and report financial information; and
b) Any fraud, whether or not material, that involves management or other employees who have asignificant role in the registrant’s internal control over financial reporting.
Date: March 3, 2011
/S/ ROLAND C. SMITH
Roland C. SmithPresident and Chief Executive Officer

EXHIBIT 31.4
CERTIFICATIONS
I, Stephen E. Hare, certify that:
1. I have reviewed this annual report on Form 10-K of Wendy’s/Arby’s Restaurants, LLC;
2. Based on my knowledge, this report does not contain any untrue statement of a material fact or omit to statea material fact necessary to make the statements made, in light of the circumstances under which such statements weremade, not misleading with respect to the period covered by this report;
3. Based on my knowledge, the financial statements, and other financial information included in this report,fairly present in all material respects the financial condition, results of operations and cash flows of the registrant as of,and for, the periods presented in this report;
4. The registrant’s other certifying officer(s) and I are responsible for establishing and maintaining disclosurecontrols and procedures (as defined in Exchange Act Rules 13a-15(e) and 15d-15(e)) and internal control overfinancial reporting (as defined in Exchange Act Rules 13a-15(f) and 15d-15(f)) for the registrant and have:
a) Designed such disclosure controls and procedures, or caused such disclosure controls and procedures tobe designed under our supervision, to ensure that material information relating to the registrant, including itsconsolidated subsidiaries, is made known to us by others within those entities, particularly during the period inwhich this report is being prepared;
(b) Designed such internal control over financial reporting, or caused such internal control over financialreporting to be designed under our supervision, to provide reasonable assurance regarding the reliability offinancial reporting and the preparation of financial statements for external purposes in accordance with generallyaccepted accounting principles;
(c) Evaluated the effectiveness of the registrant’s disclosure controls and procedures and presented in thisreport our conclusions about the effectiveness of the disclosure controls and procedures, as of the end of theperiod covered by this report based on such evaluation; and
(d) Disclosed in this report any change in the registrant’s internal control over financial reporting thatoccurred during the registrant’s most recent fiscal quarter (the registrant’s fourth fiscal quarter in the case of anannual report) that has materially affected, or is reasonably likely to materially affect, the registrant’s internalcontrol over financial reporting; and
5. The registrant’s other certifying officer(s) and I have disclosed, based on our most recent evaluation ofinternal control over financial reporting, to the registrant’s auditors and the audit committee of the registrant’s boardof directors (or persons performing the equivalent functions):
a) All significant deficiencies and material weaknesses in the design or operation of internal control overfinancial reporting which are reasonably likely to adversely affect the registrant’s ability to record, process,summarize and report financial information; and
b) Any fraud, whether or not material, that involves management or other employees who have asignificant role in the registrant’s internal control over financial reporting.
Date: March 3, 2011
/S/ STEPHEN E. HARE
Stephen E. HareSenior Vice President and Chief Financial Officer
EXHIBIT 32.1
Certification Pursuant to18 U.S.C. Section 1350
As Adopted Pursuant toSection 906 of the Sarbanes-Oxley Act of 2002
Pursuant to Section 906 of the Sarbanes-Oxley Act of 2002 (subsections (a) and (b) of section 1350, chapter 63of title 18, United States Code), each of the undersigned officers of Wendy’s/Arby’s Group, Inc., a Delawarecorporation (the “Company”), does hereby certify, to the best of such officer’s knowledge, that:
The Annual Report on Form 10-K for the year ended January 2, 2011 (the “Form 10-K”) of the Companyfully complies with the requirements of section 13(a) or 15(d) of the Securities Exchange Act of 1934 andinformation contained in the Form 10-K fairly presents, in all material respects, the financial condition and results ofoperations of the Company.
Date: March 3, 2011
/S/ ROLAND C. SMITH
Roland C. SmithPresident and Chief Executive Officer
Date: March 3, 2011
/S/ STEPHEN E. HARE
Stephen E. HareSenior Vice President and Chief Financial Officer

[THIS PAGE INTENTIONALLY LEFT BLANK]
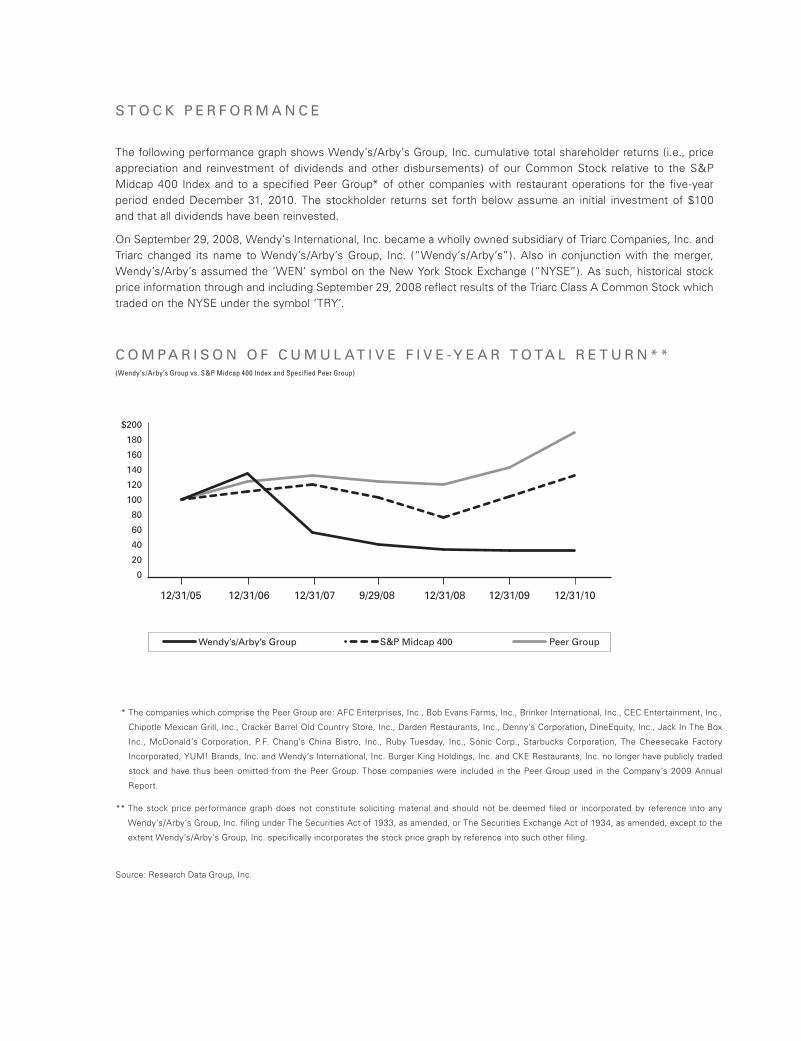
The following performance graph shows Wendy’s/Arby’s Group, Inc. cumulative total shareholder returns (i.e., price appreciation and reinvestment of dividends and other disbursements) of our Common Stock relative to the S&P Midcap 400 Index and to a specified Peer Group* of other companies with restaurant operations for the five-year period ended December 31, 2010. The stockholder returns set forth below assume an initial investment of $100 and that all dividends have been reinvested.
On September 29, 2008, Wendy’s International, Inc. became a wholly owned subsidiary of Triarc Companies, Inc. and Triarc changed its name to Wendy’s/Arby’s Group, Inc. (“Wendy’s/Arby’s”). Also in conjunction with the merger, Wendy’s/Arby’s assumed the ‘WEN’ symbol on the New York Stock Exchange (“NYSE”). As such, historical stock price information through and including September 29, 2008 reflect results of the Triarc Class A Common Stock which traded on the NYSE under the symbol ‘TRY’.
* The companies which comprise the Peer Group are: AFC Enterprises, Inc., Bob Evans Farms, Inc., Brinker International, Inc., CEC Entertainment, Inc.,
Chipotle Mexican Grill, Inc., Cracker Barrel Old Country Store, Inc., Darden Restaurants, Inc., Denny’s Corporation, DineEquity, Inc., Jack In The Box
Inc., McDonald’s Corporation, P.F. Chang’s China Bistro, Inc., Ruby Tuesday, Inc., Sonic Corp., Starbucks Corporation, The Cheesecake Factory
Incorporated, YUM! Brands, Inc. and Wendy’s International, Inc. Burger King Holdings, Inc. and CKE Restaurants, Inc. no longer have publicly traded
stock and have thus been omitted from the Peer Group. Those companies were included in the Peer Group used in the Company’s 2009 Annual
Report.
** The stock price performance graph does not constitute soliciting material and should not be deemed filed or incorporated by reference into any
Wendy’s/Arby’s Group, Inc. filing under The Securities Act of 1933, as amended, or The Securities Exchange Act of 1934, as amended, except to the
extent Wendy’s/Arby’s Group, Inc. specifically incorporates the stock price graph by reference into such other filing.
Source: Research Data Group, Inc.
C O M P A R I S O N O F C U M U L AT I V E F I V E - Y E A R T O TA L R E T U R N * *(Wendy’s/Arby’s Group vs. S&P Midcap 400 Index and Specified Peer Group)
12/31/0612/31/05 12/31/07 9/29/08 12/31/08 12/31/09 12/31/10
Wendy’s/Arby’s Group S&P Midcap 400 Peer Group
0
20
40
60
80
100
120
140
160
180
$200
S T O C K P E R F O R M A N C E

[THIS PAGE INTENTIONALLY LEFT BLANK]
Board of Directors
Nelson Peltz 2,4,6
Chairman, Wendy’s/Arby’s Group, Inc.Chief Executive Officer and Founding Partner,Trian Fund Management, L.P.
Peter W. May 2,4,6
Vice Chairman, Wendy’s/Arby’s Group, Inc.President and Founding Partner, Trian Fund Management, L.P.
Clive Chajet 3,6,8
Chairman, Chajet Consultancy, L.L.C.
Edward P. GardenVice Chairman and Founding Partner,Trian Fund Management, L.P.
Janet Hill 3,8
Principal, Hill Family Advisors
Joseph A. Levato 1,3,4,5
Former Executive Vice President and Chief Financial Officer, Triarc Companies, Inc.
J. Randolph Lewis 5,7
Senior Vice President, Supply Chain and Logistics, Walgreen Co.
Peter H. Rothschild 1,7
Managing Member ofDaroth Capital, L.L.C.
David E. Schwab II 1,3,6,7,8
Senior Counsel, Cowan, Liebowitz & Latman, P.C.
Roland C. Smith 2,6
President and Chief Executive Officer,Wendy’s/Arby’s Group, Inc.
Raymond S. Troubh 1,7
Financial Consultant and Director of variouspublic companies
Jack G. Wasserman 1,3,5,8
Attorney-at-Law
Executive Officers
Roland C. SmithPresident and Chief Executive Officer
Stephen E. HareSenior Vice President and Chief Financial Officer
J. David KaramPresident, Wendy’s
Hala G. ModdelmogPresident, Arby’s
Darrell G. van LigtenPresident, International
John D. BarkerSenior Vice President andChief Communications Officer
Sharron L. BartonSenior Vice President andChief Administrative Officer
Steven B. GrahamSenior Vice President andChief Accounting Officer
Nils H. OkesonSenior Vice President,General Counsel and Secretary
NYSE and SEC Certifications
The Company has filed with the New York Stock Exchange (“NYSE”) the 2010 certifi-cation of its Chief Executive Officer required by Section 303A.12 of the NYSE Listed Company Manual confirming that the Company has complied with the NYSE corporate governance listing standards. Additionally, the certifications of the Company’s Chief Executive Officer and Chief Financial Officer required to be filed with the Securities and Exchange Commis-sion (“SEC”) pursuant to Section 302 of the Sarbanes-Oxley Act of 2002 are included as Exhibits to the Company’s Annual Report on Form 10-K for the fiscal year ended January 2, 2011, a copy of which (including the SEC certifications) is included herein.
Corporate Office
Wendy’s/Arby’s Group, Inc.1155 Perimeter Center WestAtlanta, GA 30338(678) 514-4500
www.wendysarbys.com
Stockholder Information
Transfer Agent and Registrar(change of address or registration, lost stock certificate and other account related matters)
American Stock Transfer & Trust Company59 Maiden LanePlaza LevelNew York, NY 10038Toll free: (877) 681-8121 or(718) 921-8200Fax: (718) 236-2641E-mail: [email protected]
Common Stock Listing
Independent Registered Public
Accounting Firm
Deloitte & Touche LLP191 Peachtree Street NEAtlanta, GA 30303
Investor Inquiries
Stockholders, securities analysts, investment managers and others seeking information about the Company may either go to the Company’s Web site, www.wendysarbys.com, or contact the Company directly as follows:
Analysts/Institutional Investors/
Stockholders
John D. BarkerChief Communications Officer(678) [email protected]
Kay L. SharptonVice President, Investor Relations(678) [email protected]
DIRECTORS, OFFICERS, CORPORATE INFORMATION
1 Member of Audit Committee2 Member of Capital and Investment Committee3 Member of Compensation Committee4 Member of Corporate Social Responsibility Committee5 Member of ERISA Committee6 Member of Executive Committee7 Member of Nominating and Corporate Governance Committee8 Member of Performance Compensation SubcommitteeA
nnua
l Re
po
rt D
esi
gn
by
Cur
ran
& C
onn
ors
, Inc
. / w
ww
.cur
ran
-co
nno
rs.c
om

© 2010 Oldemark LLC
www.DaveThomasFoundation.org www.ArbysFoundation.org
Our Commitment to Giving Back
Caring about our communities is important—and it’s the right thing to do. That’s why we focus our resources in two key areas:
Promoting foster care adoption
Expanding youth-mentoring opportunities
Social responsibility has been a key part of our heritage since the founding of both
Wendy’s and Arby’s more than 40 years ago. With the commitment of our employ-
ees, franchisees, suppliers, customers and our stockholders, we are actively
involved in supporting our signature programs through two primary foundations:
Dave Thomas Foundation for Adoption and Arby’s Foundation.
Wendy’s/Arby’s Group strives to deliver sustainable business results while making responsible choices for society and the environment. We are continuously improving our stewardship in five key areas: People, Quality Food, Community, Environmental Sustainability and Supply Chain Practices. To learn more about our Corporate Responsibility efforts, visit www.wendysarbys.com/responsibility.