unit 4: analytic epidemiology. unit 4 learning objectives: 1. understand hypothesis formulation in...
TRANSCRIPT
Unit 4:
Analytic Epidemiology
Unit 4 Learning Objectives:1. Understand hypothesis formulation in
epidemiologic studies.2. Understand and calculate measures of effect
(risk difference, risk ratio, rate ratio, odds ratio) used to evaluate epidemiologic hypotheses.
3. Understand statistical parameters used to evaluate epidemiologic hypotheses and results:
--- P-values--- Confidence intervals--- Type I and Type II error--- Power
Unit 4 Learning Objectives (cont.):
4. Recognize the primary study designs used to evaluate epidemiologic hypotheses:
--- Randomized trial
--- Prospective & retrospective cohort studies
--- Case-control study
--- Case-crossover study
--- Cross-sectional study
Assigned Readings:
Textbook (Gordis): Chapter 11
Rothman: Random error and the role of statistics. In Epidemiology: an Introduction, Chapter 6, pages 113-129.
Analytic Epidemiology
Study of the DETERMINANTS ofhealth-related events
Hypothesis Formulation
Scientific Method(not unique to epi)
--- Formulate a hypothesis
--- Test the hypothesis

Basic Strategy of Analytical Epi
1. Identify variables you are interested in:• Exposure• Outcome
2. Formulate a hypothesis
3. Compare the experience of two groups of subjects with respect to the exposure and outcome
Basic Strategy of Analytical Epi
Note: Assembling the study groups to compare, whether on the basis of exposure or disease status, is one of the most important elements of study design.
Ideally, we would like to know what happened to exposed individuals had they not been exposed, but this is “counterfactual” since, by definition, such individuals were exposed.
Hypothesis Formulation
The “Biostatistican’s” way
H0: “Null” hypothesis (assumed)H1: “Alternative” hypothesis
The “Epidemiologist’s” way
Direct risk estimate(e.g. best estimate of risk of diseaseassociated with the exposure).
Hypothesis Formulation
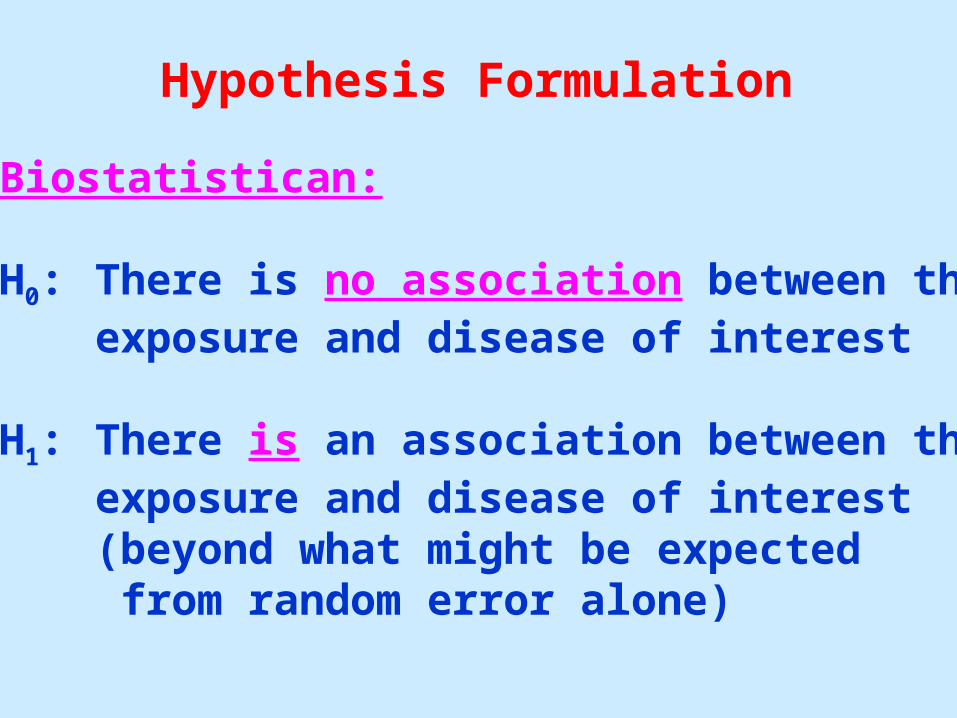
Biostatistican:
H0: There is no association between theexposure and disease of interest
H1: There is an association between theexposure and disease of interest(beyond what might be expected from random error alone)

Hypothesis Formulation
Epidemiologist:
What is the best estimate of the risk of disease in those who are exposed compared to those who are unexposed (i.e. exposed are at XX times higher risk of disease).
This moves away from the simple dichotomy of yes or no for an exposure/disease association – to the estimated magnitude of effect irrespective of whether it differs from the null hypothesis.
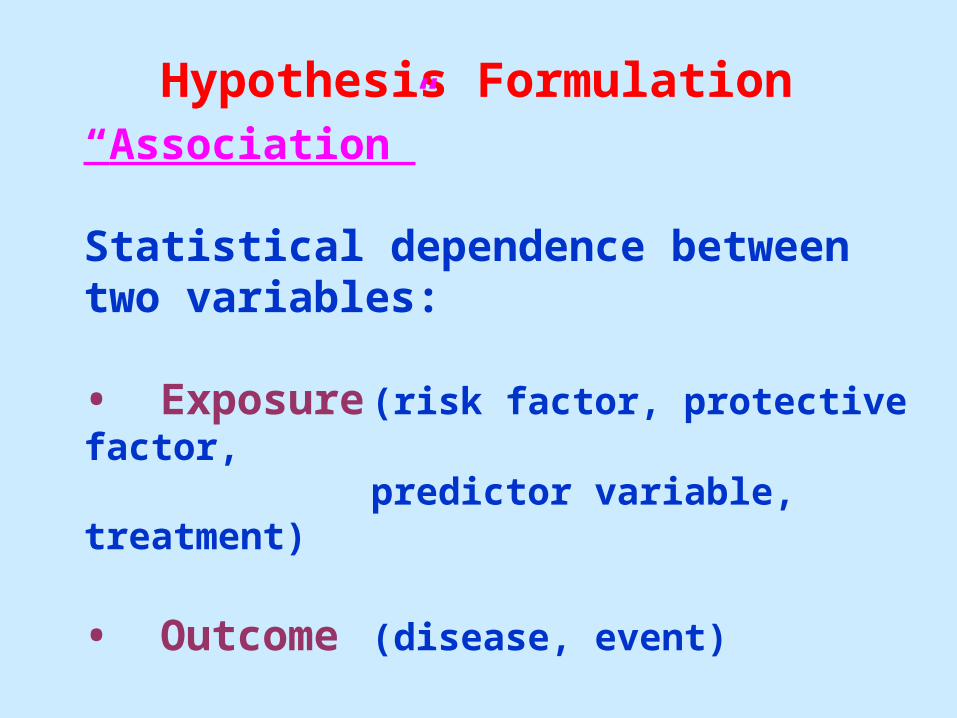
Hypothesis Formulation“Association”
Statistical dependence between two variables:
• Exposure (risk factor, protective factor,predictor variable, treatment)
• Outcome (disease, event)

Hypothesis Formulation
“Association”
The degree to which the rate of disease in persons with a specific exposure is either higher or lower than the rate of disease among those without that exposure.
Hypothesis Formulation
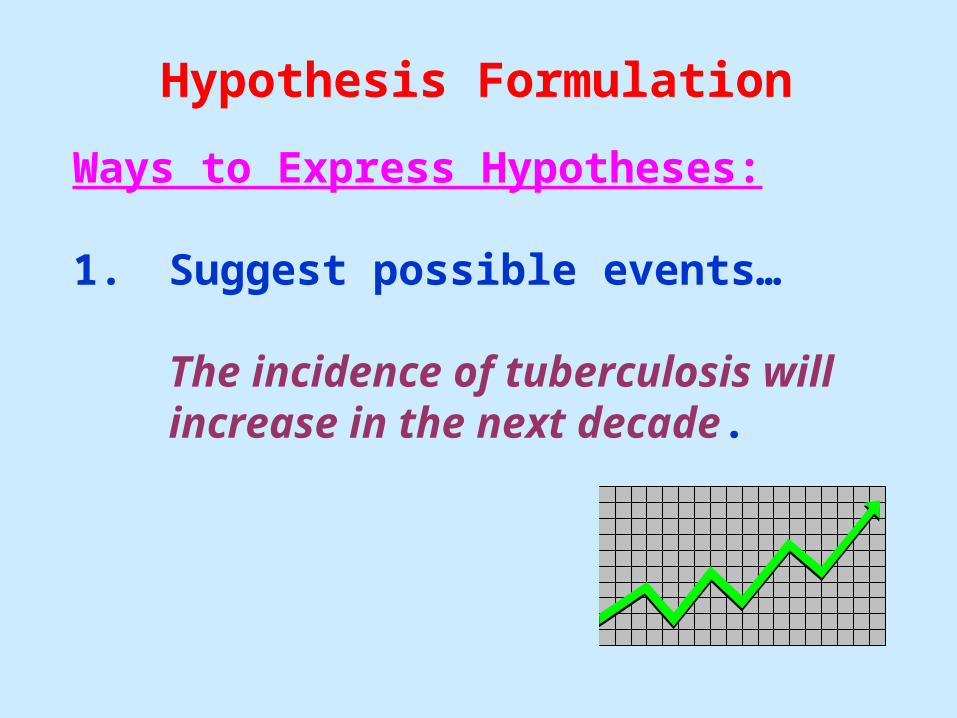
Ways to Express Hypotheses:
1. Suggest possible events…
The incidence of tuberculosis will increase in the next decade.
Hypothesis Formulation
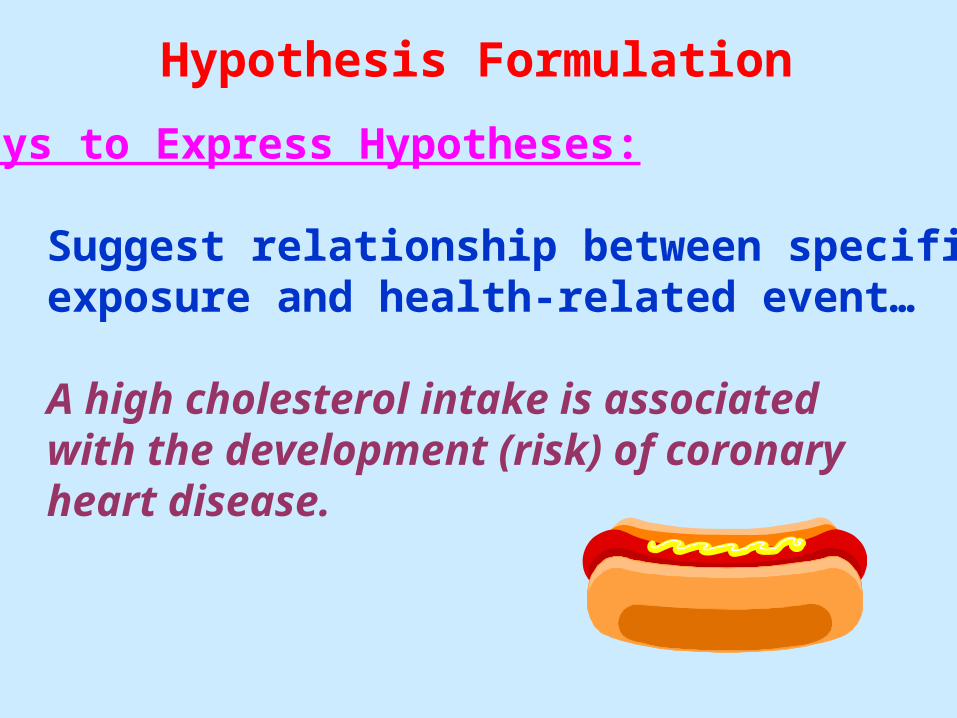
Ways to Express Hypotheses:
2. Suggest relationship between specificexposure and health-related event…
A high cholesterol intake is associatedwith the development (risk) of coronaryheart disease.
Hypothesis Formulation
Ways to Express Hypotheses:
3. Suggest cause-effect relationship….
Cigarette smoking is a cause of lung cancer
Hypothesis Formulation
Ways to Express Hypotheses:4. “One-sided” vs. “Two-sided”
One-sided example:Helicobacter pylori infection is associatedwith increased risk of stomach ulcer
Two-sided example:Weight-lifting is associated with risk oflower back injury
Hypothesis Formulation
Guidelines for Developing Hypotheses:
1. State the exposure to be measured as specifically as possible.
2. State the health outcome as specifically as possible.
Strive to explain the smallest amountof ignorance
Hypothesis Formulation
Example Hypotheses:
POOREating junk food is associated with the development of cancer.
GOODThe human papilloma virus (HPV) subtype 16 is associated with the development of cervical cancer.
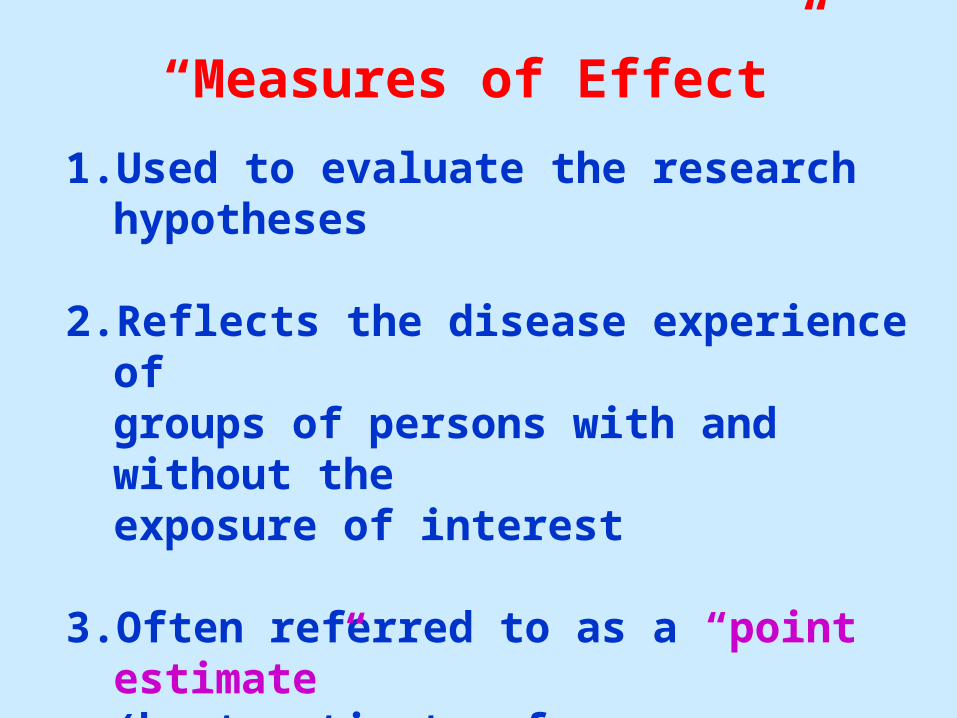
“Measures of Effect”
1. Used to evaluate the research hypotheses
2. Reflects the disease experience of groups of persons with and without theexposure of interest
3. Often referred to as a “point estimate”(best estimate of exposure/diseaserelationship between the two groups)
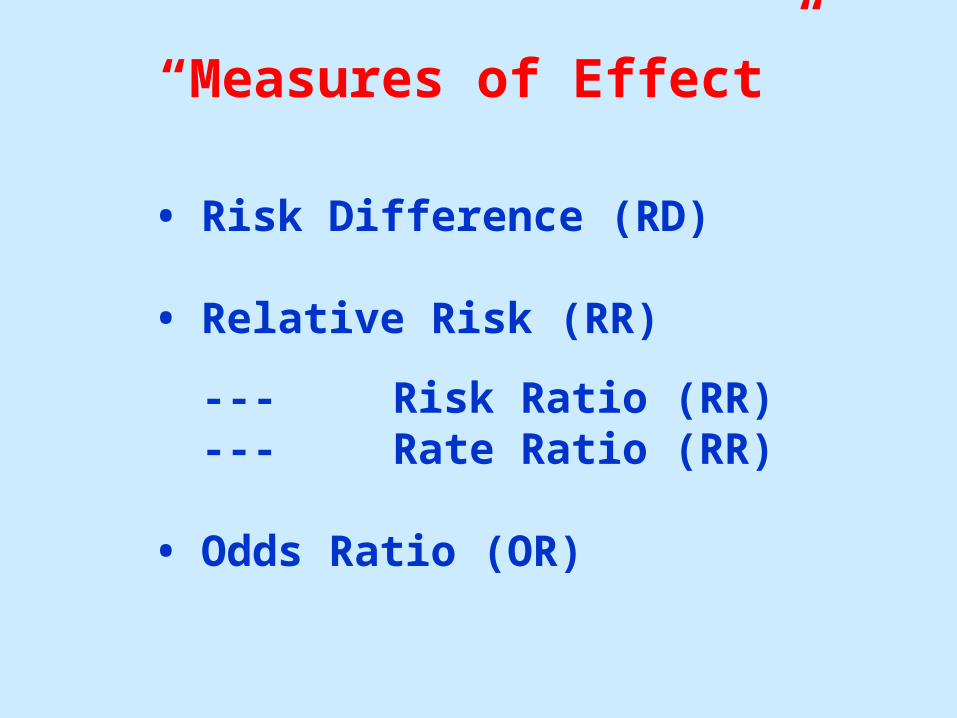
“Measures of Effect”
• Risk Difference (RD)
• Relative Risk (RR)
--- Risk Ratio (RR)--- Rate Ratio (RR)
• Odds Ratio (OR)
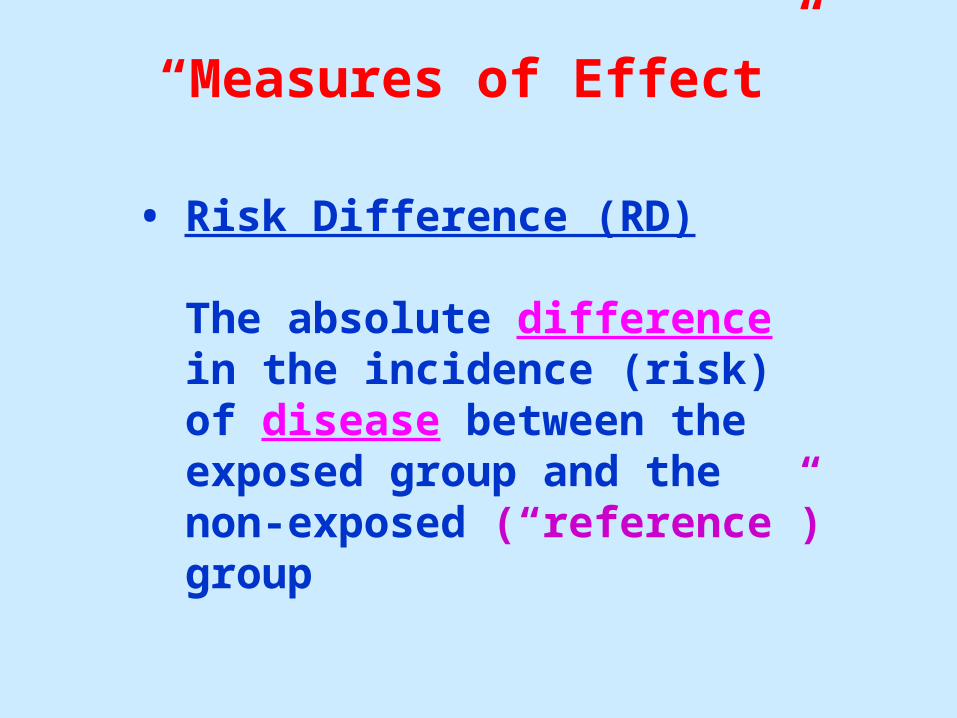
“Measures of Effect”
• Risk Difference (RD)
The absolute difference in the incidence (risk) of disease between the exposed group and the non-exposed (“reference”) group
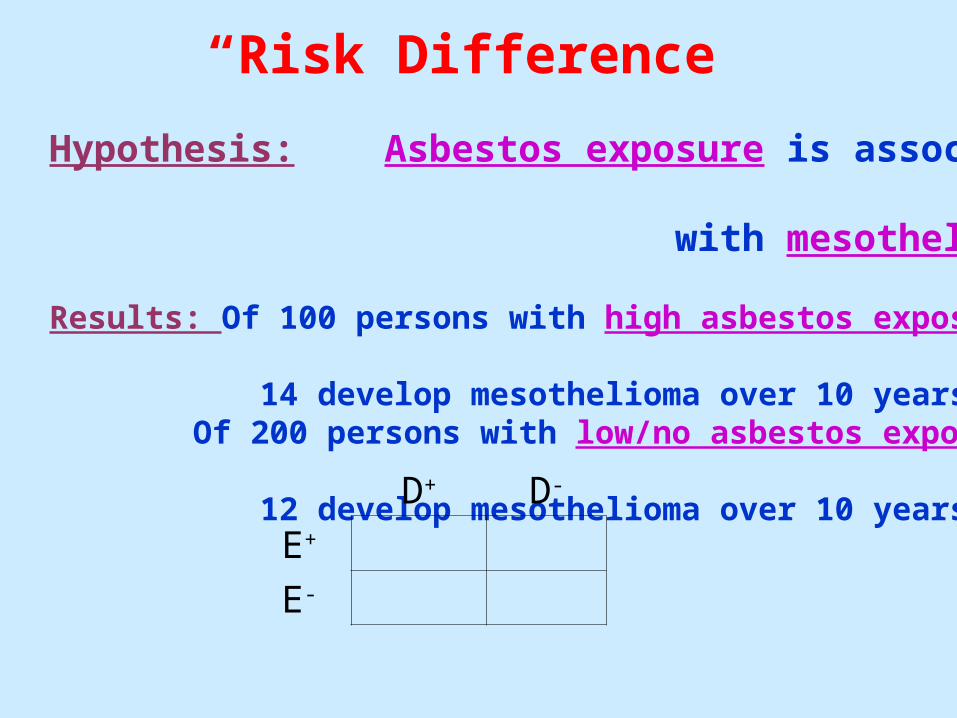
“Risk Difference”
Hypothesis: Asbestos exposure is associated
with mesothelioma
Results: Of 100 persons with high asbestos exposure,
14 develop mesothelioma over 10 yearsOf 200 persons with low/no asbestos exposure,
12 develop mesothelioma over 10 yearsD+ D-
E+
E-

“Risk Difference”
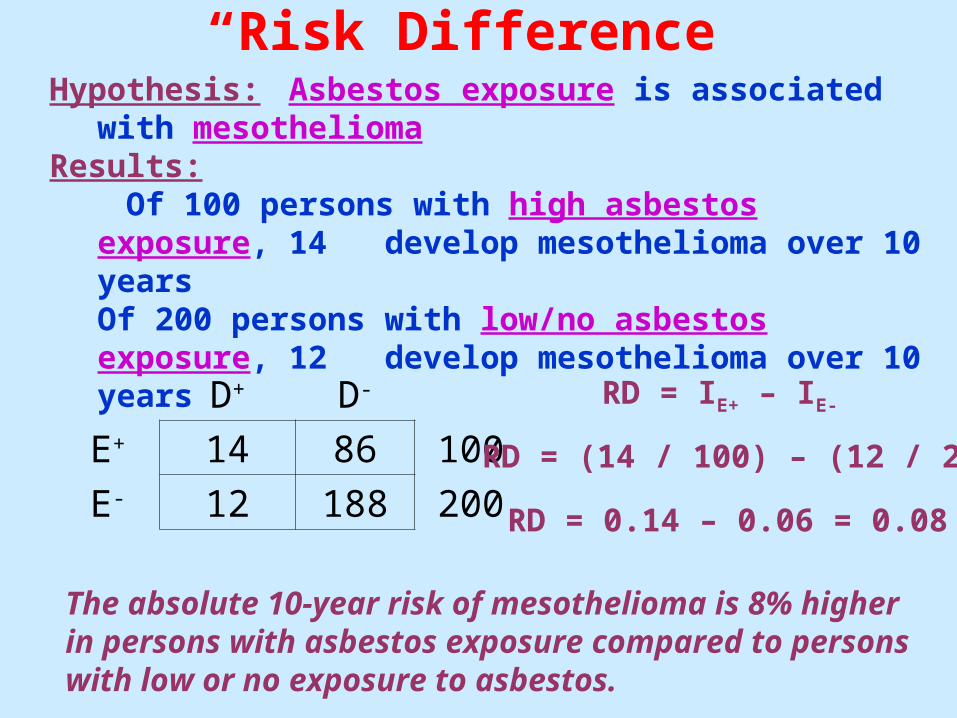
Hypothesis: Asbestos exposure is associated with mesothelioma
Results:Of 100 persons with high asbestos exposure,
14 develop mesothelioma over 10 yearsOf 200 persons with low/no asbestos exposure, 12 develop mesothelioma over 10 years
D+ D-
E+ 14 100
E- 12 200
“Risk Difference”Hypothesis: Asbestos exposure is associated with
mesotheliomaResults: Of 100 persons with high asbestos exposure, 14
develop mesothelioma over 10 yearsOf 200 persons with low/no asbestos exposure, 12
develop mesothelioma over 10 years
D+ D-
E+ 14 86 100
E- 12 188 200
RD = IE+ – IE-
RD = (14 / 100) – (12 / 200)
RD = 0.14 – 0.06 = 0.08
The absolute 10-year risk of mesothelioma is 8% higher in persons with asbestos exposure compared to persons with low or no exposure to asbestos.
“Measures of Effect”
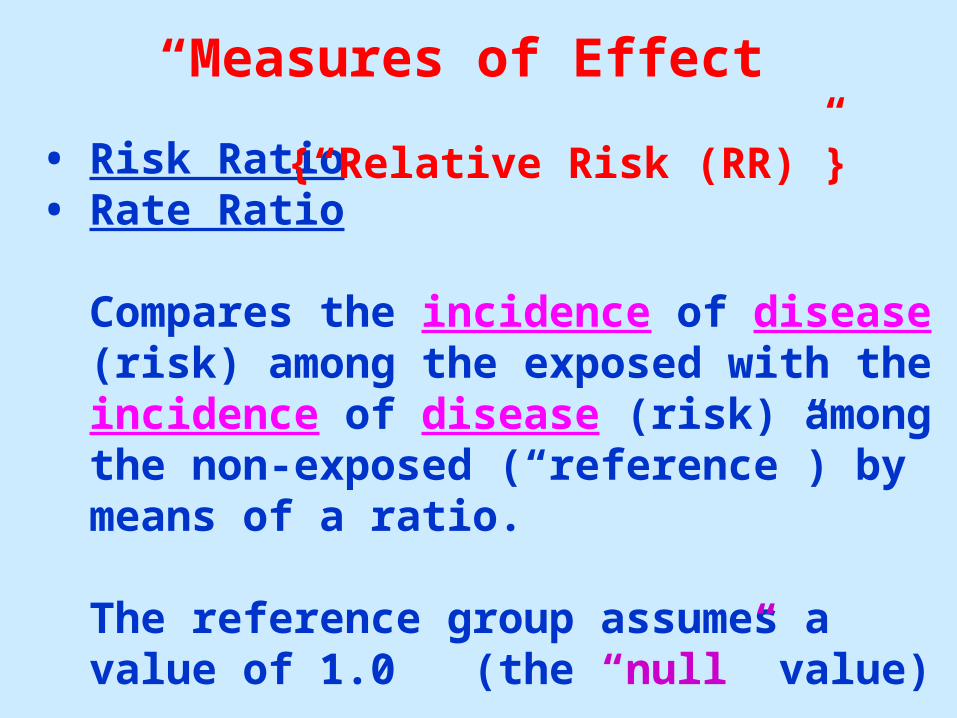
• Risk Ratio• Rate Ratio
Compares the incidence of disease (risk) among the exposed with the incidence of disease (risk) among the non-exposed (“reference”) by means of a ratio.
The reference group assumes a value of 1.0 (the “null” value)
{“Relative Risk (RR)”}

The ‘null’ value (1.0)The ‘null’ value (1.0)
CIexposed = 0.0026CInon-exposed = 0.0026
CIexposed = 0.49CInon-exposed = 0.49
IRexposed = 0.062 per 100KIRnon-exposed = 0.062 per 100K
RR = 1.0
RR = 1.0
RR = 1.0
The ‘null’ value (1.0)The ‘null’ value (1.0)
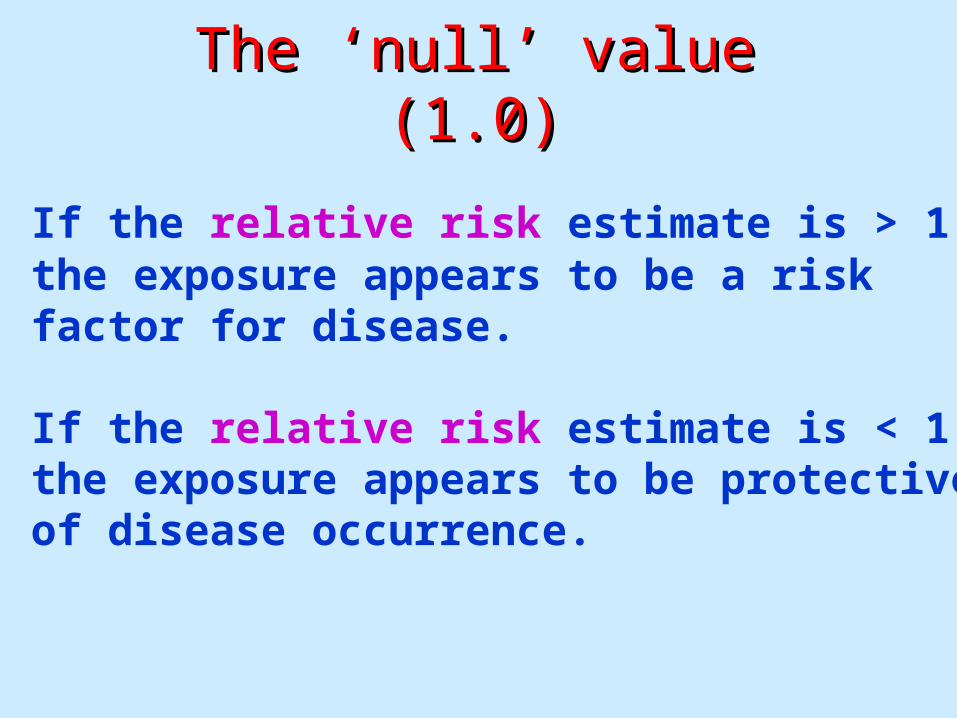
• If the relative risk estimate is > 1.0,the exposure appears to be a riskfactor for disease.
• If the relative risk estimate is < 1.0,the exposure appears to be protectiveof disease occurrence.
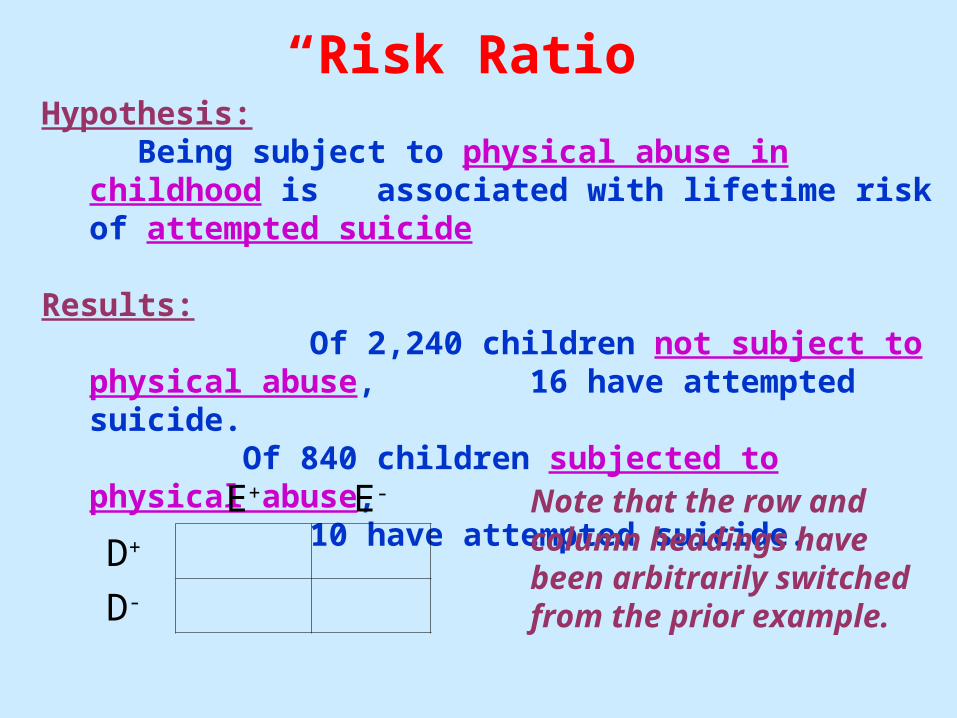
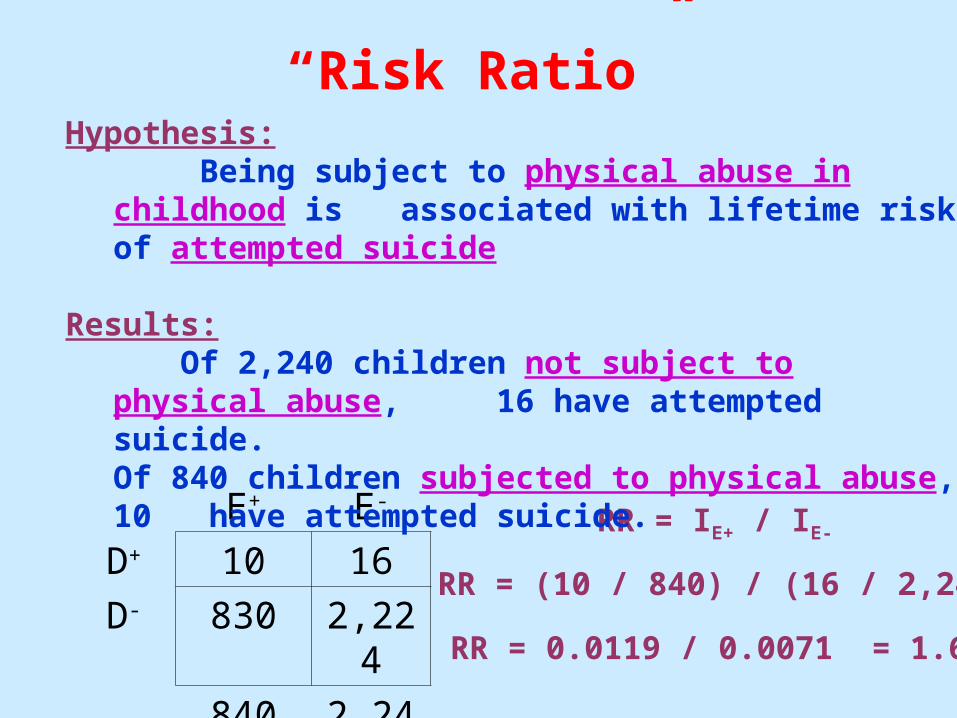
“Risk Ratio”Hypothesis: Being subject to physical abuse in childhood is
associated with lifetime risk of attempted suicide
Results: Of 2,240 children not subject to physical abuse,
16 have attempted suicide. Of 840 children subjected to physical abuse,
10 have attempted suicide.
E+ E-
D+
D-
Note that the row andcolumn headings havebeen arbitrarily switchedfrom the prior example.

“Risk Ratio”
E+ E-
D+ 10 16
D-
840 2,240
Hypothesis: Being subject to physical abuse in childhood is
associated with lifetime risk of attempted suicide
Results: Of 2,240 children not subject to physical abuse, 16
have attempted suicide.Of 840 children subjected to physical abuse, 10 have attempted suicide.
“Risk Ratio”
E+ E-
D+ 10 16
D- 830 2,224
840 2,240
RR = IE+ / IE-
RR = (10 / 840) / (16 / 2,240)
RR = 0.0119 / 0.0071 = 1.68
Hypothesis: Being subject to physical abuse in childhood is
associated with lifetime risk of attempted suicide
Results: Of 2,240 children not subject to physical abuse, 16
have attempted suicide.Of 840 children subjected to physical abuse, 10 have attempted suicide.
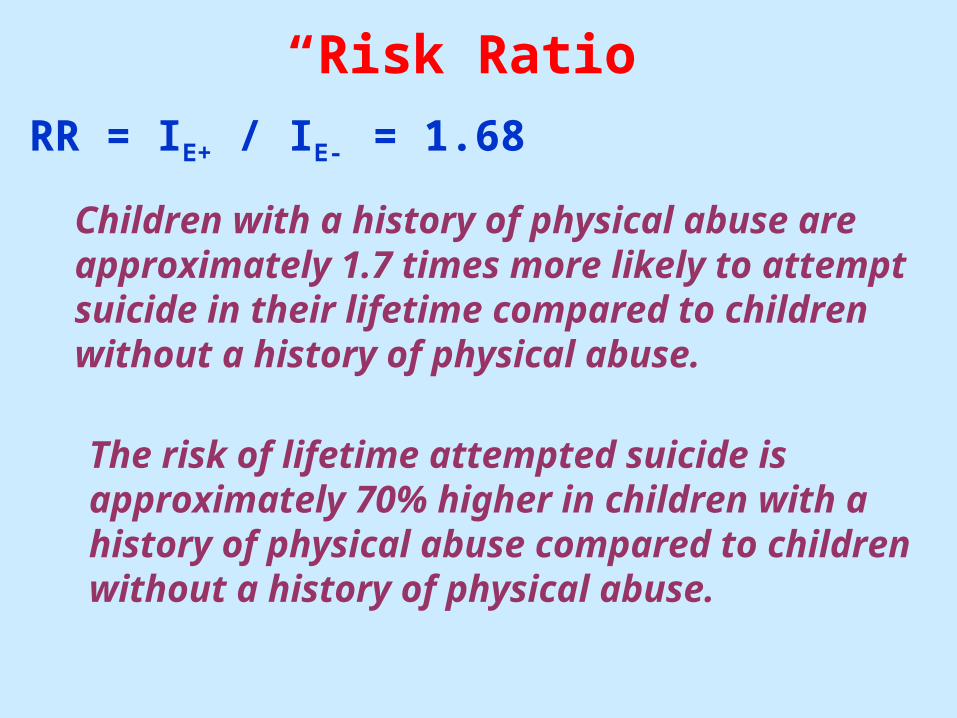
“Risk Ratio”
RR = IE+ / IE- = 1.68
Children with a history of physical abuse areapproximately 1.7 times more likely to attemptsuicide in their lifetime compared to childrenwithout a history of physical abuse.
The risk of lifetime attempted suicide isapproximately 70% higher in children with ahistory of physical abuse compared to childrenwithout a history of physical abuse.
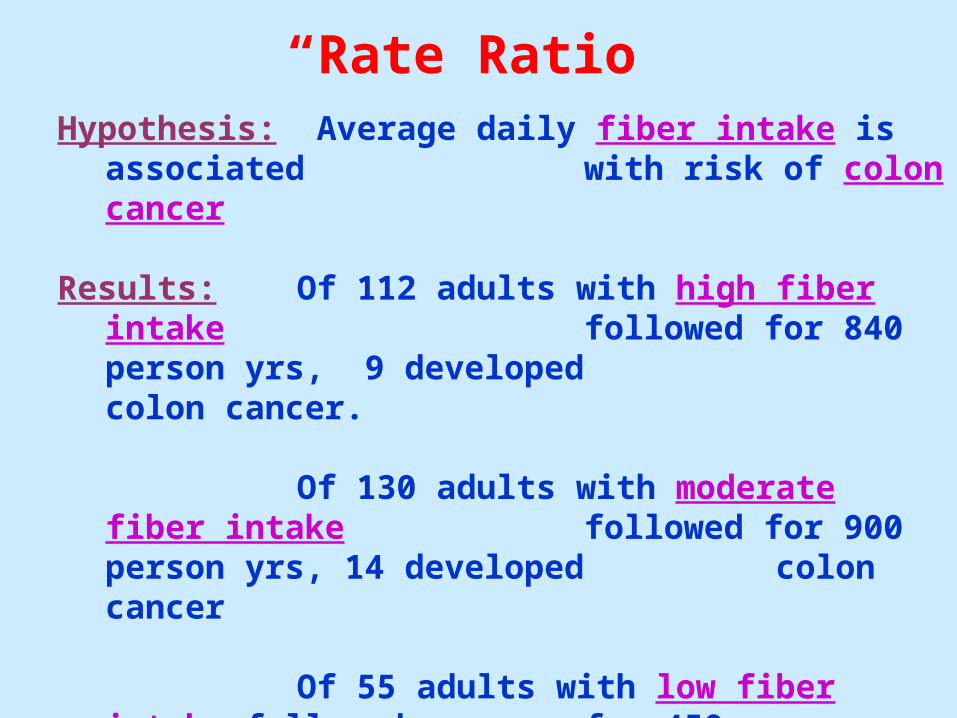
“Rate Ratio”Hypothesis: Average daily fiber intake is associated
with risk of colon cancer
Results: Of 112 adults with high fiber intake followed for 840 person yrs, 9
developed colon cancer.
Of 130 adults with moderate fiber intake followed for 900 person yrs, 14
developed colon cancer
Of 55 adults with low fiber intake followed for 450 person yrs, 12 developed colon
cancer.

“Rate Ratio”
Expos. D+ D- PY
High 9 --- 840
Mod 14 --- 900
Low 12 --- 450
• Assume that high fiber intake is the reference group (value of 1.0)• Compare the incidence rate (IR) of colon cancer:
Moderate fiber intake versus high fiber intakeLow fiber intake versus high fiber intake
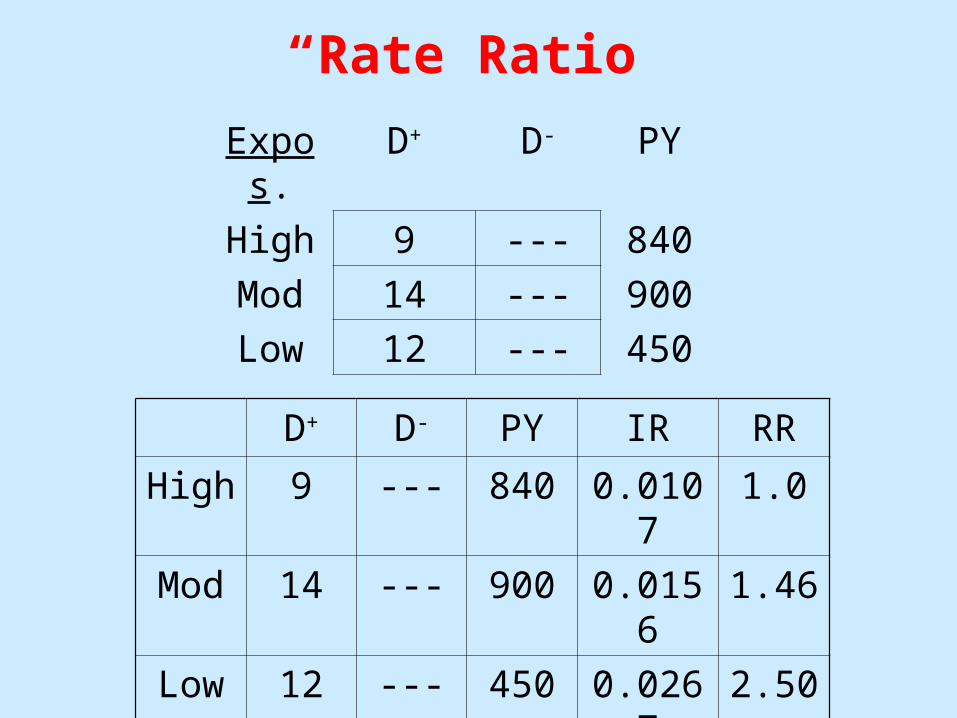
“Rate Ratio”
D+ D- PY IR RR
High 9 --- 840 0.0107 1.0
Mod 14 --- 900 0.0156 1.46
Low 12 --- 450 0.0267 2.50
Expos. D+ D- PY
High 9 --- 840
Mod 14 --- 900
Low 12 --- 450
“Rate Ratio”
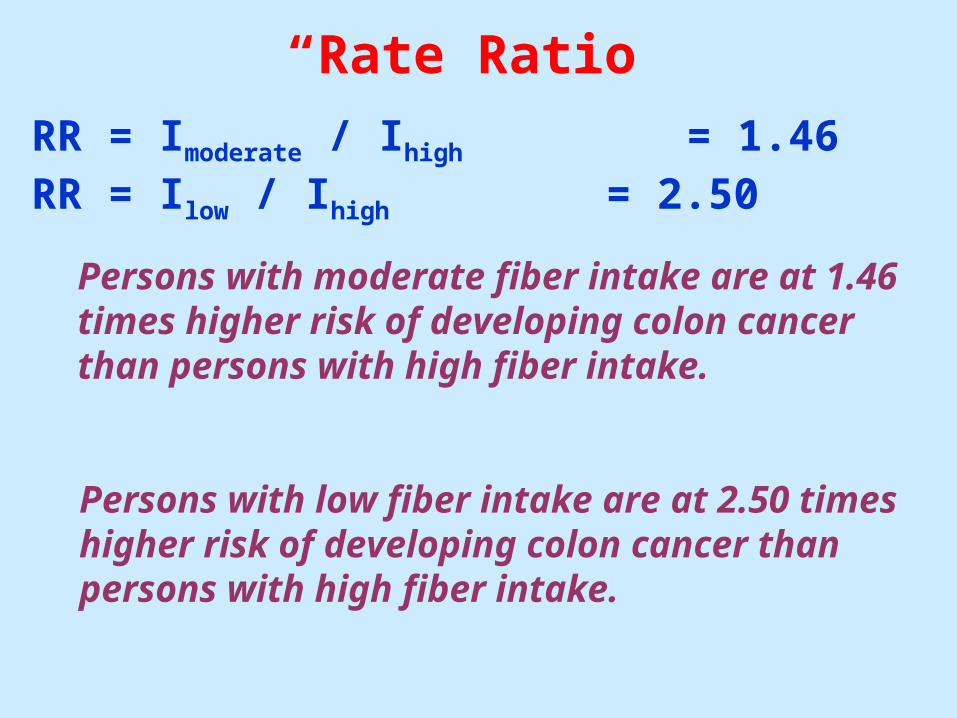
RR = Imoderate / Ihigh = 1.46RR = Ilow / Ihigh = 2.50
Persons with moderate fiber intake are at 1.46times higher risk of developing colon cancerthan persons with high fiber intake.
Persons with low fiber intake are at 2.50 timeshigher risk of developing colon cancer thanpersons with high fiber intake.
“Measures of Effect”
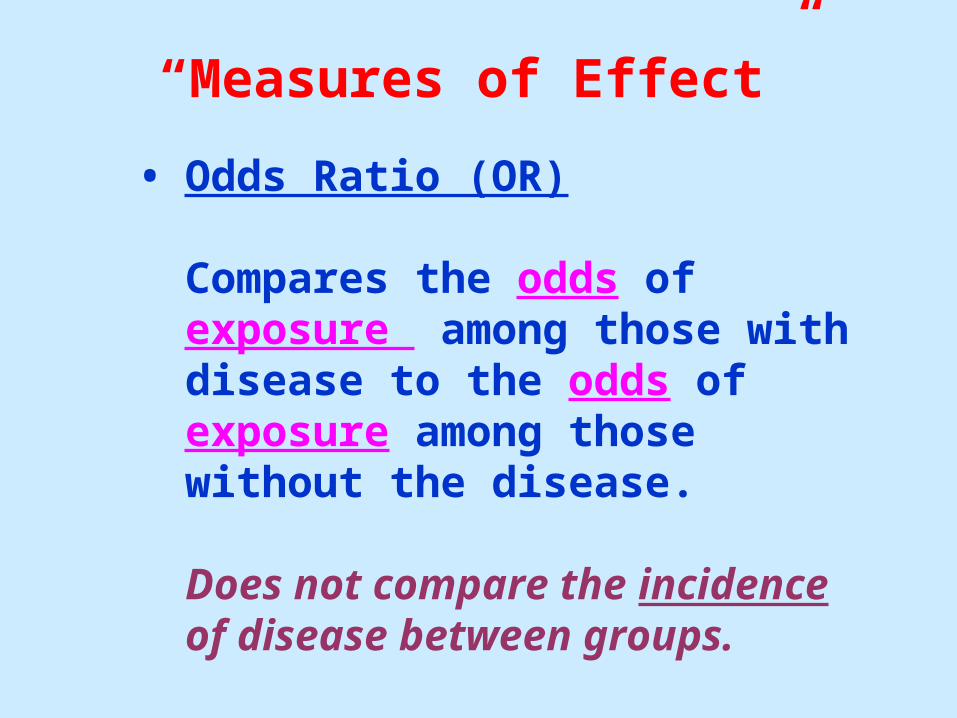
• Odds Ratio (OR)
Compares the odds of exposure among those with disease to the odds of exposure among those without the disease.
Does not compare the incidence of disease between groups.
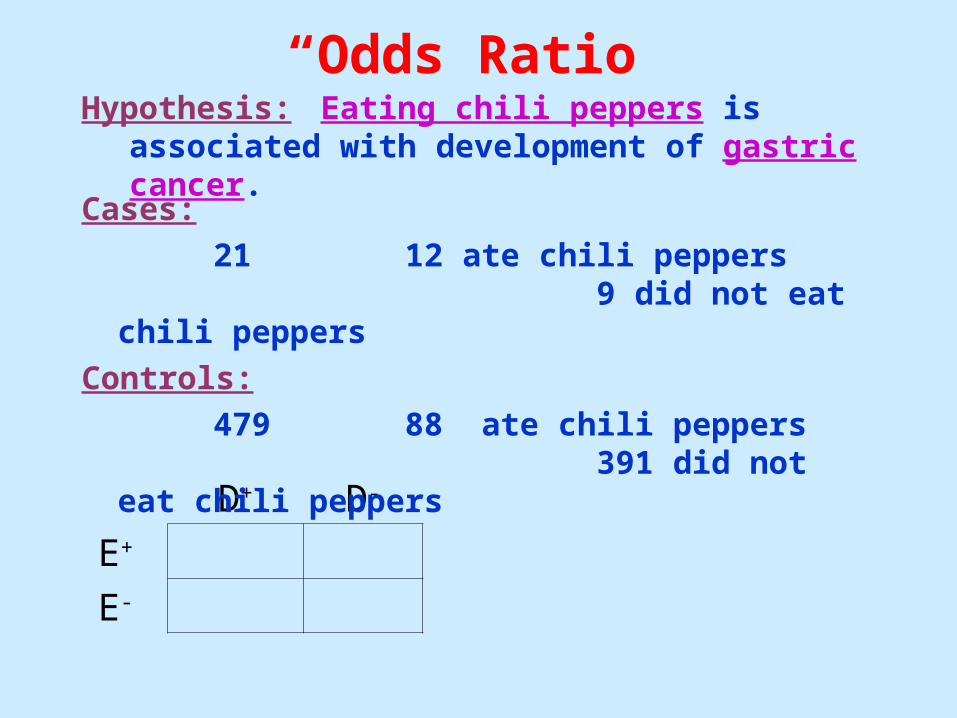
“Odds Ratio”Hypothesis: Eating chili peppers is associated with
development of gastric cancer.
D+ D-
E+
E-
Cases:
21 12 ate chili peppers9 did not eat chili
peppers
Controls:
479 88 ate chili peppers391 did not eat chili
peppers
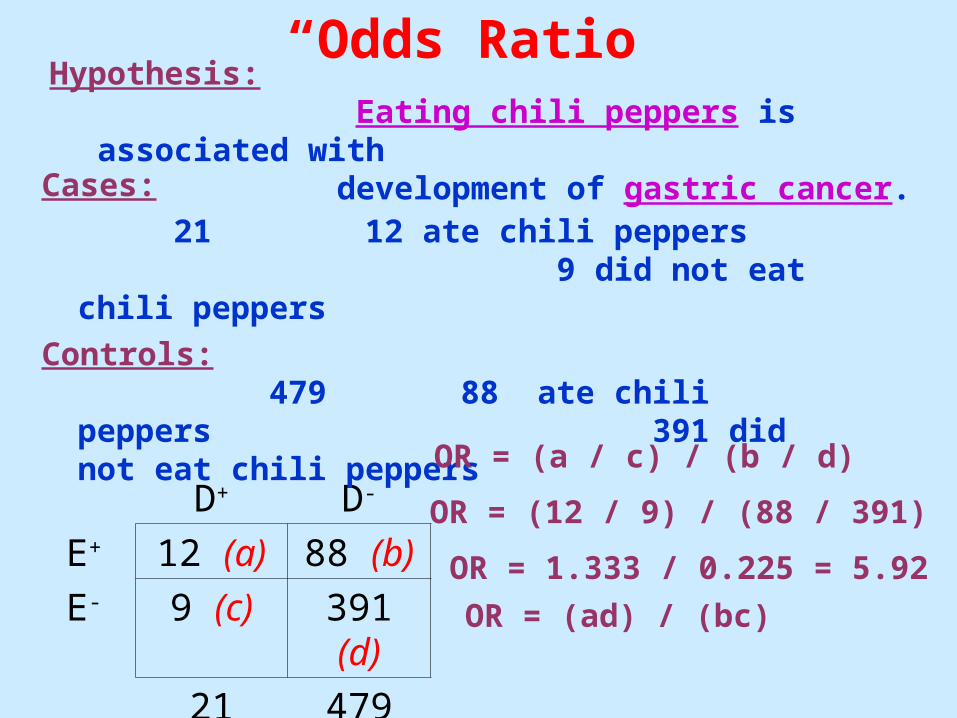
“Odds Ratio”
D+ D-
E+ 12 (a) 88 (b)
E- 9 (c) 391 (d)
21 479
Cases:
21 12 ate chili peppers9 did not eat chili
peppers
Controls:479 88 ate chili peppers
391 did not eat chili peppers OR = (a / c) / (b / d)
OR = (12 / 9) / (88 / 391)
OR = 1.333 / 0.225 = 5.92
OR = (ad) / (bc)
Hypothesis: Eating chili peppers is associated with development of gastric cancer.

“Odds Ratio”
OR = 5.92
• The odds of being exposed to chili peppers are5.92 times higher for gastric cancer cases ascompared to controls
• (Interpreting OR as RR – if appropriate)
The incidence (or risk) of gastric cancer is 5.92
times higher for persons who eat chili peppers
as compared with persons who do not eat
chili peppers (Is this appropriate?)
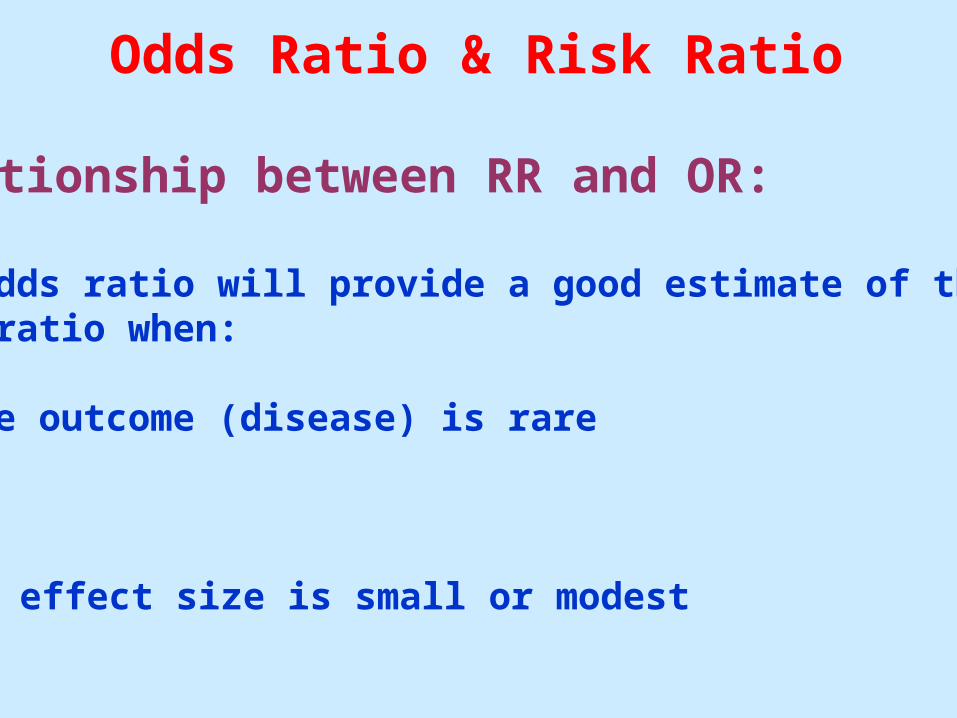
Odds Ratio & Risk Ratio
Relationship between RR and OR:
The odds ratio will provide a good estimate of therisk ratio when:
1. The outcome (disease) is rare
OR
2. The effect size is small or modest
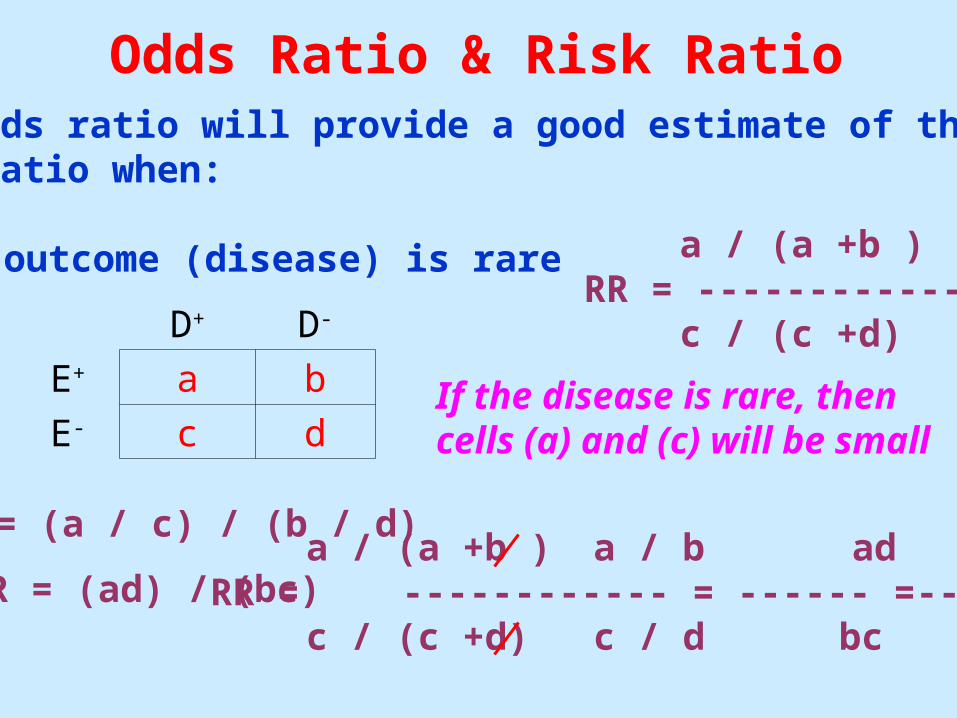
Odds Ratio & Risk RatioThe odds ratio will provide a good estimate of therisk ratio when:
1. The outcome (disease) is rare
D+ D-
E+ a b
E- c d
OR = (a / c) / (b / d)
OR = (ad) / (bc)
a / (a +b )RR = ------------
c / (c +d)
If the disease is rare, thencells (a) and (c) will be small
a / (a +b ) a / b adRR = ------------ = ------ =-- = OR
c / (c +d) c / d bc
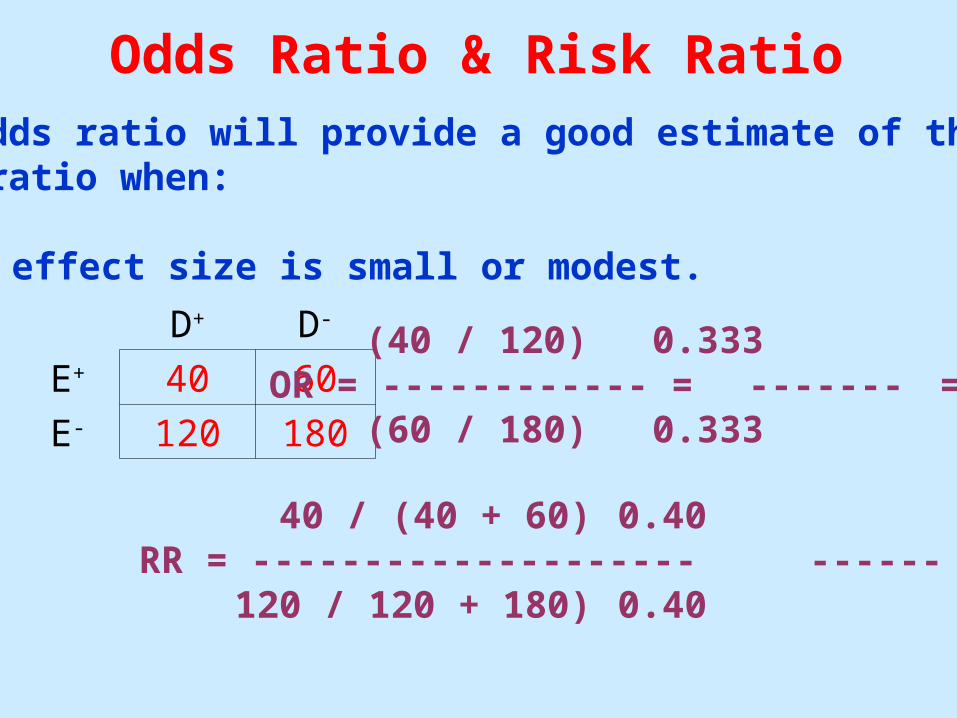
Odds Ratio & Risk RatioThe odds ratio will provide a good estimate of therisk ratio when:
2. The effect size is small or modest.
D+ D-
E+ 40 60
E- 120 180
(40 / 120) 0.333OR = ------------ = ------- = 1.0
(60 / 180) 0.333
40 / (40 + 60) 0.40RR = -------------------- ------ = 1.0
120 / 120 + 180) 0.40
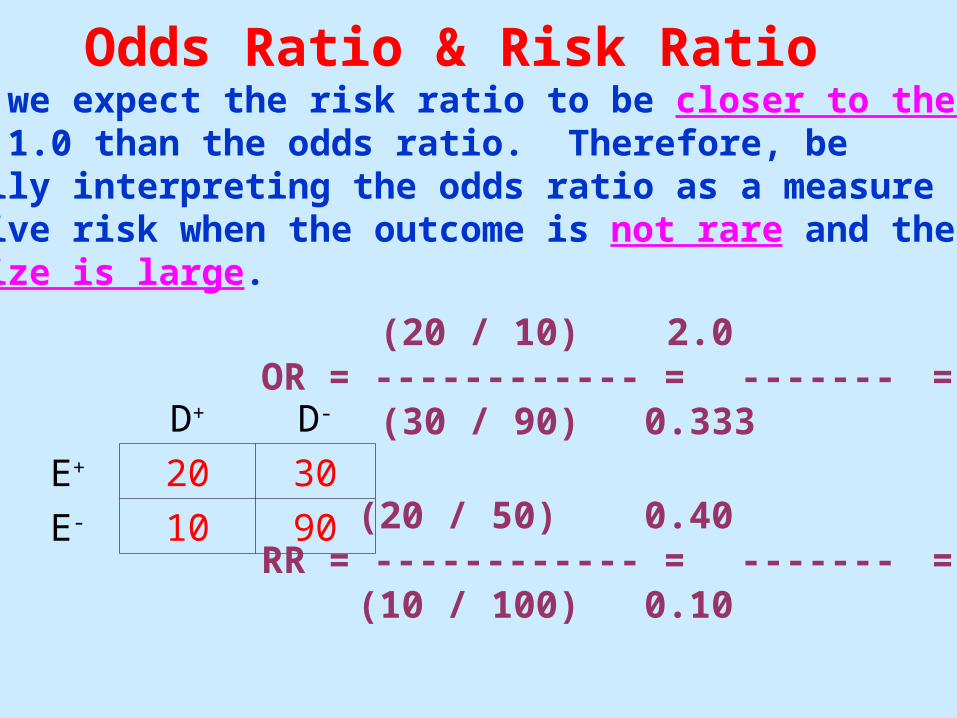
D+ D-
E+ 20 30
E- 10 90
Finally, we expect the risk ratio to be closer to the nullvalue of 1.0 than the odds ratio. Therefore, be especially interpreting the odds ratio as a measureof relative risk when the outcome is not rare and theeffect size is large.
(20 / 10) 2.0OR = ------------ = ------- = 6.0
(30 / 90) 0.333
(20 / 50) 0.40RR = ------------ = ------- = 4.0
(10 / 100) 0.10
Odds Ratio & Risk Ratio