unit 5. social science: maps and globes
TRANSCRIPT


People have been making maps of the Earth for thousands of years.
One of the oldest maps in the world was found on the wall of a cave in
Navarra in 2009. Historians think that it is about 14.000 years old.
Today, mapmakers use computers and satellite technology to make very
precise maps.
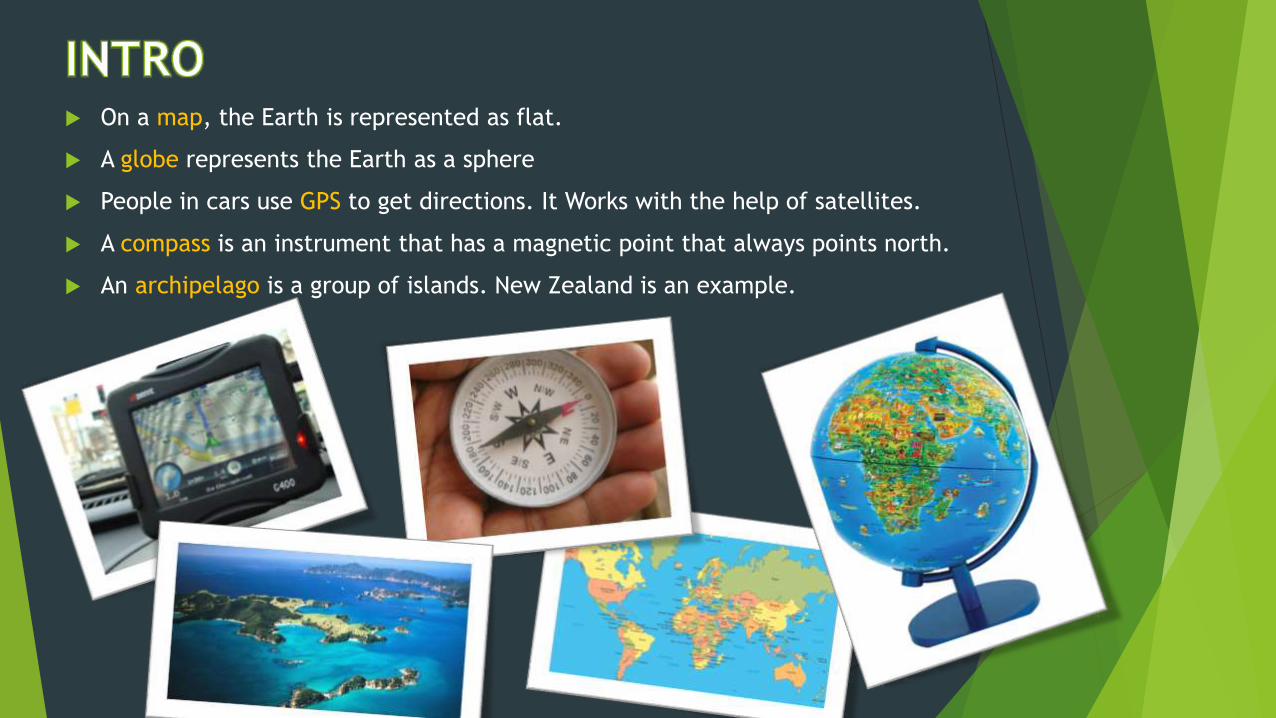
On a map, the Earth is represented as flat.
A globe represents the Earth as a sphere
People in cars use GPS to get directions. It Works with the help of satellites.
A compass is an instrument that has a magnetic point that always points north.
An archipelago is a group of islands. New Zealand is an example.

Today we know what the Earth really looks like because we can take photos of
it from planes and satellites. We use these photos to create maps and globes.
Maps show the Earth as flat.

The Equator is one line that
goes horizontally around the
Earth. It divides the Earth into
the Northern Hemisphere and
the Southern Hemisphere
Lines of latitude go horizontally around the Earth. We use
these lines to measure distance from the Equator
Lines of longitude go vertically around the
Earth from the North Pole to the South Pole

People who make maps are called cartographers. In the past, cartographers
drew maps by hand.
Today, most maps are made with computers.

Globes show the Earth as a sphere. Globes also show how the Earth is tilted
on its axis. The Earth’s axis goes through the North Pole and the South Pole. A
globe can also spin around in the same way that the Earth rotates on its axis.

We already know that the Earth is a sphere. Globes are also spheres, so they
represent the Earth as it really is. They are more realistic than maps. They
show the correct shape and size of the land and water on Earth, as well as the
correct distance between the different areas of land.

Lines of latitude Lines of longitude

Physical maps show the different areas of elevation with different colours.
They also show bodies of water, such as oceans, rivers and lakes.
This is a physical map of Europe:

Political maps show an area of land divided into countries. They also show
capital cities of these countries and other important cities. Different colours
are used for each country.
This is a political map of Europe:

Spain is the fourth largest country in Europe in terms of area.
Russia is the largest and the Vatican City is the smallest.

A street map is a map of a smaller area, such as a town or a city. They show
natural features, like forest and rivers, and man-made features, such as
hospitals, roads and parks. We use thee maps to find directions to places we
want to go.

The letters GPS stand for Global Positioning System..

A map shows a large area of land on a small piece of paper or on a screen.
Natural and man-made features are scaled down so they fit on the map. All
the different things on the map (roads, squares, parks, etc…) are all reduced
by the same amount.
Not all maps have the same scale. The two maps below show the same place
but on different scales.

Large scale maps show more detail. The features on the map look larger. On
this map, two centimetres equal 500 metres.
Small scale maps show less detail, so the features look smaller. Two
centimetres on this map are equal to 1000 metres, or one kilometre.

Scale is another way of saying size. Photos, paintings and models are all
examples of objects that are scaled down.