unit v: factor markets ***factors = resources = inputs*** length: 2 weeks chapters: 27 and 28...
TRANSCRIPT

Unit V: Factor Markets***Factors = Resources = Inputs***
Length: 2 WeeksChapters: 27 and 28Assignments:
Problem Set #5Final Exam
½ Unit V: Factor Markets ½ Everything ElseMany AP and former exam questions

The Demand for Resources
27C H A P T E R

DEMAND FOR RESOURCES
Example 1: If there was a significant increase in the
demand for pizza, how would this affect the demand for cheese?
Cows? Milking Machines? Veterinarians? Vet Schools? Etc.
Example 2: An increase in the demand for computers
increases the demand for…
Derived Demand- The demand for resources is determined (derived) by the products they help produce.
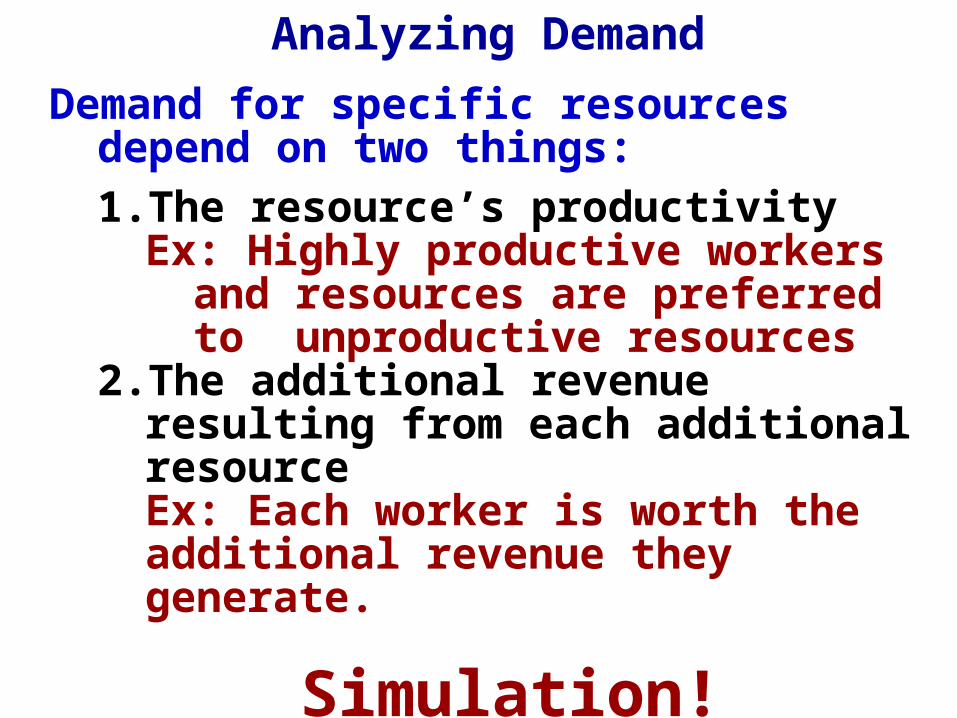
Demand for specific resources depend on two things:
1. The resource’s productivityEx: Highly productive workers and
resources are preferred to unproductive resources
2. The additional revenue resulting from each additional resourceEx: Each worker is worth the additional revenue they generate.
Simulation!
Analyzing Demand
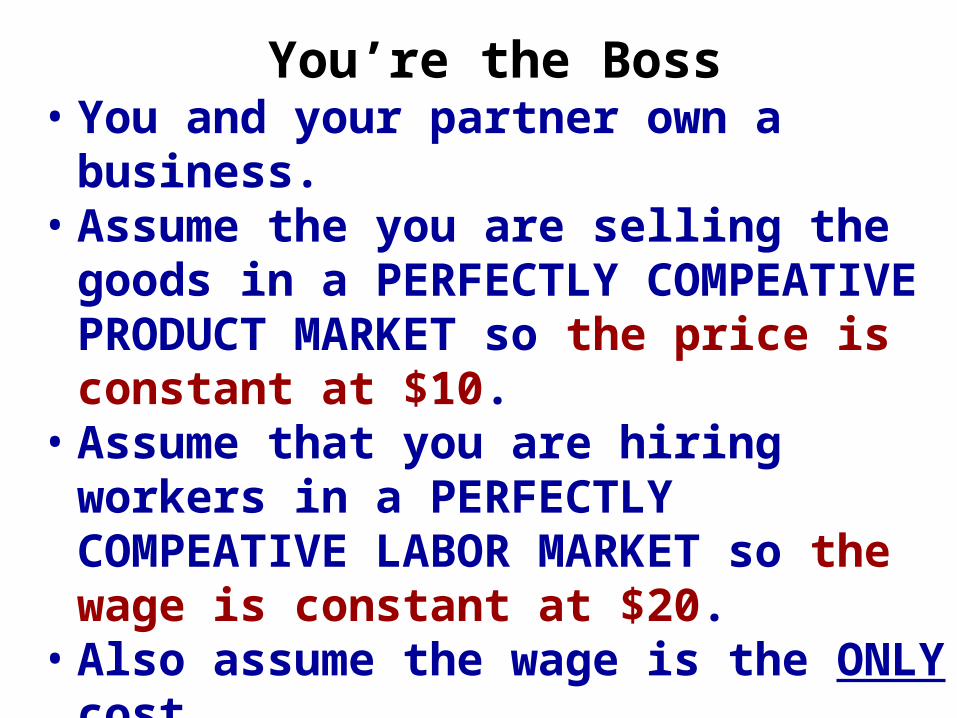
You’re the Boss• You and your partner own a business.• Assume the you are selling the goods in a
PERFECTLY COMPEATIVE PRODUCT MARKET so the price is constant at $10.
• Assume that you are hiring workers in a PERFECTLY COMPEATIVE LABOR MARKET so the wage is constant at $20.
• Also assume the wage is the ONLY cost.
To maximize profit how many workers should you hire?
WorkersTotal
Product(Output)
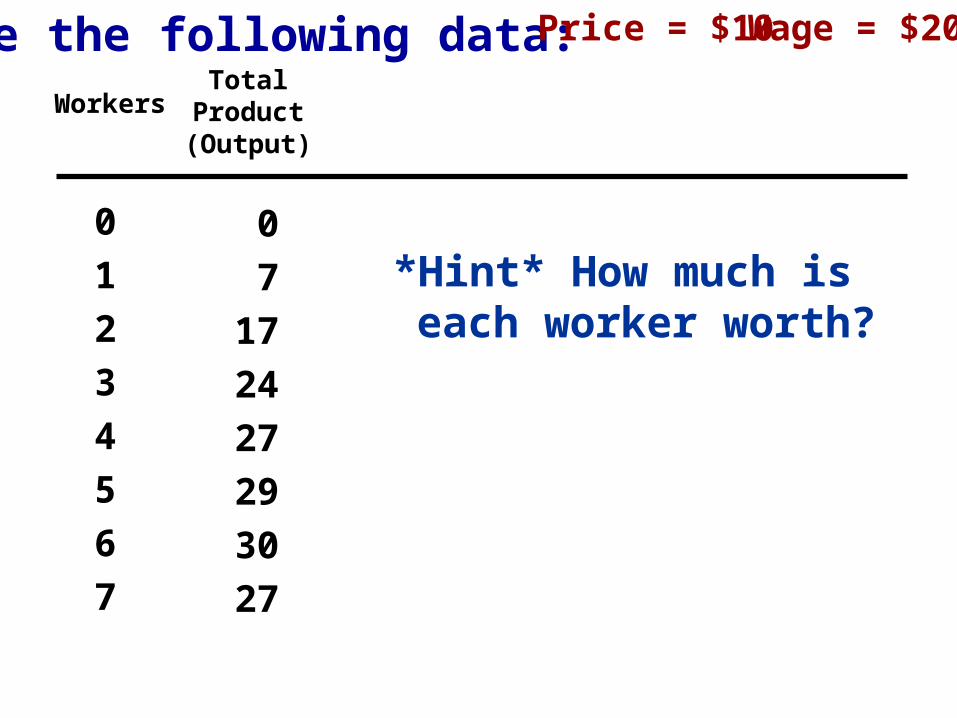
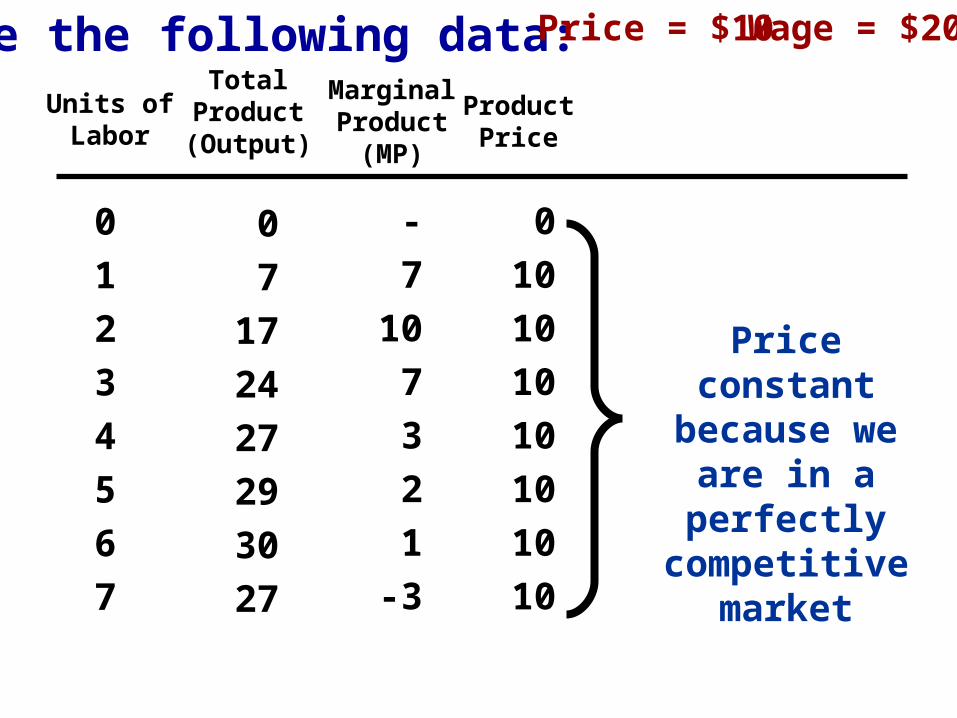
Use the following data:
0
1
2
3
4
5
6
7
0
7
17
24
27
29
30
27
*Hint* How much is each worker worth?
Wage = $20Price = $10
Units ofLabor
TotalProduct(Output)
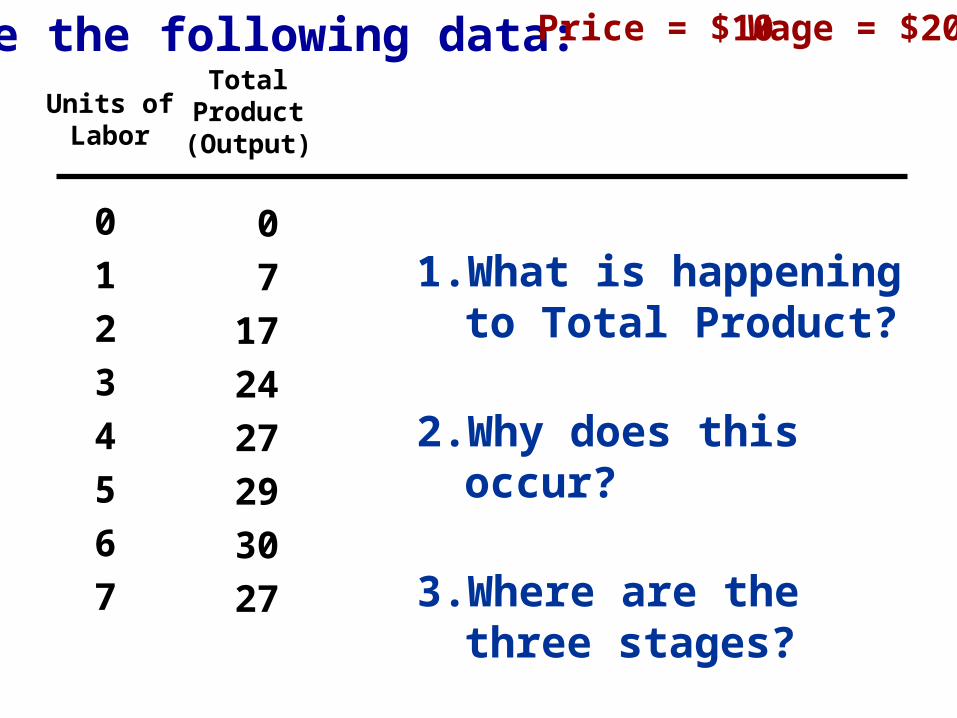
Use the following data:
0
1
2
3
4
5
6
7
0
7
17
24
27
29
30
27
1. What is happening to Total Product?
2. Why does this occur?
3. Where are the three stages?
Wage = $20Price = $10

Units ofLabor
TotalProduct(Output)
Use the following data:
0
1
2
3
4
5
6
7
0
7
17
24
27
29
30
27
Wage = $20Price = $10
MarginalProduct
(MP)
-
7
10
7
3
2
1
-3
This shows the PRODUCTIVITY of
each worker.
Why does productivity decrease?
Units ofLabor
TotalProduct(Output)
Use the following data:
0
1
2
3
4
5
6
7
0
7
17
24
27
29
30
27
Wage = $20Price = $10
MarginalProduct
(MP)
-
7
10
7
3
2
1
-3
ProductPrice
0
10
10
10
10
10
10
10
Price constant because we are
in a perfectly competitive
market

Units ofLabor
TotalProduct(Output)
Use the following data:
0
1
2
3
4
5
6
7
0
7
17
24
27
29
30
27
Wage = $20Price = $10
MarginalProduct
(MP)
-
7
10
7
3
2
1
-3
ProductPrice
0
10
10
10
10
10
10
10
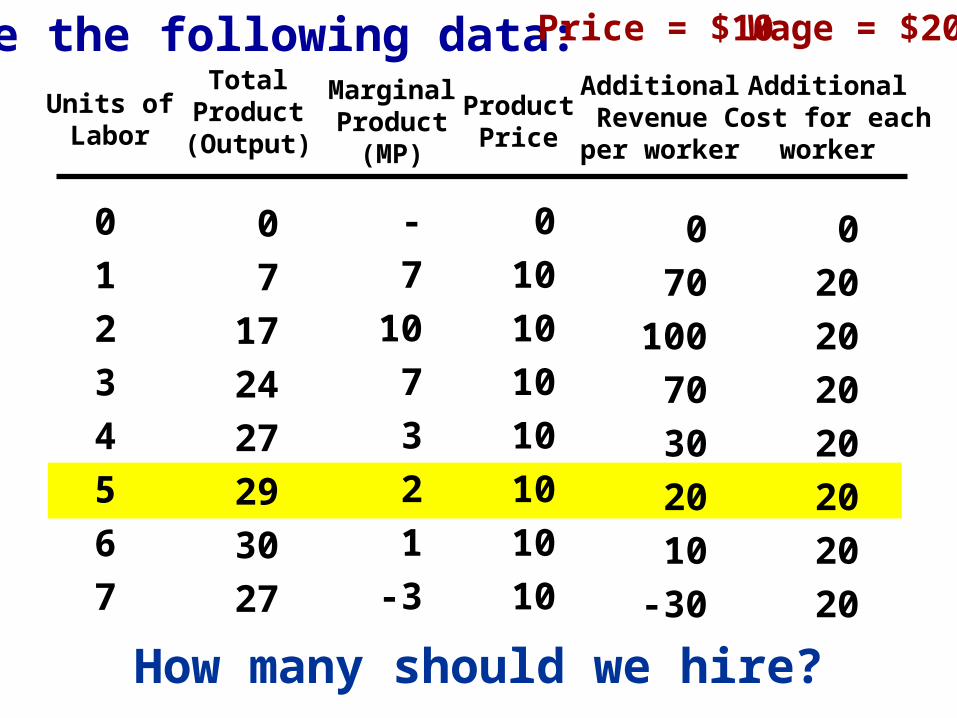
AdditionalRevenue
per worker
0
70
100
70
30
20
10
-30
Shows how
much each
worker is worth
Units ofLabor
TotalProduct(Output)
Use the following data:
0
1
2
3
4
5
6
7
0
7
17
24
27
29
30
27
Wage = $20Price = $10
MarginalProduct
(MP)
-
7
10
7
3
2
1
-3
ProductPrice
0
10
10
10
10
10
10
10
AdditionalRevenue
per worker
0
70
100
70
30
20
10
-30
AdditionalCost for each
worker
0
20
20
20
20
20
20
20
How many should we hire?

0
20
20
20
20
20
20
20
Units ofLabor
TotalProduct(Output)
Use the following data:
0
1
2
3
4
5
6
7
0
70
170
240
270
290
30
27
Wage = $20Price = $10
MarginalProduct
(MP)
-
70
100
70
30
20
1
-3
ProductPrice
0
10
10
10
10
10
10
10
0
700
1000
700
300
200
10
-30
Each worker is
worth more
Demand for specific resources depend on two things:
1. The resource’s productivity2. The additional revenue resulting from
each additional resource
AdditionalCost
per worker
AdditionalRevenue
per worker

Units ofLabor
TotalProduct(Output)
Use the following data:
0
1
2
3
4
5
6
7
0
7
17
24
27
29
30
27
Wage = $20Price = $10
MarginalProduct
(MP)
-
7
10
7
3
2
1
-3
ProductPrice
0
10
10
10
10
10
10
10
AdditionalRevenue
per worker
0
70
100
70
30
20
10
-30
AdditionalCost
per worker
0
20
20
20
20
20
20
20
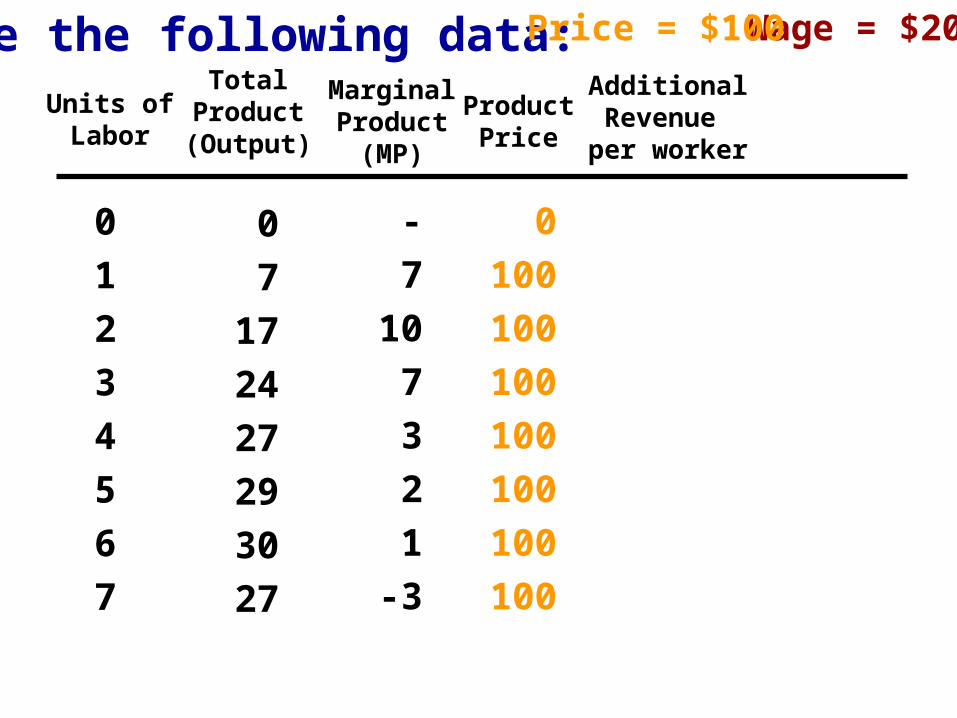
How would this change if the demand for the good
increased significantly?1.Price of the good would
increase2.Value of each worker would
increase
Units ofLabor
TotalProduct(Output)
Use the following data:
0
1
2
3
4
5
6
7
0
7
17
24
27
29
30
27
Wage = $20Price = $100
MarginalProduct
(MP)
-
7
10
7
3
2
1
-3
ProductPrice
0
100
100
100
100
100
100
100
AdditionalRevenue
per worker
Units ofLabor
TotalProduct(Output)
Use the following data:
0
1
2
3
4
5
6
7
0
7
17
24
27
29
30
27
Wage = $20Price = $100
MarginalProduct
(MP)
-
7
10
7
3
2
1
-3
ProductPrice
0
100
100
100
100
100
100
100
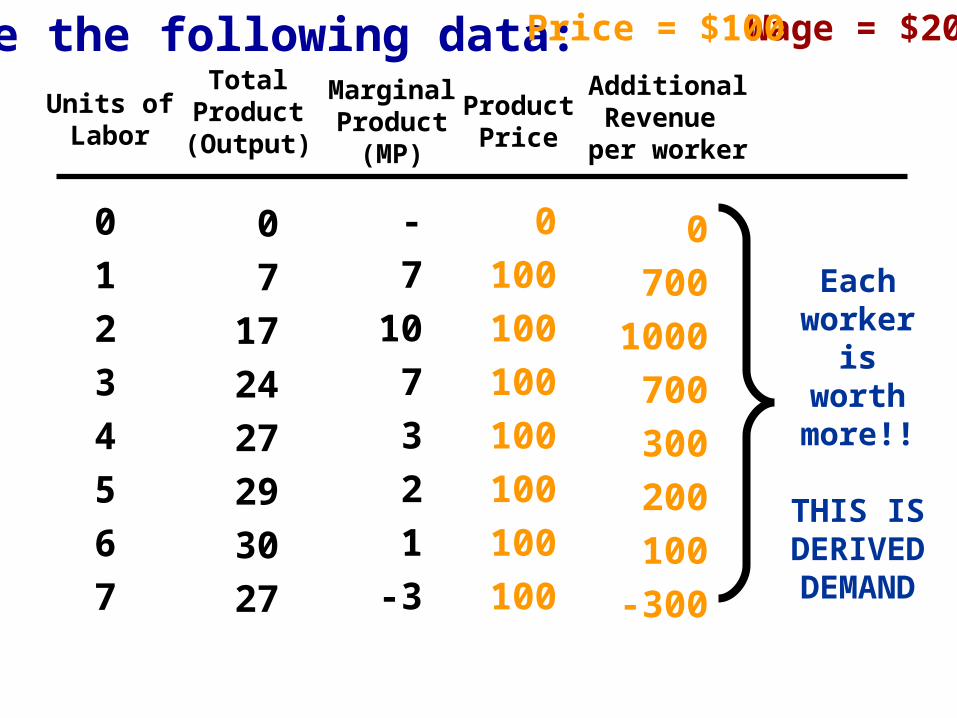
AdditionalRevenue
per worker
0
700
1000
700
300
200
100
-300
Each worker is
worth more!!
THIS ISDERIVED DEMAND

Units ofLabor
TotalProduct(Output)
Use the following data:
0
1
2
3
4
5
6
7
0
7
17
24
27
29
30
27
Wage = $20Price = $10
MarginalProduct
(MP)
-
7
10
7
3
2
1
-3
ProductPrice
0
10
10
10
10
10
10
10
AdditionalRevenue
per worker
0
70
100
70
30
20
10
-30
AdditionalCost
per worker
0
20
20
20
20
20
20
20
How would this change if the productivity of each worker
increased?1.Marginal Product would increase2.Value of each worker would
increase

Units ofLabor
TotalProduct(Output)
Use the following data:
0
1
2
3
4
5
6
7
0
70
170
240
270
290
300
270
Wage = $20Price = $10
MarginalProduct
(MP)
-
70
100
70
30
20
10
-30
ProductPrice
0
10
10
10
10
10
10
10
AdditionalRevenue
per worker
0
700
1000
700
300
200
100
-300
Each worker is
worth more!
More demand for the
resource

MRP and MRC

MARGINAL REVENUE PRODUCT (MRP)The additional revenue generated by an additional worker.
In perfectly competitive product markets the MRP equals the marginal product of the resource times the price of the product.
Ex: If the MP of the 3rd worker is 5 and the price of the good is constant at $20 the MRP is…….
$100
Another way to calculate MRP is:
MarginalRevenueProduct
=Change in
Total Revenue
Change inResource Quantity

MARGINAL RESOURCE COST (MRC)The additional cost of an additional worker.
In perfectly competitive labor markets the MRC equals the wage set by the market.
Ex: The MRC of an unskilled worker is $6.75.
Another way to calculate MRC is:
MarginalRevenueProduct
=Change in
Total Revenue
Change inResource Quantity

Continue to hire until…
MRP = MRC
How do you know how many resources (workers) to employ?

Identifying the Demand Curve for Resources
Units ofLabor
TotalProduct(Output)
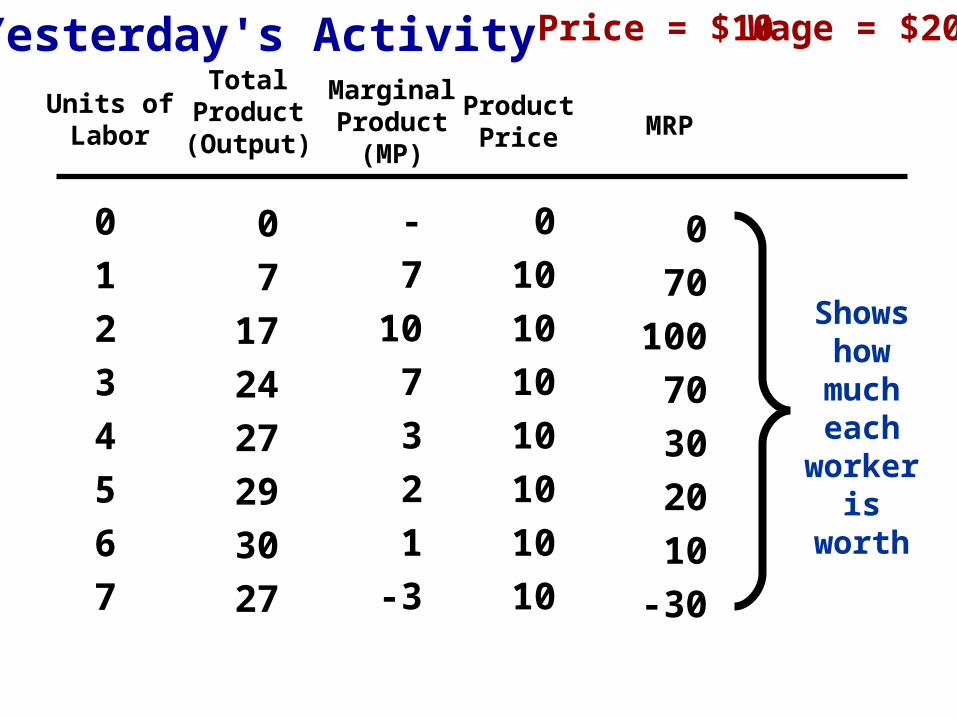
Yesterday's Activity
0
1
2
3
4
5
6
7
0
7
17
24
27
29
30
27
Wage = $20Price = $10
MarginalProduct
(MP)
-
7
10
7
3
2
1
-3
ProductPrice
0
10
10
10
10
10
10
10
MRP
0
70
100
70
30
20
10
-30
Shows how
much each
worker is worth

Conclusions: • According to the chart, if wage rate (MRC) was $100
how many workers will they hire? • What if wage rate is $70? $30 $20? $10?
As wage falls, quantity demanded risesAs wage rises, quantity demanded falls
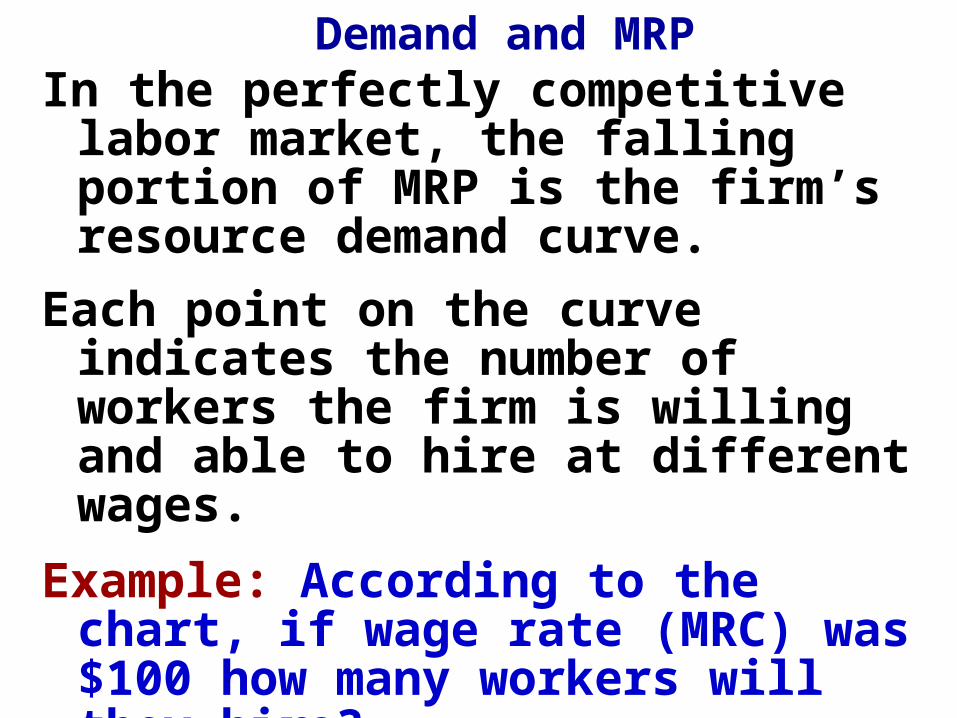
In the perfectly competitive labor market, the falling portion of MRP is the firm’s resource demand curve.
Each point on the curve indicates the number of workers the firm is willing and able to hire at different wages.
Demand and MRP
Units ofLabor
TotalProduct(Output)
Use the following data:
0
1
2
3
4
5
6
7
0
7
17
24
27
29
30
27
Wage = $20Price = $10
MarginalProduct
(MP)
-
7
10
7
3
2
1
-3
ProductPrice
0
10
10
10
10
10
10
10
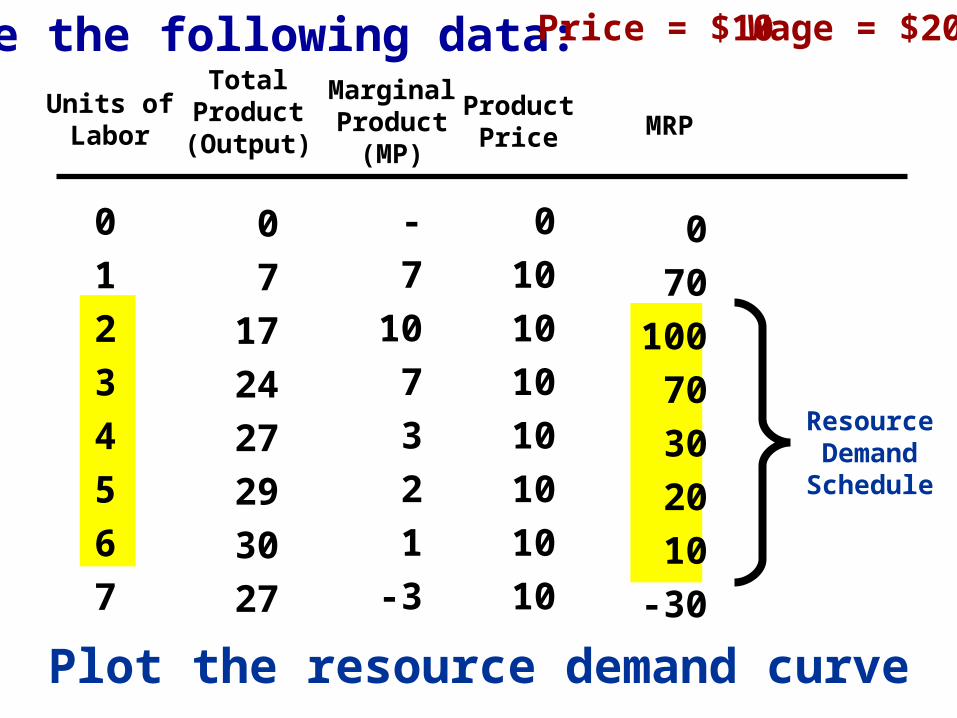
MRP
0
70
100
70
30
20
10
-30
Resource Demand Schedule
Plot the resource demand curve

Wage Rate
Q
$100
80
60
40
20
D=MRP
Quantity of Workers
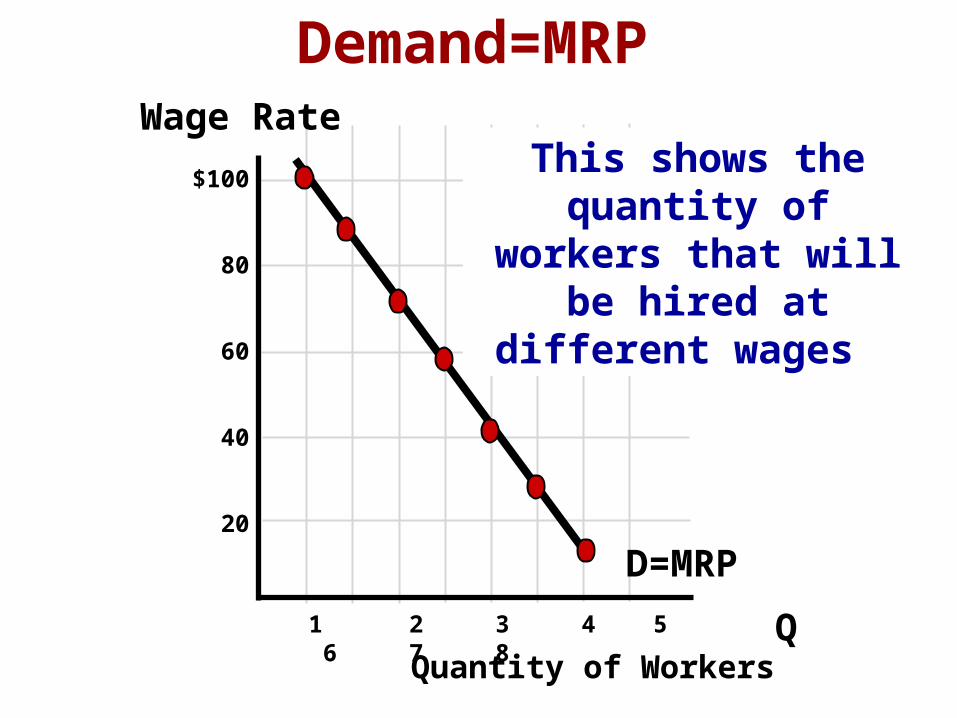
Demand=MRP
1 2 3 4 5 6 7 8
This shows the quantity of workers that will be hired
at different wages

Wage Rate
Q
$100
80
60
40
20
D=MRP
Quantity of Workers
Demand=MRP
1 2 3 4 5 6 7 8
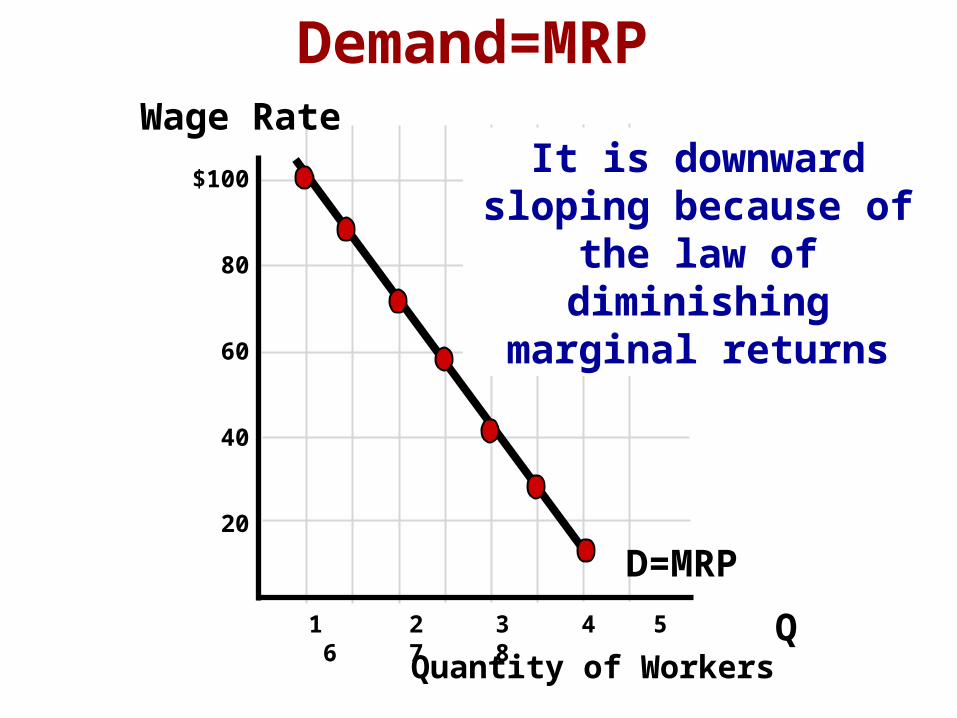
Why is it downward sloping?
Because of the law of diminishing marginal
returns.

Wage Rate
Q
$100
80
60
40
20
D=MRP
Quantity of Workers
Demand=MRP
1 2 3 4 5 6 7 8
Each worker is less productive and therefore
is worth less than the previous

Shifters of Demand
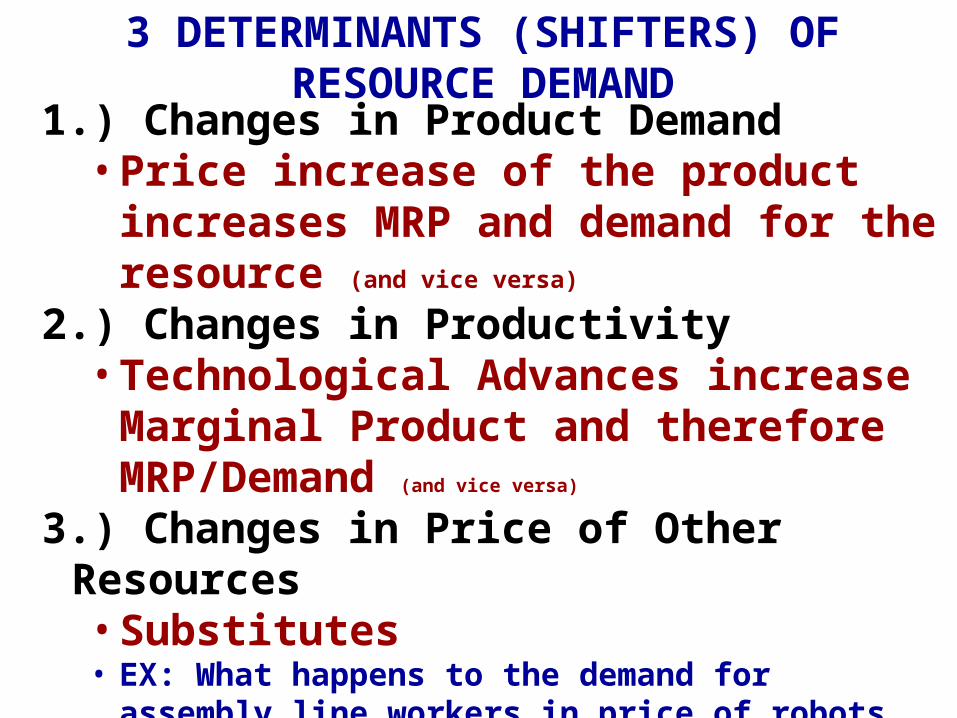
3 DETERMINANTS (SHIFTERS) OF RESOURCE DEMAND
1.) Changes in Product Demand• Price increase of the product increases MRP
and demand for the resource (and vice versa)
2.) Changes in Productivity• Technological Advances increase Marginal
Product and therefore MRP/Demand (and vice versa)
3.) Changes in Price of Other Resources• Substitutes• EX: What happens to the demand for assembly line
workers in price of robots falls?
• Compliments• Ex: What happens to the demand for software writing
programs if the wage paid to software engineers falls?

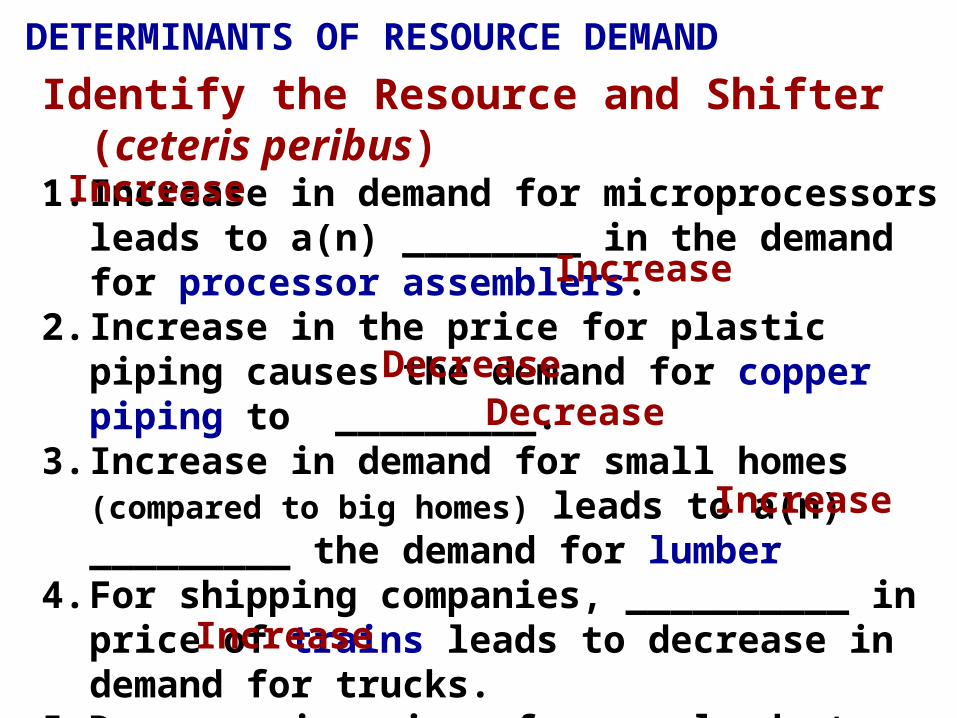
DETERMINANTS OF RESOURCE DEMAND
Identify the Resource and Shifter (ceteris peribus)1. Increase in demand for microprocessors leads to a(n)
________ in the demand for processor assemblers.2. Increase in the price for plastic piping causes the
demand for copper piping to _________.3. Increase in demand for small homes (compared to big
homes) leads to a(n) _________ the demand for lumber4. For shipping companies, __________ in price of
trains leads to decrease in demand for trucks.5. Decrease in price of sugar leads to a(n) __________
in the demand for aluminum for soda producers.6. Substantial increase in education and training leads
to an ___________ in demand for skilled labor.
Increase
Increase
DecreaseDecrease
Increase
Increase

Revisiting Current Trends Top 5 Fasting Growing Jobs (2000-2010)
1. Computer Software Engineers, Applications2. Computer Support Specialists3. Computer Software Engineers, Systems4. Computer Systems Administrators5. Data Communications Analyst
Top 5 Fastest Declining Jobs1. Railroad Switch Operators2. Shoe Machine Operators3. Telephone Operators4. Radio Mechanics5. Loan Interviewers
“You’ve got to learn computers!”

Drawing the Demand for Resources
In the perfectly competitive labor market, the falling portion of MRP is the firm’s resource demand curve.
Each point on the curve indicates the number of workers the firm is willing and able to hire at different wages.
Example: According to the chart, if wage rate (MRC) was $100 how many workers will they hire?
What if wage rate is $90? $70 $60? $40?
Plot the demand curve for these workers
Demand and MRP
Wage Rate
Q
$100
80
60
40
20
D=MRP
Quantity of Workers
Demand=MRP
1 2 3 4 5 6 7 8
This shows the quantity of workers that will be hired
at different wages
Wage Rate
Q
$100
80
60
40
20
D=MRP
Quantity of Workers
Demand=MRP
1 2 3 4 5 6 7 8
It is downward sloping because of the law of diminishing marginal
returns

Perfectly Competitive
Labor Markets
HELP
WANTED
28C H A P T E R

PURELY COMPETITIVELABOR MARKET
Characteristics:•Many Firms hiring workers
•No one firm large enough to manipulate the market.
•Identical Skills•Firms are “Wage Takers”
Firms can hire as many workers as it needs at a wage set by the industry

How does this compare to supply and demand for products?
Firms Supply and Individuals Demand
Quantity
PriceSupply =
Marginal Cost
Demand =Marginal Benefit
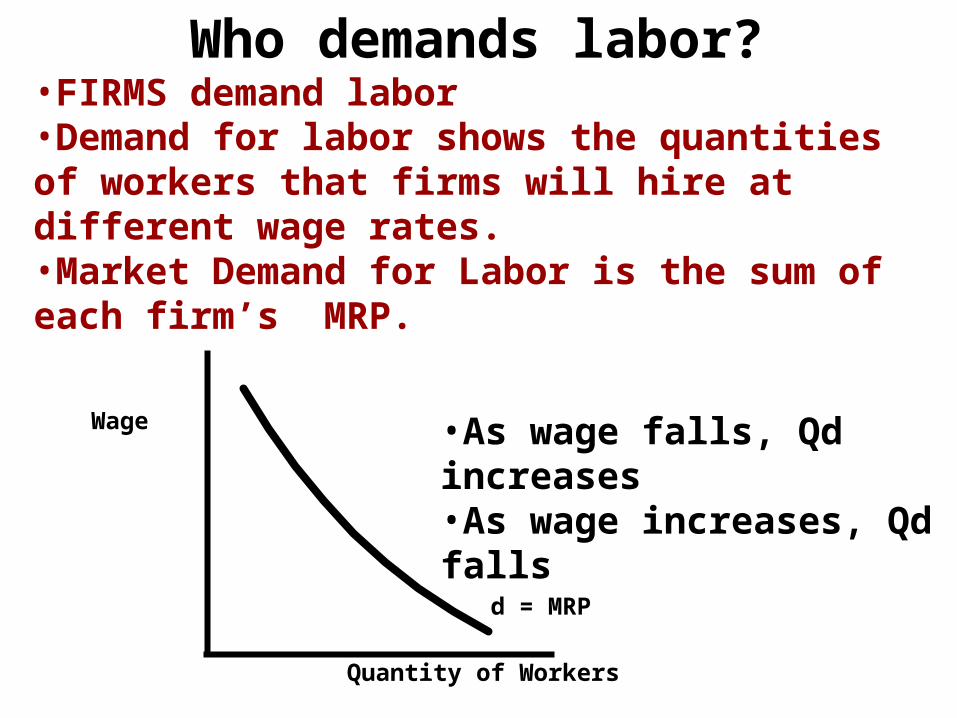
Who demands labor?•FIRMS demand labor•Demand for labor shows the quantities of workers that firms will hire at different wage rates. •Market Demand for Labor is the sum of each firm’s MRP.
d = MRP
Quantity of Workers
Wage •As wage falls, Qd increases•As wage increases, Qd falls
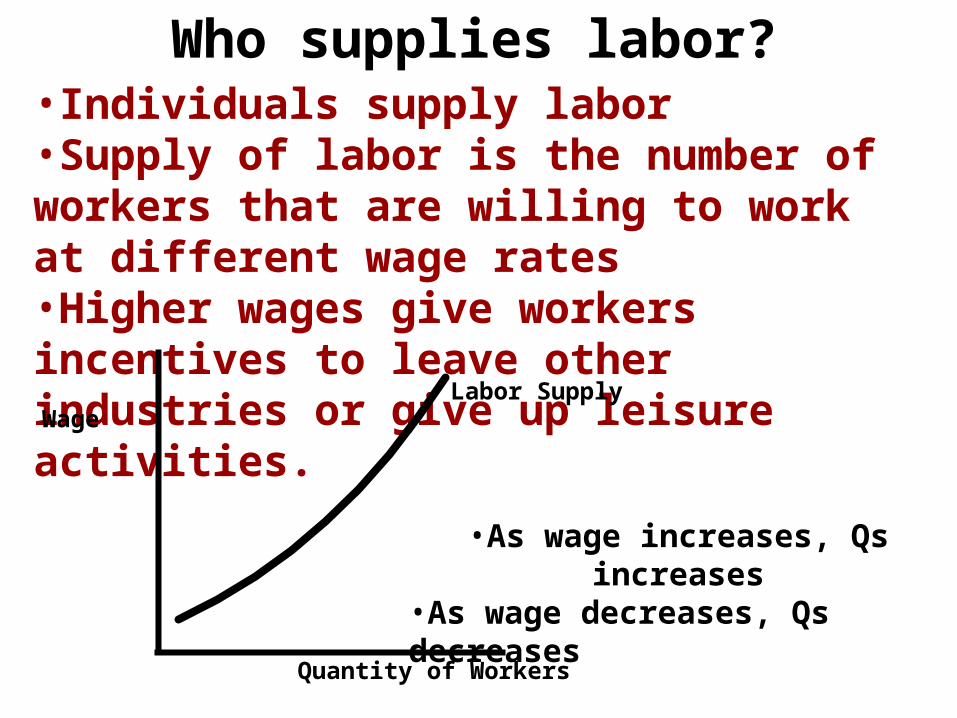
Who supplies labor?•Individuals supply labor•Supply of labor is the number of workers that are willing to work at different wage rates•Higher wages give workers incentives to leave other industries or give up leisure activities.
Quantity of Workers
Wage
•As wage increases, Qs increases•As wage decreases, Qs decreases
Labor Supply
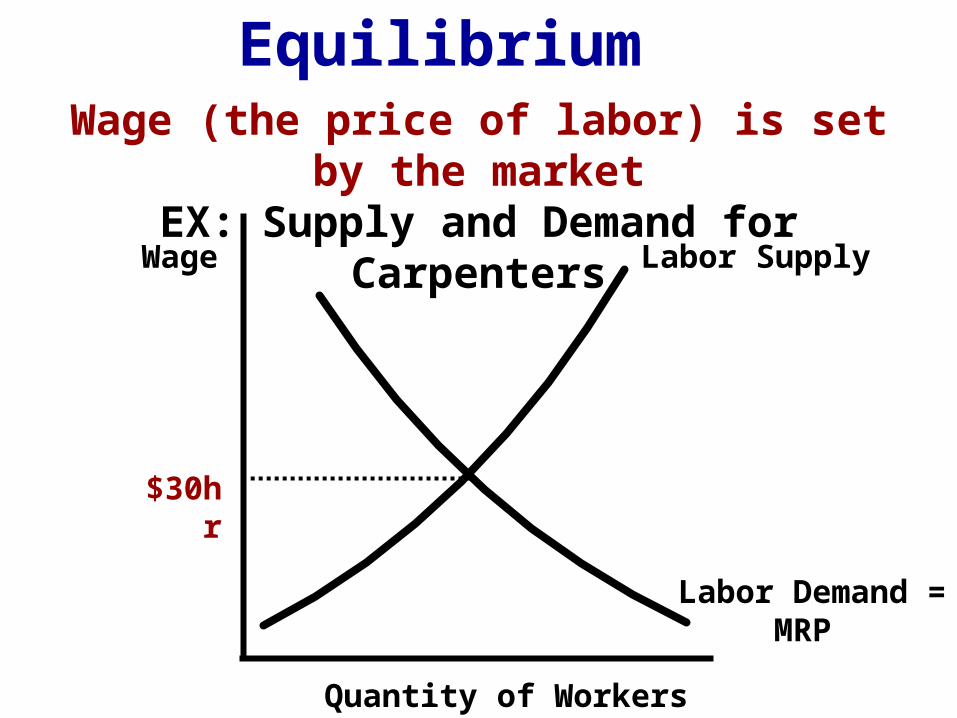
EquilibriumWage (the price of labor) is set by the market
EX: Supply and Demand for Carpenters
Quantity of Workers
Wage Labor Supply
Labor Demand =MRP
$30hr
Draw and label both at wage set at $10
Labor Market
S
D = MRP( mrp’s)
Wc
(1000)
Individual Firm
S = MRC
d = mrp
Wc
Quantity of Labor
Wa
ge
Ra
te (
do
llars
)
Quantity of Labor
($10)
(5)
$10
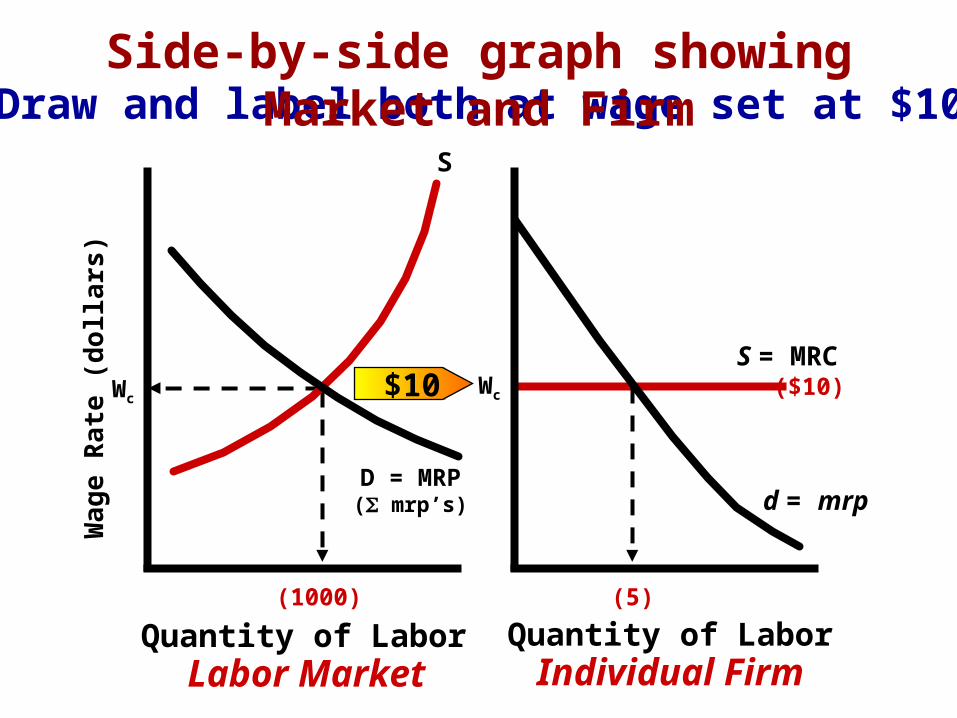
Side-by-side graph showing Market and Firm

Draw and label both at wage set at $10
Labor Market
S
D = MRP( mrp’s)
Wc
(1000)
Individual Firm
S = MRC
d = mrp
Wc
Quantity of Labor
Wa
ge
Ra
te (
do
llars
)
Quantity of Labor
($10)
(5)
$10
Side-by-side graph showing Market and Firm
Marginal ResourceCost (MRC) will be
constant and equal tothe wage set by
the market

Draw and label both at wage set at $10
Labor Market
S
D = MRP( mrp’s)
Wc
(1000)
Individual Firm
S = MRC
d = mrp
Wc
Quantity of Labor
Wa
ge
Ra
te (
do
llars
)
Quantity of Labor
($10)
(5)
$10
Side-by-side graph showing Market and Firm
All workers will supply their labor
at the wage set by the market ($10).

LaborCosts
Where is Labor Costs?Wage x Number of Workers
Labor Market
S
D = MRP( mrp’s)
Wc
(1000)
Individual Firm
S = MRC
d = mrp
Wc
Quantity of Labor
Wa
ge
Ra
te (
do
llars
)
Quantity of Labor
($10)
(5)
$10 $10 $10 $10 $10 $10
Total Labor Cost = Wage Rate x # of
workers
LaborCosts
Labor Market
S
D = MRP( mrp’s)
Wc
(1000)
Individual Firm
S = MRC
d = mrp
Wc
Quantity of Labor
Wa
ge
Ra
te (
do
llars
)
Quantity of Labor
($10)
(5)
$10 $10 $10 $10 $10 $10
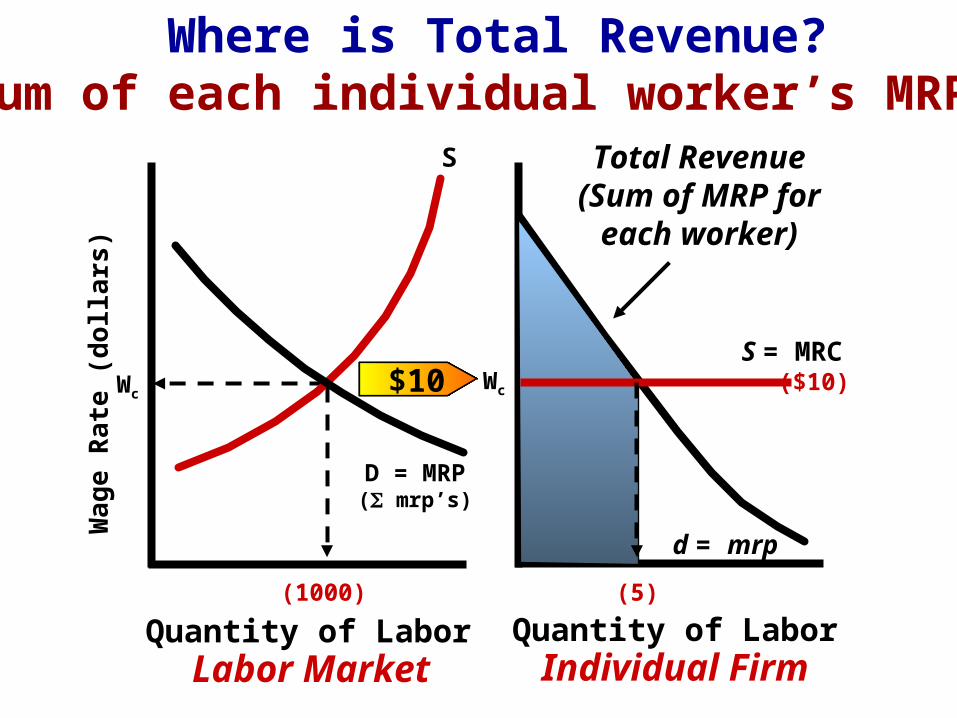
Total Revenue (Sum of MRP for each
worker)
Where is Total Revenue?Sum of each individual worker’s MRP

LaborCosts
PURELY COMPETITIVE LABORMARKET EQUILIBRIUM
Labor Market
S
D = MRP( mrp’s)
Wc
(1000)
Individual Firm
S = MRC
d = mrp
Wc
Quantity of Labor
Wa
ge
Ra
te (
do
llars
)
Quantity of Labor
($10)
(5)
$10 $10 $10 $10 $10 $10
Since TR=TC in perfect competition,
this area is…
Non-LaborCosts

Minimum Wage

S
Wage
Q Labor
D
Fast Food CooksHigh supply leads to low wage
$10
876
$5432
106 7 8 9
Not enough to live on, so…
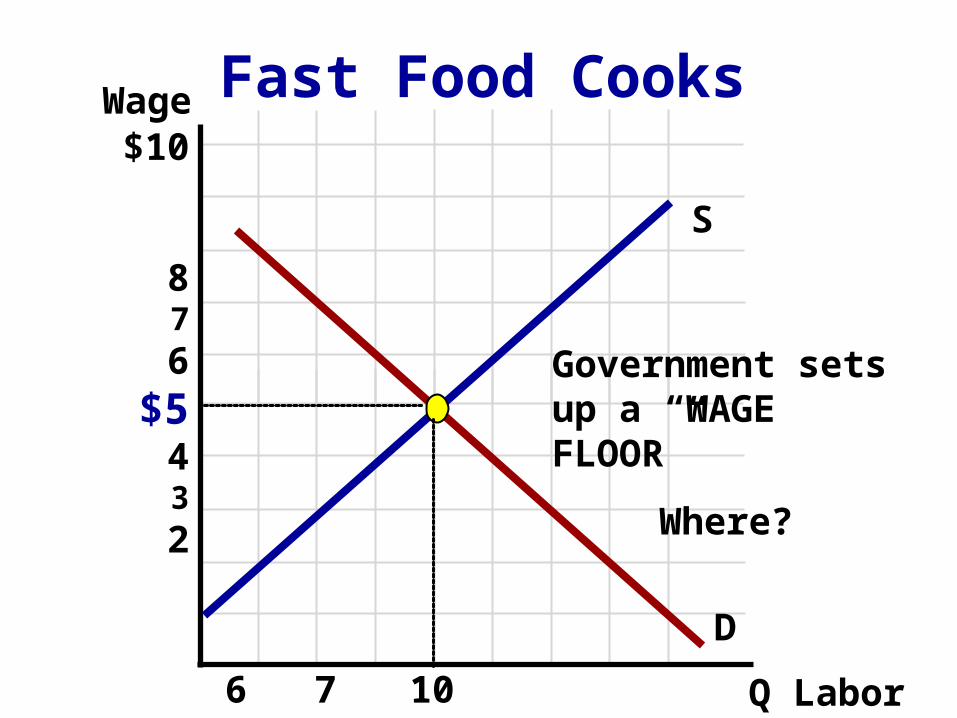
S
Wage
Q Labor
D
Fast Food Cooks $10
876
$5432
106 7 8 9
Government sets up a “WAGE FLOOR”
Where?
S
Wage
Q Labor
D
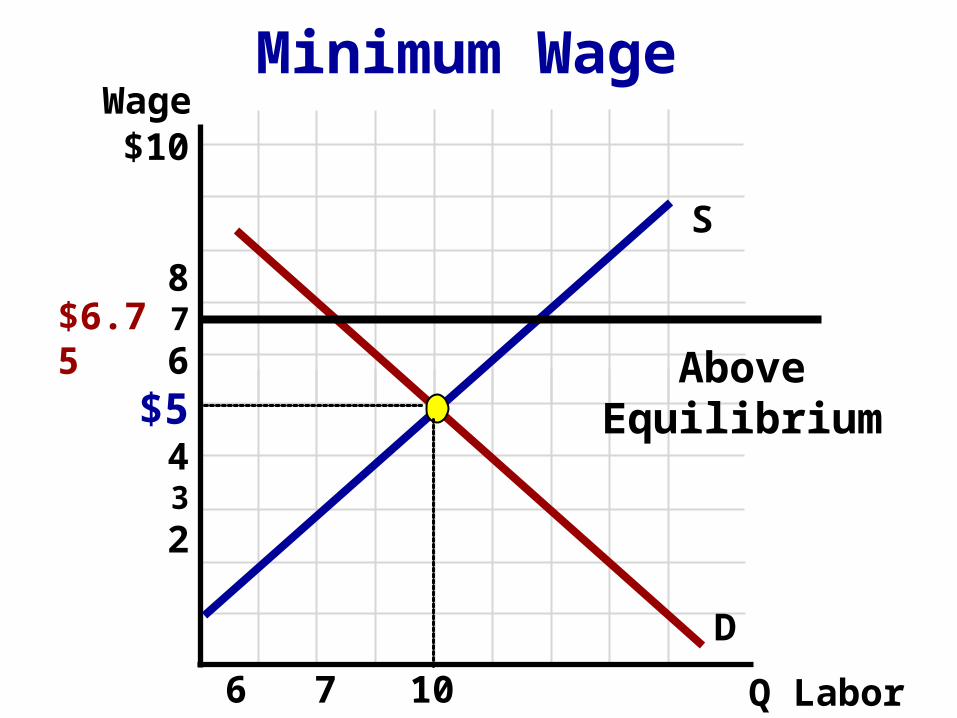
Minimum Wage
$10
876
$5432
106 7 8 9
Above Equilibrium
$6.75

S
Wage
Q Labor
D
Minimum Wage
$10
876
$5432
10 11 126 7 8 9
What’s the result?Q demanded falls
$6.75
Surplus (Unemployment)
Q supplied increases

Analyzing Labor

Use the concept of derived demand to explain this cartoon

Supply and Demand Resource Demand Shifters (Based on MRP)
1. Demand (price) of the product2. Productivity of the resource3. Price of related resources
Resource Supply Shifters1. Number of qualified workers
• Education, training, & abilities required2. Government regulation/licensingEx: What if waiters had to obtain a license to serve food?3. Personal values and traditions regarding leisure
time and societal rolls.Ex: Why did the US Labor supply increase during WWII?
Why do some occupations get paid more than others?

With your partner...Use supply and demand analysis to explain why surgeons earn an average salary of $137,050 and
gardeners earn $13,560.
Quantity of Workers
Wag
e Rate
SL
DL
Supply and Demand For Surgeons Supply and Demand For Gardeners
Quantity of Workers
Wag
e Rate
SL
DL

What are other reasons for differences in wage?
Labor Market Imperfections- • Insufficient/misleading job information-
•This prevents workers from seeking better employment.
• Geographical Immobility- •Many people are reluctant or to poor to move so they accept a lower wage
• Unions •Collective bargaining and threats to strike often lead to higher that equilibrium wages
• Wage Discrimination-•Some people get paid differently for doing the same job based on race or gender (Very illegal!).

PURELY COMPETITIVE LABOR MARKETS
VS.IMPERFECTLY
COMPETITIVE LABOR MARKETS

Tell the person next to you what they look like and why
Labor Market
S
D = MRP( mrp’s)
Wc
(1000)
Individual Firm
S = MRC
d = mrp
Wc
Quantity of Labor
Wa
ge
Ra
te (
do
llars
)
Quantity of Labor
($10)
(5)
$10
Perfectly Competitive Market and Firm

Imperfect Competition:
Monopsonies

MONOPSONY MODEL (A Monopoly for Labor)
1. Only one firm hiring a type of labor • Instead of a single seller, there is a single buyer2. The type of labor is relatively immobile3. Firm is a “Wage Maker”• To hire additional workers this firm MUST increase
the wage.Examples:1. Central American Sweat Shops2. Midwest small town with a large Car Plant3. NCAA
Characteristics:

Assume that this firm CAN’T wage discriminate and must pay each worker the same wage.
Acme Coal Mining Co.Wage rate (per hour)
Number ofWorkers
Marginal Resource Cost
$4.00 0
4.50 1
5.00 2
5.50 3
6.00 4
7.00 5
8.00 6
9.00 7
10.00 8

Assume that this firm CAN’T wage discriminate and must pay each worker the same wage.
Acme Coal Mining Co.Wage rate (per hour)
Number ofWorkers
Marginal Resource Cost
$4.00 0 -
4.50 1 $4.50
5.00 2 5.50
5.50 3 6.50
6.00 4 7.50
7.00 5 11
8.00 6 13
9.00 7 15
10.00 8 17
MRC doesn’t equal wage

Wa
ge
Ra
te (
do
llars
)S
Quantity of Labor
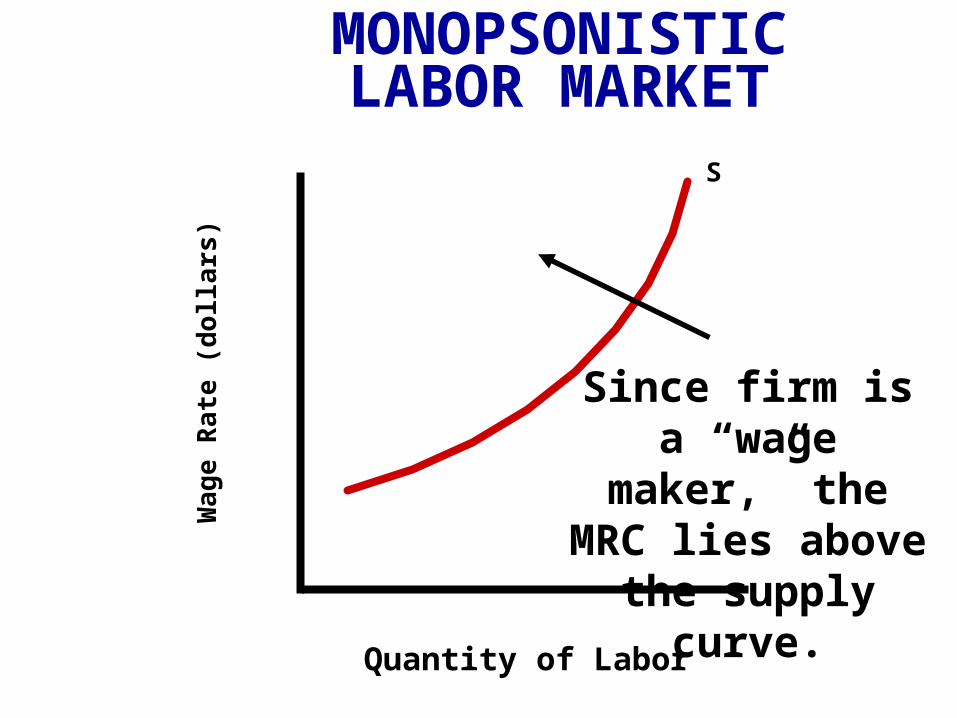
MONOPSONISTICLABOR MARKET
SL-The number of workers that are willing to work at
different wage rates
Wa
ge
Ra
te (
do
llars
)S
Quantity of Labor
MONOPSONISTICLABOR MARKET
Since firm is a “wage maker,” the MRC lies above the
supply curve.

Wa
ge
Ra
te (
do
llars
)
MRP
S
Wm
Quantity of Labor
MRC
Qm
MONOPSONISTICLABOR MARKET
MRP = MRC
Wage workers
are willing to work for

Wa
ge
Ra
te (
do
llars
)
MRP
S
Wm
Quantity of Labor
MRC
Wc
Qm Qc
The competitivesolution would
result in a higherwage and greater
employment.
MONOPSONISTICLABOR MARKET

Wa
ge
Ra
te (
do
llars
)
MRP
S
Wm
Quantity of Labor
MRC
Wc
Qm Qc
The competitivesolution would
result in a higherwage and greater
employment
MONOPSONISTICLABOR MARKET
Monopsonists maximizeprofits by hiring a smaller
number of workers andpaying a less-than-
competitive wage rate.

Labor UnionsOrganizations that seek to unify workers and
use collective bargaining to negotiate and secure their benefits.

Two Types of UnionsCraft (Trade) Unions-
•Unifies workers in a specific career field. •Limits supply of qualified workers •Examples: Teachers, Lawyer, Carpenters, Doctors, Plumbers, etc.
Industrial Unions-•Unifies workers in specific industries regardless of job. •By getting all workers, the union can more effectively negotiate with management•Examples: Steelworkers, automobile workers, supermarket workers, etc.

5 Goals of UnionsAll goals revolve around
increasing wagesWhat are the only two ways to increase
wages?

Wag
e R
ate
(do
llar
s)
D1
S
Quantity of Labor
Wc
Qc
Increase Demand for Union Labor

Wu
Qu
Wag
e R
ate
(do
llar
s)
D1
S
Quantity of Labor
Wc
Qc
D2
Increase Demand for Union Labor

How do Unions Increase Demand?
Goals1. Getting Consumers to buy only Union Products
Ex: Advertising the quality of union/domestic products
2. Lobbying government officials to increase demandEx: Teacher’s Union petitions governor to
increase spending.3. Increase the price of substitute resources
Ex: Unions support increases in minimum wage so employers are less likely to seek non-union workers

Wag
e R
ate
(do
llar
s)
D
Quantity of Labor
Wc
Qc
S1
Limit Supply of Qualified Workers

Wu
Wag
e R
ate
(do
llar
s)
D
Quantity of Labor
Wc
QcQu
S1
S2
Limit Supply of Qualified Workers

How do Unions Decrease Supply?
Goals4. Lobbying government to increase licensing for
specific careers (Often used by craft unions).Ex: Cosmetologist seek to increase requirements
and mandatory training, limiting supply
5. Getting all workers to supply their labor at a higher than equilibrium wage. (Often used by industrial unions) .Ex: Steelworker threaten to strike unless wage
increase by 15%.

Wu
Wag
e R
ate
(do
llar
s)
D
Quantity of Labor
Wc
QcQu
D
Organizing virtually all workers and demanding higher wages they control the supply curve for labor
S
Qe