united states genetic variation and forest service seed
TRANSCRIPT
United States Department of Agriculture
Forest Service
Pacific Northwest Research Station
Research Paper PNW-RP-468 February 1994
Genetic Variation and Seed Transfer Guidelines for Ponderosa Pine in the Ochoco and Malheur National Forests of Central Oregon Frank C. Sorensen and John C. Weber

Authors FRANK C. SORENSEN is principal plant geneticist and JOHN C. WEBER was a geneticist, Forestry Sciences Laboratory, 3200 S.W. Jefferson Way, Corvallis, Oregon 97331. John Weber is currently a scientist, forest genetics, International Centre for Research in Agroforestry, Niamey, Niger.

Abstract
Summary
Sorensen, Frank C.; Weber, John C. 1994. Genetic variation and seed transfer guidelines for ponderosa pine in the Ochoco and Malheur National Forests of central Oregon. Res. Pap. PNW-RP-468. Portland, OR: U.S. Department of Agriculture, Forest Service, Pacific Northwest Research Station. 30 p.
Adaptive genetic variation in seed and seedling traits was evaluated for 280 families from 220 locations. Factor scores from three principal components were related by multiple regression to latitude, longitude, elevation, slope, and aspect of the seed source, and by classification analysis to seed zone and elevation band in seed zone. Location variance was significant but not large. Multiple regression equations explained less than 50 percent of location variance. Slope-aspect variables were important.
Keywords: Pinus ponderosa, seedlings, breeding zones, provenance, genetic variation, adaptive variation, genetic diversity.
Adaptive genetic variation in seed and seedling traits was analyzed among 280 fam- ilies from 220 locations in a band 120 kilometers north-south and 290 kilometers east- west from the crest of the Cascade Range east across the Deschutes, Ochoco, and Malheur National Forests of central Oregon. Three principal components were derived from location-related variation in selected traits. Factor scores were calculated for each family. Location variation was related by multiple regression to latitude, longi- tude, elevation, slope, and aspect of the seed source. Variation was also analyzed with classification models by using geographic zones, elevation bands in zones, and locations in bands. Additional classifications including several conifer groupings and soil characteristics also were tried.
Location variance was highly significant but not large. Multiple-regression equations explained less than 50 percent of the location variance. Much location variance was associated with slope-aspect variables alone and in interaction with geographic fac- tors. In the classification analyses, elevation bands were significant for the first two principal components, but seed zones were nonsignificant for all principal compo- nents. Lack of fit to the models seemed to be greater in the Deschutes than in the Ochoco and Malheur National Forest areas.
Provisional seed-transfer guidelines based on the first two principal components are presented in two forms for the area of the Ochoco and Malheur National Forests. First, a regression equation is presented that can be used to estimate the risks of transfer between specific seed origins and specific planting sites. Second, if a zoning system is used, it is proposed that the area be subdivided into two east-west blocks with the dividing line about 120 ° W. longitude, and that elevation bands be 300 meters wide below 1550 meters and narrower above that elevation.

Contents
5
6
7
8
9
9
10
12
14
17
18
18
20
23
23
24
24
27
Introduction
Purposes
Materials and Methods
Sampling
Seed Traits
Measured Seedling Traits
Derived Seedling Traits
Principal Component Analysis
Regression Analyses
Classification Analyses
Seed-Transfer Risk Evaluation
Results
Factor Scores
Family Variation Among and Within Locations
Regression Analysis
Classification Analyses
Discussion
Seed Transfer Guidelines
Seed Transfer Equation and Application
New Block Designations
Seed Orchard Siting
Conclusion
Acknowledgments
Literature Cited
Appendix

Introduction Ponderosa pine (Pinus ponderosa Dougl. ex Laws.) is a widespread and commercially important conifer in Western North America (Conkle and Critchfield 1988, Critchfield and Little 1966). Interest was expressed early in its broad-scale geographic variation (Kempff 1928; Mirov and others 1952; Munger 1938; Squillace and Silen 1962; Wells 1964a, 1964b) and in potential problems associated with seed transfer (Hayes 1913). More recently, geographic variation has been investigated in various parts of the range, particularly in the Rocky Mountains (for example, Larsen 1966; Read 1983; Rehfeldt 1986, 1990a). In the central Rocky Mountains, there is evidence for local genetic differentiation (Linhart and others 1981, and further analysis of their data by Gregorius and Roberds 1986).
No reports of geographic variation in Oregon ponderosa pine in and east of the Cas- cade Range have been published, and few of the wide range studies have included families from central Oregon. Based on a single Ochoco National Forest (NF) source, Wells (1964a) included Oregon east of the Cascades in his North Plateau ecotype of Pinus ponderosa var. ponderosa. Smith (1977) grouped ponderosa provenances by using terpene composition. Oregon samples from the Oregon Cascades and the Warner Mountains were assigned to the Cascade-Northern Region, which extended north from the southern Oregon Cascades and east across the Rocky Mountains of the Northern United States to the Black Hills. An earlier investigation (Smith and others 1969) included a few more Oregon sources and separated the Cascade region from the northern Rocky Mountains and included the single source from the Blue Mountains (northeast Oregon) in the latter region.
Published information about geographic variation in central Oregon also is lacking for most other forest species. One exception is a common garden nursery study of Douglas-fir (Pseudotsuga menziesii (Mirb.) Franco), which included a transect of sam- ples at about 44.5" N. latitude from the Cascade Range east across the Ochoco Mountains (Sorensen 1979). In this study, longitudinal and elevational differences were both highly significant, but the former particularly strong. Between the east side of the Cascades and central Oregon (about 100 kilometers), location differences were equivalent to an elevational difference of 850 meters (based on log diameter) to 1500 meters (based on date of budset). The pattern of allozyme variation in Oregon Douglas-fir also indicated a steep cline east from the Cascade Range for about 400 kilometers (Li and Adams 1989, fig. 3A). Differences in some cortical monoterpenes showed a steep change to almost a break between the Oregon Cascades and the Ochoco Mountains (von Rudloff and Rehfeldt 1980, Zavarin and Snajberk 1973).
Since 1966, transfer of forest seed in Oregon and Washington has been guided by tree seed zone (Tree Seed Zone Map 1973). The purpose of the maps was to control distribution of planting stock raised from natural-stand seed of known origin. With the initiation of tree improvement programs, the maps have been refined by adding "breeding blocks," or geographic units within which the progeny of a designated im- proved population could be used. Of necessity, these zones and blocks were created without foreknowledge of geographic patterns of genetic variation. Figure 1 shows seed zones for the present sample area.
~2s i i t i / ! ~ ~ . . 6 7 2 ~ O Z _ i l L L . . , 9 2 1 ~..[ 922 o L I - , i I
141 .... ~-'i 1 i"~"'l~'-'"'t'""~'"l! _ _ ~ i l ' ! "''~" - "~! ............. ~ ~ ! , . . . ~ . . . . . . [ " . . . . . . . . . . . . i : i " " ~ ........... ~'~ f- ..,--..,~--w! . . . . . . . . . . . . t ........ T . . . . . . . . . . . ! ~ i •
15 ~. I • ' ' i ~ i ' •
= = En , ~ ~ , .~. ~...~. 941 i " -t-- ~ i t + r"T . . . . . . . . . . . . . ~ ! i
.........
i t d ' ~ ! =: :, i I o • ~ io ~
~ r7]~7 ' ~ T ~ i i '~- --;-7 ~ ~ [ ~ , ~ 7 ~! •
SE I 7 8 9 10 11 12 13 14 I 15 t6 17 18 19 20 21 22 ~23 24 25 26 27 28 29 30
. ' - ~ : " ~ 8 9 2 , , ~
122 ° W 121°W 120 ° W 119 ° W
-43 '30 ' N
44 ° N
"44°30" N
P u r p o s e s
M a t e r i a l s a n d
M e t h o d s
Sampling
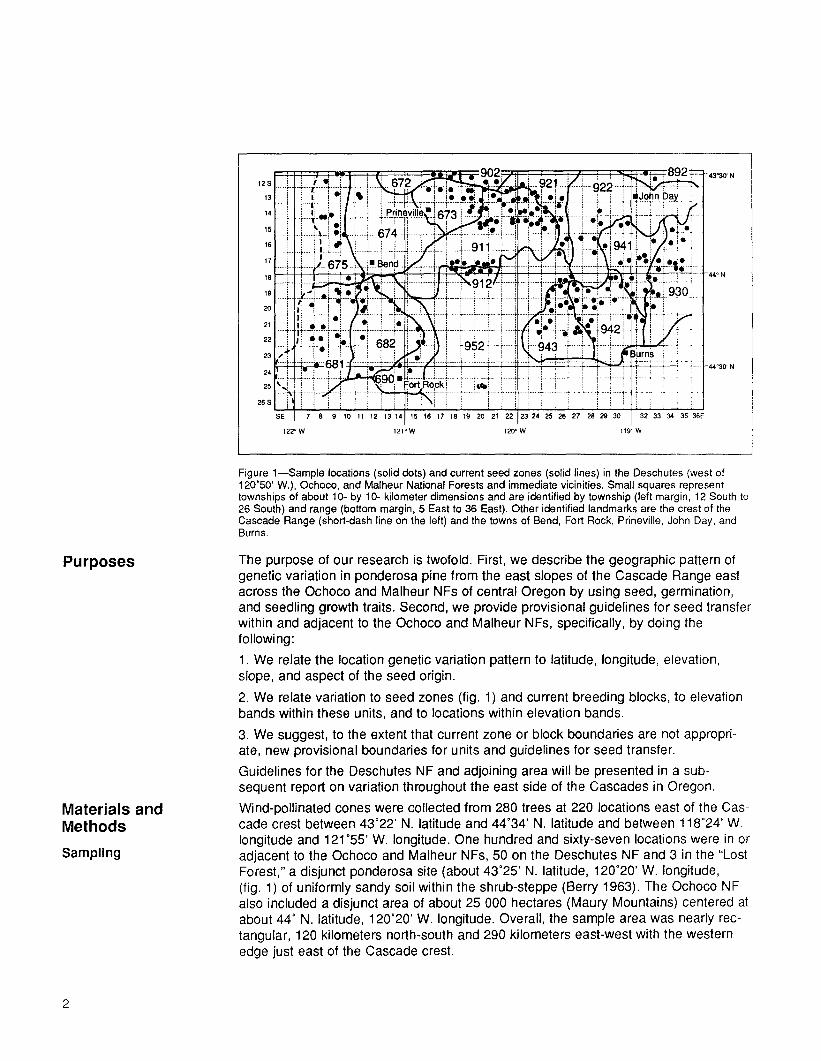
Figure 1--Sample locations (solid dots) and current seed zones (solid lines) in the Deschutes (west of 120"50' W.), Ochoco, and Malheur National Forests and immediate vicinities. Small squares represent townships of about 10- by 10- kilometer dimensions and are identified by township (left margin, 12 South to 26 South) and range (bottom margin, 5 East to 36 East). Other identified landmarks are the crest of the Cascade Range (short-dash line on the left) and the towns of Bend, Fort Rock, Prineville, John Day, and Burns.
The purpose of our research is twofold. First, we describe the geographic pattern of genetic variation in ponderosa pine from the east slopes of the Cascade Range east across the Ochoco and Malheur NFs of central Oregon by using seed, germination, and seedling growth traits. Second, we provide provisional guidelines for seed transfer within and adjacent to the Ochoco and Malheur NFs, specifically, by doing the following:
1. We relate the location genetic variation pattern to latitude, longitude, elevation, slope, and aspect of the seed origin.
2. We relate variation to seed zones (fig. 1) and current breeding blocks, to elevation bands within these units, and to locations within elevation bands.
3. We suggest, to the extent that current zone or block boundaries are not appropri- ate, new provisional boundaries for units and guidelines for seed transfer.
Guidelines for the Deschutes NF and adjoining area will be presented in a sub- sequent report on variation throughout the east side of the Cascades in Oregon.
Wind-pollinated cones were collected from 280 trees at 220 locations east of the Cas- cade crest between 43°22 , N. latitude and 44°34 ' N. latitude and between 118°24 ' W. longitude and 121"55' W. longitude. One hundred and sixty-seven locations were in or adjacent to the Ochoco and Malheur NFs, 50 on the Deschutes NF and 3 in the "Lost Forest," a disjunct ponderosa site (about 43°25 , N. latitude, 120°20 , W. longitude, (fig. 1) of uniformly sandy soil within the shrub-steppe (Berry 1963). The Ochoco NF also included a disjunct area of about 25 000 hectares (Maury Mountains) centered at about 44 ° N. latitude, 120°20 , W. longitude. Overall, the sample area was nearly rec- tangular, 120 kilometers north-south and 290 kilometers east-west with the western edge just east of the Cascade crest.

At 60 locations, cones were collected from two trees separated by 100 meters mini- mum but representing the same site. Pairs were used to estimate average variance among families within locations. This variance was used to test the significance of variation among locations. Forty-nine of the 60 locations with paired trees were in the Ochoco and Malheur NFs.
In most of the Ochoco and Malheur NFs, sampling intensity averaged two locations per township (squares of about 100 square kilometers) of commercial forest. More than two locations were sampled if the local elevational range was large or if local site differences seemed large. In the Deschutes NF, sampling intensity was about one lo- cation per township. The Deschutes NF is separated from the Ochoco NF by a plain 50 or more kilometers wide (fig. 1). The plain has no ponderosa pine. Deschutes samples were included primarily to test for differences between the ponderosa pine on the east slopes of the Cascades and in the Ochoco Mountains.
Latitude, longitude, elevation, aspect, and slope were recorded for each location. Vari- ables were entered into regression equations in the following forms: latitude in de- grees minus 43 (L), longitude in degrees minus 118 (D), and elevation in meters (E). Slope and aspect, both in degrees, were transformed (Stage 1976) to create three variables: tangent slope (T), sine aspect x tangent slope (A), and cosine aspect x tangent slope (B).
Mean sample latitude was 44"04' N.; mean longitude 120"04' W.; mean elevation 1515 meters, range 853 to 2012 meters; mean slope 7", range 0 to 36". Six of the linear correlations among geographic variables identifying locations were significant (table 1), but only three coefficients of determination (R 2) approached or were larger than 0.10. Elevations of sample sites increased from west to east (R 2 = 0.259, p < 0.001). Because slope-aspect effects were important, we note their relation with geo- graphy (table 1). Slopes of sample locations increased slightly from south to north (R z = 0.086, p < 0.001); sample locations on south a s2pects were more frequently on steep slopes than were locations on north aspects (R = 0.229; p < 0.001). The weakly negative A x B correlation (table 1) occurred because the steepest slopes tended to be in the southeast quadrant of azimuth, thereby giving a tail of coordinates with large positive values from the sine of the aspect and large negative values from the cosine.
Locations also were classified according to "seed zones" (Tree Seed Zone Map 1973) (fig. 1)and elevation bands within zones. Initial classification used 300-meter bands starting at 850 meters, but other band widths were tried. A second classification used current '1~reeding blocks." Breeding block designation included a geographic bound- ary usually coinciding with a Ranger District boundary on Forest Service land and an elevation band. Elevation bands in all but two cases were 305 meters (1,000 feet) wide, but the upper and lower elevations for bands differed among breeding blocks, depending on the elevational distribution of the managed forest. The two bands not 305 meters wide were 245 meters wide (800 feet). Sites also were classified by sev- eral conifer groupings and three soil characteristics. Conifer groups were identified at the site; soil types were based on National Forest Soil Resource Inventory Maps (Weber 1988). The best conifer grouping used five classes: ponderosa pine only, pon- derosa pine and western juniper (Juniperus occidentalis Hook), ponderosa pine and Douglas-fir with or without western juniper, ponderosa pine with Iodgepole pine (Pinus contorta Dougl. ex Loud.) and any other conifer, and ponderosa pine in any other combination. The best soil classification was based on rock volume. We used six equally spaced classes from 0 to 60 percent rock volume.
3
Seed Traits
Measured Seedling Traits
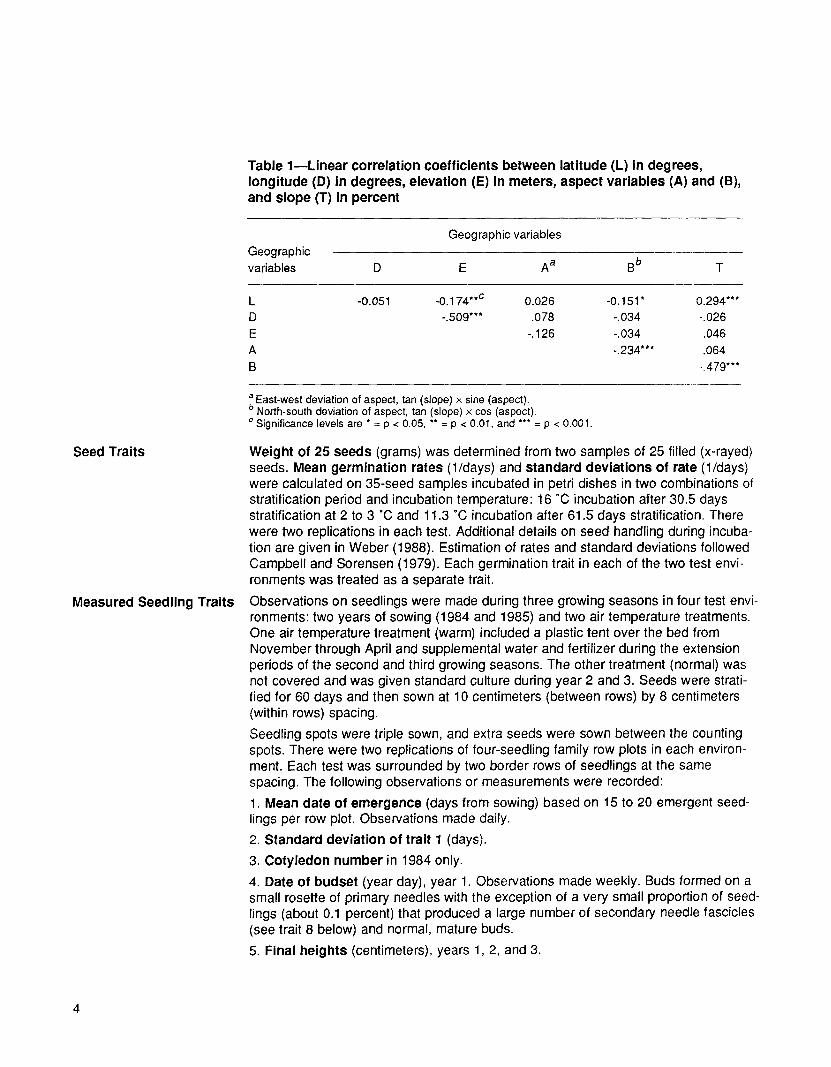
Table 1--Linear correlation coefficients between latitude (L) in degrees, longitude (D) in degrees, elevation (E) in meters, aspect variables (A) and (B), and slope (T) in percent
Geographic variables Geographic variables D E A a B b T
L -0.051 -0.174 **c 0.026 -0.151 * 0.294*** D -.509"** .078 -.034 -.026 E -. 126 -.034 .046 A -.234*** .064 B -A79"**
a East-west deviation of aspect, tan (slope) x sine (aspect). b North-south deviation of aspect, tan (slope) × cos (aspect). c Significance levels are * = p < 0.05, ** = p < 0.01, and *** = p < 0.001.
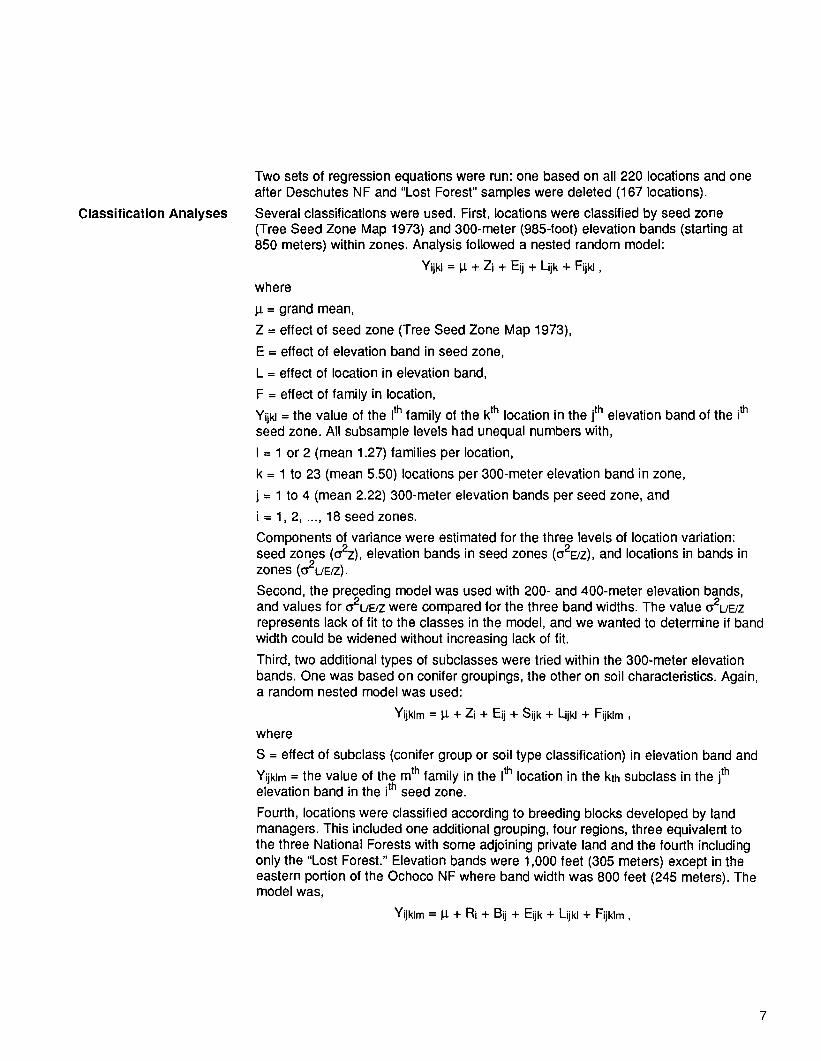
Weight of 25 seeds (grams) was determined from two samples of 25 filled (x-rayed) seeds. Mean germination rates (1/days) and standard deviations of rate (1/days) were calculated on 35-seed samples incubated in petri dishes in two combinations of stratification period and incubation temperature: 16 "C incubation after 30.5 days stratification at 2 to 3 °C and 11.3 °C incubation after 61.5 days stratification. There were two replications in each test. Additional details on seed handling during incuba- tion are given in Weber (1988). Estimation of rates and standard deviations followed Campbell and Sorensen (1979). Each germination trait in each of the two test envi- ronments was treated as a separate trait.
Observations on seedlings were made during three growing seasons in four test envi- ronments: two years of sowing (1984 and 1985) and two air temperature treatments. One air temperature treatment (warm) included a plastic tent over the bed from November through April and supplemental water and fertilizer during the extension periods of the second and third growing seasons. The other treatment (normal) was not covered and was given standard culture during year 2 and 3. Seeds were strati- fied for 60 days and then sown at 10 centimeters (between rows) by 8 centimeters (within rows) spacing.
Seedling spots were triple sown, and extra seeds were sown between the counting spots. There were two replications of four-seedling family row plots in each environ- ment. Each test was surrounded by two border rows of seedlings at the same spacing. The following observations or measurements were recorded:
1. Mean date of emergence (days from sowing) based on 15 to 20 emergent seed- lings per row plot. Observations made daily.
2. Standard deviation of trait 1 (days).
3. Cotyledon number in 1984 only.
4. Date of budset (year day), year 1. Observations made weekly. Buds formed on a small rosette of primary needles with the exception of a very small proportion of seed- lings (about 0.1 percent) that produced a large number of secondary needle fascicles (see trait 8 below) and normal, mature buds.
5. Final he ights (centimeters), years 1, 2, and 3.
4

Derived Seedling Traits
Principal Component Analysis
6. Three Intermediate height measurements (centimeters) in year 2, and two in year 3.
7. Final diameters (millimeters), years 2 and 3.
8. Secondary needle score at the end of year 1, 0 = no secondary needles, 1 = 1-5 fascicles, 2 = more than 5 fascicles.
9. Needle length (millimeters) of a fully extended fascicle 2-4 centimeters below the end of the shoot at the end of year 2.
10. Top and root weights (natural logarithms of grams) after drying at 45 to 50" C.
1. Early or late growth proport ion (early or late height increment divided by seedling height at beginning of growth period). These traits were used as substitutes for phe- nological observations, which were difficult to make after the first year.
2. Relative height or diameter growth rate
[(In sizen+l - In sizen)/time], where time = 1 year.
3. Height:diameter ratios at the ends of years 2 and 3.
4. Difference in height:diameter ratios, year 3 - year 2.
5. Top:root dry weight ratios, year 3.
Each trait in each of the four environments was treated as a separate trait.
In all, 108 individual traits were analyzed. Traits with nonsignificant (p < 0.05) location variance when tested against the mean square for families-in-locations (table 2) and traits occurring early in the life cycle that had a high genetic correlation (R 2 > 0.90) with later-measured traits were deleted. Twenty-one traits were retained and included in the principal component analysis (table 3).
Principal component analysis and factor score determinations followed procedures of Campbell (1979, 1986) and Campbell and Sugano (1987). Briefly, components of covariance were analyzed (Griffing 1956, Kempthorne 1957), and genetic correlation coefficients calculated at the location and family-in-location levels (Morrison 1967). A principal component analysis was used to summarize the location-related variation only; the analysis was run on the matrix of location-level correlation coefficients. Fac- tor scores for each family (n = 280) were calculated for the first three principal com- ponents. Geographic patterns of variation among locations were evaluated by using regression and classification analyses of factor scores.
Table 2--Analysis of variance format for individual traits in each environment
Sources of variation Degrees of freedom Expected mean squares
Total 559
Blocks 1
Locations 219
Families in locations 60
Remainder 279
o .2 + 2 a 2 F/L + 2.544 o.2L
o.2 + 2 o.2 F/L
o.2

Regression Analyses
Table 3---Seed and seedling traits included in the principal component analysis and their codes
Environment 1984 1985
Normal Warm Normal Warm Trait
Nursery traits:
41BS 41Ht2
41 D2
41TW 41RW
Seed traits: CG WG SW
42Ht3
42DI
51E 52E 52BS
51Ht3 52Ht3
51 D3 52D3 51TW 52TW 51RW 52RW
Date of emergence Date of first year budset Total height, year 2 Total height, year 3 Diameter, year 2 Diameter increment (year 3 - year 2) Diameter, year 3 Top dry weight Root dry weight
Germination rate during cool incubation Germination rate during warm incubation Seed weight
Geographic predictor variables were latitude, longitude, elevation, and the three slope- aspect transformations described above. Factor scores were fitted to a model initially including linear, quadratic, linear x linear, quadratic x linear, and linear x linear x linear terms for the six location variables. A cubic term was included for elevation and for longitude because of the elongated east-west distribution of the sample locations. Two steps were used to build the geographic models. (1) From the preliminary models, backward elimination was used to select equations in which all variables sig- nificantly (p < 0.10) reduced sums of squares (Draper and Smith 1966). The resultant equations relating factor scores to geographic variables were complex and included many higher order interaction terms. (2) To find simpler models that would explain equivalent variation (Robert Westfall 1992), 1 we tried extensions of procedures sug- gested by Box and Draper (1987, p. 205 ff.) Selected highly significant first and second-degree terms were fixed in the full model and backward elimination proce- dures repeated. The best model was assumed to be the one that explained the greatest amount of location variation with the fewest terms and least lack of fit. The second procedure gave a slightly better model with less lack of fit in one case only, the regression for PC-2 using the Ochoco-Malheur NF locations. Lack of fit to the sel- ected equations was tested by using as repeats family values from the 60 locations (49 locations for the Ochoco-Malheur NF) represented by two families each (Draper and Smith 1966). Bias was also evaluated by using Mallows Cp statistic with s 2 esti- mated by families in locations (Daniel and Wood 1971).
7 Personal Communication. 1992. Robert Westfall, Pacific Southwest Experiment Station, P.O. Box 245, Berkeley, CA 94701.
Classification Analyses
Two sets of regression equations were run: one based on all 220 locations and one after Deschutes NF and "Lost Forest" samples were deleted (167 locations).
Several classifications were used. First, locations were classified by seed zone (Tree Seed Zone Map 1973) and 300-meter (985-foot) elevation bands (starting at 850 meters) within zones. Analysis followed a nested random model:
Yijkl = I J. + Zi + Eij + Lijk + Fijkl,
where
p. = grand mean,
Z = effect of seed zone (Tree Seed Zone Map 1973),
E = effect of elevation band in seed zone,
L = effect of location in elevation band,
F = effect of family in location,
Yijkl = the value of the I th family of the k th location in the jth elevation band of the i th seed zone. All subsample levels had unequal numbers with,
I = 1 or 2 (mean 1.27) families per location,
k = 1 to 23 (mean 5.50) locations per 300-meter elevation band in zone,
j = 1 to 4 (mean 2.22) 300-meter elevation bands per seed zone, and
i = 1, 2 ..... 18 seed zones.
Components of variance were estimated for the three levels of location variation: seed zones2 ((~2z), elevation bands in seed zones (~2E/Z), and locations in bands in zones ((~ L/E/Z).
Second, the preceding model was used with 200- and 400-meter elevation bands, and values for O'2L/E/Z were compared for the three band widths. The value o'2L/E/Z represents lack of fit to the classes in the model, and we wanted to determine if band width could be widened without increasing lack of fit.
Third, two additional types of subclasses were tried within the 300-meter elevation bands. One was based on conifer groupings, the other on soil characteristics. Again, a random nested model was used:
Yijklm = ~ + Zi + Eij + Sijk + Lijkl + Fijklm,
where
S = effect of subclass (conifer group or soil type classification) in elevation band and
Yijklm = the value of the m th family in the I th location in the kth subclass in the jth elevation band in the i {h seed zone.
Fourth, locations were classified according to breeding blocks developed by land managers. This included one additional grouping, four regions, three equivalent to the three National Forests with some adjoining private land and the fourth including only the "Lost Forest." Elevation bands were 1,000 feet (305 meters) except in the eastern portion of the Ochoco NF where band width was 800 feet (245 meters). The model was,
Yijklm = IJ. + Ri + Bij + Eijk + Lijkl + Fijklm,
7

Seed-Transfer Risk Evaluation
where
R = effect of region (Ochoco, Malheur, and Deschutes NFs and Lost Forest),
B = effect of breeding block in region,
Yijklm = the value of the m th family in the I th location in k th elevation band of the jth breeding block in the i th region,
m = 1 or 2 (mean 1.27) families per location,
I = 1 to 33 (mean 6.88) locations per elevation band within breeding block,
k = 1 to 4 (mean 2.70) elevation bands per breeding block,
j = 1 to 4 (mean 2.50) breeding blocks per region, and
i = 1, 2, 3, 4 regions.
Initial seed zone and breeding block classifications were analyzed by using all locations and looked specifically at differentiation between the east side of the Cascades and the central Oregon highlands. Models used to develop seed transfer guidelines within the Ochoco and Malheur NFs did not include Deschutes NF and Lost Forest samples.
Two equations were compared for estimating risk (Campbell 1986, Westfall 1992). The R-values for the two equations were linearly related (r = 0.998) over the range, R = 0.03 to R = 0.50. The Westfall equation gave slightly lower R values, 0.075 vs. 0.10 at the lower end and 0.45 vs. 0.50 at the higher end of the risk spectrum. Values reported in this paper are based on the Campbell equation, primarily because it is a little more conservative.
In estimating seed-transfer risk (R), we attempted to determine the adaptive genetic "mismatch" between the population of seedlings being transferred and a population native to the planting site. The local population probably always includes extreme types, which stabilizing selection removes. Year-to-year climatic fluctuations, among other factors, also may cause variable directional selection. For purposes of estima- tion, we nevertheless assumed that the local population represented adaptation to the site, and deviations from the local population represented adaptive "mismatch."
Additive genetic variance among pooled families-in-locations was used to scale risk. Additive genetic variance was calculated as 3O'2F/L. The coefficient 3 was used because of the likelihood of pollination among trees within family clusters (Squillace 1974) and because of the observed low level of seed produced by self-pollination in central Oregon ponderosa pine (Sorensen and Miles 1974). The v a l u e O2F/L was estimated from locations represented by two families each. It was assumed that their pooled value could be applied over the sample area.
Average seed transfer risk among locations within elevation bands and zones (Rw) was estimated assuming that c~'L/E/Z was normally distributed. In this case, mean distance between points under the normal curve is calculated following Patel and Read (1982),
Xd = O'xi-xj (2//I;)1/2 ,
which simplifies to
Xd = 2C~L/E/Z (1/~) 1/2
where

Results
Factor Scores
Xd = mean distance between two random points within a normal distribution,
xi and xj = random points, and
~L/F_./Z = standard deviation of the appropriate component of variance from the classification analysis.
The estimate of a2L/F./Z, in addition to adaptive variation within the elevation band and zone, included sampling error associated with sample sizes of one and two families per location plus genetic effects such as drift and nonlocal wind pollination. Judging the contribution of human and genetic sampling errors to O'2L/E/Z is somewhat arbitrary, but we assumed that half of Rw represented sampling errors and half represented adaptive differences associated with transfers among random locations within an E/Z.
In the following presentation, R indicates the estimated proportion of plants in the seedling population that is, in the course of a rotation, presumed to be at risk from some type of environmental damage. For example, R = 0.4 implies that 40 percent of the plants are outside the genetic distribution of the local population and potentially at risk over the course of a rotation.
In all scaling (for example, letting a2A = 3~2F/L rather than 4O'2F/L), we tried to be liberal in estimating risk, so it should be an upper estimate. The estimate does not include factors like mechanical loss, however (for example, browsing and trampling). Appropriate planting density would have to compensate for this potential loss in addition to the potential adaptive loss, R.
Risk values have not been field tested. The values are indicators of relative, not absolute, risk. Nevertheless, for the purpose of field guidance, we have chosen as "safe," an R _< 0.51. The value is based on the assumptions that field planting is at 10-foot spacing (435 plants per acre), that 30 percent (130 plants per acre) are lost due to animal and mechanical damage (trampling, browsing, gophers and rodents, soil slippage, and windfalls), that desired crop density at harvest is 70 trees per acre, and that there should be a cushion for the unexpected. The assumptions led to a harvest of 23 percent of the seedlings that escaped mechanical damage {70 crop trees/[435 planted seedlings -(0.30)(435)] = 0.23}. The value R = 0.51 is based on R = 0.3 for the two PCs individually (Campbell 1986), and provides a safety factor between calculated acceptable R of 0.51 and the 77 percent of the plants that can be lost or removed before final harvest.
Extension growth for these pines seemed to be strongly fixed through age 3. Seed- lings showed little response to year of sowing or to being covered with the plastic tent in winter. Heights of covered seedlings, for example, averaged 46.7 vs. 46.6 centi- meters for seedlings left uncovered. In other measures of growth, the plants showed more plasticity. Final diameters were 11 percent larger for covered seedlings than for uncovered seedlings, 7.88 vs. 7.17 millimeters, and top dry weights of the former were 15 percent heavier.
Principal component analysis was based on the matrix of location-level genetic cor- relations. The first two components (PC-1 and PC-2) explained 81 percent of the location-related variance in the 21 size, phenology, and seed traits, and the third com- ponent (PC-3) added 10 percent (table 4). Factor score eigenvectors indicated that PC-1 was primarily size related. Large scores identified sources with large seeds and seedlings. Seeds and seedlings from these locations also showed a weak tendency to germinate quickly, emerge early, and set first-year buds early. Principal component-2 loaded most heavily for phenological traits. Large scores indicated

Family Variation Among and Within Locations
sources with late germination, late emergence, and late budset. These locations also had a weak positive loading for most size traits. Principal component-3 seemed to be associated with gene x test environment interactions. Large PC-3 scores were associ- ated with locations that had relatively large seedlings in the uncovered beds, and rela- tively small seedlings in the covered beds, particularly if sown in 1985. Principal com- ponent-3 also reflected a contrast between germination in the incubator (fast) and emergence in the bed (slow).
Because of significant correlations between many pairs of traits, only a few examples will be used to illustrate comparative variation among and within locations. Mean squares for families-in-locations were very highly significant for many traits (table 5), and family heritabilities were moderately high; for example, for Ht3 in the four environ- ments, they ranged from 0.67 to 0.70.
Table 4--Principal components (PC) with Ioadings, eigenvalues, and percentage of location variance explained by principal components
Trait PC-1 PC-2 PC-3
SW a 0,188 -0.108 -0.108
CG .106 -.395 .194
WG .127 -.378 ,243
51E -.117 .368 .267
52E -.100 369 .272
41BS -.004 .409 -,195
52BS -.067 .425 .041
41Ht2 .283 .070 ,039
42Ht3 .236 .103 -.063
51Ht3 .275 .083 ,130
52Ht3 .221 .049 -.346
41 D2 .254 -.002 .262
42DI .254 .118 -.052
51 D3 .277 .038 .185
52D3 .229 .001 -.338
41TW .280 ,086 .108
51TW .251 .088 ,180
52TW .228 ,049 -318
41RW .259 .100 ,237
51 RW .267 .038 215
52RW .243 .036 -,312
Eigenvalue 13.365 3.704 2,117
Variation explained b 63.6% 17.6% 10.1%
a Symbols representing the traits are identified in table 2. b Percentage of the location-related variation in the traits explained by the principal components
10

On the other hand, location mean squares, although significant, often were small compared with within-location variance. Except for date of emergence in 1985, the quotient, ~2L/O2F/L, was usually unity or below, and in some cases, zero (table 5).
A remarkable year effect was found for seedl ing emergence. Mean days to emer- gence were about the same both years and for both t reatments (p > 0.05), as were the error var iances (2.51 and 2.62 for T1 and T2 in 1984; 2.84 and 2.78 for T1 and T2 in 1985). In the 1984 sowing, all family var iance was within locations (table 5, traits 41E and 42E); in 1985, about four-fifths of the family var iance was among loca- t ions (traits 51E and 52E). In a combined analysis of years and treatments, both family-in-location x year and location x year interactions were significant (p < 0.001),
Table 5- -Means and components of variance (in percents) for location (G2L), families in location (O'ZF/L) and family x block Interaction (O'ZFB) for selected traits and 3 principal components
Trait Mean ~2 L 0-2F/L G2FB a2L/O'2F/L
SW a 16.9 mg 38 **b 55*** 7 0.7
CG 16.3 days c 36** 57*** 7 .6
WG 4.3 days c 30* 67*** 3 .4
41E 23.9 days d 0 86*** 14 0
42E 24.1 days d 0 81"** 19 0
51E 24.6 days d 70*** 18*** 12 3,9
52E 24.8 days d 71"** 17*** 12 4,2
41BS 251.2 e 20* 24*** 56 ,8
42BS 247.4 e 13ns 38*** 49 ,3
51BS 249.5 e 18ns 28*** 54 .6
52BS 248.9 e 23* 22*** 55 1.0
41 Ht3 44.4 cm 25* 24*** 51 1.0
42Ht3 46.8 cm 23* 28*** 49 .8
51 Ht3 49.2 cm 27** 25*** 48 1.1
52Ht3 46.3 cm 31"** 22*** 47 1.4
41TR 1.143 f 4ns 20ns 76 .2
51TR 1.154 f 0 25** 75 0
52TR 1.155 f lns 15ns 84 .1
PC-1 .15 43** 57 - - .8
PC-2 -.21 59*** 41 - - 1.4
PC-3 -.02 48*** 52 - - .9
Symbols representing the traits are identified in table 2. Levels of significance are ns = p • 0.05, * = p < 0.05, ** = p < 0.01, and *** = p < 0.001.
e Days from entering the incubator. d Days from sowing. e Julian date (September 1 = 244). t Ratio, In top dry weight:In root dry weight.
11
Regression Analysis
whereas no interaction involving treatment or year x treatment was significant (p > 0.05). Pearson correlation coefficients using family values were 0.92 and 0.93 between treatments within years, and 0.28, 0.31, 0.31, and 0.35 for the four possible correlations across years. Thus, the interaction was limited to years and seemed to be general for locations and families-in-locations. We have no explanation for this dif- ferent response in the two years, but the results emphasize that a year effect can not only cause a large gene x environment interaction, but also can alter the distribution of genetic variance among different levels of a genetic hierarchy.
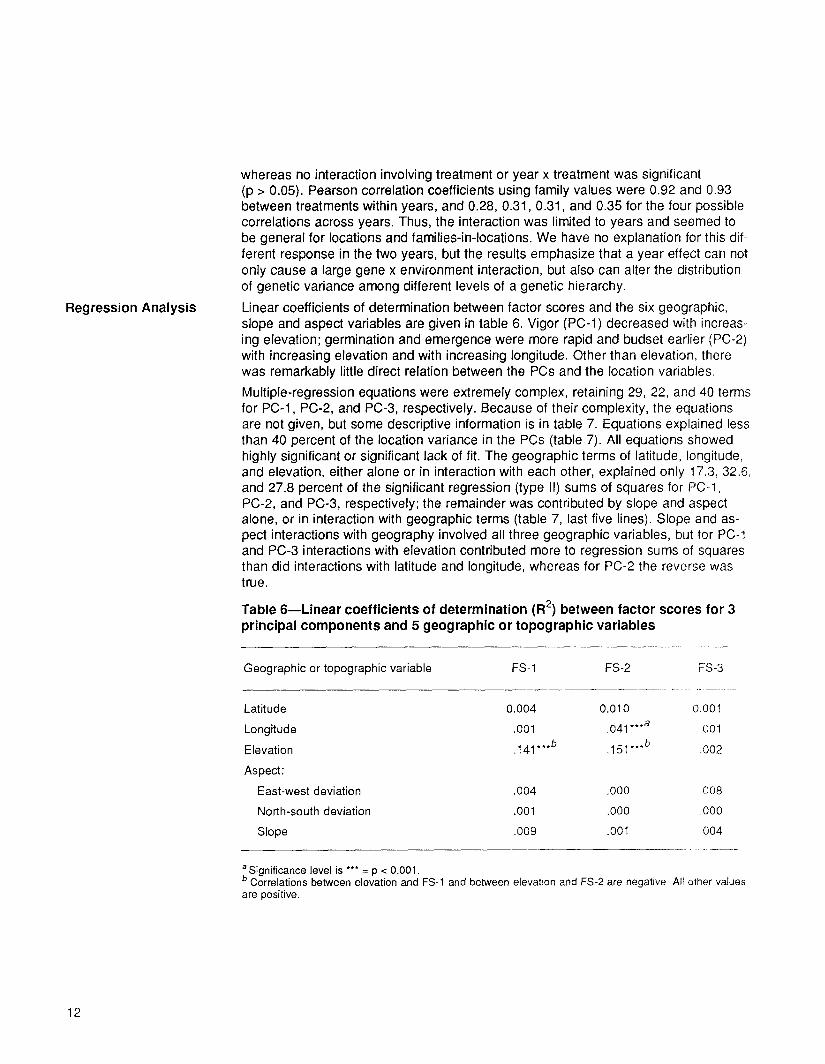
Linear coefficients of determination between factor scores and the six geographic, slope and aspect variables are given in table 6. Vigor (PC-l) decreased with increas- ing elevation; germination and emergence were more rapid and budset earlier (PC-2) with increasing elevation and with increasing longitude. Other than elevation, there was remarkably little direct relation between the PCs and the location variables.
Multiple-regression equations were extremely complex, retaining 29, 22, and 40 terms for PC-l, PC-2, and PC-3, respectively. Because of their complexity, the equations are not given, but some descriptive information is in table 7. Equations explained less than 40 percent of the location variance in the PCs (table 7). All equations showed highly significant or significant lack of fit. The geographic terms of latitude, longitude, and elevation, either alone or in interaction with each other, explained only 17.3, 32.6, and 27.8 percent of the significant regression (type II) sums of squares for PC-l, PC-2, and PC-3, respectively; the remainder was contributed by slope and aspect alone, or in interaction with geographic terms (table 7, last five lines). Slope and as- pect interactions with geography involved all three geographic variables, but for PC-1 and PC-3 interactions with elevation contributed more to regression sums of squares than did interactions with latitude and longitude, whereas for PC-2 the reverse was true.
Table 6--Linear coefficients of determination (R 2) between factor scores for 3 principal components and 5 geographic or topographic variables
Geographic or topographic variable FS-1 FS-2 FS-3
Latitude 0.004 0.010 0.001
Longitude .001 .041 ***a 001
Elevation .141 ***b .151 ***b .002
Aspect:
East-west deviation .004 .000 008
North-south deviation .001 .000 .000
Slope .009 .001 004
a Significance level is *** = p < 0.001. b Correlations between elevation and FS-1 and between elevation and FS-2 are negative All other values are positive.
12

Table 7--Descriptive characteristics of multiple-regression equations relating seed source factor scores to geographic and topographic location variables a
Characteristic PC-1 PC-2 PC-3
Number of terms in equation R 2 for locations Lack of fit test:
F-values Degrees of freedom Probability, p =
Mallows C(p) Sums of squares, type II, (in percent)
explained by the following terms: Geographic terms Geographic x geographic terms Topographic terms Topographic x topographic terms Geographic x topographic terms
29 22 40 .317 .360 .271
1.44 1.89 1.83 190,60 197,60 179,60
.0503 .0024 .0039 113 197 216
14.3 2.1 7.O 3.0 30.5 20.9
10.7 5.2 4.5 20.2 0 15.9 51.8 62.2 51.7
a All locations included.
Table 8---Descriptive characteristics of multiple-regression equations relating seed source factor scores to geographic and topographic location variables a
Characteristic PC-1 PC-2 PC-3
Number of terms in equation R 2 for locations Lack of fit tests:
F-values Degrees of freedom Probability, p --
Mallows C(p) Sums of squares, type II, (in percent)
explained by the following terms: Geographic terms Geographic x geographic terms Topographic terms Topographic x topographic terms Geographic x topographic terms
44 18 41 .479 .352 .356
1.01 1.81 1.39 122,49 148,49 125,49
.5047 .0089 .0979 42 139 9O
8.0 34.2 .7 8.5 17.8 21.9 6.2 0 6.8
14.3 17.3 10.3 63.0 30.7 60.3
a Deschutes National Forest and Lost Forest locations deleted.
13
Classification Analyses
Deleting Lost Forest and Deschutes NF (Cascade Range) locations resulted in equal- ly complex regression equations, but higher proportions of location variance were ex- plained by regression (PC-1 and PC-3), and lack of fit was reduced (PC-1 and PC-3) (table 8). Reducing the sample area decreased the proportions of sums of squares explained by geographic terms, but the reduction was slight.
Lack of fit was presumably due to local geographic or topographic factors not included in the complex regression equations.
All locat ions--When the classification was based on seed zones, zones were not significant for any PC (table 9). Three-hundred-meter elevation bands within zones were significant and accounted for about 25 percent of the location-related variance in PC-1 and PC-2 (table 9). By far, the largest estimated component of variance was associated with O'2L/E/Z or lack of fit that, in the classification analyses, included variation associated with slope and aspect as well as other local effects. Lack of fit was highly or very highly significant for all PCs.
The situation was similar if the classification was based on breeding blocks and eleva- tion bands used by the tree improvement cooperative. Neither regional differences nor differences among breeding blocks within regions were significant (table 10). In all cases, the bulk of the source-related variation was associated with lack of fit ((~2UE/B/R) to the classification model.
Using seed zones and altering the width of the elevation bands changed (~2UE/Z somewhat, but the term remained large and significant, even with 200-meter elevation bands (table 11).
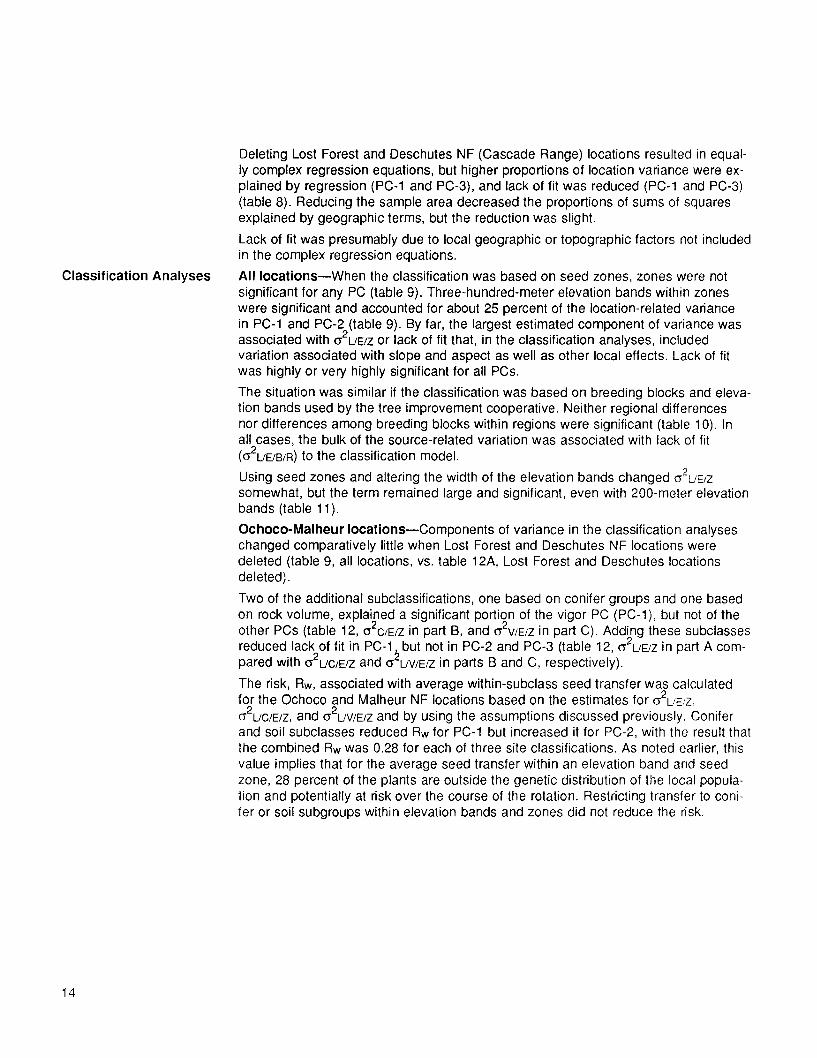
Ochoco-Malheur locations--Components of variance in the classification analyses changed comparatively little when Lost Forest and Deschutes NF locations were deleted (table 9, all locations, vs. table 12A, Lost Forest and Deschutes locations deleted).
Two of the additional subclassifications, one based on conifer groups and one based on rock volume, explained a significant portion of the vigor PC (PC-l), but not of the other PCs (table 12, O'2C/E/Z in part B, and O'2V/E/Z in part C). Adding these subclasses reduced lack of fit in PC-l, but not in PC-2 and PC-3 (table 12, (~2L/E/Z in part A com- pared with ~2L/C/E/Z and (f2L/V/E/Z in parts B and C, respectively).
The risk, Rw, associated with average within-subclass seed transfer was calculated for the Ochoco and Malheur NF locations based on the estimates for O'2UE/Z, O'2L/C/E/Z, and (~2L/V/E/Z and by using the assumptions discussed previously. Conifer and soil subclasses reduced Rw for PC-1 but increased it for PC-2, with the result that the combined Rw was 0.28 for each of three site classifications. As noted earlier, this value implies that for the average seed transfer within an elevation band and seed zone, 28 percent of the plants are outside the genetic distribution of the local popula- tion and potentially at risk over the course of the rotation. Restricting transfer to coni- fer or soil subgroups within elevation bands and zones did not reduce the risk.
14

Table 9--Components of variance (in percentage of total location variance) for seed zones (c2z), 300-meter elevation bands in z o n e s (a2E/Z) and locations In elevation bands In zones (G2L/FJZ) for 3 principal components a
Components of variance Degrees of f reedom PC-1 PC-2 PC-3
C2Z 17 -4.4ns b 5.7ns 8.0ns
(~2E/z 22 26.3* 22.7* .8ns
O-2L/E/Z 180 78.1 ** 71.6"** 91.2***
a Components calculated from type I sums of squares. b Levels of significance are ns = • 0.05, * = p < 0.05, ** = p < 0.01, and *** = p < 0.001.
Table 10--Co_mponents of variance in percentage of total location variance for regions (O~R), breeding blocks in regions (O'ZB/R), elevation bands in blocks (O'2E/B/R) and locations within elevation bands (G2L/E/B/R) a'°'c
Components of variance Degrees of f reedom PC-1 PC-2 PC-3
O-2R 3 -3.1ns d 2.0ns 0.3ns
O 2B/R 7 -31.0 ns -8.8 ns -1.7 ns
O'2E/B/R 16 64.2*** 32.9*** 0.2 ns
(~21JE/B/R 193 69.9* 73.9*** 101.2***
a Components calculated from type I sums of squares. b Regions are comparable to 3 National Forests plus adjacent private land and the detached "Lost Forest." c Elevation bands were 305 meters (mostly) or 245 meters, as prescribed by the tree improvement specialists.
d Levels of significance are ns = p > 0.05, * = p < 0.05, and *** = p < 0.001.
Table 11---G21JE/Z (lack of fit) as percent of total location components of variance in 3 principal components for elevation band widths of 200, 300, and 400 meters within seed zones and for 305- or 245-meter bands within breeding blocks a
Band width Degrees of f reedom PC-1 PC-2 PC-3
Meters
200 174 69.2 *b 62.5*** 89.4***
300 180 78.1 ** 71.6*** 91.2***
400 190 75.2** 80.8*** 92.4***
245/305 193 69.9* 73.9*** 101.2"**
a Components calculated from type I sums of squares. b Levels of significance are * = p < 0.05, ** = p < 0.01, and *** = p < 0.001.
15
Table 12--Components of variance in percentage of total location variance for seed zones (G2z), 300-meter elevation bands in zones (O'2EFZ), locations in elevation bands In zones (O2L/F_/Z) after deletion of locations in the "Lost Forest" and Deschutes National Forest a'°
Components of variance Degrees of freedom PC-1 PC-2 PC-3
A. Seed zones and elevation bands: o-2Z 12 .10.9ns c .6.1ns _7.9ns
O'2E/Z 16 32.5 ns 30.1 * 21.3 ns
~2L/E/Z 138 78.4* 76.0*** 86.6"
B. Conifer group subclasses within elevation bands: ~2 z 12 -11.0 ns -6.1ns -7.8 ns
~2E/Z 16 16.4 ns 32.7* 34.0*
O'2C/E/Z 37 46.6* -7.4 ns -36.8 ns
~2L/C/E/Z 101 48.0 ns 80.8*** 110.6"*
C. Rock volume subclasses within elevation bands: o-2Z 12 -6.1 ns -7.1 ns -6.1 ns
O'2E/Z 16 -4.0 ns 37.6* 7.2 ns
C2V/E/Z 40 73.3* -15.1 ns 28.4ns
O'2L/V/E/Z 98 36.8 ns 84.6*** 70.5**
a Part B includes an additional subclass of conifer groups ((52C/E/Z); part C includes an additional subclass of soil types based on rock volume (O2WE/Z). b Components calculated from type I sums of squares. c Levels of significance are ns = p > 0.05, * = p < 0.05, ** = p < 0.01, and *** = p < 0.001.
16

Discussion Before presenting seed transfer guidelines, we will discuss two unexpected test results. The first was the contrasting geographic differentiation patterns for Douglas-fir and ponderosa pine. Although elevational differentiation seemed roughly comparable for the two species, Douglas-fir had large differences between Cascade (Deschutes NF) and Ochoco populations (Sorensen 1979), and ponderosa showed lack of differ- entiation between these regions (see table 10, ~2R). There are two explanations for the contrasting behavior of the two species, one based on recent selection pressures and one based on historical factors. In terms of selec- tion, the elevational genetic clines in both species presumably reflect adaptation pri- marily to temperature, and to this, ponderosa pine and Douglas-fir seem to have re- sponded similarly. The longitudinal differentiation described earlier for Douglas-fir (Sorensen 1979) was attributed to the effect of increasing continentality from west to east in the rain shadow of the Cascade Range. Although weather records for the for- est zones are not available, increasing continentality may be assumed to include in- creasing moisture stress and increasing diurnal and seasonal temperature amplitude. Whatever the critical factor--moisture stress, summer frosts, or something else--if it guided selection, it resulted in much greater east-west differentiation in Douglas-fir than in ponderosa pine. This is possible, because co-occurring species need not have the same phenotypic response surfaces over environments (see footnote 1).
Historical processes, however, also may have contributed to the two ~atterns of differ- entiation. For example, there is evidence that Douglas-fir may have expanded from genetically differentiated coastal and Rocky Mountain populations (Critchfield 1984, Li and Adams 1989) and come together in central Oregon (Hermann 1985) and that ponderosa pine may have repopulated all of the east side of the Cascades and cen- tral Oregon from a southwestern refugium (Axelrod 1966). Different histories might have set different limits on potential for genecological diversity in the traits we measured.
The second unexpected result, in view of the small geographic variation, was the rela- tively large proportions of location variation associated with slope and aspect (tables 7 and 8, bottom lines). Other studies of conifers in the Pacific Northwest have in- cluded slope-aspect variables in equations fitting seedling growth and phenology to source origin: sugar pine (Pinus lambertiana Dougl.) in southwest Oregon (Campbell and Sugano 1987), Douglas-fir in southwest Oregon (Campbell 1986), Sitka spruce (Picea sitchensis (Bong.) Carr.) in southeast Alaska (Campbell and others 1989), Iodgepole pine in the east side of the Cascades of Oregon (Sorensen 1992). Signifi- cant slope-aspect influences have been present, but they always have been second- ary in magnitude to geographic effects. In the present test, the mean slope of the sample sites was only 7 degrees. In other words, it was a rolling topography and not deeply dissected. That so much slope-aspect differentiation was associated with mod- erate slopes suggested that purely climatic factors (for example, sun exposure and temperature) might not be the cause. It will require more testing to determine this. Additional ponderosa pine studies now in progress will hopefully show whether slope- aspect differentiation is general for this species, or if it is only a feature of this particu- lar sample area.
17
Seed Transfer Guidelines
Seed Transfer Equation and Application
Our results showed no variation associated with seed zone (table 9), and indicated that Deschutes NF seed could be used in the Ochoco and Malheur NFs, and vice versa. Two factors caution against this, however. First, the climates differ between the two areas, and one other species (Douglas-fir) has shown large adaptive differen- tiation over the same transect. Ponderosa pine traits that we did not measure might differ similarly. Second, all principal components had important interaction terms in- cluding, for PC-l, significant longitude x elevation. This term was not significant when Deschutes NF locations were deleted. Proper matching of seed source and planting site could be difficult in the long-distance transfers that seed movement between the Deschutes and the Ochoco-Malheur NFs would involve.
The following comments apply to the Ochoco and Malheur National Forests and the land immediately adjoining them. The first two PCs explained most of the location variance (table 4, bottom line) in the selected size and phenology traits. To simplify presentation and interpretation, only PC-1 and PC-2 were used to develop the follow- ing transfer guidelines.
Two types of guidelines are presented and discussed. The first is a seed-transfer equation, which can be used to estimate the risk in seed transfers between specific seed origins and specific planting sites. The equation is based on models using Ochoco-Malheur NF data only. The program for using the equation is in the appendix and is available from the senior author. The second guideline involves a subdivision of the area into two new blocks with recommendation on elevational bands within blocks. It is based on several considerations presented below.
The equation estimates the risk associated with seed transfer between specific loca- tions and is available for use. Use requires only that mean elevation, latitude, longi- tude, slope, and aspect are known for both locations. When these values are pro- vided, the equation calculates the proportion of adaptive genetic mismatch between populations from the two locations. It does so for each principal component separately and for both together. Table 13 gives examples of its use in one of the new blocks (see below) and for some transfers that go outside the block. The block in this case is the 1280- to 1588-meter (4,200- to 5,200-foot) elevation band west of longitude, 120" W. The planting site and the seed sources are locations we sampled in the cur- rent test. The planting site is at midelevation for the block (1433 meters, 4,700 feet) but near its eastern edge (120.05" W). Sources 1 through 7 are within the elevation band and block (source 5 is from the Maury Mountains) and were obtained by picking every fifth family in the block from the list of sample sites used in the test; sources 8 and 9 are in higher elevation bands of the same block; source 10 is in a lower eleva- tion band of the same block; sources 11 and 12 are at the same elevation but on the east side of the adjacent block.
Assuming that R < 0.51 is an acceptable maximum risk, transfers involving sources 4 and 5 approach the limit. Other within-block transfers are well under the 0.5 value, even though the plantation is near the edge of the block. Transfers within the same block but involving different elevation bands are illustrated with sources 8, 9, and 10. Risk values are higher (R > 0.51) if the transfer is between higher elevations (sources 8 and 9) than if the transfer is between lower elevations (source 10, R < 0.51). Transfers between blocks but within the same elevation band are illustrated
18

Table 13---Calculated seed.transfer risks a based on the first 2 principal components and the regression models
Location Elevation Latitude Longitude Slope Aspect (meters) ('N) ('W) (') (' azimuth)
A. Topographic variables for planting site and potential seed sources:
Planting si~ 1433 44.30 120.05 7 186 Seed source:
1 b 1450 44.30 120.26 3 140 2 1560 44.52 120.61 13 265 3 1402 44.52 120.41 5 330 4 1387 44.34 120.45 10 300 5 1554 44.04 120.56 22 344 6 1524 44.40 120.15 3 266 7 1396 44.29 120.05 3 203 8 1615 44.29 120.28 14 70 9 1860 44.46 120.09 5 169
10 1143 44.47 120.70 5 120 11 1439 43.98 118.79 3 346 12 1402 44.55 118.44 7 0
B. Factor scores 1 and 2 and seed-transfer risks based on the 2 principal components computed individually and combined.
Scores Transfer risks
Location FS-1 FS-2 FS-1 FS-2 Combined
Planting site 1.754 -0.320
Seed source:
1 -.514 .418 0.118 0.110 0.215 2 3.443 -.895 .088 .086 .166 3 2.807 .927 .056 .184 .229 4 8.867 .587 .361 .134 .447 5 .818 2.824 .049 .445 .472 6 -1.378 .057 .164 .056 .211 7 1.943 -.004 .011 .047 .058 8 -5.446 -3.115 .365 .400 .619 9 -4.816 -4.662 .335 .585 .724
10 1.886 2.622 .008 .419 .424 11 2.268 -1.491 .028 .173 .196 12 -.696 1.440 .128 .258 .353
a Estimated proportions of nonadapted seedlings in the seed source populations relative to the local population when used at the designated planting site.
b Sources 1 though 7 are in the same breeding block and elevation band as the planting site; source 8 is from the next elevation band higher, but within 200 meters (650 feet) of the planting site elevation; source 9 is also in the next elevation band higher but 425 meters (1,400 feet) above the planting site; source 10 is in the next elevation band lower; sources 11 and 12 are in the same elevation band as the planting site, but in the adjacent block about 100 and 120 kilometers, respectively, east of the planting site.
19

New Block Designations
with sources 11 and 12. The planting site is at the east edge of its block; seed sources are in the adjacent block to the east. Risk values are moderate and show that these transfers should be permissible, even though they are between blocks. This example shows the advantage of the risk equation or of floating zones over discrete zones (Rehfeldt 1990b).
Use of the equation is restricted to natural ponderosa pine sites on and bordering the Ochoco and Malheur National Forests and within the following limits:
Latitude: 43.6 to 44.6 ° N.
Longitude: 118.4 to 120.8 ° W.
Elevation: 1220 to 1830 meters (4,000 to 6,000 feet).
Slope: zero to 25 degrees (0 to 45 percent).
1. Within the Ochoco and Malheur NFs, latitudinal differentiation was very slight ex- cept below 1400 meters (4,600 feet). Most sites below this elevation are within a nar- row latitudinal band between 44.1 ° N. and 44.5 ° N. The only restriction on latitudinal transfer might be against using low-elevation Maury Mountain sources (<1400 meters) on the north side of the Ochoco Mountains, or vice versa. The R-value for some of these transfers reached 0.35 to 0.4 due to PC-2 effects alone.
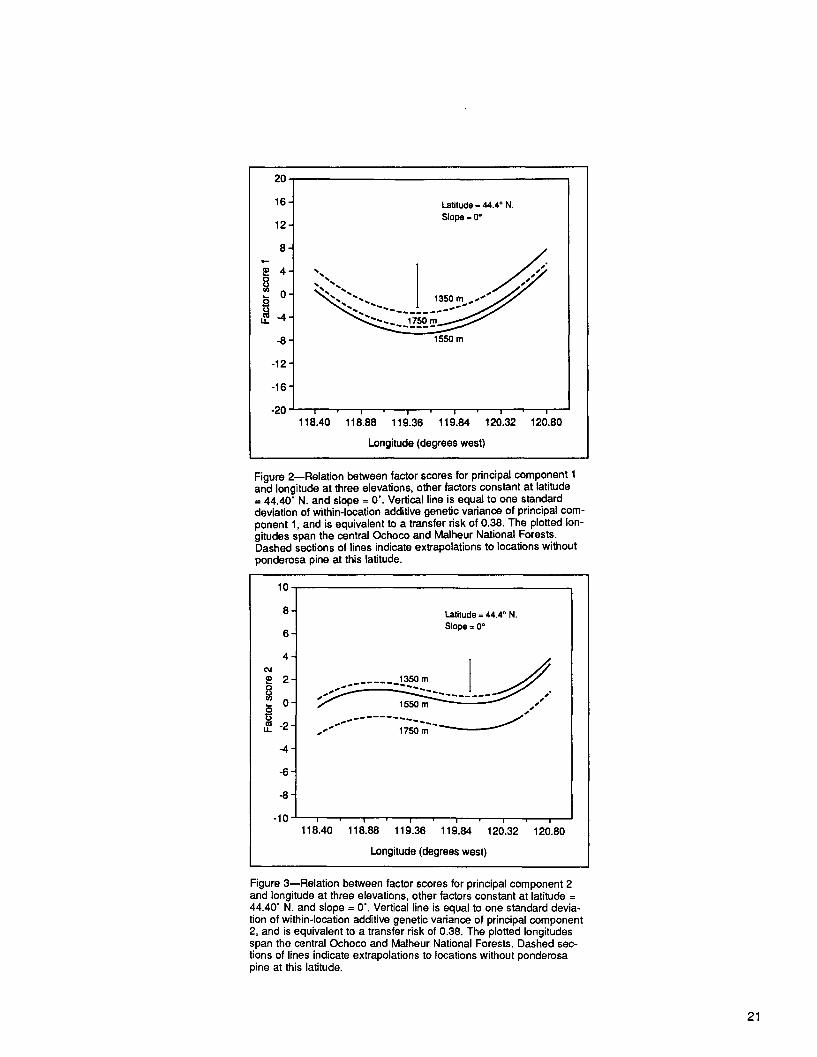
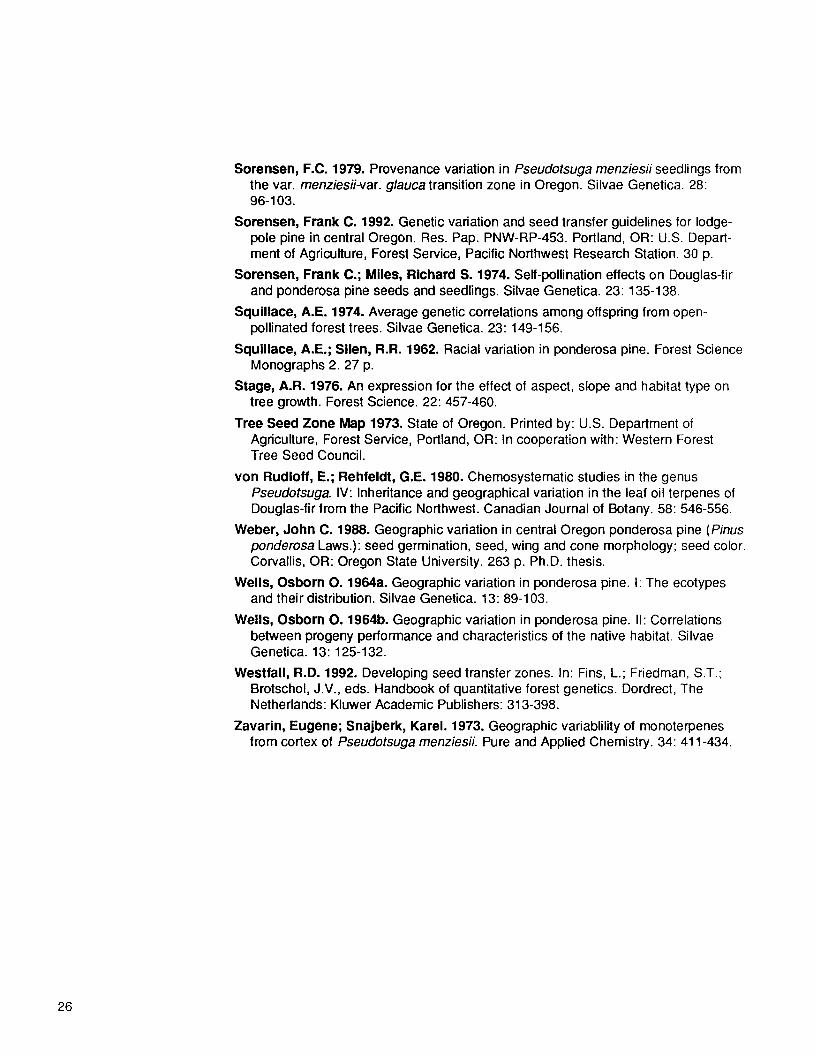
At constant elevation, both PCs changed with longitude (figs. 2 and 3). Maximum change occurred at the ends of the sample distribution. The plot of PC-2 factor scores (fig. 3) particularly indicated that a longitudinal subdivision would be appropriate. A separation into two blocks at about 120 ° W. is suggested.
2. Elevational transfers are currently limited to 305-meter (I,000-foot) bands, except in two subdivisions of the tree improvement program where the width is 245 meters (800 feet). Most sample locations in our test were between 1280 meters (4,200 feet) and 1800 meters (5,900 feet). Steepest elevational clines were associated with PC-2 above about 1550 meters (5,100 feet) (fig. 3). Although PC-1 clines were shallow be- tween these same elevations (fig. 2), the calculated R for a 300-meter transfer be- tween 1550 and 1850 meters at the location of the planting site in table 13 was 0.64. It was concluded that seed transfers above about 1550 meters (5,100 feet) should not exceed about 215 meters (700 feet).
In terms of elevation banding within breeding blocks or breeding zones, the higher band should be narrower than the lower band. Within the Ochoco and Malheur NFs we recommend two bands: 1280 to 1585 meters (4,200 to 5,200 feet) and 1585 to 1800 meters (5,200 to 5,900 feet). For the few sites below 1280 meters, we recommend use of the transfer equation. For the few sites above 1800 meters, we recommend natural regeneration of that transfer not exceed 150 meters (500 feet).
3. Slope-aspect effects contributed greatly to the sums of squares in the regression equations (table 8), and plots of even a 7-degree slope indicated considerable differentiation between aspects for PC-1 (fig. 4). There are two difficulties, however, associated with a plot like fig. 4: (1) the equation is based on few steep slopes (nine locations with slopes > 19 degrees), and even more important, (2) ponderosa pine may not occur on all sites.
20
20
16-
12-
8 -
~ O "
~ -4- 14.
-8-
-12"
-16"
-20
Latitude = 44.4 ° N. Slope = 0 =
1550 m
i • i • I I , I ' i
118.40 118.88 119.36 119.84 120.32 120.80
Longitude (degrees west)
Figure 2--Relation between factor scores for principal component 1 and longitude at three elevations, other factors constant at latitude = 44.40" N. and slope = 0'. Vertical line is equal to one standard deviation of within-location additive genetic variance of principal com- ponent 1, and is equivalent to a transfer risk of 0.38. The plotted lon- gitudes span the central Ochoco and Malheur National Forests. Dashed sections of lines indicate extrapolations to locations without ponderosa pine at this latitude.
10-
8-
6 -
4- 0 , 1
. . . , 0 "
, ,= -2-
-4-
" 6 "
-8-
-10
Latitude = 44.4 ° N. Slope = 0 °
. . . . . 1350 rn ] . . . " " . . . . . . . . . . . . J . . . . l J /
1550m ~ ' - - ' Z ~ - ' ~ . - ' "
i , i i , ,
118.40 118.88 119.36 119.84 12(~.32 120.80
Longitude (degrees west)
Figure 3--Relation between factor scores for principal component 2 and longitude at three elevations, other factors constant at latitude = 44.40" N. and slope = 0". Vertical line is equal to one standard devia- tion of within-location additive genetic variance of principal component 2, and is equivalent to a transfer risk of 0.38. The plotted longitudes span the central Ochoco and Malheur National Forests. Dashed sec- tions of lines indicate extrapolations to locations without ponderosa pine at this latitude.
21

20 ,°! 12
8
~ 0-
~ -4- U_
-8 -
-12 -
-16-'
-20 )
L a t i t u d e = 4 4 . 4 ° N
L o n g i t u d e = 1 2 0 . 4 ° W
1 3 2 5 rn S l o p e = 7 °
i + I i I !
0 72 144 216 288 360
Aspect (degrees azimuth)
Figure 4--Relation between factor scores for principal component 1 and aspect at three elevations, other factors constant at latitude = 44.40" N., longitude = 120.40" W. and slope = T. Vertical line is equal to one standard deviation of within-location additive genetic variance of principal component 1, and is equivalent to a transfer risk of 0.38.
TO reconcile this conflict, we calculated the risk of 20 transfers among 10 locations between 1450 (4,750 feet) and 1690 meters (5,550 feet) in the area of steepest slopes (44 + N. - 44.5 + N., 120.25 + W. - 120.45 + W.). Locations were chosen at ran- dom from our sample sites within this rectangle. Mean R for 20 transfers among the sample sites was 0.359; three of the values were greater than 0.6, two between 0.5 and 0.6. Transfers involving sites with relatively steep slopes and varying aspects do represent increased risk. Even for this area of comparatively steep slopes, however, we concluded that ponderosa is usually restricted to adaptively similar sites, and transfer risks are tolerable as long as the transfer is restricted to ponderosa sites.
4. Lack of fit was significant for all PCs in the classification analysis and for PC-2 in the regression analysis (tables 8 and 12). To further evaluate the real contribution of slope and aspect to lack of fit and seed transfer risk in the proposed new blocks, we compared risk estimates calculated from the regression with those calculated from the classification analysis. In the latter, we used the risk value based on the average seed-transfer distance within the 300-meter elevation band and standard seed zone (Rw). The value Rw was 0.56. We assumed, as explained earlier, that half, or 0.28, was due to sampling error and nonadaptive differentiation and half due to local adap- tive genetic variation. By using this assumption, Rw of 0.28 was slightly lower than the average value (0.359) for random transfers within the steep part of the eastern Ochoco Mountains (see item 3 above on slope-aspect effects) and similar to the mean risk value (0.257) for sample transfers within a new breeding block (sources 1 to 7 in table 13 B).
22

Seed Orchard Siting
Conclusion
Table 14~ProporUons of type I location sums of squares (in percentage) that are not explained by the regression or classification models a
PC-1 PC-2 PC-3
Model d.f. b P.V. c d.f. P.V. d.f. P.V.
Regression 190 63.8 197 60.4 179 69.5 Classification:
Elevation bands in seed zones 180 73.0 180 67.0 180 77.8
Elevation bands in breeding blocks 193 74.3 193 73.4 193 87.9
a All locations induded. b Degrees of freedom. c Proportional variance.
We concluded, both from this comparison of risk values and from the comparisons of lack-of-fit sums of squares in table 14, that significant slope and aspect effects in the regression equations were not contributing greatly to lack of fit within geographic subunits as long as the transfer was restricted to sites where ponderosa pine was native. Subdivision into zones, therefore, should be effective in controlling transfer risk. Average transfer risk within a seed zone or new block will be about 0.3; maximum risks within these entities should be 0.5 to 0.6 and should occur rarely.
Within the Ochoco and Malheur NFs, the best site for a seed orchard should include a gentle slope (<5 degrees) of azimuth about 120 degrees or about 320 degrees at midelevation (1500 meters or 4,900 feet) near the middle of the sample area. This would appear to be about an average environment for the test area, and pollen contamination should have average adaptive characteristics. The most serious deviation from this location would be low elevation (1200 meters), particularly a steep slope at low elevation. By avoiding low and high elevations and slopes greater than 5 degrees, quite similar orchard sites could be found over much of the sample area.
In brief, we propose the following seed transfer guidelines for ponderosa pine sites on and immediately adjoining the Ochoco and Malheur NFs.
1. No transfer between the east slopes of the Cascades and the Ochoco and Malheur NFs.
2a. Maintenance of detailed seed inventory of individual lots or of bulked lots of about 50 families having similar factor scores and with seed use controlled by the transfer equation in the appendix. We recommend this approach.
2b. Subdivide the area geographically into two blocks, one east and one west of about 120 ° W., and elevationally into two bands, 1280 to 1585 meters (4,200 to 5,200 feet) and 1585 to 1800 meters (5,200 to 5,900 feet), and bulk the seed by elevation band and block.
2c. There are relatively few sites below 1280 and above 1800 meters. Special suggestions are given for them in a previous section.
23

Acknowledgments
Literature Cited
Most of the cones and seeds were supplied by personnel of the Deschutes and Ochoco National Forests. The National Forests also provided financial support. Particular thanks are due to Duane Ecker and Brian Tandy of the Ochoco National Forest for their interest and supervision of the field collections. Richard Miles supervised the nursery portion of the study, Nancy Mandel provided statistical and computational advice. Robert Campbell in many discussions shared his experience and insights. Alan Ager, Vicky Erickson, Roger Petersen, Ray Steinhoff, and Robert Westfall provided thoughtful comments on an earlier draft. We thank these individuals for their time and help.
Axelrod, D.I. 1966. The Pleistocene Soboba flora of southern California. University of California Publications in Geological Sciences. 60:1-79 plus 14 plates.
Berry, Dick Wallace. 1963. An ecological study of a disjunct ponderosa pine forest in the northern Great Basin in Oregon. Corvallis, OR: Oregon State University. 291 p. Ph.D. thesis.
Box, George E.P.; Draper, Norman R. 1987. Empirical model-building and response surfaces. New York: John Wiley and Sons. 669 p.
Campbell, R.K. 1986. Mapped genetic variation of Douglas-fir to guide seed transfer in southwest Oregon. Silvae Genetica. 35: 85-96.
Campbell, Robert K. 1979. Genecology of Douglas-fir in a watershed in the Oregon Cascades. Ecology. 60: 1036-1050.
Campbell, Robert K.; Pawuk, William A.; Harris, Arland S. 1989. Microgeographic genetic variation of Sitka spruce in southeastern Alaska. Canadian Journal of Forest Research. 19: 1004-1013.
Campbell, Robert K.; Sorensen, Frank C. 1979. A new basis for characterizing germination. Journal of Seed Technology. 4: 24-34.
Campbell, Robert K.; Sugano, Albert I. 1987. Seed zones and breeding zones for sugar pine in southwestern Oregon. Res. Pap. PNW-RP-383. Portland, OR: U.S. Department of Agriculture, Forest Service, Pacific Northwest Research Station. 18p.
Conkle, M. Thompson; Critchfield, William B. 1988. Genetic variation and hybridization of ponderosa pine. In: Baumgartner, David M.; Lotan, James E., comps., eds. Ponderosa pine: the species and its management. Pullman, WA: Washington State University Cooperative Extension Service: 27-43.
Critchfield, William B. 1984. Impact of the Pleistocene on the genetic structure of North American conifers. In: Lanner, Ronald M., ed. Proceedings of the 8th North American Forest biology workshop; 1984 July 30-August 1; [meeting location unknown]. Logan, UT: Utah State University: 70-118.
Critchfield, William B.; Little, Elbert L., Jr. 1966. Geographic distribution of the pines of the world. Misc. Publ. 991. Washington, DC: U.S. Department of Agriculture, Forest Service. 97 p.
Daniel, Cuthbert; Wood, Fred S. 1971. Fitting equations to data. New York: Wiley-lnterscience. 342 p.
Draper, N.R.; Smith, H. 1966. Applied regression analysis. New York: John Wiley and Sons. 407 p.
Gregorius, H.-R.; Roberds, J.H. 1986. Measurement of genetical differentiation among subpopulations. Theoretical and Applied Genetics. 71:826-834
24

Griffing, B. 1956. Concept of general and specific combining ability in relation to diallel crossing systems. Australian Journal of Biological Science. 9: 463-493.
Hayes, W.D. 1913. Effect of source of seed on results in yellow pine reforestation. Review of Forest Service investigations. Washington, DC: U.S. Department of Agriculture, Forest Service. 2: 53-57.
Hermann, R.K. 1985. The Genus Pseudotsuga: ancestral history and past distribution. Spec. Publ. 2b. Corvallis, OR: Oregon State University, College of Forestry, Forest Research Laboratory. 32 p.
Kempff, G. 1928. Nonindigenous western yellow pine plantations in northern Idaho. Northwest Science. 2: 54-58.
Kempthorne, Oscar. 1957. An introduction to genetic statistics. New York: John Wiley and Sons. 545 p.
Larson, M.M. 1966. Racial variation in ponderosa pine at Fort Valley, Arizona. Res. Note RM-73. Fort Collins, CO: U.S. Department of Agriculture, Forest Service, Rocky Mountain Forest and Range Experiment Station. 7 p.
Li, Peng; Adams, W.T. 1989. Range-wide patterns of allozyme variation in Douglas- fir (Pseudotsuga menziesi~). Canadian Journal of Forest Research. 19: 149-161.
Linhart, Y.; Mitton, J.B.; Sturgeon, K.B.; Davis, M.L. 1981. Genetic variation in space and time in a population of ponderosa pine. Heredity. 46: 407-426.
Mirov, N.T.; Duffield, J.W.; Liddicoet, A.R. 1952. Altitudinal races of Pinus ponderosa--a 12-year progress report. Journal of Forestry. 50: 825-831.
Morrison, Donald F. 1967. Multivariate statistical methods. New York: McGraw-Hill Book Co. 338 p.
Munger, T.T. 1938. Evidences of races in a 25-year ponderosa pine test. Journal of Agricultural Research. 59: 855-887.
Petal, Jagdish K.; Read, Campbell B. 1982. The handbook of normal distribution. New York: Marcel Dekker, Inc. 337 p.
Read, Ralph A. 1983. Ten-year performance of ponderosa pine provenances in the Great Plains of North America. Res. Pap. RM-250. Fort Collins, CO: U.S. Depart- ment of Agriculture, Forest Service, Rocky Mountain Forest and Range Experiment Station. 17 p.
Rehfeldt, G.E. 1986. Adaptive variation in Pinus ponderosa from Intermountain regions. I: Snake and Salmon River Basins. Forest Science. 32: 79-92.
Rehfeldt, G.E. 1990a. Genetic differentiation among populations of Pinus ponderosa from the Upper Colorado River Basin. Botanical Gazette. 151: 125-137.
Rehfeldt, G.E. 1990b. Gene resource management: using models of genetic variation in silviculture. In: Proceedings of the genetics/silviculture workshop; 1990 August 27-31 ; Wenatchee, WA. Washington, DC: U.S. Department of Agriculture: 31-44.
Smith, R.H. 1977. Monoterpenes of ponderosa pine xylem resin in Western United States. Tech. Bull. 1532. Washington, DC: U.S. Department of Agriculture, Forest Service. 48 p.
Smith, R.H.; Peloquin, R.L.; Passof, P.O. 1969. Local and regional variation in the monoterpenes of ponderosa pine wood oleoresin. Res. Pap. PSW-56. Berkeley, CA: U.S. Department of Agriculture, Forest Service, Pacific Southwest Forest and Range Experiment Station. 10 p.
25
Sorensen, F.C. 1979. Provenance variation in Pseudotsuga menziesii seedlings from the var. menziesii-var, glauca transition zone in Oregon. Silvae Genetica. 28: 96-103.
Sorensen, Frank C. 1992. Genetic variation and seed transfer guidelines for lodge- pole pine in central Oregon. Res. Pap. PNW-RP-453. Portland, OR: U.S. Depart- ment of Agriculture, Forest Service, Pacific Northwest Research Station. 30 p.
Sorensen, Frank C.; Miles, Richard S. 1974. Self-pollination effects on Douglas-fir and ponderosa pine seeds and seedlings. Silvae Genetica. 23: 135-138.
Squillace, A.E. 1974. Average genetic correlations among offspring from open- pollinated forest trees. Silvae Genetica. 23: 149-156.
Squillace, A.E.; Silen, R.R. 1962. Racial variation in ponderosa pine. Forest Science Monographs 2.27 p.
Stage, A.R. 1976. An expression for the effect of aspect, slope and habitat type on tree growth. Forest Science. 22: 457-460.
Tree Seed Zone Map 1973. State of Oregon. Printed by: U.S. Department of Agriculture, Forest Service, Portland, OR: In cooperation with: Western Forest Tree Seed Council.
yon Rudloff, E.; Rehfeldt, G.E. 1980. Chemosystematic studies in the genus Pseudotsuga. IV: Inheritance and geographical variation in the leaf oil terpenes of Douglas-fir from the Pacific Northwest. Canadian Journal of Botany. 58: 546-556.
Weber, John C. 1988. Geographic variation in central Oregon ponderosa pine (Pinus ponderosa Laws.): seed germination, seed, wing and cone morphology; seed color Corvallis, OR: Oregon State University. 263 p. Ph.D. thesis.
Wells, Osborn O. 1964a. Geographic variation in ponderosa pine. I: The ecotypes and their distribution. Silvae Genetica. 13: 89-103.
Wells, Osborn O. 1964b. Geographic variation in ponderosa pine. I1: Correlations between progeny performance and characteristics of the native habitat. Silvae Genetica. 13: 125-132.
Westfall, R.D. 1992. Developing seed transfer zones. In: Fins, L.; Friedman, S,T.; Brotschol, J.V., eds. Handbook of quantitative forest genetics. Dordrect, The Netherlands: Kluwer Academic Publishers: 313-398.
Zavarin, Eugene; Snajberk, Karel. 1973. Geographic variablility of monoterpenes from cortex of Pseudotsuga menziesfi. Pure and Applied Chemistry. 34:411-434.
26
Appendix 10 REM THIS PROGRAM COMPUTES A "RISK" VALUE ASSOCIATED WITH SEED-TRANSFER
20 REM OF PONDEROSA PINE (OCHOCO-MALHEUR AND IMMEDIATELY ADJOINING)
30 REM THE VALUE RANGES FROM ZERO TO ONE. ZERO INDICATES A SEED SOURCE IN
40 REM WHICH ALL SEEDLINGS ARE WELL ADAPTED TO THE PLANTINGSITE;
50 REM ONE INDICATES A SOURCE IN WHICH ALL SEEDLINGS ARE HYPOTHETICALLY
60 REM POORLY ADAPTED TO THE PLANTING SITE
70 REM VALUES FOR THE FOLLOWING ENVIRONMENTAL-INDEX VARIABLES ARE REQUIRED
80 REM FOR BOTH THE SEED ORIGIN AND THE PLANTING SITE:
90 REM E -- ELEVATION IN METERS(LIMITS=1220 TO 1830)
100 REM L = LATITUDE IN DEGREES(LIMITS=43.60 TO 44.60)
110 REM D = LONGITUDE IN DEGREES(LIMITS=118.40 TO 120.85)
120 REM T = SLOPE IN DEGREES(LIMITS=0 TO 25)
130 REM
140 REM I. OBTAIN ENVIRONMENTAL-INDEX VALUES FOR THE SEED SOURCE
150 INPUT" THE ELEVATION OF THE SEED SOURCE IS ",ELEV
160 INPUT "THE LATITUDE OF THE SEED SOURCE IS ",LAT
170 INPUT "THE LONGITUDE OF THE SEED SOURCE IS ",LON
180 INPUT" THE SLOPE IN DEGREES IS ",SLO
190 INPUT "THE ASPECT IN DEGREES AZIMUTH IS ",ASP
200 REM I1. CALCULATE FACTOR SCORE FOR FIRST PRINCIPAL COMPONENT(FS1 AND F1)
210 LET M = 0
220 LET L = LAT-43
230 LET E = ELEV
240 LET D = LON-118
250 LET T = TAN(.017453*SLO)
260 LET G = SIN(.017453*ASP)
270 LET H = COS(.017453*ASP)
280 LET A = T*G
290 LET B = T*H
300 LET B 1 = 1155.81285#* L
310 LET B2 = .88534"E
320 LET B3 = 390.86677#*T
330 LET B4 = -447.60045#*A
340 LET B5 = -289.25415#*L*L
350 LET B6 = -2.1641E-04* E* E
360 LET B7 = -3825.81466#*T*T
370 LET B8 = -.99537*L*E
380 LET B9 = -1013.40419#*L*T
390 LET B10 = 47.0585*L*B
400 LET B11 = 186.81038#*D*T
410 LET B12 = -289.00239#*D*B
420 LET B13 = .37491*E*A
430 LET B14 = 3029.70733#*T*A
27

440 LET B15 = 4493.18088#*T*B
450 LET B16 = 2092.30554#*A*B
460 LET B17 =-941.27705#*L*L*T*T
470LET B18 = 587.11073#*L*L*A*A
480 LET B19 = 91.27527*D*D*T*T
490 LET B20 =-.0023703*E*E*T*T
500 LET B21 = -1083.07739#*T*T*B*B
510 LET B22 = 7480.55259#*A*A*B*B
520 LET B23 =-9 .382089*~L*D
530 LET B24 =.16586*L*L*E
540 LET B25 = 539.36629#*~L*T
550 LET B26 = 349.51171#*L*L*A
560 LET B27 =-79.9114*D*D*T
570LET B28 =-29.43678*D*D*A
580 LET B29 = 863.57307#*T*T*B
590 LET B30= 2762.41723#*A*A*B
600 LET B31 = 4.43775*L*D*D
610 LET B32 = 1.9541E-04*L*E*E
620 LET B33 = 610.53065#*L*B*B
630 LET B34 = 6.23404*E*T*T
640 LET B35 =-121.57066#*L*D*A
650 LET B36 = 126.09606#*L*D*B
660 LET B37 =-.36092*L*E*A
670 LET B38 =-1863.78659#*L*T*B
680 LET B39 = -526.3586#*L*A*B
690 LET B40 =.14295*D*E*A
700 LET B41 =.092984*D*E*B
710 LET B42 =-1.96381*E*T*A
720 LET B43 = -1.93721*E*T*B
730 LET B44 =-.8661*E*A*B
740 LET B0 =-897.78801#
750 LET F5 = B1+B2+B3+B4+B5+B6+B7+B8+Bg+B10+B11+B12+B13+B14+B15+B16
760
770
780
790
800
810
820
830
840
850
860
LET F6 = B17+B18÷B19+B20+B21+B22+B23+B24+B25+B26+B27+B28+B29+B30+B31
LET F7 = B32+B33+B34+B35+B36+B37+B38+B39+B40+B41+B42+B43+B44+B0
LET F1 = F5+F6+F7
REM I1. CALCULATE FACTOR SCORE FOR SECOND PRINCIPAL COMPONENT(FS2 AND F2)
LET C1 = 35.81354"L
LET C2 = 18.20121"D
LET C3 = -.10385"E
LET C4 = , 10071E-03*E*E
LET C5 = -4.31372*L*D
LET C6 = -.017954*L*E
LET C7 = 38.48649*D*B
28

870 LET C8 = -.020574*E*B
880 LET C9 = -9.39264*D*D
890 LET C10 = -253.37394#*A*B*B
900 LET C11= -219.95788#*T*A*B
910 LET C12 = 2.13388*D*D*D
920 LET C13 = -2.85513*D*D*T
930 LET C14 = 5.22189*L*L*T
940 LET C15 = -41.86941*L*A*A
950 LET C16 = .034642*E*A*A
960 LET C17 = -.26275E-07#*E*E*E
970 LET C18 = -11.237*D*D*B
980 LET CO = 1.82185
990 LET F2=C1+C2+C3+C4+C5+C6+C7+C8+C9+C10+Cl1+C12+C13+C14+C15+C16+C17+C18+C0
1000 IF M>0 THEN 1140
1010 LET M = M+I
1020 LET FS1 = F1
1030 LET FS2 = F2
1040 PRINT E;L; D;SLO;ASP;FS1 ;FS2
1050 PRINT
1060 REM IV. OBTAIN ENVIRONMENTAL-INDEX VALUES FOR THE PLANTING SITE
1070 INPUT "THE ELEVATION OF THE PLANTATION IS ",ELEV
1080 INPUT "THE LATITUDE OF THE PLANTATION IS ",LAT
1090 INPUT "THE LONGITUDE OF THE PLANTATION IS ",LON
1100 INPUT "THE SLOPE OF THE PLANTATION IN DEGREES IS ",SLO
1110 INPUT "THE ASPECT OF THE PLANTATION IN DEGREES AZIMUTH IS ",ASP
1120 REM V. CALCULATE XI= DIFFERENCE BETWEEN SOURCE AND PLANTATION IN FIRST PC
1130 GOTO 220
1140 LET X0 = FS1-F1
1150 LET Xl = X0/2
1160 REM VI. CALCULATE NORMAL DEVIATE CORRESPONDING TO Xl (Z1)
1170 REM SA1 = STANDARD DEVIATION FOR ADDITIVE GENETIC VARIANCE FOR FACTOR
1180 REM SCORE 1
1190 LET SA1 = 7.5856
1200 LET Z1 = X1/SA1
1210 IF ZI<0 THEN 1240
1220 LET SIGN = 1
1230 GOTO 1250
1240 LET SIGN = -1
1250 LET Z3 = ZI*SIGN
1260 LET N = 0
1270 REM VII. CALCULATE AREA UNDER STANDARD NORMAL CURVE FROM 0 TO Z
1280 LET A 1 = .387416"Z3
1290 LET A2 = .0458442*Z3*Z3
29

1300 LET A3
1310 LET A4
1320 LET A5
1330 LET A6
= -. 140874*Z3*Z3*Z3
= .0574989*Z3*Z3*Z3*Z3
= -9.845671 E -03*Z3*Z3*Z3*Z3*Z3
= 6.33339E-04*Z3*Z3*Z3*Z3*Z3*Z3
1340 LET A0 = 6.90589E-04
1350 LET A = A0+A1 +A2+A3+A4+A5+A6
1360 IF N = 1 THEN 1570
1370 LET N = N+I
1380 LET R1 = A*2
1390 IF R I< = 0 THEN 1410
1400 GOTO 1420
1410 R1 = 0
1420 RF1 = R1
1430 REM VIII. CALCULATE X2= DIFFERENCE BETWEEN SOURCE AND PLANTATION IN 2ND PC
1440 LET XX = FS2-F2
1450 LET X2 = XX/2
1460 REM IX. CALCULATE NORMAL DEVIATE CORRESPONDING TO X2 (Z2)
1470 REM SA2 = STANDARD DEVIATION OF ADDITIVE GENETIC VARIANCE FOR FACTOR
1480 REM SCORE 2
1490 LET SA2 = 2.6674
1500 LET Z2 = X2/SA2
1510 IF Z2<0 THEN 1540
1520 LET SIGN1 = 1
1530 GOTO 1550
1540 LET SIGN1 = -1
1550 LET Z3=Z2*SIGN1
1560 GOTO 1280
1570 LET R2 = A*2
1580 IF R2<=0 THEN 1600
1590 GOTO 1610
1600 R2 = 0
1610 RF2 = R2
1620 REM X. CALCULATE THE "RISK"(CRF)
1630 LET CRF2 = RFI+RF2-(RFI*RF2)
1640 PRINT E;L;D;S;F1 ;F2
1650 PRINT
1660 PRINT RF1 ;RF2;
1670 PRI NT
1680 PRINT "THE RISK VALUE FOR TWO PC'S IS ";CRF2
1690 END
3 0 "U.S. Government Pdntlng Office: 1994 - - 589-269/00006

Sorensen, Frank C.; Weber, John C. 1994. Genetic variation and seed transfer guidelines for ponderosa pine in the Ochoco and Malheur National Forests of central Oregon. Res. Pap. PNW-RP-468. Portland, OR: U.S. Department of Agriculture, Forest Service, Pacific Northwest Research Station. 30 p.
Adaptive genetic variation in seed and seedling traits was evaluated for 280 families from 220 locations. Factor scores from three principal components were related by multiple regression to latitude, longitude, elevation, slope, and aspect of the seed source, and by classification analysis to seed zone and elevation band in seed zone. Location variance was significant but not large. Multiple regression equations explained less than 50 percent of location variance. Slope-aspect variables were important. Keywords: Pinus ponderosa, seedlings, breeding zones, provenance, genetic variation, adaptive variation, genetic diversity.
The Forest Service of the U.S. Department of Agriculture is dedicated to the principal of multiple use management of the Nation's forest resources for sustained yields of wood, water, forage, wildlife, and recreation. Through forestry research, cooperation with the States and private forest owners, and management of the National Forests and National Grasslands, it strives---as directed by Congress--to provide increasingly greater service to a growing Nation.
The U.S. Department of Agriculture is an Equal Opportunity Employer. Applicants for all Department programs will be given equal consideration without regard to age, race, color, sex, religion, or national origin.
Pacific Northwest Research Station 333 S.W. First Avenue P.O. Box 3890 Portland, Oregon 97208-3890
j "

U.S. Department of Agriculture Pacific Northwest Research Station 333 S.W. First Avenue P.O. Box 3890 Portland, OR 97208
Official Business Penality for Private Use, $300
do NOT detach label