united states metals in the americas 26 september 2016
TRANSCRIPT

Deutsche Bank Markets Research
North America
United States
Periodical
Metals in the Americas
Date
26 September 2016
The Weekly Extract
________________________________________________________________________________________________________________
Deutsche Bank Securities Inc.
Deutsche Bank does and seeks to do business with companies covered in its research reports. Thus, investors should be aware that the firm may have a conflict of interest that could affect the objectivity of this report. Investors should consider this report as only a single factor in making their investment decision. DISCLOSURES AND ANALYST CERTIFICATIONS ARE LOCATED IN APPENDIX 1. MCI (P) 057/04/2016.
Jorge Beristain, CFA
Research Analyst
(+1) 203 863-2381
Chris Terry
Research Analyst
(+1) 212 250-5434
Jeremy Kliewer
Research Associate
(+1) 904 527-6532
Top picks
Alcoa (AA.N), USD9.76 Buy Kaiser (KALU.OQ),USD85.42 Buy Newmont (NEM.N), USD39.56 Buy Steel Dynamics (STLD.OQ), USD24.84 Buy
DB coverage stock performance 9/23/2016 % 1W % 1M % YTD
Coeur 12.56 1 (3) 406 Teck 18.18 (0) 15 371
Hecla 6.00 9 9 217
Pan American
Silver
17.79 5 (0) 174
Barrick 18.11 4 (0) 145
US Steel 18.95 19 (5) 137
Kinross 4.30 5 2 136
Silver Standard 16.71 5 (1) 133
Silver Wheaton 27.82 5 6 124
AK Steel 4.96 21 8 121
Newmont 39.56 3 (1) 120
Vale 5.42 8 (4) 65
Franco-Nevada 71.87 2 (1) 57
Freeport-
McMoRan
10.63 7 (4) 57
Allegheny Tech. 17.55 11 6 56
Century Aluminum 6.59 11 (4) 49
Goldcorp 16.66 7 4 44
S&P 500 M&M 99 5 (2) 43
Steel Dynamics 24.84 6 1 39
Reliance 71.63 4 (1) 24
Nucor 48.81 7 (0) 21
Ryerson 11.17 8 (5) 8
S&P 500 2,165 1 (0) 6
Kaiser 85.42 3 2 2
Southern Copper 25.96 2 1 (1)
Alcoa 9.76 3 (3) (1)
Constellium 7.20 3 34 (6) Source: Thomson One and Deutsche Bank
DB coverage forward P/E (x)
23.0
39.8
12.2
21.1 17.9
14.4
30.3
13.9 16.2 16.4
0
10
20
30
40
50
Industrial
Metals
Precious
Metals
Steel &
Service
Centers
Aluminum
& Specialty
Metals
S&P 500
2016E 2017E
Source: Thomson One and Deutsche Bank
WEEKLY EXTRACT The S&P 500 rose 1% WoW to 2,165 and the S&P 500 M&M increased 5%
to 99. Nickel (+10% WoW to $4.82/lb) led the gains following concerns that Philippines may suspend more mines under environmental crackdown. Silver (+5% WoW to $19.82/oz) and gold (+2% to $1,340/oz) increased after US Federal Reserve kept interest rates unchanged. Similarly, aluminum price was up 4% to $0.74/lb on lower USD as Fed rates stay flat. Meanwhile, US Hot-Rolled Coil (HRC) price fell 5% to $529/st while the spread between HR and Cold-Rolled (CRC) sheet widened to $218/st (+$7/st WoW).
PRICE PERFORMANCE DB M&M equities posted positive performance last week with Steel &
Service Centers equities (+8% WoW) rising the most despite a decline in US HRC prices (-5%). Industrial Metals equities increased 6% WoW aided by higher prices for nickel (+10%), zinc (+3%) and copper (+1%). Precious Metals equities rose 5% on gains in silver (+5%) and gold (+2%). Lastly, Aluminum & Specialty Metals equities were up 4% in-line with the improvement in aluminum (+4%).
AK Steel (+21% WoW) and US Steel (+19%) led the gains within Steel & Service Centers equities after filing anti-circumvention request against Chinese CRC and galvanized sheet. Amongst Industrial Metals, Vale (+8%) traded higher after Brazil granted a 10-year license for a 63-mile rail line for its S11D mine. Hecla (+9%) and Goldcorp (+7%) were the leading performers within Precious Metals equities on higher underlying bullion prices. Within Aluminum & Specialty Metals equities, Century Aluminum and Allegheny Tech. (+11% each) increased the most on higher aluminum and nickel prices.
RECENT RESEARCH Americas Metals and Mining – Notes from the road - Denver Gold. A
glimmer of hope post-slump?
UPCOMING EVENTS East Coast marketing – Synagowitz/Beristain New York and Boston,
October 3-4
STOCK AND COMMODITY LEADERS & LAGGARDS (%) – 1 WEEK
1
5
0
1
2
2
3
9
11
11
19
21
-5 0 5 10 15 20 25
S&P 500
S&P 500 M&M
Teck
Coeur
Franco-Nevada
Southern Copper
Kaiser
Hecla
Allegheny Tech.
Century Aluminum
US Steel
AK Steel
1
5
-7
-6
-5
-1
0
3
3
4
5
10
-10 -5 0 5 10 15
S&P 500
S&P 500 M&M
Molybdenum ($/lb)
Scrap #1 ($/t)
HRC ($/t)
Lead ($/lb)
Coal - CAPP ($/t)
Natural gas …
Tin ($/lb)
Aluminum ($/lb)
Silver ($/oz)
Nickel ($/lb)
Note: based on DB coverage; Source: Thomson One and Deutsche Bank Source: Thomson One and Deutsche Bank
Distributed on: 26/09/2016 16:03:26 GMT

26 September 2016
Metals in the Americas
Page 2 Deutsche Bank Securities Inc.
PRICE PERFORMANCE
DB M&M equities posted positive performance last week with Steel & Service Centers equities (+8% WoW) rising the
most despite a decline in US HRC prices (-5%). Industrial Metals equities increased 6% WoW aided by higher prices for
nickel (+10%), zinc (+3%) and copper (+1%). Precious Metals equities rose 5% on gains in silver (+5%) and gold (+2%).
Lastly, Aluminum & Specialty Metals equities were up 4% in-line with the improvement in aluminum (+4%).
AK Steel (+21% WoW) and US Steel (+19%) led the gains within Steel & Service Centers equities after filing anti-
circumvention request against Chinese CRC and galvanized sheet. Amongst Industrial Metals, Vale (+8%) traded higher
after Brazil granted a 10-year license for a 63-mile rail line for its S11D mine. Hecla (+9%) and Goldcorp (+7%) were the
leading performers within Precious Metals equities on higher underlying bullion prices. Within Aluminum & Specialty
Metals equities, Century Aluminum and Allegheny Tech. (+11% each) increased the most on higher aluminum and
nickel prices.
Figure 1: Commodity performance summary Figure 2: Commodity prices relative to 52 wk range 23-Sep-16 Price % 1W % YTD
Aluminum (LME) ($/lb) 0.74 4 9
Cobalt (LME) ($/lb) 12.36 2 14
Copper (LME) ($/lb) 2.19 1 3
Lead (LME) ($/lb) 0.87 (1) 6
Molybdenum (LME) ($/lb) 6.66 (7) 26
Nickel (LME) ($/lb) 4.82 10 21
Tin (LME) ($/lb) 8.93 3 35
Zinc (LME) ($/lb) 1.03 3 42
Gold (COMEX) ($/oz) 1,340 2 26
Silver (COMEX) ($/oz) 19.82 5 (0)
HRC (US Midwest) ($/st) 529 (5) 39
MB Scrap Index ($/ton) 202 (6) 14
Iron ore (62% Fe) ($/ton) 57 0 31
Coal - API2 (ICE) ($/ton) 63 2 32
Coal - CAPP (NYMEX) ($/ton) 40 - (8)
Crude Oil - WTI ($/bbl) 44 3 19
Natural Gas (NYMEX) ($/mmBTU) 3.03 3 31
0%
20%
40%
60%
80%
100%
Alu
min
um
(LM
E)
Co
balt (
LM
E)
Co
pp
er
(LM
E)
Lead
(LM
E)
Mo
lyb
denum
(LM
E)
Nic
kel (L
ME
)
Tin
(LM
E)
Zin
c (
LM
E)
Go
ld (
CO
ME
X)
Silv
er
(CO
ME
X)
HR
C (
US
Mid
west)
MB
Scra
p I
nd
ex
Iro
n o
re (
62%
Fe)
Co
al -A
PI2
(IC
E)
Co
al -C
AP
P (
NYM
EX
)
Cru
de O
il -W
TI
Natu
ral G
as (
NYM
EX
)
S&
P 5
00
M&
M
S&
P 5
00
Source: Thomson One, Platts, CRU, Metal Bulletin and Deutsche Bank
Source: Thomson One, Platts, CRU, Metal Bulletin and Deutsche Bank
Figure 3: Commodity performance (%) (1W) Figure 4: Commodity performance (%) (YTD)
10
5 43 3 3 3 2 2 2 1
0 0
-1
-5 -6-7
5
1
-8-6-4-202468
1012
Nic
kel (L
ME
)
Silv
er
(CO
ME
X)
Alu
min
um
(LM
E)
Tin
(LM
E)
Natu
ral G
as (
NYM
EX
)
Zin
c (LM
E)
Cru
de O
il -
WTI
Co
al -
AP
I2 (
ICE
)
Go
ld (C
OM
EX
)
Co
balt (
LM
E)
Co
pp
er
(LM
E)
Iro
n o
re (
62%
Fe)
Co
al -
CA
PP
(N
YM
EX
)
Lead
(LM
E)
HR
C (U
S M
idw
est)
MB
Scra
p I
nd
ex
Mo
lyb
denum
(LM
E)
S&
P 5
00 M
&M
S&
P 5
00
Commodity prices Indices
4239
3532 31 31
26 2621 19
14 149 6
3
0
-8
43
6
-20
-10
0
10
20
30
40
50
Zin
c (LM
E)
HR
C (U
S M
idw
est)
Tin
(LM
E)
Co
al -
AP
I2 (
ICE
)
Natu
ral G
as (
NYM
EX
)
Iro
n o
re (
62%
Fe)
Mo
lyb
denum
(LM
E)
Go
ld (C
OM
EX
)
Nic
kel (L
ME
)
Cru
de O
il -
WTI
Co
balt (
LM
E)
MB
Scra
p I
nd
ex
Alu
min
um
(LM
E)
Lead
(LM
E)
Co
pp
er
(LM
E)
Silv
er
(CO
ME
X)
Co
al -
CA
PP
(N
YM
EX
)
S&
P 5
00 M
&M
S&
P 5
00
Commodity prices Indices
Source: Thomson One, Platts, CRU, Metal Bulletin and Deutsche Bank
Source: Thomson One, Platts, CRU, Metal Bulletin and Deutsche Bank
Figure 5: Equities rel. to 52wk range Figure 6: Performance (%) (1W) Figure 7: Performance (%) (YTD)
0%
10%
20%
30%
40%
50%
60%
70%
80%
90%
100%
Ind
ustr
ial M
eta
ls
Pre
cio
us M
eta
ls
Ste
el &
Serv
ice
Cente
rs
Alu
min
um
&
Sp
ecia
lty M
eta
ls
S&
P 5
00 M
&M
S&
P 5
00
6
5
8
45
1
0
1
2
3
4
5
6
7
8
9
Ind
ustr
ial M
eta
ls
Pre
cio
us M
eta
ls
Ste
el &
Serv
ice
Cente
rs
Alu
min
um
&
Sp
ecia
lty M
eta
ls
S&
P 5
00 M
&M
S&
P 5
00
56
115
37
4
43
6
0
20
40
60
80
100
120
140
Ind
ustr
ial M
eta
ls
Pre
cio
us M
eta
ls
Ste
el &
Serv
ice
Cente
rs
Alu
min
um
&
Sp
ecia
lty M
eta
ls
S&
P 5
00 M
&M
S&
P 5
00
Source: Thomson One and Deutsche Bank Source: Thomson One and Deutsche Bank Source: Thomson One and Deutsche Bank

26 September 2016
Metals in the Americas
Deutsche Bank Securities Inc. Page 3
Figure 8: DB M&M performance (%) (1W) Figure 9: DB M&M performance (%) (YTD)
8 72
0
97
5 5 55 4 3 2 1
21 19
87
6 4
11 11
3 3 3
-10
0
10
20
30
Vale
Fre
ep
ort
-McM
oR
an
So
uth
ern
Co
pp
er
Teck
Hecla
Go
ldco
rp
Pan A
merican S
ilver
Kin
ross
Silv
er
Sta
nd
ard
Silv
er
Wheato
n
Barr
ick
New
mo
nt
Fra
nco
-Nevad
a
Co
eur
AK
Ste
el
US
Ste
el
Ryers
on
Nuco
r
Ste
el D
ynam
ics
Relia
nce
Centu
ry A
lum
inum
Alle
gheny T
ech.
Alc
oa
Co
nste
llium
Kais
er
Industrial Metals Precious Metals Steel & SC Al & SM
371
65 57
-1
406
217174
145136133124
12057 44
137121
3924 21 8
56 492
-1 -6-100
0
100
200
300
400
500
Teck
Vale
Fre
ep
ort
-McM
oR
an
So
uth
ern
Co
pp
er
Co
eur
Hecla
Pan A
merican S
ilver
Barr
ick
Kin
ross
Silv
er
Sta
nd
ard
Silv
er
Wheato
n
New
mo
nt
Fra
nco
-Nevad
a
Go
ldco
rp
US
Ste
el
AK
Ste
el
Ste
el D
ynam
ics
Relia
nce
Nuco
r
Ryers
on
Alle
gheny T
ech.
Centu
ry A
lum
inum
Kais
er
Alc
oa
Co
nste
llium
Industrial Metals Precious Metals Steel & SC Al & SM
Source: Thomson One and Deutsche Bank
Source: Thomson One and Deutsche Bank
Figure 10: DB M&M performance (%) (1Y) Figure 11: DB M&M performance (%) (1Y)
-
50
100
150
200
250
300
Sep
-15
Oct-
15
No
v-1
5
Dec-1
5
Jan
-16
Feb
-16
Mar-
16
Ap
r-16
May-1
6
Jun-1
6
Jul-16
Aug
-16
Sep
-16
Industrial Metals Precious Metals
Steel & Service Centers Aluminum & Specialty Metals
26
114
37
7
38
12
0
20
40
60
80
100
120
140
Ind
ustr
ial M
eta
ls
Pre
cio
us M
eta
ls
Ste
el &
Serv
ice
Cente
rs
Alu
min
um
&
Sp
ecia
lty M
eta
ls
S&
P 5
00 M
&M
S&
P 5
00
Source: Thomson One and Deutsche Bank
Source: Thomson One and Deutsche Bank
Figure 12: DB M&M 2017E P/E (x) Figure 13: DB M&M 2017E EV/EBITDA (x)
37
24
12
77
35 3430 28
21 21 21 21 1822
15 14 14 128
2519 16 14
9
-
10
20
30
40
50
60
70
80
90
Teck
So
uth
ern
Co
pp
er
Fre
ep
ort
Fra
nco
-Nevad
a
Hecla
Silv
er
Wheato
n
Pan A
merican
Silv
er
Sta
nd
ard
Go
ldco
rp
Co
eur
Min
ing
Kin
ross
Barr
ick
New
mo
nt
AK
Ste
el
US
Ste
el
Nuco
r
Relia
nce
Ste
el D
ynam
ics
Ryers
on
Centu
ry
Alle
gheny T
ech.
Alc
oa
Kais
er
Co
nste
llium
Industrial Metals Precious Metals Steel & SC Aluminum & SM
1211
96
26
19
10 9 97 7 6 6
4
87 6 6 6
4
8 7 6 6 5
-
5
10
15
20
25
30
So
uth
ern
Co
pp
er
Vale
Teck
Fre
ep
ort
Fra
nco-N
evad
a
Silv
er
Wheato
n
Hecla
Pan A
merican
Go
ldco
rp
Co
eur
Min
ing
New
mo
nt
Silv
er
Sta
nd
ard
Barr
ick
Kin
ross
Relia
nce
AK
Ste
el
Nuco
r
Ryers
on
Ste
el D
ynam
ics
US
Ste
el
Alle
gheny T
ech.
Kais
er
Alc
oa
Co
nste
llium
Centu
ry
Industrial Metals Precious Metals Steel & SC Aluminum &
SM
Source: Deutsche Bank estimates
Source: Deutsche Bank estimates
Figure 14: DB M&M forward P/E Figure 15: DB M&M forward EV/EBITDA
0x
10x
20x
30x
40x
50x
Sep
-09
Mar-
10
Sep
-10
Mar-
11
Sep
-11
Mar-
12
Sep
-12
Mar-
13
Sep
-13
Mar-
14
Sep
-14
Mar-
15
Sep
-15
Mar-
16
Sep
-16
Industrial Metals Precious Metals
Steel & Svc Centers Aluminum & Spec Metals
0x
5x
10x
15x
Sep
-09
Mar-
10
Sep
-10
Mar-
11
Sep
-11
Mar-
12
Sep
-12
Mar-
13
Sep
-13
Mar-
14
Sep
-14
Mar-
15
Sep
-15
Mar-
16
Sep
-16
Industrial Metals Precious Metals
Steel & Svc Centers Aluminum & Spec Metals
Note: Based on consensus estimates; Source: Thomson One and Deutsche Bank
Note: Based on consensus estimates; Source: Thomson One and Deutsche Bank

Meta
ls in th
e A
meric
as
26
Sep
tem
ber 2
01
6
Pag
e 4
D
eu
tsch
e B
an
k S
ecu
rities In
c.
Figure 16: DB Metals & Mining price performance
Price 52W 52W Price Upside/
Company Ticker 9/23/2016 High Low Target Downside 1W 3M 12M YTD 1W 3M 12M YTD
Freeport-McMoRan FCX.N 10.63 14.00 3.74 12 13 7 (10) 6 57 2 (14) (76) (31)
Southern Copper SCCO.N 25.96 30.21 22.29 25 (4) 2 (7) (2) (1) (3) (12) (84) (88)
Teck Resources TCK.N 18.18 18.44 2.66 11.5 (37) (0) 42 252 371 (6) 38 169 283
Vale VALE.N 5.42 6.07 2.15 6.5 20 8 9 18 65 3 5 (64) (23)
Industrial Metals 4 5 6 44 89 (0) 1 (38) 1
Barrick Gold Corporation ABX.N 18.11 23.16 6.19 22 21 4 (6) 205 145 (1) (11) 122 58
Franco-Nevada FNV.N 71.87 79.72 42.46 74 3 2 6 69 57 (3) 1 (13) (31)
Goldcorp GG.N 16.66 20.15 9.82 15 (10) 7 (5) 33 44 2 (10) (50) (44)
Kinross Gold Corporation KGC.N 4.30 5.74 1.38 4.5 5 5 (12) 169 136 0 (17) 86 48
Newmont Mining NEM.N 39.56 45.86 15.82 49 24 3 12 154 120 (2) 7 72 32
Gold 12 4 1 132 103 (1) (4) 50 16
Coeur Mining CDE.N 12.56 15.98 1.73 7.5 (40) 1 32 355 406 (4) 28 273 319
Hecla Mining HL.N 6.00 7.14 1.52 5.5 (8) 9 29 200 217 4 24 118 130
Pan American Silver PAAS.OQ 17.79 21.46 5.63 14.5 (18) 5 17 185 174 0 12 102 86
Silver Standard SSO.TO 16.71 20.02 5.49 14 (16) 5 14 103 133 (0) 10 20 46
Silver Wheaton SLW.N 27.82 30.88 10.50 37 33 5 34 140 124 (1) 29 58 36
Silver 11 5 29 171 169 (0) 25 89 82
Precious Metals 12 4 7 141 118 (1) 2 58 30
AK Steel AKS.N 4.96 6.70 1.83 4 (19) 21 2 110 121 16 (3) 28 34
Nucor NUE.N 48.81 56.90 34.86 60 23 7 (3) 27 21 2 (8) (56) (67)
Steel Dynamics STLD.OQ 24.84 27.98 15.86 32 29 6 (3) 46 39 1 (7) (37) (49)
US Steel X.N 18.95 27.49 6.67 23 21 19 5 69 137 14 1 (14) 50
Steel 22 9 (2) 40 43 3 (6) (43) (45)
Reliance RS.N 71.63 83.97 51.75 75 5 4 (9) 33 24 (1) (13) (50) (64)
Ryerson RYI.N 11.17 19.40 2.63 16 43 8 (33) 110 139 3 (38) 27 51
Service Centers 7 4 (10) 38 32 (1) (15) (44) (56)
Steel & Service Centers 20 8 (3) 39 41 3 (8) (43) (47)
Alcoa AA.N 9.76 11.31 6.74 12 23 3 (4) 6 (1) (2) (8) (76) (89)
Allegheny Technologies ATI.N 17.55 18.57 7.62 20 14 11 24 14 56 6 19 (69) (32)
Century CENX.OQ 6.59 9.21 2.80 7.5 14 11 (4) 31 49 6 (9) (51) (39)
Constellium CSTM.N 7.20 8.86 3.66 10 39 3 48 (8) (6) (2) 44 (90) (94)
Kaiser KALU.OQ 85.42 94.83 73.71 100 17 3 (7) 4 2 (3) (12) (79) (86)
Aluminum & Specialty Metals 22 4 1 7 6 (1) (4) (76) (81)
DB Metals & Mining 11 5 4 82 88 - - - -
S&P 500 Index SPSA 2,165 2,190 1,829 1 2 12 6
Relative PerformanceAbsolute Performance
Silver Standard price target stated in Canadian Dollars Source: Deutsche Bank, Bloomberg Finance LP

Meta
ls in th
e A
meric
as
26
Sep
tem
ber 2
01
6
Deu
tsch
e B
an
k S
ecu
rities In
c.
Pag
e 5
Figure 17: DB Metals & Mining valuation
Price Price Mkt cap P/BV Div yield ROE FCF Yld ND/Eq.
Company Ticker 9/23/2016 Rating Target (US$m) 2016E 2017E 2016E 2017E (x) (%) (%) (%) (%)
Freeport-McMoRan FCX.N 10.63 Hold 12 14,264 7.8 6.0 30.1 12.4 1.3 - (34.2) 2.9 115
Southern Copper SCCO.N 25.96 Hold 25 20,090 12.8 11.8 26.5 24.2 3.4 0.5 13.5 (0.4) 96
Teck Resources TCK.N 18.18 Sell 11.5 10,477 9.0 8.7 44.1 37.0 0.8 0.4 1.9 (0.5) 47
Vale VALE.N 5.42 Buy 6.5 27,931 7.3 10.6 8.9 nm 0.7 - 8.1 24.8 70
Industrial Metals 72,762 9.2 9.8 23.0 14.4 1.6 0.2 0.4 9.9 83
Barrick Gold Corporation ABX.N 18.11 Hold 22 21,098 7.2 6.5 28.5 20.6 2.1 0.4 5.2 7.1 61
Franco-Nevada FNV.N 71.87 Hold 74 12,656 26.6 25.8 86.3 77.1 3.0 1.1 4.1 2.8 (7)
Goldcorp GG.N 16.66 Sell 15 13,983 11.0 8.6 44.9 21.4 1.1 0.7 1.9 2.5 16
Kinross Gold Corporation KGC.N 4.30 Hold 4.5 5,342 5.0 3.9 33.1 20.7 1.2 - 2.2 7.1 20
Newmont Mining NEM.N 39.56 Buy 49 20,927 7.4 6.8 20.2 18.2 1.4 0.4 1.4 5.0 9
Gold 74,008 11.1 10.1 39.5 29.7 1.8 0.5 3.1 4.9 23.3
Coeur Mining CDE.N 12.56 Sell 7.5 1,993 10.3 7.2 nm 21.0 3.9 - 0.7 5.6 48
Hecla Mining HL.N 6.00 Hold 5.5 2,329 10.5 10.1 30.2 34.8 1.6 0.2 4.9 1.8 23
Pan American Silver PAAS.OQ 17.79 Hold 14.5 2,712 12.4 9.5 88.6 30.3 2.0 0.3 3.2 (2.2) (10)
Silver Standard SSO.TO 16.71 Hold 14 1,507 7.5 6.5 35.2 28.2 1.7 - 4.2 2.3 (7)
Silver Wheaton SLW.N 27.82 Buy 37 11,974 20.3 18.9 39.6 34.4 2.4 0.8 6.6 (1.4) 22
Silver 20,515 16.2 14.6 40.9 32.2 2.4 0.5 5.2 (0.2) 18
Precious Metals 94,523 12.2 11.1 39.8 30.3 1.9 0.5 3.6 3.8 22
AK Steel AKS.N 4.96 Sell 4 1,081 7.1 6.6 nm 22.4 nm - nm 32.9 nm
Nucor NUE.N 48.81 Buy 60 15,586 6.8 6.3 15.0 14.1 1.8 3.1 12.8 9.7 15
Steel Dynamics STLD.OQ 24.84 Buy 32 6,050 5.6 5.6 11.2 12.1 2.0 2.2 19.7 12.2 47
US Steel X.N 18.95 Hold 23 2,978 6.8 4.4 nm 14.5 1.1 1.1 (5.2) 18.7 60
Steel 25,695 6.5 5.9 11.7 14.0 1.7 2.5 11.8 12.3 27
Reliance RS.N 71.63 Hold 75 5,177 8.6 7.8 14.9 13.6 1.2 2.3 9.0 6.4 45
Ryerson RYI.N 11.17 Hold 16 385 5.5 5.7 7.5 8.3 nm - nm 40.5 nm
Service Centers 5,563 8.4 7.7 14.4 13.2 1 2.1 8.4 8.8 42
Steel & Service Centers 31,258 6.9 6.2 12.2 13.9 1.6 2.5 11.2 11.7 30
Alcoa AA.N 9.76 Buy 12 13,262 7.7 6.4 25.0 16.1 0.9 1.2 2.4 0.7 43
Allegheny Technologies ATI.N 17.55 Buy 20 1,883 29.0 7.5 nm 18.9 0.9 1.8 (38.5) 0.2 80
Century CENX.OQ 6.59 Hold 7.5 574 10.3 5.4 nm 25.2 0.6 - (3.7) 0.2 7
Constellium CSTM.N 7.20 Buy 10 760 7.0 5.8 29.1 8.9 nm - nm (2.7) nm
Kaiser KALU.OQ 85.42 Buy 100 1,554 7.8 6.6 17.2 13.9 1.9 2.1 13.3 2.8 13
Aluminum & Specialty Metals 18,032 10.0 6.5 21.1 16.2 0.9 1.2 (1.3) 0.6 42
DB Metals & Mining 216,576 10.2 9.5 28.6 21.4 1.7 0.8 3.2 6.7 45
EV/EBITDA (x) P/E (x)
Silver Standard price target stated in Canadian Dollars Source: Thomson One and Deutsche Bank
26 September 2016
Metals in the Americas
Page 6 Deutsche Bank Securities Inc.
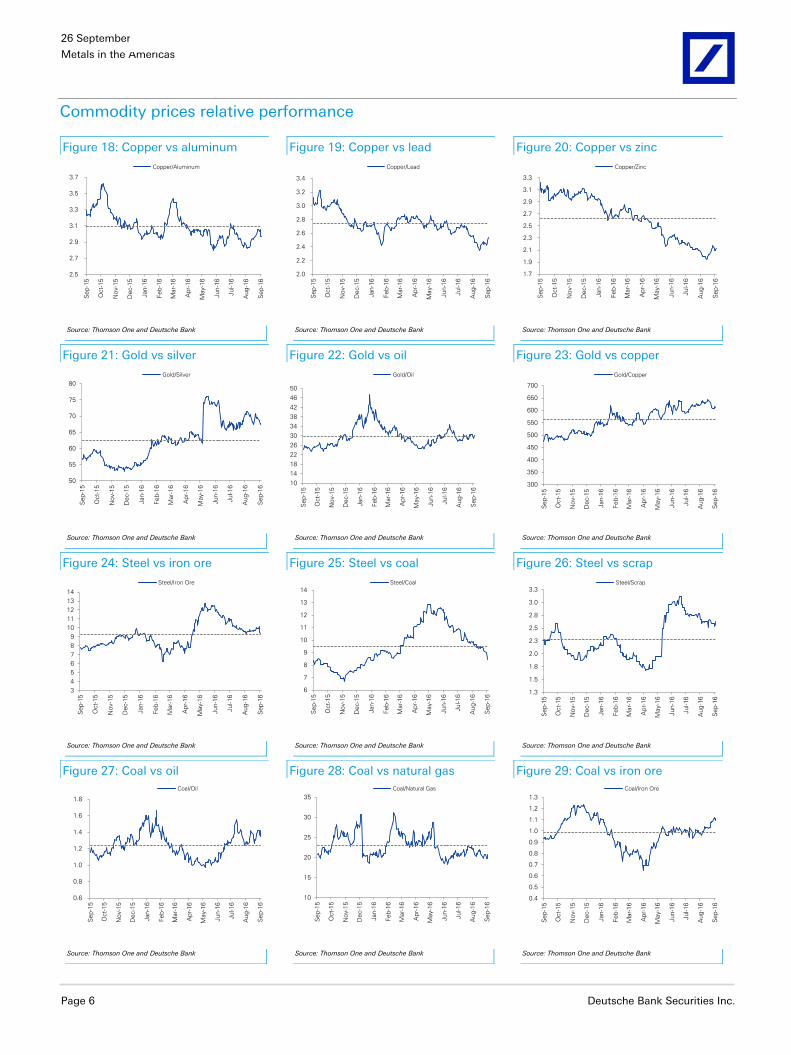
Commodity prices relative performance
Figure 18: Copper vs aluminum Figure 19: Copper vs lead Figure 20: Copper vs zinc
2.5
2.7
2.9
3.1
3.3
3.5
3.7
Sep
-15
Oct-
15
No
v-1
5
Dec-1
5
Jan
-16
Feb
-16
Mar-
16
Ap
r-16
May-1
6
Jun-1
6
Jul-16
Aug
-16
Sep
-16
Copper/Aluminum
2.0
2.2
2.4
2.6
2.8
3.0
3.2
3.4
Sep
-15
Oct-
15
No
v-1
5
Dec-1
5
Jan-1
6
Feb
-16
Mar-
16
Ap
r-16
May-1
6
Jun-1
6
Jul-16
Aug
-16
Sep
-16
Copper/Lead
1.7
1.9
2.1
2.3
2.5
2.7
2.9
3.1
3.3
Sep
-15
Oct-
15
No
v-1
5
Dec-1
5
Jan-1
6
Feb
-16
Mar-
16
Ap
r-16
May-1
6
Jun-1
6
Jul-16
Aug
-16
Sep
-16
Copper/Zinc
Source: Thomson One and Deutsche Bank Source: Thomson One and Deutsche Bank Source: Thomson One and Deutsche Bank
Figure 21: Gold vs silver Figure 22: Gold vs oil Figure 23: Gold vs copper
50
55
60
65
70
75
80
Sep
-15
Oct-
15
No
v-1
5
Dec-1
5
Jan-1
6
Feb
-16
Mar-
16
Ap
r-16
May-1
6
Jun-1
6
Jul-16
Aug
-16
Sep
-16
Gold/Silver
10
14
18
22
26
30
34
38
42
46
50
Sep
-15
Oct-
15
No
v-1
5
Dec-1
5
Jan
-16
Feb
-16
Mar-
16
Ap
r-16
May-1
6
Jun-1
6
Jul-16
Aug
-16
Sep
-16
Gold/Oil
300
350
400
450
500
550
600
650
700
Sep
-15
Oct-
15
No
v-1
5
Dec-1
5
Jan-1
6
Feb
-16
Mar-
16
Ap
r-16
May-1
6
Jun-1
6
Jul-16
Aug
-16
Sep
-16
Gold/Copper
Source: Thomson One and Deutsche Bank Source: Thomson One and Deutsche Bank Source: Thomson One and Deutsche Bank
Figure 24: Steel vs iron ore Figure 25: Steel vs coal Figure 26: Steel vs scrap
3
4
5
6
7
8
9
10
11
12
13
14
Sep
-15
Oct-
15
No
v-1
5
Dec-1
5
Jan
-16
Feb
-16
Mar-
16
Ap
r-16
May-1
6
Jun-1
6
Jul-16
Aug
-16
Sep
-16
Steel/Iron Ore
6
7
8
9
10
11
12
13
14
Sep
-15
Oct-
15
No
v-1
5
Dec-1
5
Jan-1
6
Feb
-16
Mar-
16
Ap
r-16
May-1
6
Jun-1
6
Jul-16
Aug
-16
Sep
-16
Steel/Coal
1.3
1.5
1.8
2.0
2.3
2.5
2.8
3.0
3.3
Sep
-15
Oct-
15
No
v-1
5
Dec-1
5
Jan-1
6
Feb
-16
Mar-
16
Ap
r-16
May-1
6
Jun-1
6
Jul-16
Aug
-16
Sep
-16
Steel/Scrap
Source: Thomson One and Deutsche Bank Source: Thomson One and Deutsche Bank Source: Thomson One and Deutsche Bank
Figure 27: Coal vs oil Figure 28: Coal vs natural gas Figure 29: Coal vs iron ore
0.6
0.8
1.0
1.2
1.4
1.6
1.8
Sep
-15
Oct-
15
No
v-1
5
Dec-1
5
Jan-1
6
Feb
-16
Mar-
16
Ap
r-16
May-1
6
Jun-1
6
Jul-16
Aug
-16
Sep
-16
Coal/Oil
10
15
20
25
30
35
Sep
-15
Oct-
15
No
v-1
5
Dec-1
5
Jan-1
6
Feb
-16
Mar-
16
Ap
r-16
May-1
6
Jun-1
6
Jul-16
Aug
-16
Sep
-16
Coal/Natural Gas
0.4
0.5
0.6
0.7
0.8
0.9
1.0
1.1
1.2
1.3
Sep
-15
Oct-
15
No
v-1
5
Dec-1
5
Jan-1
6
Feb
-16
Mar-
16
Ap
r-16
May-1
6
Jun-1
6
Jul-16
Aug
-16
Sep
-16
Coal/Iron Ore
Source: Thomson One and Deutsche Bank Source: Thomson One and Deutsche Bank Source: Thomson One and Deutsche Bank

26 September 2016
Metals in the Americas
Deutsche Bank Securities Inc. Page 7
DB Metals & Mining equities relative performance by underlying commodity
Figure 30: Diversified vs steel Figure 31: Diversified vs aluminum Figure 32: Diversified vs gold
0.2
0.3
0.4
0.5
0.6
0.7
0.8
0.9
1.0
1.1
1.2
Sep
-15
Oct-
15
No
v-1
5
Dec-1
5
Jan
-16
Feb
-16
Mar-
16
Ap
r-16
May-1
6
Jun-1
6
Jul-16
Aug
-16
Sep
-16
DB Am Diversified/DB NA Steel
0.2
0.4
0.6
0.8
1.0
1.2
1.4
1.6
Sep
-15
Oct-
15
No
v-1
5
Dec-1
5
Jan
-16
Feb
-16
Mar-
16
Ap
r-16
May-1
6
Jun-1
6
Jul-16
Aug
-16
Sep
-16
DB Am Diversified/DB NA Aluminum and SM
0.2
0.3
0.4
0.5
0.6
0.7
0.8
0.9
1.0
1.1
Sep
-15
Oct-
15
No
v-1
5
Dec-1
5
Jan-1
6
Feb
-16
Mar-
16
Ap
r-16
May-1
6
Jun-1
6
Jul-16
Aug
-16
Sep
-16
DB Am Diversified/DB NA Gold
Source: Thomson One and Deutsche Bank Source: Thomson One and Deutsche Bank Source: Thomson One and Deutsche Bank
Figure 33: Copper vs diversified Figure 34: Copper vs aluminum Figure 35: Copper vs gold
0.6
0.8
1.0
1.2
1.4
1.6
1.8
Sep
-15
Oct-
15
No
v-1
5
Dec-1
5
Jan-1
6
Feb
-16
Mar-
16
Ap
r-16
May-1
6
Jun-1
6
Jul-16
Aug
-16
Sep
-16
DB Am Copper/DB Am Diversified
0.3
0.4
0.5
0.6
0.7
0.8
0.9
1.0
1.1
1.2
1.3
Sep
-15
Oct-
15
No
v-1
5
Dec-1
5
Jan
-16
Feb
-16
Mar-
16
Ap
r-16
May-1
6
Jun-1
6
Jul-16
Aug
-16
Sep
-16
DB Am Copper/DB NA Aluminum
-
0.2
0.4
0.6
0.8
1.0
1.2
Sep
-15
Oct-
15
No
v-1
5
Dec-1
5
Jan-1
6
Feb
-16
Mar-
16
Ap
r-16
May-1
6
Jun-1
6
Jul-16
Aug
-16
Sep
-16
DB NA Copper/DB NA Gold
Source: Thomson One and Deutsche Bank Source: Thomson One and Deutsche Bank Source: Thomson One and Deutsche Bank
Figure 36: Aluminum vs diversified Figure 37: Aluminum vs steel Figure 38: Aluminum vs gold
0.4
0.6
0.8
1.0
1.2
1.4
1.6
1.8
Sep
-15
Oct-
15
No
v-1
5
Dec-1
5
Jan-1
6
Feb
-16
Mar-
16
Ap
r-16
May-1
6
Jun-1
6
Jul-16
Aug
-16
Sep
-16
DB NA Aluminum/DB Am Diversified
0.6
0.7
0.8
0.9
1.0
1.1
1.2
Sep
-15
Oct-
15
No
v-1
5
Dec-1
5
Jan-1
6
Feb
-16
Mar-
16
Ap
r-16
May-1
6
Jun-1
6
Jul-16
Aug
-16
Sep
-16
DB NA Aluminum/DB NA Steel
-
0.2
0.4
0.6
0.8
1.0
1.2
Sep
-15
Oct-
15
No
v-1
5
Dec-1
5
Jan-1
6
Feb
-16
Mar-
16
Ap
r-16
May-1
6
Jun-1
6
Jul-16
Aug
-16
Sep
-16
DB NA Aluminum/DB NA Gold
Source: Thomson One and Deutsche Bank Source: Thomson One and Deutsche Bank Source: Thomson One and Deutsche Bank
Figure 39: Steel vs aluminum Figure 40: Steel vs gold Figure 41: Gold vs silver
0.4
0.6
0.8
1.0
1.2
1.4
1.6
Sep
-15
Oct-
15
No
v-1
5
Dec-1
5
Jan-1
6
Feb
-16
Mar-
16
Ap
r-16
May-1
6
Jun-1
6
Jul-16
Aug
-16
Sep
-16
DB NA Steel/DB NA Aluminum and SM
-
0.2
0.4
0.6
0.8
1.0
1.2
Sep
-15
Oct-
15
No
v-1
5
Dec-1
5
Jan-1
6
Feb
-16
Mar-
16
Ap
r-16
May-1
6
Jun-1
6
Jul-16
Aug
-16
Sep
-16
DB NA NA Steel/DB NA Gold
0.5
0.6
0.7
0.8
0.9
1.0
1.1
1.2
1.3
Sep
-15
Oct-
15
No
v-1
5
Dec-1
5
Jan-1
6
Feb
-16
Mar-
16
Ap
r-16
May-1
6
Jun-1
6
Jul-16
Aug
-16
Sep
-16
DB NA Gold/DB NA Silver
Source: Thomson One and Deutsche Bank Source: Thomson One and Deutsche Bank Source: Thomson One and Deutsche Bank

26 September 2016
Metals in the Americas
Page 8 Deutsche Bank Securities Inc.
Currency movement summary
Figure 42: Currency movement - appreciation (depreciation) of currencies vs USD
Price 52W 52W Absolute Performance
Currency (FX/USD) Ticker 9/23/2016 High Low 1W 1M 3M 6M 12M Y TD
Argentine Peso ARS 15.15 15.94 9.37 (0) (2) (6) (5) (38) (15)
Brazilian Real BRL 3.23 4.21 3.13 2 (1) 4 14 28 23
Canadian Dollar CAD 1.31 1.46 1.25 1 (2) (3) 1 1 6
Chilean Peso CLP 661 732 645 2 1 1 3 6 7
Mexican Peso MXN 19.71 19.85 16.38 (0) (7) (7) (11) (14) (12)
Peruvian Sol PEN 3.36 3.54 3.19 1 (0) (2) 1 (4) 2
Americas 1 (2) (2) 0 (3) 2
Australian Dollar AUD 1.31 1.46 1.28 2 (0) 1 1 9 5
Indonesian Rupiah IDR 13,077 14,698 13,060 1 1 1 1 12 5
Russian Ruble RUB 63.75 84.24 61.29 2 1 1 7 3 15
South African Rand ZAR 13.68 16.94 13.08 4 (2) 6 12 1 13
Other producer currencies 2 0 2 5 6 10
Chinese Yuan CNY 6.67 6.70 6.32 0 (0) (1) (3) (4) (3)
Euro EUR 0.89 0.95 0.87 1 (1) (1) 0 1 3
Japanese Yen JPY 101 124 100 1 (1) 5 12 19 19
Rest of World (RoW) 1 (1) 1 3 5 7
Average 1 (1) (0) 3 2 5
Bloomberg Dollar Spot Index* BBDXY 1,186 1,253 1,156 1 (1) (2) 1 3 4 *Consists of trade-weighted basket of ten currencies (i.e. EUR, JPY, CAD, MXN, GBP, AUD, CHF, KRW, CNY and BRL) vs. USD; December 31, 2004 = 1,000 Source: Thomson One, Bloomberg Finance LP and Deutsche Bank
Figure 43: Currency performance vs USD (%) (1W) Figure 44: Currency performance vs USD (%) (YTD)
2 2
1
1
0 0
4
22
11
10
1
1
-1
0
1
2
3
4
5
CLP
BR
L
PE
N
CA
D
MX
N
AR
S
ZA
R
RU
B
AU
D
IDR
JP
Y
EU
R
CN
Y
Avera
ge
BB
DX
Y
Americas Other producing currencies RoW Overall
23
7 6
2
-12-15
15 13
5 5
19
3
-3
5 4
-20
-15
-10
-5
0
5
10
15
20
25
BR
L
CLP
CA
D
PE
N
MX
N
AR
S
RU
B
ZA
R
IDR
AU
D
JP
Y
EU
R
CN
Y
Avera
ge
BB
DX
Y
Americas Other producing currencies RoW Overall
Source: Thomson One, Bloomberg Finance LP and Deutsche Bank
Source: Thomson One, Bloomberg Finance LP and Deutsche Bank
Figure 45: 1Y currency movements - Americas Figure 46: 1Y currency movements - Others
50
60
70
80
90
100
110
120
130
140
Sep
-15
Oct-
15
No
v-1
5
Dec-1
5
Jan-1
6
Feb
-16
Mar-
16
Ap
r-16
May-1
6
Jun-1
6
Jul-16
Aug
-16
Sep
-16
ARS BRL CAD CLP MXN PEN
50
60
70
80
90
100
110
120
130
Sep
-15
Oct-
15
No
v-1
5
Dec-1
5
Jan
-16
Feb
-16
Mar-
16
Ap
r-16
May-1
6
Jun-1
6
Jul-16
Aug
-16
Sep
-16
AUD IDR RUB ZAR CNY EUR JPY
Source: Thomson One and Deutsche Bank
Source: Thomson One and Deutsche Bank

26 September 2016
Metals in the Americas
Deutsche Bank Securities Inc. Page 9
Industrial Metals
Figure 47: Industrial Metals price movement
Spot price WK %CH QTD %CH YTD% 12M %CH 2012A 2013A 2014A 2015A 2016E 2017E 2018E
Industrial Metals
Copper (Usc/lb) 219 1% -1% 3% -5% 361 334 311 250 208 203 228
Iron ore-IODEX 62% Fe ($/t) 57 0% 3% 31% -1% 124 130 97 56 49 42 45
Energy
Crude Oil-WTI ($/bbl) 44 3% -10% 19% -1% 94 98 93 49 44 53 65
Hard Coking Coal-Australia ($/t) 213 0% 129% 176% 165% 210 159 126 102 87 89 95
Natural Gas ($/mmBtu) 3.0 3% 5% 31% 18% 2.9 3.8 4.3 2.7 2.4 3.1 3.0
Thermal Coal-API2 ($/t) 63 2% 11% 32% 16% 119 100 85 71 63 59 58 Source: Deutsche Bank estimates, Platts and Thomson One
Figure 48: Copper stock vs prices Figure 49: Copper net position Figure 50: Copper forward curve
1,000
2,000
3,000
4,000
5,000
6,000
7,000
8,000
9,000
10,000
11,000
0
100
200
300
400
500
600
700
800
Sep-12 Mar-13 Sep-13 Mar-14 Sep-14 Mar-15 Sep-15 Mar-16 Sep-16
LME Copper stocks (LHS) LME Copper price (RHS)
US$/tKt
50
125
200
275
350
425
500
-50
-40
-30
-20
-10
0
10
20
30
40
50
2007 2008 2009 2010 2011 2012 2013 2014 2015 2016
Non-commercial net positions (lhs) Copper price (rhs)
K ContractsNet Long
USc/lb
Net Short
K Contracts
1.80
2.05
2.30
2.55
2.80
1 3 5 7 9 11 13 15 17 19 21 23 25 27 29 31 33 35
$/l
b
Tenor (Month)
23-Sep-16 1 Month Ago 2 Months Ago DB Copper
Source: Bloomberg Finance LP and Deutsche Bank Source: Bloomberg Finance LP and Deutsche Bank Source: Bloomberg Finance LP and Deutsche Bank
Figure 51: Chinese iron ore imports Figure 52: Chinese iron inventories Figure 53: Oil & natural gas price
20%
30%
40%
50%
60%
70%
80%
90%
0
20
40
60
80
100
120
140
Aug-01 Feb-04 Aug-06 Feb-09 Aug-11 Feb-14 Aug-16
Iron Ore Imports Fe adjusted production Imports of total needs
(m tons)
20
30
40
50
60
40
50
60
70
80
90
100
110
Aug-10 May-11 Feb-12 Nov-12 Aug-13 May-14 Feb-15 Nov-15 Aug-16
China iron ore inventory (LHS) No. of days of imports (RHS)
Days(m tons)
-
20
40
60
80
100
120
140
160
0
2
4
6
8
10
12
14
16S
ep-0
9
Mar-
10
Sep-1
0
Mar-
11
Sep-1
1
Mar-
12
Sep-1
2
Mar-
13
Sep-1
3
Mar-
14
Sep-1
4
Mar-
15
Sep-1
5
Mar-
16
Sep-1
6
Natural Gas (LHS)
Oil (RHS)($/mmBtu)
($/bbl)
Source: Bloomberg Finance LP and Deutsche Bank Source: Bloomberg Finance LP and Deutsche Bank Source: Bloomberg Finance LP and Deutsche Bank
Figure 54: Intl. coal price ($/t) Figure 55: US coal production Figure 56: US coal inventories
-
50
100
150
200
250
300
350
400
450
Sep
-09
Mar-
10
Sep
-10
Mar-
11
Sep
-11
Mar-
12
Sep
-12
Mar-
13
Sep
-13
Mar-
14
Sep
-14
Mar-
15
Sep
-15
Mar-
16
Sep
-16
Steam coal Met coal
-50%
-40%
-30%
-20%
-10%
0%
10%
20%
30%
5
10
15
20
25
Sep
-10
May-1
1
Jan-1
2
Sep
-12
May-1
3
Jan-1
4
Sep
-14
May-1
5
Jan-1
6
Sep
-16
US coal weekly output
YoY%(m tons)
-40%
-30%
-20%
-10%
0%
10%
20%
30%
40%
50%
0
50
100
150
200
250
Au
g-1
2
De
c-1
2
Apr-
13
Au
g-1
3
De
c-1
3
Apr-
14
Au
g-1
4
De
c-1
4
Apr-
15
Au
g-1
5
Dec-1
5
Apr-
16
Au
g-1
6Coal stocks (m tons)
YoY%
Source: Platts and Bloomberg Finance LP Source: Deutsche Bank and EIA Source: Deutsche Bank and EIA

26 September 2016
Metals in the Americas
Page 10 Deutsche Bank Securities Inc.
Global Industrial Metals equities performance
Figure 57: Global Industrial Metals market cap ($bn) Figure 58: Industrial Metals relative to 52wk range
83
61
39
27
17 12 11
20 14
7 6 3 1
0
10
20
30
40
50
60
70
80
90
BH
P B
illito
n
Rio
Tin
to
Gle
nco
re X
str
ata
Vale
Ang
lo A
merican
Fo
rtescue
Teck R
eso
urc
es
So
uth
ern
Co
pp
er
Fre
ep
ort
Anto
fag
asta
First
Quantu
m
Lund
in
Kaza
khm
ys
Diversified Copper
0%
10%
20%
30%
40%
50%
60%
70%
80%
90%
100%
Ang
lo A
merican
BH
P B
illito
n
Fo
rtescue
Gle
nco
re X
str
ata
Rio
Tin
to
Teck R
eso
urc
es
Vale
Iro
n o
re (
62%
Fe)
Anto
fag
asta
Fre
ep
ort
Lund
in
Kaza
khm
ys
So
uth
ern
Co
pp
er
First
Quantu
m
Co
pp
er
(LM
E)
Diversified Copper
Source: Thomson One and Deutsche Bank
Source: Thomson One and Deutsche Bank
Figure 59: Industrial Metals performance (%) (1W) Figure 60: Industrial Metals performance (%) (YTD)
1613
10 9 8 6
0
0
107 7
4 4 2 15
1
-30
-25
-20
-15
-10
-5
0
5
10
15
20
Ang
lo A
meri
can
Gle
nco
re X
str
ata
BH
P B
illit
on
Rio
Tin
to
Vale
Fo
rtescue
Teck R
eso
urc
es
Iro
n o
re (
62%
Fe)
Kaza
khm
ys
Lund
in
Fre
ep
ort
Anto
fag
asta
Fir
st
Quantu
m
So
uth
ern
Co
pp
er
Co
pp
er
(LM
E)
S&
P 5
00 M
&M
S&
P 5
00
Diversified IndicesCopper
371
179 178
10665
27 1231
12386
57 47
-1 -3
343
6
-50
0
50
100
150
200
250
300
350
400
Teck R
eso
urc
es
Ang
lo A
meri
can
Fo
rtescue
Gle
nco
re X
str
ata
Vale
BH
P B
illito
n
Rio
Tin
to
Iro
n o
re (
62%
Fe)
First
Quantu
m
Kaza
khm
ys
Fre
ep
ort
Lund
in
So
uth
ern
Co
pp
er
Anto
fag
asta
Co
pp
er
(LM
E)
S&
P 5
00 M
&M
S&
P 5
00
Diversified IndicesCopper
Source: Thomson One and Deutsche Bank
Source: Thomson One and Deutsche Bank
Industrial Metals news flow
Met coal prices set for first drop in two months Met coal prices set for the first drop in two months on declining demand from steel mills in Asia (ex-China). On 9/22, two met coal cargo sales were priced for $190-195/t FOB Australia vs. $206/t spot. Separately, Teck receives environmental approval for ~C$600m Baldy Ridge coal expansion project, Canada. The project will extend the life of Teck’s Elkview open-cut coal mine by 23 years (until 2045) and will mine ~153Mt of coal. In 2015, Elkview produced 6.5Mt of hard coking coal. (Source: Reuters, AME)
Chinese copper output rises to six-month high Chinese copper production rises to six-month high of 743kt in August (+3% MoM; +12% YoY) as smelters expanded capacity amid favorable profit margins (spot treatment charges at $105/t, highest since 2015). YTD production at 5.5m t (+9% YoY). Separately, zinc output was 517kt in August (+2%, -2%) and 4.1m t YTD (-1%) amid tightness in global ore supplies. (Source: Bloomberg Finance LP)
Chilean mining investment to decline to $49.2bn for 2016-25 Chilean mining investment to decline to $49.2bn for 2016-25 vs. prior forecast of $77.3bn for 2015-24 as miners cut capex on weaker commodity prices, as per Cochilco. Majority of investment is for copper projects with remainder for iron and gold. Chile produced 5.76m tons of copper in 2015. (Source: Reuters)
US natural gas hits a 20-month high US natural gas price hits a 20-month high of $3.05/mmBtu (+4% DoD; +30% YTD) on continued warm weather forecasts for the next two weeks, which may lead to higher operating costs at steel mini-mills and aluminum smelters. (Source: Reuters, DB)
26 September 2016
Metals in the Americas
Deutsche Bank Securities Inc. Page 11
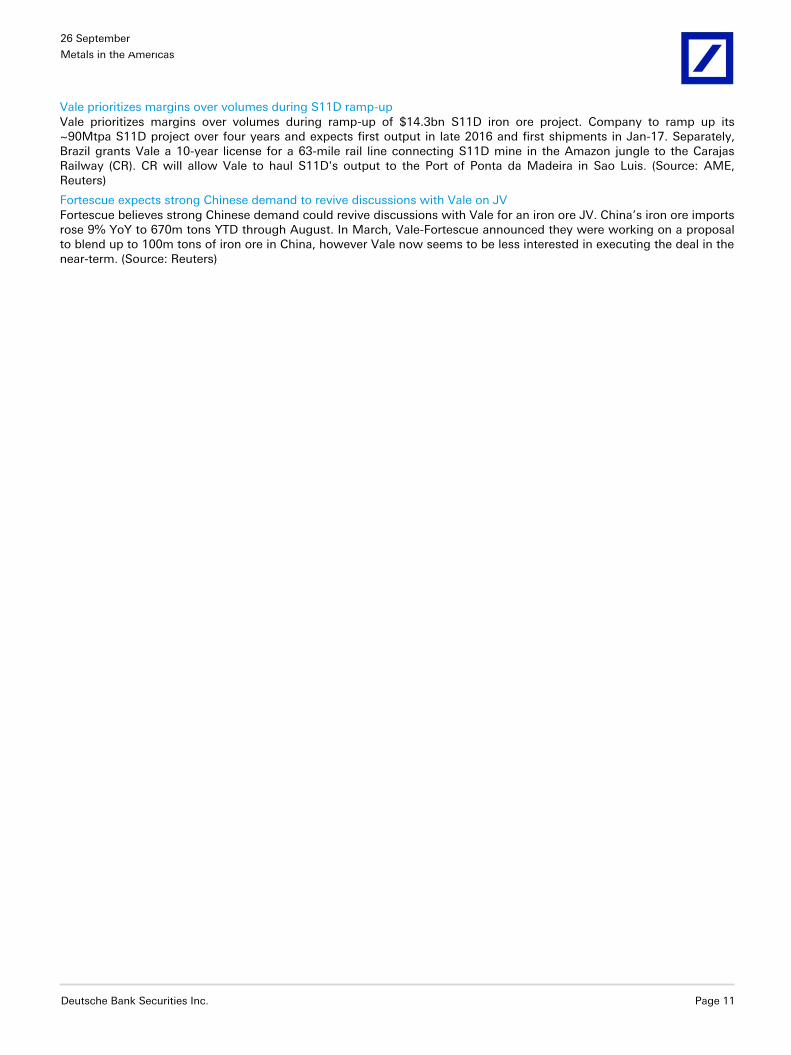
Vale prioritizes margins over volumes during S11D ramp-up Vale prioritizes margins over volumes during ramp-up of $14.3bn S11D iron ore project. Company to ramp up its ~90Mtpa S11D project over four years and expects first output in late 2016 and first shipments in Jan-17. Separately, Brazil grants Vale a 10-year license for a 63-mile rail line connecting S11D mine in the Amazon jungle to the Carajas Railway (CR). CR will allow Vale to haul S11D's output to the Port of Ponta da Madeira in Sao Luis. (Source: AME, Reuters)
Fortescue expects strong Chinese demand to revive discussions with Vale on JV Fortescue believes strong Chinese demand could revive discussions with Vale for an iron ore JV. China’s iron ore imports rose 9% YoY to 670m tons YTD through August. In March, Vale-Fortescue announced they were working on a proposal to blend up to 100m tons of iron ore in China, however Vale now seems to be less interested in executing the deal in the near-term. (Source: Reuters)
26 September 2016
Metals in the Americas
Page 12 Deutsche Bank Securities Inc.
Precious Metals
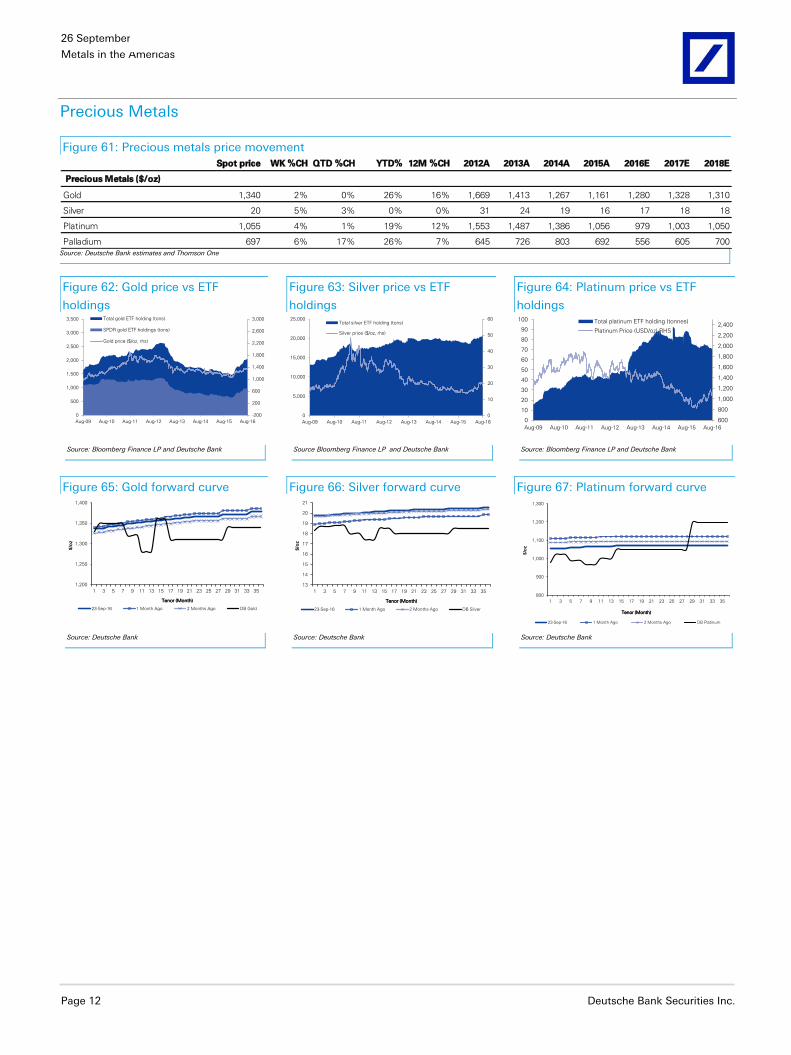
Figure 61: Precious metals price movement
Spot price WK %CH QTD %CH YTD% 12M %CH 2012A 2013A 2014A 2015A 2016E 2017E 2018E
Precious Metals ($/oz)
Gold 1,340 2% 0% 26% 16% 1,669 1,413 1,267 1,161 1,280 1,328 1,310
Silver 20 5% 3% 0% 0% 31 24 19 16 17 18 18
Platinum 1,055 4% 1% 19% 12% 1,553 1,487 1,386 1,056 979 1,003 1,050
Palladium 697 6% 17% 26% 7% 645 726 803 692 556 605 700 Source: Deutsche Bank estimates and Thomson One
Figure 62: Gold price vs ETF
holdings
Figure 63: Silver price vs ETF
holdings
Figure 64: Platinum price vs ETF
holdings
-200
200
600
1,000
1,400
1,800
2,200
2,600
3,000
0
500
1,000
1,500
2,000
2,500
3,000
3,500
Aug-09 Aug-10 Aug-11 Aug-12 Aug-13 Aug-14 Aug-15 Aug-16
Total gold ETF holding (tons)
SPDR gold ETF holdings (tons)
Gold price ($/oz, rhs)
0
10
20
30
40
50
60
0
5,000
10,000
15,000
20,000
25,000
Aug-09 Aug-10 Aug-11 Aug-12 Aug-13 Aug-14 Aug-15 Aug-16
Total silver ETF holding (tons)
Silver price ($/oz, rhs)
600
800
1,000
1,200
1,400
1,600
1,800
2,000
2,200
2,400
0
10
20
30
40
50
60
70
80
90
100
Aug-09 Aug-10 Aug-11 Aug-12 Aug-13 Aug-14 Aug-15 Aug-16
Total platinum ETF holding (tonnes)
Platinum Price (USD/oz) RHS
Source: Bloomberg Finance LP and Deutsche Bank Source Bloomberg Finance LP and Deutsche Bank Source: Bloomberg Finance LP and Deutsche Bank
Figure 65: Gold forward curve Figure 66: Silver forward curve Figure 67: Platinum forward curve
1,200
1,250
1,300
1,350
1,400
1 3 5 7 9 11 13 15 17 19 21 23 25 27 29 31 33 35
$/o
z
Tenor (Month)
23-Sep-16 1 Month Ago 2 Months Ago DB Gold
13
14
15
16
17
18
19
20
21
1 3 5 7 9 11 13 15 17 19 21 23 25 27 29 31 33 35
$/o
z
Tenor (Month)
23-Sep-16 1 Month Ago 2 Months Ago DB Silver
800
900
1,000
1,100
1,200
1,300
1 3 5 7 9 11 13 15 17 19 21 23 25 27 29 31 33 35
$/o
z
Tenor (Month)
23-Sep-16 1 Month Ago 2 Months Ago DB Platinum
Source: Deutsche Bank Source: Deutsche Bank Source: Deutsche Bank

26 September 2016
Metals in the Americas
Deutsche Bank Securities Inc. Page 13
Global Precious Metals equities performance
Figure 68: Precious Metals market cap ($bn) Figure 69: Precious Metals relative to 52wk range
21 21
14 13 13 13
10 10
7 5 5
4 4 4 3 3
17
12
3 2 2 2 2
0
5
10
15
20
25
Barr
ick
New
mo
nt
Go
ldco
rp
Po
lyus
New
cre
st
Fra
nco
-Nevad
a
Ag
nic
o-E
ag
le
Rand
go
ld
Ang
loG
old
Ashanti
Po
lym
eta
l
Kin
ross
Yam
ana
Go
ld F
ield
s
Buenaventu
ra
Sib
anye G
old
Eld
ora
do
Go
ld
Fre
snill
o
Silv
er
Whe
ato
n
Pan A
merican
Hecla
Co
eur
Min
ing
Ho
chschild
Silv
er
Sta
nd
ard
Gold Silver
0%
10%
20%
30%
40%
50%
60%
70%
80%
90%
100%
Ag
nic
o-E
ag
le
Ang
loG
old
Ashanti
Barr
ick
Buenaventu
ra
Eld
ora
do
Go
ld
Go
ldco
rp
Go
ld F
ield
s
Kin
ross
New
cre
st
New
mo
nt
Po
lym
eta
l
Po
lyus
Rand
go
ld
Sib
anye G
old
Yam
ana
Fra
nco
-Nevad
a
Go
ld (
CO
ME
X)
Co
eur
Min
ing
Fre
snill
o
Hecla
Ho
chschild
Pan A
merican
Silv
er
Sta
nd
ard
Silv
er
Wheato
n
Silv
er
(CO
ME
X)
Gold Silver
Source: Thomson One and Deutsche Bank
Source: Thomson One and Deutsche Bank
Figure 70: Precious Metals performance (%) (1W) Figure 71: Precious Metals performance (%) (YTD)
108
7 7 6 6 6 54
4 32 2
1
0
-4
2
12
9 9
5 5 5
1
5 5 5
1
-6
-4
-2
0
2
4
6
8
10
12
14
Ang
loG
old
Ashanti
New
cre
st
Go
ldco
rp
Go
ld F
ield
s
Rand
go
ld
Sib
anye G
old
Ag
nic
o-E
ag
le
Kin
ross
Barr
ick
Eld
ora
do
Go
ld
New
mo
nt
Fra
nco
-Nevad
a
Yam
ana
Buenaventu
ra
Po
lyus
Po
lym
eta
l
Go
ld (
CO
ME
X)
Ho
chschild
Fre
snill
o
Hecla
Silv
er
Sta
nd
ard
Pan A
merican
Silv
er
Wheato
n
Co
eur
Min
ing
Silv
er
(CO
ME
X)
PH
LX
Go
ld S
ilver
S&
P 5
00 M
&M
S&
P 5
00
Gold Silver Indices
231
147145142141136120107
85 81 79 68 57 48 44 39 26
423406
217
174147
124122
43
111
43
6
0
50
100
150
200
250
300
350
400
450
Buenaventu
ra
Sib
anye G
old
Barr
ick
Ang
loG
old
Ashanti
Yam
ana
Kin
ross
New
mo
nt
Ag
nic
o-E
ag
le
Go
ld F
ield
s
New
cre
st
Po
lyus
Rand
go
ld
Fra
nco
-Nevad
a
Po
lym
eta
l
Go
ldco
rp
Eld
ora
do
Go
ld
Go
ld (
CO
ME
X)
Ho
chschild
Co
eur
Min
ing
Hecla
Pan A
merican
Silv
er
Sta
nd
ard
Silv
er
Wheato
n
Fre
snill
o
Silv
er
(CO
ME
X)
PH
LX
Go
ld S
ilver
S&
P 5
00 M
&M
S&
P 5
00
Gold Silver Indices
Source: Thomson One and Deutsche Bank
Source: Thomson One and Deutsche Bank
Precious Metals news flow
Precious metals rally as Fed leaves rates unchanged Precious metals rally as Fed leaves rates unchanged but sends a strong signal for a rate hike before the end of 2016. Gold prices are up 1.4% DoD at $1,334/oz and silver 3.1% to settle at $19.84/oz. (Source: Reuters)
Japan adopts a zero interest rate target for 10-year bonds Bank of Japan adopts a zero interest rate target for 10-year government bonds to overcome deflation and achieve inflation target of >2%. New framework involves yield curve control vs. asset purchase and monetary expansion used previously. Gold prices are up ~0.5% intraday. (Source: Wall Street Journal)
India plans to double tax on precious metals Indian government plans to double tax on gold and other precious metals to 2-6% (from current 1-2%) under the Goods and Services Tax (GST) regime. The committee on GST cites that higher tax would protect revenues of the States even if standard rate of GST is set below 20%. India accounted for 25% (or 849 tons) of total consumer demand for gold in 2015. (Source: The Hindu, WGC)
Sberbank PJSC to register on the Shanghai Gold Exchange Sberbank PJSC to register on the Shanghai Gold Exchange and sell up to 100 tons/year. Also, VTB Capital is targeting sales of 20 tons in FY17 and 100 tons in FY18. If Sberbank and VTB Capital reach their target of 100 tons each, this would account for 5% of total global supply. Russian banks are targeting China as it’s the largest high paying customer. (Source: Bloomberg Finance LP)

26 September 2016
Metals in the Americas
Page 14 Deutsche Bank Securities Inc.
Barrick to resume Veladero operations in two weeks Barrick expects to resume operations at Veladero gold mine in two weeks after a second cyanide spill within a year halted operations. Company maintains Veladero’s 2016 gold production forecasts at 580-640koz (DBe 583koz). Separately, Barrick is on track to meet its 2016 debt reduction target of $2bn with or without asset sale. YTD (through 2Q16), company reduced debt by $968m and plans to repay $273m in 3Q16. (Source: Mining Weekly, Reuters)
Newmont may close Batu Hijau stake sale in 4Q16 Newmont may close Batu Hijau (Indonesia) stake sale in 4Q16, previously estimated in 3Q16, due to complex approvals process. Separately, company is interested to acquire remaining 50% of Kalgoorlie gold mine in Australia from Barrick. Kalgoorlie contributes 7% (or ~360k oz) of 2016E attributable production for each company. (Source: Reuters, DB)
Silver Wheaton keen to add 3-4 early stage financing deals Silver Wheaton keen to add three to four early stage financing deals to its portfolio with small mining exploration companies owning base metal deposits with precious metal byproducts. Company sees $2bn worth streaming deals in the market, down 60% YoY, due to availability of other forms of financing like share issuance. (Source: Reuters)

26 September 2016
Metals in the Americas
Deutsche Bank Securities Inc. Page 15
Steel & Service Centers, Aluminum & Specialty Metals
Figure 72: Steel & Service Centers, Aluminum & Specialty Metals price movement
Spot price WK %CH QTD %CH YTD% 12M %CH 2012A 2013A 2014A 2015A 2016E 2017E 2018E
Steel & Scrap
Hot rolled coil - US ($/st) 529 -5% -16% 39% 22% 664 628 627 456 520 500 550
No.1 bushelling scrap, Chicago ($/lt) 235 0% -15% 47% -2% 427 428 429 430 431 432 433
Aluminum & SM (USc/lb)
Aluminum 74 4% -2% 9% 4% 93 86 86 76 70 70 71
Lead 87 -1% 3% 6% 13% 94 98 96 81 79 79 75
Molybdenum (US$/lb) 7 -7% -11% 26% 24% 13 10 12 7 6 7 7
Nickel 482 10% 7% 21% 7% 798 685 769 538 411 454 499
Zinc 103 3% 5% 42% 36% 89 88 98 88 88 93 95 Source: Deutsche Bank estimates, mysteel.net, AMM and Bloomberg Finance LP
Figure 73: Price movements
($/tonne)
Figure 74: Input costs ($/tonne)
Figure 75: China inventories
(m tonnes)
0
200
400
600
800
1,000
1,200
0
200
400
600
800
1,000
1,200
1,400
Sep
-09
Mar-
10
Sep
-10
Mar-
11
Sep
-11
Mar-
12
Sep
-12
Mar-
13
Sep
-13
Mar-
14
Sep
-14
Mar-
15
Sep
-15
Mar-
16
Sep
-16
US HRC (left)
China HRC (left)
China Rebar (right)
0
50
100
150
200
250
300
350
400
450
0
100
200
300
400
500
600
700
800
900
1,000
Se
p-0
9
Mar-
10
Se
p-1
0
Mar-
11
Se
p-1
1
Mar-
12
Se
p-1
2
Mar-
13
Se
p-1
3
Mar-
14
Se
p-1
4
Mar-
15
Se
p-1
5
Mar-
16
Se
p-1
6
No.1 bushelling scrap (left)
Shredded auto scrap (left)
Iron ore (right)
Met coal (right)
40
60
80
100
120
140
160
0
5
10
15
20
25
Sep
-10
Jan
-11
May-1
1
Sep
-11
Jan
-12
May-1
2
Sep
-12
Jan
-13
May-1
3
Sep
-13
Jan
-14
May-1
4
Sep
-14
Jan-1
5
May-1
5
Sep
-15
Jan
-16
May-1
6
Sep
-16
China Steel Invs
China Iron ore invs (RHS)
Source: CRU and Deutsche Bank Source CRU, Platts and Deutsche Bank Source: Mysteel.net and Deutsche Bank
Figure 76: US steel imports vs
permits
Figure 77: US weekly steel output
Figure 78: Baltic freight rate
0
1
2
3
4
5
Sep
-10
Mar-
11
Sep
-11
Mar-
12
Sep
-12
Mar-
13
Sep
-13
Mar-
14
Sep
-14
Mar-
15
Sep
-15
Mar-
16
Sep
-16
Actual Imports (m stons)
Import Licenses (m stons)
20
30
40
50
60
70
80
90
700
950
1,200
1,450
1,700
1,950
2,200
Sep
-09
Jan-1
0
May-1
0
Sep
-10
Jan-1
1
May-1
1
Sep
-11
Jan-1
2
May-1
2
Sep
-12
Jan-1
3
May-1
3
Sep
-13
Jan-1
4
May-1
4
Sep
-14
Jan-1
5
May-1
5
Sep
-15
Jan-1
6
May-1
6
Sep
-16
Net output (000s tons) Capability utilization
0
1,000
2,000
3,000
4,000
5,000
6,000
Sep
-09
Mar-
10
Sep
-10
Mar-
11
Sep
-11
Mar-
12
Sep
-12
Mar-
13
Sep
-13
Mar-
14
Sep
-14
Mar-
15
Sep
-15
Mar-
16
Sep
-16
Baltic Freight Index
Source: Deutsche Bank and US Census Bureau (CB) Source: Deutsche Bank and AISI Source: Bloomberg Finance LP and Deutsche Bank
Figure 79: Aluminum stock vs prices Figure 80: Aluminum forward curve Figure 81: Nickel forward curve
1,000
1,200
1,400
1,600
1,800
2,000
2,200
2,400
2,600
2,800
3,000
0
1000
2000
3000
4000
5000
6000
Sep-12 Mar-13 Sep-13 Mar-14 Sep-14 Mar-15 Sep-15 Mar-16 Sep-16
LME Aluminum stocks (LHS) LME Aluminum price (RHS)
US$/tKt
0.60
0.65
0.70
0.75
0.80
0.85
0.90
1 3 5 7 9 11 13 15 17 19 21 23 25 27 29 31 33 35
$/l
b
Tenor (Month)
23-Sep-16 1 Month Ago 2 Months Ago DB Aluminum
3.00
4.00
5.00
6.00
1 3 5 7 9 11 13 15 17 19 21 23 25 27
$/l
b
Tenor (Month)
23-Sep-16 1 Month Ago 2 Months Ago DB Nickel
Source: Bloomberg Finance LP and Deutsche Bank Source: Bloomberg Finance LP and Deutsche Bank Source: Bloomberg Finance LP and Deutsche Bank

26 September 2016
Metals in the Americas
Page 16 Deutsche Bank Securities Inc.
Steel & Service Centers, Aluminum & Specialty Metals equities performance
Figure 82: Steel & SC, Aluminum & SM market cap ($bn) Figure 83: Steel & SC, Al. & SM relative to 52wk range
15
6 5
3 2
1 0
12
8 8
5
3
2 2 2 1
0
2
4
6
8
10
12
14
16
Nuco
r
Ste
el D
ynam
ics
Relia
nce
US
Ste
el
Co
mm
erc
ial
Meta
ls
AK
Ste
el
Ryers
on
Alc
oa
No
rsk H
yd
ro
Chalc
o
Rusal
Co
nste
llium
Alle
gheny T
ech.
Carp
ente
r Tech.
Kais
er
Alu
min
um
Centu
ry A
lum
inum
Steel & Service Centers Aluminum & Specialty Metals
0%
10%
20%
30%
40%
50%
60%
70%
80%
90%
100%
AK
Ste
el
Ryers
on
Nuco
r
Ste
el D
ynam
ics
US
Ste
el
Relia
nce
Co
mm
erc
ial M
eta
ls
HR
C (U
S M
idw
est)
MB
Scra
p I
nd
ex
Alc
oa
Alle
ghen
y T
ech.
Carp
en
ter
Tech.
Centu
ry A
lum
inum
Chalc
o
Co
nste
llium
Kais
er
Alu
min
um
No
rsk H
yd
ro
Rusal
Alu
min
um
(LM
E)
Nic
kel (L
ME
)
Steel & Service Centers Aluminum & Specialty Metals
Source: Thomson One and Deutsche Bank
Source: Thomson One and Deutsche Bank
Figure 84: Steel & SC, Al. & SM performance (%) (1W) Figure 85: Steel & SC, Al. & SM performance (%) (YTD)
2119
8 8 7 64
-5 -6
11 11 10 10
3 3 3 3
-11
4
10
5
1
-15
-10
-5
0
5
10
15
20
25
AK
Ste
el
US
Ste
el
Ryers
on
Co
mm
erc
ial M
eta
ls
Nuco
r
Ste
el D
ynam
ics
Relia
nce
HR
C (U
S M
idw
est)
MB
Scra
p I
nd
ex
Centu
ry A
lum
inum
Alle
gheny T
ech.
Carp
ente
r Tech.
No
rsk H
yd
ro
Alc
oa
Chalc
o
Co
nste
llium
Kais
er
Alu
min
um
Rusal
Alu
min
um
(LM
E)
Nic
kel (L
ME
)
S&
P 5
00 M
&M
S&
P 5
00
Steel & Sercvice Centers Aluminum & Specialty Metals Indices
139 137
121
39
24 21 18
39
14
5649
3116 11 8 2
-1
921
43
6
-20
0
20
40
60
80
100
120
140
160
Ryers
on
US
Ste
el
AK
Ste
el
Ste
el D
ynam
ics
Relia
nce
Nuco
r
Co
mm
erc
ial M
eta
ls
HR
C (U
S M
idw
est)
MB
Scra
p I
nd
ex
Alle
gheny T
ech.
Centu
ry A
lum
inum
Carp
ente
r Tech.
No
rsk H
yd
ro
Chalc
o
Rusal
Kais
er
Alu
min
um
Alc
oa
Alu
min
um
(LM
E)
Nic
kel (L
ME
)
S&
P 5
00 M
&M
S&
P 5
00
Steel & Service Centers Aluminum & Specialty Metals Indices
Source: Thomson One and Deutsche Bank
Source: Thomson One and Deutsche Bank
Steel & Service Centers, Aluminum & Specialty Metals news flow
World crude steel production rose 2% YoY in August
World crude steel production increased 1.9% YoY to 134m tons in August (flat MoM), with utilization at 68.5%
(+50bps YoY, +10bps MoM). China’s output increased 3.0% YoY to 69m tons (+2.6% MoM) while US production
decreased 3.4% to 6.7m tons (flat). YTD global output was 1.1bn tons (-0.7% YoY). (Source: WSA)
Global aluminum production up 1% MoM in August
Global aluminum production increased 1% MoM to 4.9Mt in August as China ramped production up 2% to 2.7Mt.
Through August global production was 38.1Mt (-1% YoY). (Source: International Aluminum Institute)
Chinese semi-finished aluminum net exports rose 6% MoM in August
Chinese semi-finished aluminum net exports increased to 335k tons (+5.7% MoM, +28.9% YoY) in August mainly on
higher Plates, Sheets & Strip products (+9kt or +7.7% MoM) and Foil (+7kt or +7.5%). (Source: Reuters)
Chinese aluminum producers push to supply auto and aerospace industries
Chinese aluminum producers push to supply automotive and aerospace industries, dominated by European and US
producers. China’s Hongqiao to expand smelting capacity by 16% YoY to 6m tons by YE16. (Source: Financial Times)
NA Service Center steel inventories rose 1% MoM in August
NA Service Center steel inventories rose 51kt (+1% MoM) to 9.0m st in August (-15% YoY), vs. 10-year avg. increase
of 15kt. This was mainly driven by higher flat-rolled products (+65kt, +1% MoM) partly offset by lower plates (-20kt, -
2%). Shipments increased to 3.7m st (+1% MoM and -8% YoY on days-adj. basis). Thus, inventories fell to 2.4 months
of supply (-0.4 MoM). YTD shipments total 29m st (-7% YoY). (Source: MSCI)

26 September 2016
Metals in the Americas
Deutsche Bank Securities Inc. Page 17
US sets antidumping duties of 42-94% on cut-to-length steel plate imports
US Department of Commerce sets high preliminary antidumping duties (AD) of 42-94% on cut-to-length (CTL) steel
plate imports from Brazil, South Africa and Turkey, as respondents did not cooperate with the probe. YTD (th ru July),
imports of CTL plates from these three countries declined 26% YoY to 33k st (4% of total). Next, preliminary ADs for
remaining 9 of 12 targeted countries are due Nov 7, where petitioners have alleged margins of 8-249%. (Source: SBB,
DB)
US maintains antidumping order on Russian HRC
US International Trade Commission maintains antidumping order on Russian hot-rolled coil (HRC) in its third sunset
review. HRC imports from Russia have largely stopped, after US Department of Commerce terminated the duty
suspension agreement in December 2014. Separately, Nucor may be planning a $230m cold mill expansion at its
Hickman mill in Blytheville, Arkansas. (Source: SBB)
US files complaint China to circumvent antidumping/countervailing duties on CRC
US mills file complaint with US Commerce Department alleging that China is circumventing
antidumping/countervailing duties on cold-rolled coil (CRC) and corrosion-resistant sheet by processing hot-rolled coil
in Vietnam. US imports of CRC/galvanized sheet from China dwindled from 335kt/577kt in 1H15 to 0.1kt/10kt in 1H16.
However, imports from Vietnam increased from 9kt/2kt in 1H15 to 173kt/131kt in 1H16, respectively. (Source: SBB)
US HRC price decreased $27/st WoW
US Hot-Rolled Coil (HRC) price decreased $27/st WoW to $529/st on 9/21. Spread between HR and Cold-Rolled sheet
widened to $218/st (+$7/st WoW). Separately, NYMEX 12-month forward HRC price was down $15/st WoW to
$493/st. Lastly, China spot HRC price declined $5/t WoW to $420/t (-$67/t vs. recent peak on 4/27). (Source: CRU,
CME)
US steel import permits for September through 9/20 total 2.1m st
US steel import permits for September through 9/20 total 2.1m st. If adjusted to a full month, imports would be 3.2m
st (+12% YoY), vs. August permits of 3.1m st and July imports of 3.3m st. Carbon semis (+133kt, +20% MoM) appear
to increase the most, followed by coated sheets (+50kt, +14%) and hot-rolled sheets (+46kt, +20%), whereas, cut-
length plate (-42kt, -34%) imports are decreasing. (Source: US Import Administration)
US files trade case against rebar imports from Japan, Taiwan and Turkey
US steel mills file trade case against rebar imports from Japan, Taiwan and Turkey, seeking antidumping duties of 86 -
206%. Also, counter-vailable penalties sought against Turkish rebars. From 2013-15, imports from these 3 countries
rose ~160% to 1.9m st, and held ~22% of market share. (Source: AMM)
Nucor to acquire Independence Tube Corp. for $435m
Nucor to acquire Independence Tube Corporation (ITC) for $435m or ~6x avg. EBITDA over 2013-15. ITC operates four
facilities in Illinois and Alabama (600kt combined capacity), that purchase hot-rolled coil and produce hollow
structural section steel tubing (#2 market share). Acquisition should boost internal consumption and strengthen value -
added product portfolio. (Source: Company)
Nucor plans to build a specialty cold mill at Arkansas division
Nucor plans to build a specialty cold mill at Arkansas division to expand its capability to produce advanced high-
strength, high-strength low-alloy and motor lamination steel products. The mill will cost ~$230m and is expected to
be operational in two years. (Source: Company)
Steel Dynamics provides 3Q16 EPS guide of $0.63-0.67
Steel Dynamics provides 3Q16 EPS guide of $0.63-0.67 (DBe $0.72, Thomson One consensus $0.71). Profitability of
Steel Operations to rise QoQ on higher pricing partly offset by lower shipments. Results of Fabrication and Metals
Recycling segments to decline on metal spread expansion. (Source: Company, DB, Thomson One)
Alcoa announces a proposed offering of senior unsecured notes
Alcoa announces a proposed offering of senior unsecured notes by Alcoa Nederland Holding (wholly-owned
subsidiary of Alcoa Co). Net proceeds will be used to fund transfer of assets from Alcoa to the issuer in connection
with the planned separation. The timing of pricing and terms of the notes will be subject to market conditions.
Moody’s assigned a Ba3 rating and stable outlook to the proposed notes. (Source: Company, Moody's)
Alcoa amends five-year revolving credit agreement
Alcoa amends five-year revolving credit agreement that provides for revolving loans of up to $1.5bn. The total
commitments in the credit agreement will be reduced from $4bn to $3bn. (Source: Company)

26 September 2016
Metals in the Americas
Page 18 Deutsche Bank Securities Inc.
Alcoa prices its debt offering
Alcoa prices its debt offering of $750m 6.75% senior notes due 2024 and $500m 7% senior notes due 2026. The sale
of the notes to be completed on 9/27 and proceeds to be used to fund the transfer of certain assets from Alcoa to the
issuer - Alcoa Nederland Holding in connection with the planned separation. Separately, Moody's downgraded rating
for Alcoa of Australia Ltd (60% owned by Alcoa) to Baa3 from Baa2 and places it on review for downgrade, as it
expects company’s credit profile to weaken post-separation. (Source: Company, Moody’s)
Kaiser closes its debt exchange offer
Kaiser closes offer to exchange up to ~$375m 5.875% new registered senior notes due 2024 for an equal amount of
unregistered 5.875% senior notes due 2024. The new notes are registered under the Securities Act, 1933 and are not
subject to the transfer restrictions, registration rights and special interest provisions applicable to the original
unregistered notes. (Source: Company)
Constellium to supply aluminum Crash Management Systems and Automotive Body Sheets for PEUGEOT 3008
Constellium to supply aluminum Crash Management Systems and Automotive Body Sheets for the new PEUGEOT
3008 (141k sold in 2015). Aluminum is increasingly used by automakers for light-weighting vehicles to improve fuel
economy and lower emissions. (Source: Company)
Ontario and Bedrock sign MOU to restructure US Steel Canada
Ontario government and Bedrock Industries sign MOU to restructure US Steel Canada. Terms of the agreement are
confidential. US Steel Canada employs ~2,000 workers in Ontario with capacity of 2.6Mtpa of steel. (Source: Reuters)
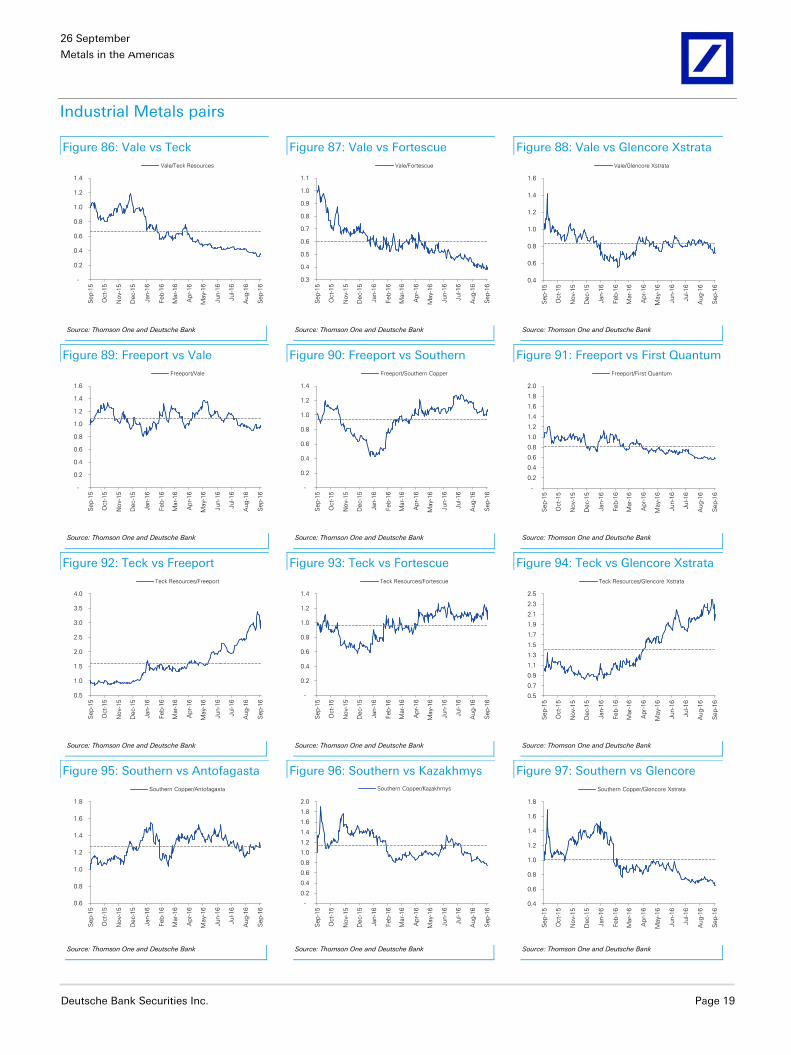
26 September 2016
Metals in the Americas
Deutsche Bank Securities Inc. Page 19
Industrial Metals pairs
Figure 86: Vale vs Teck Figure 87: Vale vs Fortescue Figure 88: Vale vs Glencore Xstrata
-
0.2
0.4
0.6
0.8
1.0
1.2
1.4
Sep
-15
Oct-
15
No
v-1
5
Dec-1
5
Jan-1
6
Feb
-16
Mar-
16
Ap
r-16
May-1
6
Jun-1
6
Jul-16
Aug
-16
Sep
-16
Vale/Teck Resources
0.3
0.4
0.5
0.6
0.7
0.8
0.9
1.0
1.1
Sep
-15
Oct-
15
No
v-1
5
Dec-1
5
Jan-1
6
Feb
-16
Mar-
16
Ap
r-16
May-1
6
Jun-1
6
Jul-16
Aug
-16
Sep
-16
Vale/Fortescue
0.4
0.6
0.8
1.0
1.2
1.4
1.6
Sep
-15
Oct-
15
No
v-1
5
Dec-1
5
Jan-1
6
Feb
-16
Mar-
16
Ap
r-16
May-1
6
Jun-1
6
Jul-16
Aug
-16
Sep
-16
Vale/Glencore Xstrata
Source: Thomson One and Deutsche Bank Source: Thomson One and Deutsche Bank Source: Thomson One and Deutsche Bank
Figure 89: Freeport vs Vale Figure 90: Freeport vs Southern Figure 91: Freeport vs First Quantum
-
0.2
0.4
0.6
0.8
1.0
1.2
1.4
1.6
Sep
-15
Oct-
15
No
v-1
5
Dec-1
5
Jan-1
6
Feb
-16
Mar-
16
Ap
r-16
May-1
6
Jun-1
6
Jul-16
Aug
-16
Sep
-16
Freeport/Vale
-
0.2
0.4
0.6
0.8
1.0
1.2
1.4
Sep
-15
Oct-
15
No
v-1
5
Dec-1
5
Jan
-16
Feb
-16
Mar-
16
Ap
r-16
May-1
6
Jun-1
6
Jul-16
Aug
-16
Sep
-16
Freeport/Southern Copper
-
0.2
0.4
0.6
0.8
1.0
1.2
1.4
1.6
1.8
2.0
Sep
-15
Oct-
15
No
v-1
5
Dec-1
5
Jan
-16
Feb
-16
Mar-
16
Ap
r-16
May-1
6
Jun-1
6
Jul-16
Aug
-16
Sep
-16
Freeport/First Quantum
Source: Thomson One and Deutsche Bank Source: Thomson One and Deutsche Bank Source: Thomson One and Deutsche Bank
Figure 92: Teck vs Freeport Figure 93: Teck vs Fortescue Figure 94: Teck vs Glencore Xstrata
0.5
1.0
1.5
2.0
2.5
3.0
3.5
4.0
Sep
-15
Oct-
15
No
v-1
5
Dec-1
5
Jan-1
6
Feb
-16
Mar-
16
Ap
r-16
May-1
6
Jun-1
6
Jul-16
Aug
-16
Sep
-16
Teck Resources/Freeport
-
0.2
0.4
0.6
0.8
1.0
1.2
1.4
Sep
-15
Oct-
15
No
v-1
5
Dec-1
5
Jan
-16
Feb
-16
Mar-
16
Ap
r-16
May-1
6
Jun-1
6
Jul-16
Aug
-16
Sep
-16
Teck Resources/Fortescue
0.5
0.7
0.9
1.1
1.3
1.5
1.7
1.9
2.1
2.3
2.5
Sep
-15
Oct-
15
No
v-1
5
Dec-1
5
Jan
-16
Feb
-16
Mar-
16
Ap
r-16
May-1
6
Jun-1
6
Jul-16
Aug
-16
Sep
-16
Teck Resources/Glencore Xstrata
Source: Thomson One and Deutsche Bank Source: Thomson One and Deutsche Bank Source: Thomson One and Deutsche Bank
Figure 95: Southern vs Antofagasta Figure 96: Southern vs Kazakhmys Figure 97: Southern vs Glencore
0.6
0.8
1.0
1.2
1.4
1.6
1.8
Sep
-15
Oct-
15
No
v-1
5
Dec-1
5
Jan-1
6
Feb
-16
Mar-
16
Ap
r-16
May-1
6
Jun-1
6
Jul-16
Aug
-16
Sep
-16
Southern Copper/Antofagasta
-
0.2
0.4
0.6
0.8
1.0
1.2
1.4
1.6
1.8
2.0
Sep
-15
Oct-
15
No
v-1
5
Dec-1
5
Jan-1
6
Feb
-16
Mar-
16
Ap
r-16
May-1
6
Jun-1
6
Jul-16
Aug
-16
Sep
-16
Southern Copper/Kazakhmys
0.4
0.6
0.8
1.0
1.2
1.4
1.6
1.8
Sep
-15
Oct-
15
No
v-1
5
Dec-1
5
Jan-1
6
Feb
-16
Mar-
16
Ap
r-16
May-1
6
Jun-1
6
Jul-16
Aug
-16
Sep
-16
Southern Copper/Glencore Xstrata
Source: Thomson One and Deutsche Bank Source: Thomson One and Deutsche Bank Source: Thomson One and Deutsche Bank

26 September 2016
Metals in the Americas
Page 20 Deutsche Bank Securities Inc.
Precious Metals pairs
Figure 98: Barrick vs Goldcorp Figure 99: Barrick vs Kinross Figure 100: Barrick vs Newmont
0.4
0.9
1.4
1.9
2.4
2.9
Sep
-15
Oct-
15
No
v-1
5
Dec-1
5
Jan-1
6
Feb
-16
Mar-
16
Ap
r-16
May-1
6
Jun-1
6
Jul-16
Aug
-16
Sep
-16
Barrick/Goldcorp
0.4
0.6
0.8
1.0
1.2
1.4
1.6
1.8
Sep
-15
Oct-
15
No
v-1
5
Dec-1
5
Jan-1
6
Feb
-16
Mar-
16
Ap
r-16
May-1
6
Jun-1
6
Jul-16
Aug
-16
Sep
-16
Barrick/Kinross
0.5
0.6
0.7
0.8
0.9
1.0
1.1
1.2
1.3
1.4
1.5
Sep
-15
Oct-
15
No
v-1
5
Dec-1
5
Jan-1
6
Feb
-16
Mar-
16
Ap
r-16
May-1
6
Jun-1
6
Jul-16
Aug
-16
Sep
-16
Barrick/Newmont
Source: Thomson One and Deutsche Bank Source: Thomson One and Deutsche Bank Source: Thomson One and Deutsche Bank
Figure 101: Goldcorp vs Kinross Figure 102: Goldcorp vs Newmont Figure 103: Goldcorp vs Coeur
-
0.2
0.4
0.6
0.8
1.0
1.2
Sep
-15
Oct-
15
No
v-1
5
Dec-1
5
Jan-1
6
Feb
-16
Mar-
16
Ap
r-16
May-1
6
Jun-1
6
Jul-16
Aug
-16
Sep
-16
Goldcorp/Kinross
0.4
0.5
0.6
0.7
0.8
0.9
1.0
1.1
Sep
-15
Oct-
15
No
v-1
5
Dec-1
5
Jan
-16
Feb
-16
Mar-
16
Ap
r-16
May-1
6
Jun-1
6
Jul-16
Aug
-16
Sep
-16
Goldcorp/Newmont
-
0.2
0.4
0.6
0.8
1.0
1.2
1.4
1.6
Sep
-15
Oct-
15
No
v-1
5
Dec-1
5
Jan-1
6
Feb
-16
Mar-
16
Ap
r-16
May-1
6
Jun-1
6
Jul-16
Aug
-16
Sep
-16
Goldcorp/Coeur d'Alene
Source: Thomson One and Deutsche Bank Source: Thomson One and Deutsche Bank Source: Thomson One and Deutsche Bank
Figure 104: Kinross vs Newmont Figure 105: Kinross (KGC) vs Coeur Figure 106: KGC vs Silver Standard
0.4
0.6
0.8
1.0
1.2
1.4
1.6
1.8
Sep
-15
Oct-
15
No
v-1
5
Dec-1
5
Jan-1
6
Feb
-16
Mar-
16
Ap
r-16
May-1
6
Jun-1
6
Jul-16
Aug
-16
Sep
-16
Kinross/Newmont
0.4
0.6
0.8
1.0
1.2
1.4
1.6
1.8
2.0
Sep
-15
Oct-
15
No
v-1
5
Dec-1
5
Jan
-16
Feb
-16
Mar-
16
Ap
r-16
May-1
6
Jun-1
6
Jul-16
Aug
-16
Sep
-16
Kinross/Coeur d"Alene
0.4
0.9
1.4
1.9
2.4
2.9
Sep
-15
Oct-
15
No
v-1
5
Dec-1
5
Jan-1
6
Feb
-16
Mar-
16
Ap
r-16
May-1
6
Jun-1
6
Jul-16
Aug
-16
Sep
-16
Kinross/Silver Standard
Source: Thomson One and Deutsche Bank Source: Thomson One and Deutsche Bank Source: Thomson One and Deutsche Bank
Figure 107: Coeur vs Barrick Figure 108: Coeur vs Newmont Figure 109: Franco-Nevada vs Silver
Wheaton
-
0.2
0.4
0.6
0.8
1.0
1.2
1.4
1.6
1.8
2.0
Sep
-15
Oct-
15
No
v-1
5
Dec-1
5
Jan
-16
Feb
-16
Mar-
16
Ap
r-16
May-1
6
Jun-1
6
Jul-16
Aug
-16
Sep
-16
Coeur d'Alene/Barrick
-
0.5
1.0
1.5
2.0
2.5
Sep
-15
Oct-
15
No
v-1
5
Dec-1
5
Jan
-16
Feb
-16
Mar-
16
Ap
r-16
May-1
6
Jun-1
6
Jul-16
Aug
-16
Sep
-16
Coeur d'Alene/Newmont
0.6
0.7
0.8
0.9
1.0
1.1
1.2
Sep
-15
Oct-
15
No
v-1
5
Dec-1
5
Jan-1
6
Feb
-16
Mar-
16
Ap
r-16
May-1
6
Jun-1
6
Jul-16
Aug
-16
Sep
-16
Franco-Nevada/Silver Wheaton
Source: Thomson One and Deutsche Bank Source: Thomson One and Deutsche Bank Source: Thomson One and Deutsche Bank

26 September 2016
Metals in the Americas
Deutsche Bank Securities Inc. Page 21
Steel & Service Centers, Aluminum & Specialty Metals pairs
Figure 110: Steel Dynamics vs US
Steel
Figure 111: Steel Dynamics vs
Nucor
Figure 112: Steel Dynamics vs AK
Steel
0.6
0.8
1.0
1.2
1.4
1.6
1.8
2.0
Sep
-15
Oct-
15
No
v-1
5
Dec-1
5
Jan-1
6
Feb
-16
Mar-
16
Ap
r-16
May-1
6
Jun-1
6
Jul-16
Aug
-16
Sep
-16
Steel Dynamics/US Steel
0.7
0.8
0.9
1.0
1.1
1.2
1.3
Sep
-15
Oct-
15
No
v-1
5
Dec-1
5
Jan-1
6
Feb
-16
Mar-
16
Ap
r-16
May-1
6
Jun-1
6
Jul-16
Aug
-16
Sep
-16
Steel Dynamics/Nucor
0.4
0.8
1.2
1.6
Sep
-15
Oct-
15
No
v-1
5
Dec-1
5
Jan-1
6
Feb
-16
Mar-
16
Ap
r-16
May-1
6
Jun-1
6
Jul-16
Aug
-16
Sep
-16
Steel Dynamics/AK Steel
Source: Thomson One and Deutsche Bank Source: Thomson One and Deutsche Bank Source: Thomson One and Deutsche Bank
Figure 113: Nucor vs Allegheny Figure 114: Nucor vs AK Steel Figure 115: Allegheny vs AK Steel
0.6
0.8
1.0
1.2
1.4
1.6
1.8
2.0
2.2
Sep
-15
Oct-
15
No
v-1
5
Dec-1
5
Jan-1
6
Feb
-16
Mar-
16
Ap
r-16
May-1
6
Jun-1
6
Jul-16
Aug
-16
Sep
-16
Nucor/Allegheny Tech
0.3
0.5
0.7
0.9
1.1
1.3
1.5
Sep
-15
Oct-
15
No
v-1
5
Dec-1
5
Jan-1
6
Feb
-16
Mar-
16
Ap
r-16
May-1
6
Jun-1
6
Jul-16
Aug
-16
Sep
-16
Nucor/AK Steel
-
0.2
0.4
0.6
0.8
1.0
1.2
Sep
-15
Oct-
15
No
v-1
5
Dec-1
5
Jan-1
6
Feb
-16
Mar-
16
Ap
r-16
May-1
6
Jun-1
6
Jul-16
Aug
-16
Sep
-16
Allegheny Tech/AK Steel
Source: Thomson One and Deutsche Bank Source: Thomson One and Deutsche Bank Source: Thomson One and Deutsche Bank
Figure 116: US Steel vs Nucor Figure 117: US Steel vs Allegheny Figure 118: US Steel vs AK Steel
0.2
0.4
0.6
0.8
1.0
1.2
1.4
1.6
1.8
Sep
-15
Oct-
15
No
v-1
5
Dec-1
5
Jan
-16
Feb
-16
Mar-
16
Ap
r-16
May-1
6
Jun-1
6
Jul-16
Aug
-16
Sep
-16
US Steel/Nucor
0.5
0.7
0.9
1.1
1.3
1.5
1.7
1.9
2.1
Sep
-15
Oct-
15
No
v-1
5
Dec-1
5
Jan
-16
Feb
-16
Mar-
16
Ap
r-16
May-1
6
Jun-1
6
Jul-16
Aug
-16
Sep
-16
US Steel/Allegheny Tech
0.4
0.5
0.6
0.7
0.8
0.9
1.0
1.1
Sep
-15
Oct-
15
No
v-1
5
Dec-1
5
Jan-1
6
Feb
-16
Mar-
16
Ap
r-16
May-1
6
Jun-1
6
Jul-16
Aug
-16
Sep
-16
US Steel/AK Steel
Source: Thomson One and Deutsche Bank Source: Thomson One and Deutsche Bank Source: Thomson One and Deutsche Bank
Figure 119: Alcoa vs Allegheny Figure 120: Kaiser vs Constellium Figure 121: Reliance vs Ryerson
0.5
0.7
0.9
1.1
1.3
1.5
1.7
Sep
-15
Oct-
15
No
v-1
5
Dec-1
5
Jan-1
6
Feb
-16
Mar-
16
Ap
r-16
May-1
6
Jun-1
6
Jul-16
Aug
-16
Sep
-16
Alcoa/Allegheny Tech
0.4
0.6
0.8
1.0
1.2
1.4
1.6
1.8
2.0
2.2
Sep
-15
Oct-
15
No
v-1
5
Dec-1
5
Jan-1
6
Feb
-16
Mar-
16
Ap
r-16
May-1
6
Jun-1
6
Jul-16
Aug
-16
Sep
-16
Kaiser/Constellium
-
0.5
1.0
1.5
2.0
2.5
Sep
-15
Oct-
15
No
v-1
5
Dec-1
5
Jan-1
6
Feb
-16
Mar-
16
Ap
r-16
May-1
6
Jun-1
6
Jul-16
Aug
-16
Sep
-16
Reliance/Ryerson
Source: Thomson One and Deutsche Bank Source: Thomson One and Deutsche Bank Source: Thomson One and Deutsche Bank
26 September 2016
Metals in the Americas
Page 22 Deutsche Bank Securities Inc.
RECENT RESEARCH
Americas Metals & Mining - Notes from the road - Denver Gold. A glimmer of hope post-slump?
We spent two days at the Denver Gold Forum meeting with Precious metal producers, Royalty/Streaming companies
and the buy-side. YTD price rally has resulted in renewed interest with ~1,000 attendees, up from ~900 YoY, albeit with
a larger component of high net worth investors in the mix. We met with over two dozen companies and many buy side
investors (~30% of attendees). Despite optimism returning, we note most large-cap managements reiterated on
maintaining discipline. While, some industry participants may repeat past mistakes (poor M&A decisions, lowering cut-
off grades and dilutive equity raisings) but, we believe the gold price outlook and industry remains supportive.
Key themes gleaned from the conference include: 1) with BS repair largely done, companies are considering "growth"
options once again, likely now in a lower-risk, staged approach; 2) Management focus increasingly on returns and
growth in per share metrics and less on EBITDA and absolute ounces; 3) While issuance of new equity, debt, streaming
deals and JVs are all possible, our sense is outright issuance of shares is increasingly frowned upon given history of
dilution and companies will look to fund moderate growth from internal cashflow and/or asset sales; 4) Exploration
budgets are increasing; and 5) Sustaining capex to increase after years of under-investment, however, companies still
guiding to reduce costs by $50-100/oz over the next 3 years.
A number of companies are positive on the outlook for Precious metals pricing, largely based on a lower-for-longer
interest rate theme, potentially weaker dollar and producer gold supply projected to decline for the industry. Technology
improvement (focus for Barrick) is one area for optimism, such as increased monitoring through sensors to reduce
down-time and the use of "big data". Most companies appear to be using a conservative gold price assumption of
$1,200/oz for Reserve pricing in 2017 and some may face asset "write-ups" under IFRS accounting rules if the gold price
recovers further.
Streaming/royalty company presentations were well attended and clearly remain an investor overweight. The
opportunity for these companies to be a source of funds to improve Precious Metals' producer Balance Sheets appears
to be slowing as bank financing and equity financing recover, however, Industrial Metals companies are providing
another wave of growth as that industry is a few years behind in terms of the financial pressure that the Precious space
went through starting in 2012. The next chapter will likely be for M&A or to assist companies advance projects.
Increasingly we see more competition in the space which could put deal returns at risk but we expect the sector to
remain a large part of the overall Precious sector.
Company-specific catalysts from our coverage include: 1) Newmont: Merian first gold pour (4Q16), Ahafo
expansion/Subika underground decision (4Q16), Batu Hijau deal close (4Q16); 2) Barrick: sale of KCGM (data room now
open), Pascua-Lama Argentina-only smaller underground project a new possibility; 3) Pan American 3-year guidance
(1Q17) given strong progress in Mexico; and 4) Hecla San Sebastian resource update (1Q17).
(Source: Jorge Beristain and Chris Terry, Deutsche Bank, September 22)

26 September 2016
Metals in the Americas
Deutsche Bank Securities Inc. Page 23
UPCOMING EVENTS
Figure 122: Upcoming events
Monday Tuesday Wednesday Thursday Friday
26 27 28 29 30
3 4 5 6 7
Jorge-Bastian joint marketing Jorge-Bastian joint marketing Jorge-Bastian joint marketing
New York Boston/Toronto San Diego/LA
10 11 12 13 14
Alcoa (AA.N) 3Q16 results
After market close
Conference Call 8:30am ET on 11-Oct
17 18 19 20 21
Vale (VALE.N) 3Q16 production results
Before market open
Reliance Steel (RS.N) 3Q16 results
Before market open
Conference Call 6:00pm ET
Dial-in: 877-407-0789
24 25 26 27 28
AK Steel (AKS.N) 3Q16 results Goldcorp (GG.N) 3Q16 results Vale (VALE.N) 3Q16 results
Before market open After market close Before market open
Conference Call 11:00am ET Conference Call 1:00pm ET on 27-Oct Conference Call 10:00am ET
Dial-in: 866-244-4637 Dial-in: 800-355-4959 Dial-in: 866-262-4553
Passcode: 1676699 Passcode: VALE
October
September
Source: Deutsche Bank and company data
Sector valuation and risks
Our PTs are based on NPV, P/E and EV/EBITDA metrics for Precious Metals, Industrial Metals, Steel and Aluminum &
Specialty Metals. On average, PTs are based ~1.0x NPV for Precious and Industrial Metals or ~6.9x EV/EBITDA for
Steels and Aluminum & Specialty Metals. We differentiate our stock views by assigning premiums or discounts to main
sub-group averages in order to reflect traditional trading patterns of stock vis-à-vis the group.
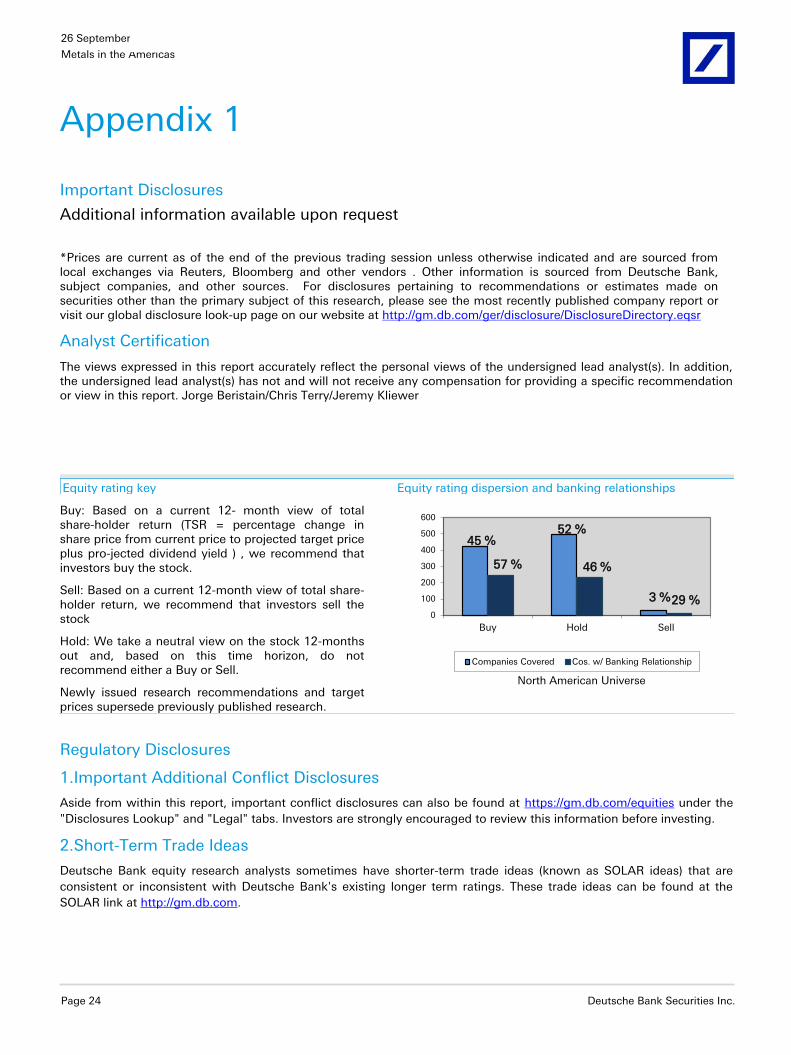
26 September 2016
Metals in the Americas
Page 24 Deutsche Bank Securities Inc.
Appendix 1
Important Disclosures
Additional information available upon request
*Prices are current as of the end of the previous trading session unless otherwise indicated and are sourced from local exchanges via Reuters, Bloomberg and other vendors . Other information is sourced from Deutsche Bank, subject companies, and other sources. For disclosures pertaining to recommendations or estimates made on securities other than the primary subject of this research, please see the most recently published company report or visit our global disclosure look-up page on our website at http://gm.db.com/ger/disclosure/DisclosureDirectory.eqsr
Analyst Certification
The views expressed in this report accurately reflect the personal views of the undersigned lead analyst(s). In addition, the undersigned lead analyst(s) has not and will not receive any compensation for providing a specific recommendation or view in this report. Jorge Beristain/Chris Terry/Jeremy Kliewer
Equity rating key Equity rating dispersion and banking relationships
Buy: Based on a current 12- month view of total share-holder return (TSR = percentage change in share price from current price to projected target price plus pro-jected dividend yield ) , we recommend that investors buy the stock.
Sell: Based on a current 12-month view of total share-holder return, we recommend that investors sell the stock
Hold: We take a neutral view on the stock 12-months out and, based on this time horizon, do not recommend either a Buy or Sell.
Newly issued research recommendations and target prices supersede previously published research.
45 %52 %
3 %
57 % 46 %
29 %0
100
200
300
400
500
600
Buy Hold Sell
North American Universe
Companies Covered Cos. w/ Banking Relationship
Regulatory Disclosures
1.Important Additional Conflict Disclosures
Aside from within this report, important conflict disclosures can also be found at https://gm.db.com/equities under the
"Disclosures Lookup" and "Legal" tabs. Investors are strongly encouraged to review this information before investing.
2.Short-Term Trade Ideas
Deutsche Bank equity research analysts sometimes have shorter-term trade ideas (known as SOLAR ideas) that are
consistent or inconsistent with Deutsche Bank's existing longer term ratings. These trade ideas can be found at the
SOLAR link at http://gm.db.com.
26 September 2016
Metals in the Americas
Deutsche Bank Securities Inc. Page 25
Additional Information
The information and opinions in this report were prepared by Deutsche Bank AG or one of its affiliates (collectively
"Deutsche Bank"). Though the information herein is believed to be reliable and has been obtained from public sources
believed to be reliable, Deutsche Bank makes no representation as to its accuracy or completeness.
If you use the services of Deutsche Bank in connection with a purchase or sale of a security that is discussed in this
report, or is included or discussed in another communication (oral or written) from a Deutsche Bank analyst, Deutsche
Bank may act as principal for its own account or as agent for another person.
Deutsche Bank may consider this report in deciding to trade as principal. It may also engage in transactions, for its own
account or with customers, in a manner inconsistent with the views taken in this research report. Others within
Deutsche Bank, including strategists, sales staff and other analysts, may take views that are inconsistent with those
taken in this research report. Deutsche Bank issues a variety of research products, including fundamental analysis,
equity-linked analysis, quantitative analysis and trade ideas. Recommendations contained in one type of communication
may differ from recommendations contained in others, whether as a result of differing time horizons, methodologies or
otherwise. Deutsche Bank and/or its affiliates may also be holding debt or equity securities of the issuers it writes on.
Analysts are paid in part based on the profitability of Deutsche Bank AG and its affiliates, which includes investment
banking revenues.
Opinions, estimates and projections constitute the current judgment of the author as of the date of this report. They do
not necessarily reflect the opinions of Deutsche Bank and are subject to change without notice. Deutsche Bank research
analysts sometimes have shorter-term trade ideas that are consistent or inconsistent with Deutsche Bank's existing
longer term ratings. These trade ideas for equities can be found at the SOLAR link at http://gm.db.com. A SOLAR idea
represents a high conviction belief by an analyst that a stock will outperform or underperform the market and/or sector
delineated over a time frame of no less than two weeks. In addition to SOLAR ideas, the analysts named in this report
may have from time to time discussed with our clients, including Deutsche Bank salespersons and traders, or may
discuss in this report or elsewhere, trading strategies or ideas that reference catalysts or events that may have a near-
term or medium-term impact on the market price of the securities discussed in this report, which impact may be
directionally counter to the analysts' current 12-month view of total return as described herein. Deutsche Bank has no
obligation to update, modify or amend this report or to otherwise notify a recipient thereof if any opinion, forecast or
estimate contained herein changes or subsequently becomes inaccurate. Coverage and the frequency of changes in
market conditions and in both general and company specific economic prospects makes it difficult to update research at
defined intervals. Updates are at the sole discretion of the coverage analyst concerned or of the Research Department
Management and as such the majority of reports are published at irregular intervals. This report is provided for
informational purposes only. It is not an offer or a solicitation of an offer to buy or sell any financial instruments or to
participate in any particular trading strategy. Target prices are inherently imprecise and a product of the analyst’s
judgment. The financial instruments discussed in this report may not be suitable for all investors and investors must
make their own informed investment decisions. Prices and availability of financial instruments are subject to change
without notice and investment transactions can lead to losses as a result of price fluctuations and other factors. If a
financial instrument is denominated in a currency other than an investor's currency, a change in exchange rates may
adversely affect the investment. Past performance is not necessarily indicative of future results. Unless otherwise
indicated, prices are current as of the end of the previous trading session, and are sourced from local exchanges via
Reuters, Bloomberg and other vendors. Data is sourced from Deutsche Bank, subject companies, and in some cases,
other parties.
The Deutsche Bank Research Department is independent of other business areas divisions of the Bank. Details regarding
our organizational arrangements and information barriers we have to prevent and avoid conflicts of interest with respect
to our research is available on our website under Disclaimer found on the Legal tab.
Macroeconomic fluctuations often account for most of the risks associated with exposures to instruments that promise
to pay fixed or variable interest rates. For an investor who is long fixed rate instruments (thus receiving these cash
flows), increases in interest rates naturally lift the discount factors applied to the expected cash flows and thus cause a
26 September 2016
Metals in the Americas
Page 26 Deutsche Bank Securities Inc.
loss. The longer the maturity of a certain cash flow and the higher the move in the discount factor, the higher will be the
loss. Upside surprises in inflation, fiscal funding needs, and FX depreciation rates are among the most common adverse
macroeconomic shocks to receivers. But counterparty exposure, issuer creditworthiness, client segmentation, regulation
(including changes in assets holding limits for different types of investors), changes in tax policies, currency
convertibility (which may constrain currency conversion, repatriation of profits and/or the liquidation of positions), and
settlement issues related to local clearing houses are also important risk factors to be considered. The sensitivity of fixed
income instruments to macroeconomic shocks may be mitigated by indexing the contracted cash flows to inflation, to
FX depreciation, or to specified interest rates – these are common in emerging markets. It is important to note that the
index fixings may -- by construction -- lag or mis-measure the actual move in the underlying variables they are intended
to track. The choice of the proper fixing (or metric) is particularly important in swaps markets, where floating coupon
rates (i.e., coupons indexed to a typically short-dated interest rate reference index) are exchanged for fixed coupons. It is
also important to acknowledge that funding in a currency that differs from the currency in which coupons are
denominated carries FX risk. Naturally, options on swaps (swaptions) also bear the risks typical to options in addition to
the risks related to rates movements.
Derivative transactions involve numerous risks including, among others, market, counterparty default and illiquidity risk.
The appropriateness or otherwise of these products for use by investors is dependent on the investors' own
circumstances including their tax position, their regulatory environment and the nature of their other assets and
liabilities, and as such, investors should take expert legal and financial advice before entering into any transaction similar
to or inspired by the contents of this publication. The risk of loss in futures trading and options, foreign or domestic, can
be substantial. As a result of the high degree of leverage obtainable in futures and options trading, losses may be
incurred that are greater than the amount of funds initially deposited. Trading in options involves risk and is not suitable
for all investors. Prior to buying or selling an option investors must review the "Characteristics and Risks of Standardized
Options”, at http://www.optionsclearing.com/about/publications/character-risks.jsp. If you are unable to access the
website please contact your Deutsche Bank representative for a copy of this important document.
Participants in foreign exchange transactions may incur risks arising from several factors, including the following: ( i)
exchange rates can be volatile and are subject to large fluctuations; ( ii) the value of currencies may be affected by
numerous market factors, including world and national economic, political and regulatory events, events in equity and
debt markets and changes in interest rates; and (iii) currencies may be subject to devaluation or government imposed
exchange controls which could affect the value of the currency. Investors in securities such as ADRs, whose values are
affected by the currency of an underlying security, effectively assume currency risk.
Unless governing law provides otherwise, all transactions should be executed through the Deutsche Bank entity in the
investor's home jurisdiction.
United States: Approved and/or distributed by Deutsche Bank Securities Incorporated, a member of FINRA, NFA and
SIPC. Analysts employed by non-US affiliates may not be associated persons of Deutsche Bank Securities Incorporated
and therefore not subject to FINRA regulations concerning communications with subject companies, public appearances
and securities held by analysts.
Germany: Approved and/or distributed by Deutsche Bank AG, a joint stock corporation with limited liability incorporated
in the Federal Republic of Germany with its principal office in Frankfurt am Main. Deutsche Bank AG is authorized under
German Banking Law and is subject to supervision by the European Central Bank and by BaFin, Germany’s Federal
Financial Supervisory Authority.
United Kingdom: Approved and/or distributed by Deutsche Bank AG acting through its London Branch at Winchester
House, 1 Great Winchester Street, London EC2N 2DB. Deutsche Bank AG in the United Kingdom is authorised by the
Prudential Regulation Authority and is subject to limited regulation by the Prudential Regulation Authority and Financial
Conduct Authority. Details about the extent of our authorisation and regulation are available on request.
Hong Kong: Distributed by Deutsche Bank AG, Hong Kong Branch.
India: Prepared by Deutsche Equities India Pvt Ltd, which is registered by the Securities and Exchange Board of India
(SEBI) as a stock broker. Research Analyst SEBI Registration Number is INH000001741. DEIPL may have received

26 September 2016
Metals in the Americas
Deutsche Bank Securities Inc. Page 27
administrative warnings from the SEBI for breaches of Indian regulations.
Japan: Approved and/or distributed by Deutsche Securities Inc.(DSI). Registration number - Registered as a financial
instruments dealer by the Head of the Kanto Local Finance Bureau (Kinsho) No. 117. Member of associations: JSDA,
Type II Financial Instruments Firms Association and The Financial Futures Association of Japan. Commissions and risks
involved in stock transactions - for stock transactions, we charge stock commissions and consumption tax by
multiplying the transaction amount by the commission rate agreed with each customer. Stock transactions can lead to
losses as a result of share price fluctuations and other factors. Transactions in foreign stocks can lead to additional
losses stemming from foreign exchange fluctuations. We may also charge commissions and fees for certain categories
of investment advice, products and services. Recommended investment strategies, products and services carry the risk
of losses to principal and other losses as a result of changes in market and/or economic trends, and/or fluctuations in
market value. Before deciding on the purchase of financial products and/or services, customers should carefully read the
relevant disclosures, prospectuses and other documentation. "Moody's", "Standard & Poor's", and "Fitch" mentioned in
this report are not registered credit rating agencies in Japan unless Japan or "Nippon" is specifically designated in the
name of the entity. Reports on Japanese listed companies not written by analysts of DSI are written by Deutsche Bank
Group's analysts with the coverage companies specified by DSI. Some of the foreign securities stated on this report are
not disclosed according to the Financial Instruments and Exchange Law of Japan.
Korea: Distributed by Deutsche Securities Korea Co.
South Africa: Deutsche Bank AG Johannesburg is incorporated in the Federal Republic of Germany (Branch Register
Number in South Africa: 1998/003298/10).
Singapore: by Deutsche Bank AG, Singapore Branch or Deutsche Securities Asia Limited, Singapore Branch (One Raffles
Quay #18-00 South Tower Singapore 048583, +65 6423 8001), which may be contacted in respect of any matters
arising from, or in connection with, this report. Where this report is issued or promulgated in Singapore to a person who
is not an accredited investor, expert investor or institutional investor (as defined in the applicable Singapore laws and
regulations), they accept legal responsibility to such person for its contents.
Taiwan: Information on securities/investments that trade in Taiwan is for your reference only. Readers should
independently evaluate investment risks and are solely responsible for their investment decisions. Deutsche Bank
research may not be distributed to the Taiwan public media or quoted or used by the Taiwan public media without
written consent. Information on securities/instruments that do not trade in Taiwan is for informational purposes only and
is not to be construed as a recommendation to trade in such securities/instruments. Deutsche Securities Asia Limited,
Taipei Branch may not execute transactions for clients in these securities/instruments.
Qatar: Deutsche Bank AG in the Qatar Financial Centre (registered no. 00032) is regulated by the Qatar Financial Centre
Regulatory Authority. Deutsche Bank AG - QFC Branch may only undertake the financial services activities that fall
within the scope of its existing QFCRA license. Principal place of business in the QFC: Qatar Financial Centre, Tower,
West Bay, Level 5, PO Box 14928, Doha, Qatar. This information has been distributed by Deutsche Bank AG. Related
financial products or services are only available to Business Customers, as defined by the Qatar Financial Centre
Regulatory Authority.
Russia: This information, interpretation and opinions submitted herein are not in the context of, and do not constitute,
any appraisal or evaluation activity requiring a license in the Russian Federation.
Kingdom of Saudi Arabia: Deutsche Securities Saudi Arabia LLC Company, (registered no. 07073-37) is regulated by the
Capital Market Authority. Deutsche Securities Saudi Arabia may only undertake the financial services activities that fall
within the scope of its existing CMA license. Principal place of business in Saudi Arabia: King Fahad Road, Al Olaya
District, P.O. Box 301809, Faisaliah Tower - 17th Floor, 11372 Riyadh, Saudi Arabia.
United Arab Emirates: Deutsche Bank AG in the Dubai International Financial Centre (registered no. 00045) is regulated
by the Dubai Financial Services Authority. Deutsche Bank AG - DIFC Branch may only undertake the financial services
activities that fall within the scope of its existing DFSA license. Principal place of business in the DIFC: Dubai
International Financial Centre, The Gate Village, Building 5, PO Box 504902, Dubai, U.A.E. This information has been

26 September 2016
Metals in the Americas
Page 28 Deutsche Bank Securities Inc.
distributed by Deutsche Bank AG. Related financial products or services are only available to Professional Clients, as
defined by the Dubai Financial Services Authority.
Australia: Retail clients should obtain a copy of a Product Disclosure Statement (PDS) relating to any financial product
referred to in this report and consider the PDS before making any decision about whether to acquire the product. Please
refer to Australian specific research disclosures and related information at
https://australia.db.com/australia/content/research-information.html
Australia and New Zealand: This research, and any access to it, is intended only for "wholesale clients" within the
meaning of the Australian Corporations Act and New Zealand Financial Advisors Act respectively.
Additional information relative to securities, other financial products or issuers discussed in this report is available upon
request. This report may not be reproduced, distributed or published without Deutsche Bank's prior written consent.
Copyright © 2016 Deutsche Bank AG
David Folkerts-Landau Group Chief Economist and Global Head of Research
Raj Hindocha Global Chief Operating Officer
Research
Michael Spencer Head of APAC Research
Global Head of Economics
Steve Pollard Head of Americas Research
Global Head of Equity Research
Anthony Klarman Global Head of Debt Research
Paul Reynolds Head of EMEA
Equity Research
Dave Clark Head of APAC
Equity Research
Pam Finelli Global Head of
Equity Derivatives Research
Andreas Neubauer Head of Research - Germany
Stuart Kirk Head of Thematic Research
International locations
Deutsche Bank AG
Deutsche Bank Place
Level 16
Corner of Hunter & Phillip Streets
Sydney, NSW 2000
Australia
Tel: (61) 2 8258 1234
Deutsche Bank AG
Große Gallusstraße 10-14
60272 Frankfurt am Main
Germany
Tel: (49) 69 910 00
Deutsche Bank AG
Filiale Hongkong
International Commerce Centre,
1 Austin Road West,Kowloon,
Hong Kong
Tel: (852) 2203 8888
Deutsche Securities Inc.
2-11-1 Nagatacho
Sanno Park Tower
Chiyoda-ku, Tokyo 100-6171
Japan
Tel: (81) 3 5156 6770
Deutsche Bank AG London 1 Great Winchester Street
London EC2N 2EQ
United Kingdom
Tel: (44) 20 7545 8000
Deutsche Bank Securities Inc. 60 Wall Street
New York, NY 10005
United States of America
Tel: (1) 212 250 2500