universitÁ degli studi di padova · 2017-12-01 · (jimi hendrix) iv. i summary ... unidirezionali...
TRANSCRIPT
I
UNIVERSITÁ DEGLI STUDI DI PADOVA
DIPARTIMENTO DI TECNICA E GESTIONE
DEI SISTEMI INDUSTRIALI
SCUOLA DI DOTTORATO IN INGEGNERIA MECCATRONICA E
DELL' INNOVAZIONE MECCANICA DEL PRODOTTO
CICLO XXVI
MULTIAXIAL FATIGUE BEHAVIOUR OF
COMPOSITE MATERIALS: CHARACTERISATION
AND MODELLING
Direttore della Scuola: Ch.mo Prof. Alessandro Persona
Supervisore: Ch.mo Prof. Marino Quaresimin
Dottorando: Paolo Andrea Carraro

II

III
Knowledge speaks,
but wisdom listens
(Jimi Hendrix)

IV
I
Summary
Thanks to their lightness and versatility combined with excellent mechanical properties,
composite materials underwent an increasing relevance in the last twenty years in many
industrial fields, also for structural applications.
This class of materials offer a wide range of advantages but it is still characterized by a quite
high cost with respect to more traditional structural materials. One of the reasons is the lack of
reliable design procedures, as well as of extensive experimental investigations in the literature
providing clear and general information.
This is particularly evident with reference to the behaviour of composite laminates and bonded
joints under multiaxial fatigue loading, which often characterise in-service conditions.
With the aim to acquire information on the multiaxial fatigue behaviour of unidirectional
composites, a specimen configuration was first defined, suitable to characterise the matrix-
dominated multiaxial fatigue behaviour of a composite lamina, which is of great importance
for the damage evolution in laminates (chapter 2). Tubular specimens subjected to combined
tension/torsion loading were identified as the best compromise between reliability of results,
easiness of testing and possibility to obtain multiaxial stress states of interest.
In the third chapter the results of an extensive experimental investigation on tubular specimens
is presented. Tubes were fatigue tested with several values of the biaxiality (shear to
transverse) ratio and load ratio (ratio between the minimum and the maximum fatigue loads).
A strong influence of both parameters was found on the off-axis crack initiation and
propagation phenomena, as well as on the damage mechanisms at the micro-scale.
Uniaxial fatigue tests were then carried out on multidirectional flat laminates, designed to
achieve local multiaxial stress states similar to those applied to the tubes by means of
tension/torsion external loads. This activity, presented in the fourth chapter, revealed the
equivalence between external (obtained by applying external loads in different directions) and
internal (due to material anisotropy) multiaxial stress states. This represents a fundamental
step for the extension of experimental results and predictive models to general loading
conditions.
The experimental activity on tubes provided information on the damage mechanisms at the
micro-scale, responsible for fatigue failure of a unidirectional lamina. On the basis of these
mechanisms a criterion for predicting crack initiation in a unidirectional lamina under
multiaxial fatigue was developed by means of a multiscale approach (chapter 5). This criterion
resulted in sound agreement with the new data on tubes, with data on flat unidirectional

II
laminates from the literature and with crack initiation data on the off-axis layers of the
laminates reported in chapter 4.
A basic topic related to the analysis of multidirectional laminates is the stiffness degradation
due to off-axis cracks in their plies. Dealing with such a topic, an analytical model was
developed for predicting the stiffness of a laminate as a function of the crack density in its
layers accounting for the interaction between cracks in different layers (chapter 6). In addition
the model is capable of calculating the stress re-distribution due to the presence of cracks. This
is fundamental for the development of a new procedure for predicting the fatigue crack density
evolution in multidirectional laminates, presented in chapter 7.
To this aim the experimental observations, the analytical models and criteria previously
presented, combined with a statistical approach, have been used to predict the initiation and
propagation of multiple cracks in a laminate. As a consequence, when this procedure is
combined with the model presented in chapter 6, both the stiffness degradation and the stress
re-distribution, useful for the estimation of the total fatigue life, can be predicted.
When composite laminates are used as adherends in bonded joints the bonding surface
represents a critical position for the onset of fatigue cracks. As a consequence an experimental
investigation on the propagation of a bondline crack in composite bonded joints subjected to
mixed mode I + II (opening + sliding) fatigue loading was carried out and presented in chapter
8. A criterion to predict the crack propagation rate under mixed mode loading was also
developed, based on the damage mechanisms observed during the experimental campaign.
Eventually, in Appendix A an analytical model for predicting the initiation of a fibre-matrix
debond crack under biaxial static loads is presented. The model provides useful information on
the influence of the main geometrical and interface parameters of the fibre-matrix interface
strength.

III
Sommario
Grazie alla loro leggerezza e versatilità combinate ad eccellenti proprietà meccaniche, i
materiali compositi hanno acquisito un'importanza sempre maggiore negli ultimi
vent'anni in molti settori industriali, anche per applicazioni strutturali.
A fronte dei numerosi vantaggi offerti da questa classe di materiali vi è un costo che
rimane ancora piuttosto elevato rispetto ai più tradizionali materiali da costruzione. Una
delle ragioni è la mancanza di procedure di progettazione affidabili e riconosciute,
nonché l'assenza, in letteratura, di estese caratterizzazioni sperimentali da cui acquisire
informazioni di carattere generale. Ciò è particolarmente evidente in riferimento al
comportamento a fatica multiassiale di lamine, laminati e giunzioni incollate in
composito.
Al fine di sopperire alla mancanza di informazioni sul comportamento a fatica
multiassiale di lamine unidirezionali, nonché all'assenza di una procedura adeguata di
test, è stata inizialmente definita una configurazione di provini adatta a caratterizzare la
risposta matrix-dominated (particolarmente significativa per il danneggiamento a fatica
di laminati) di materiali compositi unidirezionali (capitolo 2). Provini tubolari soggetti a
carichi ciclici di trazione e torsione combinati sono stati identificati come il miglior
compromesso tra affidabilità dei risultati, semplicità di testing e possibilità di ottenere
condizioni multiassiali di interesse.
Nel terzo capitolo sono riportati i risultati di un'estesa campagna sperimentale su tali
provini tubolari in presenza di diversi rapporti di biassialità (tensione di taglio su
tensione trasversale) e rapporti di ciclo (rapporto tra il minimo e il massimo carico di
fatica). É stata riscontrata una notevole influenza di tali parametri sull'innesco e
propagazione di cricche off-axis, nonché sui meccanismi di danneggiamento su scala
microscopica. Sono poi stati testati a fatica uni-assiale dei laminai piani multi-direzionali
progettati per avere condizioni di multiassialità locali simili a quelle ottenute sui provini
tubolari tramite carichi esterni in diverse direzioni. L'attività, presentata al quarto
capitolo, ha permesso di verificare l'equivalenza tra condizioni multiassiali ti tipo
esterno (carichi in più direzioni) e interno (dovute all'anisotropia di lamine e laminati in
composito). Ciò rappresenta uno step fondamentale per l'estensione di risultati
sperimentali e modelli previsionali a condizioni di carico generiche.

IV
L'attività sperimentale sviluppata sui tubi ha fornito informazioni sui meccanismi di
danneggiamento a livello microscopico che sono responsabili del cedimento a fatica
della lamina unidirezionale. Sulla base di tali meccanismi è stato proposto un criterio per
l'innesco di cricche a fatica multiassiale in lamine in composito basato su un approccio
multiscala (capitolo 5). Il criterio è risultato in ottimo accordo con i nuovi dati
sperimentali sui campioni tubolari, con dati disponibili in letteratura riguardanti lamine
unidirezionali piane e con i dati ad innesco sugli strati off-axis dei laminati testati al
capitolo 4.
Parlando quindi di laminati multi-direzionali, un aspetto fondamentale è la diminuzione
di rigidezza di questi ultimi dovuto all'innesco e propagazione di cricche multiple negli
strati off-axis. A tal proposito è stato proposto un modello analitico in grado di legare la
densità di cricche in ciascuno strato di un laminato alla diminuzione di rigidezza globale
considerando anche l'interazione tra cricche presenti su strati diversi (capitolo 6). Tale
modello fornisce anche le distribuzioni di tensione dovute alla presenza delle cricche
stesse. Questo è un aspetto di fondamentale importanza per lo sviluppo di una procedura
per prevedere l'evoluzione della densità di cricche in laminati multi-direzionali sollecitati
a fatica, presentata al capitolo 7. A tale scopo le osservazioni sperimentali, i modelli
analitici e i criteri sviluppati in precedenza, combinati ad un approccio di tipo statistico,
vengono utilizzati per prevedere l'innesco e propagazione di cricche multiple in un
laminato. Di conseguenza, combinata con il modello precedentemente illustrato, la
procedura consente di prevedere sia la diminuzione di rigidezza di laminati sia la
ridistribuzione delle tensioni per effetto del danneggiamento rappresentando quindi uno
strumento utile anche alla stima della vita a fatica totale di un laminato.
Quando i laminati in composito sono utilizzati come aderendi in giunzioni incollate,
l'interfaccia di incollaggio rappresenta una zona particolarmente critica per l'innesco di
cricche a fatica. Di conseguenza è stata analizzata sperimentalmente la propagazione di
cricche in giunzioni incollate soggette a carichi ciclici di modo misto I + II (apertura +
scorrimento). Ancora una volta i meccanismi osservati su scala microscopica sono stati
utilizzati per la formulazione di un criterio damage-based per la previsione della velocità
di propagazione di cricche in giunzioni incollate sollecitate in modo misto (capitolo 8).
In fine, in Appendice A è presentato un modello analitico sviluppato per la previsione
dell'innesco di una cricca di debonding tra fibra e matrice in condizioni di carico statico
biassiale. Il modello è utile per trarre informazioni sull'influenza dei principali parametri
geometrici e interfacciali sulla resistenza dell'interfaccia fibra-matrice.

V
Acknowledgements
I would like to thank sincerely Prof. Marino Quaresimin for giving me great opportunities, for
his precious suggestions and the constant support.
I also express my deep gratitude to the "Multiaxial Fatigue Team" composed by Ramesh
Talreja (TAMU), Janis Varna (LTU), Povl Brønsted, Bent F. Sørensen and Lars Pilgaard
Mikkelsen (DTU) as well as Marino Quaresimin (UNIPD). Discussions with them have been
fundamental for the development of the activity of this thesis and for my personal growth as a
researcher.

VI

VII
Ringraziamenti
Quando circa quattro anni fa stavo per conseguire la laurea magistrale non mi sfiorava l'idea di
intraprendere il percorso del dottorato, che reputavo un po' rischioso e dal futuro troppo
incerto. Un po' alla volta però ho cominciato ad accorgermi che mi stavo appassionando molto
alla ricerca, agli stimoli e alle sfide che questa comporta. Devo per tanto ringraziare
sinceramente il Prof. Marino Quaresimin che per primo ha instillato nella mia mente la
possibilità che io potessi intraprendere questo percorso e che fossi adatto per farlo. Lo
ringrazio della fiducia e il sostegno che mi ha sempre mostrato in questi anni.
Tuttavia la decisione di diventare un dottorando non è stata assolutamente facile e devo
ringraziare molte persone, colleghi amici e familiari, che mi hanno aiutato nella scelta che poi
si è rivelata essere quella giusta, come tutte le scelte che assecondano le nostre passioni e le
nostre inclinazioni.
Andando con ordine, ringrazio innanzitutto la mia famiglia (Franco, Simonetta, Valentina e
ora anche Johnny) per aver capito la mia scelta ed averla sostenuta moralmente e
materialmente.
Ringrazio il mio amico e collega Michele Zappalorto per i consigli, il sostegno e
l'incoraggiamento che mi ha sempre dato in questi anni, a livello professionale e personale,
che sono stati fondamentali per iniziare e proseguire con successo quest'avventura.
Ringrazio in modo particolare anche Marco Salviato, amico ed ex-collega, con cui ho
condiviso molto in questi anni, nel bene e nel male, dentro e fuori dal posto di lavoro. Da lui
ho imparato moltissimo e auguro a lui e a Rossella una vita piena di soddisfazioni e serenità.
Ringrazio gli altri miei "stretti" colleghi e amici Alessandro e Lucio, che reputo persone di
grande valore sia professionale che umano, a cui auguro di concludere questo percorso di
dottorato con le soddisfazioni che ho avuto modo di avere io.
Grazie anche a Christian, Alberto e Pasquale per rendere l'ambiente di lavoro un posto in cui si
incontrano gli amici, oltre che i colleghi, e in cui si passano momenti di divertimento e
condivisione.
Ringrazio i miei amici e colleghi cinesi Yongxin e Linqi. Lavorare con loro è stato molto
stimolante e divertente.
Un ringraziamento mi piace dedicarlo anche al mio amico di sempre Alberto con cui ho
condiviso tanto negli ultimi 15 anni. Sapere che la sua amicizia è un punto fermo nella mia
vita mi dà fiducia e serenità.

VIII
Ma il ringraziamento più importante va a mia moglie Elena, che in questi anni ha sempre
saputo trovare i modi e le parole per incoraggiare e sostenere ogni mia scelta e per darmi forza
e conforto nei momenti di difficoltà che di certo non sono mancati. La sua presenza e il suo
amore rendono tali i momenti di gioia e danno loro bellezza. Sapere che la sera torno a casa da
lei rende le giornate pesanti, le delusioni e le difficoltà meno amare.
Per questi motivi dedico a lei il frutto del lavoro di questi tre anni intensi.
Climb, find your way
scale high, don't look back
with hope you will find
the life you seek
(Haken -Because it's there-)
IX
List of contents
Summary .................................................................................................................................... I
Sommario ................................................................................................................................ III
Acknowledgements ................................................................................................................... V
Ringraziamenti ...................................................................................................................... VII
1. Introduction: motivations, problems and methodology ..................................................... 1
1.1. Introduction ...................................................................................................................... 1
1.2. Parameters influencing the fatigue behaviour of composites ........................................... 5
1.3. Multiscale nature of composite materials ......................................................................... 6
1.4. Objectives and contents .................................................................................................... 9
1.4.1. Multiaxial fatigue of composite laminae and laminates............................................. 9
1.4.2. Crack propagation in composite bonded joints ........................................................ 13
References of chapter 1 ......................................................................................................... 14
2. Development of a specimen configuration and a test procedure for multiaxial fatigue
testing of UD composites ......................................................................................................... 13
2.1. Introduction .................................................................................................................... 13
2.2. Configurations for multiaxial testing of composites ...................................................... 16
2.3. Tubular specimens: possible configurations and stress analysis .................................... 19
2.4. Materials, tube manufacturing and test equipment ......................................................... 21
2.5. Results of fatigue tests .................................................................................................... 25
2.6. Modifications of specimens' lay-up ................................................................................ 29
2.6.1 [0F/90U,3] tubes .......................................................................................................... 30
2.6.2 [0F/90U,3/0F] tubes ...................................................................................................... 32
2.7. Conclusions .................................................................................................................... 33
Appendix 2.A ........................................................................................................................ 34
References of chapter 2 ......................................................................................................... 38
3. Damage initiation and evolution in glass/epoxy tubes subjected to combined tension-
torsion fatigue loading ............................................................................................................. 43
3.1. Introduction .................................................................................................................... 43
3.2. Materials, geometry and test equipment ......................................................................... 47
3.3. Fatigue tests results: initiation phase .............................................................................. 49
3.3.1 Influence of the biaxiality ratio on crack initiation ................................................... 49
X
3.3.2 Influence of the load ratio ......................................................................................... 51
3.4. Fatigue tests results: propagation phase ......................................................................... 53
3.4.1 Influence of the Mode Mixity on crack propagation ................................................ 60
3.4.2 Influence of the load ratio on crack propagation ...................................................... 62
3.5. Fracture surfaces analysis .............................................................................................. 63
3.6. Conclusions .................................................................................................................... 66
Appendix 3.A ........................................................................................................................ 67
References of chapter 3 ......................................................................................................... 69
4. Damage evolution under internal and external multiaxial cyclic stress state: a
comparative analysis ............................................................................................................... 73
4.1. Introduction .................................................................................................................... 73
4.2. Materials, specimen preparation and test equipment ..................................................... 76
4.3. Crack initiation, multiplication, growth and stiffness degradation ................................ 79
4.4. Crack propagation .......................................................................................................... 83
4.5. Finite Element calculation of SERR .............................................................................. 85
4.6. Paris-like curves ............................................................................................................. 89
4.7. Comparison with external multiaxial fatigue results ..................................................... 91
4.8. Conclusions .................................................................................................................... 93
References of chapter 4 ......................................................................................................... 94
5. A damage based model for crack initiation in unidirectional composites under
multiaxial cyclic loading ......................................................................................................... 97
5.1. Introduction .................................................................................................................... 97
5.2. Mechanisms of fatigue failure ........................................................................................ 99
5.3. Calculation of the local stresses ................................................................................... 102
5.4. Application to experimental data ................................................................................. 105
5.4.1 Fatigue results on [90]4 tubular specimens ............................................................. 105
5.4.2 Fatigue results on [0F/903/0F] tubes ........................................................................ 108
5.4.3 Fatigue results on flat specimens from Hashin and Rotem .................................... 111
5.4.4 Fatigue results on flat specimens from El-Kadi and Ellyin .................................... 112
5.4.5 Fatigue results on constrained laminae from Quaresimin et al. [21] ...................... 113
5.5. Constant-life diagrams ................................................................................................. 114
5.6. New parameters to account for the load ratio .............................................................. 115

XI
5.7. Discussion ..................................................................................................................... 118
5.8. Conclusions .................................................................................................................. 119
Acknowledgements ............................................................................................................. 119
Appendix 5.A ...................................................................................................................... 120
Appendix 5.B ....................................................................................................................... 124
References of chapter 5 ....................................................................................................... 127
6. A stiffness degradation model for cracked multidirectional laminates ........................ 129
6.1. Introduction .................................................................................................................. 129
6.2. Optimal shear lag analysis of a symmetric laminate with cracks in one ply ................ 136
6.2.1 Relationship between average displacements and interlaminar shear stresses ....... 138
6.2.2 Equilibrium equations and solution ........................................................................ 142
6.2.3 Calculation of the laminate elastic properties ......................................................... 148
6.2.4 Validation ................................................................................................................ 149
6.3. Laminate with cracks in two or more layers ................................................................ 151
6.3.1 Analysis without crack interaction .......................................................................... 151
6.3.2 Analysis with crack interaction ............................................................................... 151
6.4. Parametric analysis of crack interaction ....................................................................... 158
6.5. Validation of the interaction model .............................................................................. 162
6.6. Conclusions .................................................................................................................. 164
References of chapter 6 ....................................................................................................... 166
7. Prediction of crack density evolution for multidirectional laminates under fatigue
loading .................................................................................................................................... 171
7.1. Introduction .................................................................................................................. 171
7.2. Definition of crack density ........................................................................................... 175
7.3. Multiscale strategy ........................................................................................................ 176
7.4. Prediction of multiple crack initiation .......................................................................... 178
7.4.1 Non-Interactive regime ........................................................................................... 180
7.4.2 Interactive Regime .................................................................................................. 183
7.5. Crack propagation ........................................................................................................ 185
7.6. Crack density calculation ............................................................................................. 190
7.7. Example of application ................................................................................................. 192
7.8. Conclusions .................................................................................................................. 195

XII
Appendix 7.A ...................................................................................................................... 196
Appendix 7.B ...................................................................................................................... 200
References of chapter 7 ....................................................................................................... 202
8. Mixed mode crack propagation in composite bonded joints under static and fatigue
loading: characterisation and damage-based modelling ................................................... 207
8.1. Introduction .................................................................................................................. 207
8.2. Materials and test equipment ....................................................................................... 210
8.3. Calculation of the strain energy release rate ................................................................ 212
8.4. Static test results........................................................................................................... 213
8.5. Fatigue test results and damage evolution ................................................................... 215
8.6. Development of a new criterion ................................................................................... 220
8.6.1 Damage analysis ..................................................................................................... 220
8.6.2 Modelling ................................................................................................................ 223
8.7. Application to experimental data ................................................................................. 226
8.7.1 Fatigue loading ....................................................................................................... 226
8.7.2 Static loading .......................................................................................................... 229
8.8. Conclusions .................................................................................................................. 232
References of chapter 8 ....................................................................................................... 234
Appendix A. Modelling fibre-matrix debonding under biaxial loading .......................... 237
A.1. Introduction ................................................................................................................. 237
A.2. Finite Fracture Mechanics approach ........................................................................... 239
A.3. Stress fields for the uncracked case ............................................................................ 241
A.3.1 Remote transverse stress ........................................................................................ 241
A.3.2 Remote antiplane shear .......................................................................................... 243
A.4. Relative displacements in the presence of an interface crack ..................................... 244
A.4.1 Debond crack with remote transverse stress .......................................................... 244
A.4.2 Debond crack with remote antiplane shear stress .................................................. 246
A.5. Calculation of the released energy .............................................................................. 247
A.6. Solution of coupled stress and energy criteria ............................................................ 249
A.7. Parametric analysis and discussion ............................................................................. 252
A.8. Validation .................................................................................................................... 257
A.9. Conclusions ................................................................................................................. 260

XIII
Appendix A.A ...................................................................................................................... 260
References of Appendix A .................................................................................................. 263
Concluding remarks .............................................................................................................. 267
List of publications ................................................................................................................ 271

XIV

Chapter 1. Introduction: motivations, problems and methodology
1
1 Introduction: motivations, problems and methodology
1.1. Introduction
Composite materials are obtained by at least two distinct phases (matrix and reinforcements)
which, combined at a microscopic level, give rise to a material with mechanical and functional
properties different from those of the constituents. Typically the reinforcement represents the
most mechanically performing material, and it can be in the form of particulates, spheres, short
and long fibres. Reinforcements are held together by the matrix which is usually less
performing but it has the basic role to distribute loads between the different phases.
We can find various composite materials in nature such as woody plants, where fibres are
aligned to provide the maximum specific strength along the direction in which external loads
act. This is also the idea at the basis of the modern concept of advanced composite materials,
mainly those made by long fibre reinforcements, developed since the beginning of the last
century. Typically glass, carbon or aramid fibres are used, together with thermosetting or
thermoplastic polymer matrices. The main advantages of this class of materials are the high
specific values of strength and stiffness which make them particularly suitable for light-weight
structural applications.
In the last two decades the development of new and more efficient manufacturing processes
and the increasing need of light structures aimed to minimise energy consumption acted as
important driving forces for the increasing use of composites in many industrial fields such as
automotive, naval, aerospace, sport facilities and wind energy.
As a proof of this, a very interesting market investigation was presented in 2013 by AVK and
CCeV [1]. Figure 1, readapted from Ref. [1], highlights the increasing trend in the demand of
carbon reinforced polymers (CRP) in the last years as well as estimations for the next seven
years.

Chapter 1. Introduction: motivations, problems and methodology
2
Figure 1: Global demand of CRP from 2008, readapted from [1], *estimated
Figures 2 a)-d) show how the CRP demand and its estimations are shared among the main
industrial fields.
Figure 2: Global CRP demand from a) wind energy, b) aerospace, c) sports and d) automotive
industries; readapted from [1], *estimated
Both at present and in the next years, according to the estimations, the major sources of
demand of CRP are represented by the aerospace and wind energy industries, where the use of
0
50000
100000
150000
200000
250000
Tons
of
CR
P
0
10000
20000
30000
40000
2010 2011 2012 2013* 2015* 2020*
Tons
of
CR
P
a)
0
10000
20000
30000
40000
2010 2011 2012 2013* 2015* 2020*
Tons
of
CR
P
b)
0
10000
20000
30000
40000
2010 2011 2012 2013* 2015* 2020*
Tons
of
CR
P
c)
0
10000
20000
30000
40000
2010 2011 2012 2013* 2015* 2020*
Tons
of
CR
P
d)

Chapter 1. Introduction: motivations, problems and methodology
3
composites is strictly related to the possibility of decreasing energy consumption and
optimising energy production, respectively.
Concerning the aerospace industry, it was estimated by Bhatta [2] that a 1 kg reduction in the
weight of a plane leads to save $3000 of fuel annually with commensurate reductions in CO2
emissions. Within this scenario it is clear the reason why the most important companies started
using composites also for structural parts in commercial aircrafts since the middle eighties.
The rapid increase in the last twenty years is evident in figure 3 [3], which shows the
percentage in total weight of commercial airplanes from the main manufacturers. It is also
worth mentioning that prior to the late eighties composites were used only for secondary parts,
the A320 (1988) being the first plane with a tail section totally made of composite materials.
Figure 3: Weight percentage of composites in commercial aircrafts over time [3]
Differently, the recent Boeing 787 is made of composites for 50% of its weight (excluding
engines), and it is the first plane with a carbon/epoxy fuselage (see figure 4).
The other major driver for composites demand is the wind energy industry. Indeed, the
increasing requirements of alternative sources of energy led, in the recent years, to rapid
developments in the wind energy field. This turns out in the need of a higher specific power
and a larger rotor's diameter, as shown in figure 5 [4], thus requiring a wide use of composite

Chapter 1. Introduction: motivations, problems and methodology
4
materials for the blades, thanks to their lightness combined with excellent mechanical
properties, allowing high specific energy production.
Figure 4: Materials used for Boeing 787 [3]
Figure 5: Growth in turbines size and power since 1985 [4]
In this field, composite materials became of even higher interest for the application of passive
load mitigation techniques to turbine blades. For this purpose in Ref. [5] Bottasso and co-
authors studied the possibility to design coupled bend-twist blades by exploiting the
anisotropy of composite laminates, properly oriented with respect to the blade's axis.
It is clear that composite materials, thanks to their high specific mechanical properties,
corrosion resistance and possibility to "design" the material on the basis of design needs, have
a very strong potential in the development of innovative solutions in the frame of energy
Chapter 1. Introduction: motivations, problems and methodology
5
saving and renewable energy production, as well as in other industrial fields. One of the main
limitations of this class of materials is represented by the cost, which is still quite high with
respect to more traditional structural materials.
High costs are due to quite expensive raw materials (mainly for carbon fibres), labour
intensive manufacturing processes and lack of general and suitable predictive models and
design procedures, which forces companies to expensive and time consuming prototyping and
testing activities. As a consequence, investing in research is fundamental for understanding the
behaviour of these relatively "young" materials and developing reliable models and procedures
to make the design process simpler and cheaper.
1.2. Parameters influencing the fatigue behaviour of composites
In structural components, such as turbine blades or airplane wings, composite laminates and
composite bonded connections are unavoidably subjected to cyclic multiaxial loads. In spite of
the increasing trend in the application of composite materials for structural components, as
discussed before, the multiaxial fatigue behaviour of this materials has not received a
sufficient attention by the scientific community [6]. In particular, Quaresimin et al. [6]
highlighted the lack of reliable predictive models as well as of knowledge of the damage
mechanisms leading a composite laminate to fatigue degradation and failure, in relationship
with the multiaxial stress state.
In the same work, [6], more than one thousand data from the literature were collected with the
aim to obtain information on the influence of some design parameters on the fatigue behaviour
of composite laminates. The most important ones were found to be:
i) the presence of shear stress (i.e. the multiaxial stress state);
ii) the load ratio R (ratio between the minimum and the maximum fatigue loads);
iii) the phase angle between stress components;
iv) the geometry (presence of geometrical variations such as notches).
The reader should refer to Ref. [6] for a detailed discussion on all these points.
However, the authors found that the presence of an in-plane shear stress component (i)
strongly and detrimentally influenced the fatigue life of composite laminates. This can be seen
in more general terms as the influence of the multiaxial stress state on the fatigue behaviour of
composites. This effects have not been clarified enough in the literature, and the analysis
carried out by Quaresimin et al. [6] highlighted the inaccuracy of empirical criteria and the

Chapter 1. Introduction: motivations, problems and methodology
6
need of damage-based models of general validity for a proper and reliable estimation of
fatigue strength or life.
The load ratio R (ii) was also shown to influence significantly the fatigue behaviour, and the
combination of shear and compressive normal stresses was found to be particularly
detrimental. Also the effect of R, mainly in relationship with the multiaxial stress state, is a
problem to be investigated more deeply for formulating a predictive model which includes all
these factors.
Contradictory results were instead found on the possible influence of the phase angle (iii),
while the few data available on the influence of notches (iv) made it difficult to drawn general
and significant conclusions [6].
Always in Ref. [6] the authors distinguished two kinds of multiaxial loading conditions,
namely external and internal multiaxiality.
The first condition is achieved when external loads are applied in different directions whereas
the second one is due to the anisotropy of composite laminae, which leads to multiaxial stress
states even if uniaxial external loads are applied. The equivalence or the possible differences
between these two conditions were not clear from the data analysed and reported in Ref. [6].
In this frame, it is clear that improving the knowledge on the fatigue behaviour of composite
materials is essential. In particular it would be important to observe and deeply understand the
damage mechanisms leading to fatigue failure and then to use them as a basis for the
development of physically-based predictive models and criteria. This approach is particularly
important when dealing with composites because of their multiscale nature, as they are non-
homogeneous materials, as it will be discussed in the next section.
1.3. Multiscale nature of composite materials
The multiscale concept applied to long-fibres composites is schematically shown in figure 6.
The constituents at each scale and the related damage mechanisms are shown, particularly
with reference to the matrix-dominated behaviour which is the main interest of the present
thesis, as it controls the degradation of the mechanical properties of a composite part.
Since composites are made of fibres and matrix, the smallest structural element that can be
defined is a fibre-matrix unit cell, which is a micro-scale entity, the fibre diameter and the
inter-fibres distance being measured in μm. At this scale the damage mechanisms occurring
both under static and cyclic loads are represented by the initiation and propagation of a debond
crack at the interface and matrix micro-cracking.

Chapter 1. Introduction: motivations, problems and methodology
7
Thousands of fibres form a unidirectional (UD) lamina or a unidirectional laminate which is,
instead, a macro-scale entity, its thickness being of the order of magnitude of millimetres. The
coalescence of debonds and matrix micro-cracks at the micro-scale gives rise to the initiation
of a macro-crack in a lamina which spans the whole thickness and propagates through its
width in a direction parallel to the fibres.
Multidirectional laminates are made of several UD laminae stacked with different fibres
orientations. In this case, when a macro-crack initiates in one or more layers, the stress
redistribution between adjacent plies is such that the cracked plies keep carrying load far
enough from the cracks, thus causing a progressive damage evolution by means of multiple
off-axis cracks initiation and propagation.
Figure 6: The multiscale nature of composite materials: length scales and related constituents
and damage mechanisms
These cracks cause the degradation of the global laminate stiffness and act as initiation sites
for delaminations and as stress concentrators for the main load bearing plies, leading to the
final failure of the laminate.
Micro-scale
Macro-scale
Structure-scale
fibre-matrix cell adhesive-adherend
interface
UD lamina
laminate
joints
structure
debonding, matrix microcracking
through-the-width crack initiation
multiple cracking,
delamination
interface failure, adhesive
micro-cracking
laminates
degradation
and failure,
bondline
failure
structure
failure

Chapter 1. Introduction: motivations, problems and methodology
8
Laminates are often used as adherends for bonded joints, the failure of which can be due to the
failure of the laminates, by means of the above mentioned mechanisms, or by the failure of the
bondline. The latter is caused, once again, by damage accumulation at the microscopic scale in
the form of interface failures or adhesive micro-cracking.
Finally, structures are made by unidirectional or multidirectional laminates, often bonded
together by means of adhesive joints, and their failure or degradation is due to the hierarchical
failure of the constituents relevant to all the smaller length scales.
As a consequence, if we want to predict the static or fatigue failure at any of the mentioned
levels (structure, sub-structures, laminates) we must first predict the damage initiation and
evolution at all the smaller length scales by means of a multiscale approach as schematically
shown in figure 7.
Figure 7: Multiscale approach adopted in the present thesis
This approach, adopted in the present thesis, consists, first, in the observation of the damage
mechanisms peculiar for each scale, from the micro-scale to the various levels of the macro-
scale, and then in modelling them by means of analytical and numerical tools. The modelling
phase often consists in the definition of the driving force for damage evolution at a given
scale, expressed in terms of stress or energy parameters relevant to that scale. Eventually, in
order to make predictions at the final scale of interest, they have to be linked to parameters at a
larger scale by means of micromechanical concepts and tools.
Observation of damage mechanisms
at smaller scale
Modelling damage mechanisms at smaller
scale (definition of the driving force for
damage evolution at smaller scale)
Bridge to the larger scale
Prediction of failure or degradation
at the larger scale
Micromechanics

Chapter 1. Introduction: motivations, problems and methodology
9
Keeping in mind this fundamental approach, in the next section the objectives of the present
thesis will be presented and the main activities briefly discussed.
1.4. Objectives and contents
With the aim to fill the gaps emerged from the literature and move some further steps towards
the definition of reliable design procedures of industrial appeal, the objectives of the present
thesis can be summarised as follows:
1) Characterisation and modelling of the multiaxial fatigue behaviour of composite laminae
and laminates;
2) Characterisation and modelling of the fatigue propagation of bondline cracks in bonded
joints under mixed mode I + II (opening + sliding) loading.
In both these fields, the multiscale approach discussed in the previous section has been
adopted and models have been developed to describe the damage mechanisms observed at the
various length scales and to link them for the eventual formulation of predictive procedures for
fatigue damage in multidirectional laminates and bonded joints.
The experimental and modelling activities relevant to these two research fields are briefly
described in the following sub-sections.
1.4.1. Multiaxial fatigue of composite laminae and laminates
As already mentioned in section 1.3 the fatigue behaviour of a multidirectional laminate is
characterised by a progressive damage evolution during the entire fatigue life, from the first
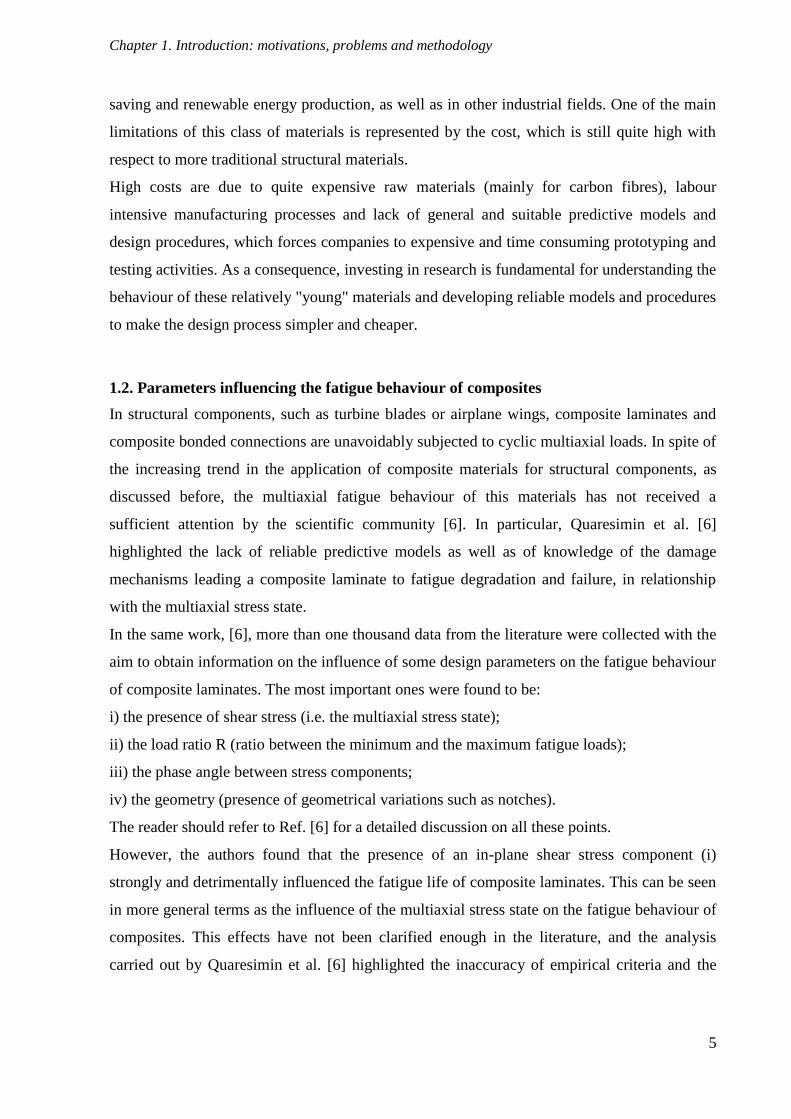
cycles to the final separation. The main macroscopic evidence of damage evolution is the
degradation of the stiffness of the laminate, the entity of which can be significant even much
before the final failure. This phenomenon is due to the initiation and propagation of cracks in
the layers oriented off-axis with respect to the external loads. This represents the first
observable damage mechanism at the macro-scale, occurring since the early stages of fatigue
life. The accumulation of such cracks, describable as increment of off-axis crack density, is
responsible for the degradation of the global elastic properties of the laminate. When the crack
density evolution reaches a saturation condition, theses cracks can trigger the initiation of
delaminations which produce a further stiffness degradation.
In addition off-axis cracks act as stress concentrators for the main load bearing plies
promoting the failure of the fibres and leading to the final failure of the laminate.
This process is described in figure 8, re-adapted from Ref. [7].
Chapter 1. Introduction: motivations, problems and methodology
10
Figure 8: Schematic of fatigue damage evolution in multidirectional laminates
It is clear that the first stages of damage evolution, which strongly affect the laminate
performance in terms of stiffness but also influence the final failure, are controlled by the
matrix-dominated behaviour of the unidirectional lamina.
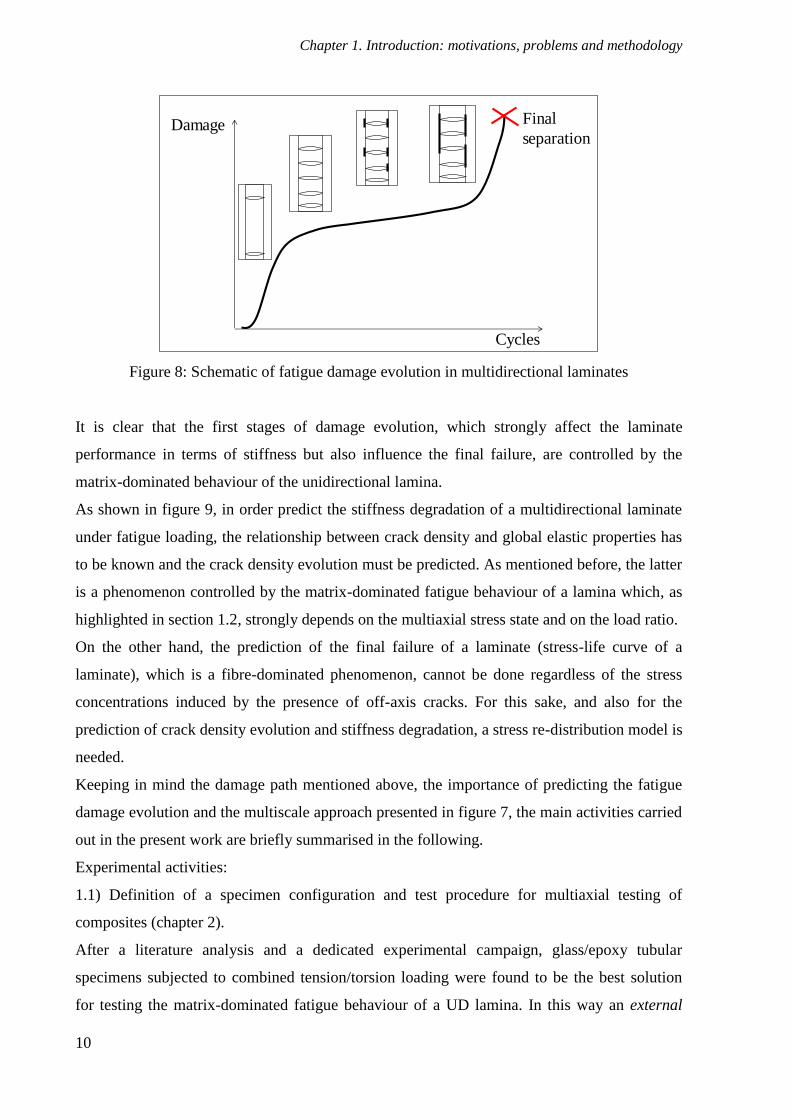
As shown in figure 9, in order predict the stiffness degradation of a multidirectional laminate
under fatigue loading, the relationship between crack density and global elastic properties has
to be known and the crack density evolution must be predicted. As mentioned before, the latter
is a phenomenon controlled by the matrix-dominated fatigue behaviour of a lamina which, as
highlighted in section 1.2, strongly depends on the multiaxial stress state and on the load ratio.
On the other hand, the prediction of the final failure of a laminate (stress-life curve of a
laminate), which is a fibre-dominated phenomenon, cannot be done regardless of the stress
concentrations induced by the presence of off-axis cracks. For this sake, and also for the
prediction of crack density evolution and stiffness degradation, a stress re-distribution model is
needed.
Keeping in mind the damage path mentioned above, the importance of predicting the fatigue
damage evolution and the multiscale approach presented in figure 7, the main activities carried
out in the present work are briefly summarised in the following.
Experimental activities:
1.1) Definition of a specimen configuration and test procedure for multiaxial testing of
composites (chapter 2).
After a literature analysis and a dedicated experimental campaign, glass/epoxy tubular
specimens subjected to combined tension/torsion loading were found to be the best solution
for testing the matrix-dominated fatigue behaviour of a UD lamina. In this way an external
Damage
Cycles
Final
separation
Chapter 1. Introduction: motivations, problems and methodology
11
multiaxial loading condition leads to combined transverse and in-plane shear stresses, the ratio
of which can be modulated in the whole range of interest.
1.2) Characterisation of the matrix-dominated multiaxial fatigue behaviour of UD laminae
(chapter 3).
Tubular specimens were fatigue tested under several multiaxial conditions (shear on transverse
stress ratio) and load ratios. The attention was focused on the influence of the multiaxial stress
state and load ratio on crack initiation and propagation phenomena and on the damage
mechanisms at the micro-scale.
Figure 9: Prediction of stiffness degradation and fatigue life of composite laminates
1.3) Characterisation of the fatigue behaviour of multidirectional laminates (chapter 4).
Multidirectional flat laminates were subjected to uniaxial cyclic load leading to an internal
multiaxial stress state in the off-axis plies. The laminate lay-ups were chosen to obtain
FATIGUE BEHAVIOUR OF A MULTIDIRECTIONAL LAMINATE
cycles
stif
fnes
s
crack density
stif
fnes
s
cycles
crac
k d
ensi
ty
life
stre
ss
crack initiation criterion
under multiaxial fatigue
criterion for the effect of
load ratio
matrix-dominated fibre-dominated
stiffness degradation final failure
stress re-distribution
model
stiffness model crack density evolution
model
Chapter 1. Introduction: motivations, problems and methodology
12
multiaxial conditions similar to those adopted for the tubes. The comparisons between flat and
tubular specimens in terms of crack initiation and propagation highlighted the equivalence in
the fatigue behaviour under external and internal multiaxial loading.
Modelling activities at the micro-scale:
1.4) Development of an analytical model to predict debond initiation under biaxial static
loading (Appendix A).
As mentioned before, fibre-matrix debonding is one of the mechanisms of damage initiation at
the micro-scale, both under static and fatigue loading. For this reason, an analytical model was
proposed for the prediction of debond initiation under static multiaxial loads, highlighting the
effect of the fibre radius and the main interface parameter on the fibre-matrix interface
strength.
1.5) Development of a criterion for crack initiation in UD laminae under multiaxial fatigue
loading (chapter 5).
On the basis of the damage mechanisms observed at the micro-scale during the experimental
program on tubular specimens, a criterion to predict the fatigue life to crack initiation in a UD
lamina was proposed. The criterion accounts for the effect of multiaxial stress states and, in
view of the equivalence between internal and external multiaxiality, it can be applied
successfully to tubular as well as flat geometries.
Modelling activities at the macro-scale:
1.6) Development of an analytical model for the computation of stress distributions and
stiffness degradation for multidirectional laminates in the presence of off-axis cracks (chapter
6).
An analytical model was developed which predicts the stress re-distribution and the stiffness
degradation of a laminate as function of the density of off-axis cracks in one or more layers.
The most innovative issue is that the model accounts analytically for the mutual interaction
between cracks in different layers.
1.7) Definition of an analytical procedure for the prediction of the crack density evolution in
multidirectional laminates under fatigue loading (chapter 7).
A procedure was developed for the prediction of the fatigue crack density evolution in the off-
axis layers of a multidirectional laminate. It includes the experimental observations on crack
propagation reported in chapter 3, the crack initiation criterion and the stress distribution
models presented in chapters 5 and 6, respectively, and the statistical distribution of fatigue
strength in a UD lamina.

Chapter 1. Introduction: motivations, problems and methodology
13
1.4.2. Crack propagation in composite bonded joints
The fatigue life of composite bonded joints is characterised by a crack initiation and a crack
propagation phase. The first one consists in the onset of a crack in critical positions such as bi-
material corners at the beginning of the bondline. A model was proposed by Quaresimin and
Ricotta [8] for the prediction of the cycles spent for crack initiation, on the basis of generalised
stress intensity factors at the corners.
It was also shown by Quaresimin and Ricotta that the crack propagation phase occurs
generally in mixed mode (I+II) conditions, which can be due either to multiaxial or uniaxial
external loads. As highlighted also in Ref. [8], the fatigue crack propagation in bonded joints
strongly depends on the mixed mode conditions, and a general and reliable criterion
accounting for this is not available in the literature yet.
The experimental and modelling activities carried out with the aim of understanding and
describing the mixed mode crack propagation in bonded joints are briefly reported in the
following.
Experimental activities:
2.1) Characterisation of the static and fatigue crack propagation phenomena in bonded joints
under mixed mode I + II loading (chapter 8).
Mode I, II and mixed mode I + II tests were carried out on composite bonded joints in order to
understand the influence of the mixed mode condition on the interface toughness and crack
growth rate. Observations of the damage mechanisms at the micro-scale revealed their strong
dependence on the loading mode.
Modelling activities at the micro-scale:
2.2) Definition of a criterion to predict the crack growth rate in bonded joints under mixed
mode loading (chapter 8).
On the basis of the propagation mechanisms observed in the experimental campaign, a
criterion to predict the interface toughness and the crack growth rate under mixed mode
loading was proposed.
Chapter 1. Introduction: motivations, problems and methodology
14
References of chapter 1
[1] Witten E., Jahn B., Composites market report 2013. Rep. N.p., n.d. Web. 13 Jan. 2014.
<http://www.pultruders.com/en/publications.html>.
[2] The Economist, 2011. The printed world. The Economist 12 Feb. 2011, 398 (8720),
69-71.
[3] United States Government Accountability Office, Status of faa’s actions to oversee the
safety of composite airplanes. Rep. N.p., n.d. Web. 13 Jan. 2014.
<http://www.gao.gov/>.
[4] International Renewable Energy Agency, Renewable energy technologies: cost
analysis series. Working paper. N.p., n.d. Web. 14 Jan. 2014.
<http://www.irena.org/home/index.aspx?PriMenuID=12>.
[5] Bottasso C.L., Campagnolo F., Croce A., Tibaldi C., Optimization-Based Study of
Bend-Twist Coupled Rotor Blades for Passive and Integrated Passive/Active Load
Alleviation, Scientific Report DIA-SR 11-02, 5 December 2011
[6] Quaresimin M., Susmel L, Talreja R., Fatigue behaviour and life assessment of
composite laminates under multiaxial loadings. International Journal of Fatigue 2010;
32: 2-16.
[7] Reifsnider K.L., Henneke E.G., Stinchcomb W.W., Duke J.C., Damage mechanics and
NDE of composite laminates. In: Hashin Z, Herakovich CT, editors. Mechanics of
composite materials. Recent advances. New York: Pergamon Press; 1983. p. 399–420.
[8] Quaresimin M., Ricotta M., Life prediction of bonded joints in composite materials,
International Journal of Fatigue 2006; 28: 1166–1176.

Chapter 1. Introduction: motivations, problems and methodology
15


Chapter 2. Development of a specimen configuration and a test
procedure for multiaxial fatigue testing of UD composites
13
2 Development of a specimen configuration and a test
procedure for multiaxial fatigue testing of UD
composites
2.1. Introduction
Structural components under in-service loading are subjected in general to fatigue and, very
frequently, loading conditions are also multiaxial. This situation occurs for several composite
parts with primary load-bearing function like, for instance, wind turbines blades, airplane
wings and landing gears but also bicycle frames and cranks or car suspensions just to mention
a few. The most obvious design goal is to avoid the fatigue failure, on the other hand, in most
of the cases, the control and the prediction of the stiffness loss of the part is also crucial. It is
clear, therefore, the need of reliable design procedures, suitable to predict fatigue failure as
well as the damage accumulation under real, in-service load conditions, in order to reduce the
time and the cost for design, prototyping and testing of structural parts made of composites.
A recent review [1] pointed out clearly that a reliable and comprehensive design criterion
against multiaxial cyclic loading is still missing in the literature. In the authors' opinion, a
criterion of general validity cannot be of phenomenological nature, but it should be based,
instead, on the damage mechanisms which are indeed dependent on the local multiaxial stress
state.
Biaxiality ratios have been identified as parameters suitable to quantify the degree of
multiaxiality of the local stress state [1] and they have therefore to be expressed in terms of
stresses referred to the local material coordinates system. According to the reference system
and stress components shown in figure 1, biaxiality ratios can be defined as:
1
21
σ
σλ ,
1
62
σ
σλ ,
2
612
σ
σλ (1)

Chapter 2. Development of a specimen configuration and a test
procedure for multiaxial fatigue testing of UD composites
14
The extensive analysis on the influence of several design parameters reported in [1] indicated
a strong detrimental effect of the shear stress component on the fatigue life. In particular, the
effect of ratio λ2 has been presented, discussing different results taken from the literature and
showing that, as the contribution of the shear stress increases, there is a significant reduction in
the longitudinal fatigue resistance. It is therefore crucial to define a criterion to properly
describe the mutual interaction between stress components, whose effect is detrimental for the
fatigue resistance of composite laminates. It is also important to observe that when looking for
data illustrating the influence of the shear stress ζ6 over the transverse fatigue strength, no
results at all are available in the technical literature.
Figure 1: Global and local coordinate systems, stresses in the local coordinates system
Another important finding discussed in reference [1] is that the knowledge about the damage
mechanisms and, most of all, the quantitative descriptions of the damage evolution along the
fatigue life and its dependence on the local multiaxial stress conditions are extremely limited if
not at all missing. The assessment of the driving force for the damage evolution, leading a
laminate to fatigue degradation and final failure, requires instead the comprehensive
understanding of the damage mechanisms occurring at the microscopic scale and their
quantitative correlation with stress state and fatigue life.
In general, the final failure, i.e. separation, of a multidirectional laminate is controlled by fibre
failures. Accordingly, fibre failure and related phenomena can be defined as critical damage
mechanisms. However, during the fatigue life other damage mechanisms related to the matrix
or the fibre-matrix interface (i.e. transverse cracks and delaminations) can take place, and they
can be classified as sub-critical damage mechanisms. Their clear understanding and
description is very important for two reasons. The first is that sub-critical mechanisms can
enhance the effect of the critical ones, for example causing stress redistribution and promoting
x
y
z
x
y
z ≡ 3
1 2
ζ1
ζ6
ζ2
ζ1
ζ6
ζ6
ζ6
ζ2

Chapter 2. Development of a specimen configuration and a test
procedure for multiaxial fatigue testing of UD composites
15
fibre failure in the 0°-oriented plies in regions of high stress concentrations due to the presence
of off-axis cracks or delaminations. The second reason is that they cause the progressive
degradation of the laminate properties, such as stiffness and residual strength, which are
critical parameters in the design of composite structures [2-6].
It has been observed several times in the literature that the damage onset is characterised by
the nucleation, propagation and multiplication of transverse cracks, either under static [7-9] or
fatigue loadings [10-13]. Since these events are basically controlled by the matrix or fibre-
matrix interface properties, it is first necessary to describe the non-fibre-dominated fatigue
behaviour of a unidirectional (UD) lamina, in order to predict the nucleation and propagation
of off-axis cracks under a general multiaxial stress condition, once this lamina is included in a
laminate. This is of course a challenging purpose and it requires an extensive experimental
activity on UD laminates, oriented to make available a sound database of experimental results,
to observe the damage mechanisms occurring at the microscopic level and to identify the
dependence of these mechanisms on the local stress state.
Unfortunately, the majority of the experimental works in the literature concerning the
multiaxial fatigue of composites deal with multidirectional laminates for practical application
and therefore they are not useful to characterise the multiaxial fatigue behaviour of a single
lamina [1]. Some fatigue results on off-axis UD coupons are presented in [14-18], however
these specimens are always characterised by a stress state where all the in-plane stress
components, ζ1, ζ2 and ζ6, are acting together simultaneously. For a proper understanding of
the damage evolution, its correlation with the local stress state and the production of "clean"
data, it would be instead important to investigate first the mutual influence of two stress
components only.
In particular, a biaxial stress state with non zero transverse stress ζ2 and in-plane shear stress
ζ6 only, is very useful to investigate the matrix or fibre-matrix interface dominated behaviour,
which controls the evolution of the sub-critical damage mechanisms. In the best of authors'
knowledge, experimental fatigue results involving only these two stress components are
completely missing in the literature.
In order to fill the gaps identified above and to provide a first contribution in this area, the
aims of the activity presented in this chapter are:
1) To define an experimental procedure for multiaxial fatigue testing of composite laminates,
paying attention to the following aspects:
− manufacturing of the specimens;
− assessment of optimal surface finishing and tabbing system;

Chapter 2. Development of a specimen configuration and a test
procedure for multiaxial fatigue testing of UD composites
16
− assessment of the best specimen geometry, combining easiness of testing and
reliability of the test results.
2) To carry out some preliminary tests in order to clarify the possible influence of different
specimen geometry.
These aims are meant as the first steps towards an extensive experimental characterization,
presented in chapter 3, oriented to understand the influence of the multiaxial loading condition
on the fatigue behaviour of composite laminates, paying particular attention to the dependence
of the damage mechanisms and their evolution on the stress state, as a basis for the definition
of a damage based predictive multiaxial fatigue criterion.
2.2. Configurations for multiaxial testing of composites
Because of the abisotropy of composite materials, a local multiaxial stress state can be
achieved even with very simple loading conditions. In the case of a tension-loaded off-axis
lamina, all the stress components ζ1, ζ2 and ζ6 are, in general, non zero, and therefore the
stress state is multiaxial. This kind of multiaxiality, originated from the anisotropic behaviour
of the lamina, has been defined internal multiaxiality, [1]. Conversely, if external loads are
applied along different directions, an external multiaxiality condition takes place.
It is clear that in real structures, both external loads in different directions and off-axis oriented
plies can be found, and therefore the final local stress state is a combination of internal and
external multiaxiality. Anyway, in the authors' opinion, there should be no differences
between these two conditions in terms of the material response, since the local stresses can be
regarded as responsible for the damage evolution and, eventually, for the fatigue failure,
independently of the way they are originated. However this will be proved in chapter 4.
Different test procedures and specimen geometries can be adopted for multiaxial static and
fatigue testing of composites. Comprehensive reviews on this subject can be found in
references [19-21]. The most popular sample geometries are presented in figure 2:
1) off-axis loaded flat coupons;
2) cruciform flat specimens under biaxial loads;
3) thin-walled tubes subjected to combined tension/torsion (or bending/torsion) even in the
presence of internal pressure.
The first test procedure takes advantage of the fact that an internal multiaxial condition is
obtained even when an uniaxial load is applied to an off-axis loaded coupon. This test is rather
easy, specimens are produced without difficulties, and a uniaxial testing machine is sufficient.

Chapter 2. Development of a specimen configuration and a test
procedure for multiaxial fatigue testing of UD composites
17
On the other hand, the presence of two stress components only, ζ2 and ζ6, cannot be obtained
with this geometry, since all the three in-plane stresses are in general different from zero. In
addition, care has to be taken in the design of the tabs to obtain a uniform stress distribution in
the sample and to avoid stress concentrations [3]. Fatigue tests on off-axis loaded UD
laminates can be found, among several others, in references [14-18]. As a common finding,
the authors reported a decreasing trend in the position of the S-N curves, expressed in nominal
stress to the fatigue life, as the off-axis angle (i.e. the shear stress component) increased.
Figure 2: Schematic of possible specimen configurations for multiaxial testing of composites
By testing flat cruciform specimens, a multiaxial stress state can be obtained by applying
external forces to the orthogonal arms of the specimen. If the material coordinate system is
aligned to the global one, an external multiaxiality is achieved, with the presence of normal
stresses ζ1 and ζ2. Conversely, if plies are laid up with an off-axis angle with respect to the
global coordinate system, the stress state results in a combination of external and internal
multiaxiality, with the presence of all the three in-plane stress components. It is clear that this
test procedure is not suitable to obtain a biaxial stress state with the transverse and in-plane
shear stresses only, and to vary their ratio (λ12), which is a condition of interest for the analysis
x
y
z 3
O
2
x
z
O
x
1
y 2
z = 3
x
z
O
x
z
O

Chapter 2. Development of a specimen configuration and a test
procedure for multiaxial fatigue testing of UD composites
18
of the non-fibre-dominated fatigue behaviour. In addition, the design of the specimen's
geometry requires a lot of care, to avoid arms failure and high stress concentrations at the
corners, as well as to obtain a uniform stress distribution in the central part of the specimen,
which is indeed the region of interest. In ref. [22] an optimization procedure has been
proposed to identify the best geometrical parameters for two configurations of cruciform
specimens, matching the requirements mentioned above. As a further problem, the
manufacturing of cruciform specimens is far more complicated than that for off-axis coupons,
since the optimised geometry requires rounded corners and a different number of layers in the
central region with respect to the arms. Finally, a four-actuator testing machine, suitable to
apply loads in two normal directions is needed. In our view, all these conditions together make
testing of cruciform specimens not very attractive. However, to confirm that other researchers
may have also different views on this problem, some results are available in the literature, in
particular for static loadings [23-26]. Only few papers report fatigue test results obtained from
cruciform specimens in the case of multidirectional UD laminates [23, 27] and fabric
reinforced laminates [28]. No fatigue data have been found for cruciform specimens made
from unidirectional laminates. Some interesting guidelines for biaxial testing with cruciform
specimens have been recently presented [29], where it appears that fatigue testing with these
specimens is indeed not an easy task.
Considering the amount of publications and data available, the most popular sample geometry
for multiaxial fatigue loading of composites seems to be that of thin walled tubes, subjected to
a biaxial/triaxial external loading obtained by applying combined tension (or bending),
internal pressure and torsion loading. Even in this case, an external multiaxiality is achieved,
and two main combinations of local stresses can be obtained. If the tubes are manufactured
with the fibres oriented only at 0° (parallel to the tube's axis), a tension/torsion external
loading condition leads to a combination of longitudinal and in-plane shear stresses (ζ1 and
ζ6). On the other hand, if the fibres are oriented at 90° (normal to the tube's axis), the presence
of the stress components ζ2 and ζ6 is achieved. The required values of the biaxiality ratios λ1
and λ12 can be easily obtained by properly combining the external tension and torsion loading.
In any case, the external multiaxial condition can be combined also with an internal
multiaxiality if the winding angle of the fibres is different from 0° or 90° with respect to the
tube's axis.
Fatigue tests results on tubes subjected to internal pressure and tensile loading have been
presented in Refs. [30-32]. The introduction of internal pressure in not easy indeed because it
requires a dedicated equipment to pump the oil inside the specimen and originate the hoop
Chapter 2. Development of a specimen configuration and a test
procedure for multiaxial fatigue testing of UD composites
19
stress, testing is therefore rather complicated. In addition, it is not possible to generate a stress
state with ζ2 and ζ6 only, and modulate the ratio between them.
Several papers in the literature report fatigue results obtained by applying a combined tension-
torsion loading on tubes, see [33-46] among the others. However, investigations on the mutual
influence of only two stress components on an unidirectional lamina have not been carried out
so far and few papers only include analysis of the damage evolution [34, 42, 44-46]. Testing
tubular samples is rather attractive because of the relative easiness of the specimens'
preparation and test execution, a biaxial (tension/torsion) testing machine being sufficient.
Another advantage is that free edge effects, which can influence the results on flat coupons,
are avoided. In addition, this is the only test procedure that allows to investigate the mutual
influence of two stress components (ζ2 and ζ6) only.
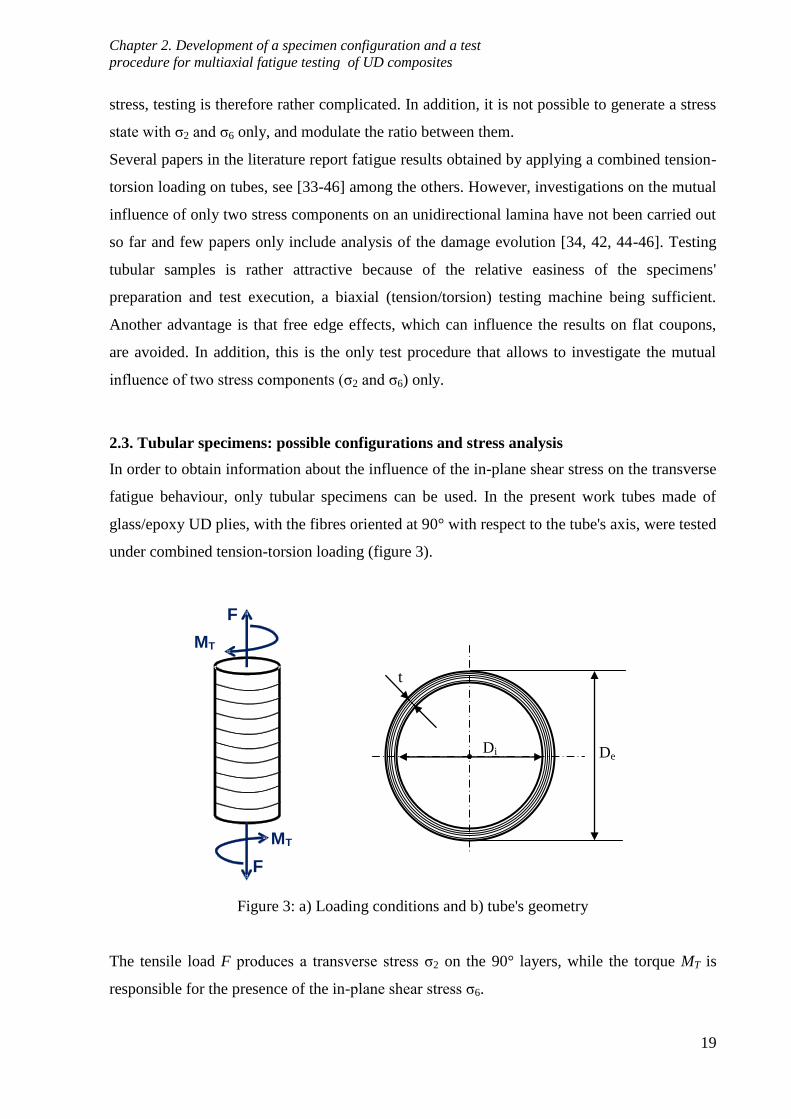
2.3. Tubular specimens: possible configurations and stress analysis
In order to obtain information about the influence of the in-plane shear stress on the transverse
fatigue behaviour, only tubular specimens can be used. In the present work tubes made of
glass/epoxy UD plies, with the fibres oriented at 90° with respect to the tube's axis, were tested
under combined tension-torsion loading (figure 3).
Figure 3: a) Loading conditions and b) tube's geometry
The tensile load F produces a transverse stress ζ2 on the 90° layers, while the torque MT is
responsible for the presence of the in-plane shear stress ζ6.
t
Di De
F
M T
M T
F

Chapter 2. Development of a specimen configuration and a test
procedure for multiaxial fatigue testing of UD composites
20
By properly combining the tension and torsion loadings it is possible to obtain the required
value of the biaxiality ratio λ12.
The transverse stress ζ2 is constant along the thickness and it can be easily calculated as
2 2 2
4σ
π e i
F
D D
(2)
Conversely the shear stress ζ6 varies linearly from the internal to the external diameter. For the
evaluation of the biaxiality ratio, the maximum shear stress value is considered, i.e. the value
corresponding to the external diameter calculated as
6,max 4 4
16σ
π
Te
e i
MD
D D
. (3)
The biaxiality ratio is therefore defined as:
6,max
12 12,max
2
σλ λ
σ (4)
To avoid the influence of the curvature and to introduce a stress state as much as possible
equivalent to a plane stress, the ratio between the maximum and the minimum shear stresses
(occurring at the external and internal radius respectively) has to be as close as possible to 1.
That ratio can be calculated as:
6,max
6,min
σ1 2
σ
e
i i
D t
D D (5)
The variation of the shear stress also implies the variability of the biaxiality ratio across the
thickness, and the ratio between the maximum and the minimum value is given always by
equation (5). To investigate the possible effect of the thickness to diameter ratio, specimens
with two different diameters (Type A and B) and lay-up [90n] were tested. Their geometrical
properties are listed in table 1.
Chapter 2. Development of a specimen configuration and a test
procedure for multiaxial fatigue testing of UD composites
21
Table 1: Geometrical characteristics of the type A and B tubes
Type Di (mm) De (mm) t (mm) t/Di σ6,max/σ6,min Number of layers
A 34 37,8 1.9 0.055 1.11 5
B 19 22 1.5 0.079 1.16 4
Type A tubes experience a lower variation of the shear stress in the radial direction, providing
a stress state closer to a plane stress condition with respect to the type B tubes.
Even if the tubes are subjected to external tension loading only, which generates the transverse
stress ζ2, additional stress components arise in the hoop and radial direction because of the
material orthotropy, as shown in Appendix 2.A. The radial stress changes along the thickness
of the tube, but its value remains always very low, with a maximum of about 0.3% of the
transverse stress resulting from the axial tension loading. The hoop stress decreases from a
positive value at the internal diameter to a negative value at the external diameter. The entity
of the peak values in tension and compression are once again dependent on the internal tube
diameter and the thickness of the tube, in particular they increase in modulus as the ratio t/Di
increases. For the two specimen configurations chosen in this work, the hoop stress peak
values in tension and compression, expressed in percentage of the transverse stress ζ2, are
equal to +8.77% and -7.95% for the smaller diameter tubes (type B), and +6.27% and -5.84%
for the large ones (type A).
In the material coordinates system, the hoop stress is a stress in direction 1, i.e. ζ1, and
therefore, to obtain a stress state which is as close as possible to a pure biaxial condition (ζ2
and ζ6), the ratio t/Di has to be very low. In the case of the present tests the maximum
transverse stress ζ2 is equal to 35 MPa, and this means that the maximum value of the hoop
stress, obtained for the type B tubes, is of -2.8 MPa in compression and 3 MPa in tension.
These values are indeed very low, when considering that they are in the fibres direction, and
therefore they are neglected in the remaining of the work, where the stress state is considered
as purely biaxial (ζ2 and ζ6 only).
2.4. Materials, tube manufacturing and test equipment
All the tubes were obtained by mandrel wrapping of the UD glass/epoxy pre-preg tape UE400-
REM produced by SAATI S. p. A (Italy). A heat-shrinking tape was wrapped around the pre-
pregs on the mandrel and then the tubes were cured in autoclave with a cycle of one hour at
140°C and 6 bars. Despite the absence of the vacuum bag, the shrinkage of the external tape
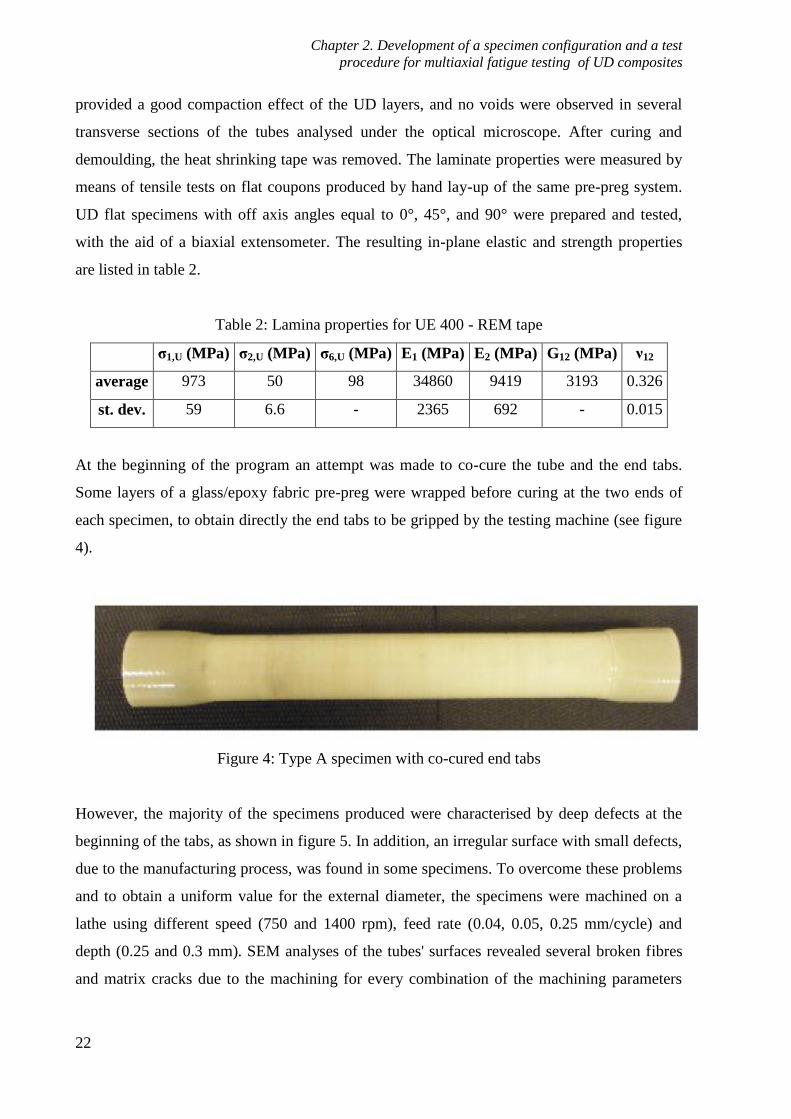
Chapter 2. Development of a specimen configuration and a test
procedure for multiaxial fatigue testing of UD composites
22
provided a good compaction effect of the UD layers, and no voids were observed in several
transverse sections of the tubes analysed under the optical microscope. After curing and
demoulding, the heat shrinking tape was removed. The laminate properties were measured by
means of tensile tests on flat coupons produced by hand lay-up of the same pre-preg system.
UD flat specimens with off axis angles equal to 0°, 45°, and 90° were prepared and tested,
with the aid of a biaxial extensometer. The resulting in-plane elastic and strength properties
are listed in table 2.
Table 2: Lamina properties for UE 400 - REM tape
σ1,U (MPa) σ2,U (MPa) σ6,U (MPa) E1 (MPa) E2 (MPa) G12 (MPa) ν12
average 973 50 98 34860 9419 3193 0.326
st. dev. 59 6.6 - 2365 692 - 0.015
At the beginning of the program an attempt was made to co-cure the tube and the end tabs.
Some layers of a glass/epoxy fabric pre-preg were wrapped before curing at the two ends of
each specimen, to obtain directly the end tabs to be gripped by the testing machine (see figure
4).
Figure 4: Type A specimen with co-cured end tabs
However, the majority of the specimens produced were characterised by deep defects at the
beginning of the tabs, as shown in figure 5. In addition, an irregular surface with small defects,
due to the manufacturing process, was found in some specimens. To overcome these problems
and to obtain a uniform value for the external diameter, the specimens were machined on a
lathe using different speed (750 and 1400 rpm), feed rate (0.04, 0.05, 0.25 mm/cycle) and
depth (0.25 and 0.3 mm). SEM analyses of the tubes' surfaces revealed several broken fibres
and matrix cracks due to the machining for every combination of the machining parameters
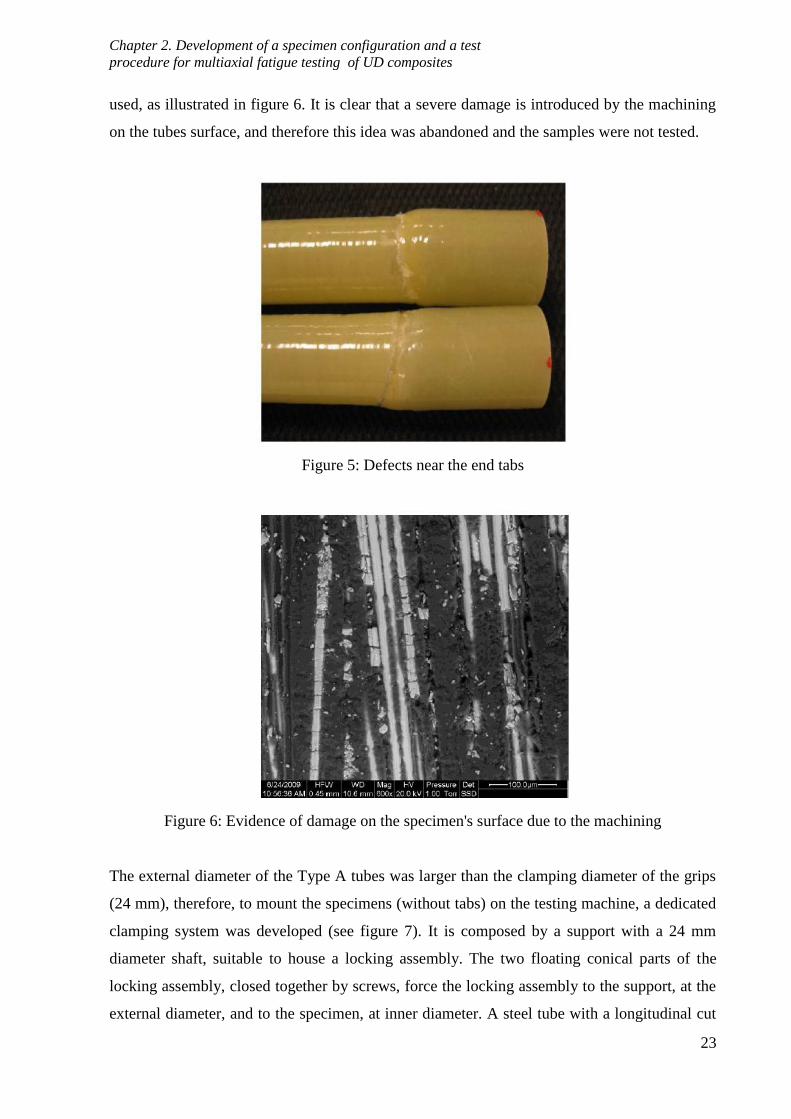
Chapter 2. Development of a specimen configuration and a test
procedure for multiaxial fatigue testing of UD composites
23
used, as illustrated in figure 6. It is clear that a severe damage is introduced by the machining
on the tubes surface, and therefore this idea was abandoned and the samples were not tested.
Figure 5: Defects near the end tabs
Figure 6: Evidence of damage on the specimen's surface due to the machining
The external diameter of the Type A tubes was larger than the clamping diameter of the grips
(24 mm), therefore, to mount the specimens (without tabs) on the testing machine, a dedicated
clamping system was developed (see figure 7). It is composed by a support with a 24 mm
diameter shaft, suitable to house a locking assembly. The two floating conical parts of the
locking assembly, closed together by screws, force the locking assembly to the support, at the
external diameter, and to the specimen, at inner diameter. A steel tube with a longitudinal cut
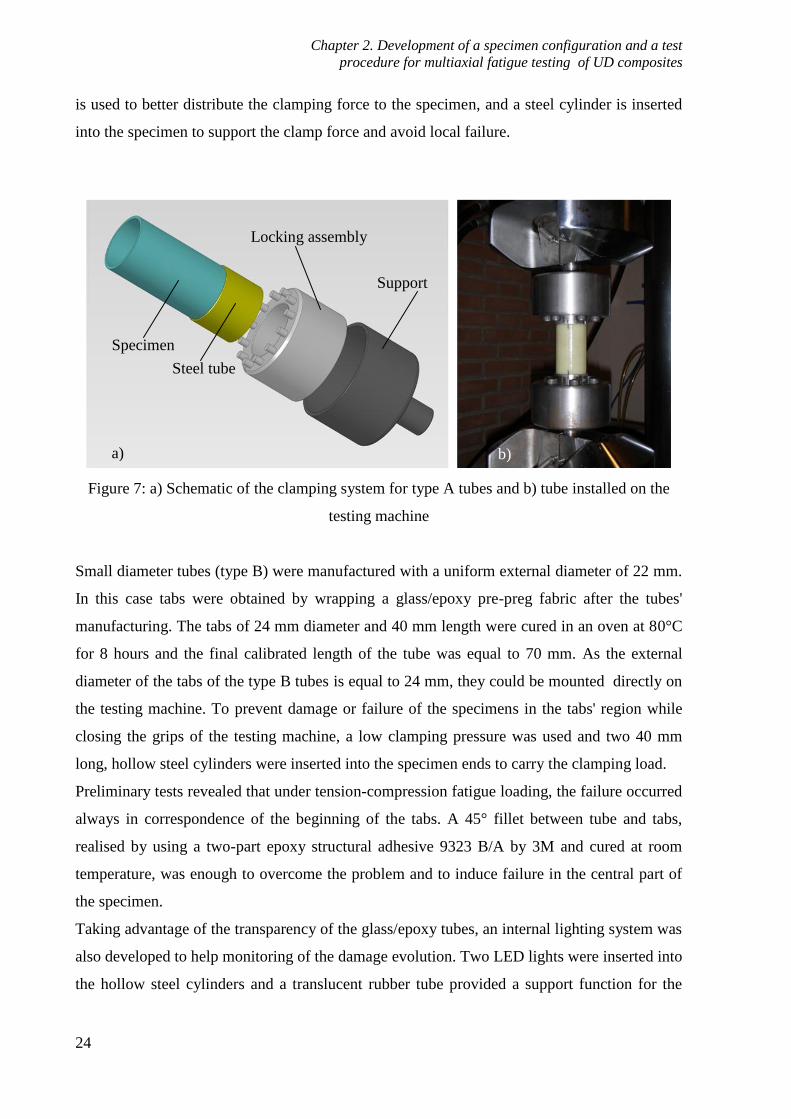
Chapter 2. Development of a specimen configuration and a test
procedure for multiaxial fatigue testing of UD composites
24
is used to better distribute the clamping force to the specimen, and a steel cylinder is inserted
into the specimen to support the clamp force and avoid local failure.
Figure 7: a) Schematic of the clamping system for type A tubes and b) tube installed on the
testing machine
Small diameter tubes (type B) were manufactured with a uniform external diameter of 22 mm.
In this case tabs were obtained by wrapping a glass/epoxy pre-preg fabric after the tubes'
manufacturing. The tabs of 24 mm diameter and 40 mm length were cured in an oven at 80°C
for 8 hours and the final calibrated length of the tube was equal to 70 mm. As the external
diameter of the tabs of the type B tubes is equal to 24 mm, they could be mounted directly on
the testing machine. To prevent damage or failure of the specimens in the tabs' region while
closing the grips of the testing machine, a low clamping pressure was used and two 40 mm
long, hollow steel cylinders were inserted into the specimen ends to carry the clamping load.
Preliminary tests revealed that under tension-compression fatigue loading, the failure occurred
always in correspondence of the beginning of the tabs. A 45° fillet between tube and tabs,
realised by using a two-part epoxy structural adhesive 9323 B/A by 3M and cured at room
temperature, was enough to overcome the problem and to induce failure in the central part of
the specimen.
Taking advantage of the transparency of the glass/epoxy tubes, an internal lighting system was
also developed to help monitoring of the damage evolution. Two LED lights were inserted into
the hollow steel cylinders and a translucent rubber tube provided a support function for the
a)
Specimen
Steel tube
Support
Locking assembly
b)
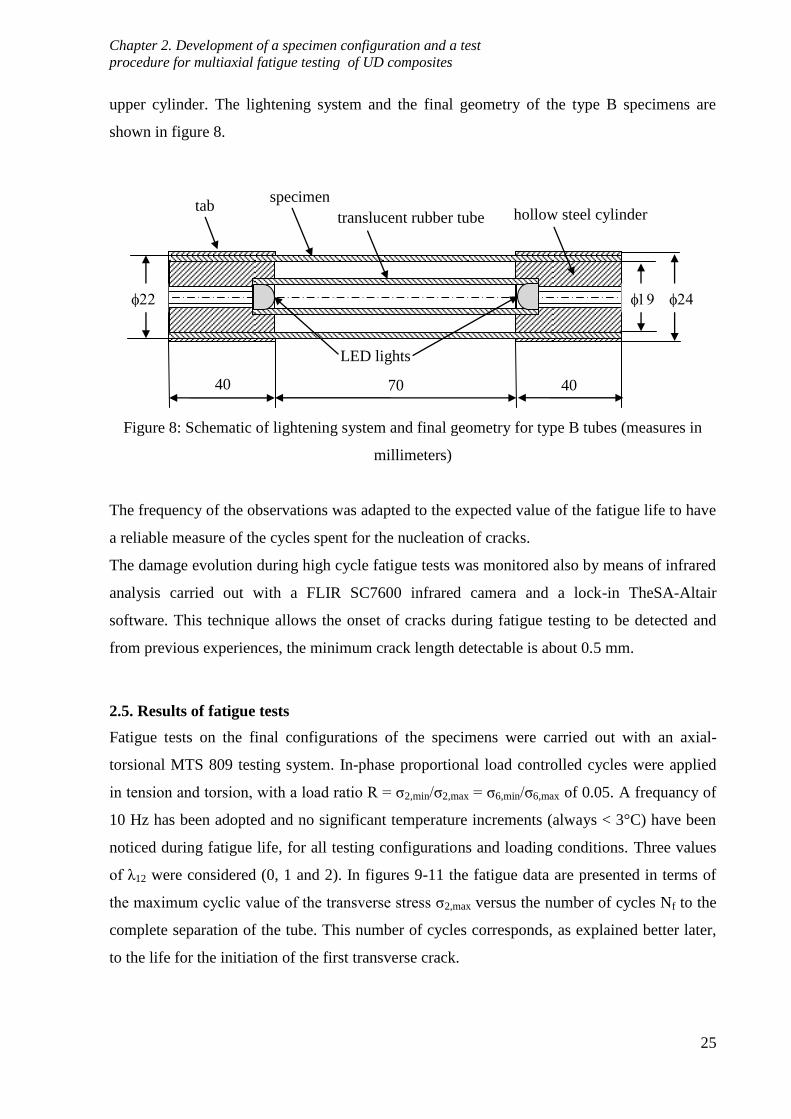
Chapter 2. Development of a specimen configuration and a test
procedure for multiaxial fatigue testing of UD composites
25
upper cylinder. The lightening system and the final geometry of the type B specimens are
shown in figure 8.
Figure 8: Schematic of lightening system and final geometry for type B tubes (measures in
millimeters)
The frequency of the observations was adapted to the expected value of the fatigue life to have
a reliable measure of the cycles spent for the nucleation of cracks.
The damage evolution during high cycle fatigue tests was monitored also by means of infrared
analysis carried out with a FLIR SC7600 infrared camera and a lock-in TheSA-Altair
software. This technique allows the onset of cracks during fatigue testing to be detected and
from previous experiences, the minimum crack length detectable is about 0.5 mm.
2.5. Results of fatigue tests
Fatigue tests on the final configurations of the specimens were carried out with an axial-
torsional MTS 809 testing system. In-phase proportional load controlled cycles were applied
in tension and torsion, with a load ratio R = ζ2,min/ζ2,max = ζ6,min/ζ6,max of 0.05. A frequancy of
10 Hz has been adopted and no significant temperature increments (always < 3°C) have been
noticed during fatigue life, for all testing configurations and loading conditions. Three values
of λ12 were considered (0, 1 and 2). In figures 9-11 the fatigue data are presented in terms of
the maximum cyclic value of the transverse stress ζ2,max versus the number of cycles Nf to the
complete separation of the tube. This number of cycles corresponds, as explained better later,
to the life for the initiation of the first transverse crack.
40 70 40
tab specimen
translucent rubber tube
LED lights
hollow steel cylinder
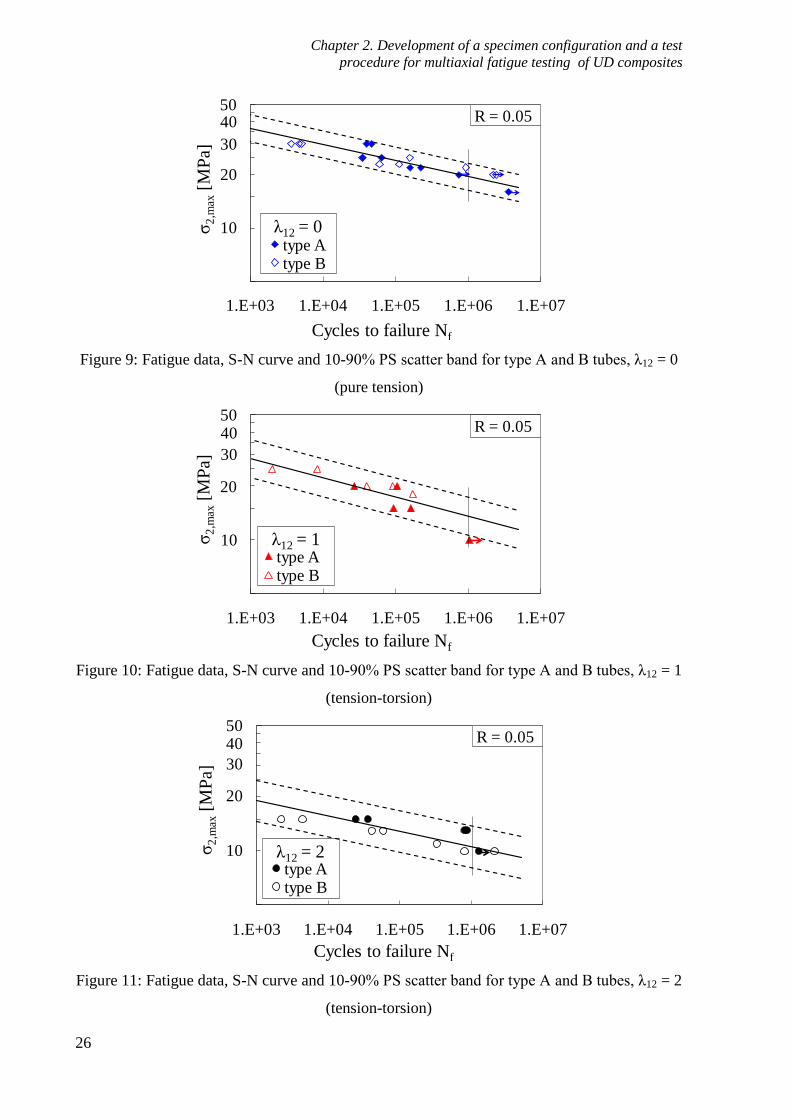
Chapter 2. Development of a specimen configuration and a test
procedure for multiaxial fatigue testing of UD composites
26
Figure 9: Fatigue data, S-N curve and 10-90% PS scatter band for type A and B tubes, λ12 = 0
(pure tension)
Figure 10: Fatigue data, S-N curve and 10-90% PS scatter band for type A and B tubes, λ12 = 1
(tension-torsion)
Figure 11: Fatigue data, S-N curve and 10-90% PS scatter band for type A and B tubes, λ12 = 2
(tension-torsion)
5
50
1.E+03 1.E+04 1.E+05 1.E+06 1.E+07
ζ2
,max
[MP
a]
Cycles to failure Nf
type Atype B
λ12 = 0
R = 0.05
10
20
30
40
5
50
1.E+03 1.E+04 1.E+05 1.E+06 1.E+07
ζ2
,max
[MP
a]
Cycles to failure Nf
type Atype B
λ12 = 1
R = 0.05
10
20
30
40
5
50
1.E+03 1.E+04 1.E+05 1.E+06 1.E+07
ζ2
,max
[MP
a]
Cycles to failure Nf
type Atype B
λ12 = 2
R = 0.05
10
20
30
40
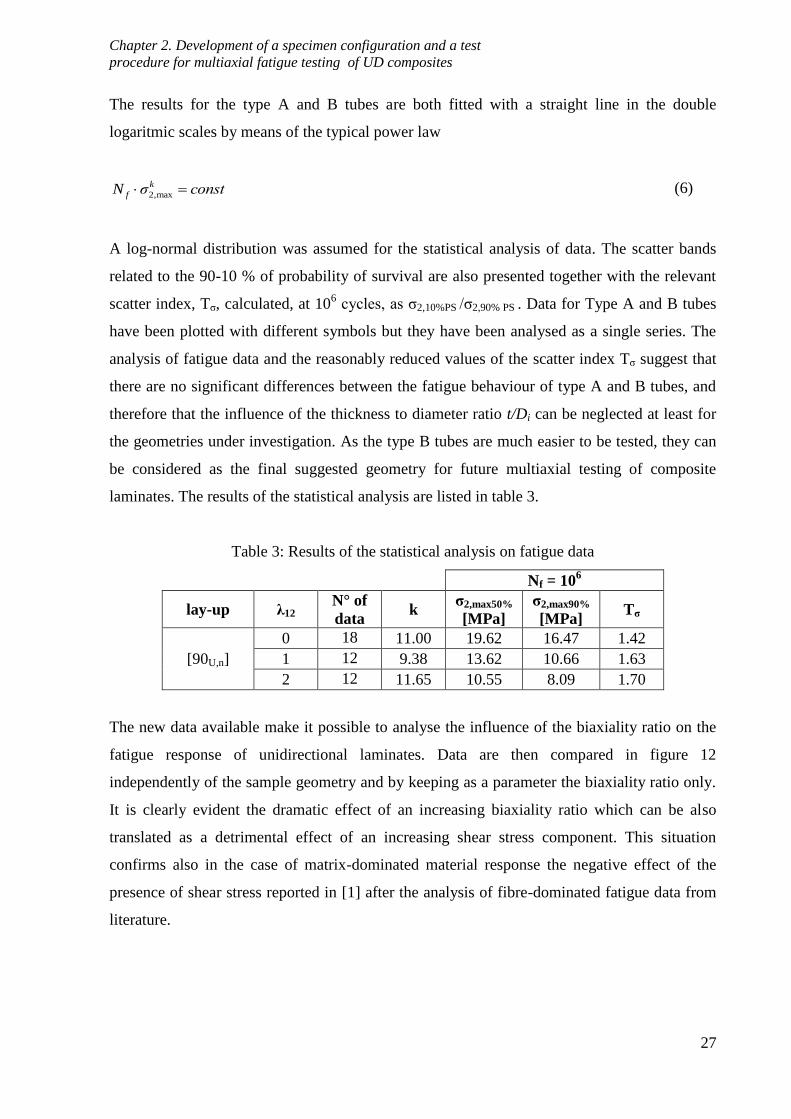
Chapter 2. Development of a specimen configuration and a test
procedure for multiaxial fatigue testing of UD composites
27
The results for the type A and B tubes are both fitted with a straight line in the double
logaritmic scales by means of the typical power law
2,max
k
fN σ const (6)
A log-normal distribution was assumed for the statistical analysis of data. The scatter bands
related to the 90-10 % of probability of survival are also presented together with the relevant
scatter index, Tζ, calculated, at 106 cycles, as ζ2,10%PS /ζ2,90% PS . Data for Type A and B tubes
have been plotted with different symbols but they have been analysed as a single series. The
analysis of fatigue data and the reasonably reduced values of the scatter index Tζ suggest that
there are no significant differences between the fatigue behaviour of type A and B tubes, and
therefore that the influence of the thickness to diameter ratio t/Di can be neglected at least for
the geometries under investigation. As the type B tubes are much easier to be tested, they can
be considered as the final suggested geometry for future multiaxial testing of composite
laminates. The results of the statistical analysis are listed in table 3.
Table 3: Results of the statistical analysis on fatigue data
Nf = 10
6
lay-up λ12 N° of
data k
σ2,max50%
[MPa]
σ2,max90%
[MPa] Tσ
[90U,n]
0 18 11.00 19.62 16.47 1.42
1 12 9.38 13.62 10.66 1.63
2 12 11.65 10.55 8.09 1.70
The new data available make it possible to analyse the influence of the biaxiality ratio on the
fatigue response of unidirectional laminates. Data are then compared in figure 12
independently of the sample geometry and by keeping as a parameter the biaxiality ratio only.
It is clearly evident the dramatic effect of an increasing biaxiality ratio which can be also
translated as a detrimental effect of an increasing shear stress component. This situation
confirms also in the case of matrix-dominated material response the negative effect of the
presence of shear stress reported in [1] after the analysis of fibre-dominated fatigue data from
literature.

Chapter 2. Development of a specimen configuration and a test
procedure for multiaxial fatigue testing of UD composites
28
Figure 12: Influence of the biaxiality ratio λ12
With the aim to collect information on the damage evolution at the macroscopic scale, the
specimens were analysed during fatigue life by means of eye-observations and lock-in analysis
with an infrared camera. Both these techniques did not reveal a visible damage accumulation.
In particular no evidences of a stable (macro) crack propagation were observed during the
entire fatigue life. In fact, immediately after the nucleation, each crack propagated unstably
along the entire circumference of the tube, causing the complete failure in very few cycles. In
this condition, it is clear that the number of cycles to failure presented in figures 9-12
corresponds to the number of cycles for the nucleation of the first transverse crack. These new
data are therefore useful to assess and quantify the influence of the local multiaxial stress state
on the life to crack initiation in unidirectional composites when the material behaviour is
controlled by the matrix or fibre-matrix interface properties.
In addition, the axial and torsional stiffness of the tubes were measured during all the fatigue
tests and no significant stiffness changes were recorded until the last few cycles, when a
sudden stiffness drop occurred due to the unstable propagation of the nucleated macro-crack.
This is a typical behaviour for unidirectional laminates in the case of a matrix-dominated
material response, as confirmed by the results presented in [14, 15].
It can be concluded that, as one may have expected, this kind of test is not characterised by a
progressive macroscopic damage evolution, meant as the nucleation and propagation of
multiple transverse cracks, as instead happens to a UD lamina constrained between other
layers in a multidirectional laminate. At this point it is important to remember one of the main
objectives of the new line of research open with this thesis: the analysis of the dependence of
the damage mechanisms on the local multiaxial stress state and their evolution during the life
5
50
1.E+02 1.E+03 1.E+04 1.E+05 1.E+06 1.E+07
ζ2
,max
[MP
a]
Cycles to failure Nf
type A
type A
type A
λ12 = 0λ12 = 1
λ12 = 2
10
20
30
40 R = 0.05

Chapter 2. Development of a specimen configuration and a test
procedure for multiaxial fatigue testing of UD composites
29
of the sample. The information obtained from this analysis represent the necessary basis for
the development of a damage-based multiaxial fatigue criterion for crack nucleation. For the
characterisation and analysis of the damage growth after the nucleation phase and its possible
dependence on the stress state, it seems therefore reasonable to slightly modify the tubes' lay-
up, including some thin constraining layers suitable to modulate and control the crack growth
and the associated damage evolution. This has to be done, however, paying always attention to
maintain as much as possible a "clean" biaxial loading condition which is crucial for the aim
of the present analysis. Proper modifications of specimens' lay-up in this direction are
proposed in the next section.
2.6. Modifications of specimens' lay-up
In order to observe the transverse crack propagation phenomenon it has to be made stable by
adding some constraining tougher layers in addition to the 90° plies. A stable propagation
phase is obtained testing tubular specimens manufactured first with stacking sequence
[0F/90U,3] and then [0F/90U,3/0F], where the subscript F means fabric. The constraining effect
provided by the 0° fabric layers prevents the unstable growth of the nucleated cracks, allowing
the analysis of the propagation phase. The type and amount of 0° fabric layers in the new
specimen configurations were chosen to provide a stable crack propagation without altering
significantly the stress state in the 90° layers. In particular, care was taken not to introduce a
significant ζ1 component, because we were interested in the influence of shear stress on
transverse fatigue behaviour.
Table 4: Elastic and strength properties of the fabric tapes
VV345T-DT107A EE106 – ET443
average st. dev. average st. dev.
σ1,U (MPa) 431 15 257 7
σ2,U (MPa) 447 21 239 2.5
σ6,U (MPa) 85 - 80 -
E1 (MPa) 21700 82 17033 491
E2 (MPa) 20880 431 16538 206
G12 (MPa) 3351 - 3032 -
ν12 0.159 0.005 0.159 -

Chapter 2. Development of a specimen configuration and a test
procedure for multiaxial fatigue testing of UD composites
30
The following fabric pre-pregs have been used:
- VV345T-DT107A produced by Deltatech (Italy), glass/epoxy fabric, thickness =
0.31mm, for the 0° fabric plies of the [0F/90U,3] tubes.
- EE106-ET443 produced by Saati S.p.A. (Italy), glass/epoxy fabric, thickness =
0.13mm, for the 0° fabric plies of the [0F/90U,3/0F] tubes.
The elastic and static strength properties are listed in Table 4.
2.6.1 [0F/90U,3] tubes
As a first attempt to stabilise damage evolution, an internal 0° fabric layer was introduced in
the lay-up of the 19 mm diameter tubes. This solution was sufficient to avoid sudden crack
propagation, without altering the stress state significantly. In fact, a peak value of ζ1, equal to
-9.5% of ζ2, arises in the external surface of the transverse layers under the application of
tensile load, as calculated from Finite Element (FE) analyses. According to the biaxiality ratios
previously defined, the value of λ1 = ζ2/ζ1 is always equal to -10.5. Though an infinite value of
λ1 would be desired for the purpose of the present work, its actual value can be considered
high enough in modulus to neglect its influence.
Fatigue tests on [0F/90U,3] tubes were carried out with different values of λ12, namely 0, 0.63,
1,25 and 2.5. During all the tests, a nucleation and subsequent propagation of the cracks in the
circumferential direction were observed. In addition, multiple cracking occurred (see Figure
13), causing a progressive decrease in global stiffness, as shown in Figure 14. Stiffness drops
are due to the nucleation of a new crack, whereas crack propagation around the tube produces
a continuous decrease in stiffness.
Figure 13: Multiple cracking in a [0F/90U,3] tube
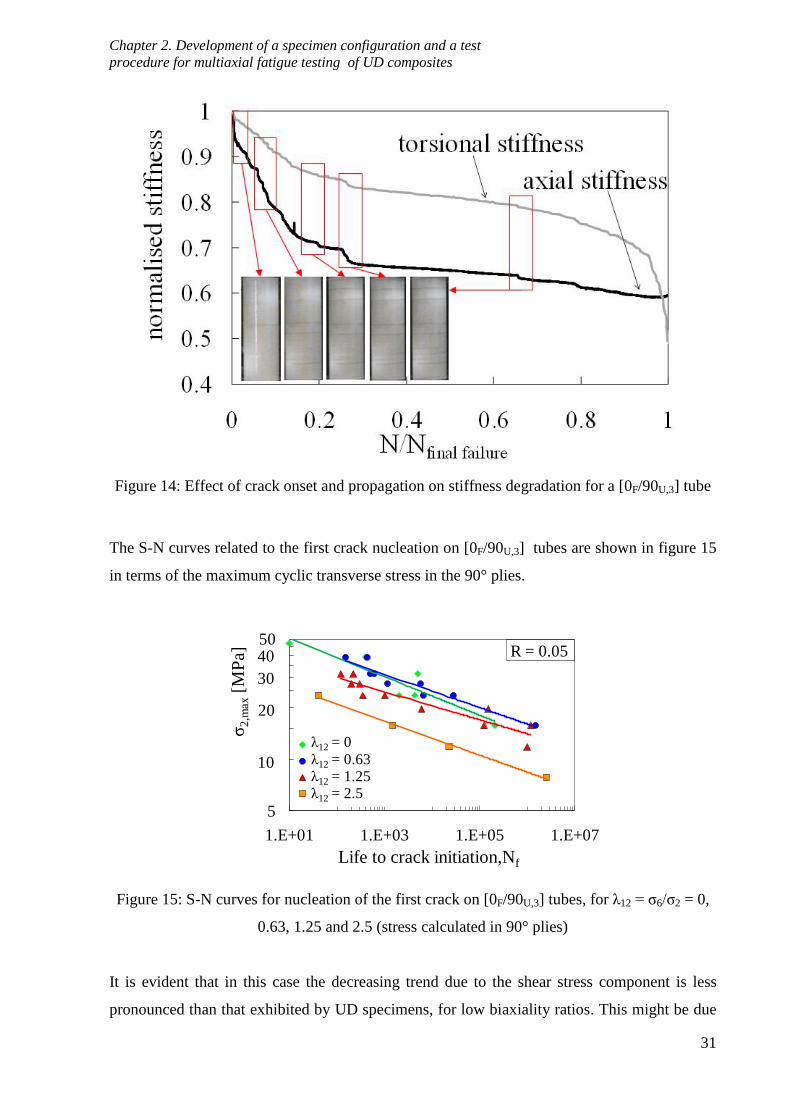
Chapter 2. Development of a specimen configuration and a test
procedure for multiaxial fatigue testing of UD composites
31
Figure 14: Effect of crack onset and propagation on stiffness degradation for a [0F/90U,3] tube
The S-N curves related to the first crack nucleation on [0F/90U,3] tubes are shown in figure 15
in terms of the maximum cyclic transverse stress in the 90° plies.
Figure 15: S-N curves for nucleation of the first crack on [0F/90U,3] tubes, for λ12 = ζ6/ζ2 = 0,
0.63, 1.25 and 2.5 (stress calculated in 90° plies)
It is evident that in this case the decreasing trend due to the shear stress component is less
pronounced than that exhibited by UD specimens, for low biaxiality ratios. This might be due
5
50
1.E+01 1.E+03 1.E+05 1.E+07
ζ2
,max
[MP
a]
Life to crack initiation,Nf
l0
l05
l
l
λ12 = 0
λ12 = 0.63λ12 = 1.25λ12 = 2.5
R = 0.05
10
20
30
40

Chapter 2. Development of a specimen configuration and a test
procedure for multiaxial fatigue testing of UD composites
32
to the presence of defects, observed in some cases on the external surface of some tubes,
which can act as preferential sites for crack nucleation (see figure 16).
Figure 16: Crack initiations at surface defects for [0F/90U,3] tubes
Table 5: Results of the statistical analysis on fatigue data for [0F/90U,3] tubes
Nf = 10
6
lay-up λ12 N° of
data k
σ2,max50%
[MPa]
σ2,max90%
[MPa] Tσ
[0F/90U,3]
0 6 7.99 12.66 8.37 2.30
0.63 9 9.49 15.17 12.21 1.54
1.25 11 10.70 13.15 9.97 1.74
2.5 4 10.02 8.50 7.29 1.31
However, S-N curves according to equation (6) have been calculated as for the UD tubes, and
the results of the statistical analysis are shown in Table 5.
2.6.2 [0F/90U,3/0F] tubes
With the aim of avoiding surface defects which could influence fatigue results in terms of
crack initiation, a third lay-up has been proposed for 19 mm diameter tubes, using both an
internal and an external fabric ply. A thinner fabric tape (EE106-ET443) was used to limit the
introduction of the ζ1 stress component in the transverse layers. In this case, from FE analyses
the peak value of ζ1 resulted equal to -9.8% of the applied ζ2, giving rise to a biaxiality ratio λ1
= -10.2, again considered high enough in modulus to be neglected.
This represents the definitive specimens configuration, since it allows to analyse the fatigue
behaviour both in terms of crack initiation (avoiding the influence of the surface finishing) and
crack propagation.
In the next chapter the fatigue results on this specimen type are reported for several biaxiality
ratios and load ratios.

Chapter 2. Development of a specimen configuration and a test
procedure for multiaxial fatigue testing of UD composites
33
2.7. Conclusions
In the present chapter, the possible test configurations for multiaxial fatigue testing of
unidirectional composites have been analysed. Glass/epoxy tubes with fibres oriented at 90°
with respect to the axis of the tube and subjected to tension/torsion loading have been found to
be the best way to obtain a biaxial stress state characterised by the presence of transverse and
in-plane shear stresses. It has been observed that the lower the thickness to diameter ratio
(obtained by means of large tubes) is, the lower the variability of the shear stress along the
thickness and the closer the stress state to a plane stress condition are. Conversely testing of
large diameter tubes is more complicated due to the difficult in clamping, and it is not worth
the effort since the fatigue response for large and small tubes, easier to be tested, is found to be
comparable. On these bases, [90]4 tubes with an external diameter of 22 mm and thickness of
1.5 mm, and end tabs bonded after the curing process, are suggested as the best specimen
configuration. Machining of the specimens for the enhancement of surface finishing turned out
to be a source of more additional defects and it is not recommended.
The analysis of the damage evolution during fatigue testing indicated clearly the absence of a
stable, measurable damage growth. Once a transverse crack is nucleated, it propagates
unstably all along the tube circumference leading to a complete separation of the sample in
very few cycles. Due to this behaviour, axial and torsional stiffness exhibited only a sudden
drop in correspondence of the final failure. The new multiaxial fatigue data presented above
are therefore to be considered as data related to the nucleation of the first transverse crack.
Under this light, the comparative analysis of the series of multiaxial fatigue data indicates a
clear and detrimental effect of the shear stress component (and biaxiality ratio λ12) on the
transverse fatigue strength and life to crack initiation of unidirectional composites.
For the accurate investigation of the damage growth after the nucleation phase, new specimen
lay-ups have been proposed, with the inclusion of thin 0° layers suitable to simulate the
constraining effect of surrounding layers and control the damage evolution, as in the case of a
UD lamina part of a multidirectional laminate, however without excessively altering the local
biaxial stress state. Eventually, tubes with internal diameter of 19 mm and lay-up [0F/90U,3/0F]
have been defined as the best solution for analysing the influence of the multiaxial stress state
on crack initiation and propagation in the 90° UD plies. The results of an extensive
experimental investigation on these specimens is presented in the next chapter.
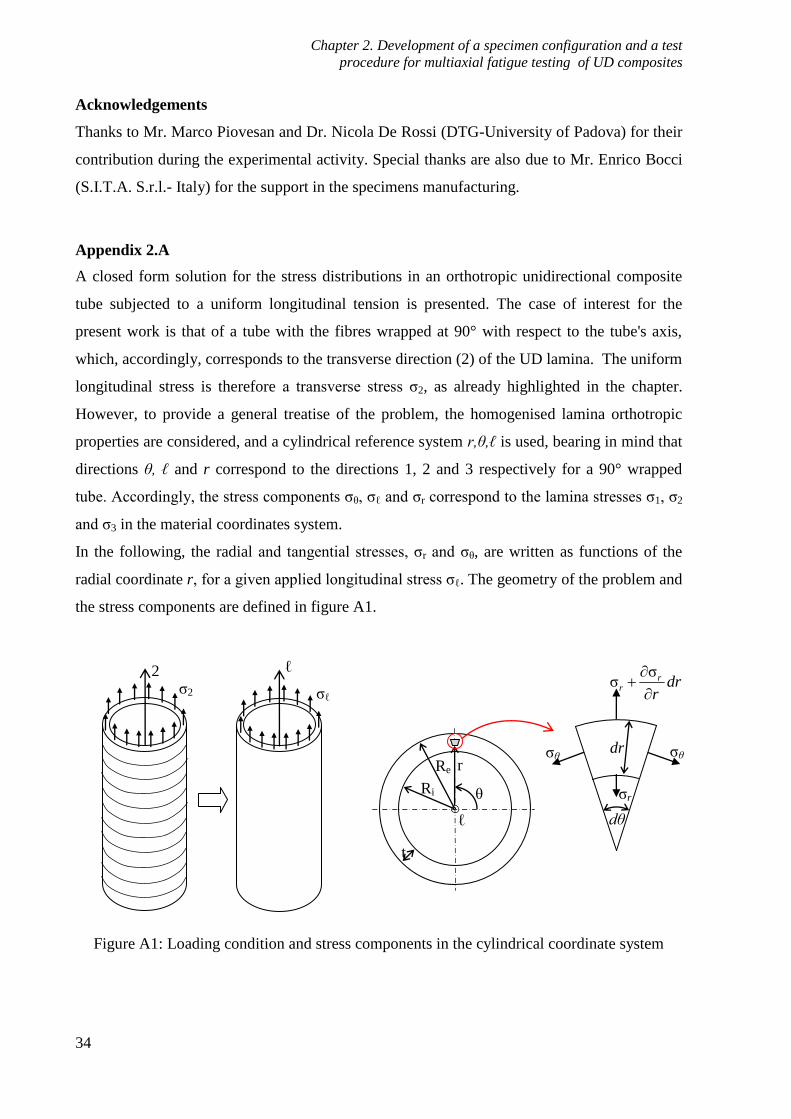
Chapter 2. Development of a specimen configuration and a test
procedure for multiaxial fatigue testing of UD composites
34
Acknowledgements
Thanks to Mr. Marco Piovesan and Dr. Nicola De Rossi (DTG-University of Padova) for their
contribution during the experimental activity. Special thanks are also due to Mr. Enrico Bocci
(S.I.T.A. S.r.l.- Italy) for the support in the specimens manufacturing.
Appendix 2.A
A closed form solution for the stress distributions in an orthotropic unidirectional composite
tube subjected to a uniform longitudinal tension is presented. The case of interest for the
present work is that of a tube with the fibres wrapped at 90° with respect to the tube's axis,
which, accordingly, corresponds to the transverse direction (2) of the UD lamina. The uniform
longitudinal stress is therefore a transverse stress ζ2, as already highlighted in the chapter.
However, to provide a general treatise of the problem, the homogenised lamina orthotropic
properties are considered, and a cylindrical reference system r,θ,ℓ is used, bearing in mind that
directions θ, ℓ and r correspond to the directions 1, 2 and 3 respectively for a 90° wrapped
tube. Accordingly, the stress components ζθ, ζℓ and ζr correspond to the lamina stresses ζ1, ζ2
and ζ3 in the material coordinates system.
In the following, the radial and tangential stresses, ζr and ζθ, are written as functions of the
radial coordinate r, for a given applied longitudinal stress ζℓ. The geometry of the problem and
the stress components are defined in figure A1.
Figure A1: Loading condition and stress components in the cylindrical coordinate system
ζℓ
ℓ 2 ζ2
Ri
Re
θ
r
ℓ
t
σσ r
r drr
ζr
dr
dθ
ζθ ζθ
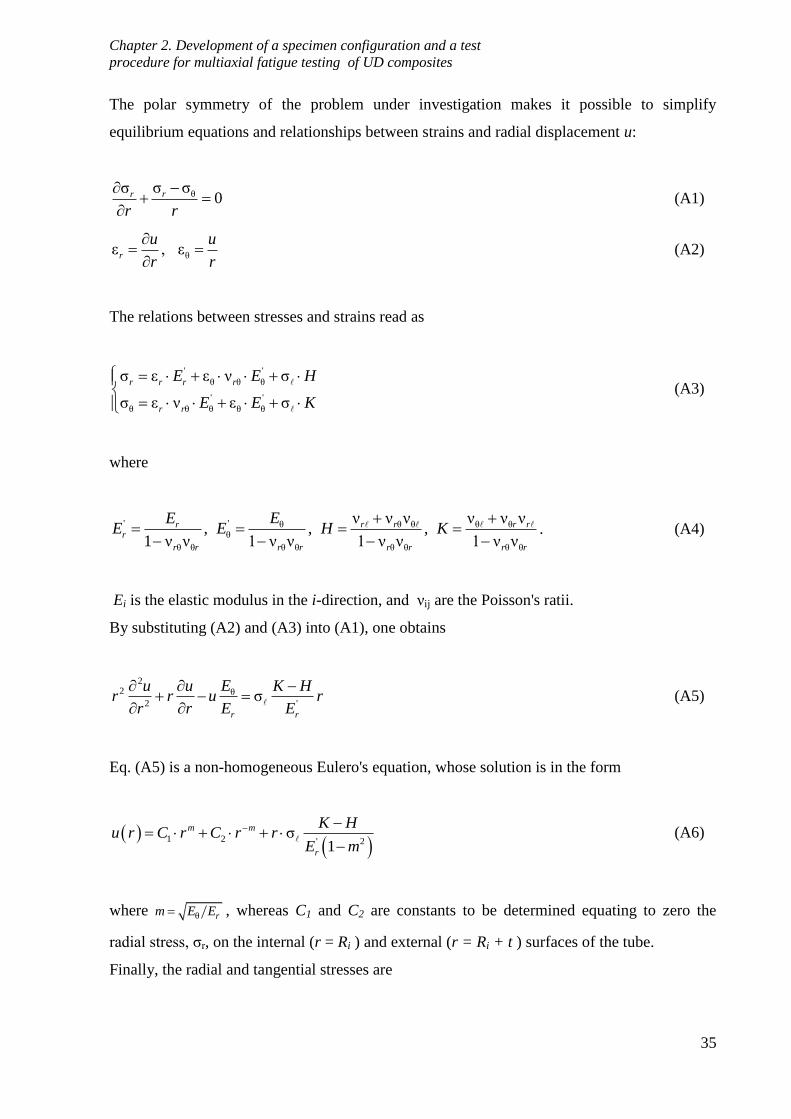
Chapter 2. Development of a specimen configuration and a test
procedure for multiaxial fatigue testing of UD composites
35
The polar symmetry of the problem under investigation makes it possible to simplify
equilibrium equations and relationships between strains and radial displacement u:
θσ σσ0rr
r r
(A1)
θε , εr
u u
r r
(A2)
The relations between stresses and strains read as
' '
θ θ θ
' '
θ θ θ θ θ
σ ε ε ν σ
σ ε ν ε σ
r r r r
r r
E E H
E E K
(A3)
where
' ' θ θ θ θ θθ
θ θ θ θ θ θ θ θ
ν ν ν ν ν ν, , ,
1 ν ν 1 ν ν 1 ν ν 1 ν ν
r r r rrr
r r r r r r r r
EEE E H K
. (A4)
Ei is the elastic modulus in the i-direction, and νij are the Poisson's ratii.
By substituting (A2) and (A3) into (A1), one obtains
22 θ
2 'σ
r r
Eu u K Hr r u r
r r E E
(A5)
Eq. (A5) is a non-homogeneous Eulero's equation, whose solution is in the form
1 2 ' 2σ
1
m m
r
K Hu r C r C r r
E m
(A6)
where θ rm E E , whereas C1 and C2 are constants to be determined equating to zero the
radial stress, ζr, on the internal (r = Ri ) and external (r = Ri + t ) surfaces of the tube.
Finally, the radial and tangential stresses are
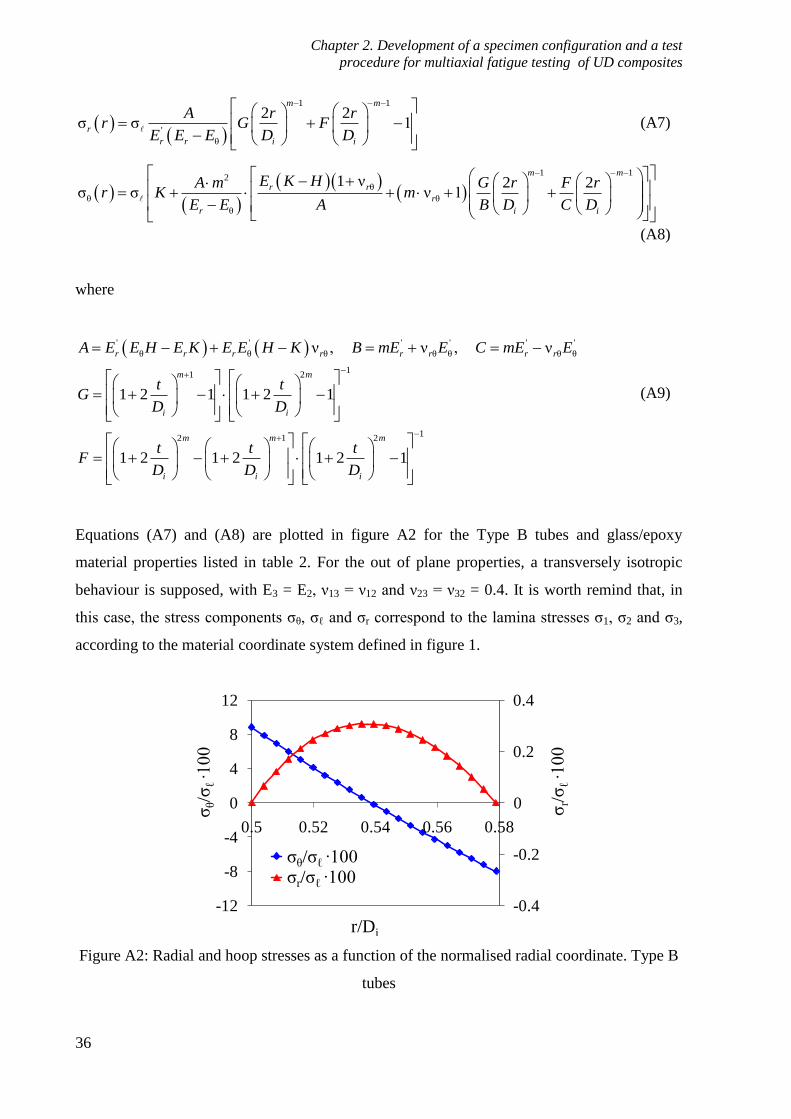
Chapter 2. Development of a specimen configuration and a test
procedure for multiaxial fatigue testing of UD composites
36
1 1
'
θ
2 2σ σ 1
m m
r
r r i i
A r rr G F
E E E D D
(A7)
1 12
θ
θ θ
θ
1 ν 2 2σ σ ν 1
m m
r r
r
r i i
E K HA m G r F rr K m
E E A B D C D
(A8)
where
' ' ' ' ' '
θ θ θ θ θ θ θ
11 2
12 1 2
ν , ν , ν
1 2 1 1 2 1
1 2 1 2 1 2 1
r r r r r r r r
m m
i i
m m m
i i i
A E E H E K E E H K B mE E C mE E
t tG
D D
t t tF
D D D
(A9)
Equations (A7) and (A8) are plotted in figure A2 for the Type B tubes and glass/epoxy
material properties listed in table 2. For the out of plane properties, a transversely isotropic
behaviour is supposed, with E3 = E2, ν13 = ν12 and ν23 = ν32 = 0.4. It is worth remind that, in
this case, the stress components ζθ, ζℓ and ζr correspond to the lamina stresses ζ1, ζ2 and ζ3,
according to the material coordinate system defined in figure 1.
Figure A2: Radial and hoop stresses as a function of the normalised radial coordinate. Type B
tubes
-0.4
-0.2
0
0.2
0.4
-12
-8
-4
0
4
8
12
0.5 0.52 0.54 0.56 0.58
ζr/ζ
ℓ ∙1
00
ζθ/ζ
ℓ ∙1
00
r/Di
Serie3Serie4ζθ/ζℓ ∙100ζr/ζℓ ∙100

Chapter 2. Development of a specimen configuration and a test
procedure for multiaxial fatigue testing of UD composites
37
It is evident that the radial stress is very small (0,3% ζℓ), whereas the tensile and compressive
peak values of the tangential stress (at the internal and external diameters, respectively)
depends on material properties and thickness to diameter ratio, t/Di. In particular the peak
tangential stresses are plotted in figure A3 as a function of t/Di for glass/epoxy and
carbon/epoxy tubes with the fibres wrapped at 90° with respect to the longitudinal axis. It is
evident that the higher the ratio t/Di is, the higher the peak stresses are. This effect is
particularly emphasised in the case of a carbon /epoxy system (E1 = 147000 MPa, E2 = 10300
MPa, G12 = 7000 MPa, ν12 = 0.27).
Figure A3: Peak values of the tangential stress for glass/epoxy (G/E) and carbon/epoxy (C/E)
systems vs t/Di
-100-80-60-40-20
020406080
100120
0 0.1 0.2
ζθ/ζ
ℓ ∙1
00
t/Di
G/E internalG/E externalC/E internalC/E external
Chapter 2. Development of a specimen configuration and a test
procedure for multiaxial fatigue testing of UD composites
38
References of chapter 2
[1] Quaresimin M, Susmel L, Talreja R. Fatigue behaviour and life assessment of
composite laminates under multiaxial loadings. International Journal of Fatigue 2010;
32: 2-16
[2] Diao X, Ye L, Mai YW. A statistical model of residual strength and fatigue life of
composite laminates. Composites Science and Technology 1995; 54: 329-336
[3] Shokrieh MM, Lessard LB. Multiaxial fatigue behaviour of unidirectional plies based
on uniaxial fatigue experiments-II. Experimental evaluation. International Journal of
Fatigue 1997; 19(3): 209-217
[4] Praveen GN, Reddy JN. Transverse matrix cracks in cross-ply laminates: stress
transfer, stiffness reduction and crack opening profiles. Acta Mechanica 1998; 130:
227-248
[5] Calcaterra JR, Mall S. Strength degradation during fatigue of unidirectional and cross-
ply SCS-6/Ti-15-3 composites. International Journal of Fatigue 1999; 21: 215-223
[6] Tserpes KI, Papanikos P, Labeas G, Pantelakis Sp. Fatigue damage accumulation and
residual strength assessment of CFRP laminates. Composite structures 2004; 63: 219-
230
[7] Varna J, Joffe R, Akshantala NV, Talreja R. Damage in composite laminates with off-
axis plies. Composites Science and Technology 1999; 59: 2139-2147
[8] Singh CV, Talreja R. A synergistic damage mechanics approach for composite
laminates with matrix cracks in multiple orientations. Mechanics of materials 2009; 41:
954-968
[9] Singh CV, Talreja R. Evolution of ply cracks in multidirectional composite laminates.
International Journal of Solids and Structures 2010; 47: 1338-1349
[10] Tong J, Guild FJ, Ogin SL, Smith PA. On matrix crack growth in quasi isotropic
laminates-I. Experimental investigation. . Composites Science and Technology 1997;
57: 1527-1535
[11] Tong J. Three Stages of Fatigue Crack Growth in GFRP Composite Laminates. Journal
of Engineering Materials and Technology 2001; 123: 139-143
[12] Sun Z, Daniel IM, Luo JJ. Modeling of fatigue damage in a polymer matrix composite,
Materials Science and Engineering 2003; A361: 302-311

Chapter 2. Development of a specimen configuration and a test
procedure for multiaxial fatigue testing of UD composites
39
[13] Tohgo K, Nakagawa S, Kageyama K. Fatigue behaviour of CFRP cross-ply laminates
under on-axis and off-axis cyclic loading. International Journal of Fatigue 2006; 28:
1254-1262
[14] Hashin Z, Rotem A. A fatigue failure criterion for fibre-reinforced materials. Journal
of Composite Materials 1973; 7: 448-464
[15] Awerbuch J, Hahn HT. Off-axis fatigue of graphite/epoxy composite. Fatigue of
Fibrous Composite Materials, ASTM STP 723, American Society for Testing and
Materials, 1981: 243-273
[16] El-Kadi H, Ellyin F. Effect of stress ratio on the fatigue of unidirectional fibreglass-
epoxy composite laminae. Composites 1994; 25(10): 917-924
[17] Kawai M, Yajima S, Hachinohe A, Takano Y. Off-axis fatigue behaviour of
unidirectional carbon fibre-reinforced composites at room and high temperatures.
Journal of Composites Materials 2001; 35(7): 545-576
[18] Kawai M, Suda H. Effects of non-negative mean stress on the off-axis fatigue
behaviour of unidirectional carbon/epoxy composites at room temperature. Journal of
Composites Materials 2004; 38(10): 833-854
[19] Found MS. Review of the multiaxial fatigue testing of fibre reinforced plastics.
ASTM Special Technical Publication 1985: 381-395
[20] Chen AS, Matthews FL. A review of multiaxial/biaxial loading tests for composite
materials. Composites 1993; 24(5): 395-406
[21] Olsson R. A survey of test methods for multiaxial and out-of-plane strength of
composite laminates. Composites Science and Technology 2011; 71: 773-783
[22] Makris A, Vandenbergh T, Ramault C, Van Hemelrijck D, Lamkanfi E, Van
Paepegem W. Shape optimisation of a biaxially loaded cruciform specimen. Polymer
Testing 2010; 29: 216-223
[23] Jones DL, Poulose PK, Liebovitz H. Effect of biaxial loads on the static and fatigue
properties of composite materials. ASTM Special Technical Publication 1985: 413-
427
[24] Mailly L, Wang SS. Recent Development of Planar Cruciform Experiment on Biaxial
Tensile Deformation and Failure of Unidirectional Glass/Epoxy Composite. Journal
of Composite Materials 2008; 42: 1359-1379
[25] Makris A, Ramault C, Van Hemelrijck D, Zarouchas D, Lamkanfi E, Van Paepegem
W. An Investigation of the Mechanical Behaviour of Carbon Epoxy Cross Ply

Chapter 2. Development of a specimen configuration and a test
procedure for multiaxial fatigue testing of UD composites
40
Cruciform Specimens Under Biaxial Loading. Polymer Composites 2010; 31: 1554-
1561
[26] Antoniou AE, Van Hemelrijck D, Philippidis TP. Failure prediction for a glass/epoxy
cruciform specimen under static biaxial loading. Composites Science and Technology
2010; 70: 1232-1241
[27] Radon JC, Wachnicky CR. Biaxial fatigue of glass fibre reinforced polyester resin.
In: Multiaxial Fatigue, ASTM STP 853, Edited by K. J. Miller and M. Brown,
American Society for Testing and Materials, Philadelphia 1985: 396-412
[28] Smith EW, Pascoe KJ. Biaxial fatigue of a glass-fibre reinforced composite. Part 1:
fatigue and fracture behaviour. In: Biaxial and Multiaxial Fatigue, Edited by M.
Brown and K. J. Miller, EGF 3, Mechanical Engineering Publications, London 1989:
367-396
[29] Ramault C. Guidelines for biaxial testing of fibre reinforced composites using a
cruciform specimen, PhD thesis 2012, Vrije Universiteit Brussel
[30] Owen MJ, Griffiths JR. Evaluation of biaxial stress failure surfaces for a glass fabric
reinforced polyester resin under static and fatigue loading. Journal of Material
Science 1978; 13: 1521-1537
[31] Foral RF, Humpherey WD. Biaxial stress behaviour of graphite and kevlar 49
fibre/epoxy composites and hybrids. AIAA Journal 1984; 22(1): 111-116
[32] Perreux D, Joseph E. The effect of frequency on the fatigue performance of filament
wound pipes under biaxial loading: experimental results and damage mechanics.
Composites Science and Technology 1997; 57: 353-364
[33] Francis PH, Walrath DE, Sims DF, Weed DN. Biaxial fatigue loading of notched
composites. Journal of Composite Materials 1977; 11: 488-501
[34] Wang SS, Chim ES-M, Socie DF. Biaxial fatigue of fiber-reinforced composites at
cryogenic temperature, Part I Fatigue fracture life and damage mechanisms. Journal
of Engineering Materials and Technology, 1982; 104: 128-136
[35] Wang SS, Chim ES-M, Socie DF. Stiffness degradation of fiber-reinforced
composites under uniaxial tensile, pure torsional, and biaxial fatigue at cryogenic
temperature. Composite Materials: Testing and Design, ASTM STP 787 EB, 1982,
pp. 287-301
[36] Krempl E, Elzey DM, Hong BZ, Ayar T, Loewy RG. Uniaxial and biaxial fatigue
properties of thin-walled composite tubes. Journal of the American Helicopter
Society 1988; 33 (3): 3-10
Chapter 2. Development of a specimen configuration and a test
procedure for multiaxial fatigue testing of UD composites
41
[37] Amijima S, Fujii T, Hamaguchi M, Static and fatigue tests of woven glass fabric
composite under biaxial tension-torsion loading. Composites 1991; 22(4): 281-289
[38] Fujii T, Shina T, Okubo K. Fatigue notch sensitivity of glass woven fabric composite
having a circular hole under tension/torsion biaxial loading. Journal of Composite
Materials 1994; 28(3): 234-251
[39] Fujii T, Lin F. Fatigue behavior of a plain-woven glass fabric laminate under
tension/torsion biaxial loading Journal of Composite Materials 1995; 29(5): 573-590
[40] Kawakami H, Fujii T, Morita Y. Fatigue degradation and life prediction of glass
fabric polymer composite under tension/torsion biaxial loadings. Journal of
Reinforced Plastics and Composites 1996; 15: 183-195
[41] Aboul Wafa MN, Hamdy AH, El-Midany AA. Combined bending torsional fatigue of
woven rowing GRP. Journal of Engineering Materials Technology (Trans of ASME)
1997; 119: 181-185
[42] Adden S, Horst P, Damage propagation in non-crimp fabrics under bi-axial static and
fatigue loading, Composites Science and Technology 2006; 66: 626–633
[43] Qi D, Cheng G. Fatigue behaviour of filament-wound glass fibre reinforced epoxy
composite tubes under tension/torsion biaxial loading. Polymer Composites 2007; 28
(1): 116-123
[44] Adden S, Horst P, Stiffness degradation under fatigue in multiaxially loaded non-
crimped-fabrics, International Journal of Fatigue 2010; 32: 108–122
[45] Schmidt F, Rheinfurth M, Horst P, Busse G, Multiaxial fatigue behaviour of GFRP
with evenly distributed or accumulated voids monitored by various NDT
methodologies, International Journal of Fatigue 2012; 43: 207–216
[46] Schmidt F, Rheinfurth M, Horst P, Busse G, Effects of local fibre waviness on
damage mechanisms and fatigue behaviour of biaxially loaded tube specimens,
Composites Science and Technology 2012; 72: 1075–1082

Chapter 2. Development of a specimen configuration and a test
procedure for multiaxial fatigue testing of UD composites
42
Chapter 3. Damage initiation and evolution in glass/epoxy
tubes subjected to combined tension-torsion fatigue loading
43
3
Damage initiation and evolution in glass/epoxy tubes
subjected to combined tension-torsion fatigue loading
3.1. Introduction
The fatigue life of a composite part subjected to multiaxial loading is characterised by a
progressive degradation of its mechanical properties (stiffness and strength) due to damage
evolution occurring from the very beginning of life to the final failure.
From the early stages of fatigue life, matrix cracks initiate in the off-axis layers and then
propagate throughout the laminate width. Examples of this behaviour, responsible for the
global stiffness degradation of the laminate, can be found in Refs. [1-4] for biaxially loaded
tubes and in [5-13] for uniaxially loaded flat coupons. The cracks initiated in the off-axis
layers are preferential sites for the onset of delaminations, usually occurring when the density
of matrix cracks is close to a saturation condition [8]. The presence of similar damage patterns
and the importance to account for the damage evolution in the development of fatigue design
tools, is emphasised also in Refs. [14-15]. These phenomena, however, are not directly
responsible for the final failure of the laminate. Accordingly, they have been defined as "sub-
critical damage mechanisms" [16]. The overall failure of the laminate is controlled, instead, by
fibre-related mechanisms, the so called "critical damage mechanisms", the evolution of which
might be enhanced by the sub-critical ones [16].
As stiffness is a crucial parameter in the design of structural components with composite
materials, it is essential to predict not only the final failure of laminates but also the
progressive damage evolution during the entire fatigue life, since it leads to the degradation of
elastic properties. In literature it is acknowledged that the loss of stiffness is a function of the
density of matrix cracks in each off-axis layer, as far as the cracks are completely spanning
through the width of the laminate (see [17-20] among others). If this condition is not verified,
the length of those cracks becomes a variable of fundamental importance for a good estimation
of stiffness degradation, as reported in [12,19,21]. Accordingly, predicting the evolution of
crack density during fatigue life, which is controlled by the initiation of off-axis cracks, and

Chapter 3. Damage initiation and evolution in glass/epoxy
tubes subjected to combined tension-torsion fatigue loading
44
the length of the initiated cracks controlled by their propagation in the width direction, is
essential.
In a composite structure under external multiaxial loading as well as in a multidirectional
laminate subjected to uniaxial load, each layer is, in general, subjected to a multiaxial stress
state, due either to the external loads applied in different directions or to the material
orthotropy. It is therefore essential to define suitable predictive multiaxial criteria for the
initiation and propagation of cracks in unidirectional layers, under loading conditions leading
to a matrix-dominated response.
In the authors' opinion, reliable criteria should be based on the damage mechanisms occurring
at the microscopic scale, leading to the initiation and propagation of off-axis cracks. Some
phenomenological criteria available in literature was applied to a large database of
experimental data in [22], and have been proved to lead, sometimes, to inaccurate and non-
conservative life estimations. Concerning the initiation of matrix cracks in UD laminae, other
phenomenological criteria can be found in Refs.[23-25]. The development of a damage-based
multiaxial criterion for crack initiation requires an extensive experimental investigation on UD
laminae with the aim of understanding the influence of the multiaxial stress state on the
damage mechanisms leading to a matrix dominated fatigue failure. Several contributions in the
literature report results on multidirectional laminates under uniaxial [5-13,26, 27] or multiaxial
external loads applied on tubular [1-4, 28-30] or cruciform [31, 32] specimens. Unfortunately,
from these works it is far from easy to obtain clear information about the influence of the
multiaxial condition on the response of the single UD lamina. Results from off-axis fatigue
tests on unidirectional composites reported in [23-25, 33] reveal that different S-N curves
(nominal stress versus number of cycle to failure) are related to different off-axis angles.
These results confirm the influence of the multiaxial condition on the fatigue life of UD
laminae, but they are related to a stress state where all the three in-plane stress components, ζ1,
ζ2, and ζ6, are non zero. Differently it would be important, for a deeper understanding of the
matrix-dominated behaviour, to focus on the mutual influence of the transverse and in-plane
shear stresses only.
Concerning the fatigue propagation of off-axis matrix cracks, which usually occurs under
mixed I+II mode, multiaxial criteria and a comprehensive experimental investigation are not
yet available in the literature. The pure mode I propagation of transverse cracks in
multidirectional laminates was studied in [10, 13, 34]. The propagation of cracks in the 90°
layers of cross-ply laminates was studied by Ogin and co-workers [34] and crack growth data
were successfully summarized in terms of a Paris curve relating the Crack Growth Rate (CGR)
Chapter 3. Damage initiation and evolution in glass/epoxy
tubes subjected to combined tension-torsion fatigue loading
45
to the maximum cyclic value of the mode I stress intensity factor at the crack tip. Similar
analyses can be found in Refs. [10, 13], where the mode I propagation of cracks in the 90°
plies of multidirectional laminates is described by means of a Paris-like curve in terms of the
range of the mode I Strain Energy Release Rate (SERR or G).
The analysis of crack propagation in off-axis layers can only be found in Ref. [5], where
cracks in the 45° and 90° layers of a quasi-isotropic laminate were analysed and Paris-like
curves were drawn in terms of the range of the total SERR (computed deriving the laminate
compliance from Finite Elements analyses). The authors reported that all the experimental data
were reasonably well described by the same Paris-like curve, independently of the off-axis
angle. However, the available experimental data were not enough to draw significant
conclusions about the influence of multiaxiality on the propagation of intralaminar matrix
cracks.
Another parameter which has been shown to significantly influence the fatigue behaviour of
composites is the load ratio R, defined as the ratio between the minimum and the maximum
fatigue loads. Qi and Cheng [30] tested tubular specimens with lay-up [±θ] (with θ = 35°, 55°
and 70°) using load ratios of 0 and -1. They found a strong influence of R on the S-N curves
plotted in terms of the maximum cyclic applied stress. In particular, a dramatic detrimental
effect was found for θ = 35° and R = -1, with respect to the fatigue curve for R = 0. A lower,
but still evident effect was also found for θ = 55° and 70°. However, as the reported fatigue
curves were related to the final failure of the tubes, these results are not useful to understand
the behavior of a single lamina.
In this direction, more useful data can be found in the works by El Kadi and Ellyin [24] and by
Kawai and Suda [25], where tests were conducted on unidirectional glass/epoxy and
carbon/epoxy laminae respectively, subjected to cyclic uniaxial load with different off-axis
angles θ. In [24] three values of the stress ratio were considered (R = -1, 0 and 0.5) for off axis
angles θ = 0°, 19°, 45°, 71° and 90°. Strong differences between the fatigue curves, expressed
in terms of the maximum cyclic global stress, for R = 0 and 0.5 were observed for each value
of θ, the slope being lower for higher value of R. Similar conclusions can be drawn for R = 0
and -1 and θ = 0° and 19°, while very small differences were found between the curves for R =
0 and -1 related to off-axis angles of 45, 71 and 90 degrees.
In [25] tests were conducted for R = -1, 0.1 and 0.5 and θ = 0°, 15°, 30°, 45° and 90°. In this
case a clear influence of R was always found, in particular on the slope of the S-N curves,
becoming steeper as R decreased. From the data presented in Refs. [24, 25] it is not possible to
drawn a unique conclusion about the influence of the load ratio on the matrix-dominated
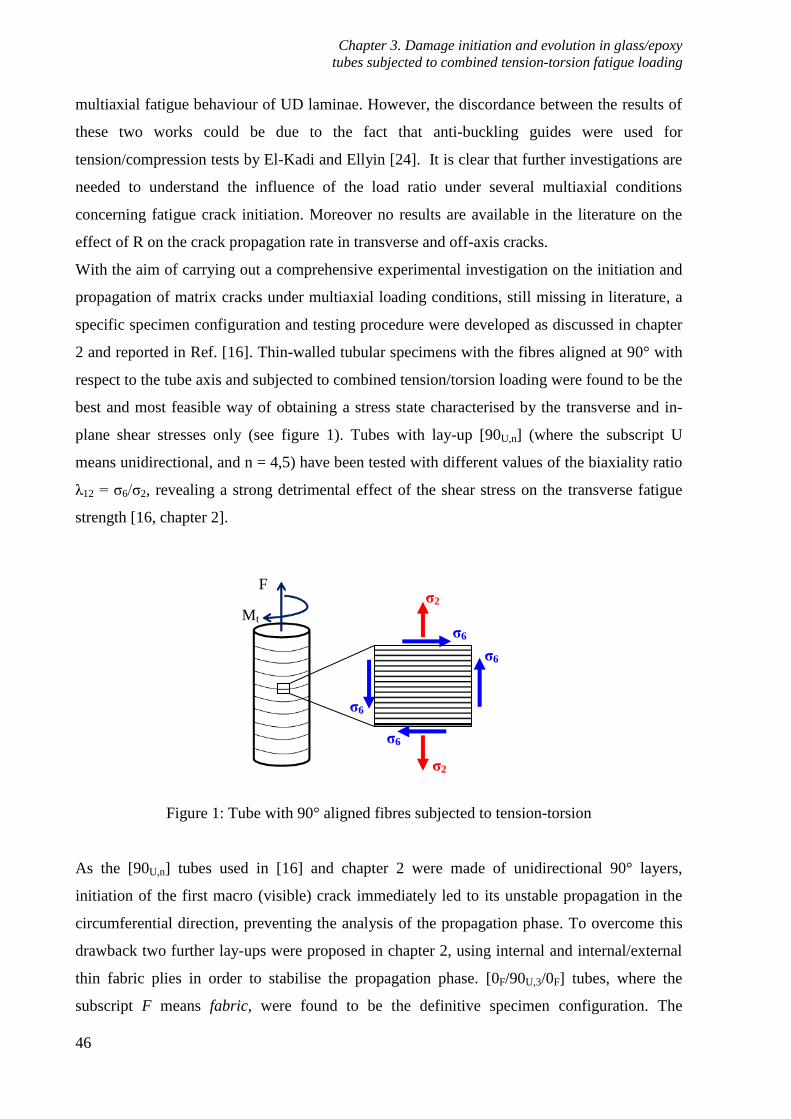
Chapter 3. Damage initiation and evolution in glass/epoxy
tubes subjected to combined tension-torsion fatigue loading
46
multiaxial fatigue behaviour of UD laminae. However, the discordance between the results of
these two works could be due to the fact that anti-buckling guides were used for
tension/compression tests by El-Kadi and Ellyin [24]. It is clear that further investigations are
needed to understand the influence of the load ratio under several multiaxial conditions
concerning fatigue crack initiation. Moreover no results are available in the literature on the
effect of R on the crack propagation rate in transverse and off-axis cracks.
With the aim of carrying out a comprehensive experimental investigation on the initiation and
propagation of matrix cracks under multiaxial loading conditions, still missing in literature, a
specific specimen configuration and testing procedure were developed as discussed in chapter
2 and reported in Ref. [16]. Thin-walled tubular specimens with the fibres aligned at 90° with
respect to the tube axis and subjected to combined tension/torsion loading were found to be the
best and most feasible way of obtaining a stress state characterised by the transverse and in-
plane shear stresses only (see figure 1). Tubes with lay-up [90U,n] (where the subscript U
means unidirectional, and n = 4,5) have been tested with different values of the biaxiality ratio
λ12 = ζ6/ζ2, revealing a strong detrimental effect of the shear stress on the transverse fatigue
strength [16, chapter 2].
Figure 1: Tube with 90° aligned fibres subjected to tension-torsion
As the [90U,n] tubes used in [16] and chapter 2 were made of unidirectional 90° layers,
initiation of the first macro (visible) crack immediately led to its unstable propagation in the
circumferential direction, preventing the analysis of the propagation phase. To overcome this
drawback two further lay-ups were proposed in chapter 2, using internal and internal/external
thin fabric plies in order to stabilise the propagation phase. [0F/90U,3/0F] tubes, where the
subscript F means fabric, were found to be the definitive specimen configuration. The
σ2
σ6
σ2
σ6
σ6
σ6
F
Mt

Chapter 3. Damage initiation and evolution in glass/epoxy
tubes subjected to combined tension-torsion fatigue loading
47
constraining effect provided by the 0° fabric layers prevented the unstable growth of the
nucleated cracks, allowing the analysis of the propagation phase. Another advantage is that the
damage nucleation in the 90° layers of the [0F/90U,3/0F] tubes is almost insensitive to the
surface finishing and surface defects, differently from [0F/90U,3] and [90U,n] specimens, where
surface defects could be preferential sites for the initiation of transverse cracks.
In this chapter the results of an extensive experimental investigation on [0F/90U,3/0F] tubes are
presented. The attention is focused on the influence of shear stress (λ12 ratio) and load ratio R
on the initiation and propagation of matrix cracks in the 90° layers of the tubes under
combined tension/torsion fatigue loadings, which produce the stress components ζ2 and ζ6 in
the transverse layers.
Another purpose of this experimental campaign is to understand the effect of multiaxiality,
and in particular the amount of shear stress, on the damage mechanisms at a microscopic scale.
Dedicated SEM investigations of the fracture surfaces were also carried out for this purpose.
Eventually, in Appendix 3.A results of quasi-static tests on [0F/90U,3/0F] tubes are presented.
3.2. Materials, geometry and test equipment
As in chapter 2, all the tubes tested in the present work were produced by mandrel wrapping
and cured in an autoclave with a one-hour cycle at 140°C and 6 bars. 1 meter long tubes (with
19 mm internal diameter) were produced. From them, 150 mm long specimens were cut, and a
calibrated length of 70 mm was finally obtained by wrapping glass/epoxy pre-preg tabs (figure
2). The tabs were cured at 80°C for 8 hours, obtaining an external diameter of the tabbed
portions of 24 mm (figure 2).
Figure 2: Final geometry of the tubular specimens (units in millimetres)
40 70 40
tab specimen
translucent rubber tube
LED lights
hollow steel cylinder
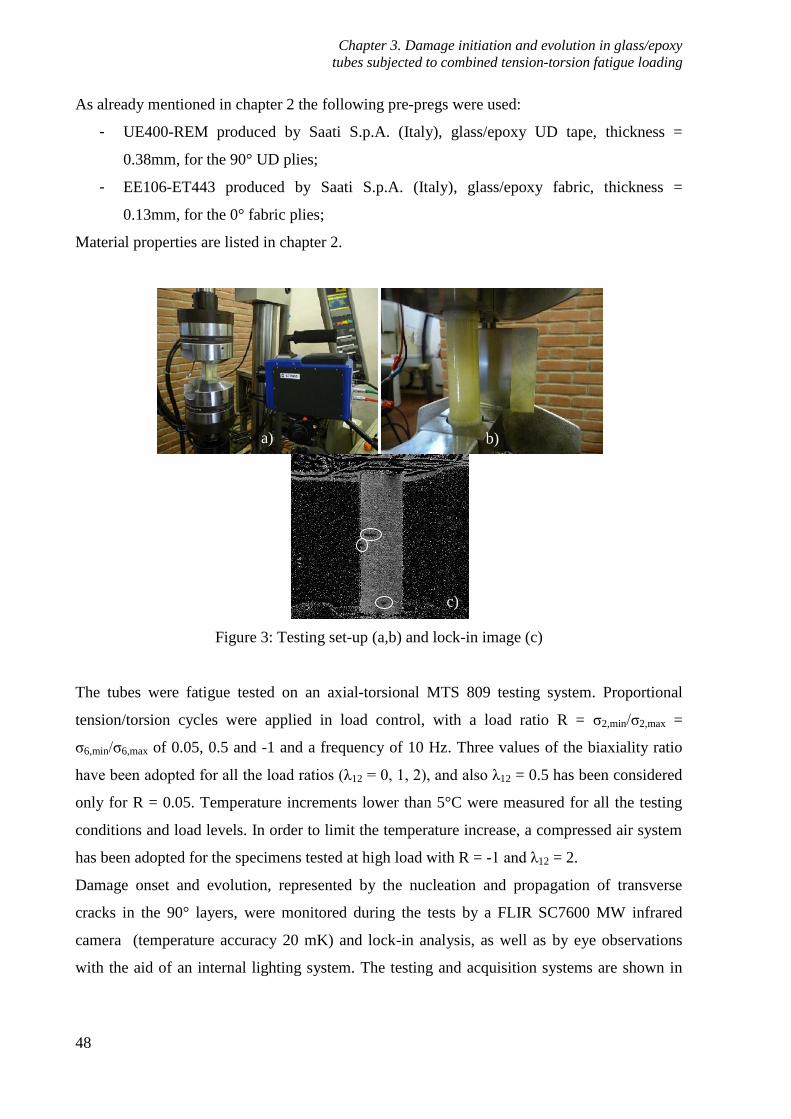
Chapter 3. Damage initiation and evolution in glass/epoxy
tubes subjected to combined tension-torsion fatigue loading
48
As already mentioned in chapter 2 the following pre-pregs were used:
- UE400-REM produced by Saati S.p.A. (Italy), glass/epoxy UD tape, thickness =
0.38mm, for the 90° UD plies;
- EE106-ET443 produced by Saati S.p.A. (Italy), glass/epoxy fabric, thickness =
0.13mm, for the 0° fabric plies;
Material properties are listed in chapter 2.
Figure 3: Testing set-up (a,b) and lock-in image (c)
The tubes were fatigue tested on an axial-torsional MTS 809 testing system. Proportional
tension/torsion cycles were applied in load control, with a load ratio R = ζ2,min/ζ2,max =
ζ6,min/ζ6,max of 0.05, 0.5 and -1 and a frequency of 10 Hz. Three values of the biaxiality ratio
have been adopted for all the load ratios (λ12 = 0, 1, 2), and also λ12 = 0.5 has been considered
only for R = 0.05. Temperature increments lower than 5°C were measured for all the testing
conditions and load levels. In order to limit the temperature increase, a compressed air system
has been adopted for the specimens tested at high load with R = -1 and λ12 = 2.
Damage onset and evolution, represented by the nucleation and propagation of transverse
cracks in the 90° layers, were monitored during the tests by a FLIR SC7600 MW infrared
camera (temperature accuracy 20 mK) and lock-in analysis, as well as by eye observations
with the aid of an internal lighting system. The testing and acquisition systems are shown in
c)
b) a)
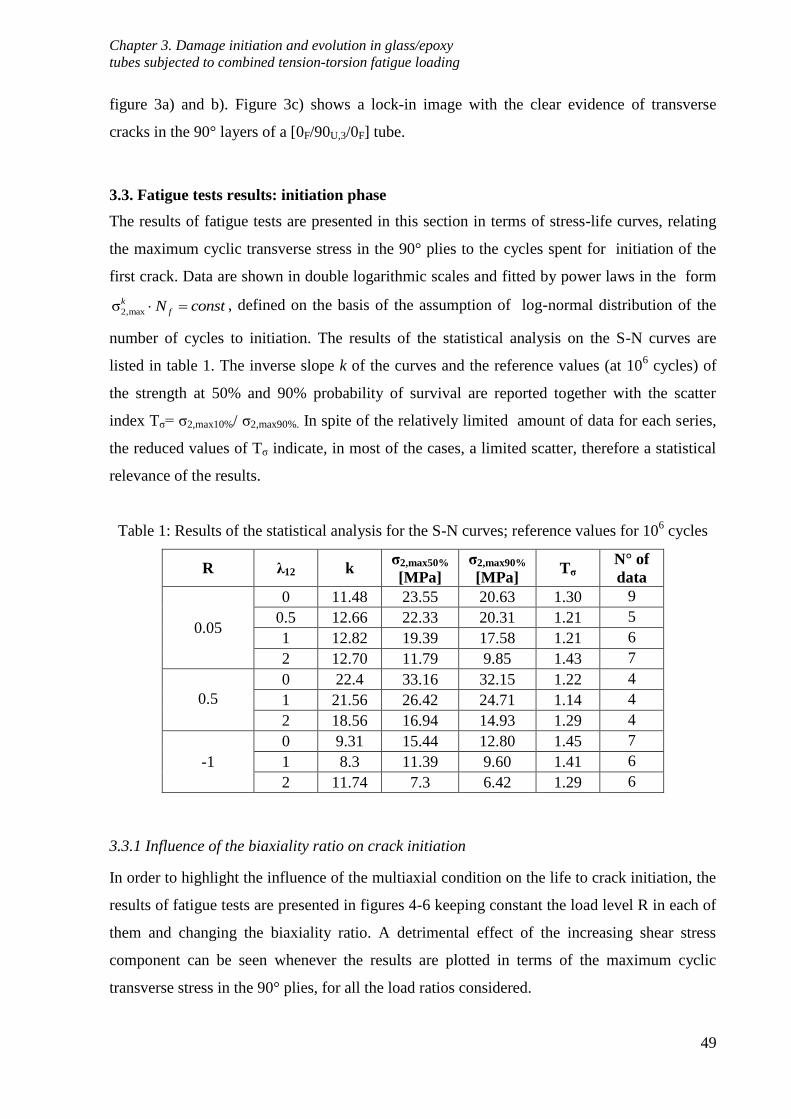
Chapter 3. Damage initiation and evolution in glass/epoxy
tubes subjected to combined tension-torsion fatigue loading
49
figure 3a) and b). Figure 3c) shows a lock-in image with the clear evidence of transverse
cracks in the 90° layers of a [0F/90U,3/0F] tube.
3.3. Fatigue tests results: initiation phase
The results of fatigue tests are presented in this section in terms of stress-life curves, relating
the maximum cyclic transverse stress in the 90° plies to the cycles spent for initiation of the
first crack. Data are shown in double logarithmic scales and fitted by power laws in the form
2,maxσk
fN const , defined on the basis of the assumption of log-normal distribution of the
number of cycles to initiation. The results of the statistical analysis on the S-N curves are
listed in table 1. The inverse slope k of the curves and the reference values (at 106 cycles) of
the strength at 50% and 90% probability of survival are reported together with the scatter
index Tζ= ζ2,max10%/ ζ2,max90%. In spite of the relatively limited amount of data for each series,
the reduced values of Tζ indicate, in most of the cases, a limited scatter, therefore a statistical
relevance of the results.
Table 1: Results of the statistical analysis for the S-N curves; reference values for 106 cycles
R λ12 k σ2,max50%
[MPa]
σ2,max90%
[MPa] Tσ
N° of
data
0.05
0 11.48 23.55 20.63 1.30 9
0.5 12.66 22.33 20.31 1.21 5
1 12.82 19.39 17.58 1.21 6
2 12.70 11.79 9.85 1.43 7
0.5
0 22.4 33.16 32.15 1.22 4
1 21.56 26.42 24.71 1.14 4
2 18.56 16.94 14.93 1.29 4
-1
0 9.31 15.44 12.80 1.45 7
1 8.3 11.39 9.60 1.41 6
2 11.74 7.3 6.42 1.29 6
3.3.1 Influence of the biaxiality ratio on crack initiation
In order to highlight the influence of the multiaxial condition on the life to crack initiation, the
results of fatigue tests are presented in figures 4-6 keeping constant the load level R in each of
them and changing the biaxiality ratio. A detrimental effect of the increasing shear stress
component can be seen whenever the results are plotted in terms of the maximum cyclic
transverse stress in the 90° plies, for all the load ratios considered.
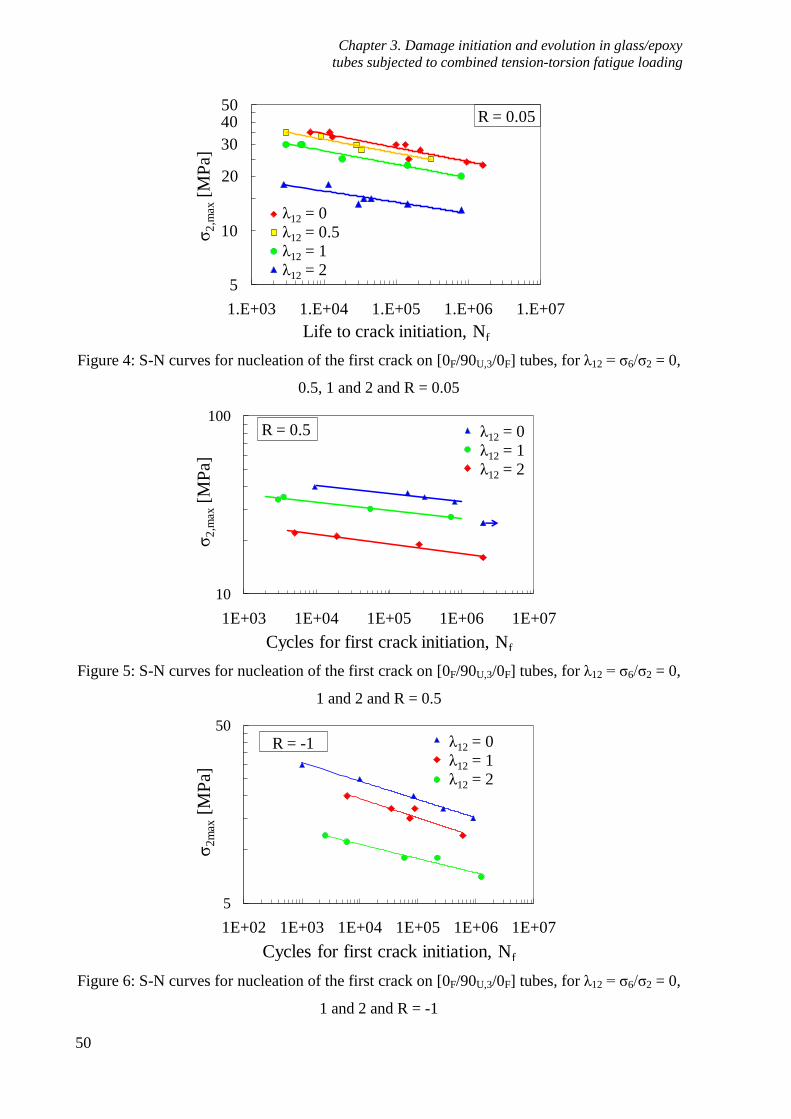
Chapter 3. Damage initiation and evolution in glass/epoxy
tubes subjected to combined tension-torsion fatigue loading
50
Figure 4: S-N curves for nucleation of the first crack on [0F/90U,3/0F] tubes, for λ12 = ζ6/ζ2 = 0,
0.5, 1 and 2 and R = 0.05
Figure 5: S-N curves for nucleation of the first crack on [0F/90U,3/0F] tubes, for λ12 = ζ6/ζ2 = 0,
1 and 2 and R = 0.5
Figure 6: S-N curves for nucleation of the first crack on [0F/90U,3/0F] tubes, for λ12 = ζ6/ζ2 = 0,
1 and 2 and R = -1
5
50
1.E+03 1.E+04 1.E+05 1.E+06 1.E+07
ζ2
,max
[MP
a]
Life to crack initiation, Nf
l12 = 0
l 12 = 0.5
l12 = 1
l12 = 2
λ12 = 0
λ12 = 0.5
λ12 = 1
λ12 = 2
R = 0.05
10
20
30
40
10
100
1E+03 1E+04 1E+05 1E+06 1E+07
ζ2
,max
[MP
a]
Cycles for first crack initiation, Nf
Serie4
Serie1
Serie2
R = 0.5 λ12 = 0
λ12 = 1
λ12 = 2
5
50
1E+02 1E+03 1E+04 1E+05 1E+06 1E+07
ζ2m
ax[M
Pa]
Cycles for first crack initiation, Nf
Serie4
Serie1
Serie2
R = -1 λ12 = 0
λ12 = 1
λ12 = 2

Chapter 3. Damage initiation and evolution in glass/epoxy
tubes subjected to combined tension-torsion fatigue loading
51
To highlight a possible influence of the 0° fabric layers on the life to crack initiation, a
comparison between [90U,4] and [0F/90U,3/0F] tubes is shown in Figure 7, for the same λ12
values.
Figure 7: Comparison between S-N curves for [0F/90U,3/0F] and [90U,4] tubes, for λ12 = ζ6/ζ2 =
0, 1 and 2 and R = 0.05
It is worth noting that the curves for the UD tubes slightly underestimate the fatigue resistance
of the 90° layers in the [0F/90U,3/0F] specimens. This can be due to the absence of surface
defects in the [0F/90U,3/0F] tubes as well as to the constraining effect of the stiffer fabric layers,
increasing the in-situ strength of the 90° plies. The last phenomenon is more or less
pronounced depending both on the thickness of the 90° plies and the stiffness of the
constraining fabric layers. It is, in fact, proven that the static strength of transverse plies in
multidirectional laminates is higher than that of the single UD lamina, and it increases when
the ply thickness is decreased or the stiffness of the surrounding layers is increased [36, 37].
The transverse static strength has also been proved to change whether the 90° layer is internal
or external in a cross-ply lay-up [38]. In Ref. [12] it is also shown that the cycles spent for the
initiation of cracks in the 90° plies of cross-ply laminates increase as the transverse ply
thickness decreases. In this case however, the S-N curves for the two specimen configurations
appear to be simply shifted by a limited amount, but the influence of the shear stress is
comparable in the two cases.
3.3.2 Influence of the load ratio
The influence of the load ratio on the life to crack initiation is highlighted in figures 8-10 for
each of the biaxiality ratios.
5
50
1.E+02 1.E+03 1.E+04 1.E+05 1.E+06 1.E+07
ζ2
,max
[MP
a]
Life to crack initiation, Nf
l12 = 0 l12 = 1 l12 = 2l12 = 0 l12 = 1 l12 = 2
: [0F/90U,3/0F] tubes
lines: [90U,4] tubes
λ12 = 0 λ12 = 2λ12 = 110
20
3040

Chapter 3. Damage initiation and evolution in glass/epoxy
tubes subjected to combined tension-torsion fatigue loading
52
Figure 8: S-N curves for nucleation of the first crack on [0F/90U,3/0F] tubes, for R = 0.5, 0.05
and -1 and λ12 = 0
Figure 9: S-N curves for nucleation of the first crack on [0F/90U,3/0F] tubes, for R = 0.5, 0.05
and -1 and λ12 = 1
Figure 10: S-N curves for nucleation of the first crack on [0F/90U,3/0F] tubes, for R = 0.5, 0.05
and -1 and λ12 = 2
1
10
100
1.0E+02 1.0E+03 1.0E+04 1.0E+05 1.0E+06 1.0E+07
ζ2
,max
[MP
a]
Life to first crack initiation, Nf
R = 0.5R = 0.05R = -1
λ12 = 0
1
10
100
1.0E+02 1.0E+03 1.0E+04 1.0E+05 1.0E+06 1.0E+07
ζ2,m
ax[M
Pa]
Life to first crack initiation, Nf
R = 0.5R = 0.05R = -1
λ12 = 1
1
10
100
1.0E+02 1.0E+03 1.0E+04 1.0E+05 1.0E+06 1.0E+07
ζ2,m
ax[M
Pa]
Life to first crack initiation, Nf
R = 0.5R = 0.05R = -1
λ12 = 2
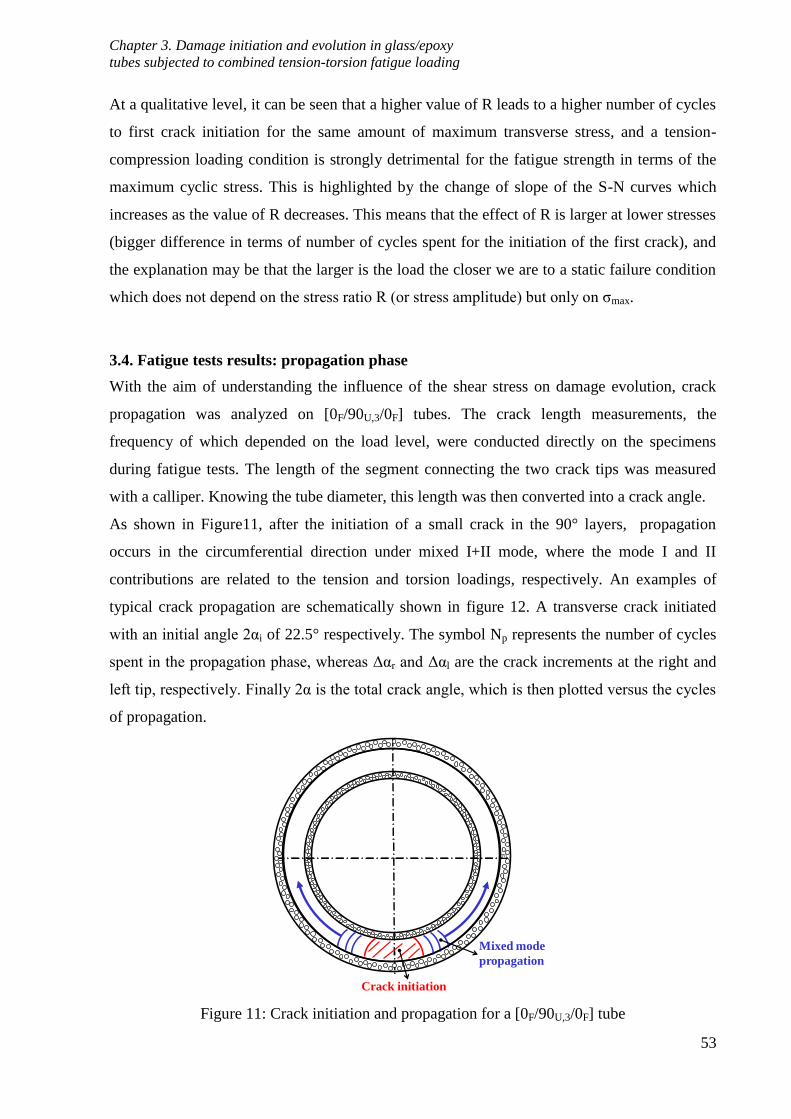
Chapter 3. Damage initiation and evolution in glass/epoxy
tubes subjected to combined tension-torsion fatigue loading
53
At a qualitative level, it can be seen that a higher value of R leads to a higher number of cycles
to first crack initiation for the same amount of maximum transverse stress, and a tension-
compression loading condition is strongly detrimental for the fatigue strength in terms of the
maximum cyclic stress. This is highlighted by the change of slope of the S-N curves which
increases as the value of R decreases. This means that the effect of R is larger at lower stresses
(bigger difference in terms of number of cycles spent for the initiation of the first crack), and
the explanation may be that the larger is the load the closer we are to a static failure condition
which does not depend on the stress ratio R (or stress amplitude) but only on ζmax.
3.4. Fatigue tests results: propagation phase
With the aim of understanding the influence of the shear stress on damage evolution, crack
propagation was analyzed on [0F/90U,3/0F] tubes. The crack length measurements, the
frequency of which depended on the load level, were conducted directly on the specimens
during fatigue tests. The length of the segment connecting the two crack tips was measured
with a calliper. Knowing the tube diameter, this length was then converted into a crack angle.
As shown in Figure11, after the initiation of a small crack in the 90° layers, propagation
occurs in the circumferential direction under mixed I+II mode, where the mode I and II
contributions are related to the tension and torsion loadings, respectively. An examples of
typical crack propagation are schematically shown in figure 12. A transverse crack initiated
with an initial angle 2αi of 22.5° respectively. The symbol Np represents the number of cycles
spent in the propagation phase, whereas Δαr and Δαl are the crack increments at the right and
left tip, respectively. Finally 2α is the total crack angle, which is then plotted versus the cycles
of propagation.
Figure 11: Crack initiation and propagation for a [0F/90U,3/0F] tube
Crack initiation
Mixed mode
propagation
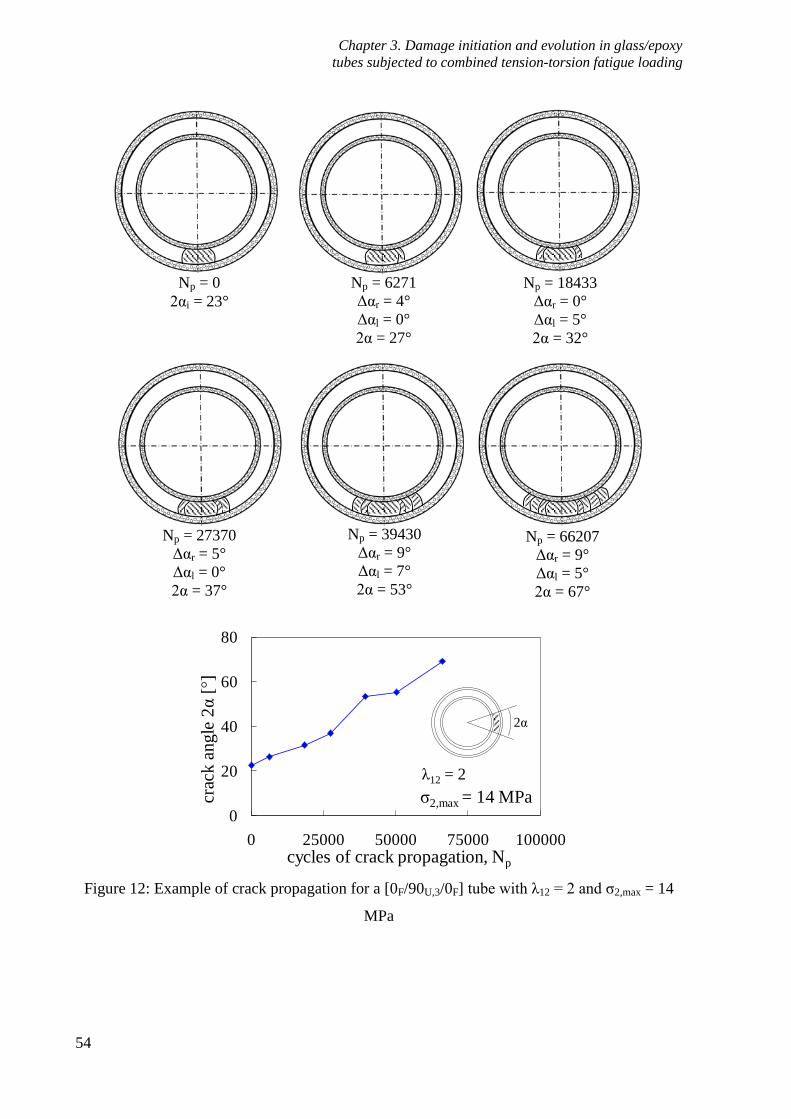
Chapter 3. Damage initiation and evolution in glass/epoxy
tubes subjected to combined tension-torsion fatigue loading
54
Figure 12: Example of crack propagation for a [0F/90U,3/0F] tube with λ12 = 2 and ζ2,max = 14
MPa
0
20
40
60
80
0 25000 50000 75000 100000cycles of crack propagation, Np
crac
k a
ngle
2α
[°]
2α
λ12 = 2
ζ2,max = 14 MPa
Np = 0
2αi = 23°
Np = 6271
Δαr = 4°
Δαl = 0°
2α = 27°
Np = 18433
Δαr = 0°
Δαl = 5°
2α = 32°
Np = 27370
Δαr = 5°
Δαl = 0°
2α = 37°
Np = 39430
Δαr = 9°
Δαl = 7°
2α = 53°
Np = 66207
Δαr = 9°
Δαl = 5°
2α = 67°

Chapter 3. Damage initiation and evolution in glass/epoxy
tubes subjected to combined tension-torsion fatigue loading
55
The crack propagation curves for some of the conditions investigated are compared in figure
13 for [0F/90U,3/0F] tubes subjected to a maximum cyclic transverse stress equal to 30 MPa and
with biaxiality ratios ranging from 0 to 1.5.
Figure 13: Crack propagation curves for [0F/90U,3/0F] tubes
The Crack Growth Rate (CGR) for each crack and λ12 value can be calculated as the slope of
the straight line fitting each propagation curve. Higher shear stress components, i.e. λ12, result
in higher CGR. The propagation curves can be reasonably described by a linear relationship
because, as it will be better explained later, the crack tips are subjected to a loading condition
which does not vary with the crack length, when expressed in terms of the Strain Energy
Release Rate. In fact, when a cracked ply is constrained between other layers in a flat coupon
under mode I, the crack growth process was shown to occur in steady state conditions for
sufficiently high values of the crack length (about twice the ply thickness) [39]. Later in the
chapter, something very similar is shown to occur in tubular specimens under mixed I+II mode
loading. Accordingly, a possible increase or decrease of the propagation rate has to be
attributed only to variations of the local toughness along the crack path. This remains valid as
long as the crack density is low enough to ensure that all the cracks in the same specimen
propagate in a non-interactive regime. Conversely, as the crack density increases, crack
interaction gives rise to a shielding effect, resulting in a lower SERR and, in turn, a lower
CGR [39]. Accordingly, the propagation data were fitted with a straight line only until the
crack density remained low enough to ensure a non-interactive regime between transverse
cracks and, therefore, a steady state propagation.
0
20
40
60
80
100
0 50000 100000 150000cycles of crack propagation, Np
crack 1crack 1crack 2crack 1
crac
k a
ngle
2α
-2
αi[
°]
2α
λ12 = 0
λ12 = 0.5
λ12 = 1
λ12 = 1.5
λ12
ζ2,max = 30 MPa
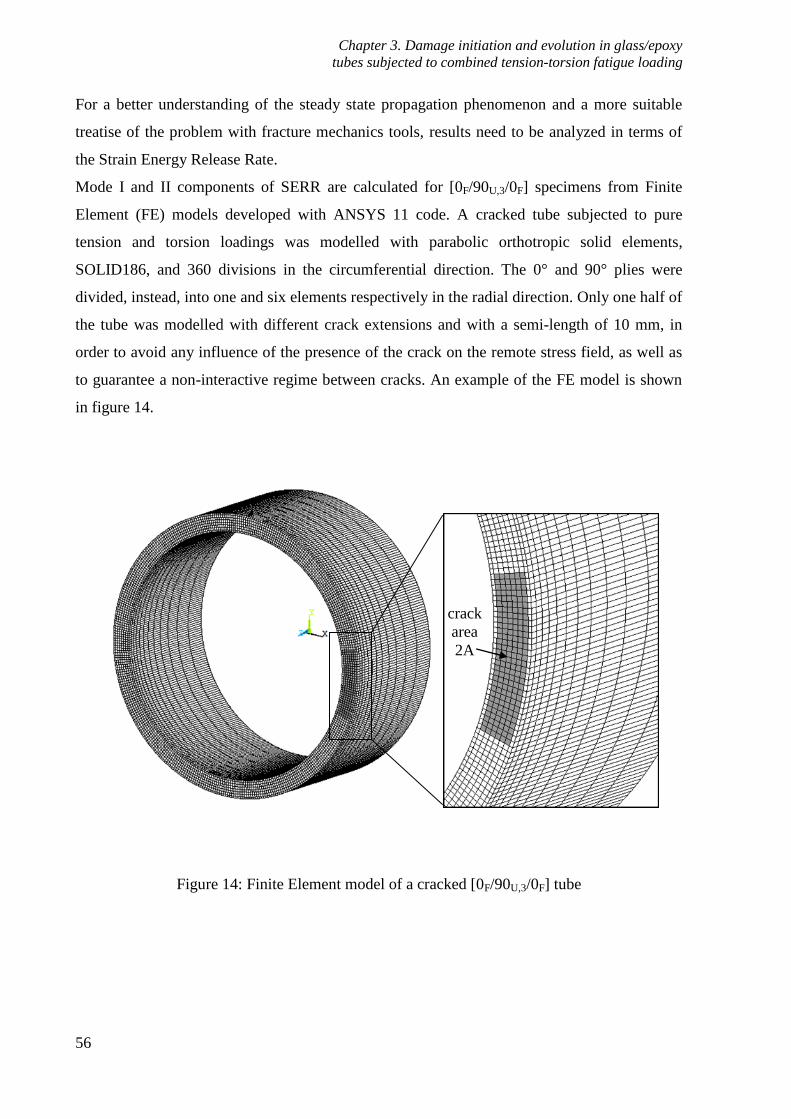
Chapter 3. Damage initiation and evolution in glass/epoxy
tubes subjected to combined tension-torsion fatigue loading
56
For a better understanding of the steady state propagation phenomenon and a more suitable
treatise of the problem with fracture mechanics tools, results need to be analyzed in terms of
the Strain Energy Release Rate.
Mode I and II components of SERR are calculated for [0F/90U,3/0F] specimens from Finite
Element (FE) models developed with ANSYS 11 code. A cracked tube subjected to pure
tension and torsion loadings was modelled with parabolic orthotropic solid elements,
SOLID186, and 360 divisions in the circumferential direction. The 0° and 90° plies were
divided, instead, into one and six elements respectively in the radial direction. Only one half of
the tube was modelled with different crack extensions and with a semi-length of 10 mm, in
order to avoid any influence of the presence of the crack on the remote stress field, as well as
to guarantee a non-interactive regime between cracks. An example of the FE model is shown
in figure 14.
Figure 14: Finite Element model of a cracked [0F/90U,3/0F] tube
crack
area
2A

Chapter 3. Damage initiation and evolution in glass/epoxy
tubes subjected to combined tension-torsion fatigue loading
57
Figure 15: Boundary conditions for the FE model of a cracked tube
A schematic of the boundary conditions is shown in figure 15. Axial and tangential
displacements (u and v, respectively) are constrained on the non-cracked portion of the front
surface, so that the crack is simulated as a non constrained area on 90° oriented plies only.
Tension and torsion loading conditions are imposed by applying uniform axial forces Fz and
uniform tangential forces Fθ respectively on the nodes of the external circumference of the
back surface. Local effects due to the applications of nodal forces vanish after one element
division from the loaded surface. Mode I and II SERRs are calculated by means of the
procedure described hereafter.
According to the definition of the SERR:
σ
τ
2
2
I
II
dUG
d A
dUG
d A
(1)
where the subscripts ζ and η refer to the tension and torsion loading conditions respectively,
and 2A is the total area of the crack of angle 2α. U is, instead, the energy released during crack
propagation:
x
y
z
r
θ
u = v = 0
unconstrained crack area
Fz
Fθ

Chapter 3. Damage initiation and evolution in glass/epoxy
tubes subjected to combined tension-torsion fatigue loading
58
σ 22
τ 62
1σ Δ 2
2
1σ Δ 2
2
A
A
U u d A
U v d A
(2)
In equation (2), ζ2 and ζ6 are the transverse and the in-plane shear stresses acting on the 90°
plies in the uncracked condition. Δu and Δv are the relative displacements between the two
faces of the crack in the transverse and tangential directions respectively. Since stresses before
crack nucleation vary only slightly through the thickness of the 90° plies, they can be
considered, within reason, constant and equal to their average value, so they can be taken out
from the integrals of equation (2). Therefore, the integrals of the relative displacements over
the crack area can be written as the product between their average value and the crack area
itself. Equation (2) can therefore be rewritten as
σ 2, 2,2
τ 6, 2,2
1σ Δ 2 σ Δ
2
1σ Δ 2 σ Δ
2
av av avA
av av avA
U u d A u A
U v d A v A
(3)
Once average stresses are determined from FE models of an uncracked tube, only the average
values of the relative displacements, Δuav and Δvav, have to be calculated by changing the
crack extension. Cracked tubes with a crack extension 2α ranging from 2 to 160 degrees were
analysed, and the corresponding released energies were calculated according to equation (3).
The derivatives in equation (1) are eventually evaluated with a numerical approach, allowing
the mode I and II SERR components to be calculated. Figures 16 and 17 show the computed
values for GI and GII, with maximum applied tension and shear stresses equal to 1 MPa. As
the system is supposed to behave in a linear elastic manner, the results in figures 16 and 17 can
be easily used for the SERR calculation for every value of the nominal transverse and shear
stresses, by simply multiplying the results by the square of the applied stresses.
In both cases the SERR reaches a maximum value, followed by a plateau, at about 2α = 50 -
60°. Accordingly, a Steady State (SS) condition can be assumed for 2α > 30° . The initial
crack angle 2αi, measured at the initiation, was usually between 20° and 30°, or even higher.
Accordingly, the larger part of the propagation phase is spent in the SS condition, and a single
value of the mode I and II SERRs (calculated as an average value for 2α > 30°) can be
attributed to each loading condition. As a consequence, a constant value of the CGR can be

Chapter 3. Damage initiation and evolution in glass/epoxy
tubes subjected to combined tension-torsion fatigue loading
59
assumed for each propagating crack, for 2α ≥ 30°, when the crack density is low enough. The
crack angle against cycles curves can therefore be fitted with straight lines, the slopes of which
represent the CGR.
Figure 16: Mode I SERR as a function of the crack angle for [0F/90U,3/0F] tubes
Figure 17: Mode II SERR as a function of the crack angle for [0F/90U,3/0F] tubes
As the analysis of crack propagation will be presented from now on in terms of the SERR, a
better parameter for quantifying the multiaxial condition is the Mode Mixity, MM = GII/Gtot,
where Gtot = GI + GII.
The cracks initiated in all the tested specimens have been measured against the number of
cycles, the CGR has been calculated for each of them fitting the propagation curve by means
of a straight line and its value has been associated to the SERR as explained above. By doing
0.00
0.02
0.04
0.06
0.08
0.10
0.12
0.14
0.16
0 20 40 60 80 100 120 140 160
GI[J
/m2]
crack angle, 2α [degrees]
ζ2 on 90° plies = 1 MPa
GI,ssSteady State
0.00
0.04
0.08
0.12
0.16
0.20
0 20 40 60 80 100 120 140 160
GII
[J/m
2]
crack angle, 2α [degrees]
ζ6 on 90° plies = 1 MPa
GII,ssSteady State

Chapter 3. Damage initiation and evolution in glass/epoxy
tubes subjected to combined tension-torsion fatigue loading
60
so the crack propagation data could be presented in a Paris-like chart relating the CGR to the
mode I SERR and MM. All the results are shown in the following sub-sections.
3.4.1 Influence of the Mode Mixity on crack propagation
To highlight the influence of the MM on the CGR, Paris-like curves are presented in terms of
the maximum cyclic value of GI, GI,max, for each value of the load ratio R in figures 18-20. It
should be mentioned that as R is the ratio between the minimum and the maximum cyclic
stresses, the ratio between GI,min and GI,max is the square of R.
It is important to note that the steady state condition implies that only one value of GI (and
CGR) can be associated with each propagation curve (for 2α ≥ 30°). Accordingly, each point
in figures 18-20 corresponds to the complete propagation of one single crack with a constant
propagation rate. In principle therefore, crack propagation data cannot be fitted by a Paris-like
curve. However, for design purposes, they can be used to draw a Paris-like diagram to
correlate the maximum cyclic value of GI to the CGR. The typical equation in the CGR =
C·(GI,max)d form is used and the coefficients C and d are reported in table 2 for all the loading
conditions.
Table 2: Coefficients of the Paris-like curves (GI in J/m2 and CGR in °/cycle)
R λ12 (MM) C d
0.05
0 (0) 3.78·10-14
5.08
0.5 (0.24) 2.07·10-10
3.32
1 (0.56) 1.27·10-15
6.29
2 (0.84) 3.05·10-12
5.77
0.5
0 (0) 2.64·10-26
9.95
1 (0.56) 5.19·10-25
10.00
2 (0.84) 1.44·10-17
7.95
-1
0 (0) 2.18·10-11
4.04
1 (0.56) 3.02·10-08
3.07
2 (0.84) 7.92·10-08
4.09
It is worth mentioning again that most specimens underwent multiple cracking, so that more
than one data point could be obtained from one single specimen, as long as the cracks analysed
were non-interacting. In spite of the scatter of data, figures 18-20 makes it evident that the
higher the mode II contribution (higher λ12 or MM value), the lower the value of GI necessary
to reach a certain CGR. This proves the detrimental effect of shear stress on the mixed mode
propagation rate, which is particularly evident for λ12 ≥ 1. Instead, data points for λ12 = 0 and

Chapter 3. Damage initiation and evolution in glass/epoxy
tubes subjected to combined tension-torsion fatigue loading
61
0.5 (MM = 0 and 0.24) and R = 0.05 seem to be reasonably described by the same scatter
band. This allows us to state that with low mode mixity values, propagation is essentially
controlled by the mode I component only. On the other hand, it is also clear that with higher
biaxiality ratio values, the mode I SERR does not represent the driving force for crack
propagation, since the CGR depends also on the mode mixity. This suggests that a change in
the propagation mechanism may occur in the presence of a high enough mode II contribution.
Figure 18: Paris-like curves for [0F/90U,3/0F] tubes in terms of the mode I SERR for R = 0.05
Figure 19: Paris-like curves for [0F/90U,3/0F] tubes in terms of the mode I SERR for R = 0.5
1.E-4
1.E-3
1.E-2
1.E-1
20
CG
R [
°/cyc
le]
GI,max [J/m2]
L0
L05
L1
L2
λ12 = 0, MM = 0
λ12 = 0.5, MM = 0.24
λ12 = 1, MM = 0.56
λ12 = 2, MM = 0.84
200
R = 0.05
1.E-5
1.E-4
1.E-3
1.E-2
1.E-1
30
CG
R [
°/cyc
le]
GI,max [J/m2]
L0
L1
L2
R = 0.5λ12 = 0, MM=0
λ12 = 1, MM=0.56
λ12 = 2, MM=0.84
300

Chapter 3. Damage initiation and evolution in glass/epoxy
tubes subjected to combined tension-torsion fatigue loading
62
Figure 20: Paris-like curves for [0F/90U,3/0F] tubes in terms of the mode I SERR for R = -1
3.4.2 Influence of the load ratio on crack propagation
To highlight the influence of the load ratio the crack growth data in the form of Paris-like
charts are plotted in figures 21-23 for the same value of Mode Mixity and all the considered
values of R.
For all the values of the biaxiality ratio λ12 a larger value of R brings to lower crack growth
rate for the same values of GI,max, whereas the presence of compressive loading leads to higher
CGR. Also the slope of the curves is influenced by the stress ratio, as it is lower for R = -1 and
higher for R = 0.5, indicating that the effect of R is more pronounced at lower SERR levels.
This is consistent with the larger influence of R shown at lower stress levels for the initiation
of the first crack in the 90° layers.
Figure 21: Paris-like curves for [0F/90U,3/0F] tubes in terms of the mode I SERR for MM = 0
1.E-5
1.E-4
1.E-3
1.E-2
1.E-1
1.E+0
9 90
CG
R [
°/cyc
le]
GI,max [J/m2]
L0
L1
L2
R = -1λ12 = 0, MM=0
λ12 = 1, MM=0.56
λ12 = 2, MM=0.84
1.E-5
1.E-4
1.E-3
1.E-2
1.E-1
10 100 1000
CG
R [
°/cyc
le]
GI,max [J/m2]
R = 0.5
R = 0.05
R = -1
λ12 = 0, MM=0
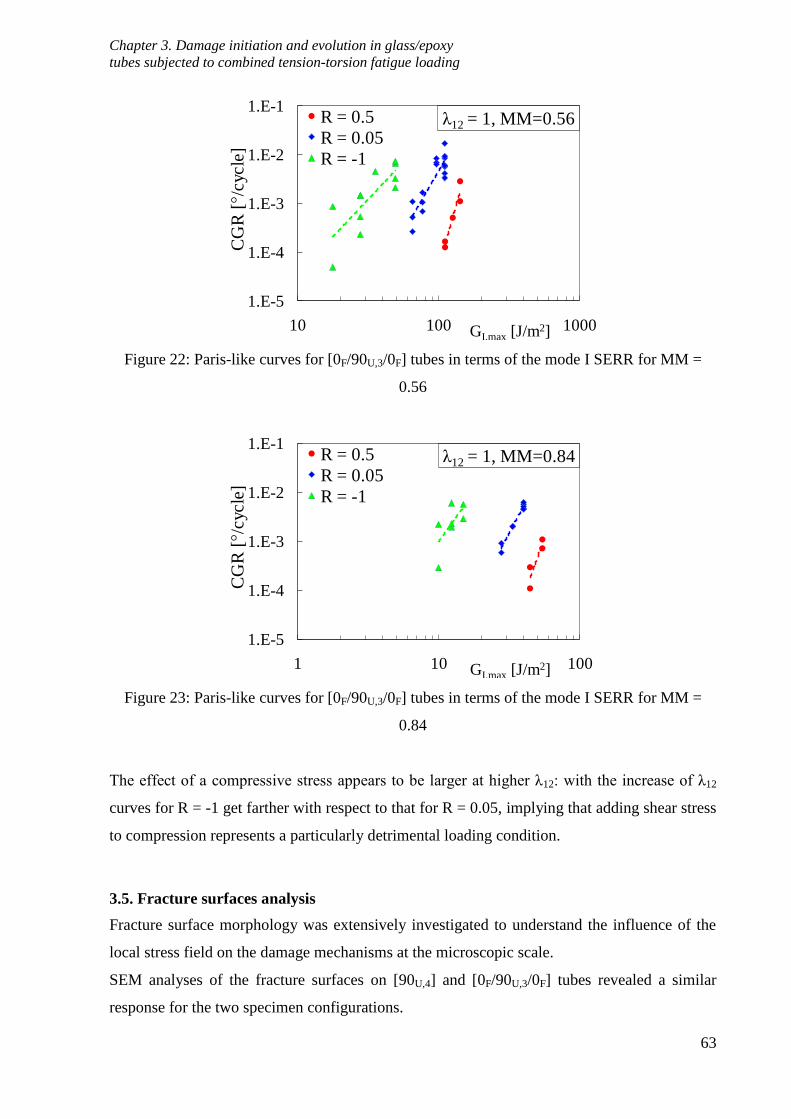
Chapter 3. Damage initiation and evolution in glass/epoxy
tubes subjected to combined tension-torsion fatigue loading
63
Figure 22: Paris-like curves for [0F/90U,3/0F] tubes in terms of the mode I SERR for MM =
0.56
Figure 23: Paris-like curves for [0F/90U,3/0F] tubes in terms of the mode I SERR for MM =
0.84
The effect of a compressive stress appears to be larger at higher λ12: with the increase of λ12
curves for R = -1 get farther with respect to that for R = 0.05, implying that adding shear stress
to compression represents a particularly detrimental loading condition.
3.5. Fracture surfaces analysis
Fracture surface morphology was extensively investigated to understand the influence of the
local stress field on the damage mechanisms at the microscopic scale.
SEM analyses of the fracture surfaces on [90U,4] and [0F/90U,3/0F] tubes revealed a similar
response for the two specimen configurations.
1.E-5
1.E-4
1.E-3
1.E-2
1.E-1
10 100 1000
CG
R [
°/cyc
le]
GI,max [J/m2]
R = 0.5
R = 0.05
R = -1
λ12 = 1, MM=0.56
1.E-5
1.E-4
1.E-3
1.E-2
1.E-1
1 10 100
CG
R [
°/cyc
le]
GI,max [J/m2]
R = 0.5
R = 0.05
R = -1
λ12 = 1, MM=0.84

Chapter 3. Damage initiation and evolution in glass/epoxy
tubes subjected to combined tension-torsion fatigue loading
64
Figure 24 shows details of the fracture surfaces of [0F/90U,3/0F] tubes for different biaxiality
ratios and R = 0.05. The analysis is focused on the 90° plies.
For low λ12 values (0 and 0.5) the fracture surfaces were rather smooth and typical of a pure
tensile failure (figure 24 a and b). For λ12 = 1, instead, shear cusps, typical of shear failure,
start to appear (figure 24c); this feature is particularly evident for λ12 = 2 (figure 24d). These
findings are in agreement with the observations discussed in [33] and with the experimental
evidence reported in [40], where a progressive fatigue damage evolution, by means of inclined
micro-cracks, was documented in UD laminae in the presence of a high shear stress
contribution. The presence of some clean fibre surfaces is also evident in the samples shown in
figure 24. This indicates that fibre-matrix debonding might play a non-negligible role in the
fracture process. Finally, some broken fibres can be observed in the 90° plies, but the fibre
failure is thought to occur mainly in correspondence with the final separation of the specimens
and not to be part of the progressive damage evolution during fatigue life, since the crack
propagation paths are always parallel to the fibres.
In conclusion, on a microscopic scale the damage mechanisms are found to depend on the
local multiaxial stress condition, and a clear change in the damage mechanisms can be
observed when the shear stress is high enough (λ12 values greater than 0.5), for R = 0.05.
a) b)
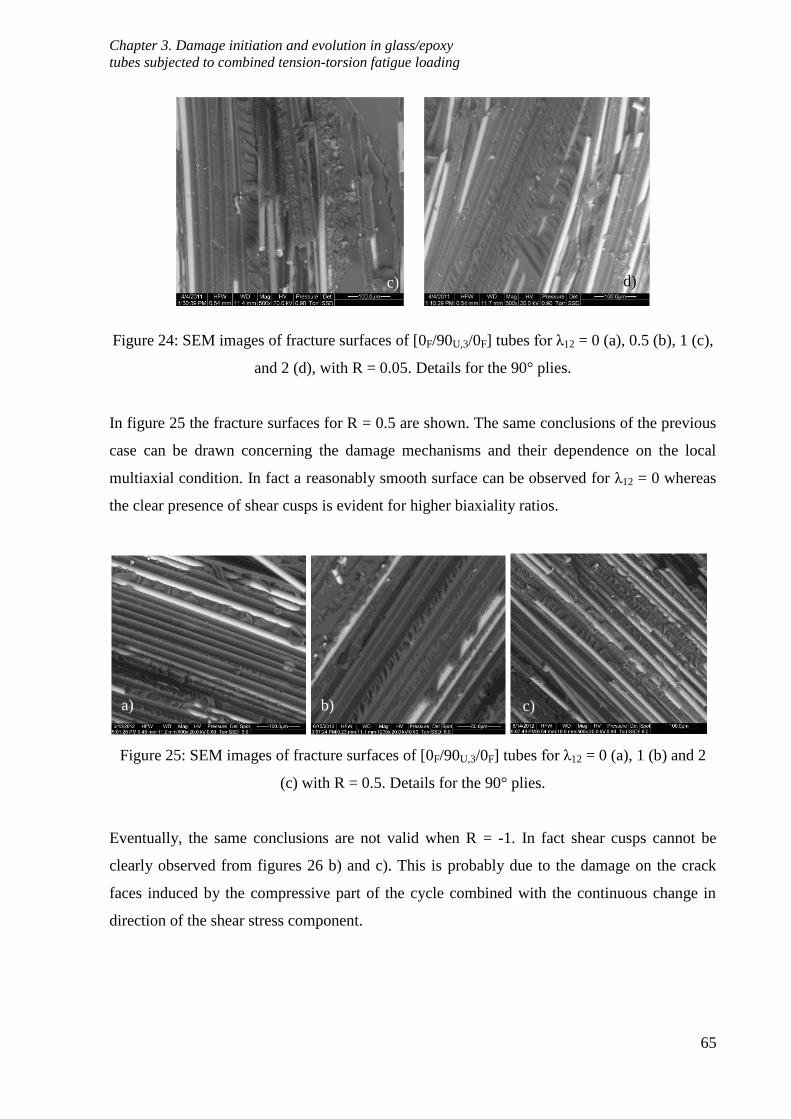
Chapter 3. Damage initiation and evolution in glass/epoxy
tubes subjected to combined tension-torsion fatigue loading
65
Figure 24: SEM images of fracture surfaces of [0F/90U,3/0F] tubes for λ12 = 0 (a), 0.5 (b), 1 (c),
and 2 (d), with R = 0.05. Details for the 90° plies.
In figure 25 the fracture surfaces for R = 0.5 are shown. The same conclusions of the previous
case can be drawn concerning the damage mechanisms and their dependence on the local
multiaxial condition. In fact a reasonably smooth surface can be observed for λ12 = 0 whereas
the clear presence of shear cusps is evident for higher biaxiality ratios.
Figure 25: SEM images of fracture surfaces of [0F/90U,3/0F] tubes for λ12 = 0 (a), 1 (b) and 2
(c) with R = 0.5. Details for the 90° plies.
Eventually, the same conclusions are not valid when R = -1. In fact shear cusps cannot be
clearly observed from figures 26 b) and c). This is probably due to the damage on the crack
faces induced by the compressive part of the cycle combined with the continuous change in
direction of the shear stress component.
c) d)
a) c) b)

Chapter 3. Damage initiation and evolution in glass/epoxy
tubes subjected to combined tension-torsion fatigue loading
66
Figure 26: SEM images of fracture surfaces of [0F/90U,3/0F] tubes for λ12 = 0 (a), 1 (b) and 2
(c) with R = -1. Details for the 90° plies.
3.6. Conclusions
Biaxial fatigue tests were conducted on Glass/Epoxy tubes with lay-up [0F/90U,3/0F]. Attention
was focused on the initiation and propagation of cracks in the 90° unidirectional plies
subjected to transverse and in-plane shear stresses, combined according to different values of
the ratio λ12 = ζ6/ζ2. The aim of the experimental campaign was to investigate the influence of
in-plane shear stress on the initiation, propagation of transverse cracks and on the damage
modes on a microscopic scale, as well as the effect of the load ratio R on these phenomena.
The main conclusions can be summarised in the following points.
i) The presence of shear stress significantly reduces the life spent for initiation of the first
transverse crack, for a given value of the transverse stress. Different S-N curves, in terms of
the transverse stress, were found to be associated to different values of the biaxiality ratio,
highlighting the need for a proper multiaxial criterion for crack initiation.
ii) The crack nucleation resistance of the [0F/90U,3/0F] tubes is slightly higher than that of the
[90U,4] ones, due to the constraining effect of the internal and external fabric layers.
iii) Different Paris-like curves, in terms of the mode I SERR, were found for different
biaxiality ratio values. In particular, for a given value of the mode I SERR, the Crack Growth
Rate was found to increase significantly with the biaxiality ratio, mainly when λ12 ≥ 1.
iv) A strong influence of the load ratio R has been found on the S-N curves for crack initiation
and on the Paris-like curves. In particular the slope of the curves depends on R and its
influence is more pronounced at lower load levels. A particularly detrimental condition is
represented by the addition of shear stress to tension/compression fatigue cycles.
v) SEM images of the fracture surfaces for different biaxiality ratios showed different damage
modes occurring at the microscopic scale and leading to the nucleation and propagation of
a) c) b)

Chapter 3. Damage initiation and evolution in glass/epoxy
tubes subjected to combined tension-torsion fatigue loading
67
cracks. A wide presence of matrix shear cusps was observed for biaxiality ratios higher than or
equal to unity for positive load ratios. This experimental evidence will be used later in the
thesis as a basis for formulating a multiaxial criterion for the matrix-dominated fatigue
behaviour of unidirectional laminae.
Acknowledgements
The writer would like to thank Dr. Marco Piovesan and Dr. Nicola De Rossi (DTG-University
of Padova) for their contribution during the experimental activity. The writer also
acknowledge the helpful discussions with the other members of the Multiaxial Fatigue Club:
Prof. Ramesh Talreja (TAMU-USA), Bent Sørensen and Povl Brønsted (DTU-DK) and Janis
Varna (LTU-SE).
Appendix 3.A
Quasi-static tests were also conducted and the results in terms of strength are reported in figure
A1 on the ζ2- ζ6 plane. The values of stresses reported are those calculated on the 90° plies at
the moment of failure.
Figure A1: Quasi-static tests results on the ζ2-ζ6 plane.
In the presence of tensile load the damage initiation was proven to occur in the 90° plies, since
a transverse crack onset was clearly detectable before the final failure by means of the infrared
0
20
40
60
80
100
-150 -100 -50 0 50 100
ζ6 (MPa)
ζ2 (MPa)
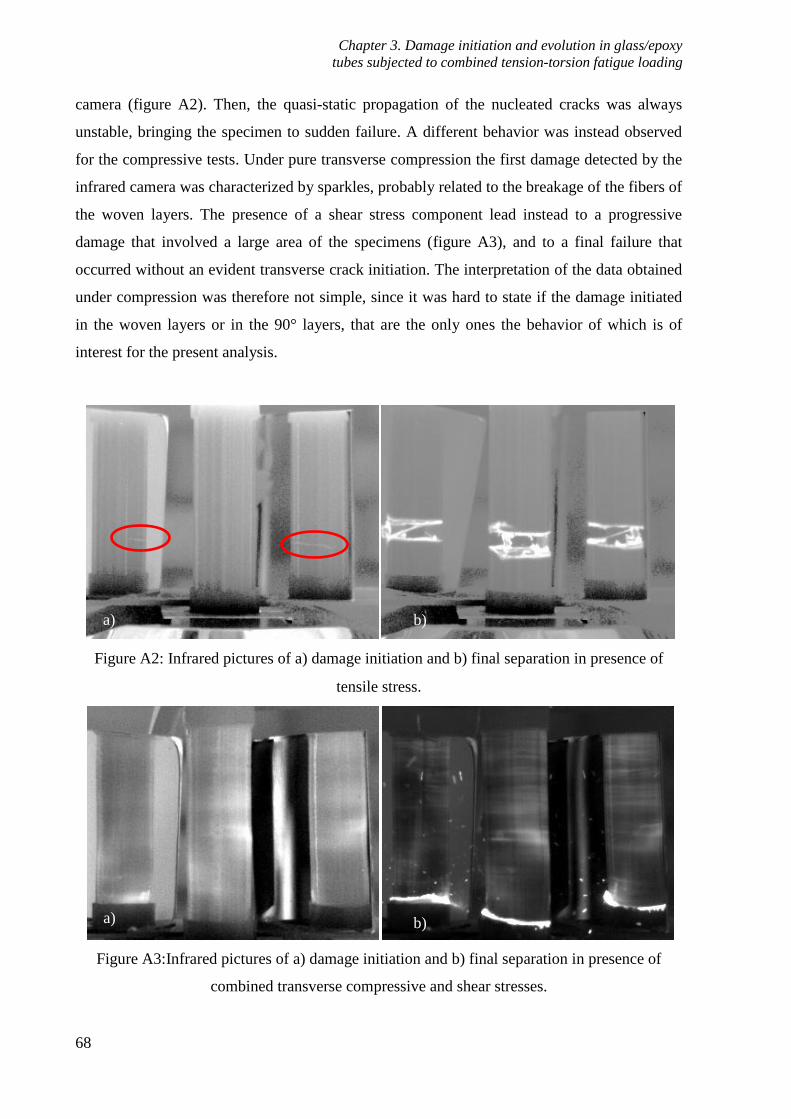
Chapter 3. Damage initiation and evolution in glass/epoxy
tubes subjected to combined tension-torsion fatigue loading
68
camera (figure A2). Then, the quasi-static propagation of the nucleated cracks was always
unstable, bringing the specimen to sudden failure. A different behavior was instead observed
for the compressive tests. Under pure transverse compression the first damage detected by the
infrared camera was characterized by sparkles, probably related to the breakage of the fibers of
the woven layers. The presence of a shear stress component lead instead to a progressive
damage that involved a large area of the specimens (figure A3), and to a final failure that
occurred without an evident transverse crack initiation. The interpretation of the data obtained
under compression was therefore not simple, since it was hard to state if the damage initiated
in the woven layers or in the 90° layers, that are the only ones the behavior of which is of
interest for the present analysis.
Figure A2: Infrared pictures of a) damage initiation and b) final separation in presence of
tensile stress.
Figure A3:Infrared pictures of a) damage initiation and b) final separation in presence of
combined transverse compressive and shear stresses.
a) b)
b) a)

Chapter 3. Damage initiation and evolution in glass/epoxy
tubes subjected to combined tension-torsion fatigue loading
69
References of chapter 3
[1] S. Adden, P. Horst, Damage propagation in non-crimp fabrics under bi-axial static and
fatigue loading, Composites Science and Technology 66 (2006) 626–633
[2] S. Adden, P. Horst, Stiffness degradation under fatigue in multiaxially loaded non-
crimped-fabrics, International Journal of Fatigue 32 (2010) 108–122
[3] F. Schmidt, M. Rheinfurth, P. Horst, G. Busse, Multiaxial fatigue behaviour of GFRP
with evenly distributed or accumulated voids monitored by various NDT
methodologies, International Journal of Fatigue 43 (2012) 207–216
[4] F. Schmidt, M. Rheinfurth, P. Horst, G. Busse, Effects of local fibre waviness on
damage mechanisms and fatigue behaviour of biaxially loaded tube specimens,
Composites Science and Technology 72 (2012) 1075–1082
[5] J. Tong, F. J. Guild, S. L. Ogin, P. A. Smith, Off-axis fatigue crack growth and the
associated energy release rate in composite laminates, Applied Composite Materials 4
(1997) 349–359
[6] J. Tong. Three Stages of Fatigue Crack Growth in GFRP Composite Laminates.
Journal of Engineering Materials and Technology 123 (2001) 139-143
[7] J. Tong, Characteristics of fatigue crack growth in GFRP laminates, International
Journal of Fatigue 24 (2002) 291–297
[8] A.W. Wharmby, F. Ellyin, Damage growth in constrained angle-ply laminates under
cyclic loading, Composites Science and Technology 62 (2002) 1239–1247
[9] B. Liu, L. B. Lessard, Fatigue and damage tolerance analysis of composite laminates:
stiffness loss, damage modelling, and life prediction, Composites Science and
Technology 51 (1994) 43-51
[10] A. Hosoi, Y. Arao, H. Kawada, Transverse crack growth behavior considering free-
edge effect in quasi-isotropic CFRP laminates under high-cycle fatigue loading,
Composites Science and Technology 69 (2009) 1388–1393
[11] A. Hosoi, K. Takamura, N. Sato, H. Kawada, Quantitative evaluation of fatigue
damage growth in CFRP laminates that changes due to applied stress level,
International Journal of Fatigue 33 (2011) 781–787
[12] M. C. Lafarie-Frenot, C. Hénaff-Gardin, Formation and Growth of 90° Ply Fatigue
Cracks in Carbon/Epoxy Laminates, Composites Science and Technology 40 (1991)
307-324
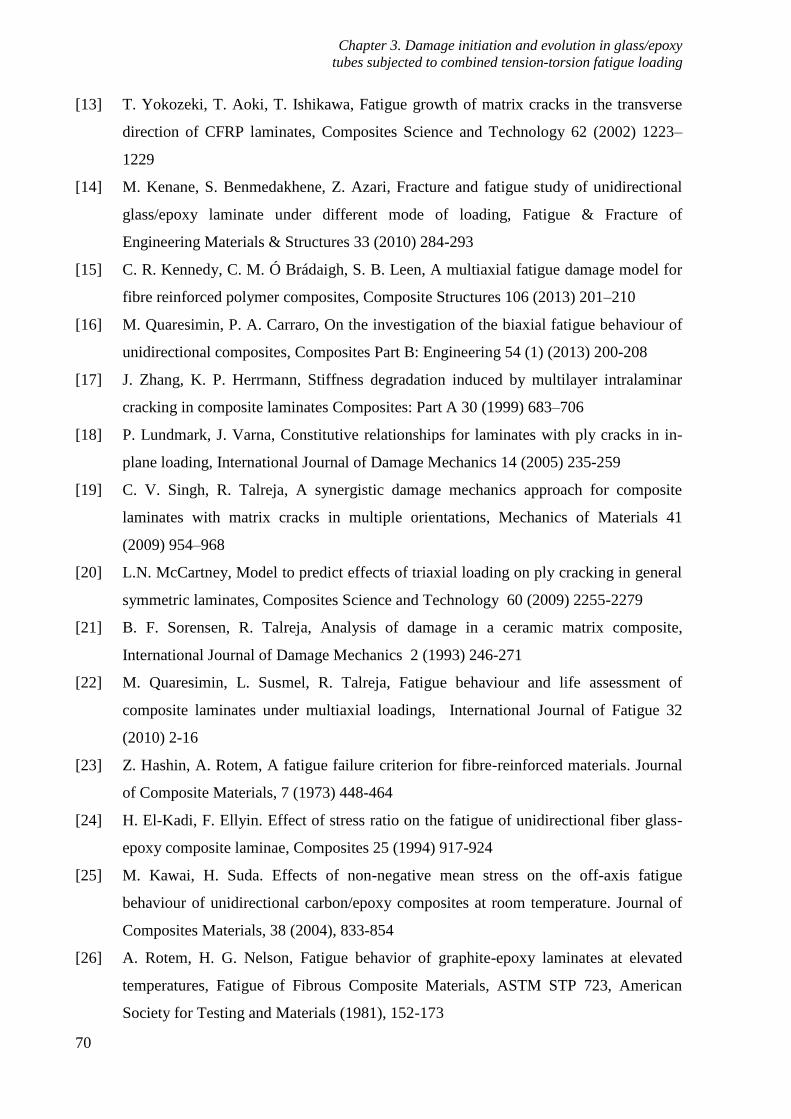
Chapter 3. Damage initiation and evolution in glass/epoxy
tubes subjected to combined tension-torsion fatigue loading
70
[13] T. Yokozeki, T. Aoki, T. Ishikawa, Fatigue growth of matrix cracks in the transverse
direction of CFRP laminates, Composites Science and Technology 62 (2002) 1223–
1229
[14] M. Kenane, S. Benmedakhene, Z. Azari, Fracture and fatigue study of unidirectional
glass/epoxy laminate under different mode of loading, Fatigue & Fracture of
Engineering Materials & Structures 33 (2010) 284-293
[15] C. R. Kennedy, C. M. Ó Brádaigh, S. B. Leen, A multiaxial fatigue damage model for
fibre reinforced polymer composites, Composite Structures 106 (2013) 201–210
[16] M. Quaresimin, P. A. Carraro, On the investigation of the biaxial fatigue behaviour of
unidirectional composites, Composites Part B: Engineering 54 (1) (2013) 200-208
[17] J. Zhang, K. P. Herrmann, Stiffness degradation induced by multilayer intralaminar
cracking in composite laminates Composites: Part A 30 (1999) 683–706
[18] P. Lundmark, J. Varna, Constitutive relationships for laminates with ply cracks in in-
plane loading, International Journal of Damage Mechanics 14 (2005) 235-259
[19] C. V. Singh, R. Talreja, A synergistic damage mechanics approach for composite
laminates with matrix cracks in multiple orientations, Mechanics of Materials 41
(2009) 954–968
[20] L.N. McCartney, Model to predict effects of triaxial loading on ply cracking in general
symmetric laminates, Composites Science and Technology 60 (2009) 2255-2279
[21] B. F. Sorensen, R. Talreja, Analysis of damage in a ceramic matrix composite,
International Journal of Damage Mechanics 2 (1993) 246-271
[22] M. Quaresimin, L. Susmel, R. Talreja, Fatigue behaviour and life assessment of
composite laminates under multiaxial loadings, International Journal of Fatigue 32
(2010) 2-16
[23] Z. Hashin, A. Rotem, A fatigue failure criterion for fibre-reinforced materials. Journal
of Composite Materials, 7 (1973) 448-464
[24] H. El-Kadi, F. Ellyin. Effect of stress ratio on the fatigue of unidirectional fiber glass-
epoxy composite laminae, Composites 25 (1994) 917-924
[25] M. Kawai, H. Suda. Effects of non-negative mean stress on the off-axis fatigue
behaviour of unidirectional carbon/epoxy composites at room temperature. Journal of
Composites Materials, 38 (2004), 833-854
[26] A. Rotem, H. G. Nelson, Fatigue behavior of graphite-epoxy laminates at elevated
temperatures, Fatigue of Fibrous Composite Materials, ASTM STP 723, American
Society for Testing and Materials (1981), 152-173

Chapter 3. Damage initiation and evolution in glass/epoxy
tubes subjected to combined tension-torsion fatigue loading
71
[27] K. Tohgo, S. Nakagawa, K. Kageyama. Fatigue behavior of CFRP cross-ply laminates
under on-axis and off-axis cyclic loading. International Journal of Fatigue 28 (2006)
1254-1262
[28] E. Krempl, D. M. Elzey, B. Z. Hong, T. Ayar, R. G. Loewy. Uniaxial and biaxial
fatigue properties of thin-walled composite tubes. Journal of American Helicopter
Society 33(3) (1988) 3-10
[29] D. Perreux, E. Joseph., The effect of frequency on the fatigue performance of filament
wound pipes under biaxial loading: experimental results and damage mechanics.
Composites Science and Technology 57 (1997) 353-364
[30] D. Qi, G. Cheng. Fatigue behaviour of filament-wound glass-fibre reinforced epoxy
composite tubes under tension/torsion biaxial loading Polymer Composites 28 (2007)
116-123
[31] D. L. Jones, P. K. Poulose, H. Liebovitz. Effect of biaxial loads on the static and
fatigue properties of composite materials, Multiaxial Fatigue, ASTM STP 853, Edited
by K. J. Miller and M. W. Brown, American Society for Testing and Materials,
Philadelphia (1985) 413-427
[32] J. C. Radon, C. R. Wachnicky. Biaxial fatigue of glass fiber reinforced polyester resin.
In: Multiaxial Fatigue, ASTM STP 853, Edited by K. J. Miller and M. Brown,
American Society for Testing and Materials, Philadelphia (1985) 396-412
[33] J. Awerbuch, H. T. Hahn. Off-axis fatigue of graphite/epoxy composite. Fatigue of
Fibrous Composite Materials, ASTM STP 723, American Society for Testing and
Materials (1981) 243-273
[34] S. L. Ogin, P. A. Smith, P. W. R. Beaumont, A Stress Intensity Factor Approach to the
Fatigue Growth of Transverse Ply Cracks, Composites Science and Technology 24
(1985) 47-59
[35] P. A. Carraro, M. Quaresimin, Damage mechanics in G/E tubes under tension-torsion
cyclic loading, Key Engineering Materials, 488-489 (2012) 783-786
[36] A. Parvizi, K. W. Garrett, J. E. Bailey, Constrained cracking in glass fibre-reinforced
epoxy cross-ply laminates, Journal of Materials Science 13 (1978) 195-201
[37] D. L. Flaggs, M. H. Kural, Experimental Determination of the In Situ Transverse
Lamina Strength in Graphite/Epoxy Laminates, Journal of Composite Materials 16
(1982) 103-116

Chapter 3. Damage initiation and evolution in glass/epoxy
tubes subjected to combined tension-torsion fatigue loading
72
[38] P. A. Smith, L. Boniface, N. F. C. Glass, A comparison of transverse cracking
phenomena in (0/90)s and (90/0)s CFRP laminates, Applied Composite Materials 5
(1998) 11–23
[39] S. Ho, Z. Suo, Tunneling cracks in constrained layers, Journal of Applied Mechanics
60 (1993) 890-894
[40] A. Plumtree, L. Shi, Fatigue damage evolution in off-axis unidirectional CFRP,
International Journal of Fatigue 24 (2002) 155–159.

Chapter 4. Damage evolution under internal and external
multiaxial cyclic stress state: a comparative analysis
73
4
Damage evolution under internal and external
multiaxial cyclic stress state: a comparative analysis
4.1. Introduction
The multiaxial fatigue behaviour of composite materials represents a topic of extreme
importance and interest for many industrial fields. In fact, composite laminates are
increasingly used for structural components subjected to cyclic loads, as wind turbine blades,
airplane wings and car frames just to name a few. In addition, the stress state is, in general,
multiaxial, it being due to external loads in several directions ("external" multiaxiality) or to
the material orthotropy ("internal" multiaxiality [1]).
A recent review [1] points out the lack of reliable and general design tools for multidirectional
laminates subjected to multiaxial fatigue loading. In addition, information on damage
mechanisms and their evolution under multiaxial loading, particularly in correlation with the
multiaxial condition, are missing as well.
However, the problem is not trivial at all, since the fatigue life of multidirectional laminates is
characterised by several sources of damage, the progressive evolution of which causes the
degradation of the global stiffness and residual strength of the laminate. Some macroscopic
evidences of this behaviour can be found in Refs. [2-6] among the others. Typically, the first
damage mechanism occurring since the earlier stages of fatigue life is the initiation and
propagation of off-axis cracks, until a saturation condition is reached. Another, and usually
subsequent, source of damage is represented by the onset and propagation of delaminations.
This behaviour has been experimentally documented by several works in the literature (see
Refs. [7-12] for instance). In particular, the onset and propagation of multiple off-axis cracks
is of extreme importance to be predicted since it can be responsible of a pronounced stiffness
reduction much before the final failure of the laminate. In addition, off-axis cracks act as stress
concentrators for the 0° oriented plies, promoting fibre breaks in the vicinity of their tips. The
initiation and propagation of off-axis cracks are matrix or fibre-matrix interface controlled
phenomena, the prediction of which has to be based on models and criteria suitable to account
for multiaxial stress states. In the writer's opinion, reliable multiaxial criteria must be defined
Chapter 4. Damage evolution under internal and external
multiaxial cyclic stress state: a comparative analysis
74
on the basis of the damage mechanisms at the microscopic scale, leading to the initiation and
propagation of off-axis cracks. The lack of knowledge on such mechanisms and their
dependence on the multiaxial condition is also highlighted in Refs. [1] and [13,14].
Accordingly, the need to improve the knowledge on this subject by means of dedicated and
extensive experimental characterisations is clear.
Several procedures and specimens configurations for multiaxial testing of composites are
reviewed in Refs. [15-17]. "Internal" multiaxial loading conditions can be achieved by means
of off-axis flat specimens, while external loads in different directions (leading to an "external"
multiaxiality) can be applied by means of cruciform or tubular specimens.
With the aim to improve the understanding of the matrix-dominated fatigue behaviour of UD
laminae, an extensive experimental activity was carried out on Glass/Epoxy tubes subjected to
an "external" multiaxial condition, obtained by combined tension and torsion cyclic loads
[13,14]. Results are reported in chapter 3 of this thesis.
Quaresimin et al. [1] suggested to used the biaxiality ratios to describe the local multiaxial
stress state acting on a lamina
6 621 2 12
1 1 2
σ σσλ , λ , λ
σ σ σ (1)
where ζ1, ζ2 and ζ6 are the longitudinal, transverse and in-plane shear stresses in the material
coordinates system.
In order to improve the understanding of the matrix-dominated fatigue behaviour of UD
laminae, a specimen configuration was designed suitable to understand the synergic effect of
ζ2 and ζ6 on the cycles spent for the initiation of a transverse crack, as discussed in chapter 2.
To this aim, tubular samples were produced, with the fibres oriented at 90° with respect to the
axis of the tube. Combining tension and torsion cyclic loads by mean of a biaxial tensile
machine, different values of λ12 were obtained (0, 1 and 2). The presence of an increasing
shear stress component was proved to have a detrimental effect on the S-N curves relating the
maximum cyclic transverse stress ζ2,max to the number of cycles spent for the initiation of a
transverse crack [13]. As these specimens were unidirectional, this event corresponded to the
final failure of the tubes, preventing us to analyse the propagation phase. Thus, as shown in
chapter 3, tubular specimens with lay-up [0F/90U,3/0F], where the subscripts F and U mean
fabric and unidirectional, respectively, were produced and tested, focusing the attention on the
initiation and propagation of cracks in the 90° UD layers. Four values of λ12 were obtained (0,

Chapter 4. Damage evolution under internal and external
multiaxial cyclic stress state: a comparative analysis
75
0.5, 1 and 2) by means of combined tension/torsion loadings. The detrimental effect of the
shear stress component was confirmed both for the crack initiation process, treated in terms of
S-N curves for the onset of the first transverse crack, and the propagation phase, described by
means of Paris-like curves relating the Crack Growth Rate (CGR) to the mode I Strain Energy
Release Rate (SERR), GI. In addition, SEM images of the fracture surfaces presented in
chapter 3 revealed the dependence of the damage modes at the microscopic scale on the shear
stress contribution. The experimental results and the evidences presented in [13,14] and
chapters 2 and 3 are useful for the definition and validation of a damage based multiaxial
criterion for crack initiation which is being presented in chapter 5 and an incoming paper [18].
It is important to remind that the activity presented in chapters 2 and 3 is related to an
"external" multiaxial condition, obtained by means of a biaxial testing machine. However, it
would be definitely far easier and cheaper to test the multiaxial fatigue behaviour of
composites by means of off-axis loaded flat coupons, taking advantage of the "internal"
multiaxiality due to material anisotropy. UD off-axis specimens could be used for this
purpose, and several works in the literature report S-N curves for different off-axis angles [19-
21]. The main limit of this specimen configuration is that it does not allow to analyse the crack
propagation phase, which can be studied, instead, by adding 0° layers constraining the off-axis
plies. The propagation of matrix cracks in laminates has been studied in Refs. [22-25], but
only in [23] an off-axis angle different from 90° has been considered, which leads to a mixed I
+ II mode propagation.
Though there are not specific reasons to believe that the material behaviour should be different
weather an "external" or an "internal" multiaxiality is applied, it is useful to verify their
equivalence with a dedicated experimental campaign. Accordingly, the aims of the work
presented in this chapter are:
1) To design a specimen configuration for multidirectional flat laminates with off-axis layers
oriented at an angle suitable to obtain "controlled" multiaxial conditions (λ12 values), for
instance similar to those adopted in chapter 3 and Ref. [14];
2) To analyse the possible effect of the layer thickness on fatigue crack initiation and
propagation, by including, in the same laminate, a thick and a thin layer with the same
orientation;
3) To characterise the fatigue behaviour of the laminates in terms of first cracks initiation,
crack density evolution, stiffness degradation and crack propagation;
4) To compare the S-N curves for crack initiation and the Paris-like curves for crack
propagation with those obtained for tubular samples [14] under similar multiaxial conditions.

Chapter 4. Damage evolution under internal and external
multiaxial cyclic stress state: a comparative analysis
76
To these aims, the same Glass/Epoxy pre-preg material of chapter 3 and Ref. [14] was used for
[0/θ2/0/-θ2]s flat specimens with off-axis angles θ of 50° and 60°, in order to achieve biaxiality
ratios λ12 = 0.57 and 1.15, as will be better clarified later on. The results of the fatigue tests are
compared to those for tubes for λ12 = 0.5 and 1.
4.2. Materials, specimen preparation and test equipment
E-glass/epoxy pre-preg “UE400-REM” by SAATI S.p.A. (Italy) was used in a [0/θ2/0/-θ2]s
specimen lay-up studying two different configurations using θ=50°or θ=60°, respectively. In
the following, the two-plies and the central four-plies layers will be referred to as the thin and
the thick layers, respectively. The laminates were manufactured using hand lay-up of the pre-
preg followed by autoclave curing at 140 °C and pressure of 6 bars, resulting in laminates with
an approximately total thickness of 50 4.5mmlayupt
and60 4.3mmlayupt
, respectively. The cured
ply elastic properties for the UE400-REM have been reported in Ref. [13,14] and chapters 2
and 3. Their values are listed again in table 1.
Table 1: Properties of UE400-REM cured ply, taken from Ref. [13,14], adopted for [0/602/0/-
602]s specimens
E1
[MPa]
E2
[MPa] ν12
G12
[MPa]
avg. ply thickness
[mm]
34860±2365 9419±692 0.326±0.015 3193 0.35
The tensile apparent modulus in the x-direction, Ex, was measured for the produced laminates.
A value of 17660 ± 500MPa was found for the [0/602/0/-602]s specimens, which is in close
agreement with the prediction based on the classical lamination theory (17332 MPa), starting
from the ply properties listed in table 1. The Ex value for the [0/502/0/-502]s laminates was
found to be of 16720 ± 570 MPa, lower than the expected value of 17823 MPa estimated with
the classical lamination theory. The reason for this disagreement has been identified in a
different fibre volume fraction for the two panels, though they were manufactured nominally
with the same materials and process. By means of a thermo-gravimetric test, volume fractions
of 0.45 and 0.38 were measured for the [0/602/0/-602]s and [0/502/0/-502]s specimens,
respectively. Therefore, for the [0/502/0/-502]s laminate the micromechanical formulation
proposed in Ref. [26] was adopted for the estimation of the ply elastic properties, based on the
measured fibre volume fraction of 0.38 and typical glass and epoxy elastic properties (Efibre =
72000 MPa, νfibre = 0.2, Ematrix = 4200 MPa, νmatrix = 0.34). The results are show in table 2.

Chapter 4. Damage evolution under internal and external
multiaxial cyclic stress state: a comparative analysis
77
Table 2: Estimated properties, adopted for [0/502/0/-502]s specimens
EL
[MPa]
ET
[MPa] νLT
GLT
[MPa]
avg. ply thickness
[mm]
30620 8620 0.2985 3250 0.375
Using these values as input for the classical lamination theory, the predicted Ex for the
[0/502/0/-502]s specimens is equal to 16300 MPa, in good agreement with the experimental
measurements.
It is also worth mentioning that the average ply thickness is equal to 0.35 and 0.375 for the
[0/602/0/-602]s and [0/502/0/-502]s specimens, respectively.
Finally, micrographic analyses revealed that in the [0/502/0/-502]s samples the thickness of the
thick 50° layer is 1.88 (instead of 2) times that of the thin one. This has to be accounted for in
the following sections of the paper, mainly for the calculation of the SERR for the crack
propagation analysis in section 5.
The cured laminates were cut into uniaxial tensile test specimens with the geometry
2300 24mmL W (including 75 mm tabs at each end). Uniaxial fatigue tests were performed
using a hydraulic test machine with hydraulic grips, see figure 1. The deformation was
measured using two back to back mounted 25 mm/±2.5 mm extensometers and a load cell of
100 kN.
Figure 1: Fatigue test set-up and acquisition system
Cyclic loads were applied under load control with a frequency in the range of 3-5 Hz
following a sine variation of the load with a R-value of min max/ 0.1R P P . Based on the
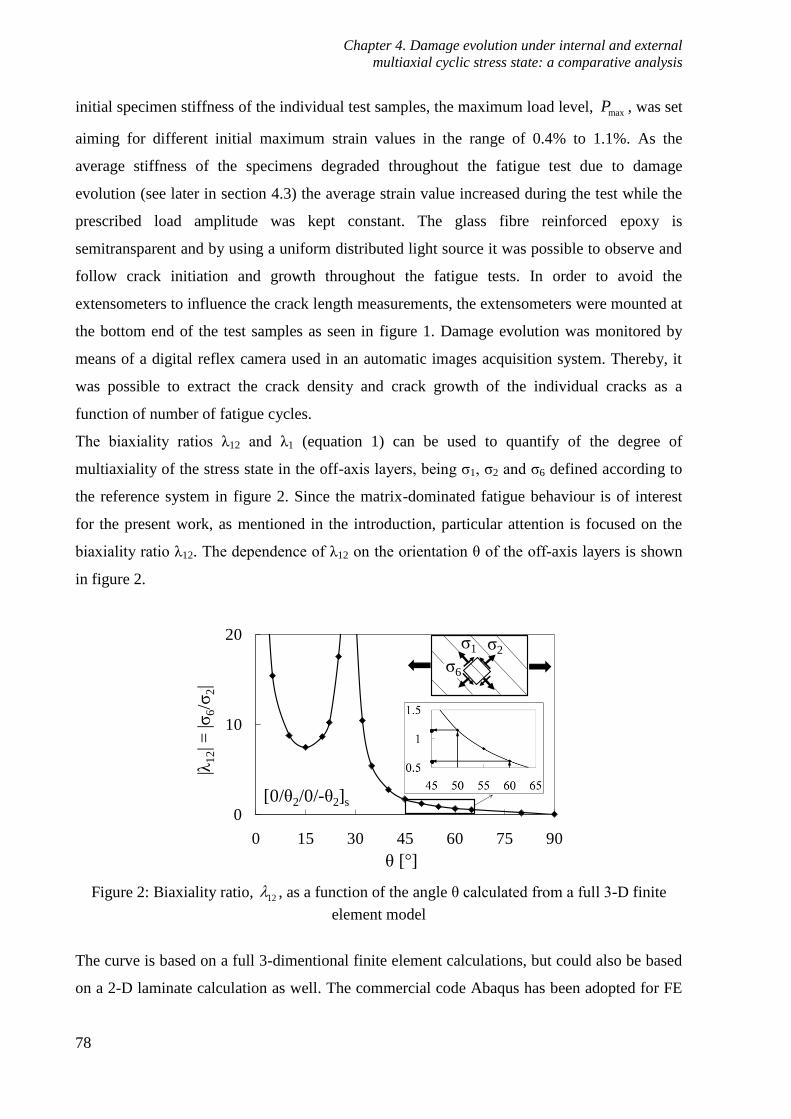
Chapter 4. Damage evolution under internal and external
multiaxial cyclic stress state: a comparative analysis
78
initial specimen stiffness of the individual test samples, the maximum load level, maxP , was set
aiming for different initial maximum strain values in the range of 0.4% to 1.1%. As the
average stiffness of the specimens degraded throughout the fatigue test due to damage
evolution (see later in section 4.3) the average strain value increased during the test while the
prescribed load amplitude was kept constant. The glass fibre reinforced epoxy is
semitransparent and by using a uniform distributed light source it was possible to observe and
follow crack initiation and growth throughout the fatigue tests. In order to avoid the
extensometers to influence the crack length measurements, the extensometers were mounted at
the bottom end of the test samples as seen in figure 1. Damage evolution was monitored by
means of a digital reflex camera used in an automatic images acquisition system. Thereby, it
was possible to extract the crack density and crack growth of the individual cracks as a
function of number of fatigue cycles.
The biaxiality ratios λ12 and λ1 (equation 1) can be used to quantify of the degree of
multiaxiality of the stress state in the off-axis layers, being ζ1, ζ2 and ζ6 defined according to
the reference system in figure 2. Since the matrix-dominated fatigue behaviour is of interest
for the present work, as mentioned in the introduction, particular attention is focused on the
biaxiality ratio λ12. The dependence of λ12 on the orientation θ of the off-axis layers is shown
in figure 2.
Figure 2: Biaxiality ratio, 12l , as a function of the angle θ calculated from a full 3-D finite
element model
The curve is based on a full 3-dimentional finite element calculations, but could also be based
on a 2-D laminate calculation as well. The commercial code Abaqus has been adopted for FE
0
10
20
0 15 30 45 60 75 90
|λ1
2| =
|ζ6/ζ
2|
θ [°]
[0/θ2/0/-θ2]s
ζ2ζ1
ζ6
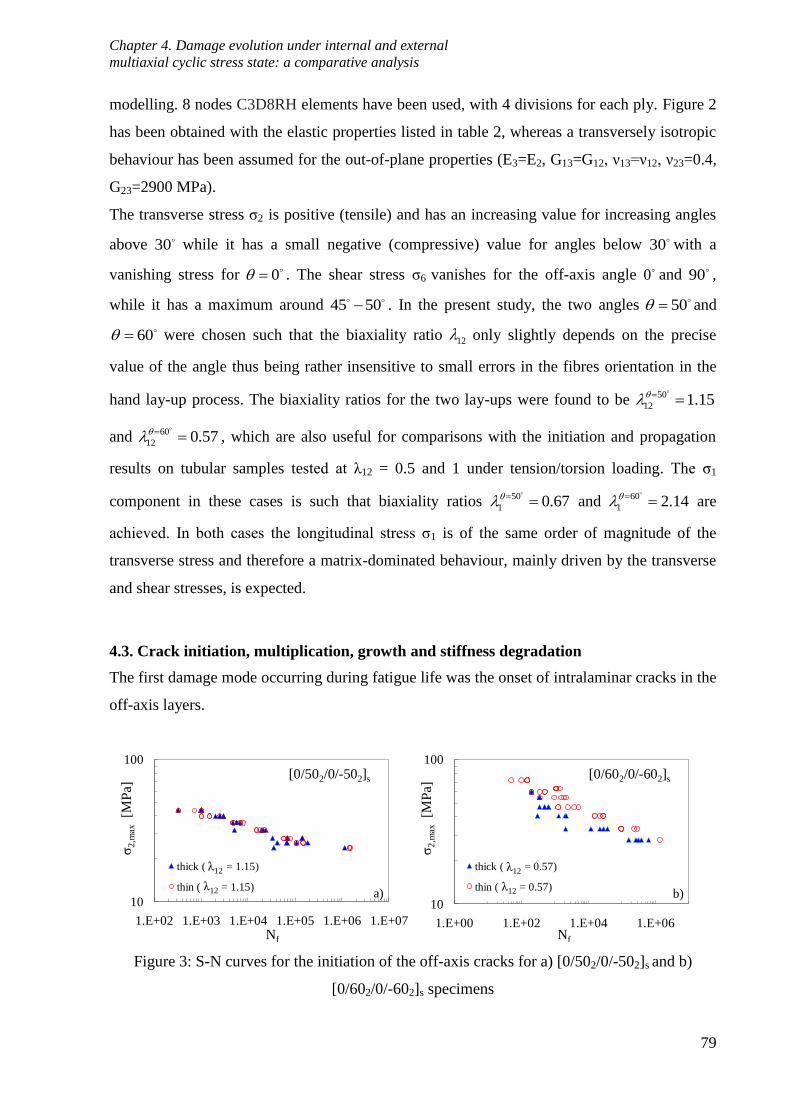
Chapter 4. Damage evolution under internal and external
multiaxial cyclic stress state: a comparative analysis
79
modelling. 8 nodes C3D8RH elements have been used, with 4 divisions for each ply. Figure 2
has been obtained with the elastic properties listed in table 2, whereas a transversely isotropic
behaviour has been assumed for the out-of-plane properties (E3=E2, G13=G12, ν13=ν12, ν23=0.4,
G23=2900 MPa).
The transverse stress ζ2 is positive (tensile) and has an increasing value for increasing angles
above 30 while it has a small negative (compressive) value for angles below 30 with a
vanishing stress for 0 . The shear stress ζ6 vanishes for the off-axis angle 0 and 90 ,
while it has a maximum around 45 50 . In the present study, the two angles 50 and
60 were chosen such that the biaxiality ratio 12l only slightly depends on the precise
value of the angle thus being rather insensitive to small errors in the fibres orientation in the
hand lay-up process. The biaxiality ratios for the two lay-ups were found to be 50
12 1.15l
and 60
12 0.57l
, which are also useful for comparisons with the initiation and propagation
results on tubular samples tested at λ12 = 0.5 and 1 under tension/torsion loading. The ζ1
component in these cases is such that biaxiality ratios 50
1 0.67 l and 60
1 2.14 l are
achieved. In both cases the longitudinal stress ζ1 is of the same order of magnitude of the
transverse stress and therefore a matrix-dominated behaviour, mainly driven by the transverse
and shear stresses, is expected.
4.3. Crack initiation, multiplication, growth and stiffness degradation
The first damage mode occurring during fatigue life was the onset of intralaminar cracks in the
off-axis layers.
Figure 3: S-N curves for the initiation of the off-axis cracks for a) [0/502/0/-502]s and b)
[0/602/0/-602]s specimens
10
100
1.E+02 1.E+03 1.E+04 1.E+05 1.E+06 1.E+07
ζ2
,max
[MP
a]
Nf
thick (L12 = 1.15)
thin (L12 = 1.15)
[0/502/0/-502]s
λ12
λ12 a)10
100
1.E+00 1.E+02 1.E+04 1.E+06
ζ2
,max
[MP
a]
Nf
thick (L12 = 0.57)
thin (L12 = 0.57)
[0/602/0/-602]s
λ12
λ12 b)

Chapter 4. Damage evolution under internal and external
multiaxial cyclic stress state: a comparative analysis
80
As expected, the first crack initiation was followed by multiple onsets in the whole specimen
length. As far as these initiation sites were far enough from each other, the cycles spent for
each crack onset could be considered as independent fatigue results, accounting for the
statistical distribution of fatigue strength along the specimen length. Figures 3a) and b) show
the S-N data for the initiation of the first cracks for each load level, for θ = 50° and 60°,
respectively. The curves are presented in terms of the maximum cyclic transverse stress ζ2 in
the off-axis layers. It can be noticed that the initiation data for the thick and the thin layers are
reasonably well described by the same scatter band.
Increasing the number of cycles the number of cracks progressively increased, and the
initiated cracks propagated along the longitudinal direction of the layer. Often in the literature
the crack multiplication phenomenon is described in terms of evolution of the crack density,
meant as the number of cracks divided by the length of the observation zone, measured
perpendicularly to the propagation direction. Referring to the geometry shown in Fig. 4, the
above mentioned crack density ρ can be calculated as follows.
ρtotal N of cracks
AC
(2)
For a better estimation of the state of damage the crack length should be incorporated in the
definition of the crack density, as already highlighted in [14, 27-29] and chapter 3.
Figure 4: A representative crack density image showing both crack in the thin and thick off-
axis layer.
50°
A B
C
E F
10 mm
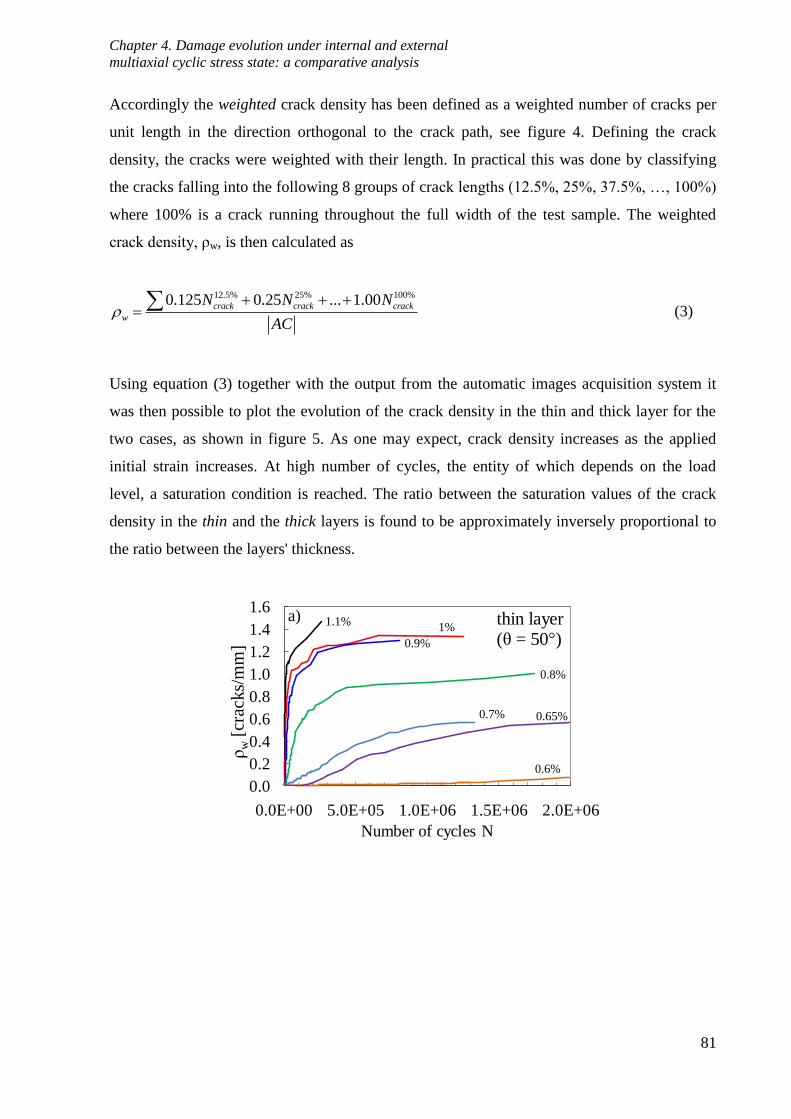
Chapter 4. Damage evolution under internal and external
multiaxial cyclic stress state: a comparative analysis
81
Accordingly the weighted crack density has been defined as a weighted number of cracks per
unit length in the direction orthogonal to the crack path, see figure 4. Defining the crack
density, the cracks were weighted with their length. In practical this was done by classifying
the cracks falling into the following 8 groups of crack lengths (12.5%, 25%, 37.5%, …, 100%)
where 100% is a crack running throughout the full width of the test sample. The weighted
crack density, ρw, is then calculated as
12.5% 25% 100%0.125 0.25 ... 1.00crack crack crack
w
N N N
AC
(3)
Using equation (3) together with the output from the automatic images acquisition system it
was then possible to plot the evolution of the crack density in the thin and thick layer for the
two cases, as shown in figure 5. As one may expect, crack density increases as the applied
initial strain increases. At high number of cycles, the entity of which depends on the load
level, a saturation condition is reached. The ratio between the saturation values of the crack
density in the thin and the thick layers is found to be approximately inversely proportional to
the ratio between the layers' thickness.
0.0
0.2
0.4
0.6
0.8
1.0
1.2
1.4
1.6
0.0E+00 5.0E+05 1.0E+06 1.5E+06 2.0E+06
ρw
[cra
cks/
mm
]
Number of cycles N
1.1%1%
0.9%
0.8%
0.7% 0.65%
0.6%
thin layer(θ = 50°)
a)

Chapter 4. Damage evolution under internal and external
multiaxial cyclic stress state: a comparative analysis
82
Figure 5: Weighted crack density for [0/502/0/-502]s specimen in the thin (a) and thick (b) layer
and [0/602/0/-602]s specimen for the thin (c) and thick (d) layer
The consequence of the increasing crack density in the off-axis layers is a stiffness
degradation of the test samples. Figure 6 shows the measured stiffness degradation as a
function of the number of cycles for the test specimens. It can be seen that there is a strong
0.0
0.1
0.2
0.3
0.4
0.5
0.6
0.7
0.8
0.0E+00 5.0E+05 1.0E+06 1.5E+06 2.0E+06
ρw
[cra
cks/
mm
]
Number of cycles N
1.1%
1%
0.9%
0.8%
0.7%
0.65%
0.6%
thick layer(θ = -50° )
b)
0
0.2
0.4
0.6
0.8
1
1.2
0.0E+00 5.0E+05 1.0E+06 1.5E+06 2.0E+06
ρw[c
rack
/mm
]
number of cycles N
1.1%
1%
0.9%
0.8%0.7%
0.6%
0.5%
thin layer(θ = 60°)
0.4%
c)
0
0.1
0.2
0.3
0.4
0.5
0.6
0.0E+00 5.0E+05 1.0E+06 1.5E+06 2.0E+06
ρw[c
rack
/mm
]
number of cycles N
1.1%
1%0.9%
0.8%
0.7%
0.6%
0.5%
thick layer(θ = -60°)
0.4%
d)

Chapter 4. Damage evolution under internal and external
multiaxial cyclic stress state: a comparative analysis
83
dependence of the stiffness reduction on the load level and that the stiffness reduction occurs
rather early in the fatigue life. The lower bound for the stiffness degradation can be estimated
with the ply discount method and it corresponds to the case where the 0° layer carries all the
load. For 50 and 60 this corresponds to a stiffness reduction of 0/ 0.63x xE E and
0/ 0.65x xE E , respectively. The stiffness is seen to saturate on a higher level indicating that
the off-axis layers still carry some load even in the saturation condition.
Figure 6: Stiffness degradation during fatigue tests for a) [0/502/0/-502]s and b) [0/602/0/-602]s
specimens
4.4. Crack propagation
In addition to the crack density, the output from the automatic images acquisition system can
be used to determine the crack propagation rate. During the post-processing of the test results,
0.60
0.70
0.80
0.90
1.00
0.0E+00 5.0E+05 1.0E+06 1.5E+06
Ex/E
x0
Number of cycles N
0.6%
0.8%
1.0%1.1%
0.9%
0.7%
0.65%
ply discounta)
[0/502/0/-502]s
0.60
0.70
0.80
0.90
1.00
0.0E+00 5.0E+05 1.0E+06 1.5E+06
Ex/E
x0
Number of cycles N
0.5%
0.8%1.0%
1.1%
0.9% 0.7%
0.6%
ply discount
0.4%
b)
[0/602/0/-602]s

Chapter 4. Damage evolution under internal and external
multiaxial cyclic stress state: a comparative analysis
84
isolated cracks initiated in the first stages of each test have been selected for the analysis of the
propagation phase.
Based on the finite element simulation described in the next section, a crack can be considered
as isolated as long as the ratio between the orthogonal distances to the neighbouring cracks ,L ,
is larger than 4 times the thickness, h, of the layer.
In addition, as it will be shown later the Energy Release Rate for tunnelling cracks is
independent on the crack length if the tip is far enough from the edges of the specimen.
Indeed, figure 7 shows a typical measurement giving a rather linear relation between the crack
length a and the number of cycles of propagation Np, the Crack Growth Rate (CGR) being
equal to the curve's slope.
The measured CGRs of the thin and thick layers are plotted in figure 8 as a function of the
initial strain level.
Each point corresponds to a single crack propagating with a constant rate. It is seen that, for a
fixed applied strain level, the crack growth rate in the thin plies is significantly lower than in
the thick ones.
Figure 7: Example of crack propagation curve in the thin layer for the [0/502/0/-502]s lay-up,
and ε = 0.7%
a = 2.74E-04·Np + 2.55
0
5
10
15
20
25
30
35
0 50000 100000 150000
crac
k len
gth
, a
[mm
]
propagation cycles Np
(a)
(b)
(c)
(a)
load direction
a (b)
a (c)
a

Chapter 4. Damage evolution under internal and external
multiaxial cyclic stress state: a comparative analysis
85
Figure 8: Crack Growth Rate versus the initial strain level tests for a) [0/502/0/-502]s and b)
[0/602/0/-602]s specimens
4.5. Finite Element calculation of SERR
With the aim to analyse in detail the crack propagation phase and provide useful design tools,
the Strain Energy Release Rate (SERR) has been calculated for the cracks propagating in the
±θ layers of the lay-ups under investigation. Finite Element (FE) analyses have been carried
out with the code Abaqus.
First, an entire specimen with one crack only was modelled, in order to compute the SERR
associated to an isolated crack. The Abaqus' J-integral calculation feature was adopted for the
SERR calculation. 8-nodes C3D8RH elements were used with an element size of 0.0125 mm
at the crack front. The J-integral was calculated through circular paths at 61 locations along
the thickness of the cracked layer which was divided in 30 elements along the thickness
direction. Convergence has been found to occur at the 5th circular contour.
The value of the J-integral associated to a certain crack was averaged over the 61 calculation
points through the thickness direction z, according to equation (4).
0
1 hJ J z dz
h (4)
In most of the simulations, a straight crack front was used even though this does not represent
the correct crack front shape. In reality, the shape should be determined such that J(z) = Gc,
being Gc the critical SERR. For a fixed mode mixity, this corresponds to a constant value of
J(z). Nevertheless, for a general case the mode mixity may vary in the thickness direction
resulting in a critical energy release rate which may vary too. For the pure mode I case,
Nakamura and Kamath [30] showed that the average J-integral value (calculated with the
1.E-6
1.E-5
1.E-4
1.E-3
1.E-2
1.E-1
1.E+0
0.4
CG
R [
mm
/cyc
le]
initial strain level, ε%
thin
thick
[0/502/0/-502]s
a)
0.8 1.2 1.6
1.E-6
1.E-5
1.E-4
1.E-3
1.E-2
1.E-1
1.E+0
0.3
CG
R [
mm
/cyc
le]
initial strain level, ε%
thin
thick
[0/602/0/-602]s
b)
0.6 1.2 1.50.9

Chapter 4. Damage evolution under internal and external
multiaxial cyclic stress state: a comparative analysis
86
stress intensity factor) is rather independent on the actual shape of the steady state crack front
indicating that a straight crack front can be used. A similar observation was made here
comparing the average value of J for the straight front with the corresponding value obtained
for a non-straight crack front.
Different crack length values were considered in order to evaluate the possible influence on
the SERR. The results of this analysis for the [0/502/0/-502]s specimens is shown in figure 9
where the crack length is normalised to the layer thickness.
The SERR was computed for both the thick and thin layers. It can be noticed that the SERR
has an increasing trend for short cracks but after a length approximately twice the layer
thickness it reaches a plateau.
Figure 9: Total SERR vs normalised crack length, lay-up: [0/502/0/-502]s, ε = 1.1%
This is consistent with the findings reported in chapter 3 and Ref. [14] for tubular specimens
and with the considerations reported by Ho and Suo for tunnelling cracks in constrained layers
[31]. As a consequence the crack growth process occurs in a Steady State (SS) condition for
the larger part of the propagation phase. This explains also why the crack length against life
curves reported in paragraph 4.4 are characterised by a linear trend. If the SERR remains
constant during the propagation phase there is no reason for a crack to increase its growth rate,
other than variations of the local toughness due to the presence of defects or to the local
microstructure, as already mentioned in chapter 3 for tubes.
The J-integral approach has the drawback that it is suitable to compute the total SERR (Gtot =
GI + GII) and not to decouple it in the mode I and mode II components GI and GII. It has been
shown in chapter 3 that the resistance to crack propagation depends indeed on the mode mixity
0.0
0.2
0.4
0.6
0.8
0 2 4 6 8 10 12 14 16
To
tal S
ER
R [
kJ/
m2]
a/h
ε = 1.1% thick
thin

Chapter 4. Damage evolution under internal and external
multiaxial cyclic stress state: a comparative analysis
87
(defined as MM = GII/Gtot) and this makes it important to know the mode decomposition,
besides the total value of the SERR. It is worth highlighting that, being the mode mixity based
on the SERR components, it is a better parameter to quantify the multiaxial condition when
talking about the propagation phenomenon, with respect to the λ12 ratio.
To address the problem of the determination of the mode I and II contributions, another way to
determine the energy release rate, proposed by Ho and Suo [31] was adopted. It consists in
computing the steady state energy release rate by determining the work necessary to close the
crack. Ho and Suo [31] used this method to compute the steady state energy release rate for a
mode I tunnel crack but this can be generalized to the mixed mode case using the generalized
relation
, , , 2 60 0
1 1( ) ( )
2 2
h h
tot ss I ss II ss n tG G G z dz z dzh h
(5)
where z is the through the thickness direction and varies from 0 to the ply thickness h. In
equation (5), the stress components ζ2 and ζ6 are those acting in the considered layer before
the initiation of a crack. The symbols δn and δt are the relative crack faces opening and sliding
displacements, respectively (see figure 10), in the presence of a crack in the considered layer.
For the application of equation (5), FE models have been realised with a single crack in the +
or - θ layers. A crack length equal to 50% of the maximum crack length was modelled.
Figure 10: Schematic of the crack opening and sliding displacements for the calculation of the
steady state SERR components
crack front crack profile
δn δt
cutting plane
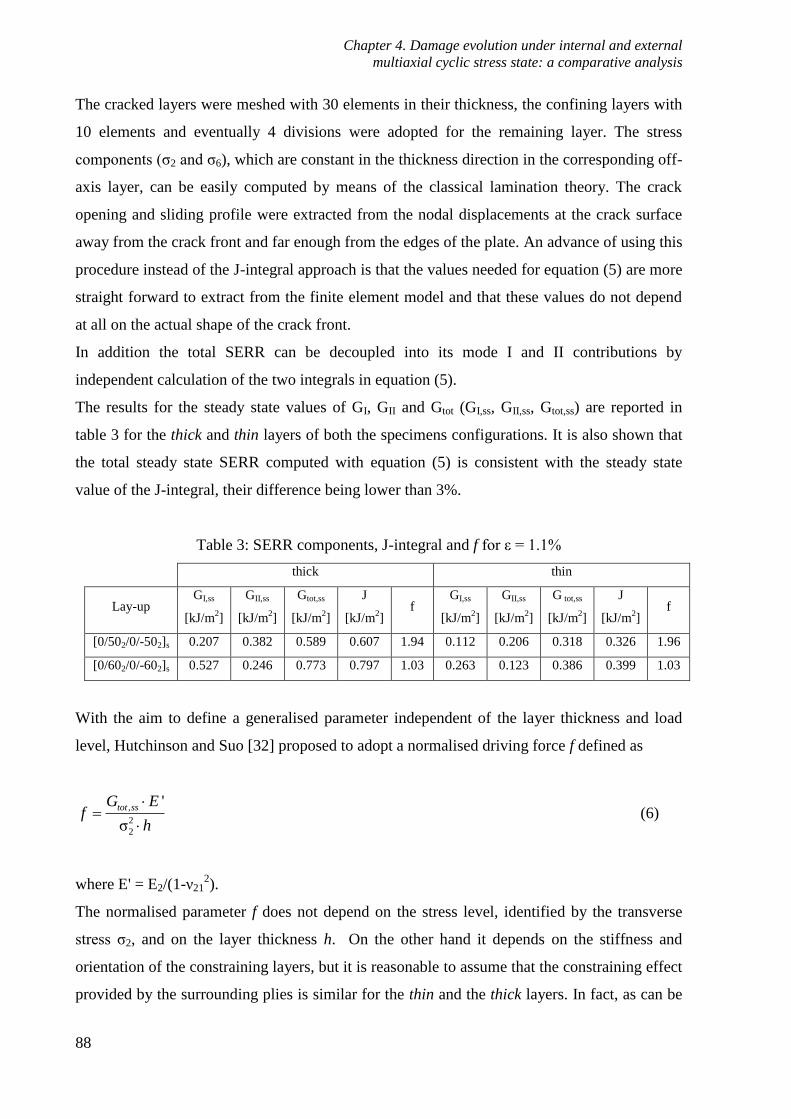
Chapter 4. Damage evolution under internal and external
multiaxial cyclic stress state: a comparative analysis
88
The cracked layers were meshed with 30 elements in their thickness, the confining layers with
10 elements and eventually 4 divisions were adopted for the remaining layer. The stress
components (ζ2 and ζ6), which are constant in the thickness direction in the corresponding off-
axis layer, can be easily computed by means of the classical lamination theory. The crack
opening and sliding profile were extracted from the nodal displacements at the crack surface
away from the crack front and far enough from the edges of the plate. An advance of using this
procedure instead of the J-integral approach is that the values needed for equation (5) are more
straight forward to extract from the finite element model and that these values do not depend
at all on the actual shape of the crack front.
In addition the total SERR can be decoupled into its mode I and II contributions by
independent calculation of the two integrals in equation (5).
The results for the steady state values of GI, GII and Gtot (GI,ss, GII,ss, Gtot,ss) are reported in
table 3 for the thick and thin layers of both the specimens configurations. It is also shown that
the total steady state SERR computed with equation (5) is consistent with the steady state
value of the J-integral, their difference being lower than 3%.
Table 3: SERR components, J-integral and f for ε = 1.1%
thick thin
Lay-up GI,ss
[kJ/m2]
GII,ss
[kJ/m2]
Gtot,ss
[kJ/m2]
J
[kJ/m2]
f GI,ss
[kJ/m2]
GII,ss
[kJ/m2]
G tot,ss
[kJ/m2]
J
[kJ/m2]
f
[0/502/0/-502]s 0.207 0.382 0.589 0.607 1.94 0.112 0.206 0.318 0.326 1.96
[0/602/0/-602]s 0.527 0.246 0.773 0.797 1.03 0.263 0.123 0.386 0.399 1.03
With the aim to define a generalised parameter independent of the layer thickness and load
level, Hutchinson and Suo [32] proposed to adopt a normalised driving force f defined as
,
2
2
'
σ
tot ssG Ef
h
(6)
where E' = E2/(1-ν212).
The normalised parameter f does not depend on the stress level, identified by the transverse
stress ζ2, and on the layer thickness h. On the other hand it depends on the stiffness and
orientation of the constraining layers, but it is reasonable to assume that the constraining effect
provided by the surrounding plies is similar for the thin and the thick layers. In fact, as can be
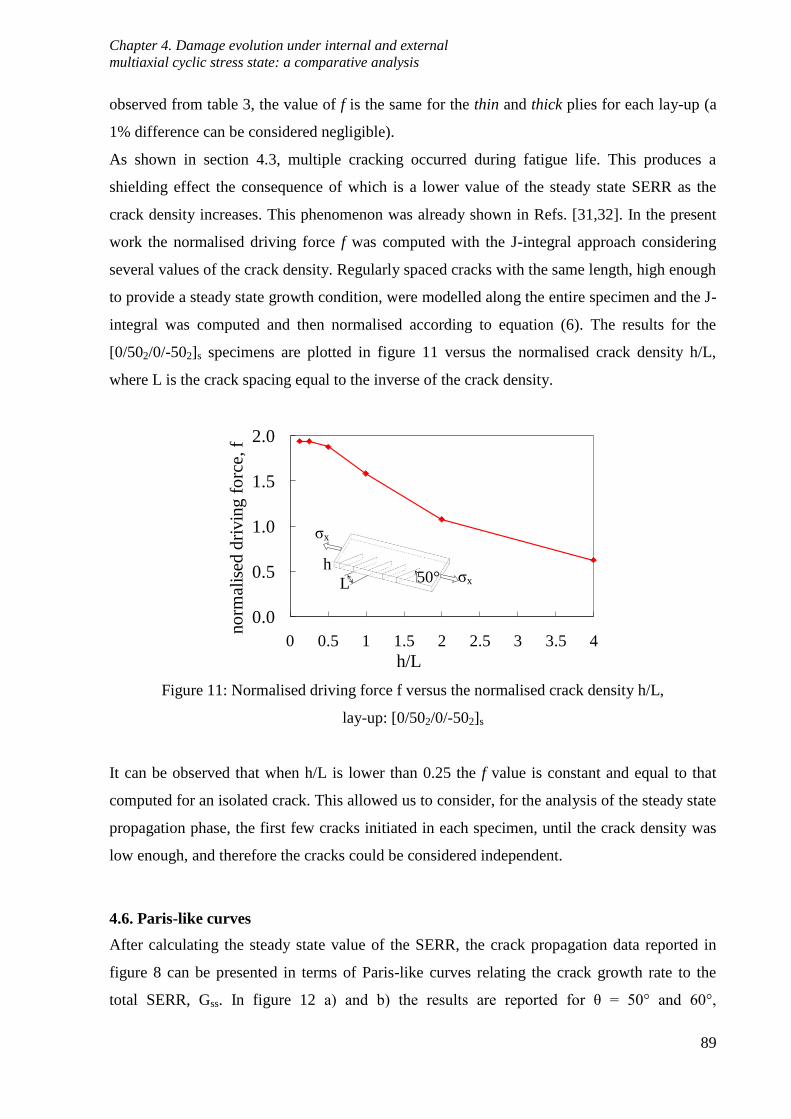
Chapter 4. Damage evolution under internal and external
multiaxial cyclic stress state: a comparative analysis
89
observed from table 3, the value of f is the same for the thin and thick plies for each lay-up (a
1% difference can be considered negligible).
As shown in section 4.3, multiple cracking occurred during fatigue life. This produces a
shielding effect the consequence of which is a lower value of the steady state SERR as the
crack density increases. This phenomenon was already shown in Refs. [31,32]. In the present
work the normalised driving force f was computed with the J-integral approach considering
several values of the crack density. Regularly spaced cracks with the same length, high enough
to provide a steady state growth condition, were modelled along the entire specimen and the J-
integral was computed and then normalised according to equation (6). The results for the
[0/502/0/-502]s specimens are plotted in figure 11 versus the normalised crack density h/L,
where L is the crack spacing equal to the inverse of the crack density.
Figure 11: Normalised driving force f versus the normalised crack density h/L,
lay-up: [0/502/0/-502]s
It can be observed that when h/L is lower than 0.25 the f value is constant and equal to that
computed for an isolated crack. This allowed us to consider, for the analysis of the steady state
propagation phase, the first few cracks initiated in each specimen, until the crack density was
low enough, and therefore the cracks could be considered independent.
4.6. Paris-like curves
After calculating the steady state value of the SERR, the crack propagation data reported in
figure 8 can be presented in terms of Paris-like curves relating the crack growth rate to the
total SERR, Gss. In figure 12 a) and b) the results are reported for θ = 50° and 60°,
0.0
0.5
1.0
1.5
2.0
0 0.5 1 1.5 2 2.5 3 3.5 4
no
rmal
ised
dri
vin
g f
orc
e, f
h/L
L
h
ζx
ζx 50°

Chapter 4. Damage evolution under internal and external
multiaxial cyclic stress state: a comparative analysis
90
respectively. It can be seen that in both cases the series of data for the thick and thin plies are
reasonably well collapsed in a single scatter band. This allows us to conclude that the steady
state SERR can be regarded as the driving force for the propagation of tunnelling cracks, as it
is suitable to capture correctly the influence of the layer thickness on the CGR.
In Fig. 12 a) and b) all data for the thick and thin plies were analysed together and fitted with
the typical power law CGR = C·Gtot,ssd represented by a solid line. The 90-10% scatter bands
are also calculated. The coefficients of the Paris-like curves are eventually reported in table 4.
Figure 12: Paris-like curves for a) [0/502/0/-502]s and b) [0/602/0/-602]s specimens
in terms of Gtot,ss and associate 10-90% scatter bands
Table 4: Coefficients of the Paris-like curves (when G tot,ss in kJ/m2 and CGR in mm/cycles)
Lay-up d C50% C90%
[0/502/0/-502]s 4.41 0.671 1.646
[0/602/0/-602]s 3.79 0.816 4.124
1.E-6
1.E-5
1.E-4
1.E-3
1.E-2
1.E-1
1.E+0
0.01 0.1 1
CG
R [
mm
/cyc
le]
Gss = GI,ss+GII,ss [kJ/m2]
thin (MM =0.65)
thick (MM = 0.65)
[0/502/0/-502]s
a)
1.E-6
1.E-5
1.E-4
1.E-3
1.E-2
1.E-1
1.E+0
0.01 0.1 1
CG
R [
mm
/cyc
le]
Gss = GI,ss+GII,ss [kJ/m2]
thin (MM=0.32)
thick (MM=0.32)
[0/602/0/-602]s
b)

Chapter 4. Damage evolution under internal and external
multiaxial cyclic stress state: a comparative analysis
91
4.7. Comparison with external multiaxial fatigue results
In this section the fatigue test results presented in this chapter are compared to those obtained
on tubular specimens, made of the same pre-preg material, presented in chapter 3 and Ref.
[14]. Glass/Epoxy tubes with lay-up [0F/90U,3/0F] were tested with R = 0.05. The attention was
focused on the initiation and propagation of cracks in the 90° UD plies, made of the UD-
400/REM tape. In figures 13 a) and b) the S-N data for the initiation of the first crack in the
90° layers of the tubes, taken from chapter 3, are shown and compared to those for the first
cracks initiation in the [0/θ2/0/-θ2]s laminates presented in section 4.3.
Figure 13: Comparison between the S-N data for the first cracks initiation for tubes [14] and
present results for a) [0/502/0/-502]s and b) [0/602/0/-602]s specimens
The tubes' results for λ12 = 1 are compared to those for the flat laminates with θ = 50°,
corresponding to a biaxiality ratio of 1.15, whereas the data for the tubes with λ12 = 0.5 are
compared to those of the flat specimens for θ = 60°, with biaxiality ratio equal to 0.57. In both
10
100
1E+02 1E+03 1E+04 1E+05 1E+06 1E+07
ζ2
,max
[MP
a]
Nf
thick (L12 = 1.15, R = 0.1)
thin (L12 = 1.15, R = 0.1)
tubes (L12 = 1, R = 0.05)
[0/502/0/-502]s λ12
λ12
λ12
a)
10
100
1.E+00 1.E+02 1.E+04 1.E+06
ζ2
,max
[MP
a]
Nf
thin (L12 = 0.57, R = 0.1)
thick (L12 = 0.57, R = 0.1)
tubes (L12 = 0.5, R = 0.05)
[0/602/0/-602]s
λ12
λ12
λ12 b)

Chapter 4. Damage evolution under internal and external
multiaxial cyclic stress state: a comparative analysis
92
cases it can be seen that the results are reasonably consistent. In particular the position of the
S-N data for the tubes are only slightly lower than those for the flat laminates, and this can be
due to small differences in the cured ply properties (fibre volume fraction for instance), the
constraining effect provided by the surrounding layers which are different for the two kinds of
samples and the presence of a certain amount of longitudinal stress ζ1 in the flat coupons. It
can also be noted that the slope of the curves is consistent, and this is a very important issue
since it represents the rate of the damage evolution during fatigue life, which is found to
depend on the local multiaxial stress state, no matter if the it is originated by external
multiaxial loads (tubes) or by the material anisotropy (flat specimens).
The crack growth data for the flat specimens presented in section 4.6 in terms of the total
SERR are also compared, in figure 14, to those obtained for the tubes with a similar multiaxial
condition, i.e. λ12 = 1 and 0.5 (MM = 0.56 and 0.25).
Figure 14: Comparison between the crack growth data for tubes [14] and present results for a)
[0/502/0/-502]s and b) [0/602/0/-602]s specimens
1.E-6
1.E-5
1.E-4
1.E-3
1.E-2
1.E-1
1.E+0
0.01 0.1 1
CG
R [
mm
/cyc
le]
Gss = GI,ss+GII,ss [kJ/m2]
thin (+50°, MM =0.65)
thick (-50°, MM = 0.65)
tubes (MM = 0.56)
1.E-6
1.E-5
1.E-4
1.E-3
1.E-2
1.E-1
1.E+0
0.01 0.1 1
CG
R [
mm
/cyc
le]
Gss = GI,ss+GII,ss [kJ/m2]
thin (+60°, MM=0.32)
thick (-60°, MM=0.32)
tubes (MM=0.25)
Chapter 4. Damage evolution under internal and external
multiaxial cyclic stress state: a comparative analysis
93
Also in this case it can be seen that the results for similar values of the MM are reasonably
consistent, confirming that the SERR is the driving force for the crack propagation, for a given
mode mixity.
It can be concluded that the damage initiation and evolution under fatigue loading depends on
the local multiaxial conditions only, expressed in terms of the ratios between the ply stresses
in the material reference system, or in terms of the mixity ratio between the mode I and II
components of the SERR. As a consequence, the characterisation of the multiaxial fatigue
behaviour of composite laminae and laminates could be carried out with flat specimens, taking
advantage of the local multiaxial stress state originated by the material anisotropy. This is far
easier than adopting more complicated test configurations in which external loads are applied
in multiple directions (tubes under tension/torsion for instance).
4.8. Conclusions
The results of an extensive experimental campaign in multidirectional glass/epoxy laminates
have been presented and discussed. The aim of the work was to compare the evolution fatigue
damage in these laminates with that measured on tubes tested under tension-torsion loading
conditions. The lay-up of the laminates was designed in such a way to introduce a local
multiaxial stress state comparable to that present in the tubes subjected to external multiaxial
loading.
The comparison of S-N data for the initiation of fatigue cracks and Paris-like curves indicates
that the evolution of fatigue damage in multidirectional laminates tested under uniaxial cyclic
loading and tubes tested under multiaxial external loading is basically the same, provided that
the local multiaxial stress states described in terms of biaxiality ratios are similar. This result is
very important in view of an extensive characterisation of the influence of multiaxial stress
state on the fatigue response of composite laminates.
Chapter 4. Damage evolution under internal and external
multiaxial cyclic stress state: a comparative analysis
94
References of chapter 4
[1] Quaresimin M, Susmel L, Talreja R. Fatigue behaviour and life assessment of
composite laminates under multiaxial loadings. International Journal of Fatigue 2010;
32: 2-16
[2] Diao X, Ye L, Mai YW. A statistical model of residual strength and fatigue life of
composite laminates. Composites Science and Technology 1995; 54: 329-336
[3] Shokrieh MM, Lessard LB. Multiaxial fatigue behaviour of unidirectional plies based
on uniaxial fatigue experiments-II. Experimental evaluation. International Journal of
Fatigue 1997; 19(3): 209-217
[4] Praveen GN, Reddy JN. Transverse matrix cracks in cross-ply laminates: stress
transfer, stiffness reduction and crack opening profiles. Acta Mechanica 1998; 130:
227-248
[5] Tserpes KI, Papanikos P, Labeas G, Pantelakis Sp. Fatigue damage accumulation and
residual strength assessment of CFRP laminates. Composite structures 2004; 63: 219-
230
[6] S. Adden, P. Horst, Stiffness degradation under fatigue in multiaxially loaded non-
crimped-fabrics, International Journal of Fatigue 32 (2010) 108–122
[7] Tong J, Guild FJ, Ogin SL, Smith PA. On matrix crack growth in quasi isotropic
laminates-I. Experimental investigation. . Composites Science and Technology 1997;
57: 1527-1535
[8] Tong J. Three Stages of Fatigue Crack Growth in GFRP Composite Laminates. Journal
of Engineering Materials and Technology 2001; 123: 139-143
[9] Sun Z, Daniel IM, Luo JJ. Modeling of fatigue damage in a polymer matrix composite.
Materials Science and Engineering 2003; A361: 302-311
[10] Wharmby AW, Ellyin F. Damage growth in constrained angle-ply laminates under
cyclic loading. Composites Science and Technology 2002; 62: 1239–1247
[11] Tohgo K, Nakagawa S, Kageyama K. Fatigue behaviour of CFRP cross-ply laminates
under on-axis and off-axis cyclic loading. International Journal of Fatigue 2006; 28:
1254-1262
[12] Adden S, Horst P. Damage propagation in non-crimp fabrics under bi-axial static and
fatigue loading. Composites Science and Technology 2006; 66: 626–633
[13] Quaresimin M, Carraro PA. On the investigation of the biaxial fatigue behaviour of
unidirectional composites. Composites Part B: Engineering 2013; 54 (1): 200-208

Chapter 4. Damage evolution under internal and external
multiaxial cyclic stress state: a comparative analysis
95
[14] Quaresimin M, Carraro PA. Damage initiation and evolution in glass/epoxy tubes
subjected to combined tension-torsion fatigue loading, DOI:
http://dx.doi.org/10.1016/j.ijfatigue.2014.01.002
[15] Found MS. Review of the multiaxial fatigue testing of fibre reinforced plastics. ASTM
Special Technical Publication 1985: 381-395
[16] Chen AS, Matthews FL. A review of multiaxial/biaxial loading tests for composite
materials. Composites 1993; 24(5): 395-406
[17] Olsson R. A survey of test methods for multiaxial and out-of-plane strength of
composite laminates. Composites Science and Technology 2011; 71: 773-783
[18] Carraro PA, Quaresimin M. A damage based model for crack initiation in
unidirectional composites under multiaxial cyclic loading, submitted to Composite
Science and Technology
[19] Hashin Z, Rotem A. A fatigue failure criterion for fibre-reinforced materials. Journal of
Composite Materials 1973; 7: 448-464
[20] El-Kadi H, Ellyin F. Effect of stress ratio on the fatigue of unidirectional fiber glass-
epoxy composite laminae. Composites 1994; 25: 917-924
[21] Kawai M, Yajima S, Hachinohe A, Takano Y. Off-axis fatigue behaviour of
unidirectional carbon fiber-reinforced composites at room and high temperatures.
Journal of Composites Materials 2001; 35: 545-576
[22] Ogin SL, Smith PA, Beaumont PWR. A Stress Intensity Factor Approach to the
Fatigue Growth of Transverse Ply Cracks. Composites Science and Technology 1985;
24: 47-59
[23] Tong J, Guild FJ, Ogin SL, Smith PA. Off-axis fatigue crack growth and the
associated energy release rate in composite laminates. Applied Composite Materials
1997; 4: 349-359
[24] Yokozeki T, Aoki T, Ishikawa T, Fatigue growth of matrix cracks in the transverse
direction of CFRP laminates. Composites Science and Technology 2002; 62: 1223-
1229
[25] Hosoi A, Arao Y, Kawada H. Transverse crack growth behavior considering free-edge
effect in quasi-isotropic CFRP laminates under high-cycle fatigue loading. Composites
Science and Technology 2009; 69: 1388-1393
[26] Zenkert D, Battley M. Foundations of Fibre Composites: Notes for the Course:
Composite Lightweight Structures.Risoe, DTU, 2006
Chapter 4. Damage evolution under internal and external
multiaxial cyclic stress state: a comparative analysis
96
[27] Lafarie-Frenot MC, Hénaff-Gardin C, Formation and Growth of 90° Ply Fatigue
Cracks in Carbon/Epoxy Laminates. Composites Science and Technology 1991; 40:
307-324
[28] Singh CV, Talreja R. A synergistic damage mechanics approach for composite
laminates with matrix cracks in multiple orientations. Mechanics of Materials 2009;
41: 954-968
[29] Sorensen BF, Talreja R. Analysis of damage in a ceramic matrix composite.
International Journal of Damage Mechanics 1993; 2: 246-271
[30] Nakamura T, Kamath SM. Three-dimensional effects in thin film fracture mechanics.
Mechanics of Materials 1992; 13(1): 67-77.
[31] Ho S, Suo Z. Tunnelling cracks in constrained layers. Journal of Applied Mechanics
1993; 60: 890-894
[32] Hutchinson JW, Suo Z. Mixed mode cracking in layered materials. Advances in
Applied Mechanics 1992; 29:63-191

Chapter 5. A damage based model for crack initiation in
unidirectional composites under multiaxial cyclic loading
97
5
A damage based model for crack initiation in
unidirectional composites under multiaxial cyclic
loading
5.1. Introduction
Most of the static and fatigue failure criteria for unidirectional (UD) composites are based on
macromechanical quantities such as the nominal stresses in the material coordinate system,
which are often used in a polynomial expression describing the failure condition. Tsai-Hill and
Tsai-Wu criteria are some classical examples for the static behaviour. An improvement to
them is achieved by Puck’s polynomial criterion [1], since it involves the macroscopic stresses
lying on the fracture plane. However, the last mentioned approach is still a macroscopic and
phenomenological criterion, thus not completely accounting, by definition, for the actual
damage mechanisms at the microscopic scale. With regards to the fatigue behaviour, some
empirical criteria are also available in the literature, providing sometimes inaccurate
predictions, as discussed in [2]. In addition, Kawai [3] extended the Tsai-Hill polynomial
criterion to fatigue, combining it with a continuum damage model to obtain a power law for
the S-N curves, but without taking into account the different damage mechanisms occurring
for different multiaxial conditions. Moreover, the description of the fatigue behaviour for both
fibre and matrix-dominated response with one equation only seems not consistent from a
physical point of view.
El-Kadi and Ellyin [4] proposed to use a polynomial expression involving the strain energy
density components instead of the stresses, each contribution being normalized with respect to
the static limit value. They obtained reasonable agreement with their own experimental data,
but the limitations of this criterion are the same already reported for that of Kawai.
Before those attempts, Hashin and Rotem [5] proposed a polynomial criterion, separating the
fibre and the matrix dominated behaviours, which have to be described with different
expressions, to be used depending on which is the critical component in the composite lamina
(fibre or matrix). In particular, for the matrix dominated behaviour they proposed to involve in

Chapter 5. A damage based model for crack initiation in
unidirectional composites under multiaxial cyclic loading
98
a polynomial expression only the transverse and in plane shear stresses, weighted by means of
fatigue functions to be experimentally calibrated.
The fibre and inter-fibre-related failure are treated separately also by the Puck's criterion based
on the fracture plane concept. This criterion, initially conceived for the static behaviour, was
extended to the case of cyclic loading by Sun and co-authors [6]. In spite of the merit of
treating separately the fibre and matrix dominated behaviours, the criteria proposed in Refs.
[5,6] still consider the macroscopic nominal stresses, involved in phenomenological
expressions, without accounting for the damage mechanisms occurring at the microscopic
scale, responsible for the lamina fatigue failure.
Concerning the non-fibre dominated behaviour, some efforts in the direction of considering
the local stresses (or micro-stresses) acting in the matrix have been published by Reifsneider
and Gao in 1991 [7]. They used the Mori-Tanaka theory in order to evaluate the average
transverse stress and in-plane shear stress in the matrix, involving them in a criterion similar to
that of Hashin, using fatigue functions of empirical derivation. In spite of the use of the local
average stresses, this is still a phenomenological criterion, and it requires a large experimental
effort for the model calibration.
In 1999 Plumtree and Cheng [8] developed a model based on the local stresses acting on the
fracture plane, defined as the plane normal to the transverse direction. According to this
definition of the fracture plane, the relevant stresses turned out to be the local transverse and in
plane shear stresses only, calculated by means of Finite Element (FE) analyses of a fibre-
matrix unit cell. In addition, reminiscent of Smith-Watson-Topper (SWT) criterion for metals
[9], they accounted for the presence of a non zero mean stress.
The aim of the present work is to define a damage based criterion, suitable to describe the non-
fibre-dominated fatigue behaviour, in terms of crack initiation, of UD laminae subjected to
multiaxial loading, characterized by the presence of the lamina stress components ζ1, ζ2 and ζ6
(see figure 1 for the definition of stresses).
It is very important to focus on the non-fibre-dominated behaviour because the fatigue life of a
multidirectional laminate is characterized, since the early stages, by the nucleation of multiple
matrix cracks in the off-axis plies (see Refs [10,11] among the others). This phenomenon is
responsible for the stiffness degradation of the laminate, and it is controlled by the matrix and
fibre-matrix interface dominated behaviour of a single unidirectional lamina.
It is also known that the multiaxiality of the stress state strongly influences the fatigue
behaviour of a UD lamina. Indeed, many works reporting off-axis fatigue test results show that
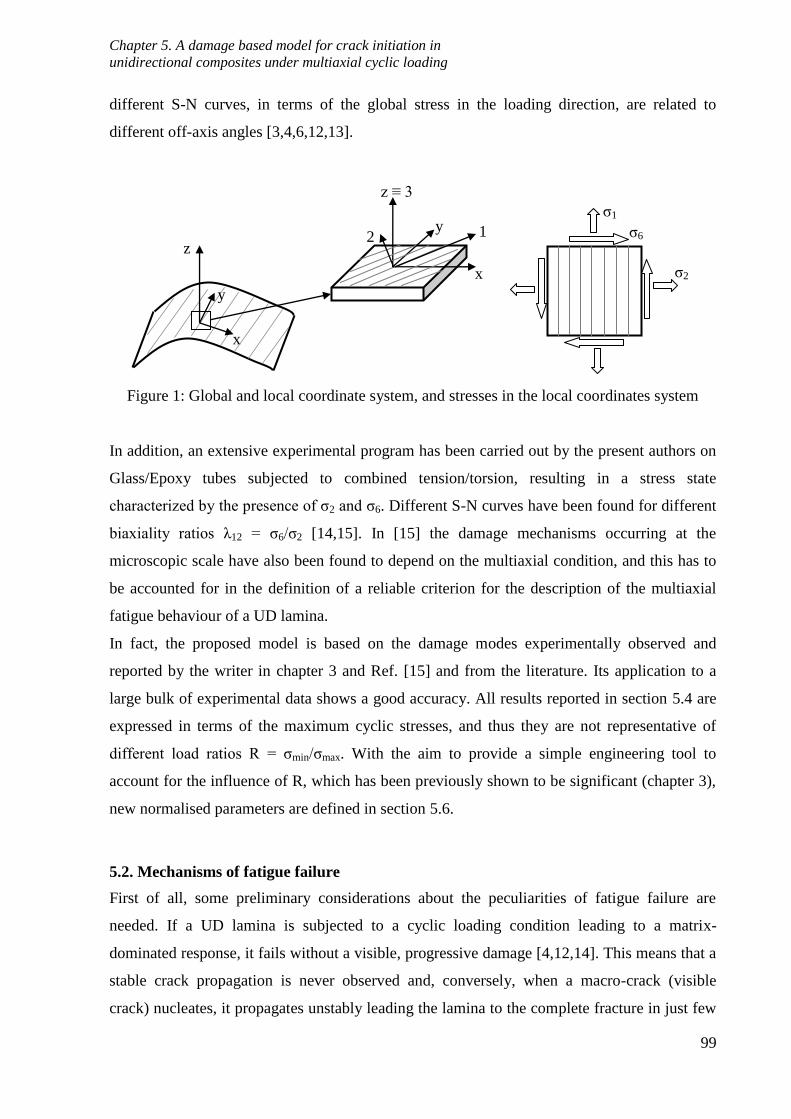
Chapter 5. A damage based model for crack initiation in
unidirectional composites under multiaxial cyclic loading
99
different S-N curves, in terms of the global stress in the loading direction, are related to
different off-axis angles [3,4,6,12,13].
Figure 1: Global and local coordinate system, and stresses in the local coordinates system
In addition, an extensive experimental program has been carried out by the present authors on
Glass/Epoxy tubes subjected to combined tension/torsion, resulting in a stress state
characterized by the presence of ζ2 and ζ6. Different S-N curves have been found for different
biaxiality ratios λ12 = ζ6/ζ2 [14,15]. In [15] the damage mechanisms occurring at the
microscopic scale have also been found to depend on the multiaxial condition, and this has to
be accounted for in the definition of a reliable criterion for the description of the multiaxial
fatigue behaviour of a UD lamina.
In fact, the proposed model is based on the damage modes experimentally observed and
reported by the writer in chapter 3 and Ref. [15] and from the literature. Its application to a
large bulk of experimental data shows a good accuracy. All results reported in section 5.4 are
expressed in terms of the maximum cyclic stresses, and thus they are not representative of
different load ratios R = ζmin/ζmax. With the aim to provide a simple engineering tool to
account for the influence of R, which has been previously shown to be significant (chapter 3),
new normalised parameters are defined in section 5.6.
5.2. Mechanisms of fatigue failure
First of all, some preliminary considerations about the peculiarities of fatigue failure are
needed. If a UD lamina is subjected to a cyclic loading condition leading to a matrix-
dominated response, it fails without a visible, progressive damage [4,12,14]. This means that a
stable crack propagation is never observed and, conversely, when a macro-crack (visible
crack) nucleates, it propagates unstably leading the lamina to the complete fracture in just few
x
y
z
x
y
z ≡ 3
1 2
ζ1
ζ6
ζ2

Chapter 5. A damage based model for crack initiation in
unidirectional composites under multiaxial cyclic loading
100
cycles. Therefore, from several experimental evidences, it can be concluded that the matrix-
dominated fatigue failure is controlled by the initiation phase, if the word “initiation” is
referred to a macro-crack parallel to the fibres. However, at a microscopic level, a progressive
and irreversible degradation process has to take place during fatigue life, otherwise the
decreasing trend of the fatigue S-N curves cannot be explained [16]. Thus, the cycles spent for
the initiation of a macro-crack are controlled by the damage evolution occurring at the
microscopic level. As a consequence, the definition of a multiaxial criterion consists in the
identification of the damage mechanisms at the microscopic scale and of the driving force for
their evolution. In order to do that, the concept of the local nucleation plane is introduced in
the following. As already mentioned, Puck’s criterion is based on the hypothesis that the
effective stresses to be considered as the cause of the static failure are the stresses lying on the
fracture plane.
According to Puck, in the case of positive values of ζ2 and ζ6, the fracture plane is always the
plane whose normal is the transverse direction (2-axis), and therefore the effective stresses are
the global stress components ζ2 and ζ6. The importance of the fracture plane is emphasized
also by Plumtree and Cheng [8], and also for them, in the case of an off-axis lamina, the stress
components to be accounted for are ζ2 and ζ6 only, because they act on the plane normal to the
2-direction. The main merit of their criterion is that it considers the local stresses in the matrix,
resulting from the concentrations due the presence of the fibres, instead of the global stresses.
It is important to point out that the fracture plane considered by Puck and by Plumtree-Cheng
is actually the plane where final separation occurs and it can be therefore defined as
macroscopic fracture plane. The actual fracture plane, in which the matrix micro-cracking and
the damage process occur is instead not parallel to the fibres, and this is confirmed by the
analysis of the fracture surfaces reported in [12,15] and by the experimental in-situ
observations reported in [17], clearly showing a damage evolution generating inclined micro-
cracks. In figure 2 the concept of the local nucleation plane is introduced, as the plane in
which the micro-damage occurs, the latter being identified in the matrix micro-cracks whose
accumulation and coalescence leads to the formation of a macro-crack.
According to these observations the driving force for this kind of damage evolution should be
searched in the stress components normal to the local nucleation plane. In the present thesis it
is assumed that the local nucleation plane is perpendicular to the local maximum principal
stress in the matrix. As a consequence, the effective stress to be considered is the Local
Maximum Principal Stress (LMPS) in the matrix, which has to be calculated by considering
the local stress fields, i.e. the micro-stresses. It can also be observed that the orientation of the

Chapter 5. A damage based model for crack initiation in
unidirectional composites under multiaxial cyclic loading
101
local nucleation plane, normal to the LMPS, is representative of the degree of multiaxiality of
the stress state at the microscopic scale.
Figure 2: Concept of the local nucleation plane
However, Asp et al.[18, 19] in 1996 proved that in the case of pure transverse tension the local
stress state at or close to the fibre-matrix interface is nearly hydrostatical. As a consequence
the failure occurs in the form of matrix cavitation and consequent brittle cracking at the fibre-
matrix interface. Therefore a suitable criterion for predicting the composite failure in the case
of pure transverse stress is based on reaching a critical value for the dilatational energy density
expressed in equation (1):
2
16
21I
EUv
(1)
where I1 is the first stress tensor invariant, which has to be calculated once again considering
the local stress fields. In [19] good agreement was found between predictions based on this
criterion and experimental results for the transverse static strength of a UD lamina.
Extending this finding also to the case of cyclic loading, it is reasonable to expect a change in
the leading damage mode moving from a loading condition near the pure transverse stress to
another one, characterized by the presence of an enough high shear stress component.
According to this idea the following criterion for multiaxial fatigue is proposed: two different
x
1 2
macroscopic fracture plane
local nucleation plane

Chapter 5. A damage based model for crack initiation in
unidirectional composites under multiaxial cyclic loading
102
parameters, representative of two different driving forces, have to be used for the
representation of the S-N curves for an UD lamina, according to the multiaxial condition:
- the peak of the Local Hydrostatic Stress (LHS = I1/3), for nearly pure transverse tension case;
- the peak of Local Maximum Principal Stress (LMPS) for enough high shear stress
component.
5.3. Calculation of the local stresses
As stated above, the driving forces for the microscopic damage evolution have to be expressed
in terms of local stresses (or micro-stresses) acting in the matrix and at the fibre-matrix
interface. In the present work a RVE with a regular square fibres array as in figure 3 is used
for the micro-stresses calculation. In spite of not being representative of a real composite
system, because of the non uniform fibres distribution of a real case, this RVE provides
reliable results for the application of the proposed multiaxial criterion. This conclusion can be
drawn after the detailed analysis of the possible effects of local fibre volume fraction and local
orientation of the fibre array presented in appendix 4.A. Because of the geometrical symmetry
only one quarter of a unit cell can be considered for the sake of stresses calculation, as shown
in figure 3.
Figure 3: Definition of the fibre-matrix unit cell for micromechanical analysis
The micro-stresses have been calculated by means of FE analyses of a fibre-matrix unit cell
subjected to the average (or macroscopic) stresses ζ1, ζ2 and ζ6. Periodic boundary conditions
shown in appendix 4.B have been applied to the surfaces of the quarter of the unit cell,
ζ1
ζ2
ζ6
ζ2
ζ6
ζ1
unidirectional lamina
fiber-matrix unit cell
1
2
3
r
θ
A B
P

Chapter 5. A damage based model for crack initiation in
unidirectional composites under multiaxial cyclic loading
103
according to [20]. In addition, the residual stresses due to the cooling process after curing have
been accounted for. Thermal loads have been applied as a uniform temperature gap ΔT = Tc -
Tr, where Tc is the curing temperature and Tr is the room temperature. Being the fatigue loads
rather low when compared to the static failure loads, the matrix behaviour is assumed to be
linear, and therefore linear elastic FE analyses have been carried out with the software ANSYS
11® using 20 nodes solid elements.
At each point P of the unit cell the mechanical micro-stresses in polar coordinates (r, θ, z) can
be defined in terms of stress concentration factors ki,jl relating the macro-stress ζi with the
local stress ζjl, as in equation (2). Finally the thermal stresses are related to the temperature
gap ΔT by means of thermal concentration factors hjl, as in equation (2).
1, 2,
1, 2,
1
1, 2,
2
1, 2,
6
6,
6,
0
0
0Δ
0 0
0 0 0
0 0 0
PP P
rr rrrr rr
υυ υυυυ υ
zz zzzz zz
rυ rυrυ
υzυz
rzrz
k kσ h
k kσ hσ
k kσ hσ T
k kσσ
kσ
kσ
(2)
The stress and thermal concentration factors are functions of the fibre volume fraction Vf and
of the elastic properties of the fibre/matrix system. The analyses reported later on the chapter
are for a typical glass/epoxy system. This is in view of the application of the criterion to the
fatigue data reported in chapters 2 and 3 (Refs [14,15]). Typical values for the tensile modulus
E, Poisson's ratio ν and Coefficients of Thermal Expansion (CTE) for the constituents have
been used in the analyses, and they are listed in table 1. In figures 4 and 5 the non vanishing
stress and thermal concentration factors are reported for the points A and B of the unit cell,
which are usually the most critical points as will be shown later on. It is worth mentioning
that, being the glass fibre much stiffer than epoxy, the value of the stress concentration factors
has a very low sensitivity to the tensile modulus of the matrix. In fact, if it is varied from 2000
to 4000 MPa, the maximum variation of the stress concentration factors is around 3%, which
can be considered negligible.
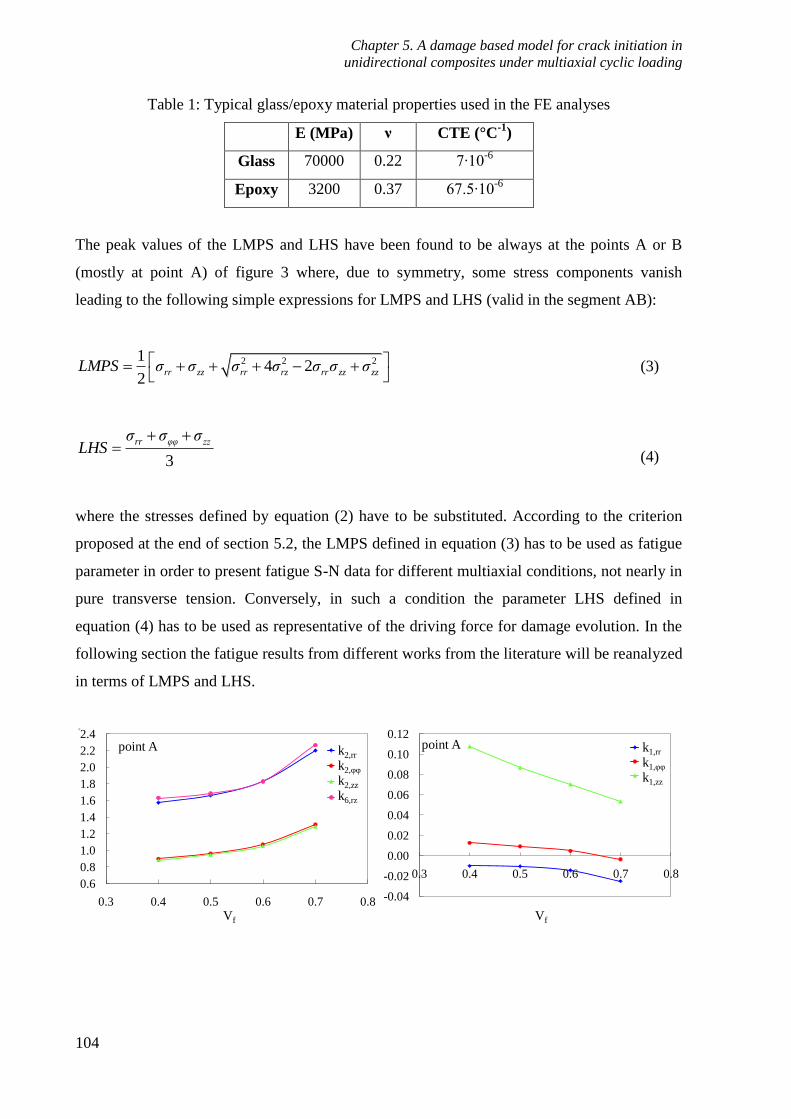
Chapter 5. A damage based model for crack initiation in
unidirectional composites under multiaxial cyclic loading
104
Table 1: Typical glass/epoxy material properties used in the FE analyses
E (MPa) ν CTE (°C-1
)
Glass 70000 0.22 7∙10-6
Epoxy 3200 0.37 67.5∙10-6
The peak values of the LMPS and LHS have been found to be always at the points A or B
(mostly at point A) of figure 3 where, due to symmetry, some stress components vanish
leading to the following simple expressions for LMPS and LHS (valid in the segment AB):
2 2 214 2
2rr zz rr rz rr zz zzLMPS σ σ σ σ σ σ σ
(3)
3
rr υυ zzσ σ σLHS
(4)
where the stresses defined by equation (2) have to be substituted. According to the criterion
proposed at the end of section 5.2, the LMPS defined in equation (3) has to be used as fatigue
parameter in order to present fatigue S-N data for different multiaxial conditions, not nearly in
pure transverse tension. Conversely, in such a condition the parameter LHS defined in
equation (4) has to be used as representative of the driving force for damage evolution. In the
following section the fatigue results from different works from the literature will be reanalyzed
in terms of LMPS and LHS.
0.6
0.8
1.0
1.2
1.4
1.6
1.8
2.0
2.2
2.4
0.3 0.4 0.5 0.6 0.7 0.8
Vf
k2rr
k2tt
k2zz
k6rz
k2,rr
k2,θθ
k2,zz
k6,rz
point A
υ
-0.04
-0.02
0.00
0.02
0.04
0.06
0.08
0.10
0.12
0.3 0.4 0.5 0.6 0.7 0.8
Vf
k1rr
k1tt
k1zz
point A k1,rr
k1,θθ
k1,zz
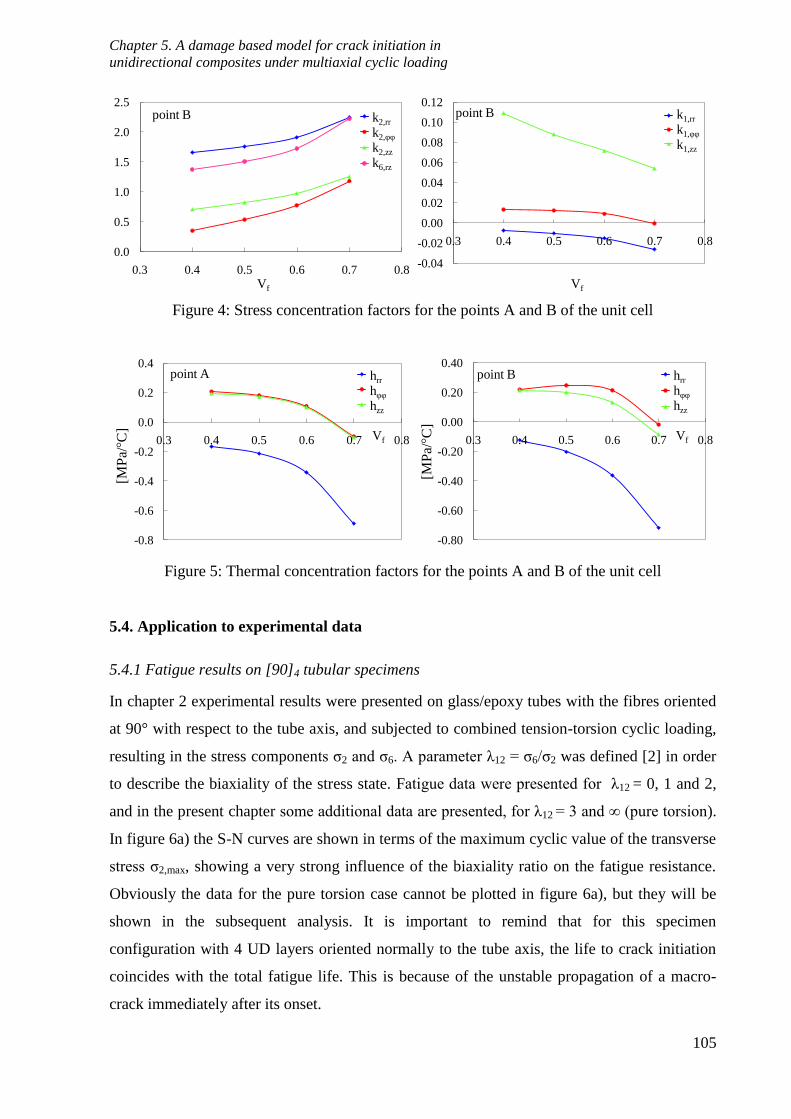
Chapter 5. A damage based model for crack initiation in
unidirectional composites under multiaxial cyclic loading
105
Figure 4: Stress concentration factors for the points A and B of the unit cell
Figure 5: Thermal concentration factors for the points A and B of the unit cell
5.4. Application to experimental data
5.4.1 Fatigue results on [90]4 tubular specimens
In chapter 2 experimental results were presented on glass/epoxy tubes with the fibres oriented
at 90° with respect to the tube axis, and subjected to combined tension-torsion cyclic loading,
resulting in the stress components ζ2 and ζ6. A parameter λ12 = ζ6/ζ2 was defined [2] in order
to describe the biaxiality of the stress state. Fatigue data were presented for λ12 = 0, 1 and 2,
and in the present chapter some additional data are presented, for λ12 = 3 and ∞ (pure torsion).
In figure 6a) the S-N curves are shown in terms of the maximum cyclic value of the transverse
stress ζ2,max, showing a very strong influence of the biaxiality ratio on the fatigue resistance.
Obviously the data for the pure torsion case cannot be plotted in figure 6a), but they will be
shown in the subsequent analysis. It is important to remind that for this specimen
configuration with 4 UD layers oriented normally to the tube axis, the life to crack initiation
coincides with the total fatigue life. This is because of the unstable propagation of a macro-
crack immediately after its onset.
0.0
0.5
1.0
1.5
2.0
2.5
0.3 0.4 0.5 0.6 0.7 0.8
Vf
k2rr
k2tt
k2zz
k6rz
point B k2,rr
k2,θθ
k2,zz
k6,rz
-0.04
-0.02
0.00
0.02
0.04
0.06
0.08
0.10
0.12
0.3 0.4 0.5 0.6 0.7 0.8
Vf
k1rr
k1tt
k1zz
point B k1,rr
k1,θθ
k1,zz
-0.8
-0.6
-0.4
-0.2
0.0
0.2
0.4
0.3 0.4 0.5 0.6 0.7 0.8
[MP
a/°C
]
Vf
Serie1
Serie2
Serie3
point A hrr
hθθ
hzz
-0.80
-0.60
-0.40
-0.20
0.00
0.20
0.40
0.3 0.4 0.5 0.6 0.7 0.8[M
Pa/
°C]
Vf
Serie1
Serie2
Serie3
point B hrr
hθθ
hzz
hrr
hθθ
hzz

Chapter 5. A damage based model for crack initiation in
unidirectional composites under multiaxial cyclic loading
106
In figure 6b) the fatigue data are plotted in terms of the maximum cyclic value of LMPS,
calculated by means of the micromechanical analysis described in section 5.3. It can be seen
that the curves for λ12 ≥ 1 are well collapsed into a narrow scatter band, indicating that, in
these conditions, the LMPS is representative of the driving force for the damage evolution
bringing the lamina to the fatigue failure. Fatigue data are fitted with a typical law in the form
Nf·LMPSk = C, and a statistical analysis is carried out assuming a log-normal distribution of
the number of cycles to failure. The scatter band in terms of LMPS for 90-10% probability of
survival is also shown, and the value of TLMPS, defined as LMPS10%/LMPS90% is reported for a
fatigue life of 106 cycles. The results of the statistical analysis for all the series of data
analysed are reported in table 2.
Lower values of LMPS are found for the curve corresponding to λ12 = 0 (pure transverse
stress). This is not surprising, since the hydrostatic component of the local stress tensor
becomes dominant in such a condition, becoming the leading driving force for the damage
progression, as reported in section 5.2. In fact, if all the curves are plotted in terms of the local
hydrostatic stress as in figure 5c), the pure tension curve exhibits higher values of LHS, which
can be considered in this case the driving force for the micro-damage evolution. Unfortunately
in this case the collapsing effect of this parameter cannot be shown because there are no other
fatigue curves characterized by a damage evolution driven by the hydrostatic stress
component.
Table 2: Results of the statistical analysis
Ref. specimen driving force k C 50% C 90% TLMPS or TLHS (106)
[15] [904] tubes LMPS 15.13 131.03 121.09 1.17
[15] [904] tubes LHS 16.67 67.2 61.03 1.21
[15] [0F/903/0F] tubes LMPS 13.22 166.84 148.29 1.27
[15] [0F/903/0F] tubes LHS 13.34 91.1 81.5 1.25
Ch.3 [0F/903/0F] tubes LMPS 21.14 155.3 145.3 1.14
Ch.3 [0F/903/0F] tubes LHS 25.89 77.3 71.9 1.13
[6] off-axis laminae LMPS 13.32 85.38 73.35 1.36
[4] off-axis laminae LMPS 11.13 158.4 131.17 1.46
[4] off-axis laminae LHS 14.47 67.94 52.91 1.65
[21] Constrained
off-axis laminae LMPS 9.82 267.02 244.84 1.19

Chapter 5. A damage based model for crack initiation in
unidirectional composites under multiaxial cyclic loading
107
Figure 6: Fatigue results for [90]4 tubes: maximum a)cyclic transverse stress [15], b)LMPS
and c)LHS against the number of cycles to failure Nf
5
50
1E+02 1E+03 1E+04 1E+05 1E+06 1E+07
ζ2
,max
[MP
a]
Nf
L12 = 0
L12 = 1
L12 = 2
Serie4
λ12 = 0
λ12 = 1
λ12 = 2
λ12 = 3
R = 0.05Vf = 0.55
ΔT = 135°C
a)
20
1E+02 1E+03 1E+04 1E+05 1E+06 1E+07
LM
PS
max
[MP
a]
Nf
L0
L1
L2
L3
L inf
λ12 = 0
λ12 = 1
λ12 = 2
λ12 = 3
λ12 = ∞
200
b)
TLMPS(106)=1.17
10
100
1E+02 1E+03 1E+04 1E+05 1E+06 1E+07
LH
Sm
ax[M
Pa]
Nf
L0
L1
L2
L3
λ12 = 0
λ12 = 1
λ12 = 2
λ12 = 3
c)
TLHS(106)=1.21

Chapter 5. A damage based model for crack initiation in
unidirectional composites under multiaxial cyclic loading
108
5.4.2 Fatigue results on [0F/903/0F] tubes
In [15] and chapter 3 of the present thesis fatigue tests have been carried out also on
[0F/903/0F] glass/epoxy tubes, where three layers of 90° UD plies have been constrained by an
external and internal thin fabric ply. For this kind of specimens, subjected to combined
tension-torsion as those of the previous section, the nucleation of the first crack on the 90°
layers was followed by its stable propagation in the circumferential direction, and eventually
by multiple cracking. However, in figure 7a) the S-N curves for the case R = 0.05 are reported
for the first transverse crack nucleation, in terms of the maximum cyclic transverse stress in
the 90° plies. Different curves are obtained for different values of the biaxiality ratio λ12, if
expressed in terms of the transverse stress, but a single and narrow scatter band in terms of
LMPS can be shown to describe fatigue data for λ12 = 1 and 2 (figure 7b). The curves related
to λ12 = 0.5 and most of all λ12 = 0 are instead characterized by lower values of LMPS, but
they can be reasonably described by a single scatter band in terms of LHS as shown in figure
7c), indicating that this is a good parameter to represent the damage driving force in this
loading conditions. Finally it is important to remark that, even if the material of the transverse
plies used in the [904] and [0F/903/0F] tubes is the same, the scatter bands defined for the first
kind of specimens cannot be directly used for the prediction of the first crack nucleation in the
[0F/903/0F] tubes. In fact the constraining effect due to the fabric 0° plies has to be considered,
as already highlighted in chapter 3.
5
50
1.E+03 1.E+04 1.E+05 1.E+06 1.E+07
ζ2
,max
[MP
a]
Life to first crack initiation, Nf
l12 = 0
l 12 = 0.5
l12 = 1
l12 = 2
λ12 = 0
λ12 = 0.5
λ12 = 1
λ12 = 2
R = 0.05Vf = 0.55
ΔT = 135°C a)

Chapter 5. A damage based model for crack initiation in
unidirectional composites under multiaxial cyclic loading
109
Figure 7: Fatigue results for [0F/903/0F] tubes with R = 0.05 [15]: maximum a)cyclic
transverse stress, b)LMPS and c)LHS against the number of cycles for first crack initiation Nf
Fatigue tests results for R = 0.5 and -1 were also reported in chapter 3.
The proposed criterion is applied also for the case R = 0.5, keeping in mind that the damage
mechanisms at the microscopic scale on the basis of which the criterion has been developed
have been observed only for positive load ratios.
The suitability of LMPS to collapse data for λ12 = 1 and 2 is shown in figure 8b), while figure
8c) shows that the curve for pure tension exhibits higher values of LHS, it being the only
condition in which the fatigue damage process is controlled by the local hydrostatic stress.
20
1.E+03 1.E+04 1.E+05 1.E+06 1.E+07
LM
PS
max
[MP
a]
Life to first crack initiation, Nf
L0
L 05
L1
L2
λ12 = 0
λ12 = 0.5
λ12 = 1
λ12 = 2
200TLMPS(106)=1.27
b)
10
100
1.E+03 1.E+04 1.E+05 1.E+06 1.E+07
LH
Sm
ax[M
Pa]
Life to first crack initiation, Nf
L0
L 05
L1
L2
λ12 = 0
λ12 = 0.5
λ12 = 1
λ12 = 2
TLHS(106)=1.25
c)

Chapter 5. A damage based model for crack initiation in
unidirectional composites under multiaxial cyclic loading
110
Figure 8: Fatigue results for [0F/903/0F] tubes with R = 0.5 [chapter 3]: maximum a)cyclic
transverse stress, b)LMPS and c)LHS against the number of cycles for first crack initiation Nf
10
100
1E+03 1E+04 1E+05 1E+06 1E+07
ζ2
max
[MP
a]
Cycles for first crack initiation, Nf
Serie4
Serie1
Serie2
R = 0.5
Vf = 0.55
ΔT = 135 °C
λ12 = 0
λ12 = 1
λ12 = 2
a)
20
1E+03 1E+04 1E+05 1E+06 1E+07
LM
PS
max
[MP
a]
Cycles for first crack initiation, Nf
L0
L 05
L1
λ12 = 0
λ12 = 1
λ12 = 2
200
b)
TLMPS(106) = 1.14
10
100
1E+03 1E+04 1E+05 1E+06 1E+07
LH
Sm
ax[M
Pa]
Cycles for first crack initiation, Nf
L0
L 05
L1
λ12 = 0
λ12 = 1
λ12 = 2 c)
TLHS(106) = 1.16

Chapter 5. A damage based model for crack initiation in
unidirectional composites under multiaxial cyclic loading
111
5.4.3 Fatigue results on flat specimens from Hashin and Rotem
In view of the equivalence of damage initiation for specimens under external and internal
multiaxial conditions, the criterion is now applied to results on flat laminae and laminates from
the literature and chapter 4.
Hashin and Rotem [6] presented the results of fatigue tests on flat UD laminae subjected to
off-axis loading, resulting in a multiaxial state with the presence of all the three in-plane stress
components. In figure 9a) the results are shown in terms of the maximum cyclic value of the
global applied stress in the loading direction ζx,max. Different fatigue curves are related to
different off-axis angles, if plotted in terms of the global stress, but they are well collapsed
into a single scatter band if LMPS is used to represent fatigue data, as can clearly shown by
figure 9b).
Figure 9: Fatigue results on flat specimens [6]: maximum a) cyclic global stress and b) LMPS
against the number of cycles to failure Nf
10
100
1000
1E+02 1E+03 1E+04 1E+05 1E+06
ζx,m
ax[M
Pa]
Nf
5° 10°
15° 20°
30° 60°
R = 0.1Vf = 0.6
ΔT = 130°C
a)
1
10
100
1E+02 1E+03 1E+04 1E+05 1E+06
LM
PS
max
[MP
a]
Nf
5° 10°
15° 20°
30° 60° b)
TLMPS(106)=1.36

Chapter 5. A damage based model for crack initiation in
unidirectional composites under multiaxial cyclic loading
112
In this case all the data, for off-axis angles from 5 to 60 degrees, are well described by the
LMPS, which turns out to be once again a suitable parameter to represent the driving force for
fatigue damage in loading conditions not nearly in pure transverse stress.
5.4.4 Fatigue results on flat specimens from El-Kadi and Ellyin
El-Kadi and Ellyin [4] tested flat unidirectional specimens subjected to cyclic off-axis loading
with three values of the load ratio R (-1, 0, 0.5). It is important to remember, once again, that
for the time being the criterion presented here is based on damage mechanisms observed in the
case of positive load ratios (i.e. with positive values of the transverse stress). In the case of
compressive stress components damage mechanisms could be different and therefore the
application of the criterion requires further investigation. In the following only the results for
R = 0 are shown, but the case of R = 0.5 leads to very similar conclusions. Figure 10a) shows
that different fatigue curves are obtained if the results are expressed in terms of the maximum
applied stress in the loading direction.
In figure 10b) the fatigue data are reanalyzed in terms of LMPS, and it can be noticed that the
data for off-axis angles of 19 and 45 degrees can be reasonably thought to be collapsed into a
single scatter band, while the other data clearly exhibit lower values of LMPS. In fact these
data for 71° and 90° are related to loading conditions characterized by a highly hydrostatical
local stress state and in fact they exhibit higher values of the LHS, as shown in figure 10c).
Data for 45° seem to be included in both the scatter bands, in terms of LMPS and LHS, and
this is probably because they are characterised by a stress state close to the point of transition
from one leading damage mode to the other. This transition point, or transition zone, is
believed to be a property of the composite system and it will be discussed in the next section.
10
100
1000
1E+02 1E+03 1E+04 1E+05 1E+06 1E+07
ζx,m
ax[M
Pa]
Nf
19° 45°
71° 90°
R = 0Vf = 0.525
ΔT = 130°C
a)
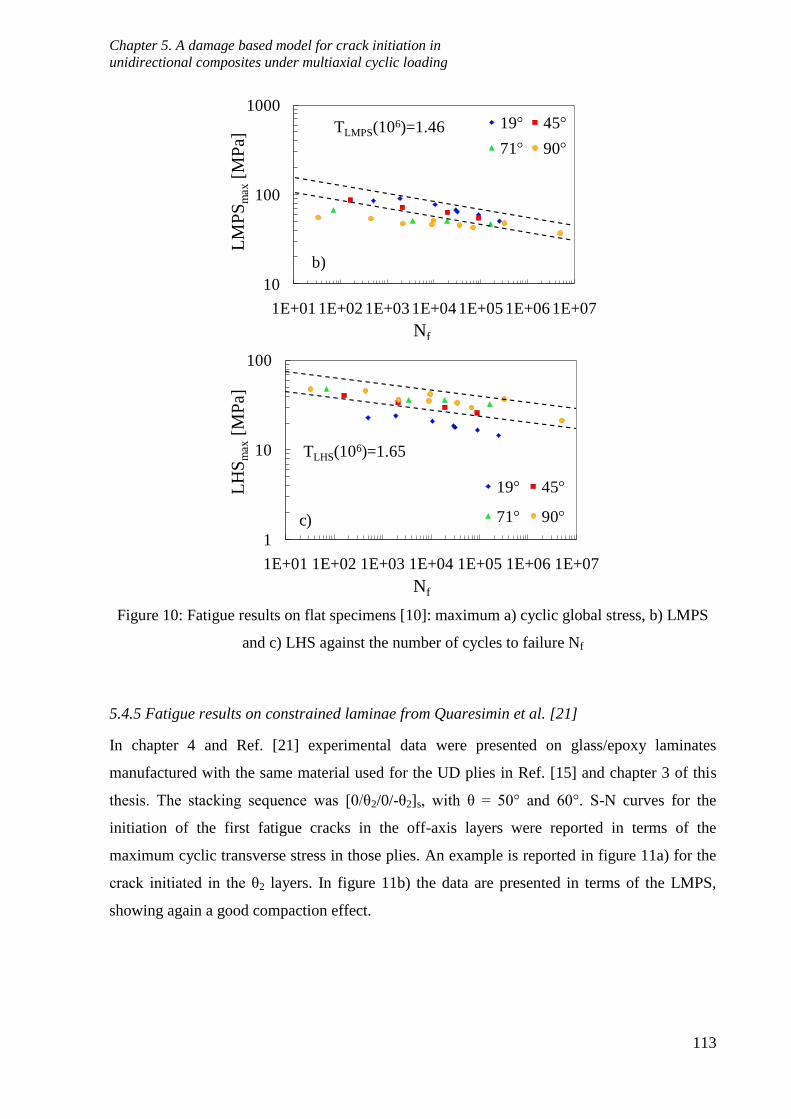
Chapter 5. A damage based model for crack initiation in
unidirectional composites under multiaxial cyclic loading
113
Figure 10: Fatigue results on flat specimens [10]: maximum a) cyclic global stress, b) LMPS
and c) LHS against the number of cycles to failure Nf
5.4.5 Fatigue results on constrained laminae from Quaresimin et al. [21]
In chapter 4 and Ref. [21] experimental data were presented on glass/epoxy laminates
manufactured with the same material used for the UD plies in Ref. [15] and chapter 3 of this
thesis. The stacking sequence was [0/θ2/0/-θ2]s, with θ = 50° and 60°. S-N curves for the
initiation of the first fatigue cracks in the off-axis layers were reported in terms of the
maximum cyclic transverse stress in those plies. An example is reported in figure 11a) for the
crack initiated in the θ2 layers. In figure 11b) the data are presented in terms of the LMPS,
showing again a good compaction effect.
10
100
1000
1E+01 1E+02 1E+03 1E+04 1E+05 1E+06 1E+07
LM
PS
max
[MP
a]
Nf
19° 45°
71° 90°
TLMPS(106)=1.46
b)
1
10
100
1E+01 1E+02 1E+03 1E+04 1E+05 1E+06 1E+07
LH
Sm
ax[M
Pa]
Nf
19° 45°
71° 90°
TLHS(106)=1.65
c)
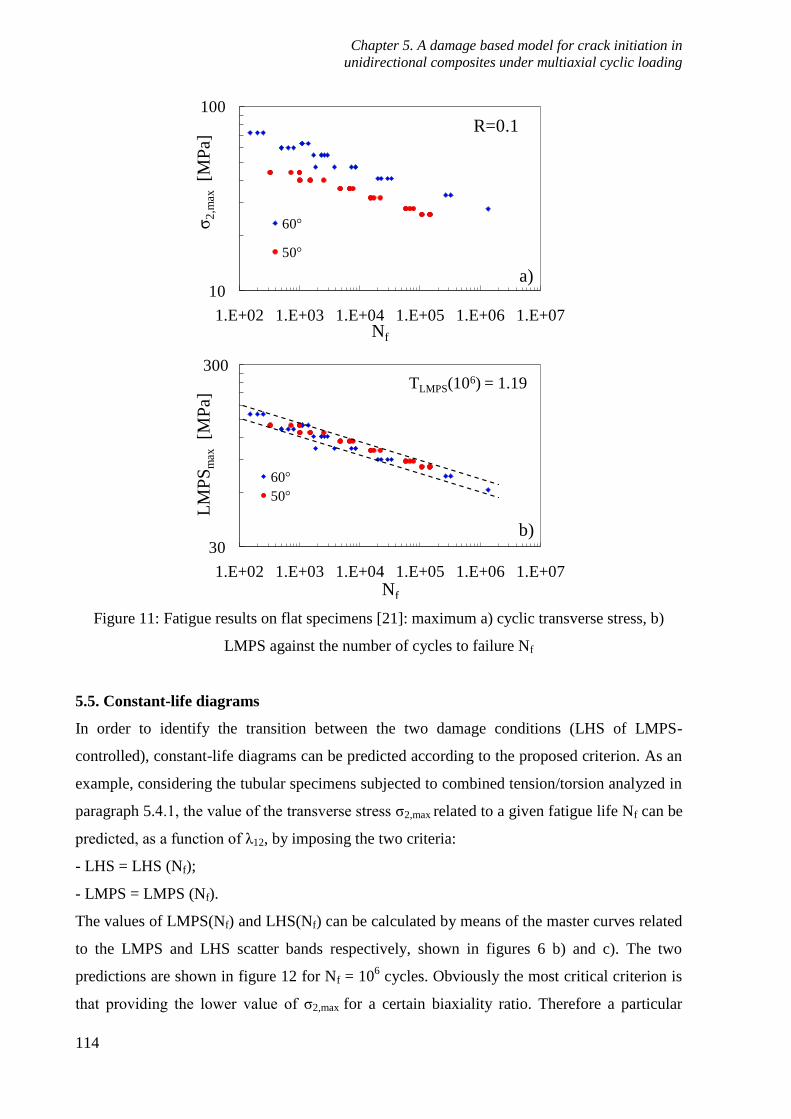
Chapter 5. A damage based model for crack initiation in
unidirectional composites under multiaxial cyclic loading
114
Figure 11: Fatigue results on flat specimens [21]: maximum a) cyclic transverse stress, b)
LMPS against the number of cycles to failure Nf
5.5. Constant-life diagrams
In order to identify the transition between the two damage conditions (LHS of LMPS-
controlled), constant-life diagrams can be predicted according to the proposed criterion. As an
example, considering the tubular specimens subjected to combined tension/torsion analyzed in
paragraph 5.4.1, the value of the transverse stress ζ2,max related to a given fatigue life Nf can be
predicted, as a function of λ12, by imposing the two criteria:
- LHS = LHS (Nf);
- LMPS = LMPS (Nf).
The values of LMPS(Nf) and LHS(Nf) can be calculated by means of the master curves related
to the LMPS and LHS scatter bands respectively, shown in figures 6 b) and c). The two
predictions are shown in figure 12 for Nf = 106 cycles. Obviously the most critical criterion is
that providing the lower value of ζ2,max for a certain biaxiality ratio. Therefore a particular
10
100
1.E+02 1.E+03 1.E+04 1.E+05 1.E+06 1.E+07
ζ2
,max
[MP
a]
Nf
60°
50°
R=0.1
a)
30
1.E+02 1.E+03 1.E+04 1.E+05 1.E+06 1.E+07
LM
PS
max
[MP
a]
Nf
60°
50°
b)
TLMPS(106) = 1.19 300

Chapter 5. A damage based model for crack initiation in
unidirectional composites under multiaxial cyclic loading
115
value λ12* can be identified as the transition between a hydrostatic stress and a maximum
principal stress driven fatigue failure. In reality there will not be a transition point, but instead
a transition zone which is however expected to occur around the point corresponding to λ12*,
which is a property of the composite system.
In the case of off-axis fatigue testing on the same material, constant-life diagrams can be
predicted in terms of the stress in the loading direction ζx as a function of the off-axis angle θ,
by means of the same procedure already exposed. An example is shown in figure 13.
Figure 12: Constant-life diagram for unidirectional tubes subjected to tension/torsion
Figure 13: Constant-life diagram for off-axis loaded unidirectional laminae
5.6. New parameters to account for the load ratio
Kawai in 2004 proposed to extend to composite laminae the well known and widely used
criterion for metals based on the simplified Haigh diagram to account for the influence of the
0
5
10
15
20
25
30
35
0 0.5 1 1.5 2
ζ2
[M
Pa]
λ12
2
Serie1
LHS
controlled
failure
LMPS
controlled
failure
λ12*
LHS=LHS(106)
LMPS=LMPS(106)
0
20
40
60
80
100
0 10 20 30 40 50 60 70 80 90
ζx [M
Pa]
θ
Serie1
Serie2
LHS
controlled
failure
LMPS
controlled
failure
θ*
LHS=LHS(106)
LMPS=LMPS(106)

Chapter 5. A damage based model for crack initiation in
unidirectional composites under multiaxial cyclic loading
116
load ratio R = ζmin/ζmax [23]. This empirical criterion consists in the definition of a normalised
parameter, called here in general Ψ, calculated as follows.
σΨ
σ σ
a
S m
(5)
The parameters ζa, ζm and ζS represent the cyclic stress amplitude, its mean value and the
static strength, respectively. Conceptually, this corresponds to normalise the stress amplitude
to the critical amplitude for static failure given by ζS-ζm, as shown in figure 14. In order to
account contemporary for the load ratio and the multiaxial condition, the general stress ζ in
equation (5) has to be substituted with the LMPS and LHS parameters, thus defining two new
parameters for the representation of the scatter bands and master curves for the matrix-
dominated fatigue behaviour (equations 6 and 7).
Ψ aLMPS
S m
LMPS
LMPS LMPS
(6)
Ψ aLHS
S m
LHS
LHS LHS
(7)
Figure 14: Stress cycle and critical amplitude
The values LMPSS and LHSS are the limit values for the local maximum principal stress and
local hydrostatic stress for static failure. Therefore, for the successful application of the new
parameters it is necessary that the crack initiation criterion proposed in section 5.2 holds also
for the static behaviour. In Table 3 the static strength data for the [0F/90U,3/0F] tubes and λ12 =
0, 1 and 2 presented in chapter 3 are re-analysed in terms of LHS and LMPS. It can be
time
ζ ζS
ζa ζm
critical amplitude
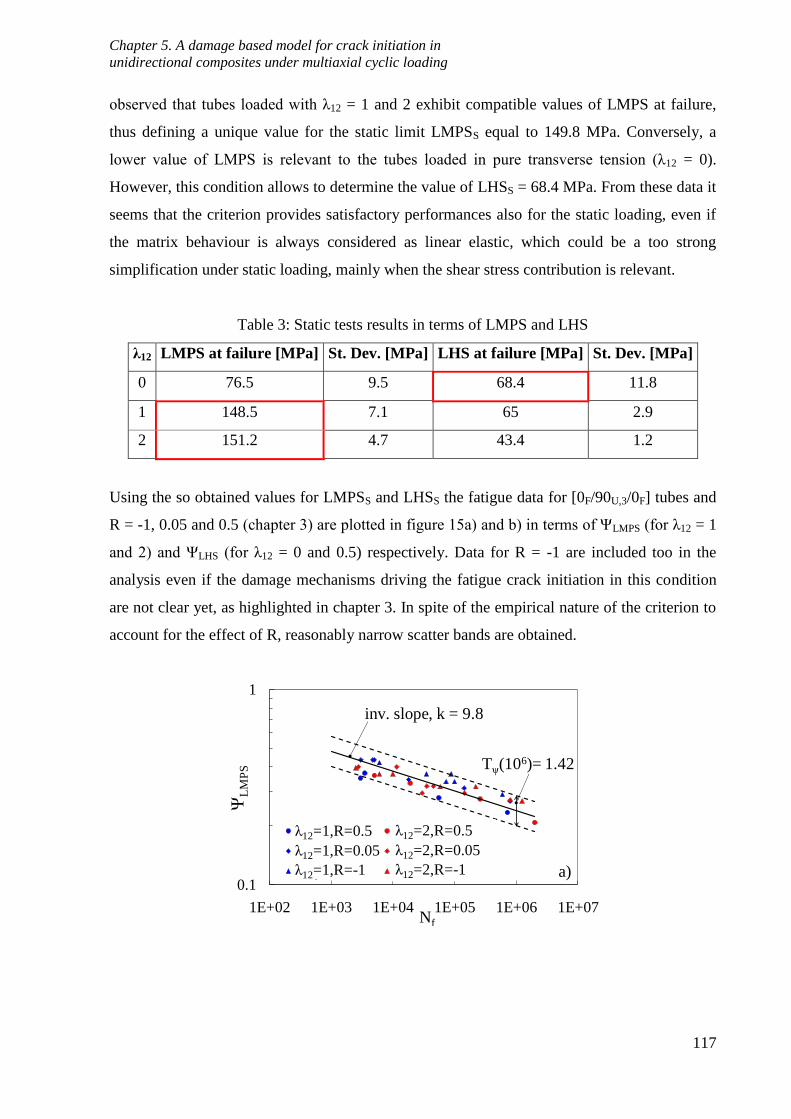
Chapter 5. A damage based model for crack initiation in
unidirectional composites under multiaxial cyclic loading
117
observed that tubes loaded with λ12 = 1 and 2 exhibit compatible values of LMPS at failure,
thus defining a unique value for the static limit LMPSS equal to 149.8 MPa. Conversely, a
lower value of LMPS is relevant to the tubes loaded in pure transverse tension (λ12 = 0).
However, this condition allows to determine the value of LHSS = 68.4 MPa. From these data it
seems that the criterion provides satisfactory performances also for the static loading, even if
the matrix behaviour is always considered as linear elastic, which could be a too strong
simplification under static loading, mainly when the shear stress contribution is relevant.
Table 3: Static tests results in terms of LMPS and LHS
λ12 LMPS at failure [MPa] St. Dev. [MPa] LHS at failure [MPa] St. Dev. [MPa]
0 76.5 9.5 68.4 11.8
1 148.5 7.1 65 2.9
2 151.2 4.7 43.4 1.2
Using the so obtained values for LMPSS and LHSS the fatigue data for [0F/90U,3/0F] tubes and
R = -1, 0.05 and 0.5 (chapter 3) are plotted in figure 15a) and b) in terms of ΨLMPS (for λ12 = 1
and 2) and ΨLHS (for λ12 = 0 and 0.5) respectively. Data for R = -1 are included too in the
analysis even if the damage mechanisms driving the fatigue crack initiation in this condition
are not clear yet, as highlighted in chapter 3. In spite of the empirical nature of the criterion to
account for the effect of R, reasonably narrow scatter bands are obtained.
0.1
1
1E+02 1E+03 1E+04 1E+05 1E+06 1E+07
ΨL
MP
S
Nf
L1, R05 L2, R05
L1, R0 L2, R0
L1, R-1 L2, R-1
λ12=1,R=0.5
λ12=1,R=0.05
λ12=1,R=-1
λ12=2,R=0.5
λ12=2,R=0.05
λ12=2,R=-1
inv. slope, k = 9.8
Tψ(106)= 1.42
a)
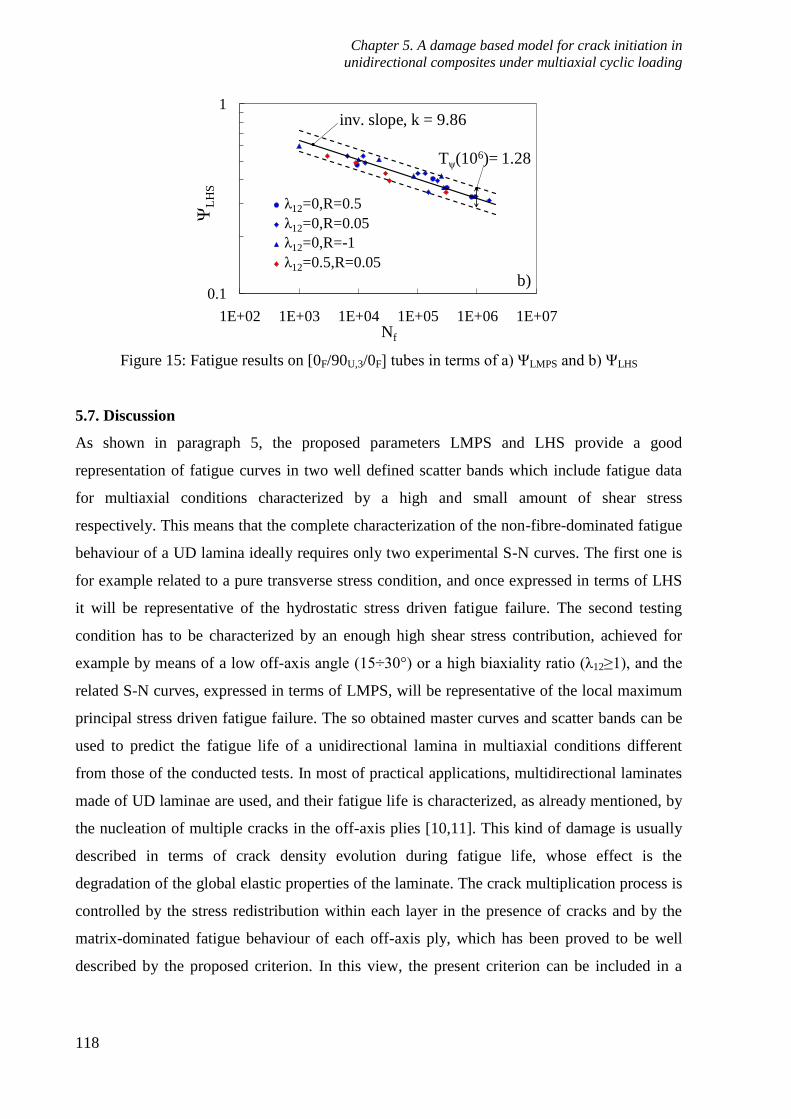
Chapter 5. A damage based model for crack initiation in
unidirectional composites under multiaxial cyclic loading
118
Figure 15: Fatigue results on [0F/90U,3/0F] tubes in terms of a) ΨLMPS and b) ΨLHS
5.7. Discussion
As shown in paragraph 5, the proposed parameters LMPS and LHS provide a good
representation of fatigue curves in two well defined scatter bands which include fatigue data
for multiaxial conditions characterized by a high and small amount of shear stress
respectively. This means that the complete characterization of the non-fibre-dominated fatigue
behaviour of a UD lamina ideally requires only two experimental S-N curves. The first one is
for example related to a pure transverse stress condition, and once expressed in terms of LHS
it will be representative of the hydrostatic stress driven fatigue failure. The second testing
condition has to be characterized by an enough high shear stress contribution, achieved for
example by means of a low off-axis angle (15÷30°) or a high biaxiality ratio (λ12≥1), and the
related S-N curves, expressed in terms of LMPS, will be representative of the local maximum
principal stress driven fatigue failure. The so obtained master curves and scatter bands can be
used to predict the fatigue life of a unidirectional lamina in multiaxial conditions different
from those of the conducted tests. In most of practical applications, multidirectional laminates
made of UD laminae are used, and their fatigue life is characterized, as already mentioned, by
the nucleation of multiple cracks in the off-axis plies [10,11]. This kind of damage is usually
described in terms of crack density evolution during fatigue life, whose effect is the
degradation of the global elastic properties of the laminate. The crack multiplication process is
controlled by the stress redistribution within each layer in the presence of cracks and by the
matrix-dominated fatigue behaviour of each off-axis ply, which has been proved to be well
described by the proposed criterion. In this view, the present criterion can be included in a
0.1
1
1E+02 1E+03 1E+04 1E+05 1E+06 1E+07
ΨL
HS
Nf
L0, R05
L0, R0
L0, R-1
L05, R0
λ12=0,R=0.5
λ12=0,R=0.05
λ12=0,R=-1
λ12=0.5,R=0.05
inv. slope, k = 9.86
Tψ(106)= 1.28
b)

Chapter 5. A damage based model for crack initiation in
unidirectional composites under multiaxial cyclic loading
119
model for the prediction of the crack density evolution in multidirectional laminates, which is
presented in chapter 6.
5.8. Conclusions
A criterion for the description of the matrix-dominated fatigue behaviour of UD laminae has
been proposed, suitable to deal with multiaxial conditions. This has been done by identifying
the parameters representative of the driving force for damage evolution at the microscopic
scale, responsible for a macro-crack initiation. According to experimental observations, the
concept of the local nucleation plane has been introduced and it has been identified as the
plane normal to the Local Maximum Principal Stress (LMPS) calculated by means of
micromechanical tools. The LMPS parameter has been found to collapse in one single scatter
band the fatigue curves related to multiaxial loading conditions, not in nearly pure transverse
stress. In fact it is proved that in such conditions the local stress state in the matrix is highly
hydrostatical, and it is reasonable to assume that this produces a change in the leading damage
mode and therefore in the parameter to be used as representative of the driving force. In this
work the local value of the hydrostatic stress (LHS) has been shown to be a good parameter to
collect fatigue data in the case of loading conditions with a low shear stress, compared to the
transverse stress. Therefore only two scatter bands, and related master curves, can be used for
multiaxial fatigue design of composite laminae, depending on the multiaxial stress state. The
condition corresponding to the transition between the two leading damage modes is a property
of the composite system and it can be easily calculated. Finally, it is remarked that the present
criterion is based on damage mechanisms observed for positive load ratios and therefore its
validity is theoretically restricted to this range. Further research is needed to understand the
mechanisms at the basis of fatigue failure when R < 0. Eventually a simple criterion has been
proposed to account for the influence of the load ratio which is shown, however, to collapse
fatigue data for different R in a single scatter band.
Acknowledgements
Thanks to Mr. Alessandro Pontefisso for the generation of the random fibres array in figure
A1 in appendix 4.A.
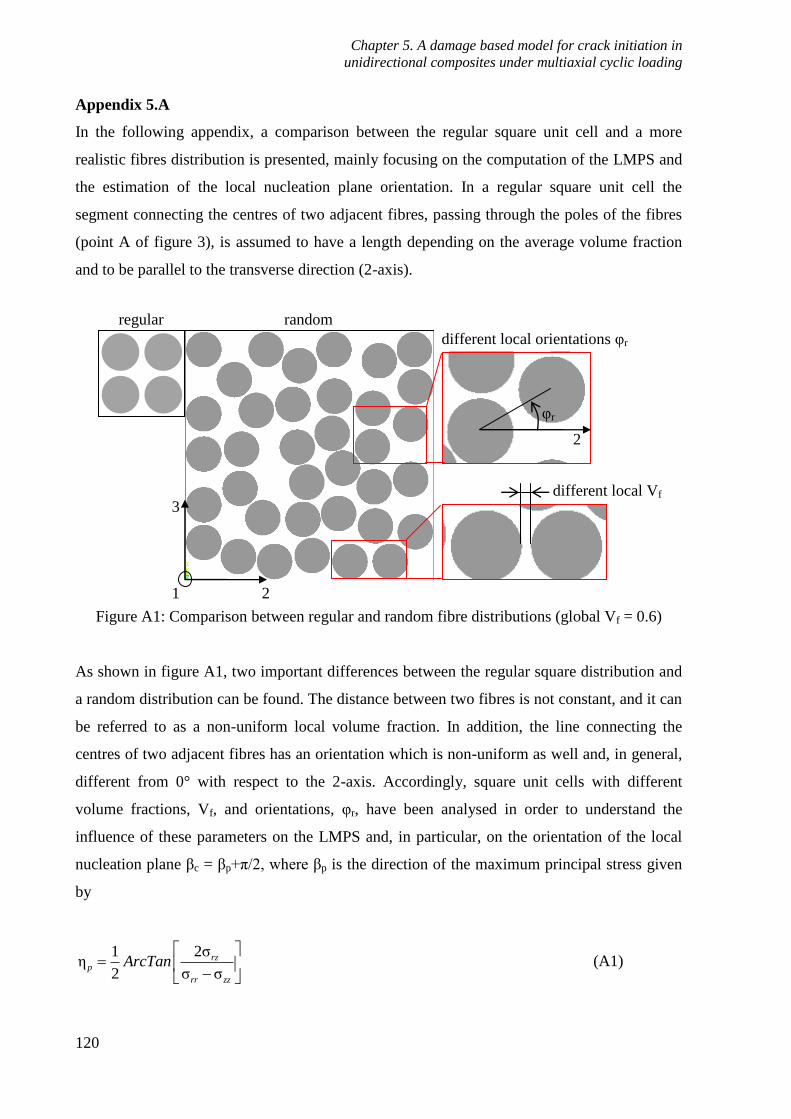
Chapter 5. A damage based model for crack initiation in
unidirectional composites under multiaxial cyclic loading
120
Appendix 5.A
In the following appendix, a comparison between the regular square unit cell and a more
realistic fibres distribution is presented, mainly focusing on the computation of the LMPS and
the estimation of the local nucleation plane orientation. In a regular square unit cell the
segment connecting the centres of two adjacent fibres, passing through the poles of the fibres
(point A of figure 3), is assumed to have a length depending on the average volume fraction
and to be parallel to the transverse direction (2-axis).
Figure A1: Comparison between regular and random fibre distributions (global Vf = 0.6)
As shown in figure A1, two important differences between the regular square distribution and
a random distribution can be found. The distance between two fibres is not constant, and it can
be referred to as a non-uniform local volume fraction. In addition, the line connecting the
centres of two adjacent fibres has an orientation which is non-uniform as well and, in general,
different from 0° with respect to the 2-axis. Accordingly, square unit cells with different
volume fractions, Vf, and orientations, θr, have been analysed in order to understand the
influence of these parameters on the LMPS and, in particular, on the orientation of the local
nucleation plane βc = βp+π/2, where βp is the direction of the maximum principal stress given
by
2σ1η
2 σ σ
rzp
rr zz
ArcTan
(A1)
1
3
2
different local Vf
θr
2
different local orientations θr
regular random
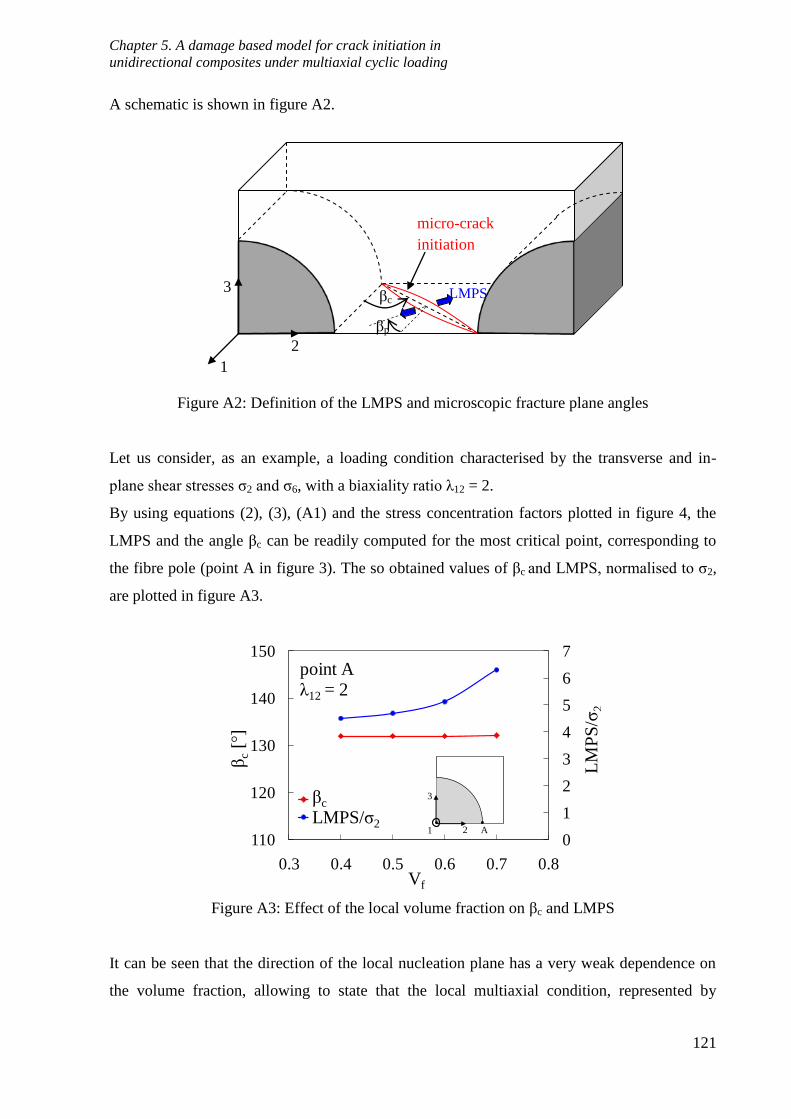
Chapter 5. A damage based model for crack initiation in
unidirectional composites under multiaxial cyclic loading
121
A schematic is shown in figure A2.
Figure A2: Definition of the LMPS and microscopic fracture plane angles
Let us consider, as an example, a loading condition characterised by the transverse and in-
plane shear stresses ζ2 and ζ6, with a biaxiality ratio λ12 = 2.
By using equations (2), (3), (A1) and the stress concentration factors plotted in figure 4, the
LMPS and the angle βc can be readily computed for the most critical point, corresponding to
the fibre pole (point A in figure 3). The so obtained values of βc and LMPS, normalised to ζ2,
are plotted in figure A3.
Figure A3: Effect of the local volume fraction on βc and LMPS
It can be seen that the direction of the local nucleation plane has a very weak dependence on
the volume fraction, allowing to state that the local multiaxial condition, represented by
0
1
2
3
4
5
6
7
110
120
130
140
150
0.3 0.4 0.5 0.6 0.7 0.8
LM
PS
/ζ2
βc
[°]
Vf
Serie1
Serie2
βc
LMPS/ζ2
point Aλ12 = 2
2 1
3
A
βc LMPS
micro-crack
initiation
1
2
3
βp

Chapter 5. A damage based model for crack initiation in
unidirectional composites under multiaxial cyclic loading
122
orientation of the local nucleation plane itself, does not change with the local volume fraction.
Conversely, appreciable variations of the LMPS can be observed, but this does not affect the
validity of the LMPS as a multiaxial fatigue parameter, since its critical value, for a given
number of cycles, is a property of the composite system considered, which must be calibrated
on at least one series of experimental data, thus accounting for the actual distribution of fibres.
In other words, we can say that the way that the global stresses ζ1, ζ2, ζ6 are combined for the
calculation of the LMPS depends only on the angle βc. As it is invariant with the local volume
fraction, the capability of the LMPS to synthesise data for different multiaxial conditions is
preserved. When considering the effect of the unit cell orientation, the local system 1',2',3' is
rotated of an angle θr with respect to the material system 1,2,3, as shown in figure A4. From
the computational point of view, similarly to the method proposed in [22], the unit cell has not
been rotated in the FE code, and the average stress components, given by the vector {ζ'}, have
been applied to the boundary of the unit cell, always respecting the periodicity conditions. The
vector {ζ'} can be easily calculated by rotating the in plane stresses as follows.
1
2
2
2
3
1 2 6
12
23
31
σ ' 01 0
σ ' 00 (υ )
σ ' 00 (υ )σ ' σ σ σ
σ ' (υ )0 0
σ ' 00 (υ ) (υ )
σ ' (υ )0 0
r
r
r
r r
r
Cos
Sin
Cos
Cos Sin
Sin
(A2)
Figure A4: Rotated local coordinates system and rotation of stress components
2
2'
3'
3
1 ≡ 1'
ζ2 ζ2 ζ6 ζ6
ζ1
ζ1
2'
3'
1'
ζ1'
ζ2'
ζ3'
ζ21' ζ12'
ζ13'
ζ31' ζ23'
ζ32'
stress rotation θr
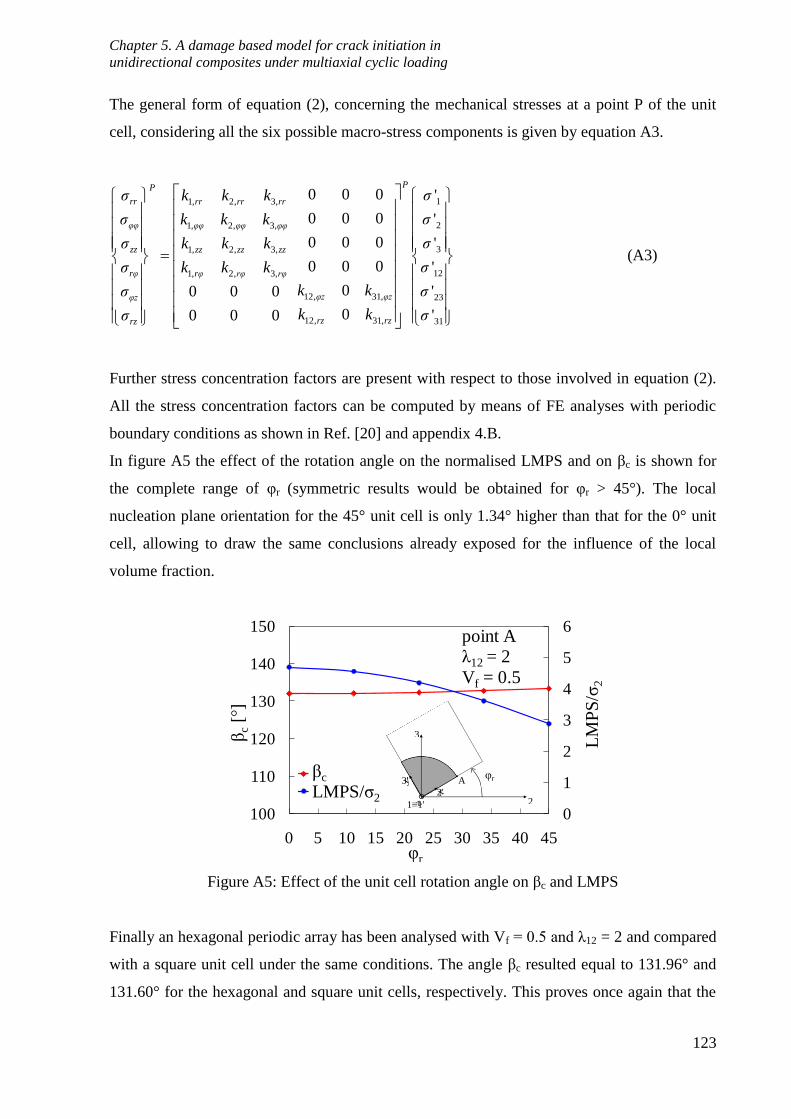
Chapter 5. A damage based model for crack initiation in
unidirectional composites under multiaxial cyclic loading
123
The general form of equation (2), concerning the mechanical stresses at a point P of the unit
cell, considering all the six possible macro-stress components is given by equation A3.
11, 2, 3,
21, 2, 3,
31, 2, 3,
121, 2, 3,
12, 31, 23
12, 31, 31
0 0 0 '
0 0 0 '
0 0 0 '
0 0 0 '
0 '0 0 0
0 '0 0 0
PP
rr rr rr rr
υυ υυ υυ υυ
zz zz zz zz
rυ rυ rυ rυ
υz υzυz
rz rzrz
σσ k k k
σσ k k k
σσ k k k
σσ k k k
k k σσ
k k σσ
(A3)
Further stress concentration factors are present with respect to those involved in equation (2).
All the stress concentration factors can be computed by means of FE analyses with periodic
boundary conditions as shown in Ref. [20] and appendix 4.B.
In figure A5 the effect of the rotation angle on the normalised LMPS and on βc is shown for
the complete range of θr (symmetric results would be obtained for θr > 45°). The local
nucleation plane orientation for the 45° unit cell is only 1.34° higher than that for the 0° unit
cell, allowing to draw the same conclusions already exposed for the influence of the local
volume fraction.
Figure A5: Effect of the unit cell rotation angle on βc and LMPS
Finally an hexagonal periodic array has been analysed with Vf = 0.5 and λ12 = 2 and compared
with a square unit cell under the same conditions. The angle βc resulted equal to 131.96° and
131.60° for the hexagonal and square unit cells, respectively. This proves once again that the
0
1
2
3
4
5
6
100
110
120
130
140
150
0 5 10 15 20 25 30 35 40 45
LM
PS
/ζ2
βc
[°]
θr
Serie1
Serie2
point Aλ12 = 2
Vf = 0.5
βc
LMPS/ζ2
y
x
z
3'
2'
1≡1'
θr
2
3
A θr
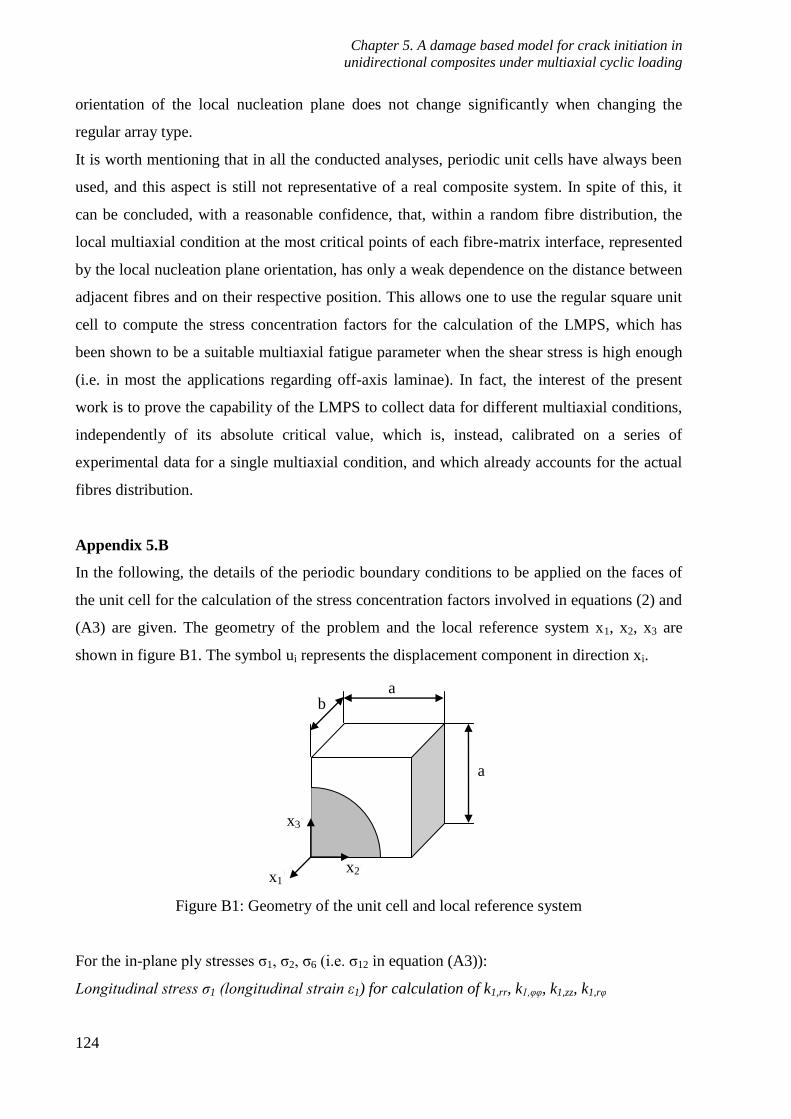
Chapter 5. A damage based model for crack initiation in
unidirectional composites under multiaxial cyclic loading
124
orientation of the local nucleation plane does not change significantly when changing the
regular array type.
It is worth mentioning that in all the conducted analyses, periodic unit cells have always been
used, and this aspect is still not representative of a real composite system. In spite of this, it
can be concluded, with a reasonable confidence, that, within a random fibre distribution, the
local multiaxial condition at the most critical points of each fibre-matrix interface, represented
by the local nucleation plane orientation, has only a weak dependence on the distance between
adjacent fibres and on their respective position. This allows one to use the regular square unit
cell to compute the stress concentration factors for the calculation of the LMPS, which has
been shown to be a suitable multiaxial fatigue parameter when the shear stress is high enough
(i.e. in most the applications regarding off-axis laminae). In fact, the interest of the present
work is to prove the capability of the LMPS to collect data for different multiaxial conditions,
independently of its absolute critical value, which is, instead, calibrated on a series of
experimental data for a single multiaxial condition, and which already accounts for the actual
fibres distribution.
Appendix 5.B
In the following, the details of the periodic boundary conditions to be applied on the faces of
the unit cell for the calculation of the stress concentration factors involved in equations (2) and
(A3) are given. The geometry of the problem and the local reference system x1, x2, x3 are
shown in figure B1. The symbol ui represents the displacement component in direction xi.
Figure B1: Geometry of the unit cell and local reference system
For the in-plane ply stresses ζ1, ζ2, ζ6 (i.e. ζ12 in equation (A3)):
Longitudinal stress σ1 (longitudinal strain ε1) for calculation of k1,rr, k1,φφ, k1,zz, k1,rφ
x2'
x3'
x1'
b a
a

Chapter 5. A damage based model for crack initiation in
unidirectional composites under multiaxial cyclic loading
125
- u2 = 0 on x2 = 0;
- u3 = 0 on x3 = 0;
- u1 = b·ε1 on x1 = 0;
- u1 = 0 on x1 = -b;
- u2 = const on x2 = a;
- u3 = const on x3 = a;
Transverse stress σ2 (transverse strain ε2) for calculation of k2,rr, k2, φφ, k2,zz, k2,rφ
- u2 = 0 on x2 = 0;
- u3 = 0 on x3 = 0;
- u2 = a·ε2 on x2 = a;
- u1 = 0 on x1 = -b;
- u1 = const on x1 = 0;
- u3 = const on x3 = a;
Shear stress σ6, i.e. σ12 in equation (A3) (shear strain γ12) for calculation of k6, φz, k6,rz,(k12, φz,
k12,rz in equation (A3))
- u2 = u3 = 0 on x2 = 0;
- u3 = 0 on x3 = 0;
- u1 = a·γ12 on x2 = a;
- u1 = 0 on x1 = -b;
- u2 = 0 on x2 = a;
- u3 = 0 on x3 = a;
- u1(0, x2, x3) = u1(-b, x2, x3);
- u2(0, x2, x3) = u2(-b, x2, x3);
- u3(0, x2, x3) = u3(-b, x2, x3);
For the out-of-plane ply stresses ζ3, ζ13, ζ23
Normal stress σ3 (strain ε3) for calculation of k3,rr, k3, φφ, k3,zz, k3,rφ
- Stress fields are those for the transverse stress ζ2 rotated of an angle φ = π/2;
Shear stress σ31, (shear strain γ31) for calculation of k31, φz, k31,rz
- Stress fields are those for the shear stress ζ6 rotated of an angle θ = π/2;

Chapter 5. A damage based model for crack initiation in
unidirectional composites under multiaxial cyclic loading
126
Shear stress σ23 (shear strain ε23) for calculation of k23,rr, k23, φφ, k23,zz, k23,rφ
- u3 = 0 on x2 = 0;
- u2 = 0 on x3 = 0;
- u3 = a·γ23 on x2 = a;
- u2 = a·γ23 on x3 = a;
- u1(0, x2, x3) = u1(-b, x2, x3);
- u2(0, x2, x3) = u2(-b, x2, x3);
- u3(0, x2, x3) = u3(-b, x2, x3);

Chapter 5. A damage based model for crack initiation in
unidirectional composites under multiaxial cyclic loading
127
References of chapter 5
[1] Puck A, Shurmann H. Failure analysis of FRP laminates by means of physically based
phenomenological models. Compos Sci Technol 1998; 58: 1045-1067.
[2] Quaresimin M, Susmel L, Talreja R. Fatigue behaviour and life assessment of
composite laminates under multiaxial loadings. Int J Fatigue 2010; 32: 2-16.
[3] Kawai M, Yajima S, Hachinohe A, Takano Y. Off-axis fatigue behaviour of
unidirectional carbon fiber-reinforced composites at room and high temperatures. J
Compos Mater 2001; 35: 545-576.
[4] El-Kadi H, Ellyin F. Effect of stress ratio on the fatigue of unidirectional fibre glass-
epoxy composite laminae. Composites 1994; 25(10): 917-924.
[5] Hashin Z, Rotem A. A fatigue failure criterion for fibre-reinforced materials. J Compos
Mater 1973; 7: 448-464.
[6] Sun XS, Haris A, Tan VBC, Tay TE, Narasimalu S, Della CN. A multi-axial fatigue
model for fiber-reinforced composite laminates based on Puck's criterion. J Compos
Mater 2012; 46: 449-469.
[7] Reifsnider KL, Gao Z. A micromechanics model for composites under fatigue loading.
Int J Fatigue 1991; 13: 149-156.
[8] Plumtree A, Cheng GX. A fatigue damage parameter for off-axis unidirectional fiber
reinforced composites. Int J Fatigue 1999; 21: 849-856.
[9] Smith KN, Watson P, Topper TH. A stress strain function for the fatigue of metals. J
Mater 1970; 5: 767-778.
[10] Tong J. Three Stages of Fatigue Crack Growth in GFRP Composite Laminates. J Eng
Mater-T Asme 2001; 123: 139-143.
[11] Wharmby AW, Ellyin F. Damage growth in constrained angle-ply laminates under
cyclic loading. Compos Sci Technol 2002; 62: 1239-1247.
[12] Awerbuch J, Hahn HT. Off-axis fatigue of graphite/epoxy composite. Fatigue of
Fibrous Composite Materials, ASTM STP 723, American Society for Testing and
Materials 1981: 243-273.
[13] Kawai M, Suda H. Effects of non-negative mean stress on the off-axis fatigue
behaviour of unidirectional carbon/epoxy composites at room temperature. J Compos
Mater 2004; 38(10): 833-854.
[14] Quaresimin M, Carraro PA. On the investigation of the biaxial fatigue behaviour of
unidirectional composites. Compos Part B-Eng 2013; 54: 200-208.

Chapter 5. A damage based model for crack initiation in
unidirectional composites under multiaxial cyclic loading
128
[15] Quaresimin M, Carraro PA. Damage initiation and evolution in glass/epoxy tubes
subjected to combined tension-torsion fatigue loading. DOI:
http://dx.doi.org/10.1016/j.ijfatigue.2014.01.002.
[16] Talreja R. Fatigue of Composite Materials: Damage Mechanisms and Fatigue-Life
Diagrams, Proceedings of the Royal Society of London. Series A, Mathematical and
Physical Sciences 1981; 378: 461-475.
[17] Plumtree A, Shi L. Fatigue damage evolution in off-axis unidirectional CFRP. Int J
Fatigue 2002; 24: 155-159.
[18] Asp LE, Berglund LA, Talreja R. A criterion for crack initiation in glassy polymers
subjected to a composite-like stress state. Compos Sci Technol 1996; 56: 1291-1301.
[19] Asp LE, Berglund LA, Talreja R. Prediction of matrix initiated transverse failure in
polymer composites. Compos Sci Technol 1996; 56: 1089-1097.
[20] Zhang Y, Xia Z. Micromechanical Analysis of Interphase Damage for Fiber
Reinforced Composite Laminates. CMC 2005; 2: 213-226.
[21] Quaresimin M., Carraro P.A, Pilgaard Mikkelsen L., Lucato N., Vivian L., Brøndsted
P., Sørensen B.F., Varna J., Talreja R. (2013). Damage evolution under internal and
external multiaxial cyclic stress state: a comparative analysis, accepted
[22] Huang Y, Jin KK, Ha SK. Effects of Fiber Arrangement on Mechanical Behaviour of
Unidirectional Composites. J Compos Mater 2008; 42: 1851-1871.
[23] Kawai M. A phenomenological model for off-axis fatigue behavior of
unidirectionalpolymer matrix composites under different stress ratios, Compos Part A-
Appl S 2004; 35: 955–963

Chapter 6. A stiffness degradation model for cracked multidirectional laminates
129
6
A stiffness degradation model for cracked
multidirectional laminates
6.1. Introduction
The increasing use of composite materials in the aerospace, naval and wind energy industries
is due to their high specific mechanical properties, and of course the stiffness is one of great
interest. During their service life, composite laminates undergo several damage mechanisms,
which, though not being critical for catastrophic failure, cause the degradation of the laminate
elastic properties. For a multidirectional laminate made of unidirectional (UD) plies, the first
damage mode responsible for this behaviour, occurring both under static and fatigue loading,
is the onset and propagation of matrix cracks in the off-axis layers. This phenomenon is
documented in several works in the literature for static [1-3] and fatigue [1,4-7] loading. In
particular the density of off-axis cracks, meant as the number of cracks per unit length normal
to the crack faces, increases with the static applied load and with the number of fatigue cycles.
In the literature, many efforts have been devoted to the correlation of the laminate elastic
properties and the density of off-axis cracks. Several approaches have been adopted and the
most common of them can be classified as follows:
1) Finite Element (FE) analysis of cracked laminates;
2) Crack-Faces-Displacement (CFD) models;
3) Sinergistic Damage Mechanics (SDM);
4) Variational analysis;
5) McCartney's models;
6) Shear Lag (SL) analysis.
The main features of these approaches are briefly described in the following. A complete and
extensive review of the literature on this topic is not in the aims of the present work, whose
introduction is, instead, focused on the basic ideas of the most widely used and acknowledged
models in the literature.
1) Li and co-authors [8] presented a technique for modelling multidirectional laminates in the
presence of regular crack arrays in multiple layers with no more than two different fibres

Chapter 6. A stiffness degradation model for cracked multidirectional laminates
130
orientations. A unit cell, representative of the entire laminate, is subjected to periodic
displacement boundary conditions, the application of which is quite onerous and time
consuming. However, the main disadvantage of this method is that it allows to model no more
than two crack directions. FE analyses on laminates with cracks in three directions have been
carried out in [9] with a simplified method which, in turns, does not reproduce the periodicity
of the modelled laminate segment.
2) CFD models are based on the micromechanical theorem which states that the global
laminate strains can be computed by averaging the strains over the volume of each layer. By
means of the divergence theorem it turns out that this process is equivalent to averaging the
displacement components over the surfaces of each layer. Accordingly the stiffness of a
cracked laminate can be computed once the average crack faces displacements are known. An
attempt in this directions was provided by Gudmunson and co-workers [10], who used the
analytic solution of the Crack Opening Displacement (COD) for a periodic system of cracks in
a homogeneous transversely isotropic medium to calculate the stiffness of cracked cross-ply
laminates. By doing so they neglected the influence of the confining stiffer layers in the
calculation of the COD. A more accurate model was presented by Lundmark and Varna [11].
They computed the COD by means of FE analyses of cracked cross-ply laminates, and found
that a simple power law was very efficient to describe variability of the COD with the stiffness
of the 0° plies and the thickness of the cracked 90° layers. The model gave satisfactory results
for the Young modulus, Poisson's ratio and thermal expansion coefficients of cross-ply
laminates, and also of other kinds of laminates with cracks in 90° layers subjected to uniaxial
tension. Lundmark and Varna [12] refined their model accounting also for the influence of the
Crack Sliding Displacement (CSD) and verified its suitability for the calculation of the shear
modulus of cross-ply laminates with cracks in the 90° layers. Both in [11] and in [12] the
influence of the interaction between cracks in the same layer is not accounted for in the
calculation of the COD and CSD, leading to perfectible predictions when the crack density is
high. Later, the same authors improved their predictions by defining an "interaction function"
computed with FE analyses [13]. The problem of a cross-ply laminate with two systems of
cracks, namely in the 0° and 90° layers, was also treated in Ref. [12], focusing on the
computation of the shear modulus of the damaged laminate. The average crack displacements
were calculated without accounting for the mutual interaction between cracks in different
layers, and the shear modulus of such multiply damaged laminates were computed with an
iterative procedure. Convergence has been proved to occur after a very small number of
iterations, but the final result was not in close agreement with FE models.
Chapter 6. A stiffness degradation model for cracked multidirectional laminates
131
3) The SDM approach was proposed by Talreja [14] as a tool for the determination of material
parameters involved in the constitutive relations for damaged laminates expressed in terms of
internal state variables in the frame of Continuum Damage Mechanics. According to SDM,
these parameters, dependent on the laminate configuration, can be computed by means of a
micromechanical analysis. In particular, constrain parameters, dependent on the thickness of
the cracked layer as well as on the configuration of the surrounding plies, are expressed in
terms of the COD which can be either measured experimentally or computed with FE
analyses. Finally, a proportionality parameter, relating the state of damage to the elastic
properties, can be calibrated by means of experimental data for a reference laminate
configuration (typically a cross-ply). Varna and co-authors adopted the SDM approach for the
estimation of stiffness properties of [±θ/904]s laminates with cracks in the 90° plies [15],
varying the orientation θ of the constraining layers. An experimental technique was used for
the evaluation of the COD relevant to the configurations investigated. The same procedure
was applied by Varna and co-authors for [0/±θ4/01/2]s laminates with cracks in the ±θ layers
[16]. Satisfactory agreement with experimental results was obtained both in Refs. [15] and
[16]. In [17] and [18] FE models were instead adopted for the calculation of the COD to be
used in the SDM approach for [±θ/904]s and [0/±θ4/01/2]s laminates, respectively. Finally,
Singh and Talreja [9] extended the SDM for [0/±θ/90]s and [0/90/±θ]s laminates with FE based
calculations of the COD for cracks in all three off-axis layers. A drawback of the SDM
approach is that the stiffness of a damaged laminate is described as linearly dependent on the
crack density, and therefore the limiting trend to the value computed with the ply-discount
technique is not correctly predicted for high crack densities. In addition, the effect of the CSD
is neglected, and this can be source of errors in case of the presence of cracked plies with
orientations not close to 0° and 90°, as proved by Varna [19]. Finally, the interaction between
cracks in different layers is accounted for by means of FE calculations of the COD in the
presence of more than one cracked ply. This method, in turns, does not consider the influence
of the crack density on the entity of such interaction.
4) The variational approach was adopted by Hashin [20] for the determination of the stress
fields in cross-ply laminates under tension and shear loading, in the presence of cracks in the
transverse layer. The in-plane ply stresses were considered constant through the thickness of
each lamina and functions of the transverse coordinate only. They were evaluated by the
minimisation of the strain energy, turning out in the solution of a fourth order ordinary
differential equation. Only the expressions for the transverse and in-plane shear stresses,
satisfying all the equilibrium and compatibility conditions, were given, neglecting the

Chapter 6. A stiffness degradation model for cracked multidirectional laminates
132
influence of the presence of cracks on the longitudinal stress. The problem of the derivation of
elastic properties, based on the variational approach, was more explicitly treated in [21]. It is
worth mentioning that, according to this method, a lower limit of the stiffness of a damaged
cross-ply laminate is obtained. The variational approach has been recently extended by
Vinogradov and Hashin [22] to the case of an angle-ply laminate with cracks in one layer. In
this case the perturbation on the longitudinal stress field was also considered, and the
minimisation of the complementary energy led to the solution of a system of two coupled
fourth order differential equations. A 3D variational analysis for cross-ply laminates was also
carried out by Hashin [23], where the in-plane ply stresses were considered functions of both
the transverse and longitudinal coordinates. This allowed to treat the problem of a cross-ply
laminate with cracks in both the 0° and 90° layers. The variational approach is proven to be an
accurate tool for stress analysis and elastic properties predictions, but, up to now, it is
restricted to simple laminate configurations such as cross-ply and angle-ply laminates with one
system of cracks, or cross-plies with two orthogonal systems of cracks.
5) In [24] and [25] McCartney proposed a generalised plane strain model for the evaluation of
the stress fields in [0/90]s laminates loaded in tension with a regular crack array in the 90° ply.
The in-plane stresses were considered constant through the thickness of each layer and they
were written as the sum of their nominal value, computed with the Classical Lamination
Theory (CLT), and a stress perturbation, function of the transverse coordinate of the 90°ply.
Solving the 2D equilibrium equations averaged over the ply thickness, and making use of the
averaged relation between the transverse strain and displacement, a fourth order differential
equation was obtained for the stress perturbation function. The result was coincident to that of
Hashin [20] a part from the fact that a generalised plane strain assumption was done by
McCartney. In fact, it is observed in [25] that the equilibrium equations averaging process,
performed by McCartney, is equivalent to the minimisation of the complementary energy
carried out by Hashin [20]. The so obtained stress and displacement fields were used in [24]
and [25] for the estimation of the thermo-elastic properties of damaged cross-plies, resulting in
good agreement with experimental data from the literature. In Ref. [25] a 3D model was also
proposed, starting from the same basic assumptions, a part from the fact that the in-plane stress
perturbation function depended on both the transverse and longitudinal coordinates. This
model can be used for the evaluation of free edge effects or in the case of a cross-ply laminate
with cracks in both the 90° and 0° layers. However, in the presence of cracks in the only
transverse ply, very similar predictions for the thermo-elastic properties are achieved by the
two models. Later McCartney extended the generalised plane strain model to general

Chapter 6. A stiffness degradation model for cracked multidirectional laminates
133
symmetric laminates with cracks in one layer and used a ply refinement technique for a better
estimation of the elastic properties of a damaged laminate [26]. Finally, he modified the model
in order to account also for the presence of a global stress applied in the thickness direction
[27]. The models presented in [26] and [27] are, probably, the most accurate tools for stress
analysis of cracked laminates (with one cracked layer), but the solution of the governing
system of coupled fourth order differential equations is carried out with numerical methods,
without providing analytical expressions for the stress perturbation functions.
6) According to its basic ideas, the SL method describes the stress transfer between uncracked
and cracked layers by means of interface interlaminar shear stresses, which are proportional to
the in-plane displacements of each layer through the so called Shear Lag Parameter (SLP). The
application of the SL method to cross-ply laminates was widely investigated by Nairn and
Mendels [28], who identified all the simplifying assumptions made when using this kind of
analysis, and defined the Optimal Shear Lag Analysis as the one which uses the fewest
assumptions possible. The three basic simplifying hypotheses are better discussed in section
6.2. It is worth mentioning that the analyses conducted in [28] deal with cross-plies loaded in
tension, where the attention is focused on the transverse stress only, and a simplified Hooke's
law, in the form ζT = ET ·εT, is used (the subscript T refers to the transverse direction of the
90°plies). It is also emphasised that the SLP is determined only by assuming the trend of the
in-plane ply displacements along the thickness, when an Optimal Shear Lag Analysis is
conducted.
Many works in the literature deal with the SL analysis of cracked cross-ply laminates, but
most of them make use of a Non-Optimal Shear Lag Analysis [29-31] or of the Parametric-
Interlayer Shear Lag Analysis, as defined by Nairn and Mendels [28]. The last method
assumes that the shear deformation is carried by interlayers, the properties and thickness of
which have to be calibrated with experiments. Some examples of this models can be found in
Refs [32-34].
An optimal analysis was instead presented by Lee and Daniel for cross-plies loaded in tension
[35], with the only drawback that the simplified Hooke's law has been used and therefore the
effect of the presence of cracks on the longitudinal stress in the 90° ply was not considered. A
similar analysis was conducted by McCartney [24], making use of the complete Hooke's law.
The SLP was calculated, both in [35] and [24], by assuming that the displacement in the
loading direction in both 0° and 90° plies is a parabolic function of the through the thickness
coordinate. As a consequence the interlaminar shear stress results linearly dependent on the
through the thickness coordinate, which is the same assumption made in the more refined
Chapter 6. A stiffness degradation model for cracked multidirectional laminates
134
McCartney's models [25]. Differently from the method proposed in Ref. [25], where a fourth
order differential equation was solved, with the SL approach the in-plane ply stresses,
averaged over the ply thickness, are calculated solving a second order differential equation
representing the averaged equilibrium equations in the transverse direction of the 90° ply. This
allows to satisfy a lower number of boundary conditions. Namely the transverse interlaminar
shear stress is not zero on the cracks surfaces. However, all the other equilibrium and
compatibility equations and conditions are satisfied either exactly or in an averaged sense [28].
In the references cited so far, the SL method was used to describe the transverse load transfer
by means of interlaminar shear stress, which is enough to deal with cross-ply laminates loaded
in tension. In general laminates under uniaxial and multiaxial loads, as well as in cross-plies
under global shear loading, also the in-plane shear transfer problem has to be treated. For this
sake, also the longitudinal interlaminar shear stress has to be introduced and the averaged
equilibrium equations in the two in-plane directions must be solved. This kind of analysis on
multidirectional laminates with a cracked off-axis layer was presented by Flaggs [36], even if
the problem of the degraded elastic properties was not treated explicitly. In addition he
adopted the same assumptions used in [29] for the determination of the SLPs, thus resulting in
a non-optimal shear lag analysis. An optimal shear lag analysis was instead presented by
Kashtalian and Soutis [37] for [0/θ]s laminates loaded in tension with cracks in the off-axis
layer. They assumed a parabolic dependence of the in-plane displacements on the through the
thickness coordinate and obtained the trend of all three in-plane stress component. Finally,
close form solution for the degraded stiffness properties were given as function of the crack
density, resulting in reasonable agreement with the results from McCartney's model [26].
The problem of a laminate with cracks in two or more directions was also treated with the SL
approach, though less frequently, because of its higher complexity. Henaff-Gardin [38] and
co-authors proposed a 3D SL analysis to treat the problem of a cross-ply with cracks in both
the 0° and 90° layers. As in [23] and [25], the 3D analysis is carried out assuming the in-plane
stresses in each ply to vary with both the in-plane coordinates.
Yokozeki and Aoki [39] presented a 3D SL model for the estimation of elastic properties of
[θ/θ] laminates with cracks in both plies and later Cortes and Barbero [40] extended this
approach to general laminates, with whatever number of layers, but always with two systems
of obliquely crossed off-axis cracks.
Though it is a reasonably accurate stress analysis tool, the 3D SL analysis has the important
limit that only two systems of cracks can be considered. For this reason, other approaches in
the literature treat the problem of multiply damaged laminates with more simplified but

Chapter 6. A stiffness degradation model for cracked multidirectional laminates
135
extendible approaches, based on the SL analysis of a laminate with cracks in one single layer
at a time. Tsai and Daniel [41] presented a model for the shear modulus of cross-ply laminates
damaged by transverse cracks and splits. They proposed a simple formula based on the
superposition of solutions obtained with the SL analysis of the cross-ply with cracks in the
only 90° and 0° layers. This approach has the advantage of being very simple, but it neglects
the influence of the mutual interaction between cracks on different layers. This aspect was
instead accounted for by Zhang and Herrmann [42], who proposed a SL analysis of a 9-layers
symmetric laminate, which can be representative of whatever configuration for symmetric
laminates, by treating groups of layers as sub-laminates. The SL analysis was conducted for a
laminate with cracks in one single ply and then an iterative procedure was used for the
estimation of the elastic properties in the presence of cracks in two or more plies. Good
agreement with experimental results was found. Finally a similar approach was adopted in
[43], together with a parametric-interlayer shear lag analysis for doubly periodically cracked
cross-plies.
The literature analysis is summarised in table 1, where the most comprehensive and refined
models are reported together with their advantages and limitations. On this basis it can be said
that the following aspects are still missing:
- an optimal shear lag analysis of a general symmetric laminate with whatever number of
layers, with cracks in one ply only;
- an analytical model for the estimation of the degraded elastic properties of general symmetric
laminates with cracks in two or more layers accounting for the mutual interaction between
cracks in different plies, without the need of iterative procedures.
Accordingly, the aim of the present work is to fill the gaps mentioned above, providing a
model for the computation of the elastic properties of general symmetric laminates with cracks
in whatever number of plies, accounting for their mutual interaction with an analytical
approach. A bi-dimensional optimal shear lag analysis of a multidirectional laminate with one
cracked ply is first performed for this purpose. Then, the final result for the case of multiply
damaged laminates is expressed in terms of parameters calculated with the single-cracked-ply
SL analysis. The model requires no other input data than the elastic and geometric properties
of the laminae and it is in good agreement with experimental and FE results from the
literature.
Finally it is worth spending some words on the shear lag method and its suitability for the
present purpose. In fact, it is an approximate method, as it is based on simplifying
assumptions, as highlighted in [28]. However, in virtue of these simplifications, "the shear lag
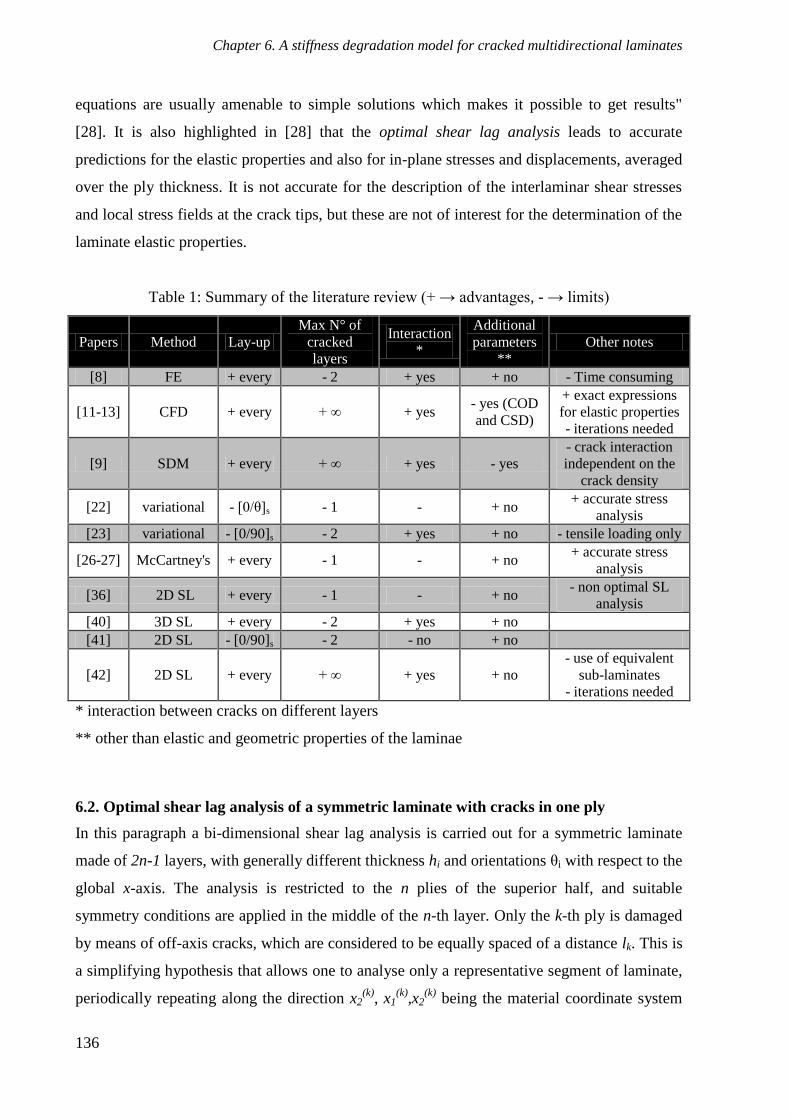
Chapter 6. A stiffness degradation model for cracked multidirectional laminates
136
equations are usually amenable to simple solutions which makes it possible to get results"
[28]. It is also highlighted in [28] that the optimal shear lag analysis leads to accurate
predictions for the elastic properties and also for in-plane stresses and displacements, averaged
over the ply thickness. It is not accurate for the description of the interlaminar shear stresses
and local stress fields at the crack tips, but these are not of interest for the determination of the
laminate elastic properties.
Table 1: Summary of the literature review (+ → advantages, - → limits)
Papers Method Lay-up
Max N° of
cracked
layers
Interaction
*
Additional
parameters
**
Other notes
[8] FE + every - 2 + yes + no - Time consuming
[11-13] CFD + every + ∞ + yes - yes (COD
and CSD)
+ exact expressions
for elastic properties
- iterations needed
[9] SDM + every + ∞ + yes - yes
- crack interaction
independent on the
crack density
[22] variational - [0/θ]s - 1 - + no + accurate stress
analysis
[23] variational - [0/90]s - 2 + yes + no - tensile loading only
[26-27] McCartney's + every - 1 - + no + accurate stress
analysis
[36] 2D SL + every - 1 - + no - non optimal SL
analysis
[40] 3D SL + every - 2 + yes + no
[41] 2D SL - [0/90]s - 2 - no + no
[42] 2D SL + every + ∞ + yes + no
- use of equivalent
sub-laminates
- iterations needed
* interaction between cracks on different layers
** other than elastic and geometric properties of the laminae
6.2. Optimal shear lag analysis of a symmetric laminate with cracks in one ply
In this paragraph a bi-dimensional shear lag analysis is carried out for a symmetric laminate
made of 2n-1 layers, with generally different thickness hi and orientations θi with respect to the
global x-axis. The analysis is restricted to the n plies of the superior half, and suitable
symmetry conditions are applied in the middle of the n-th layer. Only the k-th ply is damaged
by means of off-axis cracks, which are considered to be equally spaced of a distance lk. This is
a simplifying hypothesis that allows one to analyse only a representative segment of laminate,
periodically repeating along the direction x2(k)
, x1(k)
,x2(k)
being the material coordinate system
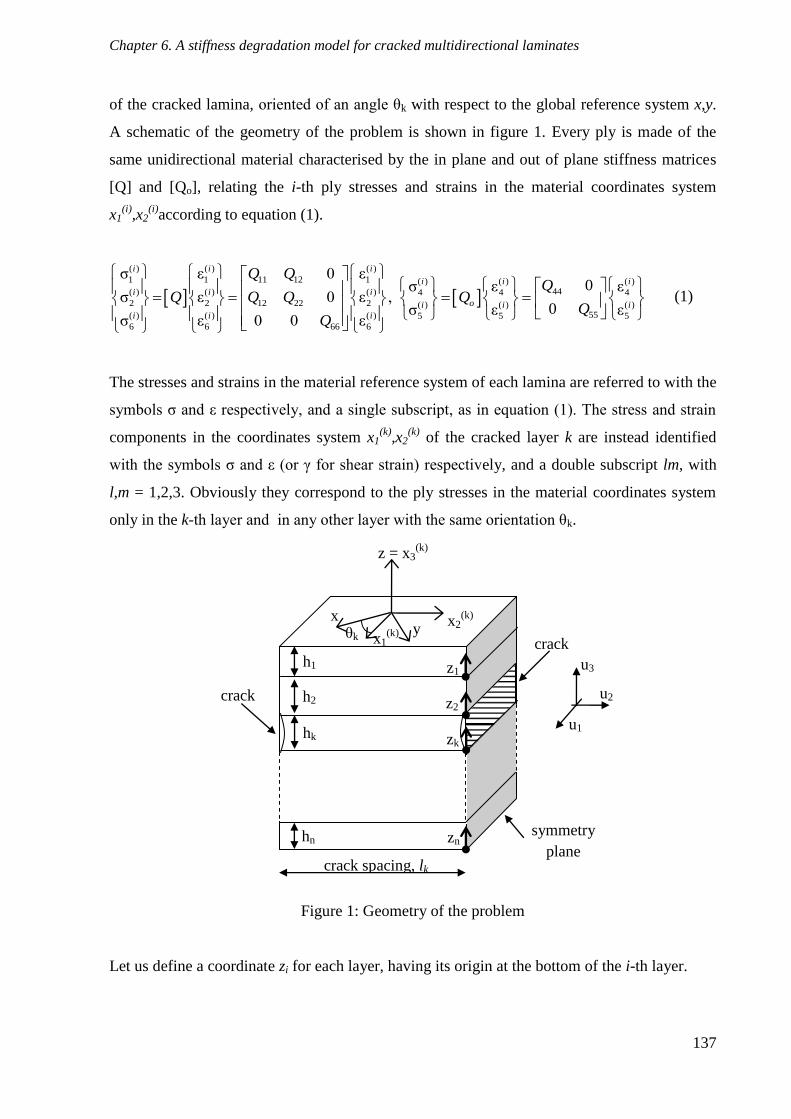
Chapter 6. A stiffness degradation model for cracked multidirectional laminates
137
of the cracked lamina, oriented of an angle θk with respect to the global reference system x,y.
A schematic of the geometry of the problem is shown in figure 1. Every ply is made of the
same unidirectional material characterised by the in plane and out of plane stiffness matrices
[Q] and [Qo], relating the i-th ply stresses and strains in the material coordinates system
x1(i)
,x2(i)
according to equation (1).
( ) ( ) ( )
1 1 11 12 1 ( ) ( ) ( )44( ) ( ) ( ) 4 4 4
2 2 12 22 2 ( ) ( ) ( )55( ) ( ) ( ) 5 5 5
6 6 66 6
σ ε 0 ε0σ ε ε
σ ε 0 ε ,0σ ε ε
σ ε 0 0 ε
i i i
i i i
i i i
oi i i
i i i
Q QQ
Q Q Q QQ
Q
(1)
The stresses and strains in the material reference system of each lamina are referred to with the
symbols ζ and ε respectively, and a single subscript, as in equation (1). The stress and strain
components in the coordinates system x1(k)
,x2(k)
of the cracked layer k are instead identified
with the symbols ζ and ε (or γ for shear strain) respectively, and a double subscript lm, with
l,m = 1,2,3. Obviously they correspond to the ply stresses in the material coordinates system
only in the k-th layer and in any other layer with the same orientation θk.
Figure 1: Geometry of the problem
Let us define a coordinate zi for each layer, having its origin at the bottom of the i-th layer.
x2(k)
x1
(k)
z = x3(k)
h1
h2
hk
hn
z1
z2
zk
zn
x θk
crack spacing, lk
crack
crack
symmetry
plane
y
u2
u1
u3
3

Chapter 6. A stiffness degradation model for cracked multidirectional laminates
138
As pointed out by Nairn and Mendels [28], the so called optimal shear lag analysis is based
on three fundamental assumptions, which are here adapted for a nominal multiaxial in-plane
stress state:
i) the out of plane shear stresses are proportional to the in-plane displacements derivatives
according to
( ) ( )
13 1
( ) ( )
23 2
σ
σ
i i
i i
i
u
z u
, (2)
which implies ( )
3
( )
2
0i
k
u
x
and
( )
3
( )
1
0i
k
u
x
;
ii) the dependence of the out of plane shear stresses on the coordinate zi has to be assumed,
which means that the form of the in plane displacements along the ply thickness is also
assumed, according to (2);
iii) the derivatives of the stress in direction x3(k)
≡ z with respect to x1(k)
and x2(k)
are null,
allowing to neglect the influence of the out of plane stress ζ33 in the calculation of the in-plane
strains.
The reader is referred to [28] for a more detailed description of the shear lag assumptions and
their motivations.
6.2.1 Relationship between average displacements and interlaminar shear stresses
According to the assumption ii), the displacements u1(i)
and u2(i)
in the i-th ply are taken to be
parabolic functions of the coordinate zi, as in equations (3) and (4), the coefficients α(x2(k)
) and
β(x2(k)
) being functions of the coordinate x2(k)
.
1 1 1 1( ) ( ) 2 ( ) ( )
1 1 2 1 2 1 2 2 1 3 2
2 2 2 2( ) ( ) 2 ( ) ( )
1 2 2 1 2 2 2 2 2 3 2
( ) ( ) 2 ( ) ( )
1 2 1 2 2 2 3 2
,
,
,
k k k k
k k k k
n n n nk k k k
n n n
u z x β x z β x z β x
u z x β x z β x z β x
u z x β x z β x z β x
(3)
Chapter 6. A stiffness degradation model for cracked multidirectional laminates
139
1 1 1 1( ) ( ) 2 ( ) ( )
2 1 2 1 2 1 2 2 1 3 2
2 2 2 2( ) ( ) 2 ( ) ( )
2 2 2 1 2 2 2 2 2 3 2
( ) ( ) 2 ( ) ( )
2 2 1 2 2 2 3 2
,
,
,
k k k k
k k k k
n n n nk k k k
n n n
u z x α x z α x z α x
u z x α x z α x z α x
u z x α x z α x z α x
(4)
The superscript (i) is referred to the i-th ply.
According to assumption i), the relationship between the longitudinal and transverse shear
stresses (ζ13 and ζ23 respectively) and the in-plane displacements in each lamina reads as
follows:
( ) ( )( ) ( )
13 155 45
( ) ( )( ) ( )23 245 44
ˆ ˆσ
ˆ ˆσ
i ii i
i ii ii
uQ Q
z uQ Q
(5)
where
( ) ( )
155 45 55
( ) ( )4445 44
ˆ ˆ 0θ θ θ θ
ˆ ˆ 0
i iT
o i c o i ci i
Q Q QT T
QQ Q
. (6)
[To] is the rotation matrix for the out of plane quantities defined as
o
Cos SinT
Sin Cos
. (7)
According to equation (5) the out of plane shear stresses have a linear dependence on the
coordinate zi, which is in agreement with the assumptions made in Refs [20-27,35,37,39-43],
and they can be written as follows.
( ) ( ) ( ) ( ) ( ) ( ) ( ) ( ) ( ) ( ) ( ) ( )
13 2 55 1 2 2 2 45 1 2 2 2
( ) ( ) ( ) ( ) ( ) ( ) ( ) ( ) ( ) ( ) ( ) ( )
23 2 45 1 2 2 2 44 1 2 2 2
ˆ ˆσ , 2β ( ) β ( ) 2α ( ) α ( )
ˆ ˆσ , 2β ( ) β ( ) 2α ( ) α ( )
i k i i k i k i i k i k
i i i
i k i i k i k i i k i k
i i i
z x Q x z x Q x z x
z x Q x z x Q x z x
(8)
They have to satisfy the following equilibrium conditions at the plies interfaces:

Chapter 6. A stiffness degradation model for cracked multidirectional laminates
140
1 ( )
13 1 2
1 2 1,2( ) ( ) ( )
13 2 13 2 2 13 2
1 , 1( ) ( ) ( )
13 2 13 1 2 13 2
1 1,( ) ( ) ( )
13 2 13 2 13 2
, 0
0, ,
0, ,
0, ,
k
k k k
i i i ik k k
i
n n n nk k k
n
σ h x
σ x σ h x σ x
σ x σ h x σ x
σ x σ h x σ x
1 ( )
23 1 2
1 2 1,2( ) ( ) ( )
23 2 23 2 2 23 2
1 , 1( ) ( ) ( )
23 2 23 1 2 23 2
1 1,( ) ( ) ( )
23 2 23 2 23 2
, 0
0, ,
0, ,
0, ,
k
k k k
i i i ik k k
i
n n n nk k k
n
σ h x
σ x σ h x σ x
σ x σ h x σ x
τ x τ h x τ x
(9)
as well as the symmetry conditions
( ) ( ) ( ) ( )
13 2 23 2σ 0, 0, σ 0, 0n k n kx x . (10)
In equation (9) the terms ζ(i,j)
13(x2(k)
) and ζ(i,j)
23(x2(k)
) are the interlaminar shear stresses at the
interface between confining plies i and j, and they are functions of x2(k)
.
The displacements have instead to satisfy the following compatibility conditions at the
interfaces:
1 2( ) ( )
2 2 2 2 2
1( ) ( )
2 2 2 1 2
1 ( ) ( )
2 2 2 2
0, ,
0, ,
0, ,
k k
i ik k
i
n nk k
n
u x u h x
u x u h x
u x u h x
1 2( ) ( )
1 2 1 2 2
1( ) ( )
1 2 1 1 2
1 ( ) ( )
1 2 1 2
0, ,
0, ,
0, ,
k k
i ik k
i
n nk k
n
u x u h x
u x u h x
u x u h x
. (11)
The shear lag analysis deals with quantities (displacements, stresses and strains) averaged over
the thickness of each lamina [28]. Accordingly, the average displacements in direction x1(k)
and
x2(k)
for each layer are calculated integrating equation (3), resulting in:
( ) ( ) 2 ( ) ( )
1 2 1 2 2 2 3 2
( ) ( ) 2 ( ) ( )
2 2 1 2 2 2 3 2
1 1
3 2
1 1
3 2
i i i ik k k k
i i
i i i ik k k k
i i
u x β x h β x h β x
u x α x h α x h α x
(12)

Chapter 6. A stiffness degradation model for cracked multidirectional laminates
141
The coefficients α and β can be eliminated imposing the boundary conditions (8) - (10), so that
the following relationships can be written between the average displacements and the
interlaminar shear stresses at the interfaces:
( ) ( ) ( )
1 2 13 2 23 2Δ σ σk k ku x H x F x (13)
( ) ( ) ( )
2 2 23 2 13 2Δ σ σk k ku x K x F x (14)
where
(1) ( ) (2) ( ) (1) ( ) (2) ( )
1 2 1 2 2 2 2 2
( ) ( )
1 2 2 2
( 1) ( ) ( ) ( ) ( 1) ( ) ( ) ( )
1 2 1 2 2 2 2 2
Δ , Δ
k k k k
k k
n k n k n k n k
u x u x u x u x
u x u x
u x u x u x u x
(15)
and
1,2 ( ) 1,2 ( )
13 2 23 2
( ) ( )
13 2 23 2
1, ( ) 1, ( )
13 2 23 2
σ σ
σ , σ
σ σ
k k
k k
n n k n n k
x x
x x
x x
. (16)
The coefficients of the (n-1)x(n-1) matrices [H], [K] and [F] are given in the following.
2 2
2 2
2
( 1) ( 1) ( 1) ( ) ( ) ( ) ( ) ( 1)
45 44 55 44 1 45 44 55 44
( 1) ( 1) ( 1) ( ) ( ) ( )
45 44 55 45 44 55
( )
44
( ) ( ) ( )
45 44 55
ˆ ˆ ˆ ˆ ˆ ˆ ˆ ˆ
,ˆ ˆ ˆ ˆ ˆ ˆ3
ˆ, 1,
ˆ ˆ ˆ6
0,
i i i i i i i i
i i
iii i i i i i
j
j
ij jij j j
ij ji
h Q Q Q Q h Q Q Q QH
Q Q Q Q Q Q
h QH H for j i
Q Q Q
H H for j
1i
(17)

Chapter 6. A stiffness degradation model for cracked multidirectional laminates
142
2 2
2 2
2
( 1) ( 1) ( 1) ( ) ( ) ( ) ( ) ( 1)
45 44 55 55 1 45 44 55 55
( 1) ( 1) ( 1) ( ) ( ) ( )
45 44 55 45 44 55
( )
55
( ) ( ) ( )
45 44 55
ˆ ˆ ˆ ˆ ˆ ˆ ˆ ˆ
,ˆ ˆ ˆ ˆ ˆ ˆ3
ˆ, 1,
ˆ ˆ ˆ6
0,
i i i i i i i i
i i
iii i i i i i
j
j
ij jij j j
ij ji
h Q Q Q Q h Q Q Q QK
Q Q Q Q Q Q
h QK K for j i
Q Q Q
K K for j
1i
(18)
2 2
2 2
2
( 1) ( 1) ( 1) ( ) ( ) ( ) ( ) ( 1)
45 44 55 45 1 45 44 55 45
( 1) ( 1) ( 1) ( ) ( ) ( )
45 44 55 45 44 55
( )
45
( ) ( ) ( )
45 44 55
ˆ ˆ ˆ ˆ ˆ ˆ ˆ ˆ
,ˆ ˆ ˆ ˆ ˆ ˆ3
ˆ, 1,
ˆ ˆ ˆ6
0,
i i i i i i i i
i i
iii i i i i i
j
j
ij jij j j
ij ji
h Q Q Q Q h Q Q Q QF
Q Q Q Q Q Q
h QF F for j i
Q Q Q
F F for j i
1
(19)
Inverting equations (13) and (14) the vectors containing the interlaminar shear stresses at the
interfaces can be written as:
1
1 1( ) ( ) ( )
13 2 1 2 2 2σ Δ Δk k kx H F K F u x F K u x
(20)
1
1 1( ) ( ) ( )
23 2 2 2 1 2σ Δ Δk k kx K F H F u x F H u x
. (21)
6.2.2 Equilibrium equations and solution
In order to compute the in-plane stresses and displacements as functions of the coordinate x2(k)
,
the equilibrium equations for each lamina are written in equations (22) and (23), in direction
x2(k)
and x1(k)
respectively. It is a fundament of the shear lag method that they are written in
terms of the average transverse and in-plane shear stresses ζ22(x2(k)
) and ζ12(x2(k)
), functions of
x2(k)
only.

Chapter 6. A stiffness degradation model for cracked multidirectional laminates
143
1,21 ( )( )
23 222 2
( )
2 1
( )1, , 1( ) ( )22 2
23 2 23 2( )
2
1, ( )( )
23 222 2
( )
2
( )( )0
( ) 1( ) ( ) 0
( )( )0
kk
k
i ki i i ik k
k
i
n nn kk
k
n
σ xdσ x
dx h
dσ xσ x σ x
dx h
σ xdσ x
dx h
(22)
1,21 ( )( )
13 212 2
( )
2 1
( )1, , 1( ) ( )12 2
13 2 13 2( )
2
1, ( )( )
13 212 2
( )
2
( )( )0
( ) 1( ) ( ) 0
( )( )0
kk
k
i ki i i ik k
k
i
n nn kk
k
n
σ xdσ x
dx h
dσ xσ x σ x
dx h
σ xdσ x
dx h
(23)
Deriving the equilibrium equations (22) and (23) with respect to x2(k)
one obtains
2
2
2
1,21 ( )2 ( )
23 222 2
( )( )1 22
1, , 1( ) ( )2
23 2 23 222 2
( ) ( )( )2 22
1, ( )2 ( )
23 222 2
( )( )1 22
( )( ) 10
( ) ( )( ) 10
( )( ) 10
kk
kk
i i i ii k k
k kki
n nn kk
kk
dσ xd σ x
h dxdx
dσ x dσ xd σ x
h dx dxdx
dσ xd σ x
h dxdx
(24)
Chapter 6. A stiffness degradation model for cracked multidirectional laminates
144
2
2
2
1,21 ( )2 ( )
13 212 2
( )( )1 22
1, , 1( ) ( )2 ( )
13 2 13 212 2
( ) ( )( )2 22
1, ( )2 ( )
13 212 2
( )( )1 22
( )( ) 10
( ) ( )( ) 10
( )( ) 10
kk
kk
i i i ii k kk
k kki
n nn kk
kk
dσ xd σ x
h dxdx
dσ x dσ xd σ x
h dx dxdx
dσ xd σ x
h dxdx
. (25)
In addition, the in-plane strains, averaged through the i-th ply thickness, can be written by
means of the following scalar products
111
222
312
i ii
i ii
i ii
ε S σ
ε S σ
γ S σ
(26)
where
( ) ( ) ( ) ( ) ( ) ( )
11 2 22 2 12 2( ), ( ), ( )Ti
i k i k i kσ σ x σ x σ x
and
ˆi
jS
is the j-th row of the matrix ( )
ˆi
S
defined
as
1( ) ( ) ( ) 1ˆ ˆ ˆ, θ θ θ θ
i i i T
i k i kS Q with Q T Q T
(27)
[T] being the 3x3 rotation matrix for in-plane quantities.
Deriving equations (20) and (21) with respect to x2(k)
, the derivatives of the interfacial shear
stresses can be expressed as functions of the strains, averaged through the thickness of each
layer ε22(i)
(x2(k)
) and γ12(i)
(x2(k)
):
(1,2) ( )(1) ( ) (2) ( ) (1) ( ) (2) ( )
13 212 2 12 2 22 2 22 21
1 1
2 ( 1) ( ) ( ) ( ) ( 1) ( ) ( ) ( )( 1, ) ( )12 2 12 2 22 2 22 213 2
σ γ ( ) γ ( ) ε ( ) ε ( )
γ ( ) γ ( ) ε ( ) ε ( )σ
kk k k k
n k n k n k n kn n k
x x x x xd
H F K F F Kdx
x x x xx
(28)
Chapter 6. A stiffness degradation model for cracked multidirectional laminates
145
(1,2) ( )(1) ( ) (2) ( ) (1) ( ) (2) ( )
23 222 2 22 2 12 2 12 21
1 1
2 ( 1) ( ) ( ) ( ) ( 1) ( ) ( ) ( )( 1, ) ( )22 2 22 2 12 2 12 223 2
σ ε ( ) ε ( ) γ ( ) γ ( )
ε ( ) ε ( ) γ ( ) γ ( )σ
kk k k k
n k n k n k n kn n k
x x x x xd
K F H F F Hdx
x x x xx
(29)
Substituting equation (26) in (28) and (29), and then (28), (29) in (24) and (25), a
homogeneous system of 2n coupled second order differential equations is obtained, with 3n
unknown functions represented by the in plane stresses ζ11(i)
(x2(k)
), ζ22(i)
(x2(k)
), ζ12(i)
(x2(k)
), for i
= 1...n.
The stresses in one layer, for example in the first one, can be easily eliminated by using the
global equilibrium equation of the laminate, obtaining
1
21 1
1 n i
gc ii
hσ T θ σ h σ
h h
(30)
where the vector gσ
contains the global stresses in the global coordinate system {ζx, ζy, ζxy}T
applied to the laminate.
The stress components ζ11(i)
(x2(k)
) can also be eliminated by considering the generalized plane
strain conditions:
1 111 111 11
ˆ ˆi ii ii i
ε ε S σ S σ
, for i = 1...n-1 (31)
If the equilibrium equations for the first layer are eliminated from systems (24) and (25) and
equations (30) and (31) are considered, a non homogeneous system of 2n-2 differential
equations is obtained, with 2n-2 unknown functions ζ22(i)
(x2(k)
), ζ12(i)
(x2(k)
), for i = 2...n.
2
2 2( ) ( )
22 2 22 2
( ) ( )222 2 22 2
( ) 2 2( ) ( )2 12 2 12 2
( ) ( )
12 2 12 2
( ) ( )
( ) ( )
( ) ( )
( ) ( )
k k
n nk k
k k k
n nk k
σ x σ x
σ x σ xdm b
dx σ x σ x
σ x σ x
(32)

Chapter 6. A stiffness degradation model for cracked multidirectional laminates
146
[m] is a (2n-2)x(2n-2) matrix containing the coefficients of the non derived terms in (24) and
(25), whereas b
is a (2n-2)x1 vector containing the known terms of (24) and (25), related to
the global applied laminate stresses. The solution of the homogeneous system is in the form
( )2
2 ( )
22 2
( )
22 2
2 ( )
12 2
( )
12 2
( )
( )
( )
( )
k
k
n k
μ x
k
n k
σ x
σ xe M
σ x
σ x
(33)
where μ and M
are respectively the eigenvalues and eigenvectors of the matrix [m]. It is
worth noting that the (2n-2) eigenvalues will always be negative for the physical problem of
interest. Finally the functions representing the (2n-2) stress components can be considered as
the linear combination of the solution (33) and the particular solution expressed by the vector
L
.
( ) ( )2 2
2 ( )
22 2
( )2 2
22 2
2 ( ) 112 2
( )
12 2
( )
( )
( )
( )
k kj j
k
n kn μ x μ x
j j j jk j
n k
σ x
σ xP e M N e M L
σ x
σ x
(34)
It is worth noting that the terms of vector L
represent the stress components for the
undamaged laminate, which can be calculated also by means of the lamination theory,
expressed in the material coordinates system of the cracked layer. Now that the general
expressions for the (2n-2) stress components are known from (34), it is possible to calculate
the stresses ζ11(i)
(x2(k)
) by means of (31) and the stresses in the first layer through equation
(30).
Pj and Nj are unknown coefficients to be computed by means of suitable boundary conditions.
Before imposing the boundary conditions, the displacements (averaged over the thickness)
Chapter 6. A stiffness degradation model for cracked multidirectional laminates
147
have to be calculated. First, the displacements in one layer (the first one in this case) can be
calculated integrating the strains as in equations (35) and (36).
1 11 1( ) ( ) ( ) ( )31 2 12 2 2 1 2 1( ) ( )k k k ku x γ x dx R S σ dx R
(35)
1 11 1( ) ( ) ( ) ( )22 2 22 2 2 2 2 2( ) ( )k k k ku x ε x dx R S σ dx R
(36)
R1 and R2 are unknown terms to be calculated once again with boundary conditions. The
displacements in the remaining layers can be calculated by means of equations (13) and (14),
where the interlaminar stresses are calculated inverting equilibrium equations (22) and (23).
Now, all the in-plane stresses, the interlaminar shear stresses and the displacements are known
functions of the coordinate x2(k)
, depending on (4n-2) unknown parameters (Pj, Nj, R1, R2), to
be calculated imposing the following boundary conditions, where the k-th layer is assumed to
be the cracked one.
22 12 22 120 0 0k k k k
k kσ σ σ l σ l (37)
1 0 0,i
u for i k (38)
1
2 0 0,u for i k (39)
, 1
13 / 2 0, 1... 2i i
kσ l for i n
(40)
, 1
23 / 2 0, 1... 2i i
kσ l for i n
(41)
Equation (37) represents the condition of stress-free crack surfaces, equations (38) and (39)
are required to ensure the periodicity of the laminate segment, and finally equations (40) and
(41) are conditions of symmetry with respect to the plane x2(k)
= lk/2. When the 4n-2 constants
are known, the in-plane stresses, strains and displacements, averaged through the thickness of
each ply, can be written as functions of the coordinate x2(k)
, for a given combination of
globally applied stresses represented by the vector gσ
. It is reminded that all these quantities
are expressed in the material coordinate system of the cracked layer x1(k)
,x2(k)
. It is clear that
the stress distribution in each ply is dependent, through the boundary conditions (37) and
(40,41), on the crack density ρk = 1/lk in the k-th layer. It is worth mentioning that, though
analytical solutions could be written for all the stress, strain and displacement components, the
Chapter 6. A stiffness degradation model for cracked multidirectional laminates
148
expressions of the involved parameters are too long to be reported. However, a code has been
realised by the authors with Matlab 9®, suitable to compute the stress and displacements
distributions in each layer of whatever symmetric cracked laminate, as well as its stiffness
properties, which will be obtained in the following sections.
6.2.3 Calculation of the laminate elastic properties
Since the final aim is to calculate the elastic properties of the damaged laminate in the global
reference system x,y, it is interesting to consider three particular loading conditions, where
only one applied stress, ζx, ζy, ζxy, is non zero, and equal to 1 (i.e. gσ
= {1,0,0}T, {0,1,0}
T and
{0,0,1}T). For each of these loading conditions, the ply stresses in the coordinate system of the
cracked lamina k can be averaged over the entire volume of the i-th layer and expressed by
means of the following parameters, which are function of the crack density ρk.
( ) ( ) ( ) ( ) ( ) ( ) ( ) ( ) ( ) ( ) ( ) ( ), 11 2 2 , 11 2 2 , 11 2 20 0 0
σ 1,0,0 σ 0,1,0 σ 0,0,1
1 1 1γ (ρ ) σ ( ) , γ (ρ ) σ ( ) , γ (ρ ) σ ( )
k k k
T T Tg g g
l l li i k k i i k k i i k kk x k k y k k xy k
k k k
x dx x dx x dxl l l
(42)
( ) ( ) ( ) ( ) ( ) ( ) ( ) ( ) ( ) ( ) ( ) ( ), 22 2 2 , 22 2 2 , 22 2 20 0 0
σ 1,0,0 σ 0,1,0 σ 0,0,1
1 1 1λ (ρ ) σ ( ) , λ (ρ ) σ ( ) , λ (ρ ) σ ( )
k k k
T T Tg g g
l l li i k k i i k k i i k kk x k k y k k xy k
k k k
x dx x dx x dxl l l
(43)
( ) ( ) ( ) ( ) ( ) ( ) ( ) ( ) ( ) ( ) ( ) ( ), 12 2 2 , 12 2 2 , 12 2 20 0 0
σ 1,0,0 σ 0,1,0 σ 0,0,1
1 1 1β (ρ ) σ ( ) , β (ρ ) σ ( ) , β (ρ ) σ ( )
k k k
T T Tg g g
l l li i k k i i k k i i k kk x k k y k k xy k
k k k
x dx x dx x dxl l l
(44)
The global laminate strains in the reference system x,y for each loading condition can now be
calculated multiplying a vector containing the average stresses, computed with equations (42)-
(44) for a non-cracked layer, by the compliance matrix of that layer ( )
ˆi
S
, and then rotating
the result of the angle -θk. Finally the compliance matrix [S(ρk)] of the damaged laminate, with
crack density ρk in the k-th ply, is composed by three column vectors representing the global
strains associated to the three loading conditions gσ
= {1,0,0}T, {0,1,0}
T and {0,0,1}
T. The
final expression is written in equation (45),
( )1 ( )1 ˆρ θ Ω ρi k i k
k k kS R T R S
(45)
Chapter 6. A stiffness degradation model for cracked multidirectional laminates
149
where
( ) ( ) ( )
, , ,( ) ( ) ( ) ( )
, , ,
( ) ( ) ( )
, , ,
1 0 0 γ (ρ ) γ (ρ ) γ (ρ )
0 1 0 , Ω ρ λ (ρ ) λ (ρ ) λ (ρ )
0 0 2 β (ρ ) β (ρ ) β (ρ )
i i i
k x k k y k k xy ki i i i
k k x k k y k k xy k
i i i
k x k k y k k xy k
R
. (46)
Once the compliance matrix [S(ρk)] is known, it is easy to calculate the in-plane Young and
shear moduli Ex, Ey, Gxy, the Poisson's ratii νxy and νyx, and the traction-shear coupling
coefficients. The only input data required by the model are the lamina elastic properties and
the ply thickness, and no calibration with numerical or experimental results is needed.
6.2.4 Validation
The proposed model is validated against experimental data from the literature for
multidirectional or cross-ply symmetric laminates with cracks in one layer. In figure 2a) and b)
the model predictions are compared to experimental results by Varna et al. [16]. The Young
modulus in x-direction Ex and the Poisson's ratio νxy for the damaged laminate are normalised
with respect to their initial values Ex,0 and νxy,0 and plotted versus the crack density in the
transverse layer. A satisfactory agreement is achieved in both cases. The same conclusion can
be drawn for the comparison with results from [44] and [1] shown in figure 3a) and b). In
figure 3b) the agreement is good for crack densities lower than 0.7. In fact, the authors [1]
observed that, after that point, cracks started to initiate in the -45° ply, causing a further
stiffness degradation which is not accounted for with the present model, as it is suitable for
laminates damaged in one layer only. This highlights the need to provide a suitable model to
account for the presence of off-axis cracks in two or more plies.
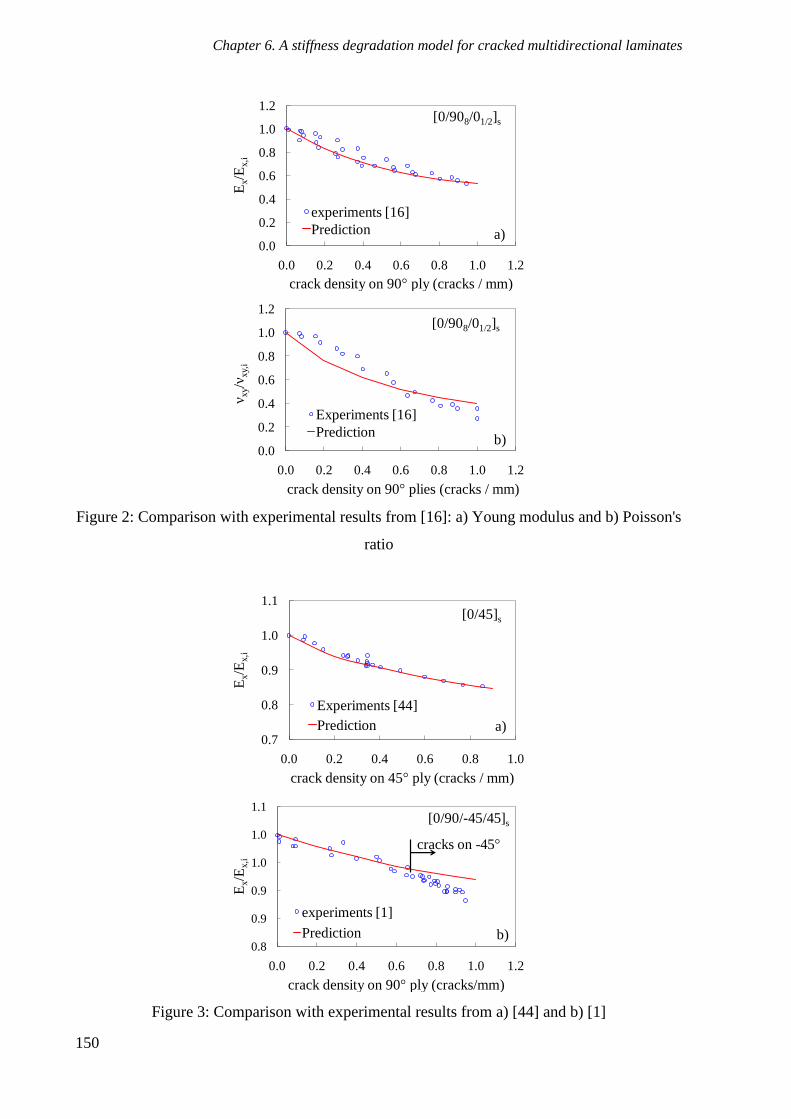
Chapter 6. A stiffness degradation model for cracked multidirectional laminates
150
Figure 2: Comparison with experimental results from [16]: a) Young modulus and b) Poisson's
ratio
Figure 3: Comparison with experimental results from a) [44] and b) [1]
0.0
0.2
0.4
0.6
0.8
1.0
1.2
0.0 0.2 0.4 0.6 0.8 1.0 1.2
Ex/E
x,i
crack density on 90° ply (cracks / mm)
experiments [16]
Prediction
[0/908/01/2]s
a)
0.0
0.2
0.4
0.6
0.8
1.0
1.2
0.0 0.2 0.4 0.6 0.8 1.0 1.2
ν xy/ν
xy,
i
crack density on 90° plies (cracks / mm)
Experiments [16]
Prediction
[0/908/01/2]s
b)
0.7
0.8
0.9
1.0
1.1
0.0 0.2 0.4 0.6 0.8 1.0
Ex/E
x,i
crack density on 45° ply (cracks / mm)
Experiments [44]
Prediction
[0/45]s
a)
0.8
0.9
0.9
1.0
1.0
1.1
0.0 0.2 0.4 0.6 0.8 1.0 1.2
Ex/E
x,i
crack density on 90° ply (cracks/mm)
experiments [1]
Prediction
cracks on -45°
[0/90/-45/45]s
b)

Chapter 6. A stiffness degradation model for cracked multidirectional laminates
151
6.3. Laminate with cracks in two or more layers
6.3.1 Analysis without crack interaction
When a multidirectional laminate is damaged by means of off-axis cracks in two or more
layers, the easier way to treat the problem is to neglect any interaction between cracks in
different layers. The presence of cracks in the k-th ply results in a compliance matrix defined
in equation (45) which can be rewritten as follows.
0ρ Δ ρk kS S S (47)
[S0] is the compliance matrix in the undamaged state, whereas [ΔS(ρk)] is the increment due to
the presence of cracks in the k-th layer. If crack interaction is neglected, the compliance matrix
[Sd] of the damaged laminate with cracks in nc layers can be thought as the sum of the initial
matrix [S0] and the contributions [ΔS(ρk)] for each cracked ply.
01
Δ ρn
d kk
S S S
, if ρk ≠ 0 (48)
Thus the coefficient of [Sd] in position lm, normalised to its value for the undamaged laminate
Slm,0 can be written as
1,0 ,0
(ρ )1 1
nlm lm k
klm lm
S S
S S
, if ρk ≠ 0. (49)
This assumption is implicitly at the basis of the semi-empirical "superposition of solutions
method" proposed by Tsai and Daniel for the shear modulus of cross-ply laminates [41] with
transverse cracks and splits. This method is very simple since it only requires to carry out the
shear lag analysis for the laminate damaged in one single layer, and then to sum the so
obtained results as in equation (49). It will be shown later that this can lead to non
conservative errors in the estimation of the degraded stiffness properties.
6.3.2 Analysis with crack interaction
Kachanov in 1987 proposed a simple method to describe interaction between cracks in an
isotropic plate based on the principle of superposition of effects [45]. Getting inspiration from
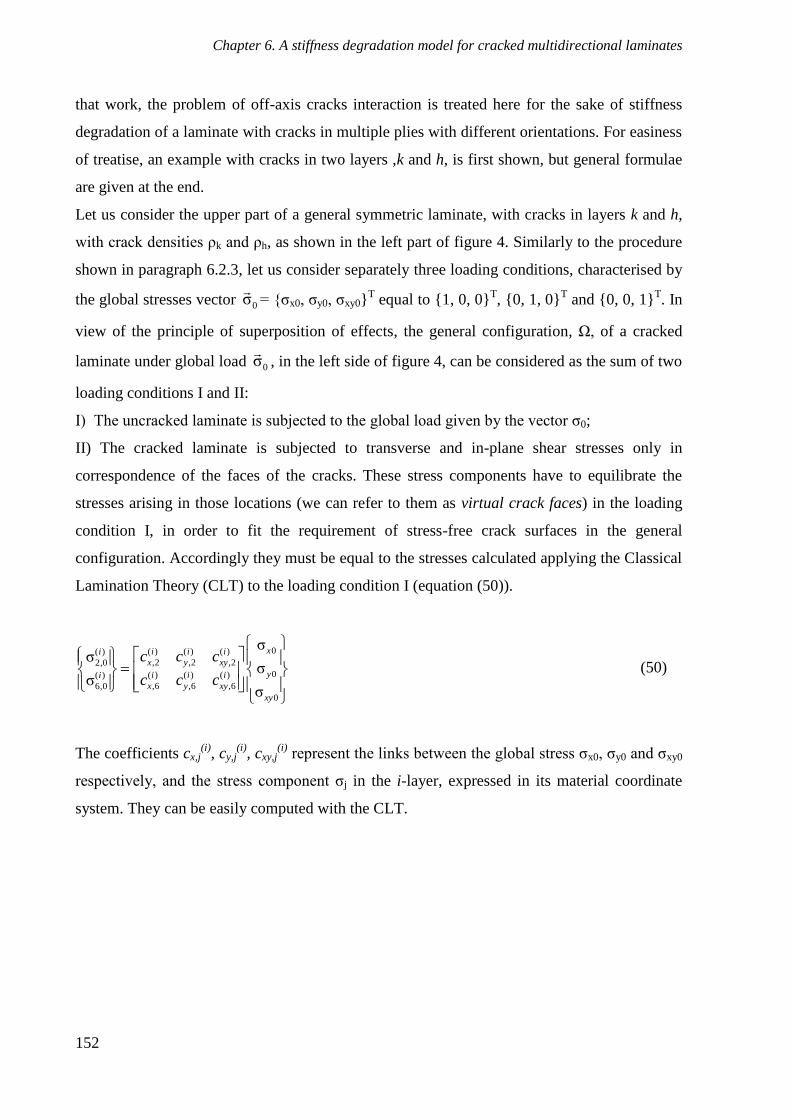
Chapter 6. A stiffness degradation model for cracked multidirectional laminates
152
that work, the problem of off-axis cracks interaction is treated here for the sake of stiffness
degradation of a laminate with cracks in multiple plies with different orientations. For easiness
of treatise, an example with cracks in two layers ,k and h, is first shown, but general formulae
are given at the end.
Let us consider the upper part of a general symmetric laminate, with cracks in layers k and h,
with crack densities ρk and ρh, as shown in the left part of figure 4. Similarly to the procedure
shown in paragraph 6.2.3, let us consider separately three loading conditions, characterised by
the global stresses vector 0σ
= {ζx0, ζy0, ζxy0}T equal to {1, 0, 0}
T, {0, 1, 0}
T and {0, 0, 1}
T. In
view of the principle of superposition of effects, the general configuration, Ω, of a cracked
laminate under global load 0σ
, in the left side of figure 4, can be considered as the sum of two
loading conditions I and II:
I) The uncracked laminate is subjected to the global load given by the vector ζ0;
II) The cracked laminate is subjected to transverse and in-plane shear stresses only in
correspondence of the faces of the cracks. These stress components have to equilibrate the
stresses arising in those locations (we can refer to them as virtual crack faces) in the loading
condition I, in order to fit the requirement of stress-free crack surfaces in the general
configuration. Accordingly they must be equal to the stresses calculated applying the Classical
Lamination Theory (CLT) to the loading condition I (equation (50)).
0( ) ( ) ( )( )
,2 ,2 ,22,0
0( ) ( ) ( )( )
,6 ,6 ,66,0
0
σσ
σσ
σ
xi i ii
x y xy
yi i ii
x y xy
xy
c c c
c c c
(50)
The coefficients cx,j(i)
, cy,j(i)
, cxy,j(i)
represent the links between the global stress ζx0, ζy0 and ζxy0
respectively, and the stress component ζj in the i-layer, expressed in its material coordinate
system. They can be easily computed with the CLT.
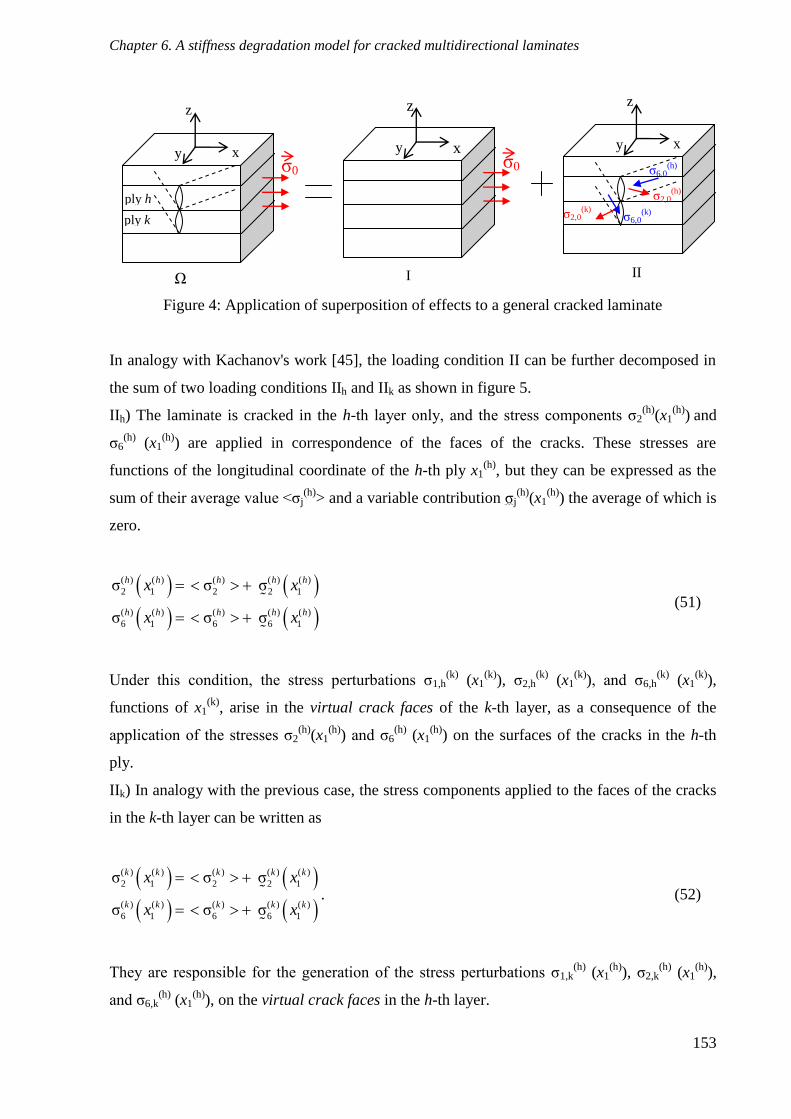
Chapter 6. A stiffness degradation model for cracked multidirectional laminates
153
Figure 4: Application of superposition of effects to a general cracked laminate
In analogy with Kachanov's work [45], the loading condition II can be further decomposed in
the sum of two loading conditions IIh and IIk as shown in figure 5.
IIh) The laminate is cracked in the h-th layer only, and the stress components ζ2(h)
(x1(h)
) and
ζ6(h)
(x1(h)
) are applied in correspondence of the faces of the cracks. These stresses are
functions of the longitudinal coordinate of the h-th ply x1(h)
, but they can be expressed as the
sum of their average value <ζj(h)
> and a variable contribution ζj(h)
(x1(h)
) the average of which is
zero.
( ) ( ) ( ) ( ) ( )
2 1 2 2 1
( ) ( ) ( ) ( ) ( )
6 1 6 6 1
σ σ σ
σ σ σ
h h h h h
h h h h h
x x
x x
(51)
Under this condition, the stress perturbations ζ1,h(k)
(x1(k)
), ζ2,h(k)
(x1(k)
), and ζ6,h(k)
(x1(k)
),
functions of x1(k)
, arise in the virtual crack faces of the k-th layer, as a consequence of the
application of the stresses ζ2(h)
(x1(h)
) and ζ6(h)
(x1(h)
) on the surfaces of the cracks in the h-th
ply.
IIk) In analogy with the previous case, the stress components applied to the faces of the cracks
in the k-th layer can be written as
( ) ( ) ( ) ( ) ( )
2 1 2 2 1
( ) ( ) ( ) ( ) ( )
6 1 6 6 1
σ σ σ
σ σ σ
k k k k k
k k k k k
x x
x x
. (52)
They are responsible for the generation of the stress perturbations ζ1,k(h)
(x1(h)
), ζ2,k(h)
(x1(h)
),
and ζ6,k(h)
(x1(h)
), on the virtual crack faces in the h-th layer.
x y
z
ζ0 x y
z
x y
z
ζ0
ζ2,0(h)
ζ6,0(h)
ζ2,0(k)
ζ6,0(k)
I II
ply h
ply k
Ω
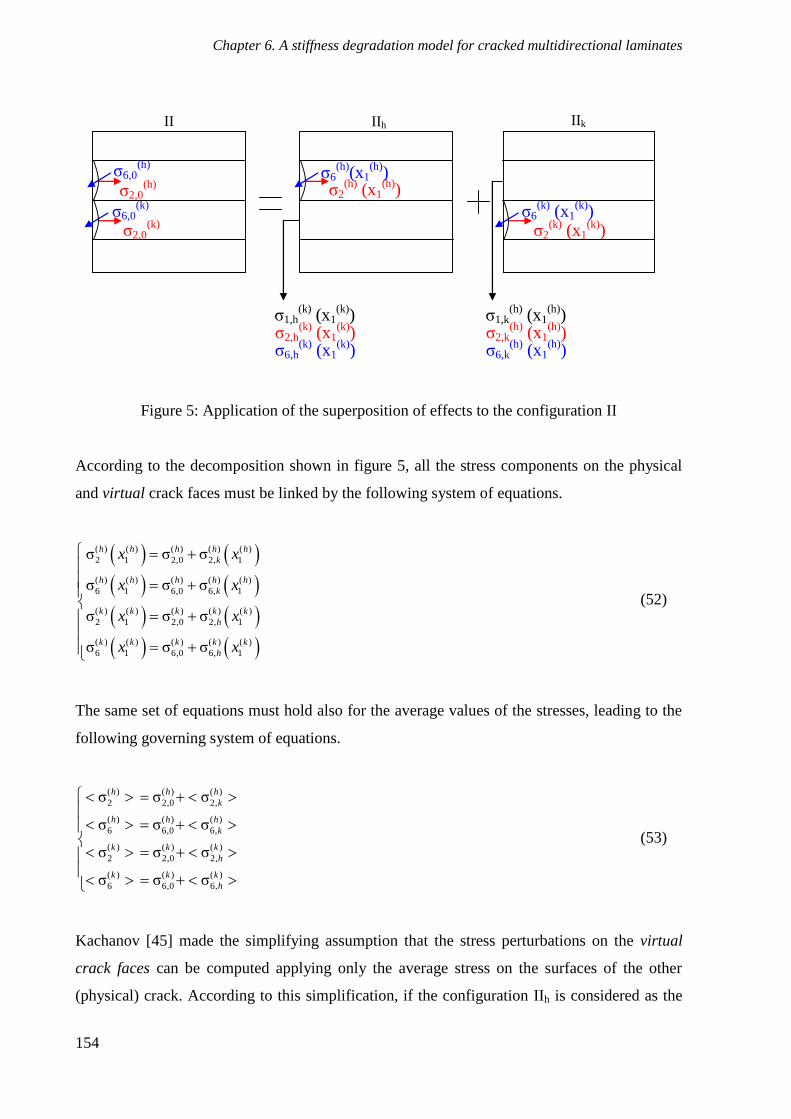
Chapter 6. A stiffness degradation model for cracked multidirectional laminates
154
Figure 5: Application of the superposition of effects to the configuration II
According to the decomposition shown in figure 5, all the stress components on the physical
and virtual crack faces must be linked by the following system of equations.
( ) ( ) ( ) ( ) ( )
2 1 2,0 2, 1
( ) ( ) ( ) ( ) ( )
6 1 6,0 6, 1
( ) ( ) ( ) ( ) ( )
2 1 2,0 2, 1
( ) ( ) ( ) ( ) ( )
6 1 6,0 6, 1
σ σ σ
σ σ σ
σ σ σ
σ σ σ
h h h h h
k
h h h h h
k
k k k k k
h
k k k k k
h
x x
x x
x x
x x
(52)
The same set of equations must hold also for the average values of the stresses, leading to the
following governing system of equations.
( ) ( ) ( )
2 2,0 2,
( ) ( ) ( )
6 6,0 6,
( ) ( ) ( )
2 2,0 2,
( ) ( ) ( )
6 6,0 6,
σ σ σ
σ σ σ
σ σ σ
σ σ σ
h h h
k
h h h
k
k k k
h
k k k
h
(53)
Kachanov [45] made the simplifying assumption that the stress perturbations on the virtual
crack faces can be computed applying only the average stress on the surfaces of the other
(physical) crack. According to this simplification, if the configuration IIh is considered as the
ζ2,0(h)
ζ2,0(k)
ζ6,0(h)
ζ6,0(k)
ζ2(h)
(x1(h)
) ζ6
(h)(x1
(h))
ζ2(k)
(x1(k)
) ζ6
(k) (x1
(k))
ζ6,h(k)
(x1(k)
) ζ2,h
(k) (x1
(k))
ζ1,h(k)
(x1(k)
)
ζ6,k(h)
(x1(h)
) ζ2,k
(h) (x1
(h))
ζ1,k(h)
(x1(h)
)
II IIh IIk

Chapter 6. A stiffness degradation model for cracked multidirectional laminates
155
sum of <IIh>, where only the average stresses <ζ2(h)
> and <ζ6(h)
> are applied, and IIh, where
only the variable contributions ζ2(h)
(x1(h)
) and ζ6(h)
(x1(h)
) are applied, the perturbations in the k-
th layer ζ1,h(k)
(x1(k)
), ζ2,h(k)
(x1(k)
), and ζ6,h(k)
(x1(k)
) can be estimated from the configuration
<IIh> only. This implies assuming that the loading condition IIh provides only a negligible
contribution for the stress perturbations in the k-th layer, or at least for their average values,
which are used in the governing system (53). The same can be said for the configuration IIk,
which can be seen as the sum of <IIk> and IIk, the latter being neglected for the calculation of
the stress perturbations ζ1,k(h)
(x1(h)
), ζ2,k(h)
(x1(h)
), and ζ6,k(h)
(x1(h)
) on the virtual crack faces in
the h-th layer.
In analogy with the superposition shown in figure 4, the loading conditions <IIh> and <IIk>
can be decomposed in the loading conditions <IIh,c> , <IIh,u> and <IIk,c> , <IIk,u> as shown in
figure 6 a) and b) respectively. The subscripts c and u refer to the fact that the laminate is
cracked and uncracked respectively.
Figure 6: Application of the superposition of effect to the configurations a) <IIh> and b) <IIk>
ζx,h and ζxy,h are unknown global stresses needed to make the stress components <ζ2(h)
> and
<ζ6(h)
> arise in the h-th layer in the configuration <IIh,u>, in order to satisfy equilibrium in the
<ζ2(h)
>
<ζ6(h)
> ζx,h
ζx,h
ζxy,h ζxy,h
<IIh> <IIh,c> <IIh,u>
a)
<ζ2(k)
> <ζ6
(k)>
ζx,k
ζx,k
ζxy,k ζxy,k
<IIk> <IIk,c> <IIk,u>
b)

Chapter 6. A stiffness degradation model for cracked multidirectional laminates
156
decomposition shown in figure 6a). The same role is played by the global stresses ζx,k, and
ζxy,k in the decomposition of figure 6b). Accordingly, the following equations can be written.
( ) ( ) ( )
2 ,2 , ,2 ,
( ) ( ) ( )
6 ,6 , ,6 ,
( ) ( ) ( )
2 ,2 , ,2 ,
( ) ( ) ( )
6 ,6 , ,6 ,
h h h
x x h xy xy h
h h h
x x h xy xy h
k k k
x x k xy xy k
k k k
x x k xy xy k
σ c σ c σ
σ c σ c σ
σ c σ c σ
σ c σ c σ
(54)
It is important to mention that the final results does not depend on the choice of the directions
of the couples of unknown global stresses. Normal stress in x-direction and shear stress in the
xy plane are chosen in this case, but a different combination of in-plane stresses, for example
ζx and ζy, could be used, without influencing the final result. According to figure 6a), the
average value of the stress perturbations on the virtual crack faces of layer k can be calculated
as the sum of two contributions, related to configurations <IIh,c> and <IIh,u>. In the condition
<IIh,u> they can be simply calculated by means of the coefficients cx,j(k)
, cy,j(k)
, cxy,j(k)
resulting
from the CLT, whereas in <IIh,c> they can be considered as the average stresses in the k-th
layer computed by means of the shear lag analysis of the laminate with cracks in the h-th ply,
represented by the coefficients defined in equations (42)-(44). Accordingly they can be written
as follows.
( ) ( ) ( ) ( ) ( )
1, , , , , ,1 , ,1 ,
( ) ( ) ( ) ( )
2, , , , , ,2
( ) ( ) ( )
6, , , , ,
( ) ( )
( ) ( )
( ) ( )
k k k k k
h h x h x h h xy h xy h x x h xy xy h
k k k k
h k h h x h x h h xy h xy h x
k k k
h h x h x h h xy h xy h
σ γ ρ σ γ ρ σ c σ c σ
σ T θ θ λ ρ σ λ ρ σ c σ
σ β ρ σ β ρ σ
( )
, ,2 ,
( ) ( )
,6 , ,6 ,
k
x h xy xy h
k k
x x h xy xy h
c σ
c σ c σ
(55)
Similarly, the perturbations in the h-th layer due to the applications of stresses on the crack
surfaces on layer k (figure 6b) can be written as
( ) ( ) ( ) ( ) ( )
1, , , , , ,1 , ,1 ,
( ) ( ) ( ) ( )
2, , , , , ,2
( ) ( ) ( )
6, , , , ,
( ) ( )
( ) ( )
( ) ( )
h h h h h
k k x k x k k xy k xy k x x k xy xy k
h h h h
k h k k x k x k k xy k xy k x
h h h
k k x k x k k xy k xy k
σ γ ρ σ γ ρ σ c σ c σ
σ T θ θ λ ρ σ λ ρ σ c σ
σ β ρ σ β ρ σ
( )
, ,2 ,
( ) ( )
,6 , ,6 ,
h
x k xy xy k
h h
x x k xy xy k
c σ
c σ c σ
. (56)
Chapter 6. A stiffness degradation model for cracked multidirectional laminates
157
Now, substituting equations (50) and (54)-(56) in the governing system (53), a non-
homogeneous linear system of four equations in the four unknown global loads ζx,h, ζxy,h, ζx,k,
and ζxy,k is obtained and can be easily solved.
In the general case of a symmetric laminate with nc cracked layers in its upper part, the
governing system (53) can be rewritten as
( ) ( ) ( )
2 2,0 2,1
( ) ( ) ( )
6 6,0 6,1
σ σ σ , ρ ρ 0
σ σ σ , ρ ρ 0
nh h h
k h kkk h
nh h h
k h kkk h
if and
if and
(57)
resulting in a system of 2nc equations. Similarly to equations (50), (54)-(56), the stress
components involved in (57) can be written as in equations (58)-(60) for every h-th cracked
layer.
0( ) ( ) ( )( )
,2 ,2 ,22,0
0( ) ( ) ( )( )
,6 ,6 ,66,0
0
σσ
σσ
σ
xh h hh
x y xy
yh h hh
x y xy
xy
c c c
c c c
(58)
( ) ( ) ( )
2 ,2 , ,2 ,
( ) ( ) ( )
6 ,6 , ,6 ,
h h h
x x h xy xy h
h h h
x x h xy xy h
σ c σ c σ
σ c σ c σ
(59)
( ) ( ) ( ) ( ) ( )1, , , , , ,1 , ,1 ,
( ) ( ) ( )2, , , , ,
( ) ( ) ( )6, , , , ,
( ) ( )
( ) ( )
( ) ( )
h h h h hk k x k x k k xy k xy k x x k xy xy k
h h hk h k k x k x k k xy k xy k
h h hk k x k x k k xy k xy k
σ γ ρ σ γ ρ σ c σ c σ
σ T θ θ λ ρ σ λ ρ σ c
σ β ρ σ β ρ σ
( ) ( ),2 , ,2 ,
( ) ( ),6 , ,6 ,
h hx x k xy xy k
h hx x k xy xy k
σ c σ
c σ c σ
(60)
Recalling all the decompositions, the general condition Ω can be written as the following sum:
, ,1
Ω , ρ 0n
k k c k u kk
I II II II if
(61)
Accordingly, the average global laminate strains in the x,y reference system, for a given
loading condition 0σ
, can be seen as the sum of the contributions coming from each
Chapter 6. A stiffness degradation model for cracked multidirectional laminates
158
configuration in which the general condition has been decomposed. Considering the average
strains in the configurations IIk negligible, the global strain vector can be written as follows.
, ,
, ,
, ,0 00 0
, ,,
, , ,1
, , ,σ σσ σ
ε εε ε
ε ε ε ε , ρ 0
γ γ γ γ
k c k u
k c k u
k c k u
x II x IIx x In
y y I y II y II kk
xy xy I xy II xy II
if
(62)
As in paragraph 6.2.3, the complete compliance matrix [Smd] of the laminate with cracks in
multiple layers (the subscript md is for multiple damage) can be written as a matrix containing
the three column strain vectors related to the global loads 0σ
= {1, 0, 0}T, {0, 1, 0}
T and {0, 0,
1}T , resulting in the following final equation.
0 0 0
, , ,
0 01
, , ,σ {1,0,0} σ {0,1,0} σ {0,0,1}
σ σ σ
ρ 0 0 0 , ρ 0
σ σ σT T T
x k x k x kn
md k kk
xy k xy k xy k
S S S S if
(63)
It is worth noting that equation (63) differs from equation (48), which does not consider crack
interaction, by means of the coefficients ζx,k and ζxy,k. Through equation (63) the elastic
properties can be computed analytically on the basis of the compliance matrix of a laminate
cracked in one single layer (equation (45)) and solving the system (57) for the global unknown
loads. It is worth mentioning that this procedure can be applied to any analytical or numerical
method which is suitable to calculate the elastic properties in the presence of cracks in one
layer only, as well as the average stresses in the other layers, as they are needed to write
equation (60) and to solve the system (57). From this point of view, the shear lag model
presented in paragraph 6.2 is only one possibility, but the procedure for modeling the
interaction can be coupled also with other stress transfer models [22,26,27].
6.4. Parametric analysis of crack interaction
In the following paragraph a parametric analysis is shown in order to understand the
importance of considering crack interaction for a reliable estimation of elastic properties. The
entire procedure described in paragraphs 6.2 and 6.3 is applied to laminates with lay-up
Chapter 6. A stiffness degradation model for cracked multidirectional laminates
159
[0m/θm/-θm/90m]s, with the elastic and geometric properties adopted by Singh and Talreja [9]
and listed in table 2, changing the number of layers m and the orientation of the off-axis plies
θ. The ratio between the elastic properties Ex, νxy and Gxy of the damaged laminate and those
of the pristine laminate Ex,0, νxy,0 and Gxy,0 is computed as a function of the crack density
which is considered the same for all the off-axis and transverse plies (ρ2 = ρ3 = ρ4), whereas ρ1
is set equal to zero. In particular, the percentage difference between the results obtained
without and with crack interaction is calculated as
,0 ,0
,0
,0 ,0
ν
,0
,0 ,0
,0
Δ 100
ν ν ν νΔ 100
ν ν
Δ 100
x
xy
xy
x x x xNI IE
x x I
xy xy xy xyNI I
xy xy I
xy xy xy xyNI IG
xy xy I
E E E E
E E
G G G G
G G
(64)
where the subscripts I and NI mean "Interaction" and "No Interaction" respectively.
Table 2: Material properties for the parametric analysis
Material E1
[MPa]
E2
[MPa]
ν12
G12 = G13
[MPa]
G23
[MPa]
ply thickness
[mm]
Glass/Epoxy [9] 44700 12700 0.297 5800 4885 0.125
In figures 7 a), b) and c), the quantities defined in equation (64) are plotted versus the crack
density when m = 4 and for three different values of the off-axis angle θ. In can be seen from
figures 7a) and c) that the prediction for Ex and Gxy without crack interaction is always non
conservative, the error being positive and increasing with the crack density. It is also clear
that, when crack interaction is neglected, the error committed is higher as the off-axis angle is
increased. This is in agreement with findings in [9] for the same kind of laminate lay-up.

Chapter 6. A stiffness degradation model for cracked multidirectional laminates
160
Figure 7: Influence of the crack density and of the off-axis angle on a) ΔEx, b) Δνxy and c) ΔGxy
Concerning the laminate's Poisson's ratio νxy (figure 7b)), the prediction provided by the model
without considering crack interaction is again non conservative for off-axis angles of 70° and
55°, allowing one to draw the same conclusions valid for the Young and shear moduli.
Conversely, for θ = 40° a conservative prediction is achieved if crack interaction is neglected,
as the error is negative, though very small for the analysed range of crack density.
In order to clarify the effect of ply thickness on crack interaction, the quantities defined in
equation (64) are plotted in figure 8a), b) and c) for θ = 70° and m = 1, 2 and 4.
0
2
4
6
8
10
0 0.5 1
ΔE
x
ρ2 = ρ3 = ρ4 [cracks /mm]
70
55
40
[04/θ4/-θ4/904]s
θ = 70°θ = 55°
θ = 40°
a)
0
2
4
6
8
10
0 0.5 1
ΔG
xy
ρ2 = ρ3 = ρ4 [cracks /mm]
705540
[04/θ4/-θ4/904]s
θ = 70°θ = 55°
θ = 40°
c)
-2
0
2
4
6
8
10
0 0.5 1
Δνx
y
ρ2 = ρ3 = ρ4 [cracks /mm]
70
55
40
b)
θ = 70°θ = 55°
θ = 40°
[04/θ4/-θ4/904]s
0
2
4
6
8
10
0 0.5 1
ΔE
x
ρ2 = ρ3 = ρ4 [cracks /mm]
70
55
40
[0m/70m/-70m/90m]s
m = 4m = 2
m = 1
a)
0
2
4
6
8
10
0 0.5 1
Δνx
y
ρ2 = ρ3 = ρ4 [cracks /mm]
70
55
40
[0m/70m/-70m/90m]s
m = 4m = 2
m = 1
b)

Chapter 6. A stiffness degradation model for cracked multidirectional laminates
161
Figure 8: Influence of the crack density and of the ply thickness on a) ΔEx, b) Δνxy and c) ΔGxy
Non conservative predictions are always achieved if crack interaction is not considered, and
the error is strongly dependent on the ply thickness, as it is an increasing function of the
number of plies m.
It can be concluded that in most cases neglecting crack interaction leads to non conservative
predictions of modulus reduction. This effect is more and more pronounced as the difference
between the orientation of the confining cracked plies is smaller and the ply thickness is
higher. Finally, crack interaction has a negligible influence when the crack density is very
small, whereas it becomes important when ρ increases.
Laminates with lay-up [0/θ4/0m/-θ4]s are also analysed, where the cracked off-axis plies are
separated by m undamaged 0° layers, in order to understand the entity of crack interaction
when two damaged plies are not contiguous. The same material properties of the previous
analysis are adopted, and the errors defined in equation (64) are plotted in figures 9a)-c) for θ
= 70°. As expected, the higher m, the lower the difference between the prediction without and
with interaction is.
Finally it can be concluded that crack interaction can be neglected only if the crack density is
very low, if cracked plies are very thin or if they are separated by thick undamaged layers.
Apart from these restrictive conditions, crack interaction has to be included in the analysis by
means of the analytical procedure defined in paragraph 6.3.2 to avoid wrong and non
conservative predictions for the degradation of elastic properties.
0
2
4
6
8
10
0 0.5 1Δ
Gx
yρ2 = ρ3 = ρ4 [cracks /mm]
70
55
40
[0m/70m/-70m/90m]s
m = 4m = 2
m = 1
c)
Chapter 6. A stiffness degradation model for cracked multidirectional laminates
162
Figure 9: Influence of the crack density and of the undamaged 0° ply thickness on a) ΔEx, b)
Δνxy and c) ΔGxy
6.5. Validation of the interaction model
The entire model described in sections 6.2 and 6.3 for multiply damaged laminates is now
validated by means of experimental results from the literature.
Fatigue tests were carried out by Messenger and Smith [46] on [0/90/45/-45]s glass/epoxy
laminates with standard and urethane modified resins. They provided accurate data on the
crack density evolution in the 90°, 45° and -45° plies as well as on the Young modulus
reduction during fatigue life. These results have been used as input for the present model and
the comparison between experimental data and predictions is shown in figures 10 a) and b). As
the ply thickness is very small (0.185 mm [46]), the difference between the predictions with
and without interaction is not dramatic. However it is worth noting that the model which
accounts for crack interaction gives a better and more conservative prediction for both resin
systems.
0
2
4
6
8
10
0 0.5 1
ΔE
x
ρ2 = ρ4 [cracks /mm]
70
55
40
[0/704/0m/-704]s
m = 4m = 2
m = 1
a)
0
2
4
6
8
10
0 0.5 1
Δνx
y
ρ2 = ρ4 [cracks /mm]
70
55
40
m = 4m = 2
m = 1
b)
[0/704/0m/-704]s
0
2
4
6
8
10
0 0.5 1
ΔG
xy
ρ2 = ρ4 [cracks /mm]
70
55
40
m = 4m = 2
m = 1
c)
[0/704/0m/-704]s
Chapter 6. A stiffness degradation model for cracked multidirectional laminates
163
Figure 10: Comparison between experimental data from [46] and model predictions for
glass/epoxy laminates with a) standard and b) modified resin
Varna et al.[16] carried out static tests on [0/θ4/-θ4/01/2]s glass/epoxy laminates with θ = 70, 55,
40 and 25 degrees. Results for θ = 70° are shown in figure 11 together with the present model
prediction and finite element results from [8]. It is evident that the agreement between
predictions and experimental data is not satisfactory. However, also Cortes-Barbero [40] and
Li and coauthors [8] found a bad correlation with these results, suggesting that probably some
additional phenomena could have been responsible for a further stiffness degradation in the
experimental tests. This is even more evident for the results concerning θ = 55° (see [16]).
Varna and coauthors concluded that, under static loading, if the off-axis angle is high enough,
the material non-linear shear response is responsible for a further Young modulus reduction,
which occurred even in the absence of off-axis cracks. This phenomenon could be responsible
also for the disagreement between model predictions and experimental data for θ = 70°.
0.3
0.4
0.5
0.6
0.7
0.8
0.9
1.0
1.1
0.0E+00 5.0E+04 1.0E+05 1.5E+05 2.0E+05
Ex/E
x,0
Number of cycles
experiments [46]
[0/90/45/-45]s
no interaction
interaction
a)
0.3
0.4
0.5
0.6
0.7
0.8
0.9
1.0
1.1
0.E+00 5.E+04 1.E+05 2.E+05 2.E+05
Ex/E
x,0
Number of cycles
experiments [46]
[0/90/45/-45]sno interaction
interaction
b)

Chapter 6. A stiffness degradation model for cracked multidirectional laminates
164
However it can be seen that a satisfactory agreement is found if the present model accounting
for crack interaction is compared to the finite element results from [8].
Figure 11: comparison between the present model predictions, FEM predictions [8] and
experimental data from [16]
6.6. Conclusions
An analytical model has been proposed for the estimation of elastic properties of a
multidirectional symmetric laminate with off-axis cracks in multiple layers with different
orientations.
First, a bi-dimensional shear lag analysis of a symmetric laminate with cracks in one single ply
was developed, the results of which are the in-plane stresses, strains and displacements
averaged over the thickness of each ply, functions of the transverse coordinate of the cracked
layer. Averaging stresses and strains over the entire volume of each ply it is possible to obtain
the entire compliance matrix of the damaged laminate, which is a function of the crack
density. The model requires as input data the lamina elastic and geometric properties only.
Then the problem of a laminate cracked in multiple plies was treated by means of an analytical
model accounting for the mutual interaction between cracks in different plies. The result is the
compliance matrix of a laminate with cracks in multiple layers, which can be analytically
calculated, without the need of an iterative procedure, simply starting from the results
computed through the single cracked layer model.
It is important to underline that the procedure proposed to account for crack interaction does
not have necessary to be coupled with the shear lag analysis carried out in the present chapter,
0.0
0.2
0.4
0.6
0.8
1.0
1.2
0.0 0.2 0.4 0.6 0.8 1.0 1.2
Ex/E
x,0
ρ2 = ρ3 (cracks / mm)
experiments [16]
FEM [8]
no interaction
interaction
[0/704/-704/01/2]s

Chapter 6. A stiffness degradation model for cracked multidirectional laminates
165
but also with any other available model (included finite element models) suitable to calculate
the elastic properties and the average ply stresses in the presence of cracks in a single layer.
The proposed model was found to be in good agreement with experimental and finite element
data from the literature.
Acknowledgements
The writer would like to thank Mr. Lucio Maragoni for the help in the implementation of the
model with the code Matlab.

Chapter 6. A stiffness degradation model for cracked multidirectional laminates
166
References of chapter 6
[1] Tong J, Guild FJ, Ogin SL, Smith PA. On matrix crack growth in quasi isotropic
laminates-I. Experimental investigation. . Composites Science and Technology 1997;
57: 1527-1535
[2] Varna J, Joffe R, Akshantala NV, Talreja R. Damage in composite laminates with off-
axis plies. Composites Science and Technology 1999; 59: 2139-2147
[3] Varna J, Joffe R, Talreja R. A synergistic damage-mechanics analysis of transverse
cracking in [±θ/904]s laminates, Composites Science and Technology 61 (2001) 657–
665
[4] A.W. Wharmby, F. Ellyin, Damage growth in constrained angle-ply laminates under
cyclic loading, Composites Science and Technology 62 (2002) 1239–1247
[5] Tohgo K, Nakagawa S, Kageyama K. Fatigue behaviour of CFRP cross-ply laminates
under on-axis and off-axis cyclic loading. International Journal of Fatigue 2006; 28:
1254-1262
[6] Adden S, Horst P, Stiffness degradation under fatigue in multiaxially loaded non-
crimped-fabrics, International Journal of Fatigue 2010; 32: 108–122
[7] Quaresimin M, Carraro PA , Damage initiation and evolution in glass/epoxy tubes
subjected to combined tension-torsion fatigue loading, DOI:
http://dx.doi.org/10.1016/j.ijfatigue.2014.01.002
[8] S. Li, C. V. Singh, R. Talreja, A representative volume element based on translational
symmetries for FE analysis of cracked laminates with two arrays of cracks,
International Journal of Solids and Structures, 46, 1793–1804 (2009)
[9] C. V. Singh, R. Talreja, A synergistic damage mechanics approach for composite
laminates with matrix cracks in multiple orientations, Mechanics of Materials 41
(2009) 954–968
[10] Gudmundson, P. and Zang, W. (1993). A universal model for thermoelastic properties
of macro cracked composite laminates, Int. J. Solids Struct., 30 (1993) 3211–3231
[11] Lundmark, P., Varna, J., 2005. Constitutive relationships for laminates with ply cracks
in in-plane loading. Int. J. Dam. Mech. 14 (3) (2005) 235–259
[12] Lundmark, P., Varna, J., Crack face sliding effect on stiffness of laminates with ply
cracks. Compos. Sci. Tech. 66 (10) (2006) 1444–1454
[13] Lundmark, P., Varna, J., Stiffness Reduction in Laminates at High Intraluminar Crack
Density: Effect of Crack Interaction, International Journal of Damage Mechanics, 20
(2), 279-97 (2011)
Chapter 6. A stiffness degradation model for cracked multidirectional laminates
167
[14] Talreja, R., A synergistic damage mechanics approach to durability of composite
material systems. In: Cardon, A., Fukuda, H., Reifsnider, K. (Eds.), Progress in
Durability Analysis of Composite Systems. A.A. Balkema, Rotterdam, pp. 117–129
(1996)
[15] Varna, J., Akshantala, N.V. and Talreja, R., Crack Opening Displacement and the
Associated Response of Laminates with Varying Constraints, Int. J. Dam. Mech., 8:
174–193 (1999)
[16] Varna, J., Joffe, R., Akshantala, N.V. and Talreja, R., Damage in Composite Laminates
with Off-axis Plies, Comp. Sci. Tech., 59: 2139–2147 (1999)
[17] Varna, J., Joffe, R. and Talreja, R., A Synergistic Damage Mechanics Analysis of
Transverse Cracking in [±θ, 904]s Laminates, Comp. Sci. Tech., 61: 657–665 (2001)
[18] Singh, C.V., Talreja, R., Analysis of multiple off-axis ply cracks in composite
laminates. Int. J. Solids Struct. 45 (16), 4574–4589 (2008)
[19] Varna J., Physical interpretation of parameters in synergistic continuum damage
mechanics model for laminates, Composites Science and Technology 68 (2008) 2592–
2600
[20] Hashin Z. Analysis of cracked laminates: a variational approach. Mech Mater
1985;4:121–36
[21] Hashin Z. Analysis of stiffness reduction of cracked cross-ply laminates. Eng Fract
Mech 1986;25(5-6):771–8
[22] V. Vinogradov, Z. Hashin, Variational analysis of cracked angle-ply laminates,
Composites Science and Technology 70 (2010) 638–646
[23] Hashin Z. Analysis of orthogonally cracked laminates under tension. J Appl Mech
1987;54:872–9
[24] L. N. McCartney, Analytical Models of Stress Transfer in Unidirectional Composites
and Cross-Ply Laminates, and Their Application to the Prediction of Matrix/Transverse
Cracking, Local Mechanics Concepts for Composite Material Systems IUTAM
Symposia 1992, pp 251-282
[25] McCartney LN. Theory of stress transfer in a 0-90-0 cross ply laminate containing a
parallel array of transverse cracks. J Mech Phys Solids 1992;40:27-68
[26] McCartney LN. Stress transfer mechanics for ply cracks in general symmetric
laminates. NPL Report CMMT(A)50, December 1996
[27] McCartney LN., Model to predict effects of triaxial loading on ply cracking in general
symmetric laminates, Composites Science and Technology 60 (2000) 2255-2279
Chapter 6. A stiffness degradation model for cracked multidirectional laminates
168
[28] Nairn J.A., Mendels D.A., On the use of planar shear-lag methods for stress-transfer
analysis of multilayered composites, Mechanics of Materials, 33(6), 335-362, 2001
[29] K.W. Garrett, J.E. Bailey Multiple transverse fracture in 90° cross-ply laminates of a
glass fibre-reinforced polyester, J. Mater. Sci., 12 (1977), p. 157-168
[30] P.W. Manders, T.W. Chou, F.R. Jones, J.W. Rock Statistical analysis of multiple
fracture in [0/90/0] glass fiber/epoxy resin laminates, J. Mater. Sci., 19 (1983), p.
2876-2889
[31] L.R. Dharani, H. Tang Micromechanics characterization of sublaminates damage, Int.
J. Fract., 46 (1990), p. 123-140
[32] Reifsnider, K.L., Some fundamental aspects of the fatigue and fracture response of
composite materials. In: Proceedings of the 14th Annual Meeting of SES, Lehigh, PA,
November, Lehigh, PA, November 1977
[33] N. Laws, G.J. Dvorak, Progressive transverse cracking in composite laminates, J.
Comp. Mater., 22 (1988), p. 900-916
[34] H.L. McManus, J.R. Maddocks, On microcracking in composite laminates under
thermal and mechanical loading, Polym. Polym. Compos., 4 (1996), p. 305-314
[35] Lee J.W., Daniel I.M., Progressive transverse cracking of crossply composite
laminates, Journal of Composite Materials, v 24, n 11, p 1225-1243, 1990
[36] Flaggs D.L., Prediction of Tensile Matrix Failure in Composite Laminates, Journal of
Composite Materials (1985) 19: 29-50
[37] M. Kashtalyan, C. Soutis, Modelling off-axis ply matrix cracking in continuous fibre-
reinforced polymer matrix composite laminates, J Mater Sci (2006) 41:6789–6799
[38] C. Henaff-Gardin, M. C. Lafarie-Frenot, D. Gamby, Doubly periodic matrix cracking
in composite laminates Part 1: General in-plane loading, Composite Structures 36
(1996) 113-130
[39] T. Yokozeki, T. Aoki, Overall thermoelastic properties of symmetric laminates
containing obliquely crossed matrix cracks, Composites Science and Technology 65
(2005) 1647–1654
[40] D.H. Cortes, E.J. Barbero, Stiffness reduction and fracture evolution of oblique matrix
cracks in composite laminates, Ann. Solid Struct. Mech. (2010) 1:29–40
[41] C.L. Tsai, I.M. Daniel, The behavior of cracked cross-ply composite laminates under
shear loading, International Journal of Solids and Structures Volume 29, Issue 24,
1992, Pages 3251–3267

Chapter 6. A stiffness degradation model for cracked multidirectional laminates
169
[42] J. Zhang, K. P. Herrmann, Stiffness degradation induced by multilayer intralaminar
cracking in composite laminates, Composites: Part A 30 (1999) 683–706
[43] M. Kashtalyan, C. Soutis, Stiffness degradation in cross-ply laminates damaged by
transverse cracking and splitting, Composites: Part A 31 (2000) 335–351
[44] D.G. Katerelos, L.N. McCartney, C. Galiotis, Effect of off-axis matrix cracking on
stiffness of symmetric angle-ply composite laminates, International Journal of Fracture
(2006) 139:529–536
[45] M. Kachanov, Elastic solids with many cracks: a simple method of analysis,
International Journal of Solids and Structures, 23, 23-43 (1987)
[46] Messenger CR, Smith PA, Bader MG. Investigation of delamination (and associated
matrix cracking) in composite laminates under static and fatigue loading. Final report
to DRA (RAE), DRA REF: XRA/10/28/26. UK: University of Surrey, 1992

Chapter 6. A stiffness degradation model for cracked multidirectional laminates
170
Chapter 7. Prediction of crack density evolution for multidirectional laminates under fatigue loading
171
7
Prediction of crack density evolution for
multidirectional laminates under fatigue loading
7.1. Introduction
As already pointed out in this thesis, the fatigue behaviour of composite laminates is
characterised by a progressive damage evolution from the beginning of fatigue life to the final
failure. The main macroscopic evidence of the damage evolution is the degradation of the
global elastic properties of laminates. In several applications the stiffness is a crucial
parameters in the design process and this makes it essential to be able to predict its loss during
the in-service cyclic loads. It is proved that the degradation of the elastic properties is due to
damage mechanisms that are not directly responsible for the laminate failure and therefore
they have been defined secondary damage mechanisms [1,2]. Such mechanisms are the
initiation and through-the-width propagation of multiple matrix cracks in the off-axis layers,
followed by the onset and propagation of delaminations [2-6]. In particular the accumulation
of matrix cracks can lead to a considerable stiffness loss much before the laminate failure. In
addition they act as stress concentrators of the 0° plies promoting the failure of the fibres, the
latter being a primary damage mechanism [1,2] which brings to the complete failure (i.e.
separation) of a laminate.
Because of the importance to predict the fatigue damage evolution besides the final failure,
this topic has been treated by several researchers in the last two decades. After a literature
review, the main predictive models can be grouped in two kinds of approach, namely:
1) Models which do not directly correlate the damage evolution (stiffness and residual strength
degradation) to the damage mechanisms (i.e. off-axis cracks initiation and propagation):
1.1. Analytical models based on a Continuum Damage Mechanics-like approach;
1.2. Finite Element (FE) methods where the element behaviour is characterised by
progressive and/or sudden degradation rules;
2) Models based on the prediction of the off-axis crack density evolution:
2.1. Models based on empirical laws for the crack density evolution;
2.2. Models based on stress distributions and statistical fatigue strength distribution.
Chapter 7. Prediction of crack density evolution for multidirectional laminates under fatigue loading
172
In the following, some models relevant to the above mentioned approaches are briefly
presented and discussed. The references are not reported in chronological order, with the aim
to favour a logic flow of the ideas at the basis of the models.
1.1. Based on the damage evolution pattern highlighted by Reifsneider and co-authors [7], Wu
and Yao in 2010 [8] proposed a new versatile empirical rule for the degradation of a laminate's
stiffness in the loading direction. Two parameters must be calibrated on the experimental data,
but they are function of the stacking sequence and hence this model is not suitable to make
predictions for different lay-ups without a dedicated experimental characterisation. However
the proposed law was shown to describe very well the stiffness trend once the parameters were
suitably calibrated.
Much before, in 1997, Shokrieh and Lessard [9,10] proposed to model the fatigue damage
evolution of an unidirectional (UD) lamina by means of empirical laws describing the gradual
stiffness and residual strength degradation under fatigue loading. An extensive experimental
campaign is needed for the calibration of such laws under several loading conditions leading
to different damage mechanisms. The final failure of a ply is then predicted by means of
polynomial criteria where the stress components are normalised with respect to the residual
strength expressed by means of the above mentioned degradation rules.
1.2. Later, Shokrieh and Lessard [11,12] applied their model to multidirectional laminates by
means of FE 3D analyses of laminates in which the elements of each ply behaved according to
the gradual degradation rules defined in [9]. After the failure of a ply was detected by means
of the polynomial criteria proposed in Ref. [9] its properties were suddenly degraded to zero.
The application of the model in Ref. [12] showed a very good capability in the prediction of
the S-N curve for the complete failure of a laminate, but no considerations were done on the
global stiffness trend.
In 2012 Naderi and Maligno [13] applied the same method proposed by Shokrieh and Lessard
[11] with two important differences: they carried out 2D FE analyses and, most of all, they
assigned to every element a strength based on a Gaussian distribution, thus simulating the
presence of defects due to the manufacturing process. They obtained sound predictions for the
S-N curves related to the laminates' complete failure, but, again, no comparisons were shown
for the stiffness degradation.
In 2013 Kennedy et al. [14] proposed a method conceptually similar to that of Shokrieh and
Lessard [11], based on the 3D analysis of a laminate, whose element properties were gradually
degraded according to empirical laws. The element failure, followed by the sudden
degradation of the ply properties, is predicted by means of a Puck-like criterion, suitably

Chapter 7. Prediction of crack density evolution for multidirectional laminates under fatigue loading
173
extended to fatigue loading. They obtained a good correspondence between the simulation
results and experimental data on multidirectional laminates concerning the stiffness trend.
Lian and Yao in 2010 [15] proposed a procedure based on 3D FE analyses of a laminate where
the strength properties were assigned to each element based on a statistical distribution. The
elastic properties of each element were gradually degraded, always by means of empirical
laws, until its failure was predicted by means of a polynomial criterion similar to those of
Hashin [16] coupled with normalised S-N curves for a single lamina under different loading
conditions. After the element failure its properties were suddenly degraded. Lian and Yao
obtained sound predictions of both the stiffness trends and S-N curves for multidirectional
laminates. The main disadvantage of this method, and in general of the models described
above, is that they based on empirical laws both for the prediction of the properties
degradation and element failure. In addition, none of them considers properly the crack
propagation phase which can be important for a reliable prediction of the global stiffness
degradation, as will be discussed in the following sections.
2) The second kind of approach consists in predicting the evolution of the crack density in the
off-axis layers as an input for models capable to link the crack density to the global elastic
properties of a multidirectional laminate. This is based on the fact that the accumulation and
propagation of off-axis cracks is the main source of damage, mainly in the earlier stages of
fatigue life. In addition several models can be found in the literature which are able to predict
the laminate stiffness as a function of the density of cracks in its layers (see Refs. [17-24]
among the others). Recently, a model based on the shear lag method has been proposed by
Carraro and Quaresimin, accounting also for the interaction between different cracked layers
[25,26 and chapter 5 of the present thesis]. While several and reliable models can be found to
link the crack density to the stiffness properties, a lower number of contributions have been
published concerning the prediction of the crack density evolution, mainly under fatigue
loading. In addition a general and well defined procedure is not still recognised by the
scientific community. Some very interesting contributions can be found for the static loading
case, and they can be grouped in energy-based [18,27,28] and stress-based [29-31]
approaches. Only Vigronadov and Hashin [27] and Huang et al. [30,31] considered the
statistical distribution of strength which is essential for an accurate prediction of the crack
density evolution.
Concerning fatigue loading, as mentioned before, two approaches have been identified for the
prediction of the crack density evolution (empirical and stress-based models).

Chapter 7. Prediction of crack density evolution for multidirectional laminates under fatigue loading
174
2.1. Liu and Lessard [32] used a simple empirical rule for a damage variable which is
representative of the entity of the crack density and also delaminations. Then they related the
damage variable to the global stiffness by means of relationships provided by Talreja [33] and
O' Brien [34].
Subramanian and co-authors [35] proposed a cumulative damage model for cross-ply
laminates, capable of predicting the stiffness degradation as well as the final failure by means
of a critical element concept. For the sake of the stiffness loss, the crack density evolution was
predicted by means of empirical laws, and used as input for a simple shear lag analysis.
In 2002 Henaff-Gardin and Lafarie-Frenot [36] developed a method for cross-ply laminates
based on an energetic approach for the prediction of the cycles spent for the initiation of the
first transverse crack, followed by an empirical law to predict the fatigue evolution of a
characteristic damage variable proportional to the crack density.
Another interesting contribution for cross-plies was provided by Hoang and co-authors in
2010 [37]. They proposed to use an approach based on iso-crack density curves Vs number of
cycles which could be obtained, after some assumptions on their shape, by quasi-static tests.
All the models discussed above provided more or less reliable results when compared to
experimental data series presented in the relevant papers. They have the advantage of being
simple in their application, but they lack in generality since they are based on empirical laws.
2.2. According to the author's best knowledge, the only stress-based model for the prediction
of the crack density evolution under cyclic loading in that proposed by Sun and co-authors in
2003, which is valid for a cross-ply laminate [38]. They carried out a Monte Carlo simulation
where the 90° layer of a cross-ply laminate was divided in small elements whose strength was
assigned according to the Weibull distribution. The failure of an element was predicted on the
basis of the S-N curve for the 90° UD lamina, whose input were the ply stresses. The latter
were calculated considering the stress re-distribution after cracking by means of a shear lag
analysis. The results of the simulations were in very good agreement with experimental results
concerning the crack density evolution. They did not consider the transverse cracks
propagation phase, but they did not need to do that since the model was verified against
experimental results for lay-ups in which the thickness of the 90° plies was high enough to
promoting the sudden propagation of the nucleated cracks. This is also proved by some images
of the damaged specimens shown in Ref. [38].
In the writer's opinion this is the most reliable and refined model in the literature in this field.
Within this frame, the aim of the present work is to move one step further and develop a tool
for the prediction of the fatigue crack density evolution for symmetric laminates with a general
Chapter 7. Prediction of crack density evolution for multidirectional laminates under fatigue loading
175
lay-up, considering both the initiation and the propagation phases, which are, in general,
distinct and describable by means of different tools.
The presence of off-axis plies with any orientation complicates the problem because of the
multiaxial stress state, which changes during fatigue life because of stress re-distributions after
cracking. For this purpose, a crack initiation criterion has been proposed by the authors [39
and chapter 4]. According to this criterion the S-N curves should be expressed by means of an
equivalent stress ζeq, accounting for the multiaxial stress state. The equivalent stress has been
defined on the basis of the damage mechanisms at the microscopic scale leading to the
initiation of a macro-crack. The Local Maximum Principal Stress (LMPS) and the Local
Hydrostatic Stress (LHS) should be used as ζeq, depending on the amount of in-plane shear
stress ζ6 (see Ref. [39] or chapter 4 of the present thesis for the details).
The multiaxial criterion proposed in chapter 4 is included in the procedure proposed for the
crack density prediction, allowing to deal with cracks initiation in off-axis plies.
7.2. Definition of crack density
According to its most trivial and common definition, the crack density is meant as the total
number of initiated cracks divided by the observation length perpendicularly to the crack
faces:
ρ
sin θ
n
L
(1)
Where n is the total number of initiated cracks, L and θ are defined in figure 1.
It is proven that this definition of the crack density, which can be defined as the total crack
density ρ, is not a good parameter to correlate with the stiffness degradation. In fact, if the
cracks are not completely spanning through the width of a laminate their length becomes a
variable of extreme importance to be accounted for a sound estimation of the stiffness
degradation [2,19,40]. Accordingly, the weighted crack density, ρw, can be defined as the total
number of cracks, each of them being weighted by its length c, divided by the observation
length, as in equation (2):
1ρni i
w
c
w L
(2)
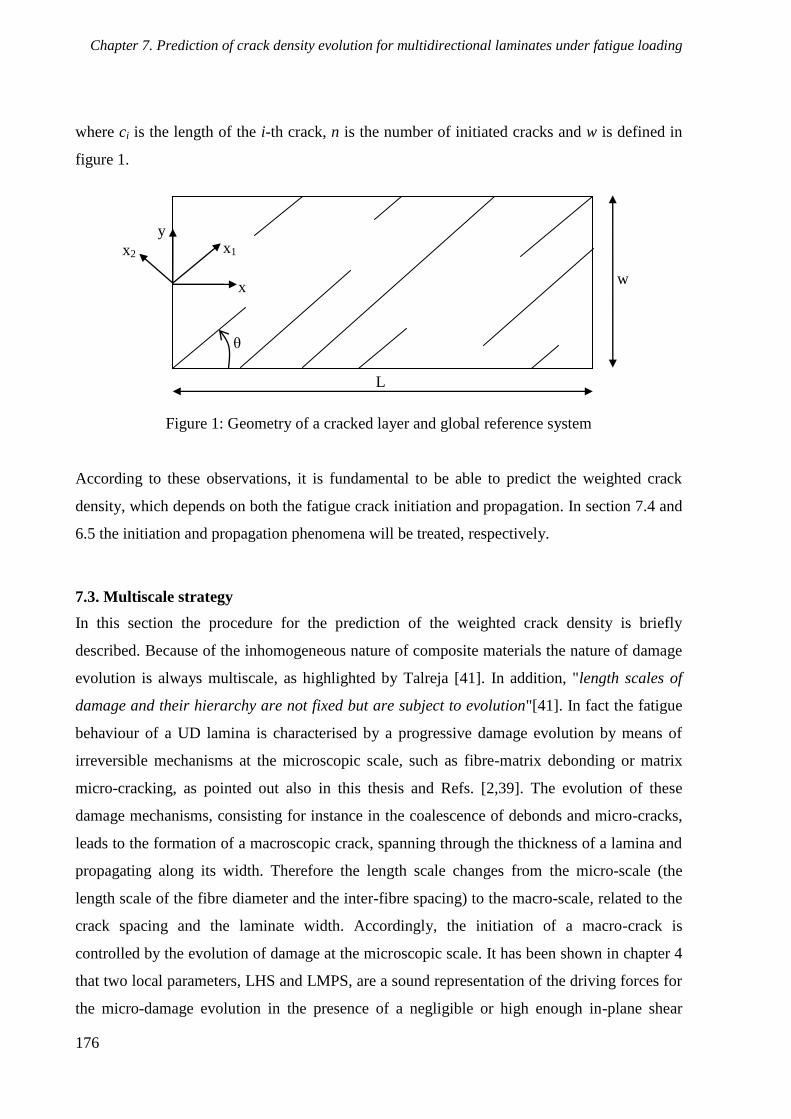
Chapter 7. Prediction of crack density evolution for multidirectional laminates under fatigue loading
176
where ci is the length of the i-th crack, n is the number of initiated cracks and w is defined in
figure 1.
Figure 1: Geometry of a cracked layer and global reference system
According to these observations, it is fundamental to be able to predict the weighted crack
density, which depends on both the fatigue crack initiation and propagation. In section 7.4 and
6.5 the initiation and propagation phenomena will be treated, respectively.
7.3. Multiscale strategy
In this section the procedure for the prediction of the weighted crack density is briefly
described. Because of the inhomogeneous nature of composite materials the nature of damage
evolution is always multiscale, as highlighted by Talreja [41]. In addition, "length scales of
damage and their hierarchy are not fixed but are subject to evolution"[41]. In fact the fatigue
behaviour of a UD lamina is characterised by a progressive damage evolution by means of
irreversible mechanisms at the microscopic scale, such as fibre-matrix debonding or matrix
micro-cracking, as pointed out also in this thesis and Refs. [2,39]. The evolution of these
damage mechanisms, consisting for instance in the coalescence of debonds and micro-cracks,
leads to the formation of a macroscopic crack, spanning through the thickness of a lamina and
propagating along its width. Therefore the length scale changes from the micro-scale (the
length scale of the fibre diameter and the inter-fibre spacing) to the macro-scale, related to the
crack spacing and the laminate width. Accordingly, the initiation of a macro-crack is
controlled by the evolution of damage at the microscopic scale. It has been shown in chapter 4
that two local parameters, LHS and LMPS, are a sound representation of the driving forces for
the micro-damage evolution in the presence of a negligible or high enough in-plane shear
L
w x
y
θ
x1 x2

Chapter 7. Prediction of crack density evolution for multidirectional laminates under fatigue loading
177
stress, respectively. The bridge between the macro-stresses in the material coordinates system
(ζ1, ζ2, and ζ6) and the micro-stresses is represented by stress concentration factors computed
by means of a micromechanical analysis, as reported in chapter 4. LHS and LMPS can be used
as equivalent stress, ζeq, for a successful representation of the lamina S-N curves in two single
scatter bands, accounting for the influence of multiaxial stress states. The initiation of off-axis
cracks in a ply within a multidirectional laminate is therefore a micro-damage driven
phenomenon, and therefore it can be predicted by means of S-N curves expressed in terms of
ζeq = LHS or LMPS, which are local parameters. The latter are calculated on the basis of the
macro-stresses which can be uniform along the transverse direction, if the ply is undamaged,
or non uniforms because of stress redistribution due to cracking. The stress redistribution can
be treated as a macro-scale phenomenon, how it is commonly done in the literature, and it can
be computed by means of several analytical [17,23-25] and semi-analytical [18] methods or by
means of Finite Element (FE) analyses of cracked laminates. Once the initiation of cracks has
been predicted, it is fundamental to describe their through-the-width propagation, which is
treated as a macroscopic phenomenon. It has been shown in the literature [3,42-44] and and in
chapter 3 that the crack propagation can be successfully described by means of a Paris-like law
relating the Crack Growth Rate (CGR) to the Strain Energy Release Rate (SERR) or to the
Stress Intensity Factor (SIF).
A schematic of the multiscale procedure for the prediction of the weighted crack density
evolution is shown in figure 2, and it consists in the simulation of fatigue life by progressively
increasing the number of cycles by steps ΔN.
For a given step of fatigue cycles ΔN, and for every off-axis layer, the analysis is divided in
the following points:
1) Calculation of ply stresses in each layer, with the possible presence of off-axis cracks, and
therefore considering the stress redistribution.
2) Calculation of micro-stresses (or local stresses) by means of a fibre matrix unit cell
subjected to periodic boundary conditions (see the stress concentration factors defined in
chapter 4 and Ref. [39]).
3) Calculation of the fatigue parameters LHS and LMPS.
4) According to the multiaxial condition, calculation of the total density of nucleated cracks,
by using the LHS of LMPS master curves for the material considered. The statistical
distribution of fatigue strength and the sequence effect, due to the stress redistribution, must be
accounted for.

Chapter 7. Prediction of crack density evolution for multidirectional laminates under fatigue loading
178
5) Analysis of the crack propagation phase to compute the length of all the nucleated cracks
and calculation of the weighted crack density.
6) Updating the crack spacing, increasing the number of cycles of a further step ΔN and
repeating steps 1-6.
Steps 4 and 5 will be described in detail in the next sections.
Figure 2: schematic of the procedure for the prediction of the weighted crack density
7.4. Prediction of multiple crack initiation
In this section the procedure for the prediction of off-axis crack initiation is described in detail.
As already mentioned, the basic idea is that the initiation of cracks is controlled by the fatigue
resistance of the material considered, represented by the S-N curves expressed in terms of an
equivalent stress ζeq (LHS or LMPS). The S-N curves are expressed by means of the typical
power law relating the equivalent stress to the number of cycles to failure Nf:
σ a
eq fK N (3)
ply-by-ply analysis
macroscopic ply stresses
fibre-matrix
unit cell
local stresses calculation
LHS or LMPS
lamina master curve
Nf
ζeq
ply
crack
initiation
statistics
weighted
crack density
evolution
sequence
effect
propagation
x y
z
N = N+ΔN

Chapter 7. Prediction of crack density evolution for multidirectional laminates under fatigue loading
179
The exponent a is an input of the model and it can be obtained by a series of experimental data
on an off-axis lamina with whatever orientation. More precisely, two values of a should be
introduced, aLHS and aLMPS, to be used whether the fatigue behaviour is LHS- or LMPS-
controlled, respectively. As already explained in chapter 4, aLHS can be obtained by testing
under fatigue a UD lamina under pure transverse stress condition (θ = 90° for instance), while
aLMPS can be calculated from experimental tests on a UD lamina under shear-dominated stress
states (θ = 10-45° for instance). A fundamental hypothesis of the model is that the scatter band
describing the fatigue behaviour is characterised by a Weibull distribution of the coefficient K,
the cumulative probability P(K) being expressed by equation (4).
0
( ) 1 exp
m
KP K
K
(4)
m and K0 are respectively the shape and scale parameters of the Weibull distribution. They are
input variables that can be computed as explained later in section 7.4.1. Expressing K from
equation (3) and substituting in equation (4) the probability to form cracks at a number of
cycles equal to N, P(N) yields
0
σ( ) 1 exp
m
eq
aP N
K N
(5)
Equation (5) holds if the local cyclic stress remains constant during the entire fatigue life. This
condition is verified only at the beginning of fatigue life, when the laminate is undamaged or
when the initiated cracks are far enough and thus non interacting. This condition is defined as
"Non-Interactive regime" and it holds until the crack density is lower than a limit value, ρNI,
after which the initiated cracks start interacting causing stress redistributions. This is defined
as "Interactive regime", and it is characterised by the variability of ζeq with the number of
cycles and the x2 coordinate. A schematic is shown in figure 3. As a consequence, the
prediction of crack initiation in the Non-Interactive and Interactive regimes will be treated
separately in sections 7.4.1 and 7.4.2, respectively.
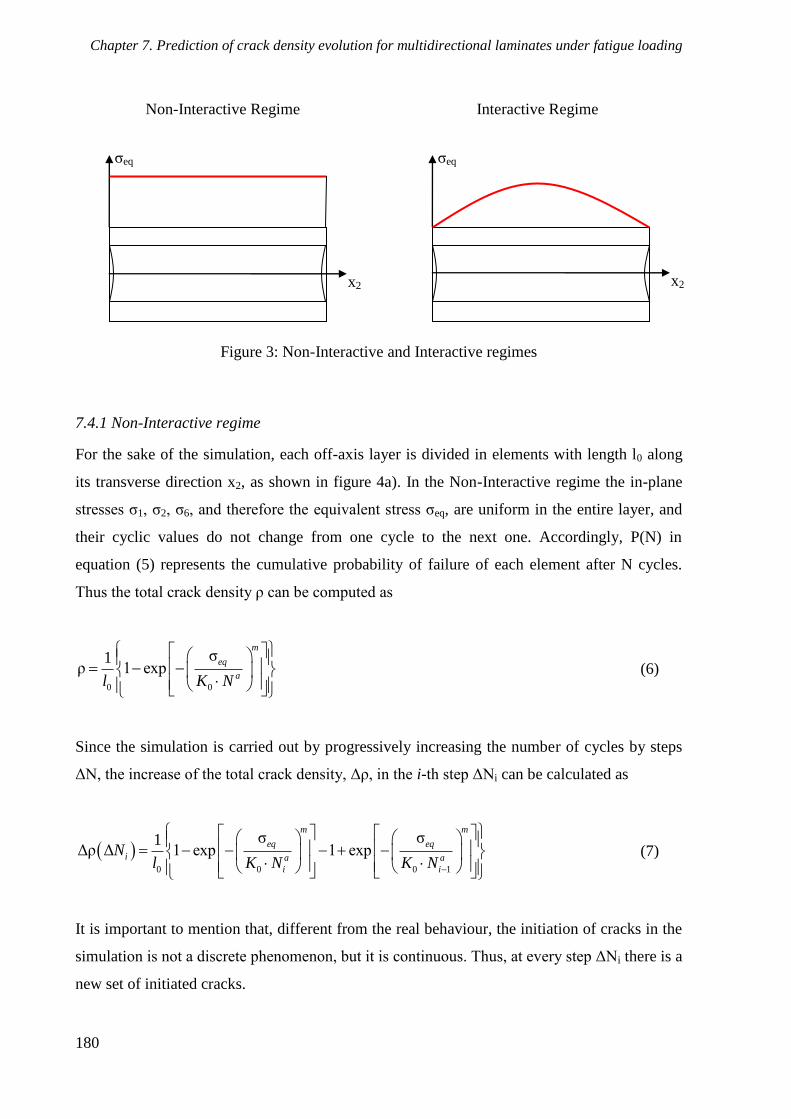
Chapter 7. Prediction of crack density evolution for multidirectional laminates under fatigue loading
180
Figure 3: Non-Interactive and Interactive regimes
7.4.1 Non-Interactive regime
For the sake of the simulation, each off-axis layer is divided in elements with length l0 along
its transverse direction x2, as shown in figure 4a). In the Non-Interactive regime the in-plane
stresses ζ1, ζ2, ζ6, and therefore the equivalent stress ζeq, are uniform in the entire layer, and
their cyclic values do not change from one cycle to the next one. Accordingly, P(N) in
equation (5) represents the cumulative probability of failure of each element after N cycles.
Thus the total crack density ρ can be computed as
0 0
σ1ρ 1 exp
m
eq
al K N
(6)
Since the simulation is carried out by progressively increasing the number of cycles by steps
ΔN, the increase of the total crack density, Δρ, in the i-th step ΔNi can be calculated as
0 0 0 1
σ σ1Δρ Δ 1 exp 1 exp
m m
eq eq
i a a
i i
Nl K N K N
(7)
It is important to mention that, different from the real behaviour, the initiation of cracks in the
simulation is not a discrete phenomenon, but it is continuous. Thus, at every step ΔNi there is a
new set of initiated cracks.
ζeq
x2
ζeq
x2
Non-Interactive Regime Interactive Regime

Chapter 7. Prediction of crack density evolution for multidirectional laminates under fatigue loading
181
To address, later, the crack propagation phenomenon, the position of the initiation sites has to
be defined. For this sake, each layer can be divided in q elements along the longitudinal
direction of the ply, x1, each of them representing an initiation site (see figure 4b)).
Accordingly, the increase of total crack density Δρ, which considers all the initiated cracks in
the layer, should be shared between q+1 arrays of cracks. This can be done on the basis of a
function Aj representing the probability density function to form cracks at the j-th array. As a
consequence, the increase of the density of cracks initiated in the j-th array, Δρarr,j can be
calculated as
,Δρ Δ Δρ Δarr j i i jN N A (8)
For example, if at every array there is the same probability for cracks to initiate, the function
Aj is uniform and equal to 1/(q+1). If instead the probability of crack initiation at the edges is
much higher than the rest of the specimen, A1 = Aq+1 = 0.5, while Aj = 0 for j ≠ 1, q+1. The
second case, implying initiation to occur only at the edges, is considered in the present work.
Thus the increase of crack density at each edge, Δρe, can be calculated as Δρe = 0.5Δρ.
Figure 4: Subdivision in a) elements along x2 and b) crack arrays along x1
x2
x1
1
2
q+1
w·|sin(θ)|
l0
a)
b)
cracks
z
x2
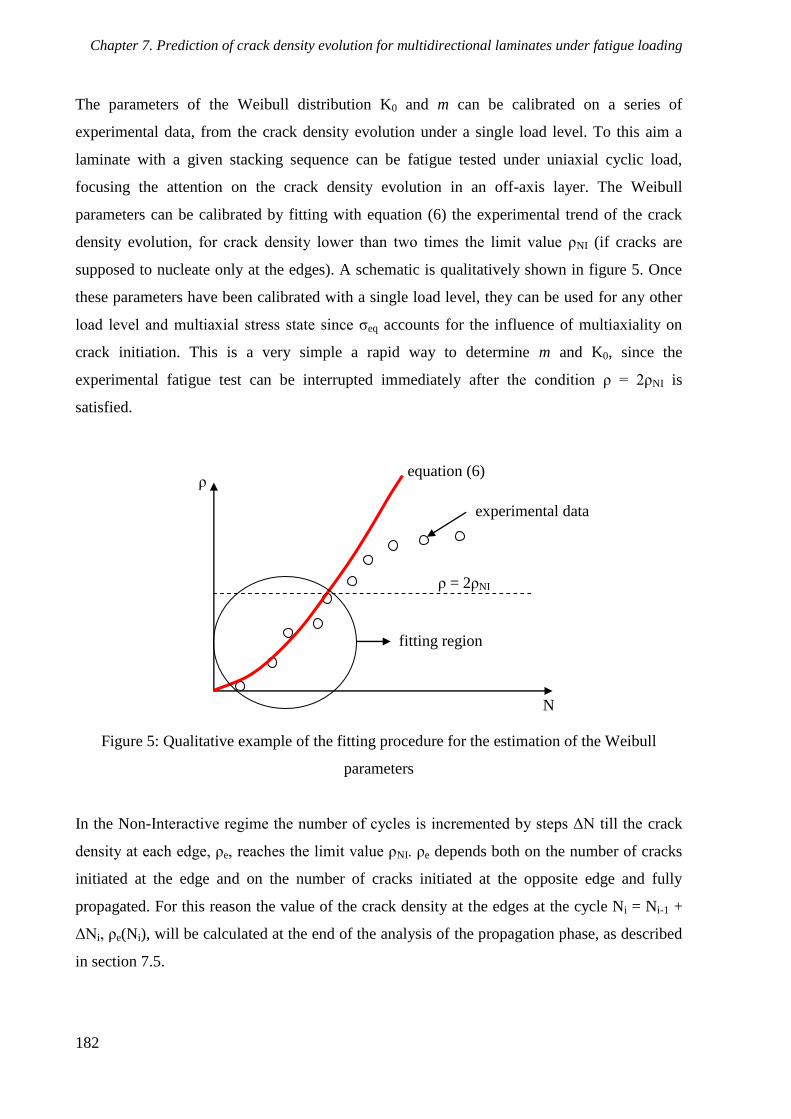
Chapter 7. Prediction of crack density evolution for multidirectional laminates under fatigue loading
182
The parameters of the Weibull distribution K0 and m can be calibrated on a series of
experimental data, from the crack density evolution under a single load level. To this aim a
laminate with a given stacking sequence can be fatigue tested under uniaxial cyclic load,
focusing the attention on the crack density evolution in an off-axis layer. The Weibull
parameters can be calibrated by fitting with equation (6) the experimental trend of the crack
density evolution, for crack density lower than two times the limit value ρNI (if cracks are
supposed to nucleate only at the edges). A schematic is qualitatively shown in figure 5. Once
these parameters have been calibrated with a single load level, they can be used for any other
load level and multiaxial stress state since ζeq accounts for the influence of multiaxiality on
crack initiation. This is a very simple a rapid way to determine m and K0, since the
experimental fatigue test can be interrupted immediately after the condition ρ = 2ρNI is
satisfied.
Figure 5: Qualitative example of the fitting procedure for the estimation of the Weibull
parameters
In the Non-Interactive regime the number of cycles is incremented by steps ΔN till the crack
density at each edge, ρe, reaches the limit value ρNI. ρe depends both on the number of cracks
initiated at the edge and on the number of cracks initiated at the opposite edge and fully
propagated. For this reason the value of the crack density at the edges at the cycle Ni = Ni-1 +
ΔNi, ρe(Ni), will be calculated at the end of the analysis of the propagation phase, as described
in section 7.5.
ρ
N
ρ = 2ρNI
equation (6)
fitting region
experimental data
Chapter 7. Prediction of crack density evolution for multidirectional laminates under fatigue loading
183
7.4.2 Interactive Regime
If the crack density at the edges of the k-th ply is higher than ρNI, the cracks in the k-th layer
start interacting with each other causing the redistribution of the stress components ζ1, ζ2, ζ6,
and thus of the equivalent stress ζeq, which are now functions of the transverse coordinate x2.
Therefore each element in which the ply is divided along the x2 direction is subjected to a
different stress state, both in terms of modulus and multiaxiality. Obviously the cyclic values
of these stress components vary proportionally to the external applied load. At this point it is
essential to make the simplifying assumption that the crack spacing at the edges, Se, is uniform
and equal to 1/ρe. Of course this is not exactly representative of real phenomena, mainly in the
earlier stages of fatigue life. It was shown in Refs. [30,45] that the crack spacing at the end of
the Non-Interactive regime follows a Poisson's distribution, while during the Interactive
regime its distribution should depend on the probability of failure at each element. This
approach cannot be adopted in the present case since the edge crack spacing does not depend
only on the cracks initiated at the edge but also on those coming from the opposite edge and
fully propagated.
Since at every step ΔNi of the simulation a new set of cracks initiates, each element is
subjected to a variable amplitude fatigue loading. As a consequence a damage accumulation
model is needed to account for the sequence effect. Neither results or models are available in
the literature concerning the sequence effect on the matrix-dominated fatigue behaviour of UD
composites. In the present work the simple and well known Miner's rule is used to define the
entity of damage D under variable amplitude fatigue. Accordingly, the entity of damage after
Ni cycles is
1,
Δij
ij
f j
ND
N
(9)
The suitability of such a model for the matrix dominated fatigue behaviour should be checked.
Let el be an index scanning through the elements of length l0 (el varies from 1 to Se/l0).
Combining equations (3), (4) and (9), and considering the volume effect (as now only half
specimen, i.e. one edge, is analysed) the probability of having a damage di(el) higher than D,
at the el-th element after Ni cycles, is given by
Chapter 7. Prediction of crack density evolution for multidirectional laminates under fatigue loading
184
0.5
1/
0 1/1
,
1 1 1 expΔ
σ
a m
ii
ja
aj
eq j
DP d el D
NK
el
(10)
where ζeq,j(el) is the equivalent stress at the el-th element between the cycles j-1 and j. In order
to simplify the expressions, a load history parameter L(el,Ni) for the el-th element after Ni
cycles is defined as
11/ 1/
1, ,
Δ Δ, ,
σ σ
ij i
i ia aj
eq j eq i
N NL el N L el N
el el
(11)
The critical condition, corresponding to the initiation of a crack at the el-th element, is
achieved when di(el) ≥ 1. Thus the cumulative probability P(el,Ni) to form a crack in
correspondence to the el-th element after Ni cycles is given by
0.5
1/
0
1, 1 1 1 exp
,
a m
i a
i
P el NK L el N
(12)
The probability of a crack to initiate at the el-th element between the cycles Ni-1 and Ni is
defined failure rate and it is calculated as
1
1
( , ) ( , )( ,Δ )
1 ( , )
i ii
i
P el N P el Nfr el N
P el N
(13)
Finally, assuming that the cycles intervals ΔN are small enough to allow only one crack per
crack spacing to initiate, the increase of edge crack density due to the failure of the el-th
element only, Δρe,el(ΔNi), is calculated as
/ 0
, 11
,ΔΔρ Δ ρ 1 ( ,Δ )
1 ,Δ
S lei
e el i e i iel
i
fr el NN N fr el N
fr el N
(14)
Chapter 7. Prediction of crack density evolution for multidirectional laminates under fatigue loading
185
The total increase of edge crack density Δρe(ΔNi) can be finally calculated by summing all the
contributions due to the failure of each element.
/ 0
,1
Δρ Δ Δρ ΔS le
e i e el iel
N N
(15)
Considering the entire specimen the increase of the total crack density Δρ(ΔNi) is equal to 2·
Δρe(ΔNi) and thus the total crack density at the cycle Ni is
1ρ ρ Δρ Δi i iN N N (16)
At this point the total crack density is known, and the analysis of the propagation phase is now
necessary for the computation of the weighted crack density ρw, as well as for the calculation
of the edge crack density ρe(Ni) accounting for both the initiated and fully propagated cracks.
7.5. Crack propagation
As already mentioned, the propagation of the initiated cracks is assumed to be governed by a
Paris-like law, relating the CGR to the SERR. Since the propagation occurs in mixed I + II
mode conditions, an equivalent SERR, Geq, should be used, according to equation (17).
d
eqCGR C G (17)
The coefficients C and d have to be calibrated with experimental results. Several
phenomenological expressions have been proposed in the literature for the Geq to be used in
equation (17). An experimental investigation carried out by the writer [2, chapter 3 of the
present thesis] revealed that, when the Mode Mixity MM = GII/Gtot is low, i.e. the loading
condition is mode I dominated, the propagation is controlled by the only mode I contribution
GI. This is because the presence of the fibres does not allow the deviation of the crack
propagation direction which would be the effect of the mode II contribution. Conversely, when
the loading mode is mode II dominated, but not pure mode II, it has been found that the Paris-
like curves are well collapsed in terms of the total SERR Gtot = GI + GII, as can be observed in
figures 6a) and b) readapted from chapter 3 in terms of total SERR.

Chapter 7. Prediction of crack density evolution for multidirectional laminates under fatigue loading
186
Figure 6: Paris-like curves in terms of Gtot for tubes with a) R = 0.05 and b) R = 0.5 [2, chapter
3 of the present thesis]
The same conclusion can be drawn, mainly for 0.53 ≤ MM ≤ 0.82, considering the fatigue data
for mixed mode interlaminar crack propagation presented by Kenane [46], data being reported
in figure 7.
Figure 7: Mixed mode interlaminar crack propagation from Kenane [46]
According to these observations the equivalent SERR can be defined as follows:
,
, *
* 1
I
eq
tot
G if MM MMG
G if MM MM
(18)
where MM* is the transition point between the GI and the Gtot driven propagation. Therefore,
the coefficients of Paris-like curves CI, dI and Ctot, dtot have to be provided to be used when the
propagation is GI or Gtot controlled, respectively.
It is remarked that, however, Gtot cannot be used for pure mode II loading. In addition, the use
of Gtot for MM > MM* is only a phenomenological criterion, the general validity of which
1.E-6
1.E-5
1.E-4
1.E-3
80 800
CG
R [
rad
/cyc
le]
Gtot = GI+GII [J/m2]
MM = 0.56
MM = 0.83
R = 0.05
1.E-7
1.E-6
1.E-5
1.E-4
1.E-3
100 1000
CG
R [
rad/c
ycl
e]
Gtot = GI +GII[J/m2]
MM = 0.56
MM = 0.83
R = 0.5
1.E-07
1.E-06
1.E-05
1.E-04
1.E-03
1.E-02
1.E-01
1.E+01 1.E+02 1.E+03 1.E+04 1.E+05
CG
R (
mm
/cycl
e)
∆Gtot [J/m2]
MM = 0.91
MM = 0.82
MM = 0.72
MM = 0.53
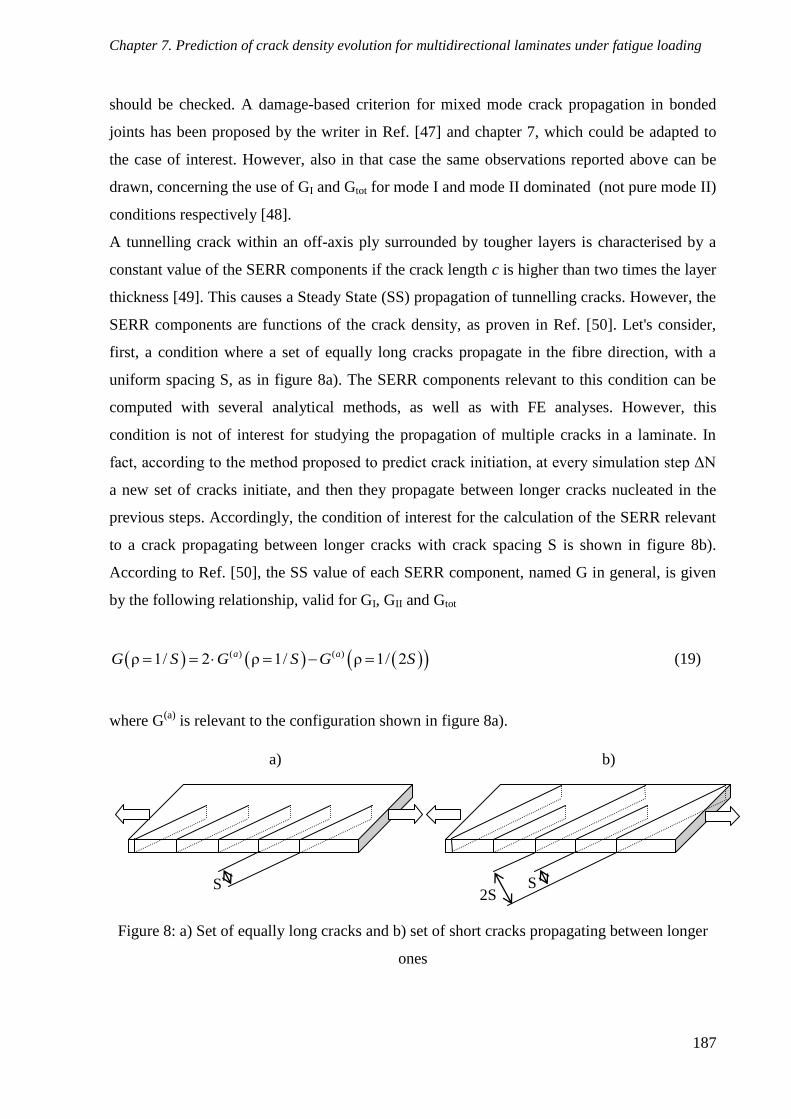
Chapter 7. Prediction of crack density evolution for multidirectional laminates under fatigue loading
187
should be checked. A damage-based criterion for mixed mode crack propagation in bonded
joints has been proposed by the writer in Ref. [47] and chapter 7, which could be adapted to
the case of interest. However, also in that case the same observations reported above can be
drawn, concerning the use of GI and Gtot for mode I and mode II dominated (not pure mode II)
conditions respectively [48].
A tunnelling crack within an off-axis ply surrounded by tougher layers is characterised by a
constant value of the SERR components if the crack length c is higher than two times the layer
thickness [49]. This causes a Steady State (SS) propagation of tunnelling cracks. However, the
SERR components are functions of the crack density, as proven in Ref. [50]. Let's consider,
first, a condition where a set of equally long cracks propagate in the fibre direction, with a
uniform spacing S, as in figure 8a). The SERR components relevant to this condition can be
computed with several analytical methods, as well as with FE analyses. However, this
condition is not of interest for studying the propagation of multiple cracks in a laminate. In
fact, according to the method proposed to predict crack initiation, at every simulation step ΔN
a new set of cracks initiate, and then they propagate between longer cracks nucleated in the
previous steps. Accordingly, the condition of interest for the calculation of the SERR relevant
to a crack propagating between longer cracks with crack spacing S is shown in figure 8b).
According to Ref. [50], the SS value of each SERR component, named G in general, is given
by the following relationship, valid for GI, GII and Gtot
( ) ( )ρ 1/ 2 ρ 1/ ρ 1/ 2a aG S G S G S (19)
where G(a)
is relevant to the configuration shown in figure 8a).
Figure 8: a) Set of equally long cracks and b) set of short cracks propagating between longer
ones
S S 2S
a) b)

Chapter 7. Prediction of crack density evolution for multidirectional laminates under fatigue loading
188
In order to estimate the SERR, and therefore the CGR, associated to a given crack, the density
of cracks surrounding its tip has to be known. To this end, the crack density versus x1 curves
must be drawn at every step of the simulation. These curves represent the value of the average
crack density at a given longitudinal coordinate x1 of the cracked ply, and it is referred to with
the symbol ρ(x1). Its value, for a fixed x1 coordinate, depends on the total number of cracks
encountered moving along the x2 direction, as qualitatively shown in figure 9.
Figure 9: Qualitative example of the calculation of the crack density vs x1 curves
At this point, further statistical considerations should be done, concerning the propagation
phenomenon. Similarly to the approach used for the S-N curves, a Weibull distribution can be
assumed for the coefficient C of the Paris-like law, the cumulative probability being
0
1 exp
p
CP C
C
(20)
where C0 and p are the scale and the shape factors respectively.
The probability density function f(C) is expressed by equation (21) and qualitatively plotted in
figure 10.
1
0 0 0
exp
p p
p C Cf C
C C C
(21)
ρ(x1*) = n° of cracks/L x1*
ρ(x1)

Chapter 7. Prediction of crack density evolution for multidirectional laminates under fatigue loading
189
Now, all the possible values of C, from 0 to Cmax, which is the value of C corresponding to an
arbitrary chosen cumulative probability Pmax = 0,99 (Cmax = C0·[-ln(1-Pmax)](1/p)
), can be
divided into nss finite intervals of length ΔC = Cmax/nss (see figure 10).
Figure 10: Qualitative representation of eq. (21) and subdivision in finite intervals
For every j-th interval between the values Cj and Cj+1, with j=1:nss+1, the average value of C
can be computed as
11 0 0
1 1
Γ 1/ 1 Γ / ,1/ 1 Γ / ,1/ 1j
j
p pC
j jC
j
j j j j
p C C p C C pC f C dCC
P C P C P C P C
(22)
where Γ(·) and Γ(*,·) are the complete and the incomplete Gamma functions, respectively.
Let s be the index scanning through the sets of cracks initiated from the first step to the i-th
one. In the simulation the s-th set of cracks can be divided in nss sub-sets, each of them
associated to an average value jC and to an increase of crack density Δρss(s,j) so that
1Δρ , Δρ Δss s j js j N P C P C (23)
As already mentioned, the SERR related to a given crack depends on the local crack density,
meant as the density of cracks surrounding its tip. Therefore the SERR for the j-th sub-set of
the s-th set of cracks at the i-th step (between Ni-1 and Ni) depends on the local crack density at
the coordinate x1(s,j,Ni-1) at which the crack tips of the j-th sub-set of set s are located after Ni-
1 cycles.
0
0.1
0.2
0.3
0.4
0.5
0.6
f(C
)
CC1=0 Cj-1 CmaxCj Cj+1...... ......

Chapter 7. Prediction of crack density evolution for multidirectional laminates under fatigue loading
190
The above mentioned local crack density does not coincide with the average crack density
ρ(x1), since it is reasonable to assume that a crack tip is not affected by longer cracks far away
from itself. Therefore, at each i-th step, the local crack density related to the tips of the j-th
sub-set of the s-th set can be estimated as follows.
1 1ρ , , 2 ρ , , Δρ ,loc i i sss j N x s j N s j (24)
Thus the CGR which the sub-set of cracks propagates with during the delta cycles ΔNi can be
calculated as
1, ,Δ ρ ( , , )d
i j eq loc iCGR s j N C G s j N (25)
Since the propagation has been shown to occur in a Steady State manner, the CGR remains
constant during the step ΔNi, and therefore the length of the cracks of the j-th sub-set of the s-
th set at the cycle Ni, c(s,j,Ni), can be computed as
1, , , , , ,Δ Δi i i ic s j N c s j N CGR s j N N (26)
Obviously the maximum length of a crack within a layer of orientation θ is given by w/|sin(θ)|.
When a sub-set of cracks in the simulation reaches this value its propagation phase is stopped.
It is also important to mention that, at the moment of crack initiation, an initial length c0 is
attributed to each sub-set of cracks. The value of c0 is assumed to be twice the layer thickness,
since up to that length the SERR increases and then stabilises to its Steady State value.
Finally the possibility of joining of cracks coming from opposite edges is not included in the
present procedure.
7.6. Crack density calculation
After the procedure described in section 7.5, the length of all the initiated cracks can be
calculated at the cycle Ni. Thus the weighted crack density ρw(Ni) can be computed as follows.
1
sin(θ)ρ Δρ Δ ,
i
w i s is
N N c s Nw
(22)

Chapter 7. Prediction of crack density evolution for multidirectional laminates under fatigue loading
191
Now the edge crack density has to be calculated on the basis of both the initiated and
propagated cracks. To this aim, the density of cracks which reached the 100% of their
maximum length, ρ100(Ni) has to be computed as
1001
ρ Δρ Δi
i ss
N N
, if c(s,Ni) = w/|sin(θ)| (23)
Now the crack density at each edge, ρe(Ni), can be computed by adding the density of all the
initiated and fully propagated cracks. They are divided by two since we are referring only to
one edge.
100
1ρ ρ ρ
2e i i iN N N (24)
On the basis of the edge crack density the edge crack spacing can be updated according to
1
ρe
e i
SN
(25)
Now the stress redistributions between cracks at the edges can be calculated by means of any
analytical or numerical method, considering the simplifying assumption that the crack spacing
is uniform along the entire edge. The entire procedure, at the i-th step, has to be applied to all
the layers oriented off-axis with respect to the external loads, so that the total, weighted and
edge crack densities can be calculated for all of them.
At this point it is fundamental to consider the interaction between cracks in different layers,
which causes a further stress redistribution. The writer recently proposed an analytical method
to account for such interaction for the calculation of the stiffness degradation of laminates with
cracks in two or more layers ([26] and chapter 5). The same procedure can be applied also for
the calculation of the stress redistribution between layers, though in an average sense, as
explained in appendix 6.A.
After considering the interaction between cracks in different layers the stress distributions are
updated and they can be used to predict the initiation of cracks at the step i+1.
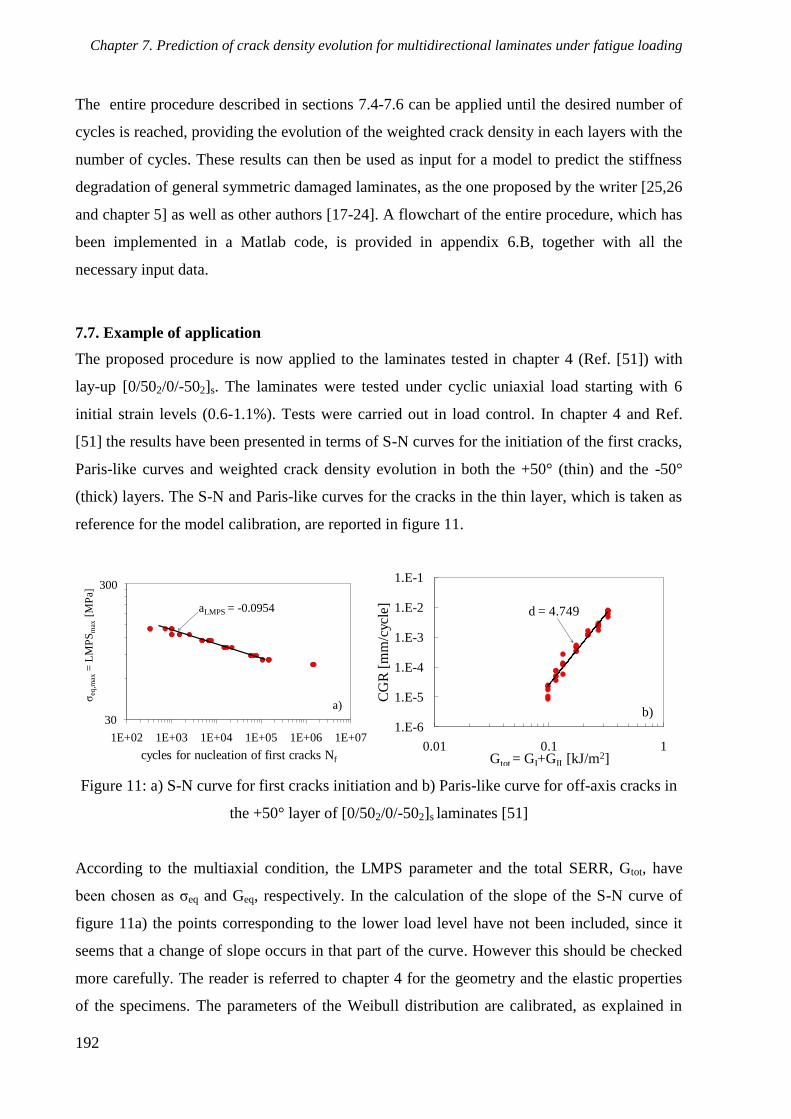
Chapter 7. Prediction of crack density evolution for multidirectional laminates under fatigue loading
192
The entire procedure described in sections 7.4-7.6 can be applied until the desired number of
cycles is reached, providing the evolution of the weighted crack density in each layers with the
number of cycles. These results can then be used as input for a model to predict the stiffness
degradation of general symmetric damaged laminates, as the one proposed by the writer [25,26
and chapter 5] as well as other authors [17-24]. A flowchart of the entire procedure, which has
been implemented in a Matlab code, is provided in appendix 6.B, together with all the
necessary input data.
7.7. Example of application
The proposed procedure is now applied to the laminates tested in chapter 4 (Ref. [51]) with
lay-up [0/502/0/-502]s. The laminates were tested under cyclic uniaxial load starting with 6
initial strain levels (0.6-1.1%). Tests were carried out in load control. In chapter 4 and Ref.
[51] the results have been presented in terms of S-N curves for the initiation of the first cracks,
Paris-like curves and weighted crack density evolution in both the +50° (thin) and the -50°
(thick) layers. The S-N and Paris-like curves for the cracks in the thin layer, which is taken as
reference for the model calibration, are reported in figure 11.
Figure 11: a) S-N curve for first cracks initiation and b) Paris-like curve for off-axis cracks in
the +50° layer of [0/502/0/-502]s laminates [51]
According to the multiaxial condition, the LMPS parameter and the total SERR, Gtot, have
been chosen as ζeq and Geq, respectively. In the calculation of the slope of the S-N curve of
figure 11a) the points corresponding to the lower load level have not been included, since it
seems that a change of slope occurs in that part of the curve. However this should be checked
more carefully. The reader is referred to chapter 4 for the geometry and the elastic properties
of the specimens. The parameters of the Weibull distribution are calibrated, as explained in
30
1E+02 1E+03 1E+04 1E+05 1E+06 1E+07
ζeq
,max
= L
MP
Sm
ax[M
Pa]
cycles for nucleation of first cracks Nf
300
aLMPS = -0.0954
a)
1.E-6
1.E-5
1.E-4
1.E-3
1.E-2
1.E-1
0.01 0.1 1
CG
R [
mm
/cyc
le]
Gtot = GI+GII [kJ/m2]
d = 4.749
b)
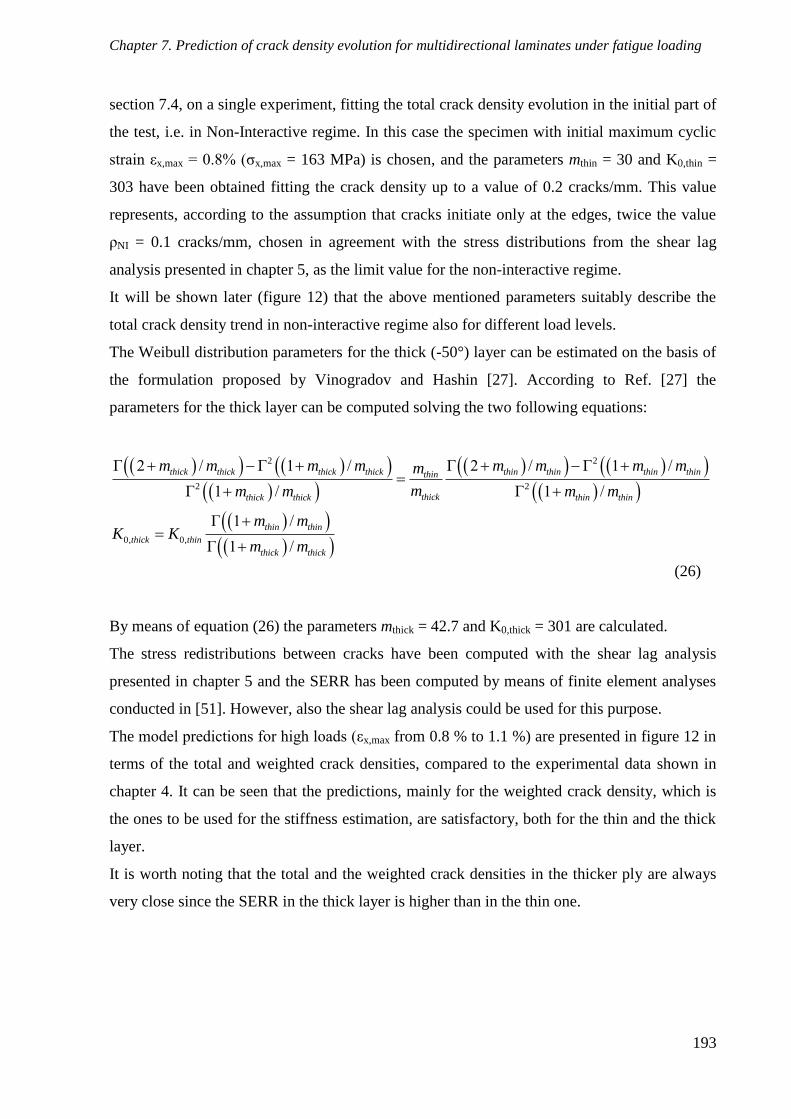
Chapter 7. Prediction of crack density evolution for multidirectional laminates under fatigue loading
193
section 7.4, on a single experiment, fitting the total crack density evolution in the initial part of
the test, i.e. in Non-Interactive regime. In this case the specimen with initial maximum cyclic
strain εx,max = 0.8% (ζx,max = 163 MPa) is chosen, and the parameters mthin = 30 and K0,thin =
303 have been obtained fitting the crack density up to a value of 0.2 cracks/mm. This value
represents, according to the assumption that cracks initiate only at the edges, twice the value
ρNI = 0.1 cracks/mm, chosen in agreement with the stress distributions from the shear lag
analysis presented in chapter 5, as the limit value for the non-interactive regime.
It will be shown later (figure 12) that the above mentioned parameters suitably describe the
total crack density trend in non-interactive regime also for different load levels.
The Weibull distribution parameters for the thick (-50°) layer can be estimated on the basis of
the formulation proposed by Vinogradov and Hashin [27]. According to Ref. [27] the
parameters for the thick layer can be computed solving the two following equations:
2 2
2 2
0, 0,
Γ 2 / Γ 1 / Γ 2 / Γ 1 /
Γ 1 / Γ 1 /
Γ 1 /
Γ 1 /
thick thick thick thick thin thin thin thinthin
thickthick thick thin thin
thin thin
thick thin
thick thick
m m m m m m m mm
mm m m m
m mK K
m m
(26)
By means of equation (26) the parameters mthick = 42.7 and K0,thick = 301 are calculated.
The stress redistributions between cracks have been computed with the shear lag analysis
presented in chapter 5 and the SERR has been computed by means of finite element analyses
conducted in [51]. However, also the shear lag analysis could be used for this purpose.
The model predictions for high loads (εx,max from 0.8 % to 1.1 %) are presented in figure 12 in
terms of the total and weighted crack densities, compared to the experimental data shown in
chapter 4. It can be seen that the predictions, mainly for the weighted crack density, which is
the ones to be used for the stiffness estimation, are satisfactory, both for the thin and the thick
layer.
It is worth noting that the total and the weighted crack densities in the thicker ply are always
very close since the SERR in the thick layer is higher than in the thin one.
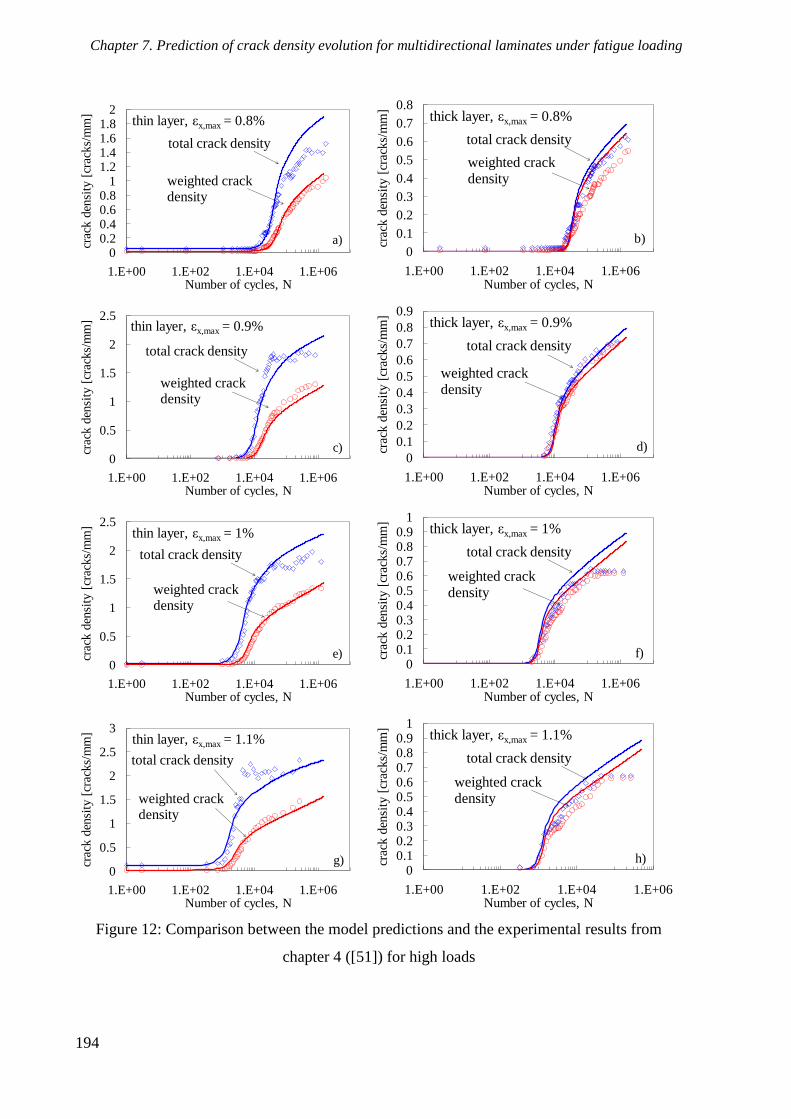
Chapter 7. Prediction of crack density evolution for multidirectional laminates under fatigue loading
194
Figure 12: Comparison between the model predictions and the experimental results from
chapter 4 ([51]) for high loads
00.20.40.60.8
11.21.41.61.8
2
1.E+00 1.E+02 1.E+04 1.E+06
crac
k d
ensi
ty [
crac
ks/
mm
]
Number of cycles, N
total crack density
weighted crack density
thin layer, εx,max = 0.8%
a)0
0.1
0.2
0.3
0.4
0.5
0.6
0.7
0.8
1.E+00 1.E+02 1.E+04 1.E+06
crac
k d
ensi
ty [
crac
ks/
mm
]
Number of cycles, N
total crack density
weighted crack density
thick layer, εx,max = 0.8%
b)
0
0.5
1
1.5
2
2.5
1.E+00 1.E+02 1.E+04 1.E+06
crac
k d
ensi
ty [
crac
ks/
mm
]
Number of cycles, N
total crack density
weighted crack density
thin layer, εx,max = 0.9%
c)0
0.1
0.2
0.3
0.4
0.5
0.6
0.7
0.8
0.9
1.E+00 1.E+02 1.E+04 1.E+06
crac
k d
ensi
ty [
crac
ks/
mm
]
Number of cycles, N
total crack density
weighted crack density
thick layer, εx,max = 0.9%
d)
0
0.5
1
1.5
2
2.5
1.E+00 1.E+02 1.E+04 1.E+06
crac
k d
ensi
ty [
crac
ks/
mm
]
Number of cycles, N
total crack density
weighted crack density
thin layer, εx,max = 1%
e)0
0.10.20.30.40.50.60.70.80.9
1
1.E+00 1.E+02 1.E+04 1.E+06
crac
k d
ensi
ty [
crac
ks/
mm
]
Number of cycles, N
total crack density
weighted crack density
thick layer, εx,max = 1%
f)
0
0.5
1
1.5
2
2.5
3
1.E+00 1.E+02 1.E+04 1.E+06
crac
k d
ensi
ty [
crac
ks/
mm
]
Number of cycles, N
total crack density
weighted crack density
thin layer, εx,max = 1.1%
g)0
0.10.20.30.40.50.60.70.80.9
1
1.E+00 1.E+02 1.E+04 1.E+06
crac
k d
ensi
ty [
crac
ks/
mm
]
Number of cycles, N
total crack density
weighted crack density
thick layer, εx,max = 1.1%
h)

Chapter 7. Prediction of crack density evolution for multidirectional laminates under fatigue loading
195
Generally the predictions are better for the thin layer, since the Weibull parameters have been
calibrated for that layer. The effect of the layer thickness on the type of statistical distribution
and its parameters should be investigated more deeply.
As already mentioned, the S-N curve for the thin layer shows a change of slope for strain
values less than 0.65%. In the final part of the curve the slope aLMPS has been calculated equal
to -0.0328. Also the Weibull parameters are recalculated fitting the total crack density data for
εx,max = 0.65% in the non-interactive regime. The parameters have been calibrated both for the
thin and the thick layer since the formulation proposed in Ref. [27] and reported in equations
(26) did not give good results in this case. This confirms the need to investigate more
accurately the effect of thickness as well as the high cycles fatigue behaviour. The following
parameters have been found: mthin = 40, K0,thin = 137.8, mthick = 53 and K0,thick = 133.66. The
results and the comparisons are reported in figure 13 for εx,max = 0.6 % and 0.65 %. A
reasonable agreement is obtained for all the data sets.
Figure 13: Comparison between the model predictions and the experimental results from
chapter 4 ([51]) for low loads
7.8. Conclusions
A new procedure has been proposed for the prediction of the total and weighted crack density
0
0.02
0.04
0.06
0.08
0.1
0.12
0.14
0.16
1.E+04 1.E+05 1.E+06 1.E+07
crack
den
sity
[cr
ack
s/m
m]
Number of cycles, N
total crack density
weighted crack density
thin layer, εx,max = 0.6%
a)0
0.01
0.02
0.03
0.04
0.05
0.06
0.07
0.08
0.09
1.E+04 1.E+05 1.E+06 1.E+07
crac
k d
ensi
ty [
crac
ks/
mm
]
Number of cycles, N
total crack density
weighted crack density
thick layer, εx,max = 0.6%
b)
0
0.1
0.2
0.3
0.4
0.5
0.6
0.7
0.8
0.9
1.E+04 1.E+05 1.E+06 1.E+07
crac
k d
ensi
ty [
crac
ks/
mm
]
Number of cycles, N
total crack density
weighted crack density
thin layer, εx,max = 0.65%
c)0
0.05
0.1
0.15
0.2
0.25
0.3
1.E+04 1.E+05 1.E+06 1.E+07
crac
k d
ensi
ty [
crac
ks/
mm
]
Number of cycles, N
total crack density
weighted crack density
thick layer, εx,max = 0.65%
d)

Chapter 7. Prediction of crack density evolution for multidirectional laminates under fatigue loading
196
evolution in multidirectional laminates subjected to cyclic loading. The model treats the off-
axis crack initiation and propagation phases separately. The multiple cracks initiation is
predicted by means of the S-N curve of the unidirectional lamina expressed in terms of an
equivalent stress previously defined in chapter 4 [39], which accounts for multiaxial stress
states. A Weibull distribution of the fatigue strength was considered, and a simple and fast
way for the determination of the parameters was proposed. The stress redistributions between
cracks are accounted for in the procedure, and also the interaction between different cracked
layers is considered, as explained in appendix 6.A. The propagation phase is treated in terms
of Paris-like curve of the lamina. The model is here presented for a finite width laminate under
uniaxial load considering that the cracks initiate only at the two edges. However there are not
conceptual differences if more initiation sites are considered. The model was validated with
experimental results presented in chapter 4 (Ref. [51]), resulting in good agreement. Some
topics have still to be deepened to improve the reliability of the predictions, i.e. the thickness
effect, the high cycles fatigue behaviour and the description of the damage accumulation rule
(equation(9)). Experimental campaigns are needed to clarify these points.
However this procedure, combined with the stiffness degradation model presented in chapter
6, represents a very useful tool for predicting the fatigue damage evolution in laminates, with
particular reference to the stiffness loss. In addition, the stress re-distributions associated to the
predicted crack density can be computed with the model presented in chapter 6 and used for
estimating the total fatigue life of a laminate.
Acknowledgements
The writer would like to thank Dr. Yongxin Huang for the discussions and the help in
conceiving this procedure. Thanks also to Lucio Maragoni for the help in the implementation
of the model in a Matlab code.
Appendix 7.A
In this appendix the procedure to account for the influence of cracks in different layers on the
stress redistribution is explained. It is based on a model proposed in chapter 5 and Ref. [26] for
the stiffness degradation of multiply damages laminates. First, an example for a case in which
only two layers, h and k, are cracked is shown for simplicity, and finally the general formula is
provided in case of whatever number of cracked layers.

Chapter 7. Prediction of crack density evolution for multidirectional laminates under fatigue loading
197
By means of the shear lag analysis proposed in chapter 5 and Ref. [25] the case of a laminate
with one cracked ply, k, can be addressed (see figure A1). The in-plane stresses (ζ1(k)
(x2(k)
),
ζ2(k)
(x2(k)
), ζ6(k)
(x2(k)
)) between the cracks in the cracked layer can be expressed as functions of
the transverse coordinate of the k-th layer x2(k)
, for a general global loading condition gσ
=
{ζx, ζy, ζxy}T. In addition the in-plane stresses in the reference system of the cracked ply can
be calculated, always as function of x2(k)
, for every i-th non cracked layer (ζ11(i)
(x2(k)
),
ζ22(i)
(x2(k)
), ζ12(i)
(x2(k)
)).
Figure A1: Laminate with one cracked ply
Considering three particular loading conditions ( gσ
= {1,0,0}T, {0,1,0}
T and {0,0,1}
T), the
stresses in every layer can be averaged over the entire volume of the ply, and the following
parameters, function of the crack density on the k-th ply ρk, can be defined for the i-th layer
(see Ref. [25] or chapter 5 for a more detailed treatise).
( ) ( ) ( ) ( ) ( ) ( ) ( ) ( ) ( ) ( ) ( ) ( ), 11 2 2 , 11 2 2 , 11 2 20 0 0
σ 1,0,0 σ 0,1,0 σ 0,0,1
1 1 1γ (ρ ) σ ( ) , γ (ρ ) σ ( ) , γ (ρ ) σ ( )
k k k
T T Tg g g
l l li i k k i i k k i i k kk x k k y k k xy k
k k k
x dx x dx x dxl l l
(A1)
( ) ( ) ( ) ( ) ( ) ( ) ( ) ( ) ( ) ( ) ( ) ( ), 22 2 2 , 22 2 2 , 22 2 20 0 0
σ 1,0,0 σ 0,1,0 σ 0,0,1
1 1 1λ (ρ ) σ ( ) , λ (ρ ) σ ( ) , λ (ρ ) σ ( )
k k k
T T Tg g g
l l li i k k i i k k i i k kk x k k y k k xy k
k k k
x dx x dx x dxl l l
(A2)
x2(k)
x1
(k)
z = x3(k)
h1
h2
hk
hn
z1
z2
zk
zn
x θk
crack spacing, lk
crack
crack
symmetry
plane
y

Chapter 7. Prediction of crack density evolution for multidirectional laminates under fatigue loading
198
( ) ( ) ( ) ( ) ( ) ( ) ( ) ( ) ( ) ( ) ( ) ( ), 12 2 2 , 12 2 2 , 12 2 20 0 0
σ 1,0,0 σ 0,1,0 σ 0,0,1
1 1 1β (ρ ) σ ( ) , β (ρ ) σ ( ) , β (ρ ) σ ( )
k k k
T T Tg g g
l l li i k k i i k k i i k kk x k k y k k xy k
k k k
x dx x dx x dxl l l
(A3)
Let us consider now a laminate with two cracked plies, h and k, and subjected to a general
external loading condition given by the vector 0σ
= {ζx0, ζy0, ζxy0}T. In view of the principle
of the superposition of effects, this condition can be decomposed as schematically shown in
figure A2. The reader is referred to chapter 5 or Ref. [26] for the detailed explanation.
Figure A2: decomposition of a laminate with two cracked plies under global load 0σ
The global stresses ζx,k, ζxy,k, ζx,h, ζxy,h are unknowns to be calculated as explained in chapter
5. The influence of the presence of cracks in the h-th layer on the stress distributions in the k-
th ply is treated in terms of the increase of the average stress due to the cracks in the h-th layer,
and vice versa. If only the k-th ply was cracked, the average stresses ζ1av(k)
(ρk), ζ2av(k)
(ρk) and
ζ6av(k)
(ρk) could be calculated as
ζx,h
ζxy,h ζxy,h
ζx,h
h
k
ζ0 ζ0
ζx,k
ζxy,k ζxy,k
ζx,k

Chapter 7. Prediction of crack density evolution for multidirectional laminates under fatigue loading
199
( )
1( )( )
2 0
( )
6
σ ρ
σ ρ Ω ρ σ
σ ρ
k
av kkk
av k k
k
av k
(A4)
where
( ) ( ) ( )
, , ,( ) ( ) ( ) ( )
, , ,
( ) ( ) ( )
, , ,
γ (ρ ) γ (ρ ) γ (ρ )
Ω ρ λ (ρ ) λ (ρ ) λ (ρ )
β (ρ ) β (ρ ) β (ρ )
k k k
k x k k y k k xy kk k k k
k k x k k y k k xy k
k k k
k x k k y k k xy k
(A5)
If, instead, there are cracks also in the h-th layer, with density ρh, the average stresses in the k-
th ply can be calculated by summing all the contributions coming from the decomposition
shown in figure A2:
( )
1 , , , ,( ) ( )( ) ( ) ( )( )
2 0
( )
6 , , , ,
σ σ σ σ σ
σ σ θ θ Ω ρ 0 0 Ω ρ 0 0
σ σ σ σ σ
k
av x h x h x k x kk kk k kk
av k h h k
k
av xy h xy h xy k xy k
c T c c
(A6)
where
( ) ( ) ( )
,1 ,1 ,1( ) ( ) ( ) ( )
,2 ,2 ,2
( ) ( ) ( )
,6 ,6 ,6
k k k
x y xyk k k k
x y xy
k k k
x y xy
c c c
c c c c
c c c
(A7)
The coefficients cx,i(k)
, cy,i(k)
, cxy,i(k)
link the global stresses ζx, ζy and ζxy, respectively, to the
stress ζi (i = 1, 2, 6) in the k-th layer for an undamaged laminate. Therefore they can be easily
computed with the classical lamination theory. In the general case of a symmetric laminate
with 2n-1 layers, with cracks in a whatever number plies, the average stresses in the k-th
lamina can be calculated with the following general formula.
( )
1 , ,( )( ) ( )( )
2 01
( )
6 , ,
σ σ σ
σ σ θ θ Ω ρ 0 0
σ σ σ
k
av x h x hn kk kk
av k h hh
k
av xy h xy h
c T c
, if ρh ≠ 0 (A8)
Chapter 7. Prediction of crack density evolution for multidirectional laminates under fatigue loading
200
In the present work it is assumed that the stress distributions ζ1(k)
(x2(k)
), ζ2(k)
(x2(k)
), ζ6(k)
(x2(k)
)
in the k-th layer should be updated by multiplying them for the ratio between the average
stresses calculated accounting for the interaction with other cracked layers (ζ1av(k)
, ζ2av(k)
and
ζ6av(k)
) and those with the only cracked layer k (ζ1av(k)
(ρk), ζ2av(k)
(ρk) and ζ6av(k)
(ρk)).
Accordingly, the updated stress distributions read
( )
1,( ) ( )
1 2 ( )( ) ( ) 1,1, 2
( )
2,( ) ( ) ( ) ( )
2, 2 2 2 ( )
2,( ) ( )
( )6, 26,( ) ( )
6 2 ( )
6,
σσ
σ ρσ
σσ σ
σ ρ
σσ
σσ ρ
k
avk k
kk k av kup
k
avk k k k
up k
av kk k
kupavk k
k
av k
x
x
x x
x
x
(A9)
It is worth mentioning that the proposed procedure for crack interaction does not have to be
coupled necessary with the shear lag model proposed by the writer in chapter 5 and Ref. [25]
but also with other stress transfer models available in the literature.
According to this procedure the effect of crack interaction on the stress fields is treated in an
average sense, but it is the best that can be done analytically, in the author's opinion. Finally it
is important to mention that, as the cracks are in general not fully propagated, the crack
densities ρh and ρk in equations A8 and A9 are actually the edge crack densities in the h-th and
k-th layer.
Appendix 7.B
Input data:
- Ply elastic properties (E1, E2, G12, ν12, G23, G13);
- Ply thickness;
- Lay-up, width w and external loads;
- Slope of the S-N curve (aLHS, aLMPS);
- Stress concentration factors for calculation of LHS and LMPS (see Ref. [39] and chapter 4);
- Weibull distribution parameters m and K0;
- Coefficients of the Paris-like curve (CI, dI and Ctot, dtot);

Chapter 7. Prediction of crack density evolution for multidirectional laminates under fatigue loading
201
Ni =Ni-1 + ΔN
Interactive Regime Non-Interactive Regime
for el=1 to Se/l0
updating L(el,Ni), eq.(11)
calculation of P(el,Ni), eq.(12)
calculation of fr(el,ΔNi), eq.(13)
end
calculation of ρ(Ni), eq.(6)
calculation of Δρ(ΔNi), eq.(7)
Drawing the local crack
density curves
ρloc (x1,Ni)
for s=1 to i-1
for j = 1 to nss
calculation of CGR(s,j,ΔNi), eq(20)
calculation of c(s,j,Ni), eq.(21)
if c(s,j,Ni) > w/|sin(θ) | then c(s,j,Ni) = w/|sin(θ) |
end
c(s=i,j=1 to nss,Ni) = c0
calculation of ρw(Ni), eq.(22)
calculation of ρ100(Ni), eq.(23)
calculation of ρe(Ni), eq.(24)
calculation of Se, eq.(25)
stress redistribution
updating stress redistribution in each
layer considering the other cracked
plies (appendix 6.A)
ρ > ρNI
yes
no
last ply?
yes
no
next ply
initiation
propagation
calculation of Δρe,el(ΔNi), eq.(14)
calculation of Δρe, eq.(15)
Δρ = 2·Δρe
calculation of ρ(Ni), eq.(16)
Chapter 7. Prediction of crack density evolution for multidirectional laminates under fatigue loading
202
References of chapter 7
[1] M. Quaresimin, P. A. Carraro, On the investigation of the biaxial fatigue behaviour of
unidirectional composites, Composites: Part B 54 (2013) 200–208
[2] M. Quaresimin, P. A. Carraro, Damage initiation and evolution in glass/epoxy tubes
subjected to combined tension-torsion fatigue loading, DOI:
http://dx.doi.org/10.1016/j.ijfatigue.2014.01.002
[3] J. Tong, F. J. Guild, S. L. Ogin, P. A. Smith, On matrix crack growth in quasi isotropic
laminates-I. Experimental investigation, Composites Science and Technology 57
(1997) 1527-1535
[4] A.W. Wharmby, F. Ellyin, Damage growth in constrained angle-ply laminates under
cyclic loading, Composites Science and Technology 62 (2002) 1239–1247
[5] K. Tohgo, S. Nakagawa, K. Kageyama, Fatigue behaviour of CFRP cross-ply
laminates under on-axis and off-axis cyclic loading, International Journal of Fatigue 28
(2006) 1254-1262
[6] S. Adden, P. Horst, Stiffness degradation under fatigue in multiaxially loaded non-
crimped-fabrics, International Journal of Fatigue 32 (2010) 108–122
[7] Reifsnider KL, Henneke EG, Stinchcomb WW, Duke JC. Damage mechanics and NDE
of composite laminates. In: Hashin Z, Herakovich CT, editors. Mechanics of composite
materials. Recent advances. New York: Pergamon Press; 1983. p. 399–420.
[8] F. Wu, W. Yao, A fatigue damage model of composite materials, International Journal
of Fatigue 32 (2010) 134–138
[9] M. M. Shokrieh, L. B. Lessard, Multiaxial fatigue behaviour of unidirectional plies
based on uniaxial fatigue experiments-I. Modelling, Int. J. Fatigue 19 (3) (1997) 201-
207
[10] M. M. Shokrieh, L. B. Lessard, Multiaxial fatigue behaviour of unidirectional plies
based on uniaxial fatigue experiments-II. Experimental evaluation, Int. J. Fatigue 19
(3) (1997) 209-217
[11] M. M. Shokrieh, L. B. Lessard, Progressive Fatigue Damage Modeling of Composite
Materials, Part I: Modelling, Journal of Composite Materials 34 (2000) 1056-1079
[12] M. M. Shokrieh, L. B. Lessard, Progressive Fatigue Damage Modeling of Composite
Materials, Part II: Material Characterization and Model Verification, Journal of
Composite Materials 34 (2000) 1081-1115
Chapter 7. Prediction of crack density evolution for multidirectional laminates under fatigue loading
203
[13] M. Naderi, A. R. Maligno, Finite element simulation of fatigue life prediction in
carbon/epoxy laminates, Journal of Composite Materials 47 (2013) 475-484
[14] C. R. Kennedy, C. M. Ó Brádaigh, S. B. Leen, A multiaxial fatigue damage model for
fibre reinforced polymer composites, Composite Structures 106 (2013) 201–210
[15] W. Lian, W. Yao, Fatigue life prediction of composite laminates by FEA simulation
method, International Journal of Fatigue 32 (2010) 123–133
[16] Z. Hashin, A. Rotem, A fatigue failure criterion for fibre-reinforced materials. Journal
of Composite Materials 7 (1973) 448-464
[17] J. Zhang, K. P. Herrmann, Stiffness degradation induced by multilayer intralaminar
cracking in composite laminates, Composites: Part A 30 (1999) 683–706
[18] L. N. McCartney, Model to predict effects of triaxial loading on ply cracking in general
symmetric laminates, Composites Science and Technology 60 (2000) 2255-2279
[19] Lundmark, P., Varna, J., 2005. Constitutive relationships for laminates with ply cracks
in in-plane loading. Int. J. Dam. Mech. 14 (3) (2005) 235–259
[20] Lundmark, P., Varna, J., Crack face sliding effect on stiffness of laminates with ply
cracks. Compos. Sci. Tech. 66 (10) (2006) 1444–1454
[21] S. Li, C. V. Singh, R. Talreja, A representative volume element based on translational
symmetries for FE analysis of cracked laminates with two arrays of cracks,
International Journal of Solids and Structures 46 (2009) 1793–1804
[22] C. V. Singh, R. Talreja, A synergistic damage mechanics approach for composite
laminates with matrix cracks in multiple orientations, Mechanics of Materials 41
(2009) 954–968
[23] V. Vinogradov, Z. Hashin, Variational analysis of cracked angle-ply laminates,
Composites Science and Technology 70 (2010) 638–646
[24] D.H. Cortes, E.J. Barbero, Stiffness reduction and fracture evolution of oblique matrix
cracks in composite laminates, Ann. Solid Struct. Mech. 1 (2010) 29–40
[25] P. A. Carraro, M. Quaresimin, A stiffness degradation model for cracked
multidirectional laminates, to appear
[26] P. A. Carraro, M. Quaresimin, An analytical model to predict the stiffness degradation
of composite laminates considering the mutual interaction between cracks in different
layers, to appear
[27] V. Vinogradov, Z. Hashin, Probabilistic energy based model for prediction of
transverse cracking in cross-ply laminates, International Journal of Solids and
Structures 42 (2005) 365–392

Chapter 7. Prediction of crack density evolution for multidirectional laminates under fatigue loading
204
[28] C. V. Singh, R. Talreja, Evolution of ply cracks in multidirectional composite
laminates, International Journal of Solids and Structures 47 (2010) 1338–1349
[29] J. W. Lee, I. M. Daniel, Progressive transverse cracking of crossply composite
laminates, Journal of Composite Materials 24(11) (1990) 1225-1243
[30] Y. Huang, J. Varna, R. Talreja, A statistical approach to evaluate the effect of
manufacturing quality on transverse cracking in cross ply laminates, Proceedings of
18th International Conference on Composites Materials, August 21-26 2011, Jeju
Island, Korea
[31] Y. Huang, R. Talreja, private communication
[32] B. Liu, L. B. Lessard, Fatigue and damage-tolerance analysis of composite laminates:
stiffness loss, damage modelling, and life prediction, Composites Science and
Technology 51 (1994) 43-51
[33] R. Talreja, Fatigue of composite materials, Technometric Publishing Co., Lancaster,
PA 1987
[34] T. K. O' Brien, Analysis of Local Delaminations and their Influence on Composite
Laminate Behaviour, Delamination and Debonding of Materials, ASTM STP 876
(1985) 282-297
[35] S. Subramanian, K. L. Reifsneider, W. W. Stinchcombe, A cumulative damage model
to predict the fatigue life of composite laminates including the effect of a fibre-matrix
interphase, International Journal of Fatigue 17(5) (1995) 343-351
[36] C. Henaff-Gardin, M. C. Lafarie-Frenot, The use of a characteristic damage variable in
the study of transverse cracking development under fatigue loading in cross-ply
laminates, International Journal of Fatigue 24 (2002) 389–395
[37] N. T. Hoang, D. Gamby, M. C. Lafarie-Frenot, Predicting fatigue transverse crack
growth in cross-ply carbon–epoxy laminates from quasi static strength tests by using
iso-damage curves, International Journal of Fatigue 32 (2010) 166–173
[38] Z. Sun, I. M. Daniel, J. J. Luo, Modeling of fatigue damage in a polymer matrix
composite, Materials Science and Engineering A361 (2003) 302–311
[39] P. A. Carraro, M. Quaresimin, A damage based model for crack initiation in
unidirectional composites under multiaxial cyclic loading, submitted to Composites
Science and Technology
[40] M. C. Lafarie-Frenot, C. Hénaff-Gardin, Formation and Growth of 90° Ply Fatigue
Cracks in Carbon/Epoxy Laminates, Composites Science and Technology 40 (1991)
307-324

Chapter 7. Prediction of crack density evolution for multidirectional laminates under fatigue loading
205
[41] R. Talreja, Multi-scale modeling in damage mechanics of composite materials, J Mater
Sci 41 (2006) 6800–6812
[42] S. L. Ogin, P. A. Smith, P. W. R. Beaumont, A Stress Intensity Factor Approach to the
Fatigue Growth of Transverse Ply Cracks, Composites Science and Technology 24
(1985) 47-59
[43] T. Yokozeki, T. Aoki, T. Ishikawa, Fatigue growth of matrix cracks in the transverse
direction of CFRP laminates, Composites Science and Technology 62 (2002) 1223–
1229
[44] A. Hosoi, Y. Arao, H. Kawada, Transverse crack growth behavior considering free-
edge effect in quasi-isotropic CFRP laminates under high-cycle fatigue loading,
Composites Science and Technology 69 (2009) 1388–1393
[45] P. Manders, T.W. Chou, F. R. Jones, J. W. Rock, Statistical analysis of multiple
fracture in 0°/90°/0° glass fibre/epoxy resin laminates, Journal Of Materials Science 18
(1983) 2876-2889
[46] Kenane M, Benzeggagh ML. Mixed-mode delamination fracture toughness of
unidirectional glass/epoxy composites under fatigue loading. Comp. Sci. Technol. 57
(1997) 597–605
[47] P.A. Carraro, G. Meneghetti, M. Quaresimin, M. Ricotta, Crack propagation analysis
in composite bonded joints under mixedmode (I+II) static and fatigue loading: a
damage-based model, Journal of Adhesion Science and Technology 27 (2013) 1393-
1406
[48] P.A. Carraro, G. Meneghetti, M. Quaresimin, M. Ricotta, Crack propagation analysis
in composite bonded joints under mixedmode (I+II) static and fatigue loading:
experimental investigation and phenomenological modelling, Journal of Adhesion
Science and Technology 27 (2013) 1179-1196
[49] S. Ho, Z. Suo, Tunneling cracks in constrained layers, Journal of Applied Mechanics
60 (1993) 890-894
[50] J. W. Hutchinson, Z. Suo, Mixed mode cracking in layered materials, Advances in
Applied Mechanics 29 (1992) 63-191
[51] Quaresimin M., Carraro P.A, Pilgaard Mikkelsen L., Lucato N., Vivian L., Brøndsted
P., Sørensen B.F., Varna J., Talreja R. (2013). Damage evolution under internal and
external multiaxial cyclic stress state: a comparative analysis, accepted on Composites
Part B

Chapter 7. Prediction of crack density evolution for multidirectional laminates under fatigue loading
206

Chapter 8. Mixed mode crack propagation in composite bonded joints
under static and fatigue loading: characterisation and damage-based modelling
207
8
Mixed mode crack propagation in composite bonded
joints under static and fatigue loading:
characterisation and damage-based modelling
8.1. Introduction
One of the main issues concerning the design of structural components of complex shape in
composite materials is the joining of different parts by means of epoxy adhesives. Therefore
reliable criteria for static and fatigue behaviour of bonded joints have to be developed, in order
to be used in the design of such structures. Of particular interest is the fatigue behaviour,
which has been found to be divided, both for joints in composites and in metallic materials, in
a nucleation and a propagation phase [1-4]. In the first one, one or more macro-cracks nucleate
from critical points such as edges and corners, and then they propagate, in the second phase,
until they reach a critical length for the unstable growth. A model has been proposed by the
authors for the prediction of the fatigue life of bonded joints, treating separately the initiation
and the propagation phases, on the basis on the nucleation of a small technical crack of 0.3
mm [4,5]. The life spent for crack propagation has been described by means of a Paris-like
power law relating the Strain Energy Release Rate (SERR or G) to the crack growth rate. It
was also pointed out that, for the single lap geometry studied in those papers, the propagation
occurred in mixed mode I + II conditions, and that the ratio between the mode I and the mode
II components was not constant during the propagation itself, but it was a function of the crack
length. This is something that can be reasonably though to be frequent even in real structures,
and therefore it has to be taken into account in the design process, even because it is known
that the static and fatigue resistance to the crack propagation in bonded joints strongly depends
on the loading mode.
Some examples for static case can be found in Refs. [6-8]. Concerning fatigue behaviour, in
Refs. [9-11] it is shown that different Paris-like curves relating the SERR to the Crack Growth
Rate (CGR) describe the fatigue crack propagation under different mixed mode conditions.

Chapter 8. Mixed mode crack propagation in composite bonded joints
under static and fatigue loading: characterisation and damage-based modelling
208
Some attempts of describing the crack propagation phenomenon, by means of different forms
of the Paris-like law, for common bonded joint geometries, can be found in the literature,
leading sometimes to contradictory results.
In [12], Curely et al. tried to predict the life spent for crack propagation in bonded single lap
aluminum joints, by using the total SERR as the driving force in the Paris equation, the
coefficients of which were evaluated considering pure mode I DCB test. This approach
neglects the influence of the mode mixity on the fatigue behaviour, resulting in a conservative
prediction of the fatigue life.
Wahab et al. [13] reanalyzed the data from [12], by using the only mode I contribution as the
propagation driving force in the Paris equation, obtaining a much better prediction. They also
proposed to account even for the mode II component by considering the crack growth rate as
the sum of the mode I and mode II contributions separately, expressed by means of the Paris
law equations obtained from pure mode I and II tests. However they did not compare this
criterion to the experimental results because of the lack of information about the coefficients
of the Paris-like law for pure mode II.
Kinloch and Osiyemi [14] studied the propagation life of composite single lap joints, by
employing the analytically derived mode I component of the SERR in the Paris-like law
obtained from a pure mode I DCB test. Similar to Wahab et al.[13], they found a good
correlation with experimental data, even if this approach does not account for the mode
mixity, which varies during the crack propagation. The reason of the good agreement of this
method for the single lap geometry will be clear once the present model will be explained in
paragraph 8.5.
Cheuk et al. [11] studied double lap composite/metal joints, observing that, in terms of total
SERR, the crack growth rate predicted by using the pure mode II Paris-like curve was much
lower than the experimental measurements for the joints, characterized by a mode I/ mode II
ratio of 0.15, which means near the pure mode II condition. They defined an equivalent SERR
Geq where the mode II contribution was weighted by means of the ratio between the static
critical values of GI and GII, obtaining a much better agreement.
Another expression for an equivalent SERR accounting for the mode mixity condition was
made by Quaresimin and Ricotta [15], where the mode II component was multiplied by the
ratio between GII and the total SERR. This definition accounts for the mode mixity, but it does
not consider the dependence of the crack propagation resistance on the loading mode.
Moroni and Pirondi [16] developed a procedure for crack growth simulation by means of a
cohesive model implemented in a finite element code. The input information for the code were

Chapter 8. Mixed mode crack propagation in composite bonded joints
under static and fatigue loading: characterisation and damage-based modelling
209
the cohesive law for the interface elements, the Paris-like equation and its dependence on the
mode mixity which was modelled by means of three criteria: the equivalent SERR proposed
by Quaresimin-Ricotta [15], the superposition of the mode I and II equations proposed by
Wahab [13] and an approach proposed by Kenane and Benzeggagh [17] for mixed mode
delamination in composite laminates. The latter consists in describing the crack propagation
by means of a Paris law expressed in terms of the total SERR, where the coefficients depend
on the mode mixity by means of phenomenological laws. Satisfactory results were obtained
with all the three mentioned criteria.
It can be concluded that a well established criterion cannot be found in the literature, and even
an extensive experimental investigation, aimed to the complete bonded joints characterization
from mode I to mode II, is still missing. As a consequence, a strong and expensive
experimental effort is needed in order to obtain reliable design tools for life estimation.
The aim of the present work is to define a criterion to describe the fatigue crack propagation in
composite bonded joints subjected to whatever mixed mode condition. In the writer’s opinion,
the only way to asses a reliable criterion of general validity is to understand and describe
quantitatively the propagation and damage modes, and their dependence on the mode mixity.
An important effort in this direction can be found in [8], just for the static behaviour. In [8]
Wang underlined the existence of two different propagation modes, respectively near the pure
mode I and mode II condition, which were described by means of two different criteria.
According to the observation of the damage mechanisms, Wang proposed the only the mode I
stress intensity factor as the driving force near the pure mode I condition, and the principal
strain evaluated at a generic point at the interface for mode II dominated loading conditions.
For the principal strain criterion Wang obtained a simple analytical expression based on the
interface fracture mechanics, including also a material constant describing the adhesive
sensitivity to the hydrostatic pressure, which can be used indeed as a fitting parameter.
In the present work, experimental static and fatigue tests were carried out on composite
bonded joints under pure mode I, pure mode II and mixed mode conditions. The static
experimental results are reported in terms of the total critical SERR (Gc) vs the mixed mode
condition. The results of the fatigue propagation tests are instead presented with Paris-like
curves relating the total SERR to the CGR.
The propagation modes during fatigue tests were analysed by means of an optical microscope,
and they were found to depend on the mixed mode condition. The observed mechanisms,
reported later on, are used as a basis for a damage-based mixed mode propagation criterion for
bonded joints.

Chapter 8. Mixed mode crack propagation in composite bonded joints
under static and fatigue loading: characterisation and damage-based modelling
210
8.2. Materials and test equipment
Laminates with stacking sequence [0]12 were produced by hand lay-up of carbon/epoxy fabric
tape CC206, T300 twill 2x2 carbon fabric/ET442 toughened epoxy matrix, from seal Texi-
preg®, and cured in autoclave, with a permanence for one hour at the temperature of 125°C
and pressure of 7 bars. Finally the test specimens were obtained by bonding two laminates
with a 0.15 mm layer of the two-part epoxy adhesive 9323 B/A by 3M, and cured in an oven at
65°C for two hours. In order to keep a uniform adhesive thickness, glass spheres with a 0.15
mm diameter were used. By inserting a Teflon sheet (50 μm thickness) between the two
adherends the initial crack of length a0 was created. Specimens were finally cut obtaining the
typical geometry of figure 1. The elastic properties of the materials are listed in table 1.
150 a0=3 0 40
25
Figure 1: Specimen’s geometry
Table 1: Elastic properties of adhesive and adherends
Adherends EL (MPa) ET (MPa) GLT (MPa) νLT
58080 58080 3300 0.06
Adhesive
E (MPa) ν
2879 0.37
Static and fatigue tests were carried out varying the mode mixity from pure mode I (DCB test)
to pure mode II (ENF test), through mixed I+II mode (MMB tests). Equipment and procedures
of reference for these tests can be found in [18-21], respectively.
The mode mixity was expressed by the following parameter:
150 3040
6

Chapter 8. Mixed mode crack propagation in composite bonded joints
under static and fatigue loading: characterisation and damage-based modelling
211
III
II
GG
GMM
(1)
Accordingly, pure mode I (DCB) test is characterized by MM = 0, and pure mode II (ENF)
test by MM = 1. Four intermediate MM values (MM=0.15, 0.36, 0.52, 0.75) were investigated
with MMB tests, by varying the lever arm length c (see Figure 2) and keeping constant the
length L.
Figure 2: (a) Schematic representation, (b) picture of the MMB test equipment and (c) load
condition for a MMB test
Tests were carried out on a MTS Minibionix servo-hydraulic machine equipped with a 1.5 kN
load cell. Crack opening was measured by means of the displacement transducer of the testing
machine and the crack length was monitored by means of a travelling optical microscope with
a magnification of 40x. Fatigue tests were characterized by a nominal load ratio, defined as
R=Fmin/Fmax, equal to 0.1, and a frequency varying from 2 to 8 Hz. Typically the frequency
was decreased in the final part of the tests because of the large crack opening displacements.
For the DCB and MMB tests, a gripping system was developed, composed by an aluminium
block and two screws for each arm of the cracked portion of the specimen, as in figure 3a).
c)
L
LcP )(
L
LcP
2
)(
L
LcP
2
)(
L
LcP
4
)3(
L
LcP
4
)3(
L
LcP )(
L
LcP
4
)(
L
LcP
2
)(
L
LcP
4
)(
MM
B
DCB ENF
P
a
c L
a) b)
Chapter 8. Mixed mode crack propagation in composite bonded joints
under static and fatigue loading: characterisation and damage-based modelling
212
The screws are placed in cut-outs obtained by machining the specimens, as shown in figure
3b), and finally the aluminium blocks are linked to the test equipment by means of hinges.
Figure 3: a) Gripping system and b) machined specimens with cut-outs for the screws
8.3. Calculation of the strain energy release rate
As already mentioned in the introduction, the results of static and fatigue tests are presented in
terms of the strain energy release rate, paying particular attention to the value of the mode
mixity defined in equation 1. Therefore, not only the total SERR is needed (Gtot = GI + GII),
but also the single mode I and II components, so that the MM can be calculated.
In [21] an analytical formulation is proposed, but it is valid for symmetrically cracked
specimens, as in the case of interlaminar toughness characterization of composite laminates. In
the case of the bonded joints the crack tip is usually at the adhesive-adherend interface, as will
be shown in paragraph 8.4, and therefore the specimen is not symmetrically cracked, both in
terms of geometry and materials. Therefore using the formulation proposed in [21] leads to an
erroneous calculation of the total SERR and most of all of the mode mixity (errors up to 80%
for the MM).
In [22], an analytical formulation is proposed for bonded joints, taking into account the
presence of the adhesive layer. The mode I and II components are obtained by differentiating
the global compliance with respect to the crack length. Despite the merit of considering the
adhesive layer, the method proposed in [22] provides again wrong values for the MM.
In the present work the SERR components have been calculated by means of linear elastic FE
analyses with the code ANSYS 11® and the Virtual Crack Closure Technique (VCCT). The

Chapter 8. Mixed mode crack propagation in composite bonded joints
under static and fatigue loading: characterisation and damage-based modelling
213
latter is based on local forces and displacements at the crack tip, and it is considered a reliable
way for the evaluation of the SERR components, which has been often adopted in the
literature [9,15, 23-25]. The VCCT technique requires that the elements immediately before
and after the crack tip are of the same size ∆a (see figure 4). In this work, the crack was
modelled at the adhesive-adherend interface and the whole adhesive layer was meshed with 8-
nodes plane strain (PLANE82) elements. After a convergence analysis the element size was
fixed equal to 0.03 mm, according to [15].
Figure 4: Deformed mesh around the crack tip
In the FE analyses of the MMB specimens the loads have been applied as in figure 2c and
considering also the influence of the lever weight, as explained in [21].
8.4. Static test results
Load and displacement were recorded during the static tests obtaining curves, as shown in
figure 5 a) and b). As it can be seen in figure 5, an unstable crack growth is typical of all the
mixed mode conditions. However, while the specimens for MM = 0 and 0.15 have a linear
behaviour up to the critical point, increasing the MM there is a more and more marked plateau
which precedes the unstable propagation. This phenomenon could be due to a progressive
damage evolution in the adhesive.
Chapter 8. Mixed mode crack propagation in composite bonded joints
under static and fatigue loading: characterisation and damage-based modelling
214
Figure 5: Load-displacement curves for a) MM=0, 0.15, 0.36 and b) MM=0.52, 0.75, 1
For the calculation of the critical values of the SERR the procedure recommended in
ASTMD5528 [18] has been adopted. Accordingly, the critical load has to be identified as the
maximum load before the propagation or the load corresponding to the increase of 5% of the
compliance, if the latter occurred first. All static tests results are plotted in Figure 6, in terms
of total SERR Gc = (GI+ GII)c versus the mode mixity, showing that mode II is far less critical
than mode I, as usually found in literature [6-8].
0
100
200
300
400
500
600
700
0 5 10 15 20 25 30
Load
[N
]
Displacement [mm]
MM = 0
MM = 0.15
MM = 0.36
a)
0
1000
2000
3000
0 2 4 6 8 10
Load
[N
]
Displacement [mm]
MM = 0.52
MM = 0.75
MM = 1
b)
Chapter 8. Mixed mode crack propagation in composite bonded joints
under static and fatigue loading: characterisation and damage-based modelling
215
Figure 6: Total critical SERR versus mode mixity
8.5. Fatigue test results and damage evolution
Fatigue tests were carried out by imposing the six MM values already chosen for static tests.
Different propagation and damage mechanisms were identified by varying the MM, and they
are schematically summarised in Figure 7.
Figure 7: Crack location and propagation as function of mode mixity
It was noticed that DCB specimens are characterized by a continuous crack propagation in the
adhesive or at the adhesive-adherend interface, as illustrated in Figure 8.
0
500
1000
1500
2000
2500
3000
3500
4000
4500
0 0.2 0.4 0.6 0.8 1
Gto
t [J
/m2]
MM = GII/Gtot
1)
Inclined cracks in the
adhesive
Adhesive, adherend
and interface
Separated
delaminations in the
upper adherend
Adhesive and
interface
2)
3)
4)
Mode II
Mode I

Chapter 8. Mixed mode crack propagation in composite bonded joints
under static and fatigue loading: characterisation and damage-based modelling
216
For MM = 0.15 and 0.36, the damage evolution is more complex and it is not continuous. In
fact independent delaminations in the upper adherend occurred beyond the main crack tip,
which could be either at the interface or in the adherend itself, as shown in Figure 9. It was
observed that in the final part of the fatigue life (the final 20-25%), the main crack ceased
propagating for thousands of cycles, while independent delaminations initiated and propagated
in the adherend. Then they often joined, thus creating a longer delamination, as shown in
Figure 10. The further evolution of damage for the same specimen is shown in Figure 11. It
can be seen that the delamination propagated in the adherend, while the main crack, which is
much shorter, propagated at the interface below the delamination itself.
Specimens with MM = 0.52 were characterized by crack propagation in the adhesive, at the
interface and sometimes in the upper adherend, preceded by the initiation of multiple inclined
micro-cracks in the adhesive in front of the main crack tip (Figure 12).
In the case of loading conditions near to the pure mode II (MM = 0.75), the initial damage
mechanism consisted of the onset of separated roughly 45° oriented cracks in the adhesive
layer, which stopped when they reached the adhesive-adherend interface, as shown in figure
13. Once these cracks were formed, they joined after some thousands of cycles creating a
continuous crack in the adhesive, which sometimes propagated also in the upper adherend, as
shown in Figure 14.
In the case of pure mode II tests, one single damage mechanism was observed, consisting of
45°-oriented crack initiations followed by coalescence into a macro-crack and propagation
inside the adhesive layer. This is a very typical behaviour for ENF bonded joints [26, 27], and
it is reasonably due to the principal stress distribution in the adhesive.
Figure 8: Typical crack propagation for a DCB specimen
CRACK AT INTERFACE CRACK IN THE ADHESIVE

Chapter 8. Mixed mode crack propagation in composite bonded joints
under static and fatigue loading: characterisation and damage-based modelling
217
Figure 9: Delaminations, mode mixity = 0.15
Figure 10: Joined delaminations, mode mixity = 0.15
Figure 11: Joined delaminations and main crack interface propagation, mode mixity = 0.15
Figure 12: Typical crack propagation for mode mixity = 0.52
Figure 13: Inclined cracks in the adhesive for mode mixity = 0.75
MAIN CRACK
FIRST DELAMINATION
SECOND DELAMINATION
THIRD DELAMINATION
JOINED DELAMINATIONS
SECOND DELAMINATION MAIN CRACK
JOINED DELAMINATIONS
MAIN CRACK AT INTERFACE
CRACKS IN THE ADHESIVE
MAIN CRACK TIP AT INTERFACE
CRACKS IN THE ADHESIVE
MAIN CRACK TIP AT INTERFACE

Chapter 8. Mixed mode crack propagation in composite bonded joints
under static and fatigue loading: characterisation and damage-based modelling
218
Figure 14: Joined inclined cracks and propagation in the adherend for mode mixity = 0.75
During fatigue tests the crack length a was measured, and plotted against the number of
cycles. In case of a non-continuous crack propagation, as for instance for MM = 0.15 and 0.36,
the crack length was considered as the distance between the load application point and the tip
of the farthest crack or delamination, as shown in figure 15.
Figure 15: criterion for crack length measurement in the case of separated delaminations
Starting from the a-N curves and using the IPM method [28], the Crack Growth Rate (CGR)
has been calculated and plotted versus the value of ∆Gtot (Gtot,max - Gtot,min), calculated by
means of FE analyses, obtaining the Paris curves shown in figure 16. It can be clearly seen that
the curves expressed in terms of the total SERR gradually shift from left to right as the MM
increases. Even concerning the fatigue behaviour the pure mode II condition is far less critical
than the pure mode I loading. This means that, for a fixed value of ∆Gtot, a lower CGR is
reached as the mode II contribution increases. In addition it is clear that the total SERR is not a
good parameter for the univocal description of the crack propagation phenomenon under
mixed mode conditions, as it was also reported in [9-11].
CRACK IN THE ADHEREND JOINED CRACKS
measured crack length a

Chapter 8. Mixed mode crack propagation in composite bonded joints
under static and fatigue loading: characterisation and damage-based modelling
219
Figure 16: Paris curves in terms of total SERR
The Paris-like curves can be described by means of a power law expressed in the form:
Δd
tot
daC G
dN (2)
The coefficients of the Paris-like curves for every mixed mode condition are listed in Table 2.
Table 2: Coefficients of the Paris-like laws for the different mode mixities investigated (valid
for CGR expressed in mm/cycle and SERR in J/m2).
MM C d
0 3.04E-12 3.16
0.15 5.66E-08 2.03
0.36 4.20E-08 2.40
0.52 2.02E-08 4.59
0.75 2.02E-08 4.35
1 1.34E-08 4.10
Another interesting way, also consistent to that adopted for the static behaviour in figure 6, to
present fatigue data is by means of iso-CGR curves in the MM-∆Gtot as in figures 17. The
points in this figure are calculated by means of the Paris-like law expressed in equation (2) for
each conducted test.
1.E-07
1.E-06
1.E-05
1.E-04
1.E-03
1.E-02
1.E-01
10 100 1000 10000
CG
R (
mm
/cycl
e)
∆Gtot [J/m2]
MM = 0
MM = 0.15
MM = 0.36
MM = 0.52
MM = 0.75
MM = 1

Chapter 8. Mixed mode crack propagation in composite bonded joints
under static and fatigue loading: characterisation and damage-based modelling
220
Figure 17: Iso-CGR curves in the MM-∆Gtot plane
As can be seen from figure 17, some points are characterised by unreasonably high valued of
the total SERR, which are clearly out of the general trend. These points are related to the
propagation mode consisting in the initiation and propagation of independent delaminations
occurring for MM = 0.15 and 0.36, as shown in figure 15. For this reason, as this damage is
mode not related to the bonded joint itself but to the damage in the laminate, these points are
not considered in subsequent analyses.
8.6. Development of a new criterion
8.6.1 Damage analysis
In order to develop a reliable criterion for static and fatigue crack propagation, the observed
damage mechanisms have to be taken into account. In particular, two propagation modes have
been observed: a continuous crack propagation occurring mainly at the interface near the pure
mode I loading, and inclined micro-cracks in the adhesive near the pure mode II, which is
reasonably due to the maximum principal stress field in the vicinity of the crack tip.
The damage mode consisting of independent delaminations (number 2 in figure 7) is not
considered here because it is not related to the properties of the bonded joints, and in addition
it has never been observed in the single lap specimens tested in [3] made of the same materials
and subjected to similar values of the mode mixity. Therefore, as will be underlined in figure
26, 27, some fatigue data related to MM = 0.15 and 0.36 at high CGR were not considered for
the validation of the criterion that will be proposed further. Anyway for the same MM values
and low CGR, the fatigue data can be considered acceptable, since at the beginning of the
0
500
1000
1500
2000
0 0.2 0.4 0.6 0.8 1
∆G
tot(J
/m2)
MM
CGR = 1E-3 mm/cycle
CGR = 1E-4 mm/cycle
CGR = 1E-5 mm/cycle
data to be discarted
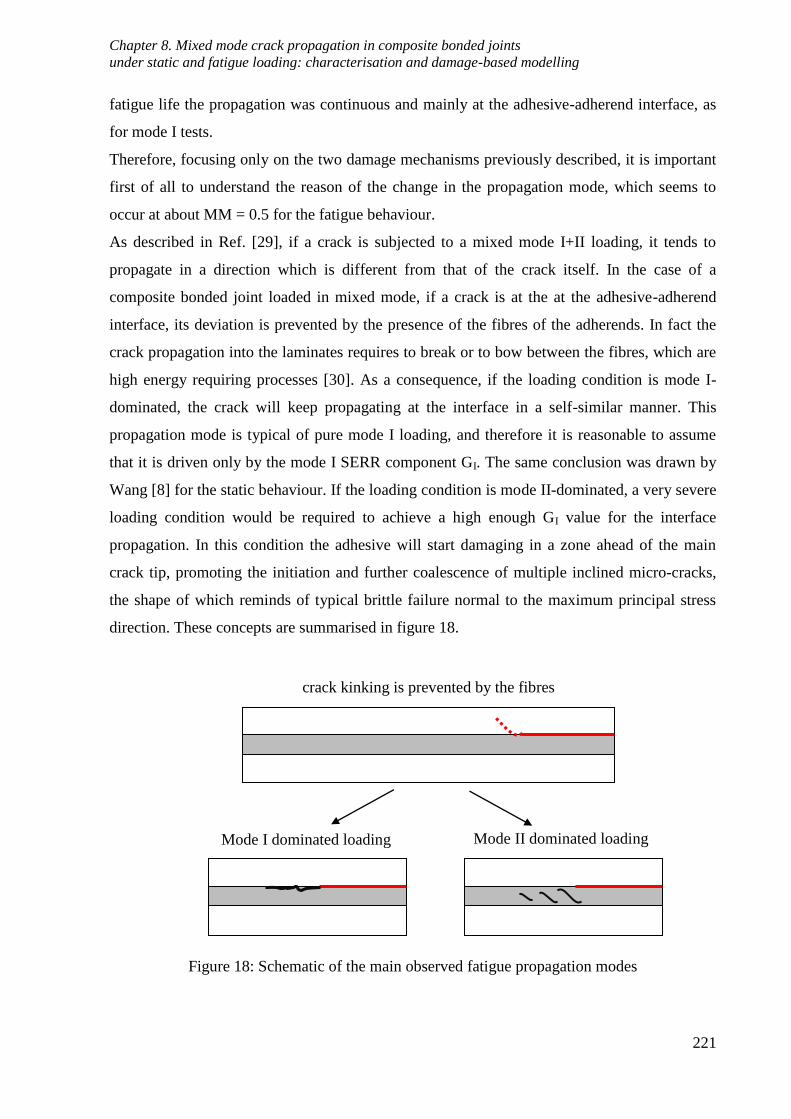
Chapter 8. Mixed mode crack propagation in composite bonded joints
under static and fatigue loading: characterisation and damage-based modelling
221
fatigue life the propagation was continuous and mainly at the adhesive-adherend interface, as
for mode I tests.
Therefore, focusing only on the two damage mechanisms previously described, it is important
first of all to understand the reason of the change in the propagation mode, which seems to
occur at about MM = 0.5 for the fatigue behaviour.
As described in Ref. [29], if a crack is subjected to a mixed mode I+II loading, it tends to
propagate in a direction which is different from that of the crack itself. In the case of a
composite bonded joint loaded in mixed mode, if a crack is at the at the adhesive-adherend
interface, its deviation is prevented by the presence of the fibres of the adherends. In fact the
crack propagation into the laminates requires to break or to bow between the fibres, which are
high energy requiring processes [30]. As a consequence, if the loading condition is mode I-
dominated, the crack will keep propagating at the interface in a self-similar manner. This
propagation mode is typical of pure mode I loading, and therefore it is reasonable to assume
that it is driven only by the mode I SERR component GI. The same conclusion was drawn by
Wang [8] for the static behaviour. If the loading condition is mode II-dominated, a very severe
loading condition would be required to achieve a high enough GI value for the interface
propagation. In this condition the adhesive will start damaging in a zone ahead of the main
crack tip, promoting the initiation and further coalescence of multiple inclined micro-cracks,
the shape of which reminds of typical brittle failure normal to the maximum principal stress
direction. These concepts are summarised in figure 18.
Figure 18: Schematic of the main observed fatigue propagation modes
Mode I dominated loading Mode II dominated loading
crack kinking is prevented by the fibres

Chapter 8. Mixed mode crack propagation in composite bonded joints
under static and fatigue loading: characterisation and damage-based modelling
222
To confirm the relevance of the maximum principal stress field as driving force for the latter
damage mode, the comparison between the principal directions calculated by means of FE
analyses and the inclined micro-cracks for a specimen tested under MM = 0.75 is presented in
figure 19. A very good correspondence is found between the principal direction and the
normal to the micro-cracks initiation planes.
Figure 19: Comparison between FE principal directions and micro-cracks in the adhesive, MM
= 0.75
It is also important to underline that the fatigue failure does not involve a single point in the
adhesive, but a finite region which can be named process zone. A clear evidence is shown in
Figure 20, which is representative of a MM=0.75.
In figure 20a) the initial crack tip is at the interface between the adhesive and the upper
laminate and it is followed by a region in which the adhesive whitening indicates where the
fatigue damage evolution is in progress.
In figure 20b), it can be seen that the above mentioned process zone, after 10000 cycles, is
characterized by the presence of inclined cracks which start joining in a longer macro-crack.
The new main crack tip can be considered the last tip at the interface, which is once again
followed by a new process zone.
adhesive
crack
Interface tip

Chapter 8. Mixed mode crack propagation in composite bonded joints
under static and fatigue loading: characterisation and damage-based modelling
223
Figure 20: Damage evolution and process zone, MM = 0.75
This evidence clarifies that a point criterion as that proposed by Wang [8] is not suitable for
the problem under analysis, and it can be improved by considering the principal stress field in
a finite region representative of the process zone.
The fact that the adhesive failure in bonded joints is not a point phenomenon, but it involves a
finite damage zone, is not new in the literature, and some criteria, based on the existence of
such a process zone, have been defined in the literature for the static strength prediction of
uncracked bonded joints [31-33].
8.6.2 Modelling
As has been shown above, if the MM is enough high, the maximum principal stress field
ahead of the crack tip seems to play an important role for the damage progression and crack
propagation. In addition, it is clear that the damage involves a process zone ahead of the crack
tip which is longer than the adhesive thickness t. Therefore the authors propose to use, as
driving force parameter for this damage mechanism, the maximum principal stress averaged
inside a control volume Vc which is representative of the process zone. It was assumed that this
volume is rectangular in shape, involving the whole adhesive thickness and with a length equal
Interface crack
tip
Process zone
10000 Cycles
New interface crack tip
New process zone
previous process zone
20000 Cycles
b) a)
Process zone New process zone
New interface crack tip initial crack

Chapter 8. Mixed mode crack propagation in composite bonded joints
under static and fatigue loading: characterisation and damage-based modelling
224
to 3t, as shown in figure 21. The length 3t was chosen on the basis of experimental
observations.
Figure 21: Schematic representation of the control volume
Therefore when the propagation mode consists on the initiation and coalescence of inclined
micro-cracks the following stress parameter, S, is proposed as representative of the driving
force
cVc
dVV
S 1
1 (3)
where ζ1 is the maximum principal stress.
The parameter S is calculated by means of FE models, and a convergence analysis was
carried-out in order to check its sensitivity to the elements size. Two mesh strategy were
adopted: the typical mesh for the SERR calculation by using the VCCT, already described in
paragraph 8.3, by varying the element size ∆a from 0.01 to 0.075 mm, and a typical mesh for
crack modelling, with an element size of 10-5
mm at the crack tip. It was found that the S
parameter is mesh insensitive, the variation being lower than 1% in the analysed range of
element size. This can be explained by considering that the length of the volume equal to 3t is
longer than the singularity dominated zone, defined as the zone where the stress, plotted
against the distance from the tip in a double logarithmic scale, can be described by a straight
line. In fact the singularity dominated zone is extended, at the interface, for a length which is
no longer than the adhesive thickness, as can be seen in figure 22, where the stress in y
direction is plotted versus the distance from the tip normalized to the adhesive thickness, for
MM = 0.52.
adherend
adherend
adhesive
Interface crack
t
Control volume
3t

Chapter 8. Mixed mode crack propagation in composite bonded joints
under static and fatigue loading: characterisation and damage-based modelling
225
Figure 22: ζy at the interface as a function of the distance normalized to the layer thickness,
MM = 0.52
It is interesting to note that a square root dependence there exist between the total SERR Gtot
and the stress parameter S, as in equation (4).
totS k MM G (4)
The coefficient k(MM) is a function of the mode mixity, to be calculated by means of FE
analyses.
Figure 23: Relationship between Gtot and S for MM = 0.52
1
10
100
1000
10000
0.001 0.01 0.1 1 10
ζy
[MP
a]
x/t
t
xy
singularity
dominated zone
0
40
80
120
160
0 500 1000 1500 2000 2500 3000
S [
MP
a]
Gtot [J/m2]
FE results (varying P)
FE results (varying a and P)
Eq.(4), k = 2.68

Chapter 8. Mixed mode crack propagation in composite bonded joints
under static and fatigue loading: characterisation and damage-based modelling
226
As an example, figure 23 shows the relationship between Gtot and S for an MMB specimen
with MM = 0.52. FE analyses have been carried out varying both the load P, from 200 to 800
N, and the crack length a, from 10 to 40 mm. It can be seen that a single curve of the form
given by equation (4) is suitable to fit all the points with a parameter k = 2.68 for the case
under analysis.
The k(MM) values calculated for the different test configurations adopted in the present work
are summarized in Table 3.
Table 3: Values of k(MM) for the considered MM calculated via FE simulations
MM k
0 2
0.15 2.63
0.36 2.73
0.52 2.68
0.75 2.55
1 2
After introducing the stress parameter S and keeping in mind the damage mechanisms
observed during the fatigue test programme, the following criteria are proposed:
- for MM ≤ MM* the only mode I SERR contribution, GI, is responsible for the interface
crack propagation;
- for MM ≥ MM* the parameter S is representative of the driving force for crack propagation
by means of initiation and coalescence of inclined micro-cracks in the adhesive.
MM* is the value of the mode mixity corresponding to the transition between the two damage
modes and therefore between the two synthesis parameters to be used. According to the
experimental evidences reported in paragraph 8.5, MM* is roughly equal to 0.5 for the fatigue
behaviour.
8.7. Application to experimental data
8.7.1 Fatigue loading
The above mentioned criterion is now applied to static and fatigue experimental results
previously presented, which are here re-analyzed in terms of GI and S.
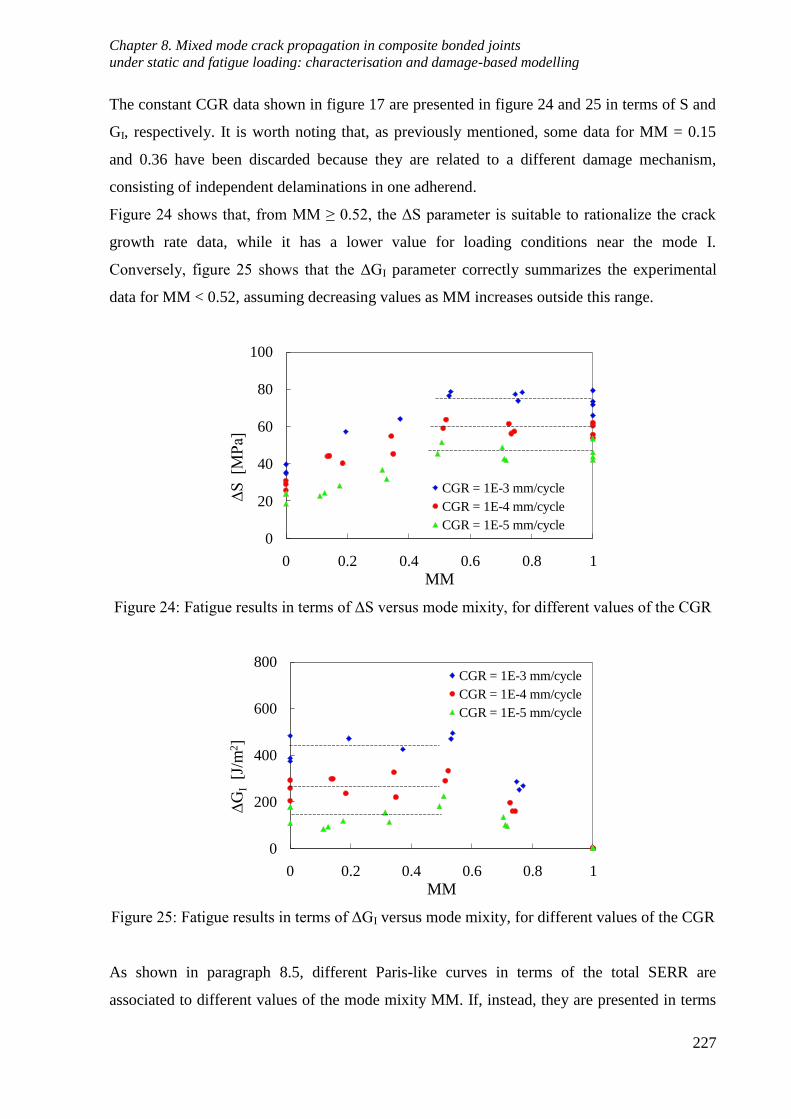
Chapter 8. Mixed mode crack propagation in composite bonded joints
under static and fatigue loading: characterisation and damage-based modelling
227
The constant CGR data shown in figure 17 are presented in figure 24 and 25 in terms of S and
GI, respectively. It is worth noting that, as previously mentioned, some data for MM = 0.15
and 0.36 have been discarded because they are related to a different damage mechanism,
consisting of independent delaminations in one adherend.
Figure 24 shows that, from MM ≥ 0.52, the ΔS parameter is suitable to rationalize the crack
growth rate data, while it has a lower value for loading conditions near the mode I.
Conversely, figure 25 shows that the ΔGI parameter correctly summarizes the experimental
data for MM < 0.52, assuming decreasing values as MM increases outside this range.
Figure 24: Fatigue results in terms of ΔS versus mode mixity, for different values of the CGR
Figure 25: Fatigue results in terms of ΔGI versus mode mixity, for different values of the CGR
As shown in paragraph 8.5, different Paris-like curves in terms of the total SERR are
associated to different values of the mode mixity MM. If, instead, they are presented in terms
0
20
40
60
80
100
0 0.2 0.4 0.6 0.8 1
∆S
[M
Pa]
MM
CGR = 1E-3 mm/cycle
CGR = 1E-4 mm/cycle
CGR = 1E-5 mm/cycle
0
200
400
600
800
0 0.2 0.4 0.6 0.8 1
∆G
I[J
/m2]
MM
CGR = 1E-3 mm/cycle
CGR = 1E-4 mm/cycle
CGR = 1E-5 mm/cycle
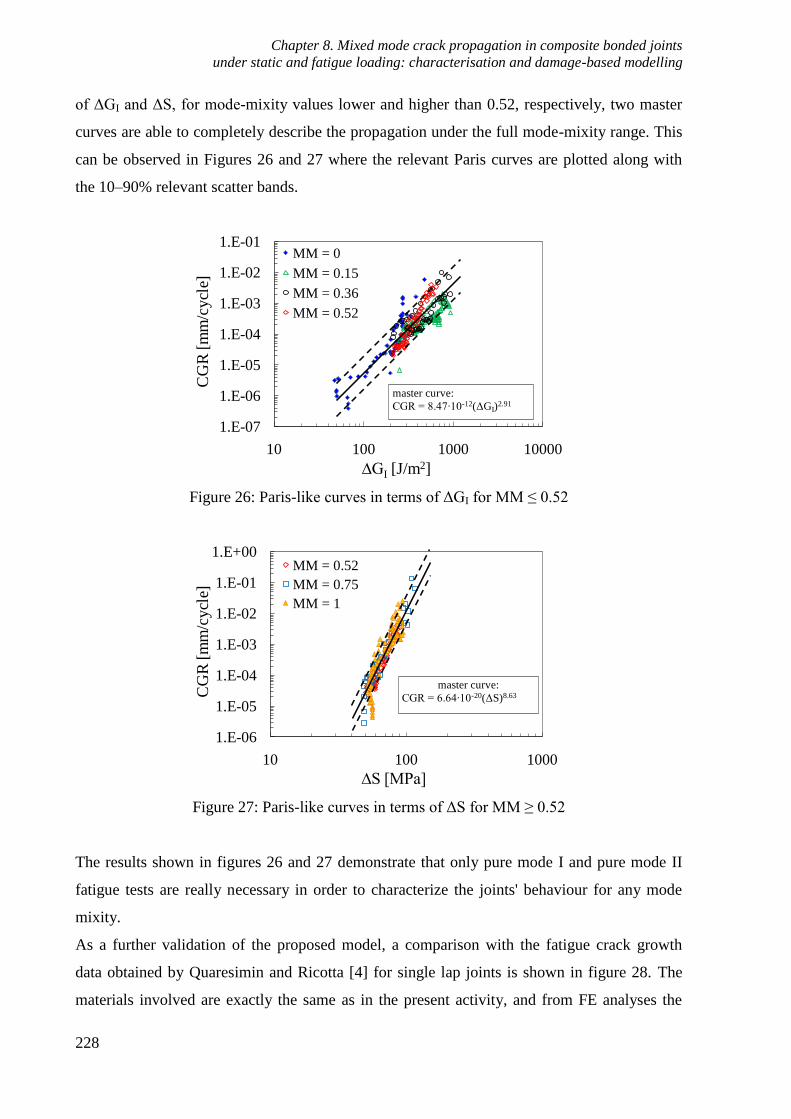
Chapter 8. Mixed mode crack propagation in composite bonded joints
under static and fatigue loading: characterisation and damage-based modelling
228
of ΔGI and ΔS, for mode-mixity values lower and higher than 0.52, respectively, two master
curves are able to completely describe the propagation under the full mode-mixity range. This
can be observed in Figures 26 and 27 where the relevant Paris curves are plotted along with
the 10–90% relevant scatter bands.
Figure 26: Paris-like curves in terms of ΔGI for MM ≤ 0.52
Figure 27: Paris-like curves in terms of ΔS for MM ≥ 0.52
The results shown in figures 26 and 27 demonstrate that only pure mode I and pure mode II
fatigue tests are really necessary in order to characterize the joints' behaviour for any mode
mixity.
As a further validation of the proposed model, a comparison with the fatigue crack growth
data obtained by Quaresimin and Ricotta [4] for single lap joints is shown in figure 28. The
materials involved are exactly the same as in the present activity, and from FE analyses the
1.E-07
1.E-06
1.E-05
1.E-04
1.E-03
1.E-02
1.E-01
10 100 1000 10000
CG
R [
mm
/cycl
e]
∆GI [J/m2]
MM = 0
MM = 0.15
MM = 0.36
MM = 0.52
master curve:
CGR = 8.47∙10-12(ΔGI)2.91
1.E-06
1.E-05
1.E-04
1.E-03
1.E-02
1.E-01
1.E+00
10 100 1000
CG
R [
mm
/cycl
e]
∆S [MPa]
MM = 0.52
MM = 0.75
MM = 1
master curve:
CGR = 6.64∙10-20(ΔS)8.63

Chapter 8. Mixed mode crack propagation in composite bonded joints
under static and fatigue loading: characterisation and damage-based modelling
229
values of GI and GII were calculated in [15]. The resulting values of the mode mixity were
always less than 0.5, apart from a very few points, and therefore the criterion to be used for
crack growth rate prediction should be the pure mode I driven propagation. In fact, if the Paris
curve from Ref. [3] is plotted in terms of ΔGI, it is included in the scatter band for the present
experiments for MM ≤ 0.52 computed in the analysis shown in figure 26.
The present criterion also explains the reason why Wahab et al. [13] and Kinloch-Osiyemi
[14] obtained good predictions for the single lap joints using the only mode I contribution and
the Paris-like curve obtained from a pure mode I test.
Figure 28: Comparison between the present scatter band and the results from [15] in terms of
ΔGI
8.7.2 Static loading
Even if the criterion has been developed on the basis of fatigue-related damage mechanisms, it
has also been extended to the analysis of the static response of bonded joints, assuming that
the damage mechanisms are the same of cyclic loading.
The static test results summarized in terms of S are shown in figure 29: it can be seen that for
MM ≥ 0.36 all the points can be reasonably described by a horizontal scatter band which
collects the experimental data with a 10-90% probability of failure. Its amplitude is
characterized by the TS parameter defined as S10%/S90% equal to 1.35, which is a reasonable
value.
1.E-07
1.E-06
1.E-05
1.E-04
1.E-03
1.E-02
1.E-01
10 100 1000 10000
CG
R [
mm
/cycl
e]
∆GI [J/m2]
single lap results [15]
90-10% scatter band
from present results

Chapter 8. Mixed mode crack propagation in composite bonded joints
under static and fatigue loading: characterisation and damage-based modelling
230
Figure 29: Static results; S versus the mode mixity
This seems to confirm the idea that also concerning static behaviour the crack propagation is
controlled by the maximum principal stress field for enough high values of the mode mixity. It
is important to note that, for lower MM, which means for loading conditions near the pure
mode I, the value of S is lower. Conversely, in those cases the value of the only mode I
contribution is higher, as can be seen in figure 30. Once again a horizontal band, from MM = 0
to 0.36, can be defined in terms of GI, with an average value of 1335 J/m2 and TG equal to 2.66
(TG=GI,10%/GI,90%). In this case the scatter is larger, but it depends also on the high dispersion
which is intrinsic in the phenomenon and which is very well evident for the pure mode I
results. It is important to remind that GI is an energetic parameter and therefore it is more
appropriate to compare TS with the square root of TG, which is equal to 1.63. Finally, by
considering the actual experimental data, the transition point between the two different
damage modes, and therefore between the two criteria to be used, can be roughly set at MM =
0.35. This seems to be consistent with the fact that a plateau is seen to occur in the load
displacement curves for MM ≥ 0.36. This behaviour could be due to a progressive damage
evolution in the adhesive layer by means of inclined micro-cracks, but this should be checked
when dealing with static loading.
0
40
80
120
160
0 0.2 0.4 0.6 0.8 1
S [
MP
a]
MM = GII/Gtot
average value Sc = 124 MPa
TS (90-10%) = 1.35
principal stress controlled
failure of the adhesive

Chapter 8. Mixed mode crack propagation in composite bonded joints
under static and fatigue loading: characterisation and damage-based modelling
231
Figure 30: Static results in terms of GI versus the mode mixity
As a further validation of the present model even for the static case, the S criterion was applied
to the experimental data taken from [34]. Ji et al. [34] conducted static tests on pre-cracked
ENF specimens made of composite laminates bonded with an epoxy adhesive, varying the
layer thickness t from 0.1 to 0.8 mm. They obtained an increasing trend of the critical SERR
for increasing values of t. Pictures of the specimens during tests, documented the adhesive
damage within a process zone, with the nucleation of inclined micro-cracks, similar to those
observed in the present work. The S criterion was applied to the specimens described in [34],
always keeping a length of the control volume equal to 3t.
This means that the control volume, representative of the process zone, is larger as the
thickness of the adhesive layer increases.
Figure 31: comparison between the present model prediction and the experimental results from
[34]
0
1000
2000
3000
0 0.2 0.4 0.6 0.8 1
GI [J
/m2]
MM = GII/Gtot
average value GIc = 1345 J/m2
TG (90-10%) = 2.66
mode I
controlled
propagation
0
2
4
6
8
10
0 0.1 0.2 0.3 0.4 0.5 0.6 0.7 0.8 0.9
GII
c(t)
/GII
c(0
.1)
adhesive thickness t [mm]
model prediction
maximum load
Visible propagation

Chapter 8. Mixed mode crack propagation in composite bonded joints
under static and fatigue loading: characterisation and damage-based modelling
232
Figure 31 shows the comparison between the model prediction and the experimental results,
calculated with two different criteria for the detection of the critical point in the load-
displacement curve. The predicted increase in the mode II toughness, referred to the value
obtained for t = 0.1, is in satisfactory agreement with the experimental results. This enhances
the hopes concerning the suitability of the present model for bonded joints loaded nearly in
mode II.
8.8. Conclusions
The static and fatigue crack propagation was analyzed for bonded joints subjected to mixed
mode I + II loadings. In terms of the total SERR, the loading condition is less critical as the
mode II contribution increases, both in static and fatigue. In particular, concerning the fatigue
behaviour, a higher value of the total SERR is required to obtain a certain value of the CGR,
as the pure mode two condition is approached. In general, different Paris curves describe the
crack propagation for different values of the mode mixity, and this requires a large amount of
experiments for the material characterization, in order to obtain a tool for the assessment of the
life spent for crack propagation.
To overcome this difficulty, a criterion for an univocal description of the propagation
phenomenon is needed and several attempts can be found in the literature.
In the present work the mechanisms of crack propagation were deeply investigated, and two
main damage modes were found: continuous crack propagation driven by the mode I
contribution, and adhesive failure by means of inclined micro-cracks, due to the principal
stress field ahead the crack tip. A parameter S, which is the average value of the maximum
principal stress inside a control volume has been defined, and it was shown to be a good
synthesis parameter to describe the crack propagation characterized by the second damage
mode, i.e for mode mixities ≥ 0.5. Conversely the only mode I contribution was found to
collapse the Paris curves for MM < 0.5, confirming the idea that the propagation in those cases
is only due to the opening mode.
It was proven that two scatter bands and master curves, expressed in terms of ΔGI and ΔS, are
suitable to describe the mixed mode propagation under the full range of mode mixities.
Therefore, only two tests are necessary for the material characterization, for example a pure
mode I (DCB) test, and a pure mode II (ENF) test. The equation for the Paris curve obtained in
the DCB test, relating the CGR to ΔGI can be used for the first propagation mode, while the
master curve from the ENF test relating the CGR to ΔS can be used for the second one. The

Chapter 8. Mixed mode crack propagation in composite bonded joints
under static and fatigue loading: characterisation and damage-based modelling
233
application of the criterion to the present results and other results from the literature seems to
support its reliability both for the fatigue and the static behaviour.

Chapter 8. Mixed mode crack propagation in composite bonded joints
under static and fatigue loading: characterisation and damage-based modelling
234
References of chapter 8
[1] Johnson WS, Mall S. Influence of interface ply orientation on fatigue damage of
adhesively bonded composite joints. Journal of Composites Technology & Research.
1986; 8(1): 3-7.
[2] Potter KD, Guild FJ, Harvey HJ, Wisnom MM, Adams RD. Understanding and control
of adhesive crack propagation in bonded joints between carbon fibre composite
adherends I. Experimental. International Journal of Adhesion and Adhesives. 2001.
21(6): 435-443.
[3] Quaresimin M, Ricotta M. Fatigue behaviour and damage evolution of single lap bonded
joints in composite material. Composites Science and Technology. 2006. 66 (2): 176-
187.
[4] Quaresimin M, Ricotta M. Life prediction of bonded joints in composite materials.
International Journal of Fatigue. 2006. 28(10): 1166-76.
[5] Meneghetti G, Quaresimin M, Ricotta M. Influence of the interface ply orientation on
the fatigue behaviour of bonded joints in composite materials. International Journal of
Fatigue. 2010. 32(1): 82-93.
[6] Ducept F, Davies P, Gamby D. Mixed mode failure criteria for a glass/epoxy composite
and an adhesively bonded composite/composite joint. International Journal of Adhesion
& Adhesives. 2000. 20(3): 233-44.
[7] De Moura MFSF, Oliveira JMQ, Morais JJL, Dourado N. Mixed-mode (I + II) fracture
characterization of wood bonded joints. Construction and Building Materials. 2011.
25(4): 1956-62.
[8] Wang CH. Fracture of interface cracks under combined loading. Engineering Fracture
Mechanics. 1997. 56(1): 77-86.
[9] Xu XX, Crocombe AD, Smith PA. Mixed-mode fatigue and fracture behaviour of joints
bonded with either filled or filled and toughened adhesive. International Journal of
Fatigue. 1995. 17(4), 279-86.
[10] Azari S, M. Papini M, Schroeder JA, Spelt JK. The effect of mode ratio and bond
interface on the fatigue behavior of a highly-toughened epoxy. Engineering Fracture
Mechanics. 2010. 77(3): 395-414.
[11] Cheuk PT, Tong L, Wang CH, Baker A, Chalkley P, Fatigue crack growth in adhesively
bonded composite-metal double-lap joints. Composite Structures. 2002. 57(1-4): 109-
115.

Chapter 8. Mixed mode crack propagation in composite bonded joints
under static and fatigue loading: characterisation and damage-based modelling
235
[12] Curley AJ, Hadavinia H, Kinloch AJ, Taylor AC. Predicting the service-life of
adhesively-bonded joints- International Journal of Fracture. 2000; 103(1): 41-69.
[13] Abdel Wahab MM, Ashcroft IA, Crocombe AD, Smith PA. Numerical prediction of
fatigue crack propagation lifetime in adhesively bonded structures. International Journal
of Fatigue. 2002; 24(6): 705-09.
[14] Kinloch AI, S. Osiyemi O. Predicting the fatigue life of adhesively-bonded joints.
Journal of Adhesion. 1993; 43(1-2): 79-90 (1993)
[15] Quaresimin M, Ricotta M. Life prediction of bonded joints in composite materials.
International Journal of Fatigue. 2006; 28(10): 1166-1176.
[16] Moroni F, Pirondi A. A procedure for the simulation of fatigue crack growth in
adhesively bonded joints based on the cohesive zone model and different mixed-mode
propagation criteria. Engineering Fracture Mechanics. 2011; 78(8): 1808-16.
[17] Kenane M, Benzeggagh ML. Mixed-mode delamination fracture toughness of
unidirectional glass/epoxy composites under fatigue loading. Composites Science and
Technology. 1997; 57(5): 597-605.
[18] ASTMD 5528-01: Standard test method for mode I interlaminar fracture toughness of
unidirectional fiber-reinforced polymer matrix composites. ASTM International. 2001
[19] ASTMD 3115-97: Mode I Fatigue Delamination Growth Onset of Unidirectional Fiber-
Reinforced Polymer Matrix Composites. ASTM International. 1997.
[20] prEN 6034: Determination of interlaminar fracture toughness energy Mode II-GIic
[21] ASTMD 6671-01: Standard test method for mixed mode I-II interlaminar fracture
toughness of unidirectional fiber-reinforced polymer matrix composites. ASTM
International. 2001
[22] Z. Liu, R. F. Gibson, G. M. Newaz. The use of a modified mixed mode bending test for
characterization of mixed-mode fracture behavior of adhesively bonded metal joints.
Journal of Adhesion. 2002. 78(3), 223-44.
[23] Liu S, Mei Y, Wu TY. Bimaterial interfacial crack growth as a function of mode-mixity.
IEEE Transactions on Components, Packaging and Manufacturing Technology - Part A.
1985. 18: 618-26.
[24] Ashcroft IA, Casas-Rodriguez JP, Silberschmidt VV. Mixed-mode crack growth in
bonded composite joints under standard and impact-fatigue loading. Journal of material
science. 2008. 43(20): 6704-13.

Chapter 8. Mixed mode crack propagation in composite bonded joints
under static and fatigue loading: characterisation and damage-based modelling
236
[25] Ashcroft IA, Casas-Rodriguez JP, Silberschmidt VV. A model to predict the anomalous
fatigue crack growth behaviour seen in mixed mechanism fracture. Journal of Adhesion.
2010. 86(5-6): 522-38.
[26] Leffler K, Alfredsson KS, U. Stigh U. Shear behaviour of adhesive layers. International
Journal of Solids and Structures. 2007. 44(2): 530-45.
[27] Blackman BRK, Kinloch AJ, Paraschi M, The determination of the mode II adhesive
fracture resistance, GIIC, of structural adhesive joints: an effective crack length
approach. Engineering Fracture Mechanics. 2005. 72(6): 877-97.
[28] ASTME 647-00: Standard Test Method for Measurement of Fatigue Crack Growth
Rates. ASTM International. 2000
[29] Richard HA, Fulland M, Sander M. Theoretical crack path prediction. Fatigue &
Fracture of Engineering Materials & Structures. 2005; 28(1-2): 3-12.
[30] Evans AG. Strength of brittle materials containing second-phase dispersions.
Philosophical magazine.1972; 26(6): 1327-44.
[31] Clark JD, McGregor IJ, Ultimate Tensile Stress over a Zone: A New Failure Criterion
for Adhesive Joints. Journal of Adhesion. 1993; 42: 227-45.
[32] Sheppard A, Kelly D, Tong L. Damage zone model for the failure analysis of adhesively
bonded joints. International Journal of Adhesion & Adhesives. 1998; 18(6): 385-400.
[33] Nguyen KH, Kweon JH, Choi JH. Failure load prediction by damage zone method for
single-lap bonded joints of carbon composite and aluminum. Journal of Composite
Materials. 2009; 43(25): 3031-3056.
[34] Ji G, Ouyang Z, Li G. Effect of bondline thickness on mode II interfacial laws of bonded
laminated composite plate. International Journal of Fracture. 2011; 168(2): 197-207.

Appendix A. Modelling fibre-matrix debonding under biaxial loading
237
Appendix A
Modelling fibre-matrix debonding under biaxial
loading
A.1. Introduction
The static and fatigue behaviour of a multidirectional composite laminate made of
unidirectional (UD) plies is characterised by progressive damage accumulation in terms of
matrix cracks initiating in the off-axis layers [1-5]. It is therefore very important to provide
suitable criteria for the description of the off-axis behaviour of UD laminae. Reliable
predictive models of general validity should be based on the quantitative description of the
damage mechanisms occurring at the microscopic scale, which are responsible for the
initiation of off-axis macro-cracks. In particular, these mechanisms are the initiation and
propagation of matrix micro-cracks [5-7], as well as of fibre-matrix interface debonds. The
importance of the debonding mechanism, which is significantly influenced by fibre sizing, has
been widely documented in literature [8-10]. In [8,9] the authors found a strong dependence of
the transverse strength of the lamina on the fibre sizing. Hoecker et al. [10] reported the results
of static tests on UD carbon/epoxy laminae obtained with optimised, non-optimised and
minimised interfaces, and subjected to transverse tension and pure in-plane shear. As in [8,9],
they found a strong dependence of the transverse strength on the surface treatment, and a less
pronounced but still appreciable effect on the shear strength. These results prove that the
initiation and propagation of debonds, which are affected by the interface properties, are
fundamental mechanisms in the transverse and in-plane shear static failure process. For this
reason the debonding phenomenon has received significant attention from the scientific
community in the last decades, mainly focusing on the propagation of a crack already existing
at the fibre-matrix interface. In [11] the stress and displacement fields, as well as the Strain
Energy Release Rate (SERR or G), have been determined in closed form for a debond crack in
the case of a fibre embedded in an infinite plate subjected to remote tension. Chao and Huang
[12] provided, instead, the stress fields for a crack at the interface between a fibre and an
infinite matrix plate under a remote antiplane shear stress.

Appendix A. Modelling fibre-matrix debonding under biaxial loading
238
The expressions given in [11,12] are useful for analysing the circumferential and longitudinal
propagation of a debond crack at the interface. This kind of analysis was carried out in Refs.
[13,14] for transverse remote stress.
Using Toya's SERR based formulation [11] and the Stress Intensity Factor (SIF) approach
proposed by Rice [15] and Comninou [16], Paris and co-workers studied the propagation of a
debond crack, paying attention to the competition between interface crack propagation and
crack kinking into the matrix [17]. The same approach was also used to study the effect of
compressive stresses in Refs. [18,19].
Less attention, particularly in terms of modelling, has been dedicated to the initiation of a
debond crack at an undamaged fibre-matrix interface.
In Refs. [9,20] the authors described the static transverse lamina behaviour by means of the
Finite Element (FE) analysis of a fibre-matrix unit cell, where debonding was supposed to
initiate when the peak value of the radial stress at the interface reached a critical value, typical
of the bi-material system. In addition, De Kok and Peijs [9] modelled the interface by means
of spring elements the separation of which, simulating circumferential crack propagation,
occurred when an equivalent stress calculated from the radial and tangential shear stress
components reached the same critical value used to predict initiation. In [21] the off-axis
lamina behaviour was simulated by means of 3D FE analyses using a critical debonding
condition analogous to that adopted by De Kok and Peijs [9], including also the contribution
of longitudinal shear stress. Quadratic criteria were also used in Refs. [22] and [23], where
the fibre-matrix interface strength was measured by means of experimental tests on cruciform
shaped single-fibre specimens made of epoxy resin and SiC and glass fibres, respectively.
Tests were carried out with several off-axis angles between the fibre and the loading
directions, and failure envelopes were obtained on the radial-longitudinal shear stresses
plane. Finally, empirical quadratic expressions were obtained by fitting the experimental
results. Because of its phenomenological nature, the last mentioned approach cannot be
considered of general validity and, most important, a complete characterisation of the interface
strength under biaxial loading is always required, involving expensive experimental activity.
However, the main drawback of using a stress based criterion as proposed in [9,20-23] is that
the influence of the fibre radius, or equivalently the scale effect, cannot be described, because
the local stress field is independent from the absolute fibre dimensions.
Cohesive Zone Models (CZMs) were adopted by Chandra [24] to simulate the initiation and
propagation of debonds in a pull-out test configuration, and by Koyanagi and co-authors [25]
for debonding onset and propagation in the circumferential and longitudinal direction under
Appendix A. Modelling fibre-matrix debonding under biaxial loading
239
transverse remote stress. CZMs have the advantage that they consider a coupled stress and
energy criterion for element separation in the FE code, thus being sensitive to the fibre radius.
Another approach which involves a coupled stress and energy criterion is Finite Fracture
Mechanics (FFM), initially proposed by Leguillon in 2002 [26] and later applied in different
fields to predict the initiation of cracks in regions of stress concentrations, where classical
strength or fracture mechanics criteria fail. This approach was applied by Mantič and co-
authors for predicting debond initiation in the case of a fibre embedded in an infinite plate
subjected to remote uniaxial [27] and biaxial [28] transverse tension.
In this work the FFM approach is used as the basis to develop a model capable of predicting
debond initiation for a fibre embedded in an infinite plate subjected to combined remote
transverse and antiplane shear stresses.
This model can represent a useful tool for improving the understanding and quantitative
description of damage initiation in the off-axis laminae of a multidirectional laminate under
static remote tensile loading.
A.2. Finite Fracture Mechanics approach
In this section, the concepts at the basis of the FFM approach are briefly recalled, and adapted
to the case of interest. Differently from classical fracture mechanics, which considers
infinitesimal and self-similar increments of the length of an existing crack, the FFM approach
is based on the idea that the onset of a crack in a critical location (in correspondence to stress
concentration regions for example) occurs with a finite crack length l0. This length is, together
with the critical nominal stress for crack initiation ζn,c, an unknown of the problem. Leguillon
[26] proposed to calculate these two unknowns by solving simultaneously the following
system of equations, representing the stress and energy conditions required for the crack
initiation to occur.
σ σ , σn Rl (1.1)
Δ σ ,n cG l G (1.2)
Equation (1.1) represents the stress criterion, which states that the stress along the length of the
nucleated crack l has to be at least equal to the critical stress ζR of the material.
Equation (1.2) represents, instead, the energy criterion, which requires that the energy released
in the initiation process of a crack of finite length l divided by the cracked area ΔG be at least
Appendix A. Modelling fibre-matrix debonding under biaxial loading
240
equal to the critical value of the SERR Gc. The latter is a material property which could be
better interpreted as the specific energy necessary for the formation of new crack surfaces.
The simultaneous solution of equations (1.1) and (1.2) allows one to determine the value of the
critical remote stress ζn,c, and the finite length of the nucleated defect l0.
In the next sections, this approach is applied to the case of an isotropic fibre of infinite length
and radius Rf embedded in an infinite isotropic plate and subjected to remote combined
transverse stress ζ2 (=ζx) and out of plane shear stress ζ6 (=ζxz). This combination of stress
components is representative of the stress state in an off-axis unidirectional lamina under in-
plane loading; indeed the antiplane remote shear stress is named ζ6 to emphasise its
correspondence to the in-plane shear stress for a UD lamina.
Initially the fibre is supposed as being perfectly bonded to the surrounding plate (figure 1a),
and an arc crack of finite angle 2α0 is assumed to nucleate at the interface in correspondence to
the critical values of the remote stresses ζ2,c and ζ6,c (figure 1b).
Figure 1: Fibre embedded in an infinite plate with a) pristine and b) partially debonded
interface
In order to solve the governing system, the interface stresses and the relative crack face
displacements have to be calculated for the uncracked and cracked conditions respectively,
both under pure transverse and antiplane shear stress. In addition, the material properties Gc
and ζR have to be known. The latter should be ideally measured by a tensile test of the bi-
material system in a condition where the stress criterion holds, i.e. testing specimens that are
large enough, as discussed later on in section A.7. From this point of view the test method
proposed in Ref. [29] could be a useful tool for measuring the bi-material interface strength
under normal and shear stress. The critical SERR Gc can instead be obtained by analysing the
mode I propagation of a crack at the considered bi-material interface.
ζ6 (= ζxz) x
y
z
r θ
ζ2 (= ζx)
Rf
a)
ζ6,c x
y
z
2α0
b)
ζ2,c
Appendix A. Modelling fibre-matrix debonding under biaxial loading
241
A.3. Stress fields for the uncracked case
In this section the interface stress fields for the pre-debonding condition are provided, because
necessary for solving equations (1.1) and (1.2). In the following, subscripts 1 and 2 refer to
the fibre and the matrix respectively.
A.3.1 Remote transverse stress
The complete stress fields for the plane strain problem of an isotropic cylindrical inclusion
embedded in an infinite plate under tension were obtained by Goodier [30]. That formulation
is used in the present work for calculating the interface stress fields in the case of a fibre in an
infinite resin plate. Though all the stress components in cylindrical coordinates, ζr, ζθ, ζz, and
ηrθ, are non zero at the fibre-matrix interface, only the radial and tangential shear components
are responsible for the onset of a debond crack. At the fibre-matrix interface, r = Rf, these
stresses can be written as:
2 1 2
1 2 1 2 1 2
2υ1σ σ μ 1 κ
4μ 2μ κ 1 2 κ μ μr
Cos
(2)
1 2
θ 2
2 1 2
μ 1 κτ σ 2υ
2 κ μ μr Sin
(3)
where θ is the polar angle shown in figure 1a), μi is the shear modulus κi = 3 - 4νi, with νi
being Poisson's ratio of the material. Equations (2) and (3) are plotted in figure 2, for the
glass/epoxy material properties adopted in [23] and listed in Table 1. The angle θ0 is defined
as the angular coordinate where the radial stress vanishes (ζr(θ0) = 0), and it is about 66° for
the material system under investigation.
Table 1: Elastic properties for glass and epoxy [23]
Material E [MPa] ν
Glass 72000 0.22
Epoxy 4280 0.42
Appendix A. Modelling fibre-matrix debonding under biaxial loading
242
Figure 2: Interface stress fields for glass/epoxy system under remote transverse stress ζ2 = 1
MPa (elastic properties from [23])
It is evident that the interface is subjected to a biaxial stress state even if the applied remote
load is purely uniaxial. Mantič, [27], considers only the radial component ζr in the stress
criterion, neglecting a possible contribution of shear stress to the interface failure. In this
work the shear contribution is included and the stress criterion is written in terms of an
equivalent stress ζeq, to be compared with the bi-material interface strength ζR. A possible
expression for ζeq is given in equation (4).
2 2
1 υσ σ τeq r rc (4)
Equation (4) is mathematically similar to those proposed in Refs. [9, 21-23], but it is important
to highlight that its physical meaning is different. In fact in [9, 21-23] the quadratic expression
is used to describe the interface failure locus of a particular fibre-matrix interface. In the
present work, instead, it is used to describe the strength of the bi-material system, which can
be different from that of the fibre-matrix interface (the latter depending also on the energy
criterion, according to the FFM approach). Conversely, it can be said that the meaning of
equation (4), from a physical point of view, is similar to that assumed by the quadratic
expression used in the CZMs in Refs. [24,25]. In equation (4), c1 is a constant that is equal to
the square of the ratio between the normal and shear interface strengths. De Kok and Peijs [9]
modelled the interface using springs to simulate the chemical links between fibre and matrix,
and obtained a values for c1 close to 3. The analysis of SiC/Ti and glass/epoxy systems [24,25]
proved, instead, that a value of c1 around unity provides good results if the stress criterion is
-1
-0.5
0
0.5
1
1.5
2
0 15 30 45 60 75 90
Str
ess
[MP
a]
θ [°]
ζr
μ1 = 29508 MPaκ1 = 2.12
μ2 = 1507 MPa
κ2 = 1.32ζ2 = 1 MPa
ηrθ
θ0
Appendix A. Modelling fibre-matrix debonding under biaxial loading
243
coupled with an energy criterion by means of a CZM. A value close to 1 has been
experimentally found in [29] for an aluminium/epoxy system. However the value of this
constant is still an open problem. The equivalent stress, as given by equation (4), is plotted in
figure 3 versus θ for a typical glass/epoxy system and for different values of parameter c1.
Values of θ from θ0 (66°) to 90° are not considered in figure 3 since the radial stress is
compressive in that range of angles.
Figure 3: Equivalent stress trends for different values of c1 (material properties are the same as
those in figure 2)
A.3.2 Remote antiplane shear
Let us consider an isotropic fibre within an infinite plate under antiplane shear ζ6. The
complete stress fields can be easily calculated by solving the equilibrium equation written in
terms of the displacement w in the z -direction:
2
2 2
1 10
υ
w wr
r r r r
(5)
and further accounting for the displacement-stresses relationships:
,τ μ ,irz i i
w
r
υ ,τ μ
υ
iz i i
w
r
(6)
0.0
0.2
0.4
0.6
0.8
1.0
1.2
1.4
1.6
1.8
0 10 20 30 40 50 60 70
ζeq
[MP
a]
θ [°]
c1 = 0
c1 = 1
c1 = 2c1 = 3
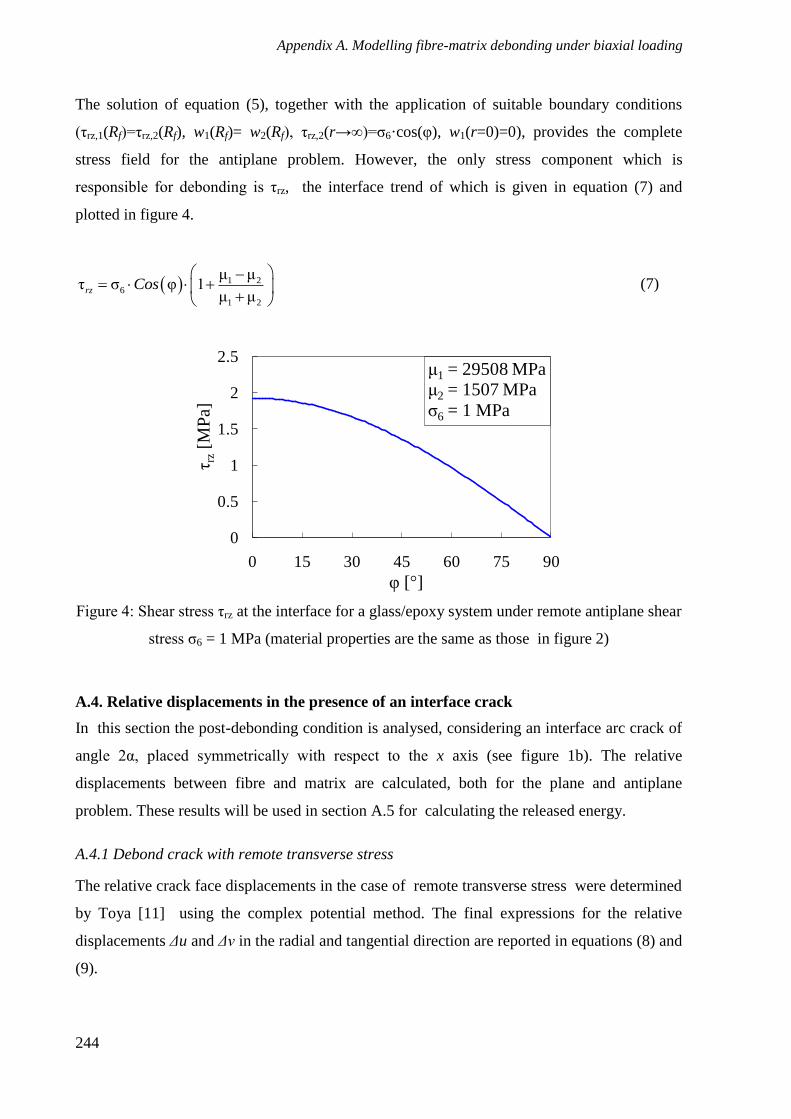
Appendix A. Modelling fibre-matrix debonding under biaxial loading
244
The solution of equation (5), together with the application of suitable boundary conditions
(ηrz,1(Rf)=ηrz,2(Rf), w1(Rf)= w2(Rf), ηrz,2(r→∞)=ζ6·cos(θ), w1(r=0)=0), provides the complete
stress field for the antiplane problem. However, the only stress component which is
responsible for debonding is ηrz, the interface trend of which is given in equation (7) and
plotted in figure 4.
1 26
1 2
μ μτ σ υ 1
μ μrz Cos
(7)
Figure 4: Shear stress ηrz at the interface for a glass/epoxy system under remote antiplane shear
stress ζ6 = 1 MPa (material properties are the same as those in figure 2)
A.4. Relative displacements in the presence of an interface crack
In this section the post-debonding condition is analysed, considering an interface arc crack of
angle 2α, placed symmetrically with respect to the x axis (see figure 1b). The relative
displacements between fibre and matrix are calculated, both for the plane and antiplane
problem. These results will be used in section A.5 for calculating the released energy.
A.4.1 Debond crack with remote transverse stress
The relative crack face displacements in the case of remote transverse stress were determined
by Toya [11] using the complex potential method. The final expressions for the relative
displacements Δu and Δv in the radial and tangential direction are reported in equations (8) and
(9).
0
0.5
1
1.5
2
2.5
0 15 30 45 60 75 90
η rz
[MP
a]
θ [°]
μ1 = 29508 MPaμ2 = 1507 MPa
ζ6 = 1 MPa
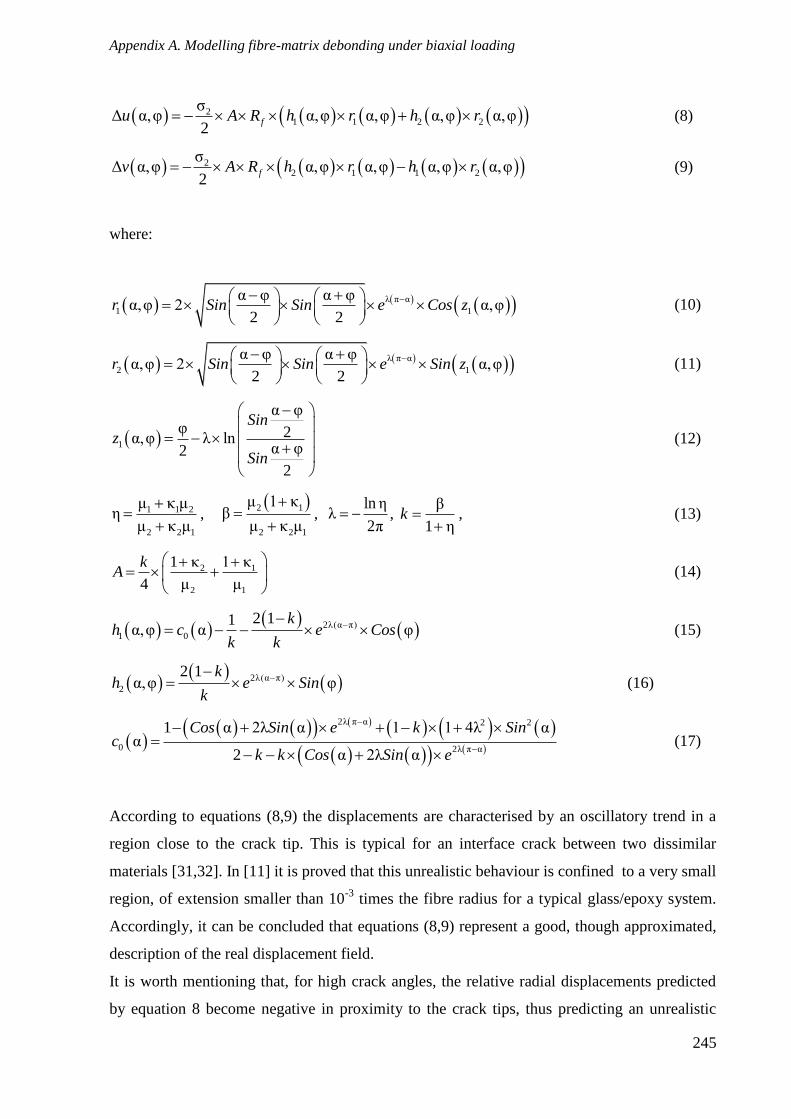
Appendix A. Modelling fibre-matrix debonding under biaxial loading
245
21 1 2 2
σΔ α,υ α,υ α,υ α,υ α,υ
2fu A R h r h r (8)
22 1 1 2
σΔ α,υ α,υ α,υ α,υ α,υ
2fv A R h r h r (9)
where:
λ π α
1 1
α υ α υα,υ 2 α,υ
2 2r Sin Sin e Cos z
(10)
λ π α
2 1
α υ α υα,υ 2 α,υ
2 2r Sin Sin e Sin z
(11)
1
α υυ 2α,υ λ ln
α υ2
2
Sin
z
Sin
(12)
1 1 2
2 2 1
μ κ μη
μ κ μ
,
2 1
2 2 1
μ 1 κβ
μ κ μ
,
ln ηλ
2π ,
β
1 ηk
, (13)
2 1
2 1
1 κ 1 κ
4 μ μ
kA
(14)
2λ(α π)
1 0
2 11α,υ α υ
kh c e Cos
k k
(15)
2λ(α π)
2
2 1α,υ υ
kh e Sin
k
(16)
2λ π α 2 2
0 2λ π α
1 α 2λ α 1 1 4λ αα
2 α 2λ α
Cos Sin e k Sinc
k k Cos Sin e
(17)
According to equations (8,9) the displacements are characterised by an oscillatory trend in a
region close to the crack tip. This is typical for an interface crack between two dissimilar
materials [31,32]. In [11] it is proved that this unrealistic behaviour is confined to a very small
region, of extension smaller than 10-3
times the fibre radius for a typical glass/epoxy system.
Accordingly, it can be concluded that equations (8,9) represent a good, though approximated,
description of the real displacement field.
It is worth mentioning that, for high crack angles, the relative radial displacements predicted
by equation 8 become negative in proximity to the crack tips, thus predicting an unrealistic

Appendix A. Modelling fibre-matrix debonding under biaxial loading
246
interpenetration between the two phases. As a consequence, equations (8,9) can be considered
valid until the interpenetration zone remains very limited. In the present work, the maximum
allowable extension of this region is set as equal to 1°, corresponding to a length of
approximately 10-4
mm for a typical glass fibre. Equations (8,9) can therefore be used for
crack angles lower than a limit value 2αℓ which is found to be equal to about 140 degrees for a
typical glass/epoxy system. An exact description of the displacement field should consider the
contact between fibre and matrix, but in the present work this aspect is not treated, because
not restrictive for the model developed. The limit angle αℓ (70°) is, in fact, greater than θ0
(66°), angle at which the interface radial stress goes to zero and then becomes negative. The
influence of a compressive radial contribution on the debond initiation is not treated in this
work and therefore the actual limit angle for the applicability of the present model is equal to
θ0 < αℓ.
A.4.2 Debond crack with remote antiplane shear stress
The antiplane problem of a crack at the fibre-matrix interface was studied by Chao and Huang
[12], using the complex potentials method. The interface stresses were explicitly obtained in
[12], while the relative displacements Δw in z direction (see figure 1) are calculated here.
The stress components can be written as
τ μ ,yz
w
y
τ μxz
w
x
(18)
and therefore the following expression holds valid
τ τ μ μ Φxz yz
w wi i Z
x y
(19)
where Z = x + iy = reiφ
, and Φ Z is a complex function. Equation (19) can be rewritten in
polar coordinates:
υ
υτ τ μ μ Φυ
i
rz z
w wi i Z e
r r
(20)

Appendix A. Modelling fibre-matrix debonding under biaxial loading
247
Chao and Huang suggested the following expressions for Φ(Z):
61 2 22
1 2
ασ 1 1 1Φ α 1
μ μ 2 α 1
CosZ Z Cos
Z Z ZZ Z Cos
(21)
6 12 2 22
1 2 2
ασ μ 1 1 1Φ α 1
μ μ μ 2 α 1
CosZ Z Cos
Z Z ZZ Z Cos
(22)
Equations (21) and (22) have been obtained for a fibre radius Rf = 1. As we are interested in
the relative displacements at the interface, the complex variable Z has to be substituted with
eiφ
.
According to equation (20) the shear stress ηθz at the interface can be written as:
υ υ
υ ,τ ,υ μ μ Im Φυ
i iiz i f i i i
f
wR e e
R
(23)
therefore the derivative with respect to θ of the relative displacements can be written as
2 1 υ υ υ υ
1 2Im Φ Im Φυ
i i i i
f
w wR e e e e
1 2
6
2 2 1
υ 3υα
μ 2μ 2 2σ 2
2μ μ μ υ αf
Cos Sin Sin
RCos Cos
(24)
Integrating equation (24) with respect to θ, the relative displacement field results:
1 26
2 2 1
μ 2μ υΔ α,υ σ 2 υ α
μ μ μ 2fw R Cos Cos Cos
(25)
A.5. Calculation of the released energy
Once the interface stresses and the relative displacements are known for the pre and post-
debonding conditions respectively, the energy released during the initiation process ΔU can be
calculated as follows.

Appendix A. Modelling fibre-matrix debonding under biaxial loading
248
α
α
1Δ σ Δ υ
2I f rU R u d
(26)
α
υα
1Δ τ Δ υ
2II f rU R v d
(27)
α
α
1Δ τ Δ υ
2III f rzU R w d
(28)
The subscripts I, II and III mean that the three contributions are related to mode I, mode II and
mode III loading respectively. Thanks to the solutions given in sections A.3 and A.4, the
energy contributions can be written as functions of the crack angle:
2 2
2 1Δ α σ Ω αI f pU R I (29)
2 2
2 2Δ α σ Ω αII f pU R I (30)
2 2
6 3Δ α σ Ω αIII f aU R I (31)
where Ωp and Ωa are non-dimensional parameters defined as
1 2
1Ω μ 1 κ
2p A ,
1 1 2
2 1 2
μ μ 2μΩ 2 2
μ μ μa
(32)
and
α
1 1 1 2 2
2 1 2 1 2 1
2υ 1α α,υ α,υ α,υ α,υ υ
2 κ μ μ 4μ 2μ κ 1o
CosI h r h r d
(33)
α
2 2 1 1 2
2 1 2
1α α,υ α,υ α,υ α,υ 2υ υ
2 κ μ μ o
I h r h r Sin d
(34)
α
3 01 2
1 2
1 υα υ υ α υ
μ μ 2
2π1 α α 3
16 μ μ
I Cos Cos Cos Cos d
Cos Cos
(35)
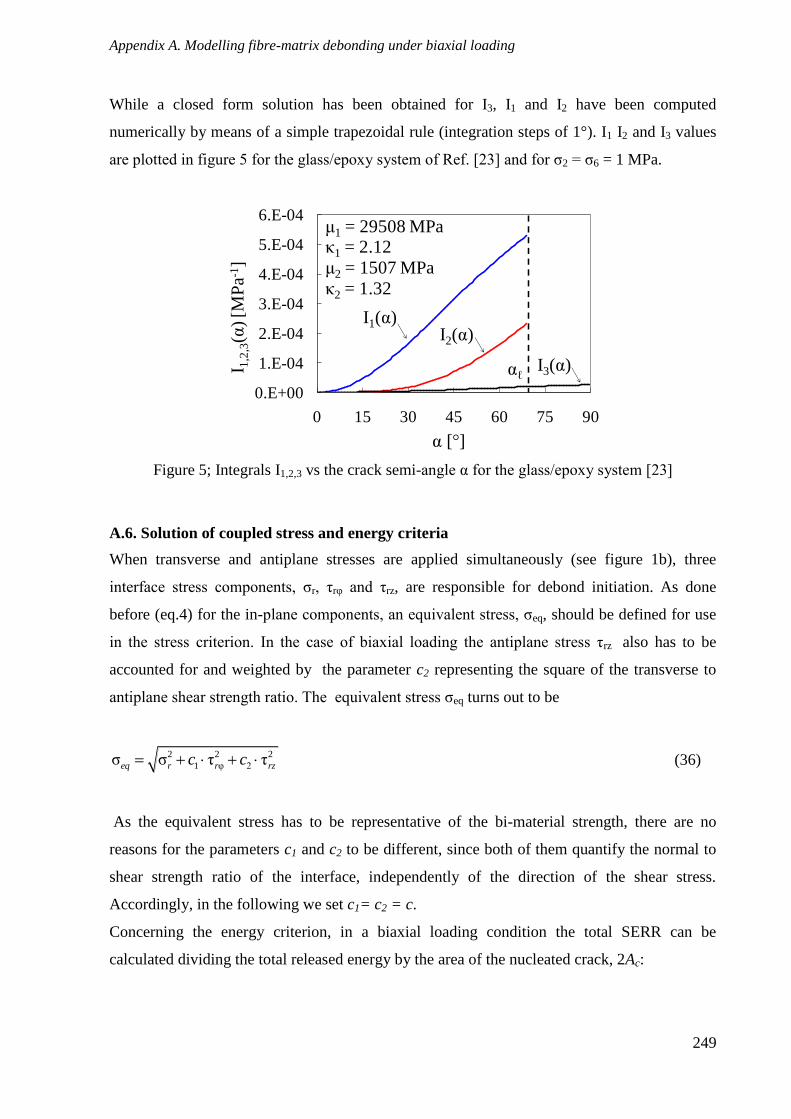
Appendix A. Modelling fibre-matrix debonding under biaxial loading
249
While a closed form solution has been obtained for I3, I1 and I2 have been computed
numerically by means of a simple trapezoidal rule (integration steps of 1°). I1 I2 and I3 values
are plotted in figure 5 for the glass/epoxy system of Ref. [23] and for ζ2 = ζ6 = 1 MPa.
Figure 5; Integrals I1,2,3 vs the crack semi-angle α for the glass/epoxy system [23]
A.6. Solution of coupled stress and energy criteria
When transverse and antiplane stresses are applied simultaneously (see figure 1b), three
interface stress components, ζr, ηrθ and ηrz, are responsible for debond initiation. As done
before (eq.4) for the in-plane components, an equivalent stress, ζeq, should be defined for use
in the stress criterion. In the case of biaxial loading the antiplane stress ηrz also has to be
accounted for and weighted by the parameter c2 representing the square of the transverse to
antiplane shear strength ratio. The equivalent stress ζeq turns out to be
2 2 2
1 υ 2σ σ τ τeq r r rzc c (36)
As the equivalent stress has to be representative of the bi-material strength, there are no
reasons for the parameters c1 and c2 to be different, since both of them quantify the normal to
shear strength ratio of the interface, independently of the direction of the shear stress.
Accordingly, in the following we set c1= c2 = c.
Concerning the energy criterion, in a biaxial loading condition the total SERR can be
calculated dividing the total released energy by the area of the nucleated crack, 2Ac:
0.E+00
1.E-04
2.E-04
3.E-04
4.E-04
5.E-04
6.E-04
0 15 30 45 60 75 90
I 1,2
,3(α
) [M
Pa-1
]
α [°]
αℓ
μ1 = 29508 MPaκ1 = 2.12
μ2 = 1507 MPa
κ2 = 1.32
I1(α)I2(α)
I3(α)
Appendix A. Modelling fibre-matrix debonding under biaxial loading
250
Δ Δ Δ ΔΔ
2 2α
tot I II III
c f
U U U UG
A R
(37)
Therefore the energy criterion, equation (1.2), can be explicitly rewritten as follows:
Δ 2αtot f cU R G (38)
It is clear that the released energy is the sum of the contributions due to mode I, II and III
loadings, so it is worth spending some words on the value of the critical SERR, Gc.
In the case of uniaxial transverse stress, which results in a mixed mode I + II loading
condition, Mantič [27] proposed to calculate Gc as the following averaged value:
0α
00
1Ψ α α
αc cG G d (39)
where Ψ(α) is the square root of the ratio between the mode II and mode I contributions (
Ψ α α αII IG G ), and an increasing function of the crack semi-angle α [17]. Cracks at
bi-material interfaces are usually characterised by an increasing trend of the critical SERR
while increasing the mode II contribution, (i.e. increasing Ψ). A phenomenological law for
Gc(Ψ) was proposed by Hutchinson and Suo [33]. This formulation has been used by Mantič
[27] to compute the critical SERR, to be used in equation (39), corresponding to values of α
ranging from 0 to α0.
The typical increasing trend of the function Gc(Ψ) is usually due to a more pronounced crack
tip plastic deformation as the mode II contribution increases [34], or to a change of the damage
mechanism [35-37]. In the case of interest for the present work none of the above-mentioned
phenomena are expected to occur. It is in fact, reasonable to assume that the matrix does not
undergo any plastic deformation before debond initiation. This is confirmed by the
experimental results obtained in Refs. [22,23,25], where the critical debond stresses have been
found to be much lower than the typical yielding stress for epoxy resins. In addition, since the
interface is undamaged in the pre-debonding condition, there are no singularities which could
be responsible for localised plasticity, which instead occurs near the tips of an already existing
crack. Concerning the change in the damage mechanism (i.e. cracks in the matrix and not at

Appendix A. Modelling fibre-matrix debonding under biaxial loading
251
the interface), this aspect is not within the scope of the present work, which instead focuses on
the initiation of interface debond cracks.
According to these observations, it can be reasonably assumed here that the value of Gc to be
used for the present analysis does not change with the mode ratio. This choice is also
supported by the fact that, according to the FFM concept, a finite crack of angle 2α0 is
supposed to nucleate suddenly and therefore its tips are never subjected to mixed mode
conditions related to crack angles lower than 2α0. In the author's opinion, therefore, the value
of the critical SERR should be kept constant and not be averaged over the crack length, as in
equation (39). It is once again remarked that, in the frame of the FFM approach, Gc can be
thought of as a specific surface energy that does not depend on the loading mode (I, II or III),
and is, for this reason, constant.
After defining a biaxiality ratio λ12 as the ratio between the remote antiplane shear and
transverse stresses (i.e. λ12=ζ6/ζ2) [37,38], the governing system of two equations,
representing the stress and energy criteria, can be explicitly written as follows.
2 2 2 2
2 θ 2 12 2σ σ ,α τ σ ,α τ λ σ ,α σr r rz Rc (40.1)
2 2
2 1 2 12 3σ Ω α α λ Ω α 2αf p a cR I I I G (40.2)
In equation (40.1) it is emphasised that the local stresses at the interface are functions of the
angle α, the remote stress ζ2, which are unknown variables, and the biaxiality ratio λ12.
As α is involved in complicated expressions within the integrals I1,2,3(α), a closed form
solution for the system is not possible, however the value of ζ2,s and ζ2,e satisfying the stress
and energy criteria respectively can be calculated as a function of the crack angle α from
equations (40.1) and (40.2):
2,2 2 2 2
θ 12
σσ α
(α) (α) λ (α)
Rs
rr r rzk c k k
(41.1)
2, 2
1 2 12 3
2ασ α
Ω α α λ Ω α
ce
f p a
G
R I I I
(41.2)

Appendix A. Modelling fibre-matrix debonding under biaxial loading
252
The terms kij(α) in equation (41.1) are the interface stress concentration factors at the angle
θ=α with respect to the x-axis, and they can be easily obtained by dividing equations (2), (3)
and (7) by the remote stresses ζ2 and ζ6.
1 2
1 2 1 2 1 2
2α1α μ 1 κ
4μ 2μ κ 1 2 κ μ μrr
Cosk
(42)
1 2
θ
2 1 2
μ 1 κα 2α
2 κ μ μrk Sin
(43)
1 2
1 2
μ μα α 1
μ μrzk Cos
(44)
The initial angle α0 can be computed equating equations (41.1) and (41.2), resulting in
equation (45) to be solved numerically for α0.
2
1 0 2 0 12 3 0
0
22 2 2 2
0 θ 0 12 0
1Ω α α λ Ω α
2α 1
σ(α ) (α ) λ (α )
p a
c
f Rrr r rz
I I IG
Rk c k k
(45)
Once the initial angle has been calculated, the critical remote transverse stress can be easily
computed by substituting α0 in equation (41.1) or (41.2).
Thus, the solution depends on the fibre radius Rf, on the interface toughness Gc and strength
ζR, as well as on the biaxiality ratio λ12.
The effects of these parameters and the role of the constant c are discussed in section A.7.
A.7. Parametric analysis and discussion
It is first interesting to discuss the influence of the fibre radius Rf on the critical debonding
stress computed with the procedure described in section A.6.
Initially, the case of the shear strength ratio c = 0 is considered. In this condition a pure
antiplane shear stress cannot be responsible for debond initiation.
In figure 6 the critical remote transverse stress is plotted versus the fibre radius in double
logarithmic scales for c = 0. The critical SERR is chosen as Gc = 2J/m2, in agreement with
findings reported by Varna and co-authors [14], while the interface strength is arbitrarily
chosen as equal to 50 MPa. It is clear that for small enough values of Rf , the critical stress for

Appendix A. Modelling fibre-matrix debonding under biaxial loading
253
debond initiation is strongly dependent on the fibre radius, because proportional to 1/Rf0.5
. It
can be easily observed, from equation (41.2), that this dependence is provided by the
application of the energy criterion. In fact, for Rf tending to zero, the solution of the system of
equations (40.1) and (40.2) tends towards that of the energy criterion only.
Differently, if Rf is sufficiently high, the solution is almost insensitive to the fibre radius and
ζ2,c converges to that computed by the stress criterion only (equation (41.1)). This explains
why, as anticipated in section A.2, testing large enough specimens allows one to determine the
strength, ζR, of the bi-material system to be used in the stress criterion.
The detrimental effect of an increasing shear contribution, i.e. increasing λ12, can be observed
when Rf is low enough, whereas for high values of Rf the critical stress tends towards a
constant value independently from the amount of shear stress. In fact, as c = 0, the shear
stress has no effect on the result computed with the stress criterion, as can be derived from
equation (41.1).
Figure 6: Critical remote transverse stress versus fibre radius for a glass/epoxy system, c = 0
Similar conclusions can be drawn when the shear strength ratio c is equal to unity, with the
relevant critical stress trends presented in figure 7. In this case, however, the shear
contribution is accounted for and the stress criterion, equation (41.1), provides different
asymptotic values for the critical transverse stress, depending on the biaxiality ratio.
10
100
1000
1.E-05 1.E-04 1.E-03 1.E-02 1.E-01
ζ2
,c[M
Pa]
Rf [mm]
λ12 = 0 Gc = 2 J/m2
ζR = 50 MPa
stress criterion
λ12 = 2
λ12 = 1
c = 0
slope -0.5
Appendix A. Modelling fibre-matrix debonding under biaxial loading
254
Figure 7: Critical remote transverse stress versus fibre radius for a glass/epoxy system, c = 1
These conclusions hold valid for the particular bi-material system the properties of which (Gc
and ζR) are listed in figures 6 and 7. For a deeper investigation, it is helpful to define a new
interface parameter, Γ, which accounts for the simultaneous influence of the fibre radius as
well as of the interface properties Gc and ζR.
2
1Γ
σ
c
f R
G
R (46)
The dimension of Γ is MPa-1
when Rf, Gc and ζR are expressed in mm, kJ/m2 and MPa
respectively.
If, for brevity, the left-hand side of equation (45) is referred to as the function F(α0), equation
(45) can be synthetically written as F(α0) = Γ. The initial angle α0 therefore depends only and
directly on the interface parameter Γ.
For a better understanding of the influence of the interface parameter on the critical transverse
stress, it is interesting to investigate the two extreme conditions, when Γ tends towards zero or
to high values (∞). The limit behaviour Γ→0 occurs for high values of Rf or low values of the
Gc to ζR2 ratio. In critical conditions F(α0) has to tend to zero as well. To conveniently analyse
the problem from a mathematical point of view, it is useful to treat α0 as the independent
variable and study F(α0) as a function of the initial angle. By doing so, it is proved in
Appendix A.A that when α0 approaches zero, F(α0) goes to zero as well. This means that when
Γ→0, the initial debonding angle α0 tends towards zero, independently of λ12. This is
10
100
1.E-03 1.E-02 1.E-01
ζ2
,c[M
Pa]
Rf [mm]
λ12 = 0Gc = 2 J/m2
ζR = 50 MPa
stress criterion
λ12 = 2
λ12 = 1
c = 1

Appendix A. Modelling fibre-matrix debonding under biaxial loading
255
confirmed in figure 8, where the initial angle, computed solving the coupled stress and energy
criteria, is plotted against the parameter Γ (for c = 0).
Figure 8: Initial crack angle versus Γ for a glass/epoxy system and c = 0
For debonding to occur in the other limit case, i.e. Γ→∞, F(α0) must tend towards infinity as
well, which implies that the denominator of F(α0) tends towards zero. This happens, if c = 0,
when α0 = θ0, resulting in a vanishing interface radial stress. This means that for very low
values of Rf or very high values of the Gc to ζR2 ratio, the initial angle α0 approaches a constant
value equal to θ0, independently of λ12. This is clearly shown in figure 8. It can also be seen
that asymptotic behaviour has already been reached for Γ > 0.1 MPa-1
.
Figure 9: Critical remote transverse stress versus Γ for a glass/epoxy system and c = 0
0.01
0.1
1
10
1.E-06 1.E-05 1.E-04 1.E-03 1.E-02 1.E-01
α0
[°]
Γ [MPa-1]
λ12 = 0
λ12 = 2
λ12 = 1
c = 0 θ0
100
10
100
1000
1.E-06 1.E-05 1.E-04 1.E-03 1.E-02 1.E-01
ζ2
,c[M
Pa]
Γ [MPa-1]
λ12 = 0
stress criterion
λ12 = 2
λ12 = 1
c = 0ζR = 50 MPa λ12 = 0
stress criterion
λ12 = 2
λ12 = 1
c = 0ζR = 50 MPa
slope 0.5

Appendix A. Modelling fibre-matrix debonding under biaxial loading
256
These observations have two important consequences in the computation of the critical remote
transverse stress ζ2,c, plotted in figure 9 against the parameter Γ. When the initial angle tends
towards the constant value θ0 (for Γ→∞), it is no longer a variable of the problem, which can
therefore be solved by applying the energy criterion only, providing for ζ2,c a trend
proportional to the square root of Γ (right-hand side of the diagram). In fact, the critical remote
stress, plotted in double logarithmic scales versus Γ, exhibits an almost linear trend with slope
0,5 for Γ tending towards infinity (here Γ > 0.1 MPa-1
). This means that the asymptotic trend
to the solution given by the energy criterion is achieved not only for fibres with very limited
radius, as highlighted in figure 6, but also for very high values of the Gc to ζR2 ratio.
Conversely, if Γ approaches 0, and with α0 also tending towards 0, the FFM approach turns
out in the application of a point criterion. In fact the critical stress tends towards a constant
value which corresponds to that calculated with the stress criterion, equation (41.1), setting α =
0. This behaviour is therefore achieved for high values of the fibre radius as well as for very
low values of the Gc to ζR2 ratio.
Figure 10: Initial crack angle versus Γ for a glass/epoxy system and c = 1
The case c = 1 is now considered. The same conclusions drawn in appendix A.A remain valid
for the behaviour of F(α0) with α0 tending towards 0, therefore it is confirmed that α0 goes to
zero as Γ approaches 0, also when c = 1 (see figure 10). As already mentioned, the condition
Γ→∞ is encountered when the denominator of F(α0) vanishes, but this is never verified if c ≠
0. However, the analysis should be limited at α0 = θ0, since after that value the radial stress is
compressive and its influence is not included in the present analysis. Thus if c ≠ 0, only
fibre/matrix systems with a maximum value of Γ (Γ0 = F(θ0)) can be analysed with the present
0.01
0.1
1
10
1.E-07 1.E-06 1.E-05 1.E-04 1.E-03 1.E-02
α0
[°]
Γ [MPa-1]
λ12 = 0
λ12 = 2
λ12 = 1
c = 1
Γ0

Appendix A. Modelling fibre-matrix debonding under biaxial loading
257
approach. F(θ0) is a decreasing function of the biaxiality ratio, and its lowest value is achieved
for λ12 equal to ∞ (pure shear stress condition), which can be easily obtained from equation
(45):
12
3 0
0 0λ
0 0
Ω υΓ lim υ
2υ υ
a
rz
IF
c k
. (47)
For the considered material properties, when c = 1 Γ0 is equal to 6.2·10-4
MPa-1
.
The influence of Γ values lower than Γ0 on the remote critical stress is eventually shown in
figure 11. In this case the asymptotic behaviour for Γ→0 results in different values of the
remote stress obtained by means of the stress criterion represented by equation (41.1).
Figure 11: Critical remote transverse stress versus Γ for a glass/epoxy system and c = 1
A.8. Validation
In this section the approach proposed in the present work is validated by the experimental
results reported by Ogihara and Koyanagi [23], for a glass/epoxy system. As the specimen
width is sufficiently higher than the fibre diameter (2Rf = 0.017 mm), the interface stress field
can be considered comparable to that occuring in a fibre embedded in an infinite plate, as
given in section A.3. In addition, the specimens have been cured at room temperature so that
no thermal stresses have to be considered in the analysis. The experimental results from [23]
are plotted as symbols in figure 12, in terms of local stresses at the interface for θ = 0. In order
to apply the proposed model, ζR and Gc have to be known, but unfortunately their values are
not reported in [23]. In order to estimate Gc, the radial critical stress obtained in [23] is
10
100
1.E-06 1.E-05 1.E-04 1.E-03 1.E-02
ζ2
,c[M
Pa]
Γ [MPa-1]
λ12 = 0
stress criterion
λ12 = 2
λ12 = 1
c = 1ζR = 50 MPa
Γ0
Appendix A. Modelling fibre-matrix debonding under biaxial loading
258
compared with the results reported in [13], where the authors tested single fibre specimens
made of epoxy resin and a 0.017 mm diameter glass fibre, previously fragmented with a
longitudinal tension test. Two surface treatments have been adopted, with and without an
aminosilane and methacrylate coupling agent, identified as NOCA and CA, respectively [13],
providing different values of the remote critical stress, equal to 33 and 72 MPa respectively.
The corresponding local radial stresses (at θ = 0) can be calculated by multiplying these values
by the factor kr(0), equal to 1.42 for the material system adopted in [13], resulting in critical
radial stresses of 47 and 102 MPa. The values of GIc were also estimated by Varna et al. [14]
as being equal to 2 J/m2 and 10 J/m
2 for NOCA and CA surface treatments respectively. It is
worth noting that the local critical radial stress obtained in [23] is significantly lower than that
reported in [13,14] for NOCA treated specimens, suggesting that Gc for the bi-material system
used in [23] could reasonably be lower than 2 J/m2. A value of 0.75 J/m
2 is chosen in this
work on the basis of these observations. Finally, the value of ζR is calculated in order to fit the
experimental result obtained for the pure transverse stress loading condition with the model
prediction.
Figure 12: Comparison between model predictions and experimental data from [23]
Two values of the parameter c are used, in order to clarify its influence. First, c is chosen equal
to 1, according to [24,25] where the stress criterion has been used within a CZM. A value
close to 1 has also been experimentally found in [29] for an aluminium/epoxy system with an
innovative and effective experimental device.
When c = 1, the value of ζR, estimated by matching the result for the pure transverse stress
condition, is equal to 18 MPa. It is evident that the model prediction is in satisfactory
0
10
20
30
40
50
0 10 20 30 40 50
η rz
[MP
a]
ζr [MPa]
experimental data [23]
c = 0
c = 1
ζR(c=0)
Rf = 8.5μmGc = 0.75 J/m2
Appendix A. Modelling fibre-matrix debonding under biaxial loading
259
agreement with the average trend of the experimental results for multiaxial stress states (see
figure 12). It is also worth noting that in this case Γ is equal to 2.7·10-4
MPa-1
, lower than the
value Γ0 = 6.2·10-4
MPa-1
calculated in section A.7, the validity limit of our approach.
If, instead, c is set equal to zero, ζR is equal to 7,5 MPa, and the agreement with the
experimental results is satisfactory as well. In fact, in the investigated range of multiaxial
conditions, the difference between the model predictions for c = 0 and 1 is not significant, if
compared to the large scatter of data. It is therefore difficult to state which is the most suitable
choice for parameter c. The two curves start diverging significantly for higher contributions of
antiplane shear stress. In fact, in the case of c = 0, the local value of the critical shear stress
tends towards infinity as ζr approaches ζR, suggesting that a pure shear loading condition can
never induce debond initiation.
Since the value of Gc is not measured but is assumed on the basis of the comparison with
results from Ref. [13,14], a sensitivity analysis is carried out. Independently of the choice of
ζR, values of Gc higher than 0.8 J/m2 can never provide a solution for pure transverse stress
loading which fits the experimental value shown in figure 12, respecting the condition α0 < θ0
(Γ < Γ0). On the other hand, when c = 1, decreasing the value of Gc, and recalculating ζR as
already described turns out in slightly lower predictions as the antiplane shear contribution
increases. For instance, if Gc is decreased by 50% with respect to the previous value of 0.75
J/m2, the maximum difference is achieved for the pure antiplane shear condition, and it is
equal to -8% for the critical ηrz.
When c = 0 instead, and if Gc is decreased by 50%, ζR results equal to 24 MPa, providing
asymptotic behaviour as ζr approaches 24 MPa, which is in disagreement with the
experimental data.
Experimental results on cruciform single-fibre-specimens were also conducted by Tandon
and co-authors [22] for uncoated SiC fibres SCS-0. In this case, by measuring the longitudinal
debond propagation, the authors calculated a critical interface SERR, Gc, of approximately 25
J/m2, which is larger than the value assumed for the glass/epoxy system [23]. Using this value
of Gc and calibrating ζR with the pure transverse stress condition, the present model provides
overestimated predictions (up to +45%) of the critical debond stresses under biaxial loading.
It is important however to mention that the interface stresses along the fibre length for the
specimens tested in [22] undergo steep variations even across the specimen centre-line (see
figure 25 of Ref.[22]). In addition, the specimen thickness is only 6.4 times the fibre diameter,
which is not enough to consider this case as equivalent to that of a fibre in an infinite matrix
plate. In view of these conditions, the proposed model, which holds valid for an infinite plate

Appendix A. Modelling fibre-matrix debonding under biaxial loading
260
and for uniform stress fields in the longitudinal direction, should not be expected to fit the
results obtained in [22].
The satisfactory agreement with experimental results for the glass/epoxy system of Ref.[23]
suggests that this approach is suitable for describing debonding initiation under static biaxial
loading as representative of the off-axis stress state in a composite lamina. It is finally worth
mentioning that the present model can be easily adapted to account for the fibre to fibre
interaction and thermal stresses arising in a real unidirectional lamina.
A.9. Conclusions
With the aim of improving knowledge on damage initiation in unidirectional laminates under
a local multiaxial stress state, a new model for the onset of debond cracks at the fibre-matrix
interface has been proposed. An isotropic fibre embedded in an infinite plate and subjected to
remote transverse and antiplane shear stresses has been considered. The model is based on the
Finite Fracture Mechanics approach and makes it possible to estimate the initial crack angle
and the critical stress for debond initiation. The latter has been found to depend on the
biaxiality ratio, i.e. the remote antiplane to transverse stress ratio, and on the fibre radius Rf. In
particular, for a fibre radius tending towards zero, the critical transverse stress is proportional
to the inverse of the square root of the radius, whereas for large fibre diameters the critical
stress is almost radius-independent, tending to a constant value computed by means of the
stress criterion only.
The model has been validated through experimental results taken from literature, resulting in
a satisfactory agreement. This suggests that the present approach could be applied to predict
the static debond initiation in real unidirectional off-axis laminae, accounting for the actual
stress and displacement fields relevant for multiple fibre composites.
Appendix A.A
The aim of this appendix is to prove that the limit value of F(α0) for α0→0 is zero. It is worth
noting that as α0→0, the denominator of F(α0) in equation (45) is a finite non-zero value. The
problem is therefore converted to evaluation of the following limit:
0
2
1 0 2 0 12 3 0
α 00
Ω α α λ Ω αlim
2α
p aI I I
(A1)

Appendix A. Modelling fibre-matrix debonding under biaxial loading
261
It is worth noting that both numerator and denominator in equation (A1) tend to zero as α0→0,
resulting in an indeterminate form 0/0. Moreover, the problem is even more complicated since
integrals I1 and I2 can be computed only numerically, as a closed form expression is not
generally available for them. However, since the problem is restricted to α0 tending to zero, the
integrals I1, I2 and I3 can be expanded in MacLaurin series as follows:
0
0
0
21 0
1 0 1 0 0
0 α 0
22 0
2 0 2 0 0
0 α 0
23 0
3 0 3 0 0
0 α 0
αα 0 0 α α
α
αα 0 0 α α
α
αα 0 0 α α
α
dII I o
d
dII I o
d
dII I o
d
(A2)
where, according to equations (33) and (34), Ii(0) = 0. After simplifying the factor α0 and
neglecting higher order terms, equation (A1) can be rewritten as follows:
0
1 2 32
12α 0
0 0 0
0 0 01lim Ω λ Ω
2 α α αp a
dI dI dI
d d d
(A3)
According to the definition of the SERR given in the frame of linear elastic fracture
mechanics, the mode I, II and III components of G can be calculated by deriving the released
energy with respect to the crack area which is, in this case, proportional to the crack semi-
angle α. Accordingly, considering equations (29)-(31), the SERR components can be written
as
, , 0 1,2,3 0
, , 0
0
α αα
2 α
I II III
I II III
c
dU dIG
d A d . (A4)
The SERR for crack angle tending to zero has to be null (see for example Ref. [11]), thus
implying null values for the derivatives of the integrals I1, I2 and I3 with respect to α0, if α0 = 0.
Therefore:

Appendix A. Modelling fibre-matrix debonding under biaxial loading
262
0
0α 0lim (α ) 0F
(A5)
Appendix A. Modelling fibre-matrix debonding under biaxial loading
263
References of Appendix A
[1] Varna J, Joffe R, Akshantala NV, Talreja R. Damage in composite laminates with off-
axis plies. Compos Sci Technol 1999; 59: 2139-2147
[2] Tong J. Three Stages of Fatigue Crack Growth in GFRP Composite Laminates. J Eng
Mater-T Asme 2001; 123: 139-143
[3] Wharmby AW, Ellyin F. Damage growth in constrained angle-ply laminates under
cyclic loading. Compos Sci Technol 2002; 62: 1239–1247
[4] Singh CV, Talreja R. Evolution of ply cracks in multidirectional composite laminates.
Int J Solids Struct 2010; 47: 1338-1349
[5] Quaresimin M, Carraro PA. Damage initiation and evolution in glass/epoxy tubes
subjected to combined tension-torsion fatigue loading, DOI:
http://dx.doi.org/10.1016/j.ijfatigue.2014.01.002.
[6] A. Plumtree, L. Shi, Fatigue damage evolution in off-axis unidirectional CFRP. Int J
Fatigue 2002; 24: 155–159.
[7] Carraro PA, Quaresimin M. A damage based model for crack initiation in unidirectional
composites under multiaxial cyclic loading. submitted to Compos Sci Technol
[8] Keusch S, Queck H, Gliesche K. Influence of glass fibre/epoxy resin interface on static
mechanical properties of unidirectional composites and on fatigue performance of cross
ply composites. Compos Part A-Appl S 1998; 29A: 701-705
[9] De Kok JMM, Peijs T. Deformation, yield and fracture of unidirectional composites in
transverse loading 2. Influence of fibre-matrix adhesion, Compos Part A-Appl S 1999;
30: 917-932
[10] Hoecker F, Friedrich K, Blumberg H, Karger-Kocsis J. Effect of fiber/matrix adhesion
on off-axis mechanical response in carbon-fiber/epoxy resin composites. Compos Sci
Technol 1995; 54: 317-327
[11] Toya M. A crack along a circular inclusion embedded in an infinite solid. J Mech Phys
Solids 1974; 22: 325-348
[12] Chao CH. Huang WJ. Antiplane problem of curvilinear cracks in bonded dissimilar
materials. Int J Fracture 1993; 64: 179-190
[13] Zhang H, Ericson ML, Varna J, Berglund LA. Transverse single-fibre test for interfacial
debonding in composites: 1. Experimental observations. Compos Part A-Appl S 1997;
28A: 309-315

Appendix A. Modelling fibre-matrix debonding under biaxial loading
264
[14] Varna J, Berglund LA, Ericson M. Transverse single fibre test for interfacial debonding
in composites: 2 Modelling. Compos Part A-Appl S 1997; 28A: 317-326
[15] Rice JR. Elastic Fracture Mechanics Concepts for Interfacial Cracks. J Appl Mech
1988; 55: 98–103
[16] Comninou M. The Interface Crack. J Appl Mech 1977; 44: 631–636
[17] Paris F, Correa E, Mantič V. Kinking of transversal interface cracks between fiber and
matrix. J Appl Mech 2007; 74: 703-716
[18] Correa E, Gamstedt EK, Paris F, Mantic V. Effects of the presence of compression in
transverse cyclic loading on fibre–matrix debonding in unidirectional composite plies.
Compos Part A-Appl S 2007; 38: 2260–2269
[19] Correa E, Mantic V, Paris F. A micromechanical view of inter-fibre failure of
composite materials under compression transverse to the fibres. Compos Sci Technol
2008; 68: 2010–2021
[20] Hobbiebrunken T, Hojo M, Adachi T, De Jong C, Fiedler B. Evaluation of interfacial
strength in CF/epoxies using FEM and in-situ experiments. Compos Part A-Appl S
2006; 37: 2248-2256
[21] Ha SK, Jin KK, Huang Y. Micro-Mechanics of Failure (MMF) for Continuous Fiber
Reinforced Composites. J Compos Mater 2008; 42: 1873-1895
[22] Tandon GP, Kim RY, Bechel VT. Fiber-matrix interfacial failure characterization
using a cruciform-shaped specimen. J Compos Mater 2002; 36: 2667-2691
[23] Ogihara S, Koyanagi J. Investigation of Combined Stress State Failure Criterion for
Glass Fiber/Epoxy Interface by the Cruciform Specimen Method. Compos Sci Technol
2010; 70: 143-150
[24] Chandra N, Evaluation of interfacial fracture toughness using cohesive zone model.
Compos Part A-Appl S 2002; 33: 1433–1447
[25] Koyanagi J, Shah PD, Kimura S, Ha SK, Kawada H. Mixed-Mode Interfacial
Debonding Simulation in Single-Fiber Composite under a Transverse Load. Journal of
Solid Mechanics and Materials Engineering 2009; 3(5): 796-806
[26] Leguillon D. Strength or toughness? A criterion for crack onset at a notch. Eur J Mech
A-Solid 2002; 21: 61-72
[27] Mantič V. Interface crack onset at circular cylindrical inclusion under a remote
transverse tension. Application of a coupled stress and energy criterion. Int J Solids
Struct 2009; 46: 1287-1304

Appendix A. Modelling fibre-matrix debonding under biaxial loading
265
[28] Mantic V, García IG. Crack onset and growth at the fibre–matrix interface under a
remote biaxial transverse load. Application of a coupled stress and energy criterion. Int
J Solids Struct 2012; 49: 2273–2290
[29] Chowdhuri MAK , Xia Z, Ju F, A new test method for the measurement of normal-
shear bonding strength at bi-material interface. Mech Adv Mater Struc 2013; 20(7):
571-579
[30] Goodier JN. Concentration of stress around spherical and cylindrical inclusions and
flaws. J Appl Mech 1933; 55: 39-44
[31] Erdogan, F. Stress Distribution in Bonded Dissimilar Materials with Cracks. J Appl
Mech 1965; 32: 403-410
[32] Sun CT, Jih CJ. On strain energy release rates for interfacial cracks in bi-material
media. Eng Fract Mech 1987; 28: 13-20
[33] Hutchinson JW, Suo Z. Mixed mode cracking in layered materials. Adv Appl Mech
1992; 29: 63-191
[34] Liechti KM, Chai YS. Asymmetric shielding in interfacial fracture under in-plane
shear. J Appl Mech 1992; 59: 295-304
[35] Wang CH. Fracture of interface cracks under combined loading. Eng Fract Mech 1997;
56: 77-86
[36] Carraro PA, Meneghetti G, Quaresimin M, Ricotta M. Crack propagation analysis in
composite bonded joint under mixed-mode (I + II) fatigue loadings: Experimental
investigation and phenomenological modeling. J Adhes Sci Technol 2013; 27(11):
1179-1196
[37] Quaresimin M, Carraro PA. On the investigation of the biaxial fatigue behaviour of
unidirectional composites. Compos Part B-Eng 2013; 54: 200-208.
[38] Quaresimin M, Susmel L, Talreja R. Fatigue behaviour and life assessment of
composite laminates under multiaxial loadings. Int J Fatigue 2010; 32: 2-16

Appendix A. Modelling fibre-matrix debonding under biaxial loading
266
Conclusions
267
Concluding remarks
In the last two decades the needs of decreasing energy consumptions and increasing the power
supplied by renewable sources acted as major driving forces for the use of composite materials
for structural components. These materials offer a wide range of advantages deriving from
their high specific strength and stiffness, resistance to environmental effects and versatility.
On the other hand they are still characterised by a quite high cost with respect to more
traditional materials, due to expensive raw materials, labour intensive manufacturing processes
and lack of reliable design procedures.
In particular the behaviour of composites under multiaxial fatigue loadings, which often
characterise in-service conditions, has not been understood and modelled exhaustively in the
literature.
In order to decrease the costs and to fully exploit the advantages provided by this class of
materials it is essential to improve the knowledge of their behaviour under multiaxial cyclic
loading. Accordingly, extensive experimental investigations are needed, aimed not only to the
production of large databases but also to the observation of the damage mechanisms leading
these materials to failure, with the final aim to define predictive models and criteria.
In the present work, after defining a proper specimen configuration for multiaxial testing
(chapter 2), the matrix-dominated multiaxial fatigue behaviour of unidirectional composites
was characterised under several loading conditions (chapter 3). Different values of the
biaxiality ratio, defined as the shear to transverse stress ratio, and load ratio R have been
adopted for multiaxial testing of glass/epoxy tubes subjected to combined tension/torsion
loading. A strong influence of both parameters was found on the stress-life curves for crack
initiation and on Paris-like curves for crack propagation, highlighting the need of suitable
criteria to account for them. In particular it was found that the addition of a more and more
pronounced shear stress contribution led to a lower number of cycles to crack initiation and to
a higher crack growth rate, mainly when combined with alternating transverse stress.
Also the damage mechanisms at the microscopic scale were found to depend on the multiaxial
stress state. In particular, for positive load ratios, loading conditions characterised by a high
enough shear stress contribution led to the formation of micro-cracks in the matrix, the
accumulation of which is presumably the cause of a macro-crack initiation in a lamina.

Conclusions
268
Tubular specimens subjected to tension/torsion loading are characterised by an external
multiaxial stress state, in which external loads are applied in different directions. Conversely,
an internal multiaxial stress state can be originated by the material anisotropy even in the
presence of a uniaxial load.
In order to verify the (expected) equivalence between fatigue damage evolution under external
and internal multiaxial stress states, a dedicated experimental campaign was carried out on
multidirectional flat laminates (chapter 4). The comparison with results on the tubes presented
in chapter 3 revealed that the fatigue behaviour of a unidirectional lamina under external and
internal multiaxial conditions is consistent, in terms of crack initiation and propagation,
provided that the local multiaxial stress state is the same, independently of the way it is
originated. As a consequence, experimental results and observations, as well as predictive
models, can be extended from flat to tubular geometries and vice-versa.
On the basis of the damage mechanisms at the micro-scale observed on tubular specimens a
criterion for crack initiation in UD laminates was proposed in chapter 5. It consists in adopting
two stress parameters, Local Hydrostatic Stress and Local Maximum Principal Stress,
representative of the driving forces for micro-damage evolution under loading conditions
characterised by low and high enough shear stress, respectively. It was shown in chapter 5 that
these parameters, computed by means of a multiscale analysis, are suitable to fully describe
the matrix-dominated fatigue behaviour of a lamina by means two stress-life curves only.
A simple but efficient parameter was also defined to account simultaneously for the influence
of the multiaxial stress state and load ratio.
In view of the equivalence between damage initiation under external and internal multiaxial
conditions, the criterion can be successfully applied also to flat unidirectional laminates and
layers of multidirectional laminates, the damage evolution of which is characterised by the
initiation and propagation of multiple cracks in the off-axis layers.
The above mentioned phenomena lead to the degradation of the global elastic properties of a
laminate. In the literature many efforts have been devoted to the prediction of laminate's
stiffness on the basis of the crack density in its layers. Several models were analyses and
classified in six main groups, as discussed in chapter 6. However none of them was capable of
accounting analytically for the interaction between cracks in different layers. To this end, in
chapter 6 a model based on an Optimal Shear Lag analysis was developed for the stress
distributions and stiffness degradation in multidirectional laminates with cracks in one or more
layers. Crack interaction was accounted for by means of a procedure based on the principle of
superposition. It was shown that neglecting such interactions can lead to wrong and non

Conclusions
269
conservative estimations of the stiffness degradation of cracked laminates. The proposed
model resulted in very satisfactory agreement with the available experimental data from the
literature and it was implemented in a Matlab code with graphical interface.
Once the link between crack density and stiffness is known, it is important to predict the crack
density evolution under fatigue loading. To this end an analytical procedure was developed
and presented in chapter 7. It is based on the idea that the initiation of multiple cracks in a ply
within a multidirectional laminate is controlled by the stress re-distributions between cracks in
the ply (which can be computed by means of the stress distribution model presented in chapter
6) and by the lamina stress-life curve expressed in terms of the parameters proposed in chapter
5. It is also fundamental to account for the statistical distribution of fatigue strength along the
length of a laminate. The Weibull distribution was adopted for this scope.
The through the width propagation of multiple cracks was also considered in the procedure by
means of Paris-like curves expressed in terms of the Strain Energy Release Rate (SERR), the
value of which depends on the local crack density in each point of the laminate.
The crack density evolution predicted by means of the developed procedure, implemented in a
Matlab code with graphical interface, resulted in reasonable agreement with experimental data,
even if some important points still have to be clarified, as, for instance, the way to estimate
damage accumulation in variable amplitude fatigue and the ply thickness effect.
This procedure, combined with the stiffness degradation model presented in chapter 6,
represents a very useful tool for predicting the fatigue damage evolution in laminates, with
particular reference to the stiffness loss. However, the stress re-distributions associated to the
predicted crack density can be computed with the model presented in chapter 6 and used for
estimating the total fatigue life of a laminate.
The activity carried out on composite bonded joints was presented in chapter 8. An extensive
experimental campaign was carried out to characterise the static and fatigue propagation of
cracks at the bondline under mixed mode I + II. The Paris-like curves linking the Crack
Growth Rate (CGR) to the total SERR were shown to depend on the mixed mode condition.
Also the propagation modes at the micro-scale were found to change whether the loading
condition was mode I or mode II dominated. In the former case, the propagation occurred in a
self-similar manner at the adhesive-adherend interface and therefore it was reasonable to
assume it to be controlled by the mode I SERR contribution only. Conversely, in the presence
of dominant mode II, the damage mechanism consisted in the initiation, accumulation and
coalescence of inclined micro-cracks in the adhesive layer. Accordingly, a stress parameter, S,

Conclusions
270
based on the maximum principal stress averaged over a process zone was proposed as the
driving force for this propagation mode.
It was shown that two Paris-like curves in terms of the mode I SERR and S are capable of
fully describing the mixed mode propagation of cracks in bonded joints under fatigue loading.
Eventually, an analytical model for predicting the initiation of a debond crack at the fibre-
matrix interface under static biaxial loading was developed on the basis of the Finite Fracture
Mechanics approach and presented in Appendix A.
This activity is not strictly related to the fatigue behaviour of composites but it represents a
helpful tool for understanding the role of the main geometrical and interface parameters on the
fibre-matrix interface strength. In particular it was found that the lower the fibre' radius, the
higher the resistance to fibre-matrix debonding is.

List of publications
271
List of publications
(a) INTERNATIONAL JOURNALS
[1] Carraro P.A., Quaresimin M. (2012). Damage mechanics in G/E tubes under tension-
torsion cyclic loading, Key Engineering Materials, vol. 488-489, p. 783-786
[2] Carraro P.A., Meneghetti G., Quaresimin M., Ricotta M. (2013). Crack propagation
analysis in composite bonded joints under mixed-mode (I+II) static and fatigue
loading: a damage-based model. Journal Of Adhesion Science And Technology, vol.
27, p. 1393-1406
[3] Carraro P.A., Meneghetti G., Quaresimin M., Ricotta M. (2013). Crack propagation
analysis in composite bonded joints under mixed-mode (I+II) static and fatigue
loading: experimental investigation and phenomenological modelling. Journal of
Adhesion Science and Technology, vol. 27, p. 1179-1196
[4] Quaresimin M., Carraro P.A. (2013). On the investigation of the biaxial fatigue
behaviour of unidirectional composites. Composites Part B: Engineering, vol. 54, p.
200-208
[5] Quaresimin M., Carraro P.A. (2014). Damage initiation and evolution in glass/epoxy
tubes subjected to combined tension-torsion fatigue loading, DOI:
http://dx.doi.org/10.1016/j.ijfatigue.2014.01.002
[6] Carraro P.A., Quaresimin M. (2014). Modelling the fibre-matrix debonding under
biaxial loading, accepted for publication on Composites Part A: Applied Science and
Manufacturing
[7] Quaresimin M., Carraro P.A, Pilgaard Mikkelsen L., Lucato N., Vivian L., Brøndsted
P., Sørensen B.F., Varna J., Talreja R. (2014). Damage evolution under internal and
external multiaxial cyclic stress state: a comparative analysis, accepted for publication
on Composites Part B: Engineering
[8] Zappalorto M., Carraro P.A. (2014). Explicit solution for the stress and displacement
fields in composite plates with re-entrant corners under various boundary conditions,
under review on Composite Structures

List of publications
272
[9] Carraro P.A., Quaresimin M. (2014). A damage based model for crack initiation in
unidirectional composites under multiaxial cyclic loading, submitted to Composite
Science and Technology
[10] Carraro P.A., Quaresimin M. (2014). A stiffness degradation model for cracked
multidirectional laminates, to appear
[11] Carraro P.A., Quaresimin M. (2014). An analytical model to predict the stiffness
degradation of composite laminates considering the mutual interaction between cracks
in different layers, to appear
[12] Carraro P.A., Maragoni L., Quaresimin M. (2014). Influence of the load ratio on the
multiaxial fatigue behaviour of glass/epoxy tubes, to appear
(b) INTERNATIONAL CONFERENCES
[13] Carraro P.A., Quaresimin M., Salviato M., Zappalorto M. (2010). Interlaminar
properties of clay-modified epoxy-glass reinforced laminates. In: proceedings of
ECCM 14. Budapest, Hungary, 7-10 june 2010
[14] Carraro P.A., Meneghetti G., Quaresimin M., Ricotta M. (2010). Fatigue behaviour of
composite bonded joints under mixed-mode loading. In: proceedings of ECCM 14.
Budapest, Hungary, 7-10 june 2010
[15] Carraro P.A., Quaresimin M. (2011). Investigation of damage mechanics in
[0T/90U,3/0T] glass / epoxy tubes . In: Proceedings of DFC11/SI5. Cambridge, 12-15
April 2011
[16] Carraro P.A., Quaresimin M. (2011). Fatigue damage evolution in [0F/90U,3/0F]
composite tubes under multiaxial loading. In: Proceedings of 18th International
Conference on Composite Materials. Jeju Island, Korea, 21-25 Agoust 2011
[17] Carraro P.A., Maragoni L., Quaresimin M. (2012). Influence of the stress ratio on the
multiaxial fatigue behaviour of glass/epoxy tubes. In: Proceedings of 15th European
Conference on Composite Materials. Venezia, 24-28 June 2012
[18] Carraro P.A., Quaresimin M. (2012). A model for the crack initiation process in
composite materials under multiaxial fatigue loading. In: Proceedings of 15th European
Conference on Composite Materials ECCM15. Venezia, 24-28 June 2012
List of publications
273
[19] Carraro P.A., Quaresimin M. (2013). Prediction of fatigue damage evolution in
multidirectional laminates. In: Proceedings of 19th International Conference on
Composite Materials ICCM19. Montreal (Canada), 28 July-02 August 2013
[20] Carraro P.A., Meneghetti G., Quaresimin M., Ricotta M. (2013). Mixed mode (I+II)
fatigue loading of composite bonded joints: experimental investigation and modelling.
In: Proceedings of 13th Japanese-European Symposium on Composite Materials.
Nantes, France, 4-6 Novembre 2013
[21] Quaresimin M., Carraro P.A. (2013). Biaxial fatigue testing of glass/epoxy composite
tubes . In: Proceedings of Comptest 2013 . Aalborg, Denmark, 22-24 April 2013
[22] Carraro P.A., Quaresimin M. (2013). A multiaxial criterion for the initiation of off-axis
cracks in multidirectional laminates under fatigue loading. In: Proceedings of
DFC12/SI6. Cambridge, UK, 8-11 April 2013
(c) NATIONAL CONFERENCES
[23] Carraro P.A., Meneghetti G., Quaresimin M., Ricotta M. (2010). Comportamento a
fatica a modo misto di giunzioni incollate in materiale composito. In: 39° Convegno
Nazionale AIAS. Maratea, Italy, 7-10 September
[24] Carraro P.A., Quaresimin M. (2011). Un modello per il debonding tra fibra e matrice in
presenza di sollecitazioni multiassiali. In: 40° Convegno Nazionale AIAS. Palermo,
ITALY, 7-9 September 2011
[25] Carraro P.A., Quaresimin M. (2011). Analisi del danneggiamento in condizioni di
carico multiassiale di tubi in vetro-epossidica con diverse sequenze di sovrapposizione.
In: 40° Convegno Nazionale AIAS. Palermo, 7-10 settembre 2011
[26] Carraro P.A., Meneghetti G., Quaresimin M., Ricotta M. (2012). Un modello per la
stima della vita a fatica a modo misto di giunzioni incollate in materiale composito. In:
41° Convegno Nazionale AIAS. Vicenza, Settembre 2012
[27] Carraro P.A. (2012). Modellazione della rigidezza di laminati multidirezionali in
presenza di cricche trasversali. In: 41° Convegno Nazionale AIAS. Vicenza, Settembre
2012
[28] Carraro P.A., Maragoni L., Quaresimin M. (2012). Influence of the load ratio on the
multiaxial fatigue behaviour of glass/epoxy tubes. In: 41° Convegno Nazionale AIAS.
Vicenza, Settembre 2012

List of publications
274
[29] Carraro P.A., Quaresimin M. (2013). A model for the crack initiation process in
composite materials under multiaxial fatigue loading. In: 42° Convegno Nazionale
AIAS. Salerno, Settembre 2013