universiti putra malaysia distribution of pelagic...
TRANSCRIPT

UNIVERSITI PUTRA MALAYSIA
DISTRIBUTION OF PELAGIC FISH SPECIES IN THE JAVA SEA FROM REMOTE SENSING DATA
WIJOPRIONO.
FH 2006 2

DISTRIBUTION OF PELAGIC FISH SPECIES IN TEE JAVA SEA FROM REMOTE SENSING DATA
WIJOPRIONO
DOCTOR OF PHILOSOPHY UNIVERSITI PUTRA MALAYSIA
2006

DISTRIBUTION OF PELAGIC FISH SPECIES IN THE JAVA SEA FROM REMOTE SENSING DATA
Thesis Submitted to tbe School of Graduate Studies, Universiti Putra Malaysia, in Fulfilment of the Regnirements For the Degree of Doctor of Philosophy
January 2006

DEDICATION
This thesis is dedicated to my beloved parents, wife, and daughter:
Djamin Sastro Suwito and late Widjiati;
Dwi Irianingsih, Siswoyo Budi Priono, Jodi Azhar Priono and Kernala Adi Citra

Abstract of thesis submitted to the Senate of Universiti Putra Malaysia in fulfilment of the requirement for the degree of Doctor of Philosophy
DISTRIBUTION OF PELAGIC FISH SPECIES IN THE JAVA SEA FROM REMOTE SENSING DATA
BY
WIJOPRIONO
January 2006
Chairman : Professor Kamaruzaman Jusoff, PhD
Faculty : Forestry
Pelagic fishery in the Java Sea is multi-species and dominated by a community of
small pelagic species. This study attempted to employ different sources of data in
order to determine the distribution of pelagic fish species and to estimate their
environmental preferences. Catch per unit effort (CPUE), hydro-acoustic, satellite
derived sea surface temperature (SST) and chlorophyll-a data as well as
oceanographic in sifu measurements data were used to achieve these objectives.
CPUE data were collected from commercial fishing records available at the fishing
port of Pekalongan, the main pelagic fish landing centre in the north coast of Java
Hydro-acoustic and oceanographic in situ measurements data were collected from
hydro-acoustic survey carried out during September-October 2002, while the data of
satellite &rived SST of AVHRR-NOAA and chlorophyll-a derived fiom SeaWiFS
were collected from the HRPT (High Resolution Picture Transmission) ground
receiving station at BPPT (Assessment and Application of Technology Board),
Jakarta, and GSFC-NASA (Goddard Space and Flight Center of the National
Aeronautics and Space Administration). Correlation analysis, cluster analysis, PCA,
spatial analysis and GIs technique were employed in determining abundance and

density distribution of pelagic fish species. Spatial analysis and GIs technique
together with GLM were also applied in building the fishery-environment dependent
model in order to estimate the environmental preferences of the fishes. Results of the
study showed that the Java Sea water was seasonally occupied by oceanic water of
the Indonesian Throughflow (ITF). The influence of the ITF was most pronounced in
the southeast monsoon when the currents in the Java Sea flow towards the west. The
influence is minimum in the northwest monsoon when the currents flow towards the
east. The sea has a great thermal stability with a monthly SST average of 28.9 OC and
the difference between maximum and minimum (gradient) of 2.0-3.5 OC. The
abundance of phytoplankton tends to increase towards the west and towards the
coastal areas off north coast of Java, south coast of Kalimantan, and around the small
islands spreading over the Java Sea. Correlations between physical and biological
oceanographic parameters were exhibited. Pelagic fishery resources in the Java Sea
have undergone considerable variations in both their seasonal distributions and
abundances. They were relatively low during northwest monsoon (December-
March), and increased during southeast monsoon (June-September), with a peak at
the end of the monsoon. Abundance of the resources was mostly driven by
fluctuations in the abundance of one dominant species, SardineIIa spp in the inshore
and Decapterus spp in the offshore. The two species make up the average of 36%
and 32% of the total CPUE, respectively. GLM model gave evidence that the pelagic
fish species have a tolerance limit of temperature of up to 28.5 OC, and below this
temperature limit they show a positive trend of relationships with chlorophyll-a
concentrations. The model also revealed that oceanographic variables (SST and
chlorophyll-a concentrations) contriiuted 54% to the total variance explained by the
GLM predictors, confirming the relative importance of these variables in predicting

m u s bvmar~ rwr
pelagic fish catch However, relationship between sea surface temperature ana
chlorophyll-a concentrations was weak The GIs model has demonstrated its
capability in delineating spatial patterns of fish density in relation to the
environmental variables, especially zooplankton, which was not covered in the GLM
model.

Abstrak tesis yang dikemukakan kepada Senat Universiti Putra Malaysia sebagai memenuhi keperluan mtuk ijaah Doktor Fabfah
TABURAN SPESIES IKAN PELAGIK DI LAUT JAWA BARB DATA PENBERIAAN JAUH
mOPR11ONO
Jannari 2006
Pengerusi : Profesor Kamaruzaman Jusoff, PhD
Faknlti : Perhotanan
Perikanan pelagik di Laut Jawa adalah multi-spesies dm dikuasai oleh komuniti
spesies ikan pelagik kecil. Kajian ini menggunakan pelbagai sumber data yang
berbeza bagi memastikan penyebaran spesies ikan pelagik dan menganggarkan
keutamaan persekitaran mereka. Data hasif tangkapan per unit daya (CPUE), hidro-
akustik, suhu permrrkaan but (SST) dan UorofiEa daripada satelit, dan data
oseanografi daripada pengukuran in situ digunakan bagi men* objelaif kajian.
Data CPUE diperolehi dztripada rekod h i 1 tturgkapan i h komersil yang di
Pelabuhm Peiikanan N m t a r a P&*n, iaitu pusat pendaratan ikan pelagik
trtama di pantai utzm Jawa. Data Woakwtik rtan data oseamgmfi herb k e p b
pen- rit situ dipolehi daripada hasil kajian hi&&& yang dilaksanakan
pada bulan September-Oktober 2002, naanakala data SST dm kbrofila daripada
AVHRR-NOAA dan SeaWiFS diprolehi daripada stesen peneriana resalusi tin@
(HRPT) Badan Pengkajian dan Penerapan Teknology (BPFTJ Jakarta, dan GSFC-
NASA (Goddard Space and Flight Center of the National Aeronautics and Space
Administration). Analisis korelasi, analisis kelompok, PC& analisis ruang dan teknik
GIS (geographic information system) digunakan bagi memasbian kelimpahan dm

kepadatan taburan spesies ikan pelagik Analisis spasial dan teknik GIs, dan juga
GLM (general linear model) digunakan dalam membangunkan model antara
perikanan dan persekitaran bagi memperkirakan keutamaan persekitaran daripada
ikan-ikan pelagik. Hasil kajian menunjukkan bahawa Laut Jawa Secara bermusirn
dipenuhi oleh air lautan yang dibawa oleh a m ITF (Indonesian Througflow).
Pengaruh daripada ITF lebih ketara pada musim tengkujuh tenggara ketika arus-arus
di Laut Jawa mengalir ke arah barat Pengaruhnya adalah minimum pada musim
tengkujuh barat laut ketika arus di Laut Jawa mengalir ke arah timur. Laut hi
mempunyai stabilan termal yang tinggi dengan purata bulanan SST 28.9 OC dan
perbezaan antara gradient rnaksimum dan minimum adalah 2.0-3.5 OC. Kelimpahan
fibplankton cenderung untuk meningkat ke arah kawasan pantai barat dan kawasan-
kawasan di luar pantai utara Jawa, pantai selatan Kalimantan, dan kawasan di sekitar
pulau-pulau kecil yang terhampar di Laut Jawa. Korelasi di antara beberapa
parameter-parameter oseanografi fizikal clan biologi ditunjukkan Sumber-sumber
perikanan pelagik di Laut Jawa mengalami perbezaan distribusi dan kelimpahan
mengikut musim. Secara relatifnya, sumber ikan ini adalah rendah pada waktu
musim tengkujuh barat laut (Disernber-Mac), dm bertambah pa& musim tengkujuh
tenggara (Jun-September), dengan puncaknya pada penghujung musim tersebut.
Kelimpahan sumber ini pada keseluruhannya berpunca daripada tunm naiknya
kelimpahan spesies utamanya, iaitu Sardinella spp di kawasan perairan pantai dan
Decapterus spp di kawasan perairan dalarn. Keduadua spesies ini membentuk
masing-masing dengan purata 36% dm 32% daripada jumlah CPUE. Model GLM
memberikan bukti bahawa spesies ikan pelagik memiliki had toleransi suhu sehingga
28.5 OC clan ikan-ih pada suhu yang lebih rendah daripada ini menunjukkan
hubungan positif dengan klorofil-a. Model tersebut juga mengungkap bahawa
vii

pembolehubah-pernbolehubah oseanograf~ (SST dan klorofil-a) menyumbang 54%
kepada keragaman yang boleh diterangkan oleh pembolehubah-pembolehubah bebas
dalam GLM, mengesahkan pentingnya pembolehubah-pembolehubah osea~ografi
tersebut dalarn meramallcan tangkapan ikan pelagik. Walau bagaimanapun,
perhubungan antara SST dm pemusatan-pemusatan klorofil-a adalah lemah. Model
GIs menunjukkan kemampuannya bagi menggambarkan pola ruang bagi kepadatan
ikan berhubung dengan pembolehubah persekitaran, terutamanya zooplankton, yang
tidak dirnasukkan dalam model GLM.
... Vlll

ACKNOWLEDGEMENTS
The assistance and services of various individuals and institutions, making this study
possible are gratefully acknowledged. In short, the following particulars have to be
mentioned for their regular motivation through my tenature of study period.
First and foremost, my sincere gratitude and appreciation are due to the chairman of
my supervisory committee, Prof. Dr. Kamaruzarnan Jusoff, for his professional
guidance, encouragement and constructive criticisms from the beginning of this
research till the final review of the manuscript.
I would like to express my sincere thanks to the other members of the committee,
namely Prof. Dr. Fatimah Md Yusoff, Deputy Director of Institute of Bioscience,
Universiti Putra Malaysia, Prof. Dr. Mazlan Hashim, Head Department of Remote
Sensing, Faculty of Engineering and Geoinformatics, University Technology
Malaysia, Associate Prof. Dr. Khalid Samo, Research Fellow of the Institute of
Oceanography, University College of Science and Technology Malaysia,
Terengganu, for their advice and valuable comments during my study period.
Special thanks are due to Dr. Nani Hendiarti for valuable discussion concerning the
interpretation of SeaWiFS data and also for her assistance in providing satellite
derived chlorophyll-a data. Her smart discussion certainly improves the
interpretation of the results.

I am indebted to the Head of Remote Sensing Laboratory of the Assessment and
Application of Technology Board (BPPT), for allowing me to utilize the laboratory
facilities to collect satellite derived sea surface temperature data. My
acknowledgement also goes to the BPPT laboratory staE Ir. Retno Andiastuti and Ir.
Khairul Amri MS. Their practical help is highly appreciated.
I would like to express my sincere thanks to the PAATP of the Department of
Agriculture of Indonesia for the scholarship award and the financial assistance,
which made this study possible. I wish also to express my gratitude to Dr. Wudianto
(Head of the Research Institute for Marine Fisheries), Dr. Subhat Nurhakim (Head of
the Research Center for Capture Fisheries) for giving support to continue my study in
Malaysia.
Special thanks are also due to Nuwianto, Sujianto, Suwardi and all crews of R.V.
Mutiara IV, for their assistance during the fieldwork in the Java Sea. Finally, I
address my deep gratitude to many people, whose names not be mentioned above.
I certifj. that an Examination Committee met on 19 January 2006 to conduct the final examimtim of Wijopriom on his Doctor of Philosophy thesis entitled 7kfri'bution of Pelagic Fish Species in the Java Sea from Remote Sensing Data" in accordance with Wversiti Pertanian Malaysia (Higher Degree) Act 1980 and Universiti Pertanian Malaysia (Higher Degree) Regulations 198 1. The Committee recommends that the candidate be awarded the relevant degree. Members of the Examination Committee are as follows:
Mohd. Ibrahim Hj. Mobamed, PBD Professor Faculty of Environmental Studies Universiti Putra Malaysia (Chairman)
Shattri M~msor, PhD Professor Institute of Advance Technology Universiti Putra Malaysia (Internal Examiner)
Siti Khalijah Dand, PhD Associate Professor Faculty of Science Universiti Putra Malaysia (Internal Examiner)
Sharifab Mastura Syed Abdullah, PhD Professor Faculty of Sciences and Technology Universiti Kebangsaan Malaysia (External Examiner)
School of Graduate Studies Universiti Putra Malaysia
Date:

This thesis submitted to the Senate of Universiti Putra Malaysia has been accepted as fblfilment of the requirement for the degree of Doctur of Philosophy. The members of the Supervisory Committee are as follows:
Kamaruzaman Jusoff, PhD Professor Faculty of Forestry Universiti Putra Malaysia (Chairman)
Fatimah Md. Ynsoff, PhD Professor Institute of Bioscience Universiti Putra Malaysia (Member)
Mazlan Hashim, PbD Professor Faculty of Engineering and Geoinfiormatics University of Technology Malaysia (Member)
Khalid Samo, PhB. Associate Professor Institute of Oceanography College University of Science and Technology Malaysia (Member)
A N IDERIS, PhD Professor/Dean School of Graduate Studies Universiti Putra Malaysia
Date: 13 APR 2006
xii

DECLARATION
I hereby declare that the thesis is based on my original work except for quotations and citations which have been duly acknowledged. I also declare that it has not been previously or concurrently submitted for any other degree at W M or other institutions.
*.. Xlll
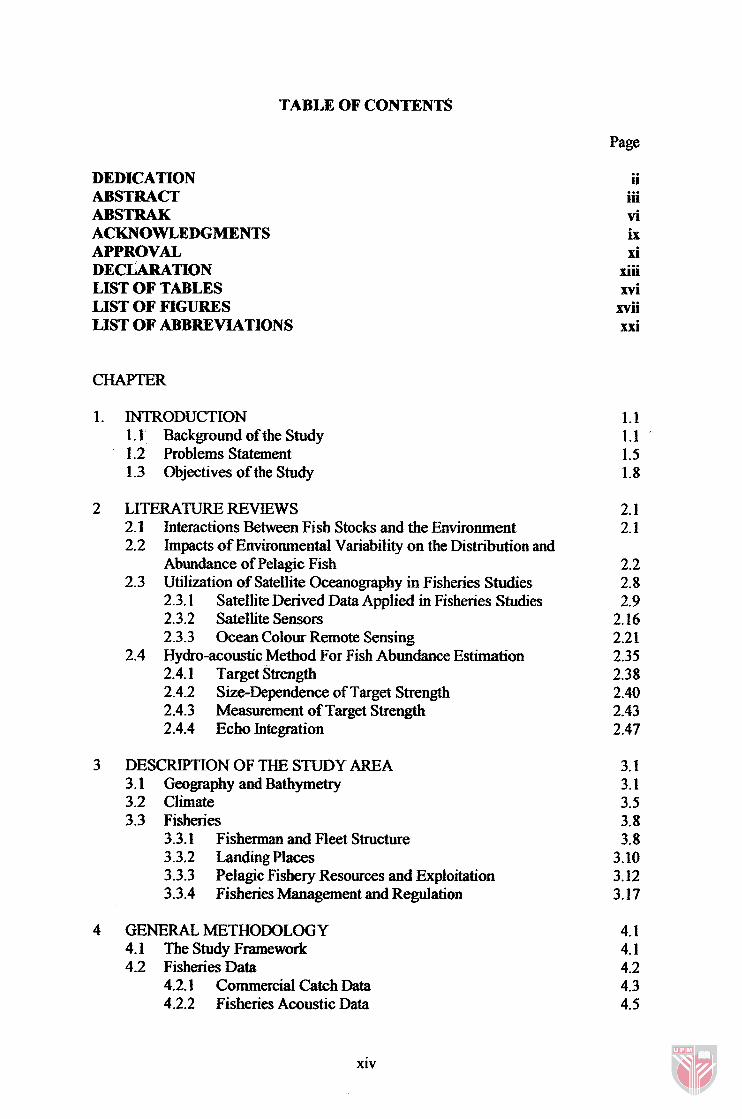
TABLE OF CONTENTS
Page
DEDICATION ABSTRACT ABSTRAK ACKNOWLEDGMENTS APPRQVAZ DECLARATION LIST OF TABLES LIST OF FIGURES LIST OF ABBREViATlONS
CHAPTER
1. INTRODUCTION 1.1 Background of the Study 1.2 Problems Statement 1.3 Objectives of the Study
2 LITERATUREREVIEWS 2.1 Interactions Between Fish Stocks and the Environment 2.2 Impacts of Environmental Variability on the Distribution and
Abundance of Pelagic Fish 2.3 Utilization of Satellite Oceanography in Fisheries Studies
2.3.1 Satellite Derived Data Applied in Fisheries Studies 2.3.2 Satellite Sensors 2.3.3 Ocean Colour Remote Sensing
2.4 Hydro-acoustic Method For Fish Abundance Estimation 2.4.1 Target strength 2.4.2 Size-Dependence of Target Strength 2.4.3 Measurement of Target Strength 2.4.4 Echo Integration
3 DESCRIPTION OF THE STUDY AREA 3.1 Geography and Bathymetxy 3.2 Climate 3.3 Fisheries
3.3.1 Fisherman and Fleet Structure 3.3.2 Landing Places 3.3.3 Pelagic Fishery Resources and Exploitation 3.3.4 Fisheries Management and Regulation
4 GENERAL METHODOLOGY 4.1 The Study Framework 4.2 Fisheries Data
4.2.1 Commercial Catch Data 4.2.2 Fisheries Acoustic Data
ii iii vi ix xi
xiii mi xvii xxi
xiv
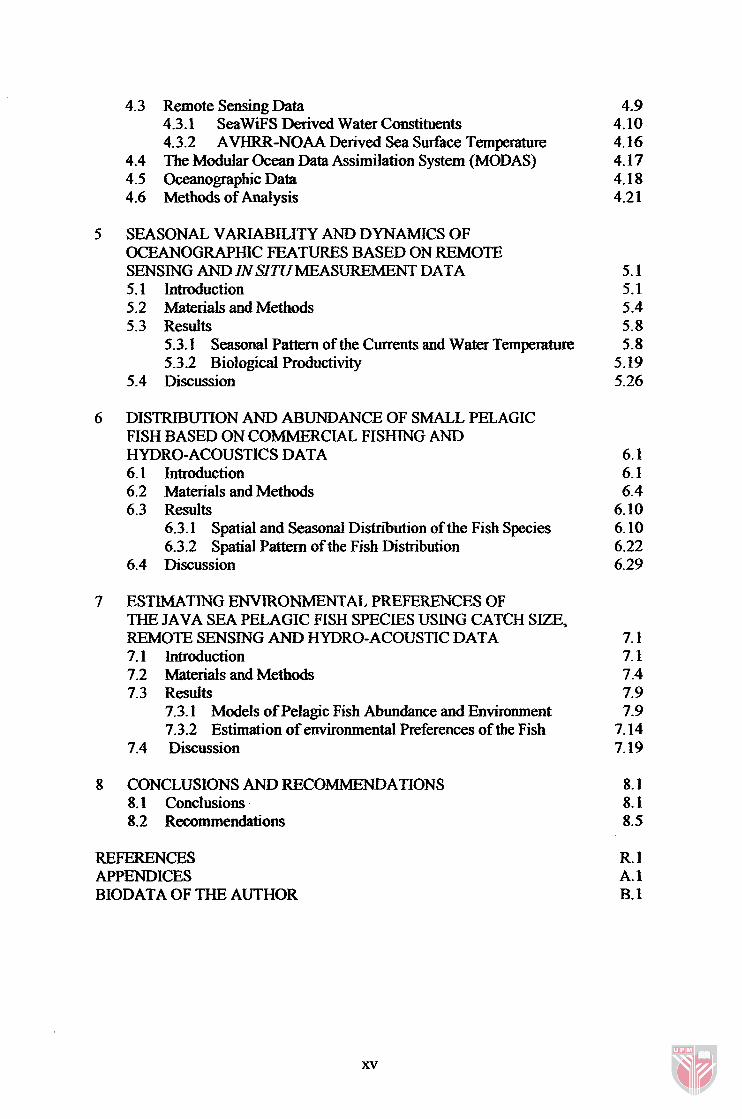
4.3 Remote Sensing Data 4.3.1 SeaWiFS Derived Water Constituents 4.3.2 AVHRR-NOAA Derived Sea Surface Temperature
4.4 The Modular Ocean Data Assimilation System (MODAS) 4.5 Oceanographic Data 4.6 Methods of Analysis
SEASONAL VARIABLLITY AND DYNAMICS OF OCEANOGRAPHIC FEATURES BASED ON REMOTE SENSING AND IN SITU MEASUREMENT DATA 5.1 Introduction 5.2 Materials and Methods 5.3 Results
5.3.1 Seasond Pattern of the Currents and Wakr Temperature 5.3 -2 Biological Productivity
5.4 Discussion
DISTRIBUTION AND ABUNDANCE OF SMALL PELAGIC FISH BASED ON COMMERCIAL FISHING AND HYDRO-ACOUSTICS DATA 6.1 Introduction 6.2 Materials and Methods 6.3 Results
6.3.1 Spatial and Seasonal Distribution of the Fish Species 6.3.2 Spatial Pattern of the Fish Distribution
6.4 Discussion
7 ESTIMATING ENVIRONMENTAL PREFERENCES OF THE JAVA SEA PELAGIC FISH SPECIES USING CATCH SIZE, REMOTE SENSING AND HYDRO-ACOUSTIC DATA 7.1 Introduction 7.2 Materials and Methods 7.3 Results
7.3.1 Models of Pelagic Fish Abundance and Environment 7.3.2 Estimation of environmental Preferences of the Fish
7.4 Discussion
8 CONCLUSIONS AND RECOMMENDATIONS 8.1 Conclusions 8.2 Recommendations
REFERENCES APPENDICES BIODATA OF THE AUTHOR
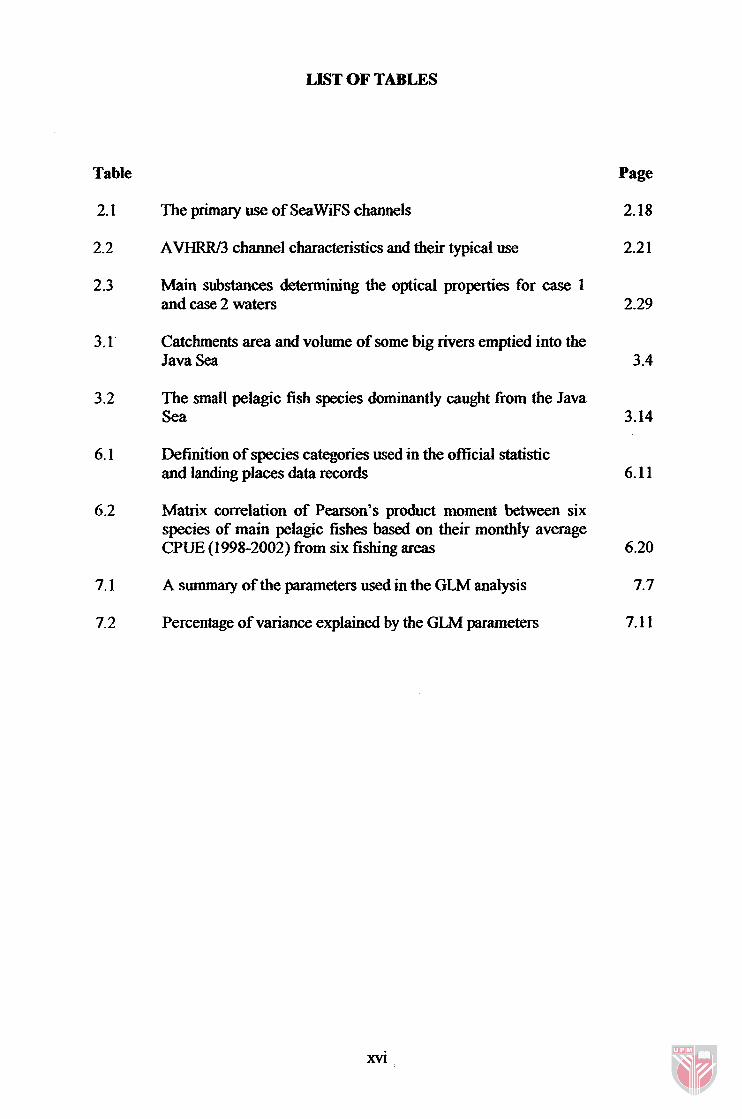
LIST OF TABLES
Table
The primary use of SeaWiFS channels
AVHFUU3 channel characteristics and their typical use
Main substances determining the optical properties for case 1 and case 2 waters
Catchments area and volume of some big rivers emptied into the Java Sea
The small pelagic fish species dominantly caught fiom the Java Sea
Definition of species categories used in the official statistic and landing places data records
Matrix correlation of Pearson's product moment between six species of main pelagic fishes based on their monthly average CPUE (1 998-2002) from six fishing areas
A summary of the parameters used in the GLM analysis
Percentage of variance explained by the GLM parameters
Page

LIST OF FIGURES
Figure
2.1
2 -2
Page
2.17 SeaStar spacecraft and SeaWIFS sensor
Composition of spectral radiance variables received by the satellite sensor
Light irradiance and its interaction just below and above the sea surface
Spectral absorption coefficients for pure seawater, chlorophyll a (1 mglm3) and yellow substances (1 mgldm3)
The echosounding system
Principle of split-beam echosounder
Principles of echo integration
Geographic location of the Java Sea, Indonesia
Profile of bathyrnetq of the Java Sea
Winds vector derived fiom QUICKSCAT
The principal fishing fleet of small jxlagic fishery in the Java Sea
Landing places for small pelagic fishing fleet in the north coast of the Java Sea
Development of the fishing grounds extension of small pelagic fishery in the Java Sea
The small pelagic fish species dominantly caught from the Java Sea
Framework of the study
Tracks of hydro-acoustic survey in SeptemberaCtober 2002
General steps for processing different levels of SeaWiFS data
Maps of the sampling sites during oceanographic cruises
Oceanographic parameters data collection

CTD-Current meter Valeport 308 used for measuring temperature, salinity, currents and depth profiles
Surface currents and sea surface temperature (SST) of the Java Sea derived from MODAS
Currents direction and velocity at the surface layer and 10 m depth layer, derived from insitu measurement during pre- northwest monsoon (October 2002)
Currents direction and velocity at 20 m depth layer and 30 m depth layer, derived fiom insitu measurement during pre- northwest monsoon (October 2002)
Sea surface temperature in 11 January 2002 and 8 July 2002 derived from AVHRR-NOAA with 1 km spatial resolution
Sea surface temperature in 2 April 2002 and 22 October 2002 derived fiom AVHRR-NOAA with 1 km spatial resolution
Result of regression (matched up) analysis between SST satellite derived data and SST derived from in situ measurement in the Java Sea
Monthly sea surface temperature of the Java Sea derived from AVHRR-NOAA pathfinder 5.0 with spatial resolution of 4 lan
Contours of vertical temperature of the Java Sea during pre- northwest monsoon (October 2002)
5.10 Vertical profiles of temperature in selected stations measured during the cruise of September-October 2002
5.1 1 SeaWiFS derived LAC data with spatial resolution of 1 kin showing the distribution of chlorophyll-a on 2 August 200 1
5.12 Monthly GAC data derived fiom SeaWiFS with spatial resolution of 5 km showing the distribution of chlorophyll-a in September 200 1 and November 2002
5.13 Result of regression (matched up) analysis between chlorophyll-a satellite derived data and chlorophyll-a derived fiom in situ measurement in the Java Sea
5.14 Distribution of chlorophyll-a concentration derived fiom insitu measurement in October 2002 and SeaWiFS GAC data in October 2001
5.15 Distribution of phytoplankton in October 2002 mapped by classed interval and contour plot

Distribution of Zooplankton in October 2002 mapped by classed interval and contour plot
Geographical location of sampling sites and the main fishing areas of the fleets (purse seiners)
Trends of CPUE of pelagic fish species averaged from 1998- 2002
Seasonal variation of CPUE of each pelagic fish species in the area offshore and inshore, averaged from 1998-2002
Percentage of CPUE of each pelagic fish species relative to the total species in the area offshore and inshore averaged from 1998-2002.
Map and surface plot showing the main fishing areas and seasonal relative abundance of pelagic fishes according to fishing area and season (month)
Surface plots showing the seasonal relative abundance of Decapterus spp, Sardinela spp, RasfreIIiger spp, according to fishing area and season (month)
Surface plots showing the seasonal relative abundance of S. crzmtenophthalmus, A. sirm, A-thazard and E. afznis, according to fishing area and season (month)
Hierarchical clustering, based on Euclidean distance, of the six species of main pelagic fishes combined from six fishing areas
Species ordination, based on principal component analysis (PCA) upon catch weights (monthly average CPUE 1998- 2002), of main pelagic fishes combined from six fishing areas
Horizontal distribution of pelagic fish resources within the entire water column in the Java Sea in September-October 2002
Horizontal distribution of pelagic fish resources in the depth layers 10-25m
Horizontal distribution of pelagic fish resources in the depth layers 25-50m
Horizontal distribution of pelagic fish resources in the depth layers 50-75m
Vertical distribution of pelagic fish resources along the two meridional transects western and eastern parts of the survey area

Bivariate GLMs showing the relationships of response and individual predictors
GIs model showing spatial relations between fish density distributions and: (a) sea surface temperature, (b) zooplankton
GIs model showing spatial relations between fish density distribution and: (a) phytoplankton, (b) chlorophyll-a.
Mean seasonal variability of pelagic fish catches in the Java Sea
Relationship between pelagic fish catches and SST in the different ranges of SST
Relationship between pelagic fish catches and chlorophyll-a in different ranges of SST

LIST OF ABBREVIATIONS
ACS
ADEOS
AVHRR
BURS
C
CDA
CDOM
CPUE
CRISP
CSlRO
CTD
CZCS
EMR
ESDU
FAD'S
GAC
GPS
GRT
Attitude Control System
Advanced Earth Observation Satellite
Advanced Very High Resolution Radiometer
Bradford University Remote Sensing
Celsius
Command and Data Acquisition
Colored Dissolved Organic Matter
Catch per Unit Effort
Centre for Remote Imaging, Sensing and Processing
Commonwealth Scientific and Industrial Research Organization
Conductivity Temperature Depth
Coastal Zone Color Scanner
Electromagnetic Radiation
Elementary Sampling Distance Unit
Fish Aggregating Devices
Global Area Coverage
Geographic Information System
GLI Global Imager
GLM General Linier Model
GNP Gross National Product
GOSSTCOMP Global Operational Sea Surface Temperature Composite
Global Positioning System
Gross Registered Tonnage

GSFC
HRPT
ITCZ
ITF
JPL
LAC
1,
1,
m
MCSST
MERIS
mg
MODAS
MODIS
MSY
NASA
NIR
nm
NOAA
NRL
NW
OCTS
P
PCA
PODAAC
Goddard Space Flight Center
High Resolution Picture Transmission
Inter-Tropical Convergence Zone
Indonesian ThrougMow
Jet Propulsion Laboratory
Local Are Coverage
Length at first capture
Length at fust maturity
Meter
Multi-channel Sea Surface Temperature
Medium Resolution haging Spectrometer
Milligram
Modular Data Assimilation System
Moderate Resolution Imaging Spectroradiometer
Maximum Sustainable Yield
National Aeronautics and Space Administration
Near Infrared
Nautical Mile
National Oceanic and Atmospheric Administration
Naval Research Laboratory
Northwest
Ocean Color and Temperature Scanner
Probability
Principal Component Analysis
Physical Oceanography Data Active Archive Center

POES
RN
SE
SeaDAS
SeaWiFS
SSH
SST
ST
TAC
Polar-orbiting Operational Environmental Satellite
Research Vessel
Southeast
SeaWiFS Data Analysis System
Sea-Viewing Wide Field of View Sensor
Sea Surface Height
Sea Surface Temperature
Station
Total Allowable Catch
Target Strength
Time Varied Gain