university of bath · (laursen, leone, and torrisi 2010; leone and reichstein 2012; leone et al....
TRANSCRIPT

Citation for published version:Criscuolo, P, Laursen, K, Reichstein, T & Salter, A 2018, 'Winning combinations: search strategies andinnovativeness in the UK' Industry and Innovation, vol. 25, no. 2, pp. 115-143.https://doi.org/10.1080/13662716.2017.1286462
DOI:10.1080/13662716.2017.1286462
Publication date:2018
Document VersionPeer reviewed version
Link to publication
Publisher RightsUnspecifiedThis is an Accepted Manuscript of an article published by Taylor & Francis in Industry and Innovation on 9February 2017 (early online), available online: http://www.tandfonline.com/10.1080/13662716.2017.1286462.
University of Bath
General rightsCopyright and moral rights for the publications made accessible in the public portal are retained by the authors and/or other copyright ownersand it is a condition of accessing publications that users recognise and abide by the legal requirements associated with these rights.
Take down policyIf you believe that this document breaches copyright please contact us providing details, and we will remove access to the work immediatelyand investigate your claim.
Download date: 14. Feb. 2019

1
Winning combinations:
Search strategies and innovativeness in the UK
Paola Criscuolo Imperial College Business School, Imperial College London,
South Kensington Campus, London SW7 2AZ, UK, [email protected]
Keld Laursen Department of Innovation and Organizational Economics, Copenhagen Business School,
Kilevej 14A, 2000 Frederiksberg, Denmark, [email protected]
Toke Reichstein Department of Strategic Management and Globalization, Copenhagen Business School,
Kilevej 14A, 2000 Frederiksberg, Denmark, [email protected]
Ammon Salter School of Management, University of Bath,
Building 8 West, Quarry Road, Bath BA2 7AY, UK, [email protected]
Abstract: Searching for the most rewarding sources of innovative ideas remains a key
challenge in management of technological innovation. Yet little is known about which
combinations of internal and external knowledge sources are triggers for innovation.
Extending theories about searching for innovation, we examine the effectiveness of
different combinations of knowledge sources for achieving innovative performance.
We suggest that combinations involving integrative search strategies— combining
internal and external knowledge—are the most likely to generate product and process
innovation. In this context, we present the idea that cognitively distant knowledge
sources are helpful for innovation only when used in conjunction with knowledge
sources that are closer to the focal firm. We also find important differences between
product and process innovation, with the former associated with broader searches than
the latter. Using a large-scale pooled sample of UK firms, we find overall support for
our conjectures, particularly in terms of product innovation.
Keywords: Innovation, openness, innovation search, knowledge integration,
innovative performance.
Paola Criscuolo, Keld Laursen, Toke Reichstein & Ammon Salter (2017): Winning
combinations: search strategies and innovativeness in the UK, Industry and Innovation, DOI:
10.1080/13662716.2017.1286462
2
Introduction
The innovation process is essential to firms’ performance because the ability to innovate is
critical for gaining and sustaining a competitive advantage (see e.g. Nelson and Winter 1982;
Dierickx and Cool 1989; Teece, Pisano, and Shuen 1997; McEvily and Chakravarthy 2002).
The innovation process and how and where firms search for new and novel ideas are
relatively well understood (see Bogers et al. 2017, for a review). Studies have, for instance,
focused on the intra-organizational level, looking at individual-level challenges (see e.g.
Dahlander, O'Mahony, and Gann 2016; Salter, Criscuolo, and Ter Wal 2014; Li et al. 2013)
and organizational features (see e.g. Foss, Laursen, and Pedersen 2011; Colombo, Rabbiosi,
and Reichstein 2011), or the inter-organizational level through, for instance, partnering
(Laursen, Leone, and Torrisi 2010; Leone and Reichstein 2012; Leone et al. 2015). At the
core of these studies is the conceptualization of innovations as the “combining (of) materials
and forces differently” (Schumpeter 1912/34, : 65) and the intrinsic link between innovation
and combinatorial searches. Innovation models and the view of innovation as recombination
of existing bodies of knowledge have been adopted throughout the literature (e.g. Kogut and
Zander 1992; Hargadon and Sutton 1997; Katila and Ahuja 2002; Fleming and Sorenson
2004; Laursen and Salter 2006; see Laursen 2012, , for an overview).
Prior studies have primarily looked at either a single source of knowledge for innovation
or considered external linkages to be a homogenous source (for exceptions see Cassiman and
Veugelers 2006; Grimpe and Sofka 2016; Cassiman and Valentini 2016; Olsen, Sofka, and
Grimpe 2016). Little empirical research on combinatorial searches across organizational
borders has distinguished between multiple sources and investigated the combinations that
are more likely to precipitate innovation. In this paper, we explore the effectiveness of
combinatorial searches using different sources of innovation—including internal research and
development, customers, suppliers, competitors, and universities—on the probability that

3
certain combinations will be associated with a higher probability of innovation within an
organization. Previous research on the sources of innovation highlights the interactive nature
of the innovation process and suggests that organizations rely heavily on their interactions
with actors outside their own boundaries, including lead users, suppliers, and a range of
institutions within the innovation system (von Hippel 1988; Lundvall 1992; Chesbrough
2003). Despite considerable research on the importance of particular sources (see for
instance, Klevorick et al. 1995; von Hippel 2005; Tomlinson 2010; de Faria, Lima, and
Santos 2010; Roper, Du, and Love 2008) and the impact of the level of external knowledge
sources for innovation (see for instance, Vega-Jurado, Gutiérrez-Gracia, and Fernández-de-
Lucio 2009; Grimpe and Sofka 2009; Laursen and Salter 2006; Rothaermel and Alexandre
2009; Tether and Tajar 2008; Leiponen 2012; Antonelli and Colombelli 2015), little is known
regarding which combination of knowledge sources is most conducive to innovation. Given
the importance of sourcing knowledge to achieve more innovation, the lack of information
about “winning combinations” of sources represents a critical gap in our understanding of the
innovation process. We define “winning combinations” as combinations of knowledge
sources that more effectively increase the probability that firms will innovate in terms of
process and/or product compared to alternative combinations.
Drawing on a knowledge-based view of firms, we suggest that integrative sourcing
strategies are likely to be associated with better innovative performance than search
approaches that exclusively focus on either internal or external sources. We also suggest that
broad search combinations are more likely to be associated with innovation and that the use
of proximate knowledge sources will facilitate effective use of more distant sources to enable
innovative outcomes. In addition, building on the fundamental distinction in the literature
between product and process innovation, we explore the different outcomes of combinatorial
searches for each type of innovation. In this context, product innovation involves the

4
development of new, commercialized goods and services, while process innovation involves
changes to the system of production, organization, operations, and logistics for the delivery or
supply of a good or service (Klepper 1997; Utterback 1994). We argue that there are
important differences between product and process innovation in terms of combinatorial
searches, with the former associated with broader searches than the latter. In addition, we
show that the importance of suppliers is increased for process innovation, while the value of
customers is increased for product innovation.
Our empirical analysis exploits data regarding over 6,790 manufacturing and service firms
from two waves of the UK Innovation Survey. We explore how the use of different search
strategies shapes innovativeness in subsequent years. In this context, a “search strategy”
refers to any combination of knowledge sources (ranging from no sources to all sources). For
product innovation, by and large, we find support for our theoretical suggestions, while the
results for process innovation are ambiguous.
Our work theoretically extends the concept of combinatorial searches to include
combinations of internal and external sources of knowledge, helping to deepen and extend
our understanding of how organizations benefit from integrating internal and external
knowledge. In this context, Rosenkopf and Nerkar (2001) address firms’ internal sourcing
versus inter-organizational boundary-spanning in the context of innovation, but they do not
distinguish between the different types of external knowledge sources. Rothaermel and
Alexandre (2009) explicitly address knowledge sourcing across organizational boundaries,
including both internal and external knowledge sourcing. Although they look at the ratio of
external knowledge sourcing to total knowledge sourcing, they also do not distinguish
between different types of external knowledge sources. We suggest that a notion of search
involving integrative search strategies, which include combinations of internal and external
sources, would further our understanding of this phenomenon since it explicitly allows for

5
multiple external knowledge sources.
The search for innovation
Searching for innovation can be defined as “an organization’s problem-solving activities that
involve the creation and recombination of technological ideas” (Katila and Ahuja 2002, :
1184). The search for new combinations of ideas often requires firms to work with many
different actors outside the firm, including consultants, customers, suppliers, and universities
(von Hippel 1988; Lundvall 1992). Additionally, this process can be relational or
transactional (Grimpe and Sofka 2016). These searches require firms to expend considerable
effort to build relationships and understandings in order to absorb knowledge from external
sources (Cohen and Levinthal 1990; Lane and Lubatkin 1998) and obtain the capability to
understand the routines, norms, and habits of different actors’ ways of working (Brown and
Duguid 2000).
A number of empirical studies assess the nature and impact of search strategies on
innovation. For instance, Stuart and Podolny (1996) find that firms search in areas that are
technologically close to their existing patent portfolio. Fleming and Sorenson (2004) focus on
the impact of science on subsequent technological development, finding that science-based
patents are often associated with increased likelihood that a firm will use new combinations
in subsequent search activities. Katila and Ahuja’s (2002) investigation of the impact of
search depth and scope on innovative performance shows that firms can “over-search,” which
can lead to negative performance.
Although these studies expand our understanding of searching and its impact on
innovation, they have some important limitations. First, they tend to focus on technological
searches and measure them according to patent citations. Patent citations are imperfect
measures of innovation searches because they focus on technology and thus may reflect both
technological similarities between the focal patent and the cited patent as well as search

6
activities. Second, by focusing on industries that obtain patents, this research offers little
insight into how external search efforts shape different innovation outcomes in sectors that do
not obtain many patents, such as services. Third, these studies tend to focus on single sources
of knowledge (such as universities) but say little about innovation searches that involve a
variety of sources of knowledge.
These limitations can be overcome by utilizing survey data to map the use of sources of
innovation. Drawing on a survey of UK manufacturing firms, Laursen and Salter (2006) look
at the cumulative effect of using a broad range of individual knowledge sources and suggest
that there are decreasing returns when too many different sources are used. This approach has
been extended by a range of studies that help to more clearly identify the advantages of
external searches for firms in a broad range of countries and industries (e.g., Leiponen 2012;
Leiponen and Helfat 2010; Gruber, MacMillan, and Thompson 2013; Köhler, Sofka, and
Grimpe 2012; Vega-Jurado, Gutiérrez-Gracia, and Fernández-de-Lucio 2009; Lee et al.
2010). However, none of these studies investigate how these different knowledge sources are
combined, relying instead on simple counts of the sources used. This means that they do not
identify beneficial combinations of sources, but provide limited evidence about the different
search patterns related to product and process innovation and often rely purely on cross-
sectional information. The approach proposed in this paper seeks to overcome these
limitations and extend our understanding of combinations of knowledge sources that promote
innovative outcomes.
Hypotheses
When developing innovative ideas, firms tend to rely on what they already know and can do
(Kogut and Zander 1992; Helfat 1994; Katila and Ahuja 2002). Internal knowledge is
inherently very accessible, easily convertible, and well aligned to the operating routines of
the organization (March 1991). In addition, local managers trust internal knowledge since it

7
has been validated by internal processes and experience. However, focusing only on internal
knowledge may lead the organization to forgo opportunities to capture external knowledge,
thus hindering the effectiveness of internal projects because the solutions to problems that
emerge may not be available within the organization. Thus, a “go-it-alone” approach might
cause the firm to miss out on productive new combinations of internal, in-house, and external
knowledge. The problem with local input sources is that they tend not to provide a variety of
inspirations for resolving innovation-related problems as the local search environment may
be limited in terms of opportunities for combination and recombination of knowledge
(Rosenkopf and Nerkar 2001; Fleming and Sorenson 2004).
A purely external search strategy—extreme openness or a “go-all-outside” strategy—
might facilitate the development of new ideas by opening up new areas of knowledge that
differ significantly from a firm’s own knowledge base (March 1991). These external sources
may provide skills and competencies that are far removed from the firm’s current practice
and products and may provide opportunities to learn from the users and developers of
technologies that are new to the firm (von Hippel 2005). Some firms may be attracted to the
low cost and potentially high rewards associated with new open models of innovation
(Chesbrough 2003). This attraction is driven by the belief that external sources will be
effective substitutions for internal investments and enable firms to “outsource” the innovation
process (Rigby and Cook 2002). However, this “go-all-outside” approach could lead to a lack
of integration between the firm’s internal efforts and external sources, causing the knowledge
obtained and ideas developed from these outside sources to be poorly utilized if they are too
distant from and discordant with the organization’s internal knowledge and capabilities.
External sources may offer the allure of novelty, but this novelty will only be valuable if it
can be integrated successfully into the firm’s knowledge base.
8
The knowledge-based view of firms stresses that a firm’s primary task is to integrate
specialized knowledge inputs (Grant 1996b). Knowledge integration is achieved through
mechanisms such as setting rules, creating a common language, generating routines for
integration, and learning to enable effective interactions between specialists performing non-
standardized, complex tasks (Grant 1996a, : 12-14). Thus, the firm must develop high-level
routines for synthesizing different inputs from inside and outside the firm to achieve overall
performance or output that is more than the sum of its parts. Drawing on this logic, we
suggest that those firms that combine internal and external searches are likely to exhibit
higher performance than firms whose searches are either only internal or only external. We
call a strategy that combines internal and external searches an integrative search strategy.
Firms that adopt such a strategy are likely to have higher success rates in process and product
innovation. Accordingly, the external and internal knowledge being combined should be
complementary (i.e. mutually reinforcing, see, Arora and Gambardella 1990; Cassiman and
Veugelers 2006), help to optimize internal search efforts by providing insights and resources
that are not available internally, and increase the effectiveness of external searches by
directing search efforts towards the most productive sources. Based on this background, we
developed the following hypothesis:
H1. Firms that engage in integrative search strategies are more likely to be innovative
than firms that rely on only external or internal sources.
The literature on combinatorial search for innovation suggests that firms that are able to
harness diverse sources of knowledge are more likely to develop and commercialize new
ideas. Developing an innovative idea may require firms to combine knowledge from a range
of different internal and external sources, and by recombining this knowledge, firms will be
able to see opportunities to reuse their existing knowledge in new ways and combine it with
9
new knowledge (Hargadon and Sutton 1997; Laursen and Salter 2006).1 This process of
recombination often involves brokering knowledge from domains where it is common to
those where it is novel (Burt 2004). Brokering requires that a firm is aware of the
opportunities afforded by recombination. Drawing from a diverse range of sources is a strong
signal that a firm has developed the “bandwidth” required to exploit diverse opportunities in
its external environment. Therefore, search strategies that seek to recombine complementary
knowledge from a broad range of sources2 are likely to result in greater opportunities for
innovation than narrower search strategies. Thus, we developed the following hypothesis:
H2. Firms that use broad integrative search strategies are more likely to be innovative
than firms with narrow search strategies.
Not all types of knowledge sources for innovation are equally easy to exploit; some
sources are more cognitively distant from the focal firm. We follow Nooteboom et al. (2007, :
1017) in viewing cognitive distance between organizations as differences in “systems of
shared meanings…established by means of shared fundamental categories of perception,
interpretation and evaluation inculcated by organizational culture.” Here, we suggest that the
cognitive distance of an external source is, in part, a function of whether the type of
organization associated with the source of innovation has economic interests and incentive
systems that are aligned with those of the focal firm. When these interests and incentives are
aligned, it is easier for the focal firm to collaborate with the external source since the former
1 Laursen and Salter argues that the firms that invest in broader external search “…may have a greater
ability to adapt to change and therefore to innovate.” It does not, however, allow for the possibility
of using integrative search strategies involving both internal and external sources of knowledge to
achieve innovation.
2 In the empirical part of the paper, we work with a total of five knowledge sources. In this context,
we consider a strategy consisting of at least three sources to be “broad.”
10
will be exposed to less risk and lower coordination costs. Figure 1 summarizes our arguments
regarding cognitive distance from the focal firm (in terms of economic interests and
incentives) for different sources of innovation and knowledge.
<Insert Figure 1 about here>
Nooteboom (1999, : 5-6) argues that, generally, vertical relationships are likely to be more
successful than horizontal relationships because there is lower risk of misaligned interests and
incentives. Horizontal relationships are likely to be zero-sum games in which the participants
try to capture each other’s market share, which carries a potential risk of defection. Vertical
relationships involving suppliers and/or customers most often involve common interests and
incentives; the more downstream products are sold, the more both parties will benefit.
Universities also often interact with firms due to aligned economic interests, even though
they operate under a different incentive system that rewards disclosure rather than
exploitation of knowledge (Dasgupta and David 1994; D'este and Patel 2007; Roach and
Sauermann 2010; Köhler, Sofka, and Grimpe 2012; Agarwal and Ohyama 2013). This
fundamental difference makes universities a cognitively distant source of innovation for
firms.
The ability to integrate insights, ideas, and bodies of knowledge from these sources, each
of which is associated with a different degree of cognitive distance from the focal firm, is
crucial for effective use of any source or combination of sources. Building on this idea, we
argue that firms that use an integrative search strategy involving cognitively proximate
external knowledge sources will be more likely to benefit from more distant sources of
knowledge. In other words, working with (a combination of) closer knowledge sources
allows a firm to more effectively span more distant boundaries. Certainly, the central problem
with using distant external knowledge sources lies in the fact that this knowledge is unlikely
to fit the pre-existing categories and ways of working in the focal firm (Cohen and Levinthal
11
1990; Lane and Lubatkin 1998). In other words, because external knowledge is developed in
a different organizational context, it is “sticky,” or difficult to utilize in another context (von
Hippel 1998). However, when firms seek to actively align internal and familiar external
knowledge, they are better able to recognize opportunities to use distant external knowledge
in new settings (Hargadon and Sutton 1997). Combining internal knowledge with proximate
external knowledge helps firms more effectively re-package and translate external knowledge
from distant sources. For instance, if proximate knowledge (from internal sources, suppliers,
or customers) is not included in a combination of knowledge sources, it is very difficult for a
focal firm to find uses for (distant) knowledge from universities and competitors in its
innovation process. Fundamentally, these more familiar knowledge sources (internal,
suppliers, customers) can assist the focal firm to find applications for the more distant
knowledge (held by universities and to some extent by competitors). Likewise, knowledge
from competitors may be difficult to integrate into the focal firm’s own innovation projects
because firms do not desire to disclose all aspects of the relevant knowledge. In such cases,
internal and proximate external sources can help fill the gaps in knowledge obtained from
competitors so that it can be productively employed in the innovation process of the focal
firm. Certainly, a firm can turn to its suppliers to help it copy its competitors’ ideas for
products as their suppliers may directly provide machinery, components, or materials to
competitors or be in a position to develop similar machinery, components, or materials for the
focal firm. For example, when Apple worked with Corning to help develop Gorilla Glass, a
durable, scratch-resistant cover glass for the iPhone, its competitors—HTC, Samsung, and
Nokia—later utilized this same product. Based on this, we developed the following
hypothesis:

12
H3. Firms that use cognitively distant knowledge sources are more likely to innovate if
they apply an integrative search strategy that involves cognitively proximate external
knowledge sources.
Studies of innovation commonly highlight the differences between product and process
innovation (Tushman and Anderson 1986; Utterback 1994). Product innovation involves the
creation of technologically new products, while process innovation results in new elements
that alter an organization’s operations and production processes―the flow of materials and
tasks regarding information management and capital equipment―in order to lower costs
and/or ensure better product quality (Utterback 1994; Freeman and Soete 1997; Rosenberg
1976). Product innovations often arise out of interactions with lead users, universities, and
other key sources of innovation (von Hippel 1988; Laursen and Salter 2006; Köhler, Sofka,
and Grimpe 2012). Product innovation requires extensive interaction and the orchestration of
many different internal and external sources of knowledge (Brown and Eisenhardt 1995).
This, in turn, requires that product innovators have strong “combinative capabilities” to
integrate different bodies of knowledge from different sources (Kogut and Zander 1992;
Grant 1996a; Nickerson and Zenger 2004).
Process innovation, on the other hand, has a strong focus on internal processes and
efficiency, indicating that it arises out of local searches. Process innovation is described by
Tushman and Rosenkopf (1992, : 313) as “the most primitive form of innovation,” This
description may reduce the importance of process innovation; several researchers have
demonstrated its relevance to business performance (e.g. Parisi, Schiantarelli, and Sembenelli
2006). Nevertheless, as Rosenberg (1982) suggests, process innovation tends to be “grubby
and pedestrian,” occurring silently within a firm through learning-by-using and learning-by-
doing. As such, process innovation often involves a high level of tacitness since it is
associated with subtle changes to operating routines that are hard to observe and difficult for
13
the firm and others to codify. Process innovations tend to be determined by managerial
decisions about how to best organize the firm in order to maximize the efficiency and
effectiveness of internal procedures, routines, and operations (Tomlinson 2010; He and Wong
2004; Reichstein and Salter 2006). Process innovation, therefore, is simpler, more local, and
requires fewer external searches than product innovation. Thus, we developed the following
hypothesis:
H4. Process innovation is likely to be associated with integrative search strategies that
involve fewer knowledge sources than those associated with product innovation.
Suppliers’ role in shaping process innovation is widely acknowledged (Pavitt 1984; von
Hippel 1988). Process innovations often require manufacturers to work closely with suppliers
of specialized machinery. For example, the implementation of lean production often requires
firms to develop new relationships with suppliers and draw on them for knowledge about
production and delivery times (Womack, Jones, and Roos 1990) or new types or
combinations of technologies. Suppliers themselves can also spur process innovation, as new
components and technologies may allow user firms to reshape their production processes.
Indeed, there is a strong relationship between technologies and components available from
external suppliers and the potential for firms to achieve process innovation.
As mentioned earlier, newer models of innovation highlight the critical role of users
(including customers) in shaping firms’ potential for product innovations. Von Hippel (2005;
2001) describes the central importance of users when drawing out new products from
manufacturers since users may provide a rich tapestry of experience and ideas about how to
improve existing products and may even spur the creation of new products. In many cases,
users are the first to experience the need for a new product, and thus they may be incentivized
to contribute their knowledge and experience as they will often be the first to benefit from a

14
product innovation (von Hippel 1988). Based on this discussion, we present the following
hypotheses:
Hypothesis 5a: Process innovation is associated with search strategies that involve
drawing knowledge from suppliers.
Hypothesis 5b: Product innovation is associated with search strategies that involve
drawing knowledge from customers.
Data and Method
Data and Sample
The goal of our empirical analysis is to determine which combinations of knowledge sources
are more associated with a higher likelihood that a firm will achieve product or process
innovation. To do this, we use data from two consecutive UK Innovation Surveys conducted
in 2005 and 2007. The data for our dependent variables were obtained from the 2007 survey
and the data for our independent and control variables were obtained from the 2005 survey.
Using different data sources for the dependent and independent variables allows us to avoid
common-method bias.
The UK Innovation Surveys were carried out by the Office of National Statistics (ONS) on
behalf of the Department for Business, Innovation and Skills (formerly the Department of
Trade and Industry, or DTI). The UK Innovation Survey is part of the fourth Europe-wide
Community Innovation Survey (CIS) (Robson and Ortmans 2006). The implementation of
these surveys, the types of questions included in the surveys, and the sampling techniques
used follow the guidelines described in the Organisation for Economic Co-operation and
Development’s (OECD) Oslo Manual. The CISs are often described as “subject-oriented”
because they focus on innovating agents rather than technology (Archibugi and Pianta 1996).
Data from these surveys may provide a useful complement to traditional measures of

15
innovation output, such as patent statistics (Cassiman and Veugelers 2006; Leiponen and
Helfat 2011; Mairesse and Mohnen 2002), because they cover a wider range of industries,
including services, and different types of innovative outputs, such as product and process
innovation (Leiponen and Helfat 2010).
The UK Innovation Surveys cover many different aspects of the innovation process. Firms
are asked to report whether they have achieved product and/or process innovation in the
preceding years. Product innovation is defined as “the market introduction of a new good or
service or a significantly improved good or service with respect to its capabilities, such as
quality, user friendliness, software or subsystems,” and process innovation is defined as “the
use of new or significantly improved methods for the production or supply of goods and
services” (DTI 2005). The surveys include questions about other innovation-related activities
such as identifying sources of information that are relevant to innovation and spending for
research and development (R&D). The validity of the CIS questionnaire was established
through a series of pilot studies and pre-testing before its implementation in different
European countries and a number of industries, including manufacturing, services, and
construction (Smith 2005).
The fourth UK Innovation Survey was distributed in 2005 to a sample of 28,000 firms
with 10 or more employees in the manufacturing and services sectors.3 The survey
respondents were generally managing directors, chief financial officers, and R&D managers.
A total of 16,240 firms took part in the survey, corresponding to a response rate of 58
3 The survey was administered at the reporting unit level, with a reporting unit defined as “the
smallest combinations of legal units which have a certain degree of autonomy within an enterprise
group.” Thus, a reporting unit can be assumed to be a firm, which may have more than one business
establishment (e.g., a plant) and can be part of a larger multi-enterprise business entity (i.e., a
group).

16
percent. This high response rate greatly reduces the potential for non-response bias
(Armstrong and Overton 1977, : 396). The sample of firms was determined by the ONS
based on a random sampling of firms with fewer than 250 employees stratified across 23
sectors, 12 regions, and various size bands. All firms with more than 250 employees were
included in the sample. The fifth UK Innovation Survey was sent to 28,000 firms in 2007—
the same set of firms that received the survey in 2005—and achieved a response rate of 53
percent. Because the sample population was the same for both surveys, when we matched
firms using unique identifiers in the fourth survey with information about those firms in the
fifth survey, we achieved a large overlap sample (6,792 firms) that responded to both
surveys.
Although the size of the matched sample is relatively large, there is still the possibility that
the data used in our analysis suffered from selection bias. We checked for this by testing
whether the distribution of the main characteristics of firms affecting their innovative
performance (e.g., size, age, R&D intensity, technological cooperation, use of government
funding to support R&D investment, and participation in a wider corporate group) differed
between the firms that replied to both surveys and those that responded only to the 2005
survey. There were no statistically significant differences between the two groups for most
variables except age. The average age of firms in the overlap sample was 21.7 years,
compared with 19.8 years for those firms that did not respond to the fifth survey. This finding
might be explained by survival bias. However, the correlation between age and our main
independent variables, search strategies, is very low, which suggests that although the two
samples differ in terms of firm age, there are not necessarily differences regarding the
independent variables of interest in this study. In addition, we matched the innovation survey
data to the ONS Inter-Departmental Business Register to obtain information about firms’ age
and ownership.
17
Measuring the impact of different search strategies
To assess the effect of different search strategies on firms’ performance, we follow an
approach similar to those used in the literature to measure complementarities (Ennen and
Richter 2010). In particular, we adopt a system approach (for an application of this approach,
see, e.g., Ichniowski, Shaw, and Prennushi 1997), which derives the relative performance
outcomes of an entire set of variables (26 in our case) through regression analysis. Even
through this approach is not a formal test of complementarity, we prefer it to the interaction
approach, since the latter tests for the presence of complementarity among only a few
variables (typically, two; (e.g., Cassiman and Veugelers 2006).
Measures
Dependent variables. We use three measures of innovative performance: one referring to
product innovation, one to process innovation, and one to the share of sales of innovative
products. Product innovation is measured using an item from the fifth UK Innovation Survey,
which asks firms whether, from 2004 to 2006, they introduced a technologically new or
significantly improved product (good or service). Process innovation is measured in a similar
way, with an item in the questionnaire asking whether firms have used any new or
significantly improved technology for the production or supply of products (goods or
services) from 2004 to 2006. These variables are equal to 1 if the firm introduced a new
product or a new process and 0 otherwise. The share of sales of innovative products are
measured by three items in the questionnaire, which asked firms to report the percentage of
total turnover attributable to products introduced from 2004 to 2006 that were new to the
market, new to the firm, and significantly improved. We use the sum of these three
percentages to determine the returns of product innovations.
Our measures of product and process innovation are similar to those used in a number of
other studies, such as those of Reichstein and Salter (2006), Love et al. (2009), and Leiponen

18
and Helfat (2010), and Foss et al. (2011). Our share of innovative sales measure is also
consistent with prior studies (Mairesse and Mohnen 2002; He and Wong 2004; Cassiman and
Veugelers 2006; Laursen and Salter 2006). These measures allow researchers to explore
innovative outcomes across the entire economy, unlike conventional indicators of innovation
such as citation-weighted patents, which may be relevant only to a small number of sectors.
Moreover, there is a large body of research showing that these measures have strong
predictive validity for explaining a variety of organizational outcomes, including growth in
productivity, sales and employment growth, survival, profits, and the ability to obtain credit
from financial institutions (recent examples include, Love, Roper, and Du 2009; Cefis and
Marsili 2005; Evangelista and Vezzani 2010).
However, these measures have several important limitations. First, they are self-reported,
and thus we cannot be sure that statements about innovative achievement are objectively true.
Although the survey provides some definitions, managers may interpret the information
differently based on their organization’s setting and history. Second, since the data are
confidential, it is not possible to validate the responses with more “objective” measures, such
as patents. Third, our binary measure of innovativeness does not allow us to discriminate
between firms that have introduced only one product or process innovation from those that
have introduced many during the same period. However, our measure examining the share of
sales from innovative products helps to alleviate this shortcoming as it assesses the overall
commercial success of a firm’s product innovations.
Independent variables. Search strategies that combine sources of knowledge are measured
using responses to the fourth UK Innovation Survey, which covers the period from 2002 to
2004. Respondents were asked to assess on a four-point scale (1=“Not Used”; 2=“Low”;
3=“Medium”; 4=“High”) the importance of five sources of knowledge for the firm’s
innovative activities: internal sources, suppliers and consultants, customers, competitors, and

19
universities and other research institutes. These knowledge sources broadly correspond to the
resources and institutions that are considered to be part of the national innovation system
(Lundvall 1992). This definition has been used in several other empirical studies (e.g.,
Laursen and Salter 2006; Leiponen and Helfat 2010; Grimpe and Sofka 2009; Leiponen and
Helfat 2011).
The responses to the questions are converted into binary variables: 1 if the source is of
medium or high importance and 0 if the firm does not use the source or evaluates it as low.
This means that our search strategy, called “internal only,” identifies those firms that rate
internal sources as having medium or high importance and either do not use any other sources
of knowledge or consider them to be of low importance for their innovative activities. This
produces 32 (25) possible innovation search strategies characterized by some combination of
external and internal sources of knowledge. To ensure the reliability of the econometric
estimations, we consider only strategies adopted by 12 or more firms since the inclusion of
less common strategies implies reliance on only a few observations, which could lead to a
breakdown of the parameter estimates (Mili and Coakley 1996). This reduces the number of
examined strategies to 26. Table 1 displays the different search strategies and the number of
firms that adopted them.
Although these search measures allow us to measure the use of different knowledge
sources, they provide only indirect and partial evidence of the depth of searches in each of
these domains. In particular, our measure of internal sources is based on a single item and
does not cover the range of internal sources available to the firm, such as marketing, R&D,
and senior management. Moreover, similar to many other semantic scales, respondents may
interpret terms such as “use” of a source differently, and without a clear definition of “use,” it
is difficult to know the level of use to which the respondent is referring in his or her response.
Also, it is not possible from the survey to identify whether a firm draws on single or multiple

20
partners in its use of an individual source, nor to assess the degree of overlap or past
collaboration between the firm and its sources. Despite these limitations, the survey item does
provide information on the broad range of sources available in the innovation system and
therefore is fairly comprehensive in its coverage of the main sources of knowledge for
innovation.
Control variables. We control for firm size and whether the firm engages in R&D since
these variables often influence innovation performance (Cohen 1995). Firm size is measured
as the number of employees and their full-time equivalents (expressed in logarithms) in 2004.
The extent of the firm’s R&D efforts is determined by two items in the survey: R&D active,
which is equal to 1 if the firm undertakes activities aimed at increasing the stock of
knowledge and using it to create new or improved products or services from 2002 to 2004.
We also control for the human capital of the firm by introducing a measure, share of
scientists and engineers, which is defined as the proportion of scientists and engineers to the
total number of employees in 2004. Another important firm characteristic that may be
correlated with innovative performance is age. We use data from the Inter-Departmental
Business Register, which covers all UK businesses registered for value-added tax purposes,
to measure firm age in years. We include a dummy variable representing whether the firm is
part of a larger organizational group (part of a group), which is equal to 1 if the firm belongs
to an enterprise group, and a dummy representing whether the firm is domestically owned
(domestic) using data from the Inter-Departmental Business Register. We introduce a variable
to control for the size of the perceived product market (market focus). This is measured using
a 4-item scale based on a question asking firms to indicate which of four markets (local,
national, European, or beyond Europe) they perceive to be the largest for their products. This
variable controls for the possibility that firms operating in the international market tend to be
more innovative.

21
We include a binary variable measuring innovation co-operation that controls for whether
or not firms engaged in cooperative R&D with other firms or institutions. Previous studies
have found a relationship between cooperation and innovative performance (e.g., Powell,
Koput, and Smith-Doerr 1996). Although we control for a number of factors that could
predict the innovative performance of companies, we added a dummy variable (active
innovation) that is equal to 1 if the company was actively innovating during the period from
2002 to 2004. This dummy is also equal to 1 if a firm introduced a new or significantly
improved good, service, or process; was engaged in innovation projects that were unfinished
or abandoned at the time of the survey; was engaged in longer-term innovation activity such
as basic R&D; had expenditure in areas such as internal R&D, training, and acquisition of
external knowledge or machinery and equipment linked to innovation activities; or had
formally cooperated on innovation activities with other enterprises or institutions. The
inclusion of this control helps to ensure that our results are not affected if some firms do not
innovate because it is not part of their corporate strategy. This variable is intended to capture
serial correlation between innovative activities and at least partially capture unobserved
factors that drive innovative conduct among firms. We expect some hysteresis in firms’
innovativeness to lead to a positive parameter estimation for this variable. We also introduced
another dummy variable (prior innovations) that is equal to 1 if the firm did not need to be
involved in any innovation activities from 2004 to 2006 because of successful prior
innovations.
Literature on publicly funded R&D (Griliches 1995) suggests that government support for
R&D in the form of tax credits, deductions, grants, or low-interest loans, which increase
investment, can have a positive and significant effect on firms’ innovative performance. We
account for this by including a dummy variable (government funding) that is equal to 1 if the
firm received public financial support for innovation from a regional, national, or European

22
source during the period from 2002 to 2004. Finally, we include seven 1-digit SIC-92
industry dummies to account for differences in the propensity to innovate across industries
(Klevorick et al. 1995).
Econometric method
The analysis relies on three dependent variables. The first two are binary variables
representing the incidence of product and process innovation. Since prior research has
indicated that these two types of innovation are often mutually independent (Reichstein and
Salter 2006), we use a bivariate probit specification, which is a joint model of two binary
outcomes. This model was also applied in the context of product and process innovation by
Hall, Lotti, and Mairesse (2009). This model may generally be specified as follows:
y1=a1+b1x1+u1
y2=a2+b2x2+u2
where y1 and y2 refer to product and process innovation, respectively; a1 and a2 represent the
intercept terms of the two equations, respectively; b1 and b2 are the vectors of the estimated
parameters; x1 and x2 are the vectors of explanatory and control variables, respectively; and
u1 and u2 are the two estimated error terms, respectively. In this paper, we consider a case in
which x1 and x2 contain the same sets of explanatory and control variables. It is important to
note that even if the two sets of variables in x are the same, we cannot assume that b1 and b2
are equal as well. If product (y1) and process (y2) innovation are independent from each other,
the error terms (u1 and u2) become uncorrelated (ρ=0) and the two equations boil down into
two separate probit models. If the two types of innovation are correlated (ρ≠0), the estimated
probabilities become a function of the joint estimated parameters of the two equations. The
correlations between the error terms need not be due to their complementarity; they may
appear due to the influence of common unobservable factors.

23
To test the robustness of the results with regard to product innovation, we employed a
third dependent variable, share of sales from product innovation. This measure has been
utilized by many other studies using similar data (see e.g., Cassiman and Veugelers 2006; He
and Wong 2004; Mairesse and Mohnen 2002; Laursen and Salter 2006). This measure
overcomes some of the shortfalls of binary measures of product innovation and acts a
robustness check for our bivariate probit results. For this dependent variable, we use a tobit
specification since the share of sales from innovations is significantly skewed to the right and
is truncated at 0 and 100.
Results
Descriptive Statistics
Table 1 contains some descriptive statistics and shows the distribution of the search
strategies. Although the most popular strategy is to not engage in any search activities, with
1,977 firms opting for this approach (29.0 percent), we find that many firms search broadly
and combine internal and external sources of knowledge. Indeed, these combinatorial search
strategies are much more common than strategies involving only internal or only external
sources of knowledge. It is interesting to note that strategies relying on only one source of
knowledge are less popular than strategies relying on multiple sources, which suggests that
most firms seek to combine knowledge from a range of sources. The most popular search
strategy involves internal sources, suppliers, customers, and competitors (1,255 firms; 18.5
percent), while the least-used strategy is sourcing knowledge from only suppliers and
universities (12 firms; 0.2 percent).
Looking at the descriptive statistics of the dependent variables, 15.0 percent of the firms
engage in process innovation and 24.5 percent engage in product innovation. The average
share of sales from innovative products is 7.4 percent. Regarding the control variables, more
24
than a third of the firms are part of a wider corporate group and a similar proportion are
foreign-owned. From 2002 to 2004, more than a quarter of firms invested in R&D, and 14.8
percent engaged in innovative collaborative agreements.
Given space limitations, we do not report the full correlation in Table 1.4 However, the
table clearly shows that the tetrachoric correlation between the innovation dummies is 0.71,
which indicates that the bivariate probit may be the right choice for the multivariate analysis.
The other correlation estimates tend to be very low, suggesting that there is little reason for
concern regarding multicollinearity. This was confirmed by a variance inflation factor (VIF)
analysis, which resulted in VIFs below 4.5.
<Insert Table 1 about here>
Regression results
Table 2 shows the coefficient estimates of the bivariate probit. Before commenting on the
results, note that the estimated correlation coefficient of the error terms is always positive and
significant, indicating that product and process innovations are influenced by a common
unobservable factor and that it is important to simultaneously model product and process
innovation outcomes. Thus, the bivariate model appears to be a highly appropriate estimation
method.
<Insert Table 2 about here>
The first two columns in Table 2 show the estimates of our baseline model, which includes
only the control variables. The coefficients of this model are consistent with the findings of
previous innovation literature and, more importantly, do not vary much in magnitude or
significance when we include our main independent variables.
4 These are available upon request.

25
The last two columns in Table 2 report the results of the full model. To assess the
magnitude of the coefficient estimates, we calculate the marginal predicted probability of
achieving a product (or process) innovation using the bivariate probit estimations, with all
other independent variables set at their means. Table 3 reports these predicted probabilities.
For example, firms drawing on internal sources, customers, and universities are 22.6 percent
more likely to engage in product innovation compared to companies not engaging in search
activities. Similarly, we found that firms that use suppliers and universities as sources of
knowledge are 16.5 percent more likely also to engage in process innovation than companies
not engaging in search activities.
<Insert Table 3 about here>
In a similar fashion, we ran tobit regressions against the share of sales from innovations.
These results are presented in Table 4. The overall results are comparable to those of the
product innovation equation in the bivariate probit regression in terms of control variables.
The search strategy variables also exhibit substantial overlap in patterns of significance,
providing some support for our initial regression results.
<Insert Table 4 about here>
To identify the best strategies for each of the innovation outcomes, we test each coefficient
estimate against the others. The results of these Wald tests regarding product innovation,
process innovation, and share of sales from product innovation are reported as matrices in
Tables 5, 6, and 7, respectively. The tables also contain the estimated coefficients of each
strategy. Stars in the cells indicate significant differences between the strategies in the
corresponding column and row at different levels of significance. To simplify the
interpretation of our findings, we report only the results of a significant Wald test when the
coefficient in the row is greater than the coefficient in the corresponding column. This should
help to identify winning strategies (i.e., those having a significantly more pronounced

26
association with product or process innovation). Cells without stars therefore indicate that the
two strategies being compared do not have significantly different associations with
innovation outcomes or that the coefficient estimate of the strategy in the column is
statistically significantly smaller than the coefficient of the strategy in the row.
The results of the Wald tests confirm that the search strategy including internal sources,
customers, and universities (strategy 21) has a pronounced association with product
innovation (see Table 5). Strategies 22, 23, and 25 exhibit equally strong associations with
the likelihood of introducing a product innovation and display even higher coefficients. All of
these strategies involve suppliers and competitors, suppliers and universities, and competitors
and universities, respectively, as well as customers and internal sources. Our results suggest
that strategies employing only one knowledge source, whether external or internal to the firm,
are less likely to be associated with successful innovation, indicating that combinatorial
strategies outperform single-source approaches.5 In general, the findings suggest that
combinations involving both internal and external knowledge sources are more likely to lead
to product innovation than strategies that use only external sources of knowledge. Indeed, the
results regarding product innovation are consistent with Hypothesis 1, indicating that
integrative search strategies are advantageous for innovation. Regarding process innovation
(see Table 6), the results are less clear since firms using strategies 16 and 19—which involve
internal sources—do not perform better than several strategies (7, 8, 11, and 12) that do not
involve internal sources. Thus, while process innovation requires combinatorial searches, it
seems unnecessary to combine external and internal sources.
5 We tested the equality of the coefficients for all strategies using only one search channel and found
that we cannot reject the null hypothesis (p-value=0.603). In other words, they all have the same
effect in terms of likelihood of product innovation. The results regarding the equality of coefficients
for strategies involving only one or two search strategies were similar (p-value=0.254).

27
<Insert Table 5 about here>
<Insert Table 6 about here>
<Insert Table 7 about here>
Overall, the findings regarding product innovation support Hypothesis 2 as they suggest
that, on average, broad combinatorial strategies are associated with better outcomes than
narrow strategies for both product and process innovation. Again, the results are less clear
regarding process innovation (see Table 5) in Hypothesis 2. Three of the best-performing
strategies (7, 8, and 12) do not include internal sources, and two include only two sources (7
and 8). Overall, our results regarding process innovation do not support Hypothesis 2.
Hypothesis 3 states that firms that use cognitively distant knowledge sources will be more
likely to innovate if they use an integrative search strategy involving external knowledge
sources that are cognitively proximate. For product innovation (see Table 5), we find
evidence supporting this hypothesis since the most cognitively distant sources (or search
channels), competitors and/or universities, exhibit significantly larger coefficients than other
strategies only when combined with internal sources and at least one other external source
that is cognitively closer to the focal firm. As previously mentioned, strategy 21 displays the
highest coefficients of the 26 strategies investigated. It involves internal and cognitively close
(customers and suppliers) sources as well as a cognitively distant (universities) source. The
strategy using only universities (strategy 5) is associated with by far the lowest coefficient
regarding the likelihood of introducing new innovations, confirming Hypothesis 2. Again, the
picture is less clear for process innovation (see Table 6), yet there is some evidence to
support Hypothesis 2. Strategy 5 (universities only) is ranked significantly lower than 20
other strategies, and strategy 3 (suppliers only) is ranked lower than 15 other strategies. In
general, combinatorial strategies that include universities do not tend to be associated with
high levels of process innovation. While somewhat weak, these findings do provide some
28
evidence in favor of Hypothesis 3. We nevertheless have to conclude that, in the case of
process innovation, the hypothesis is only partially supported.
Hypothesis 4 is concerned with differences in the importance of broad combinatorial
searches for product and process innovation. The results provide partial support for this view;
the strategies associated with the highest likelihood of product innovation are broad, but for
process innovation, narrow search strategies do not seem to be associated with lower
likelihood of innovation than broad strategies. In fact, in the process innovation regression,
some of the strategies involving only two sources (7 and 8) were equally ranked with
strategies that involve multiple sources (16 and 19). This suggests that process innovation
may require less combinatorial novelty because it involves more modest types of innovative
achievement.6 However, it is also clear that some of the strategies associated with the highest
likelihood of process innovation involve a range of sources (in particular, strategies 12 and
23). Given this, our results are not definitive.
Consistent with Hypothesis 5a, we find that suppliers as a source of knowledge increase
the likelihood that a firm also is engaged in process innovation as almost all of the winning
strategies include this source (7, 8, 12, 13, 22, and 23). In line with Hypothesis 5b, for
product innovation, customers are most often part of a winning combination; customers are
involved in all of the highest-ranked strategies (17, 20, 21, 22, 23, 25, and 26).
Table 7 presents the corresponding comparisons using the results of the tobit regression as
inputs. These results generally confirm the results of the bivariate probit analysis for product
innovation. Yet, there are some discrepancies between Tables 5 and 7. For instance, strategies
6 This is confirmed by the fact that when we test whether all the coefficients of search strategies
employing one or two sources are the same using only one search channel, we can reject the null
hypothesis (p-value=0).

29
7 and 8 are highly associated with firms with a high share of sales from product innovations,
even if they involve only two sources of knowledge.
As a robustness check, we re-ran all our models using a higher threshold (50 firms per
strategy group), and reducing the number of strategies to 15 (by excluding 4, 5, 7, 8, 11, 12,
15, 16, 19, 21, 24, and 25). The results of this robustness check are consistent with the results
reported above. We also re-estimated the models using a standard probit estimation
procedure, the results of which are consistent with those obtained using the more appropriate
bivariate probit model. To check the robustness of our tobit model estimations, we exclude
those firms that did not actively engage in innovation from 2002 to 2004. This excluded
2,358 firms from the analysis. Again, the results are consistent with those reported in Tables
4 and 7. We also tested whether the results are robust to the exclusion of the share of
innovative sales that firms have attributed to the launch of significantly improved products.
Also, in this case, we found that the coefficients’ estimates are consistent with those
presented in Tables 4 and 7.
Discussion and conclusion
By bringing together arguments regarding the benefits of combinatorial searches in the
distributed innovation literature, we aimed to cast new light on which combinations of
knowledge sources provide the greatest opportunities for subsequent innovation. We have
tried to advance understanding about the nature and type of external sources that shape
innovative outcomes by extending knowledge about the utility of sources of innovation. In
general, the results are consistent with our expectations, especially for product innovation.
The results for process innovation are more ambiguous. In the context of product innovation,
we found clear evidence of the importance of adopting strategies involving integrative search
combinations. These results demonstrate that sources of innovation should be viewed as a
mutually reinforcing system and that it could be risky for firms to rely on a single source or a

30
small number of internal or external knowledge sources to spur innovation. Indeed, the “go-
it-alone” strategy of using only internal sources and the “go-all-outside” strategy of using
only external sources are generally less effective than using a strategy that combines internal
and external knowledge.
Apart from the cognitive problems associated with an effective combinatorial search
process, type of innovation appears to predetermine which combination will provide the
highest payoff. This paper shows that the strength of association with innovation performance
of different search combinations are contingent on the type of innovation being considered. In
this regard, we found important differences between product and process innovation. In
general, process innovation appears to require narrower searches than product innovation.
This suggests that process innovations requires less combinatorial novelty than product
innovation and therefore that process innovation may be a less complex form of innovation in
terms of knowledge sources. This is not to say that process innovation is straightforward or
simple; it may involve significant organizational change.
We contribute to the literature on open and distributed innovation. In this context, we can
confirm the importance of users―especially for product innovation―as suggested by
previous research on the innovation process (see for instance, Urban and von Hippel 1988;
Bogers, Afuah, and Bastian 2010). Customers as a source of knowledge were always
included in our winning combinations. The literature on user innovation tends to focus on the
importance of users for stimulating innovation, but our findings point to the limitations of
using single sources of innovation. This leads to a more general contribution: rather than
assessing the effects of a specific knowledge source for innovation, which is common in the
distributed innovation literature, the present study analyzes the impact of particular
combinations of knowledge sources.
31
We also contribute to the literature on knowledge integration and innovation. We extend
the strand of research that addresses inter-organizational aspects by explicitly accounting for
the fact that external knowledge sources are heterogeneous. It is not just a question of how
much external knowledge the firm can exploit in its innovation processes; we must also
consider the type of knowledge being used and how it is combined with other types of
knowledge. In this context, we believe that our notion of an integrative search strategy may
be useful. We also show that searches aimed at cognitively distant knowledge sources are
only helpful for product innovation when used in conjunction with knowledge sources that
are closer to the focal firm. This is an important addition to the literature that considers
organizational boundary-spanning to be a dichotomous variable (Rothaermel and Alexandre
2009; Rosenkopf and Nerkar 2001).
Our paper has some implications for management. First, it is dangerous for managers to
use “go-it-alone” or “go-all-outside” approaches when pursuing innovation. Second, it is
important for managers to try to develop integrative search strategies that combine internal
and external sources of knowledge, particularly for product innovation. They need also to
develop routines to assimilate and synthesize the specific skills and competencies of different
sources. Third, we found that, for product innovation to benefit from distant sources of
knowledge, it is useful for the firm to combine this knowledge with the ideas and experiences
of more proximate sources, such as customers and suppliers. This suggests that using
proximate sources of knowledge may spur more successful, distant search efforts.
Limitations and directions for future research
Analysis of the implications of combining complementary sources of knowledge for
innovation is complicated and requires one to simplify assumptions in order to make the
analysis tractable. As a result, the results of this paper should be interpreted cautiously. The
present study was limited to exploring search strategies, and although we include a measure

32
of the use of internal sources, it is somewhat rough and does not tell us much about the ways
in which external sources of knowledge are integrated into internal innovation practices
(Foss, Laursen, and Pedersen 2011). A second limitation of this study is related to possibility
of overemphasizing the dependent variable, the distinction between innovators and non-
innovators. It does not reveal anything about the amount of projects developed, it does not
consider their scale, and it does not consider the rate of successful innovation projects.
However, although our dependent variable is simple, our findings regarding the ratio of sales
of new products to total sales did produce results that are reasonably consistent with the
results pertaining to the distinction between innovators and non-innovators. Third, also
pertaining to the dependent variable, many firms may survive on past innovations or may be
able and willing to innovate in the future. Although our lagged structure to measure
innovativeness and searches and our use of a control for prior innovation may mitigate this
concern, it is not fully addressed. Fourth, by comparing the performance of the most common
search strategies, we overlook less common combinations that may be highly advantageous
for innovative performance. Thus, this study identifies winning combinations from among the
most common strategies, but not necessarily the absolute best combinations. Fifth, the search
strategies of firms can hardly be considered exogenous to the firm’s innovation performance.
We do believe that the fine-grained distinction between strategies only separated with one or
two sources makes endogeneity as a source of bias less likely. But we cannot completely rule
this out. Finally, by using a systems approach, we have not conducted formal tests of
complementarity. Future research should attempt to apply such formal tests when appropriate
statistical methods become available. This study suggests several avenues for further
research. It would be useful to know whether choosing different combinatorial search
strategies influences the degree of novelty or “radicalness” of innovations. It could also map
combinatorial search strategies over time to explore how search efforts evolve. This paper has
33
theorized and demonstrated that integrative search strategies combining internal and external
knowledge allow the greatest possibility for generation of novel ideas. In doing so, we have
advanced the understanding of “winning combinations” of knowledge sources for achieving
innovative outcomes, which adds to our understanding of the sources and determinants of
innovation.
References
Agarwal, Rajshree, and Atsushi Ohyama. 2013. "Industry or Academia, Basic or Applied? Career
Choices and Earnings Trajectories of Scientists." Management Science 59 (4):950-70. doi: doi:
10.1287/mnsc.1120.1582
Antonelli, Cristiano, and Alessandra Colombelli. 2015. "External and Internal Knowledge in the
Knowledge Generation Function." Industry and Innovation 22 (4):273-98. doi:
10.1080/13662716.2015.1049864.
Archibugi, D., and M. Pianta. 1996. Innovation surveys and patents as technology indicators: the
state of the art. Edited by OECD, Innovation, Patents, and Technological Strategies. Paris:
OECD.
Armstrong, J. S., and T. S. Overton. 1977. "Estimating non-response bias in mail surveys." Journal
of Marketing Research 14 (3):396–402.
Arora, Ashish, and Alfonso Gambardella. 1990. "Complementarities and external linkages: the
strategies of the large firms in biotechnology." The Journal of Industrial Economics 38 (4):361-
79.
Bogers, Marcel, Allan Afuah, and Bettina Bastian. 2010. "Users as Innovators: A Review, Critique,
and Future Research Directions." Journal of Management 36 (4):857-75.
Bogers, Marcel, Ann-Kristin Zobel, Allan Afuah, Esteve Almirall, Sabine Brunswicker, Linus
Dahlander, Lars Frederiksen, Annabelle Gawer, Marc Gruber, and Stefan Haefliger. 2017. "The
open innovation research landscape: Established perspectives and emerging themes across
different levels of analysis." Industry and Innovation 24 (1):8-40.
Brown, J. S., and P. Duguid. 2000. The social life of information. Boston, Massachusetts: Harvard
Business School Press.
Brown, S. L., and K. M Eisenhardt. 1995. "Product development: Past research, present findings
and future directions." Academy of management review 20 (2):343-78.
Burt, R. S. 2004. "Structural holes and good ideas." American Journal of Sociology 110 (2):349-
99.
Cassiman, Bruno, and Giovanni Valentini. 2016. "Open innovation: Are inbound and outbound
knowledge flows really complementary?" Strategic Management Journal 37 (6):1034-46.
34
Cassiman, Bruno, and Reinhilde Veugelers. 2006. "In Search of Complementarity in Innovation
Strategy: Internal R&D and External Knowledge Acquisition." Management Science 52 (1):68-
82.
Cefis, Elena, and Orietta Marsili. 2005. "A matter of life and death: innovation and firm survival "
Industrial and Corporate Change 14 (6):1167 - 92.
Chesbrough, H. 2003. Open innovation. Cambridge, Massachusetts: Harvard University Press.
Cohen, W. M. 1995. "Empirical studies of innovative activity." In Handbook of the economics of
innovation and technological change, edited by Paul Stoneman, 342-65. Oxford: Blackwell.
Cohen, Wesley M., and Daniel A. Levinthal. 1990. "Absorptive capacity: A new perspective of
learning and innovation." Administrative Science Quarterly 35:128-52.
Colombo, Massimo G, Larissa Rabbiosi, and Toke Reichstein. 2011. "Organizing for external
knowledge sourcing." European Management Review 8 (3):111-6.
D'este, P., and P. Patel. 2007. "University–industry linkages in the UK: what are the factors
underlying the variety of interactions with industry? ." Research Policy 36 (9):1295-313.
Dahlander, Linus, Siobhan O'Mahony, and David M Gann. 2016. "One foot in, one foot out: how
does individuals' external search breadth affect innovation outcomes?" Strategic Management
Journal 37 (2):280–302.
Dasgupta, P., and P. David. 1994. "Towards a new economics of science." Research Policy 23
(5):487-522.
de Faria, P., F. Lima, and R. Santos. 2010. "Cooperation in innovation activities: The importance of
partners." Research Policy 39 (8):1082-92. doi: 10.1016/j.respol.2010.05.003.
Dierickx, I., and K. Cool. 1989. "Asset stock accumulation and sustainability of competitive
advantage." Management Science 35:1504-11.
DTI. 2006. "UK Innovation Survey." Department of Trade and Industry, Accessed June.
http://www.dti.gov.uk/files/file9673.pdf.
Ennen, Edgar, and Ansgar Richter. 2010. "The Whole Is More Than the Sum of Its Parts: Or Is It?
A Review of the Empirical Literature on Complementarities in Organization." Journal of
Management 36 (1):207-33.
Evangelista, R., and R. Vezzani. 2010. "The economic impact of technological and organizational
innovations. A firm-level analysis." Research Policy 39 (10):1253-63.
Fleming, Lee, and Olav Sorenson. 2004. "Science as a map in technological search." Strategic
Management Journal 25 (8/9):909-28.
Foss, NJ., K. Laursen, and T. Pedersen. 2011. "Linking customer interaction and innovation: The
mediating role of new organizational practices." Organization Science 22 (4):980–99.
Freeman, Christopher, and Luc L.G. Soete. 1997. The Economics of Industrial Innovation. London:
Pinter.
35
Grant, R.M. 1996a. "Toward a knowledge-based theory of the firm." Strategic Management
Journal 17 (S2):109-22.
Grant, Robert M. 1996b. "Prospering in Dynamically-Competitive Environments: Organizational
Capability as Knowledge Integration." Organization Science 7 (4):375-87.
Griliches, Z. 1995. "R&D and Productivity." In Handbook of Industrial Innovation, edited by P.
Stoneman, 52-89. Blackwell Press, London.
Grimpe, Christoph, and Wolfgang Sofka. 2009. "Search Patterns and Absorptive Capacity: Low-
and High-Technology Sectors in European Countries." Research Policy 38 (3):495–506.
Grimpe, Christoph, and Wolfgang Sofka. 2016. "Complementarities in the search for innovation—
Managing markets and relationships." Research Policy 45 (10):2036-53.
Gruber, Marc, Ian C. MacMillan, and James D. Thompson. 2013. "Escaping the Prior Knowledge
Corridor: What Shapes the Number and Variety of Market Opportunities Identified Before
Market Entry of Technology Start-ups?" Organization Science 24 (1):280-300. doi:
10.1287/orsc.1110.0721.
Hall, B. H., F. Lotti, and J. Mairesse. 2009. "Innovation and productivity in SMEs: empirical
evidence for Italy " Small Business Economics 33 (1):13-33.
Hargadon, A., and R. Sutton. 1997. "Technology brokering and innovation in a product
development firm." Administrative Science Quarterly 42 (4):716-49.
He, Z., and P. Wong. 2004. "Exploration vs. Exploitation: An Empirical Test of the Ambidexterity
Hypothesis." Organization Science 15 (4):481-94.
Helfat, C. 1994. "Evolutionary Trajectories in Petroleum Firm R&D." Management Science
40:1720-47.
Ichniowski, Casey, Kathryn Shaw, and Giovanna Prennushi. 1997. "The Effects of Human
Resource Management Practices on Productivity: A Study of Steel Finishing Lines." American
Economic Review 87 (3):291-313.
Katila, R., and G. Ahuja. 2002. "Something old, something new: A longitudinal study of search
behaviour and new product introduction." Academy of Management Journal 45 (8):1183-94.
Klepper, Stephen. 1997. "Industry Life Cycles." Industrial and Corporate Change 86 (3):562-83.
Klevorick, A.K., R.C. Levin, R.R. Nelson, and S.G. Winter. 1995. "On the sources and significance
of interindustry differences in technological opportunities." Research Policy 24 (2):185-205.
Kogut, Bruce , and Udo Zander. 1992. "Knowledge of the Firm, Combinative Capabilities, and the
Replication of Technology." Organization Science 3 (3):383-97.
Köhler, Christian, Wolfgang Sofka, and Christoph Grimpe. 2012. "Selective search, sectoral
patterns, and the impact on product innovation performance." Research Policy 41 (8):1344-56.
doi: http://dx.doi.org/10.1016/j.respol.2012.03.020.

36
Lane, P. J., and M. Lubatkin. 1998. "Relative absorptive capacity and interorganizational learning."
Strategic Management Journal 19 (5):461-77.
Laursen, K. 2012. "'Keep searching and you'll find: What do we know about variety creation
through firms' search activities for innovation?" Industrial and Corporate Change 21 (5):1181-
220. doi: doi:10.1093/icc/dts025.
Laursen, Keld, Maria Isabella Leone, and Salvatore Torrisi. 2010. "Technological exploration
through licensing: new insights from the licensee’s point of view." Industrial and Corporate
Change 19 (3):871-97.
Laursen, Keld, and Ammon J. Salter. 2006. "Open for Innovation: The role of openness in
explaining innovative performance among UK manufacturing firms." Strategic Management
Journal 27 (2):131-50.
Lee, Sungjoo, Gwangman Park, Byungun Yoon, and Jinwoo Park. 2010. "Open innovation in
SMEs—An intermediated network model." Research Policy 39 (2):290-300. doi:
http://dx.doi.org/10.1016/j.respol.2009.12.009.
Leiponen, A., and C. E. Helfat. 2010. "Innovation Opportunities, Knowledge Sources, and the
Benefits of Breadth." Strategic Management Journal 31 (2):224-36.
Leiponen, Aija. 2012. "The benefits of R&D and breadth in innovation strategies: a comparison of
Finnish service and manufacturing firms." Industrial and Corporate Change 21 (5):1255-81.
doi: 10.1093/icc/dts022.
Leiponen, Aija, and Constance E. Helfat. 2011. "Location, Decentralization, and Knowledge
Sources for Innovation." Organization Science 22 (3):641-58.
Leone, Maria Isabella, and Toke Reichstein. 2012. "Licensing‐in fosters rapid invention! the effect
of the grant‐back clause and technological unfamiliarity." Strategic Management Journal 33
(8):965-85.
Leone, Maria Isabella, Toke Reichstein, Paolo Boccardelli, and Mats Magnusson. 2015. "License
to learn: an investigation into thin and thick licensing contracts." R&D Management 46 (2):326-
40.
Li, Qiang, Patrick G. Maggitti, Ken G. Smith, Paul E. Tesluk, and Riitta Katila. 2013. "Top
Management Attention to Innovation: The Role of Search Selection and Intensity in New
Product Introductions." Academy of Management Journal 56 (3):893-916. doi:
10.5465/amj.2010.0844.
Love, J.H., S. Roper, and J. Du. 2009. "Innovation, ownership and profitability." International
Journal of Industrial Organization 27:424-34.
Lundvall, Bengt-Åke. 1992. "National Systems of Innovation: Towards a Theory of Innovation and
Interactive Learning." In. London: Pinter Publishers.
Mairesse, J., and P. Mohnen. 2002. "Accounting for Innovation and Measuring Innovativeness: An
Illustrative Framework and an Application." American Economic Review 92 (2):226-31.

37
March, J. G. 1991. "Exploration and Exploitation in Organization Learning." Organization Science
2 (1):71-87.
McEvily, S.K., and B. Chakravarthy. 2002. "The Persistence of Knowledge-based Advantage: An
Empirical Test for Product Performance and Technological Knowledge." Strategic
Management Journal 23 (4):285-305.
Mili, L., and C. W. Coakley. 1996. "Robust estimation in structured linear regression." The Annals
of Statistics 24 (6):2593-607.
Nelson, R.R., and S. Winter. 1982. An Evolutionary Theory of Economic Change. Cambridge,
Massachusetts: Harvard University Press.
Nickerson, Jackson, and Todd Zenger. 2004. "A Knowledge-based Theory of the Firm: The
Problem-Solving Perspective." Organization Science 15 (6):617–32.
Nooteboom, Bart. 1999. Inter-Firm Alliances. Analysis and Design. London: Routledge.
Nooteboom, Bart, Wim Van Haverbeke, Geert Duysters, Victor Gilsing, and Ad van den Oord.
2007. "Optimal cognitive distance and absorptive capacity." Research Policy 36 (7):1016–34.
Olsen, Anders, Wolfgang Sofka, and Christoph Grimpe. 2016. "Coordinated Exploration for Grand
Challenges: The Role of Advocacy Groups in Search Consortia." Academy of Management
Journal 59 (6):2232-55. doi: 10.5465/amj.2015.0730.
Parisi, M., F. Schiantarelli, and A. Sembenelli. 2006. "Productivity, innovation and R&D: Micro
evidence for Italy." European Economic Review 50 (8):2037-61.
Pavitt, K.L.R. 1984. "Sectoral patterns of technical change: towards a taxonomy and a theory."
Research Policy 13 (6):343-73.
Powell, W. W., K. W. Koput, and L. Smith-Doerr. 1996. "Interorganizational collaboration and the
local of innovation: Networks of learning in biotechnology." Administrative Science Quarterly
41:116-45.
Reichstein, T., and A. Salter. 2006. "Investigating the sources of process innovation among UK
manufacturing firms." Industrial and Corporate Change 15 (4):653–82.
Rigby, D., and C. Cook. 2002. "Open-Market Innovation " Harvard Business Review October:80-
9.
Roach, Michael, and Henry Sauermann. 2010. "A taste for science? PhD scientists’ academic
orientation and self-selection into research careers in industry." Research Policy 39 (3):422–34.
Robson, S., and L. Ortmans. 2006. "First findings from the UK Innovation Survey, 2005."
Economic Trends 628 (March):58-64.
Roper, S., J. Du, and J. Love. 2008. "Modelling the innovation value chain." Research Policy 37
(6):961-77.
Rosenberg, N. 1976. Perspectives on Technology. Cambridge: Cambridge University Press.
38
Rosenberg, Nathan. 1982. Inside the Black Box: Technology and Economics. Cambridge, UK:
Cambridge University Press.
Rosenkopf, L., and A. Nerkar. 2001. "Beyond local research: boundary-spanning, exploration, and
impact in the optical disk industry." Strategic Management Journal 22 (4):287-306.
Rothaermel, F.T., and M.T. Alexandre. 2009. "Ambidexterity in technology sourcing: The
moderating role of absorptive capacity." Organization Science 20 (4):759-80.
Salter, Ammon, Paola Criscuolo, and Anne LJ Ter Wal. 2014. "Coping with Open Innovation."
California Management Review 56 (2):77-94.
Schumpeter, J. A. 1912/34. The Theory of Economic Development: An Inquiry into Profits, Capital,
Credit, Interest and the Business Cycle. Translated by R. Opie. London: Oxford University
Press.
Smith, K. 2005. "Measuring Innovation." In The Oxford Handbook of Innovation, edited by J.
Fagerberg, D. C. Mowery and R. R. Nelson, 148-79. Oxford: Oxford University Press.
Stuart, T., and J. Podolny. 1996. "Local search and the evolution of technological capabilities."
Strategic Management Joural 17 (Special Issue: evolutionary perspectives on strategy
(Summer)):21-38.
Teece, D. J., G. Pisano, and A. Shuen. 1997. "Dynamic capabilities and strategic management."
Strategic Management Journal 18:509-33.
Tether, BS, and A Tajar. 2008. "Beyond industry-university links: Sourcing knowledge for
innovation from consultants, private research organisations and the public science-base."
Research Policy 37 (6/7):1079-95.
Tomlinson, P. R. 2010. "Co-operative ties and innovation: Some new evidence for UK
manufacturing." Research Policy 39 (6):762-75. doi: 10.1016/j.respol.2010.02.010.
Tushman, M. L., and P. Anderson. 1986. "Technological discontinuities and organizational
environments." Administrative Science Quarterly 31:439-65.
Urban, G. L., and E. von Hippel. 1988. "Lead user analysis for development of new industrial
products." Management Science 34 (5):569-82.
Utterback, James M. 1994. Mastering the Dynamics of Innovation. Boston: Harvard Business
School Press.
Vega-Jurado, Jaider, Antonio Gutiérrez-Gracia, and Ignacio Fernández-de-Lucio. 2009. "Does
external knowledge sourcing matter for innovation? Evidence from the Spanish manufacturing
industry." Industrial and Corporate Change 18 (4):637-70.
von Hippel, E. 1998. "Economics of product development by users: the impact of "sticky" local
information." Management Science 44 (5):629-44.
von Hippel, E. 2001. "User toolkits for innovation." Journal of Product Innovation Management
18 (4):247-57.
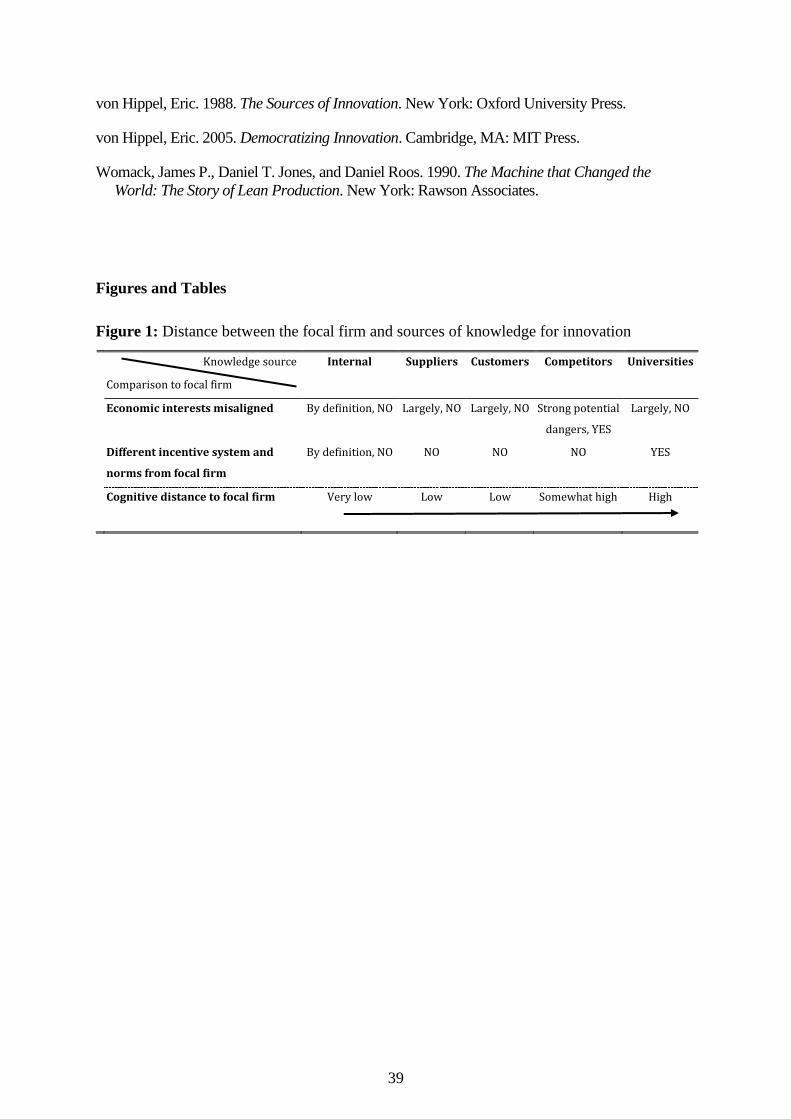
39
von Hippel, Eric. 1988. The Sources of Innovation. New York: Oxford University Press.
von Hippel, Eric. 2005. Democratizing Innovation. Cambridge, MA: MIT Press.
Womack, James P., Daniel T. Jones, and Daniel Roos. 1990. The Machine that Changed the
World: The Story of Lean Production. New York: Rawson Associates.
Figures and Tables
Figure 1: Distance between the focal firm and sources of knowledge for innovation
Knowledge source Internal Suppliers Customers Competitors Universities
Comparison to focal firm
Economic interests misaligned By definition, NO Largely, NO Largely, NO Strong potential
dangers, YES
Largely, NO
Different incentive system and
norms from focal firm
By definition, NO NO NO NO YES
Cognitive distance to focal firm Very low Low Low Somewhat high High

40
Table 1 Search strategies and descriptive statistics
Variable ID #firm Mean Std. Dev.
Search Strategies
No Sources 0 1977 0.29 0.454
Internal sources only 1 164 0.024 0.154
Suppliers only 2 197 0.029 0.168
Customers only 3 147 0.022 0.146
Competitors only 4 25 0.004 0.061
Universities only 5 13 0.002 0.044
Suppliers & Customers 6 206 0.03 0.172
Suppliers & Competitors 7 27 0.004 0.063
Suppliers & Universities 8 12 0.002 0.042
Customers & Competitors 9 122 0.018 0.133
Suppliers, Customers & Competitors 10 273 0.04 0.196
Suppliers, Customers & Universities 11 19 0.003 0.053
Suppliers, Customers, Competitors & Universities 12 34 0.005 0.071
Internal & Suppliers 13 255 0.038 0.19
Internal & Customers 14 218 0.032 0.176
Internal & Competitors 15 23 0.003 0.058
Internal & Universities 16 18 0.003 0.051
Internal, Suppliers & Customers 17 608 0.09 0.286
Internal, Suppliers & Competitors 18 81 0.012 0.109
Internal, Suppliers & Universities 19 35 0.005 0.072
Internal, Customers & Competitors 20 275 0.04 0.197
Internal, Customers & Universities 21 22 0.003 0.057
Internal, Suppliers, Customers & Competitors 22 1255 0.185 0.388
Internal, Suppliers, Customers & Universities 23 104 0.015 0.123
Internal, Suppliers, Competitors & Universities 24 18 0.003 0.051
Internal, Customers, Competitors & Universities 25 38 0.006 0.075
All sources 26 666 0.092 0.29
Dependent and control variables
Product innovation
0.245 0.43
Process innovation
0.15 0.357
Share of sales from innovative products
7.409 19.356
Firm size (log employees)
4.148 1.492
Firm age
21.725 9.675
R&D active
0.272 0.445
Share of scientists & engineers
5.169 14.44
Part of a group
0.335 0.472
Domestic
0.667 0.471
National Market Focus
0.321 0.467
European Market Focus
0.129 0.335
Beyond Europe Market Focus
0.22 0.414
Innovation co-operation
0.148 0.355
Innovative active
0.654 0.476
Prior innovations
0.203 0.402
Government funding 0.09 0.286

41
Table 2 Results from the bivariate probit estimations (N=6,792)
Baseline Model Full Model
Product Innov Process Innov Product Innov Process Innov
Firm size (log employees) 0.004 0.062** -0.008 0.058**
(0.014) (0.015) (0.014) (0.015)
Firm age -0.003 -0.003 -0.003 -0.003
(0.002) (0.002) (0.002) (0.002)
R&D active 0.368** 0.230** 0.309** 0.189**
(0.043) (0.048) (0.045) (0.049)
Share of scientists & engineers 0.004** 0.003* 0.004** 0.002
(0.001) (0.001) (0.001) (0.001)
Part of a group -0.029 -0.069 -0.041 -0.075
(0.042) (0.046) (0.042) (0.046)
Domestic -0.092* -0.024 -0.088* -0.016
(0.040) (0.044) (0.040) (0.044)
National market focus 0.068 0.140* 0.063 0.133*
(0.049) (0.055) (0.049) (0.056)
European market focus 0.255** 0.222** 0.238** 0.209**
(0.061) (0.069) (0.062) (0.070)
Beyond Europe market focus 0.381** 0.275** 0.359** 0.262**
(0.056) (0.064) (0.057) (0.065)
Innovation co-operation 0.171** 0.210** 0.146** 0.197**
(0.049) (0.053) (0.050) (0.054)
Innovative active 0.368** 0.381** 0.287** 0.219**
(0.047) (0.054) (0.053) (0.062)
Prior innovations -0.659** -0.619** -0.659** -0.618**
(0.055) (0.061) (0.055) (0.062)
Government funding 0.306** 0.219** 0.277** 0.183**
(0.059) (0.063) (0.060) (0.063)
Internal sources only 0.027 0.088
(0.122) (0.148)
Suppliers only -0.112 0.343**
(0.123) (0.125)
Customers only 0.034 0.098
(0.135) (0.172)
Competitors only -0.013 -0.156
(0.344) (0.454)
Universities only -0.845 -5.480**
(0.437) (0.147)
Suppliers & Customers -0.07 0.088
(0.120) (0.142)
Suppliers & Competitors 0.239 0.694*
(0.287) (0.279)
Suppliers & Universities 0.343 0.869*
(0.401) (0.374)
Customers & Competitors 0.136 0.364*
(0.138) (0.155)
Suppliers, Customers & Competitors 0.095 0.318**
(0.097) (0.112)

42
Baseline Model Full Model
Product Innov. Process Innov. Product Innov. Process Innov.
Suppliers, Customers & Universities -0.183 -0.407
(0.368) (0.466)
Suppliers, Customers, Competitors, & Universities 0.311 0.687**
(0.243) (0.241)
Internal & Suppliers 0.122 0.464**
(0.102) (0.110)
Internal & Customers 0.212* 0.414**
(0.106) (0.118)
Internal & Competitors 0.262 0.093
(0.284) (0.388)
Internal & Universities -0.453 0.171
(0.406) (0.338)
Internal, Suppliers & Customers 0.241** 0.347**
(0.075) (0.087)
Internal, Suppliers & Competitors 0.192 0.389*
(0.163) (0.188)
Internal, Suppliers & Universities 0.014 -0.178
(0.239) (0.265)
Internal, Customers & Competitors 0.303** 0.386**
(0.097) (0.109)
Internal, Customers & Universities 0.787** 0.594*
(0.300) (0.302)
Internal, Suppliers, Customers & Competitors 0.305** 0.397**
(0.065) (0.074)
Internal, Suppliers, Customers & Universities 0.374** 0.681**
(0.141) (0.146)
Internal, Suppliers, Competitors & Universities 0.421 0.57
(0.285) (0.345)
Internal, Customers, Competitors & Universities 0.547* -0.083
(0.235) (0.257)
All sources 0.285** 0.419**
(0.074) (0.084)
Constant -0.895** -1.470** -0.929** -1.611**
(0.114) (0.125) (0.116) (0.130)
athrho 0.737** 0.736**
(0.031) (0.031)
log pseudolikelihood -5360 -5301
Wald chi2 1208 9664
All models include seven 1-digit industry dummies.
Robust standard errors in brackets. *** p<0.001, ** p<0.01, * p<0.05
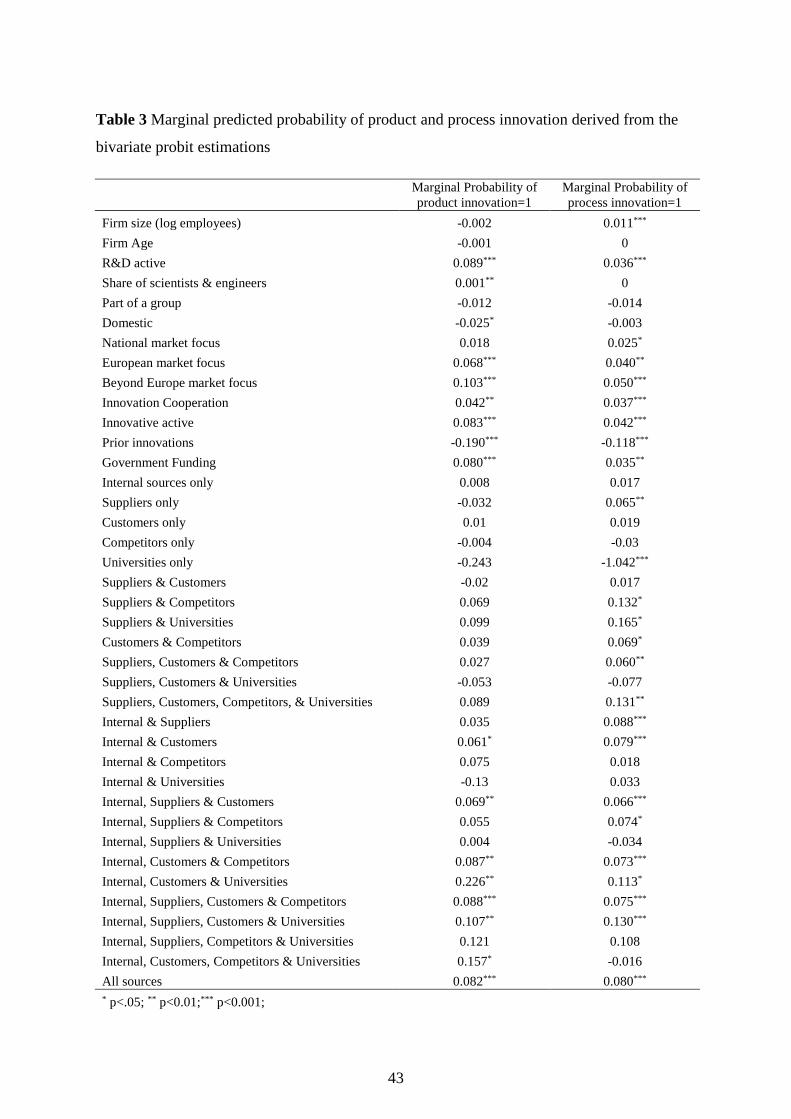
43
Table 3 Marginal predicted probability of product and process innovation derived from the
bivariate probit estimations
Marginal Probability of
product innovation=1
Marginal Probability of
process innovation=1
Firm size (log employees) -0.002 0.011***
Firm Age -0.001 0
R&D active 0.089*** 0.036***
Share of scientists & engineers 0.001** 0
Part of a group -0.012 -0.014
Domestic -0.025* -0.003
National market focus 0.018 0.025*
European market focus 0.068*** 0.040**
Beyond Europe market focus 0.103*** 0.050***
Innovation Cooperation 0.042** 0.037***
Innovative active 0.083*** 0.042***
Prior innovations -0.190*** -0.118***
Government Funding 0.080*** 0.035**
Internal sources only 0.008 0.017
Suppliers only -0.032 0.065**
Customers only 0.01 0.019
Competitors only -0.004 -0.03
Universities only -0.243 -1.042***
Suppliers & Customers -0.02 0.017
Suppliers & Competitors 0.069 0.132*
Suppliers & Universities 0.099 0.165*
Customers & Competitors 0.039 0.069*
Suppliers, Customers & Competitors 0.027 0.060**
Suppliers, Customers & Universities -0.053 -0.077
Suppliers, Customers, Competitors, & Universities 0.089 0.131**
Internal & Suppliers 0.035 0.088***
Internal & Customers 0.061* 0.079***
Internal & Competitors 0.075 0.018
Internal & Universities -0.13 0.033
Internal, Suppliers & Customers 0.069** 0.066***
Internal, Suppliers & Competitors 0.055 0.074*
Internal, Suppliers & Universities 0.004 -0.034
Internal, Customers & Competitors 0.087** 0.073***
Internal, Customers & Universities 0.226** 0.113*
Internal, Suppliers, Customers & Competitors 0.088*** 0.075***
Internal, Suppliers, Customers & Universities 0.107** 0.130***
Internal, Suppliers, Competitors & Universities 0.121 0.108
Internal, Customers, Competitors & Universities 0.157* -0.016
All sources 0.082*** 0.080***
* p<.05; ** p<0.01;*** p<0.001;
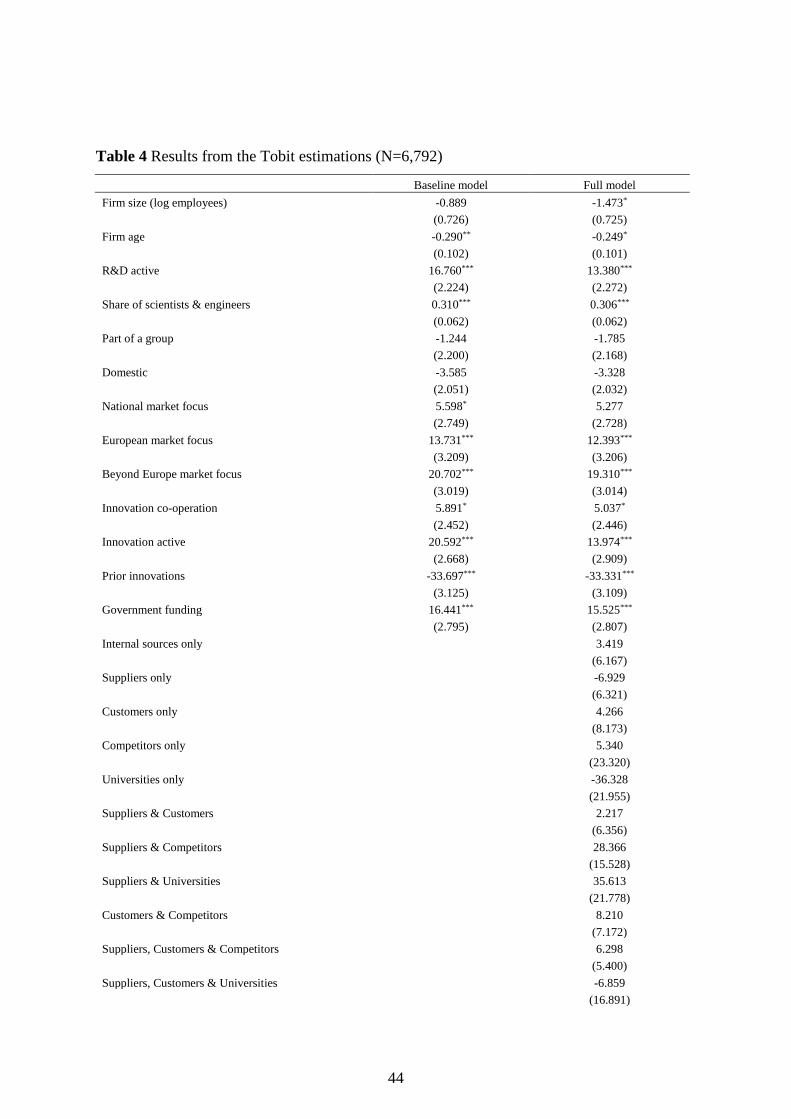
44
Table 4 Results from the Tobit estimations (N=6,792)
Baseline model Full model
Firm size (log employees) -0.889 -1.473*
(0.726) (0.725)
Firm age -0.290** -0.249*
(0.102) (0.101)
R&D active 16.760*** 13.380***
(2.224) (2.272)
Share of scientists & engineers 0.310*** 0.306***
(0.062) (0.062)
Part of a group -1.244 -1.785
(2.200) (2.168)
Domestic -3.585 -3.328
(2.051) (2.032)
National market focus 5.598* 5.277
(2.749) (2.728)
European market focus 13.731*** 12.393***
(3.209) (3.206)
Beyond Europe market focus 20.702*** 19.310***
(3.019) (3.014)
Innovation co-operation 5.891* 5.037*
(2.452) (2.446)
Innovation active 20.592*** 13.974***
(2.668) (2.909)
Prior innovations -33.697*** -33.331***
(3.125) (3.109)
Government funding 16.441*** 15.525***
(2.795) (2.807)
Internal sources only 3.419
(6.167)
Suppliers only -6.929
(6.321)
Customers only 4.266
(8.173)
Competitors only 5.340
(23.320)
Universities only -36.328
(21.955)
Suppliers & Customers 2.217
(6.356)
Suppliers & Competitors 28.366
(15.528)
Suppliers & Universities 35.613
(21.778)
Customers & Competitors 8.210
(7.172)
Suppliers, Customers & Competitors 6.298
(5.400)
Suppliers, Customers & Universities -6.859
(16.891)

45
Suppliers, Customers, Competitors, & Universities 26.790*
(12.933)
Internal & Suppliers 14.447**
(5.287)
Baseline model Full model
Internal & Customers 13.856*
(5.547)
Internal & Competitors 19.384
(15.189)
Internal & Universities -23.506
(15.887)
Internal, Suppliers & Customers 17.246***
(4.033)
Internal, Suppliers & Competitors 16.768
(9.291)
Internal, Suppliers & Universities -7.286
(9.915)
Internal, Customers & Competitors 20.084***
(4.697)
Internal, Customers & Universities 8.523
(11.132)
Internal, Suppliers, Customers & Competitors 19.987***
(3.502)
Internal, Suppliers, Customers & Universities 18.235**
(6.498)
Internal, Suppliers, Competitors & Universities 21.926
(13.191)
Internal, Customers, Competitors & Universities 21.858*
(9.446)
All sources 17.781***
(4.004)
Constant -52.221*** -54.715***
(5.943) (6.007)
sigma 54.376*** 53.716***
(1.399) (1.373)
R-squared 0.0543 0.0581
Log-likelihood -9529 -9491
Left censored obs 5296 5296
Righ censored obs 77 77
All models include seven 1-digit industry dummies.
Robust standard errors in brackets. *** p<0.001, ** p<0.01, * p<0.05
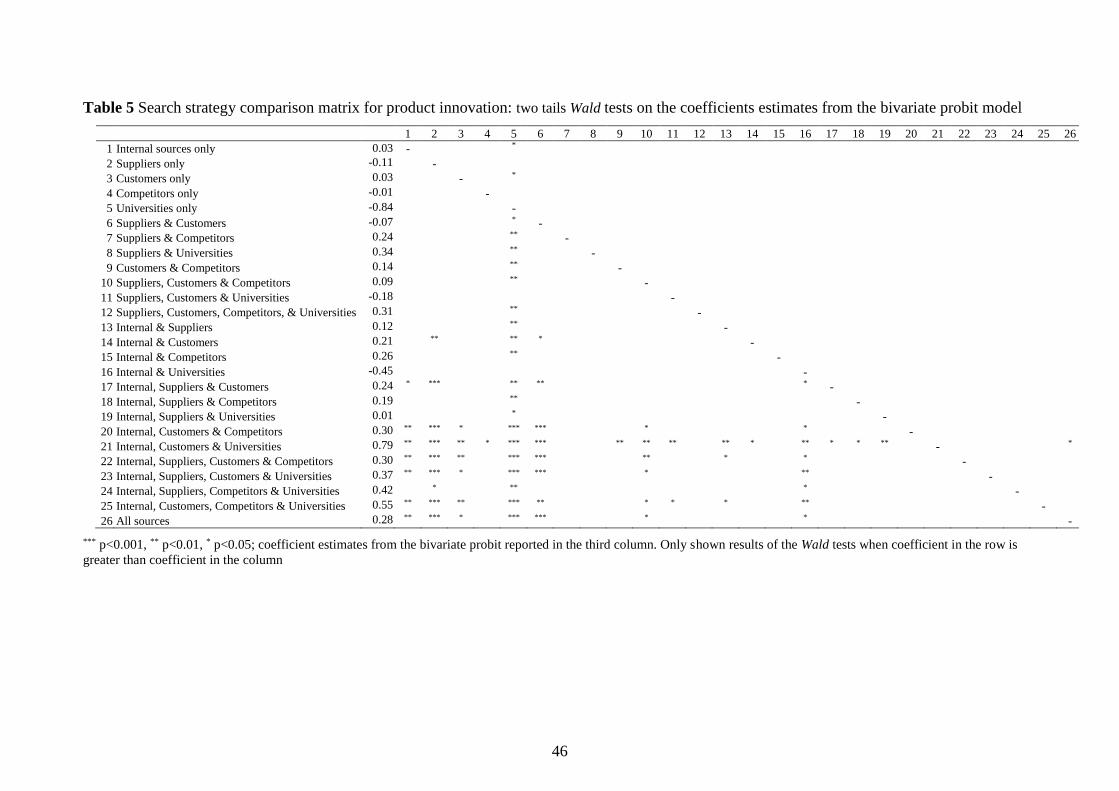
46
Table 5 Search strategy comparison matrix for product innovation: two tails Wald tests on the coefficients estimates from the bivariate probit model
1 2 3 4 5 6 7 8 9 10 11 12 13 14 15 16 17 18 19 20 21 22 23 24 25 26
1 Internal sources only 0.03 -
*
2 Suppliers only -0.11
-
3 Customers only 0.03
-
*
4 Competitors only -0.01
-
5 Universities only -0.84
-
6 Suppliers & Customers -0.07
* -
7 Suppliers & Competitors 0.24
**
-
8 Suppliers & Universities 0.34
**
-
9 Customers & Competitors 0.14
**
-
10 Suppliers, Customers & Competitors 0.09
**
-
11 Suppliers, Customers & Universities -0.18
-
12 Suppliers, Customers, Competitors, & Universities 0.31
**
-
13 Internal & Suppliers 0.12
**
-
14 Internal & Customers 0.21
**
** *
-
15 Internal & Competitors 0.26
**
-
16 Internal & Universities -0.45
-
17 Internal, Suppliers & Customers 0.24 * ***
** **
* -
18 Internal, Suppliers & Competitors 0.19
**
-
19 Internal, Suppliers & Universities 0.01
*
-
20 Internal, Customers & Competitors 0.30 ** *** *
*** ***
*
*
-
21 Internal, Customers & Universities 0.79 ** *** ** * *** ***
** ** **
** *
** * * **
-
*
22 Internal, Suppliers, Customers & Competitors 0.30 ** *** **
*** ***
**
*
*
-
23 Internal, Suppliers, Customers & Universities 0.37 ** *** *
*** ***
*
**
-
24 Internal, Suppliers, Competitors & Universities 0.42
*
**
*
-
25 Internal, Customers, Competitors & Universities 0.55 ** *** **
*** **
* *
*
**
-
26 All sources 0.28 ** *** *
*** ***
*
*
-
*** p<0.001, ** p<0.01, * p<0.05; coefficient estimates from the bivariate probit reported in the third column. Only shown results of the Wald tests when coefficient in the row is
greater than coefficient in the column

47
Table 6 Search strategy comparison matrix for process innovation: two tails Wald tests on the coefficients estimates from the bivariate probit model
1 2 3 4 5 6 7 8 9 10 11 12 13 14 15 16 17 18 19 20 21 22 23 24 25 26
1 Internal sources only 0.09 ***
2 Suppliers only 0.34 *** *
3 Customers only 0.10 ***
4 Competitors only -0.16 ***
5 Universities only -5.48
6 Suppliers & Customers 0.09 ***
7 Suppliers & Competitors 0.69 ** * *** ** ** ** **
8 Suppliers & Universities 0.87 ** * * *** ** ** ** **
9 Customers & Competitors 0.36 *** *
10 Suppliers, Customers & Competitors 0.32 *** *
11 Suppliers, Customers & Universities -0.41 ***
12 Suppliers, Customers, Competitors, & Universities 0.69 ** ** * *** ** ** ** **
13 Internal & Suppliers 0.46 ** ** *** ** * ** **
14 Internal & Customers 0.41 * * *** ** * ** *
15 Internal & Competitors 0.09 ***
16 Internal & Universities 0.17 ***
17 Internal, Suppliers & Customers 0.35 * *** * ** *
18 Internal, Suppliers & Competitors 0.39 *** *
19 Internal, Suppliers & Universities -0.18 ***
20 Internal, Customers & Competitors 0.39 * *** * * ** *
21 Internal, Customers & Universities 0.59 *** * ** *
22 Internal, Suppliers, Customers & Competitors 0.40 ** * *** ** * ** *
23 Internal, Suppliers, Customers & Universities 0.68 *** ** *** * *** *** ** ** ** *** * ** *** *
24 Internal, Suppliers, Competitors & Universities 0.57 *** * *
25 Internal, Customers, Competitors & Universities -0.08 ***
26 All sources 0.42 ** * *** ** * ** **
*** p<0.001, ** p<0.01, * p<0.05; coefficient estimates from the bivariate probit reported in the third column. Only shown results of the Wald tests when coefficient in the row is
greater than coefficient in the column
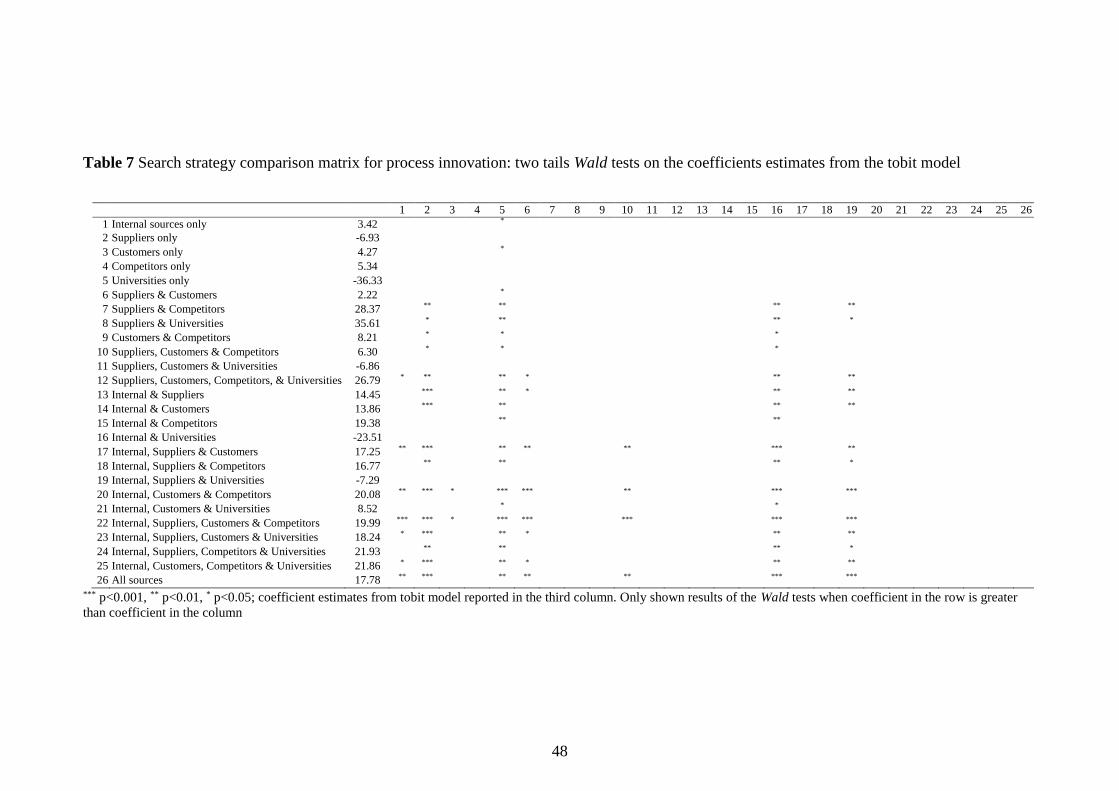
48
Table 7 Search strategy comparison matrix for process innovation: two tails Wald tests on the coefficients estimates from the tobit model
1 2 3 4 5 6 7 8 9 10 11 12 13 14 15 16 17 18 19 20 21 22 23 24 25 26
1 Internal sources only 3.42 *
2 Suppliers only -6.93
3 Customers only 4.27 *
4 Competitors only 5.34
5 Universities only -36.33
6 Suppliers & Customers 2.22 *
7 Suppliers & Competitors 28.37 ** ** ** **
8 Suppliers & Universities 35.61 * ** ** *
9 Customers & Competitors 8.21 * * *
10 Suppliers, Customers & Competitors 6.30 * * *
11 Suppliers, Customers & Universities -6.86
12 Suppliers, Customers, Competitors, & Universities 26.79 * ** ** * ** **
13 Internal & Suppliers 14.45 *** ** * ** **
14 Internal & Customers 13.86 *** ** ** **
15 Internal & Competitors 19.38 ** **
16 Internal & Universities -23.51
17 Internal, Suppliers & Customers 17.25 ** *** ** ** ** *** **
18 Internal, Suppliers & Competitors 16.77 ** ** ** *
19 Internal, Suppliers & Universities -7.29
20 Internal, Customers & Competitors 20.08 ** *** * *** *** ** *** ***
21 Internal, Customers & Universities 8.52 * *
22 Internal, Suppliers, Customers & Competitors 19.99 *** *** * *** *** *** *** ***
23 Internal, Suppliers, Customers & Universities 18.24 * *** ** * ** **
24 Internal, Suppliers, Competitors & Universities 21.93 ** ** ** *
25 Internal, Customers, Competitors & Universities 21.86 * *** ** * ** **
26 All sources 17.78 ** *** ** ** ** *** ***
*** p<0.001, ** p<0.01, * p<0.05; coefficient estimates from tobit model reported in the third column. Only shown results of the Wald tests when coefficient in the row is greater
than coefficient in the column