university of california scripps …scilib.ucsd.edu/sio/hist/sioreference66-01.pdfworked two...
TRANSCRIPT
UNIVERSITY OF CALIFORNIA
SCRIPPS INSTITUTION OF OCEANOGRAPHY
PHYSICAL, CHEMICAL,
CURRENT MEASUREMENT AND BIOLOGICAL DATA
Swan Song Expedition
21 August - 1 December 1961
Sponsored by
Office of Naval Research
SIO Reference 66-1 15 September 1965
Approved for distribution:
ctor
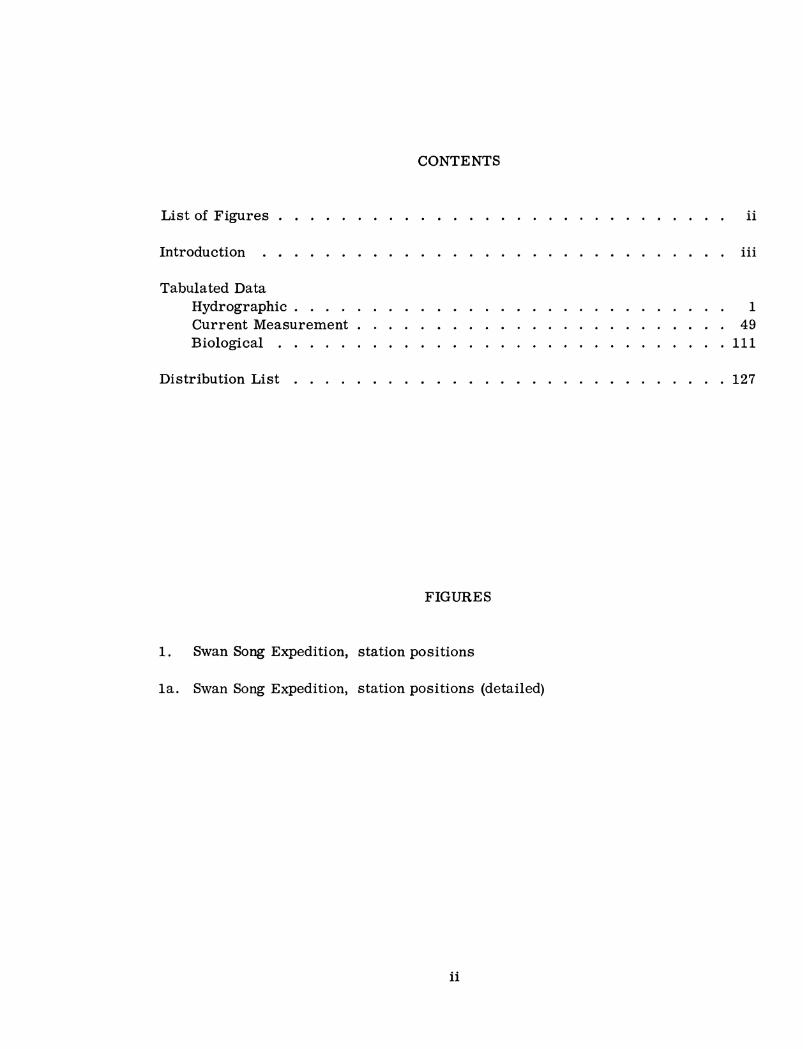
List of Figures
Introduction
Tabulated Data Hydrographic . Current Measurement Biological .
Distribution List
CONTENTS
FIGURES
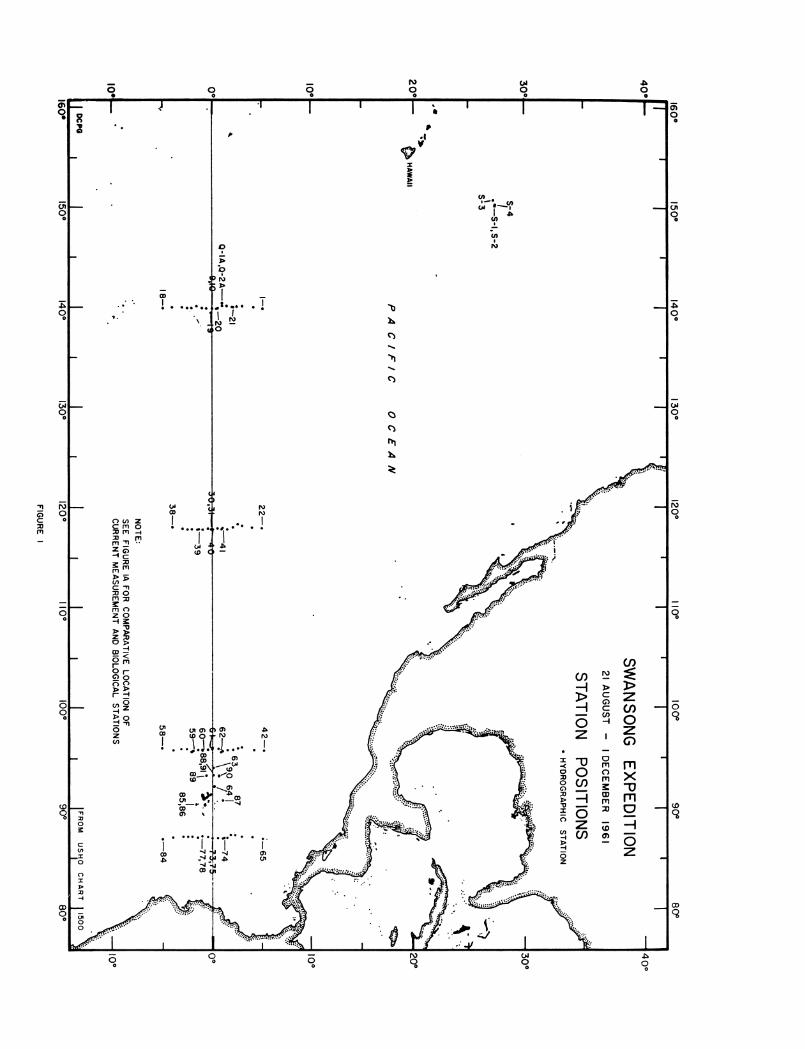
1. Swan Song Expedition, station positions
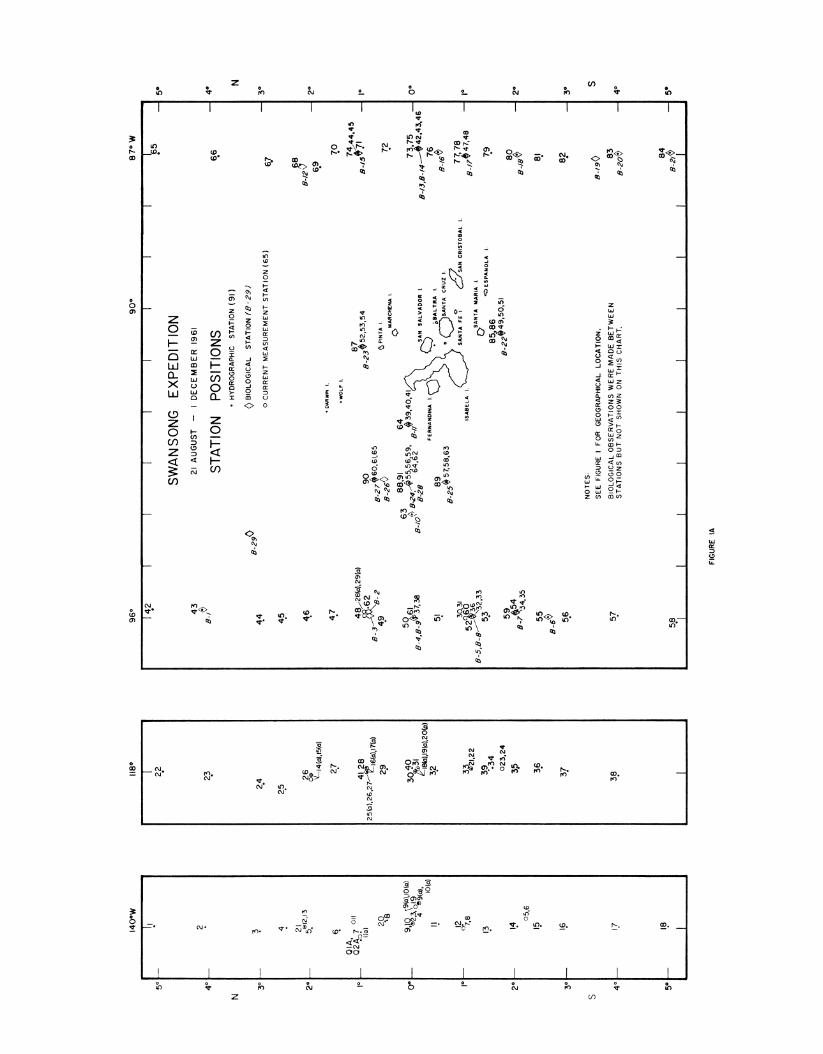
1a. Swan Song Expedition, station positions (detailed)
ii
ii
iii
1 49
111
127
INTRODUCTION
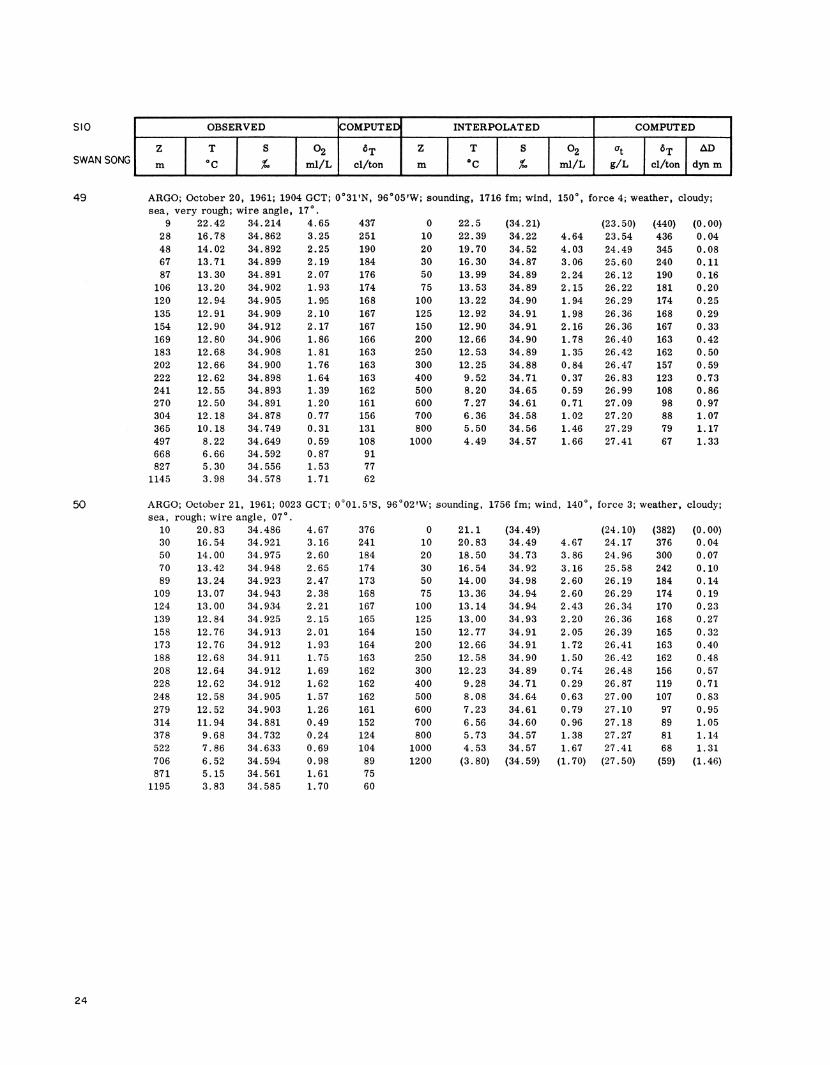
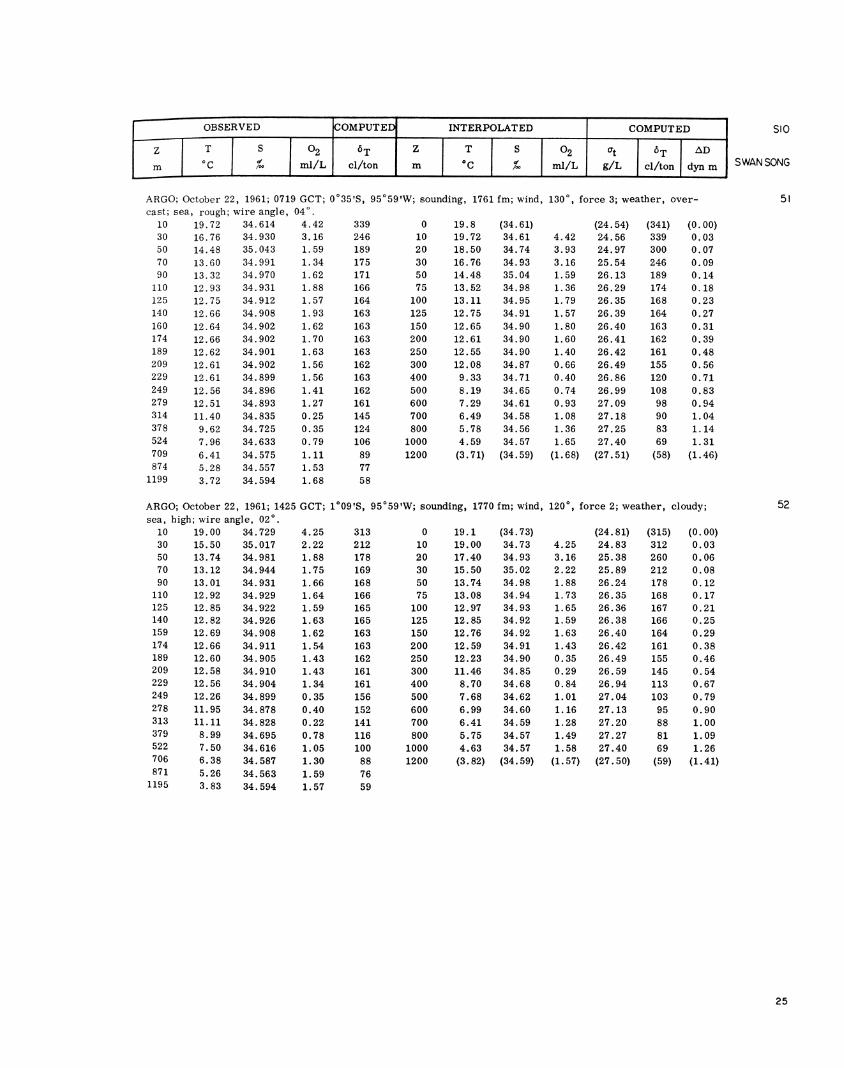
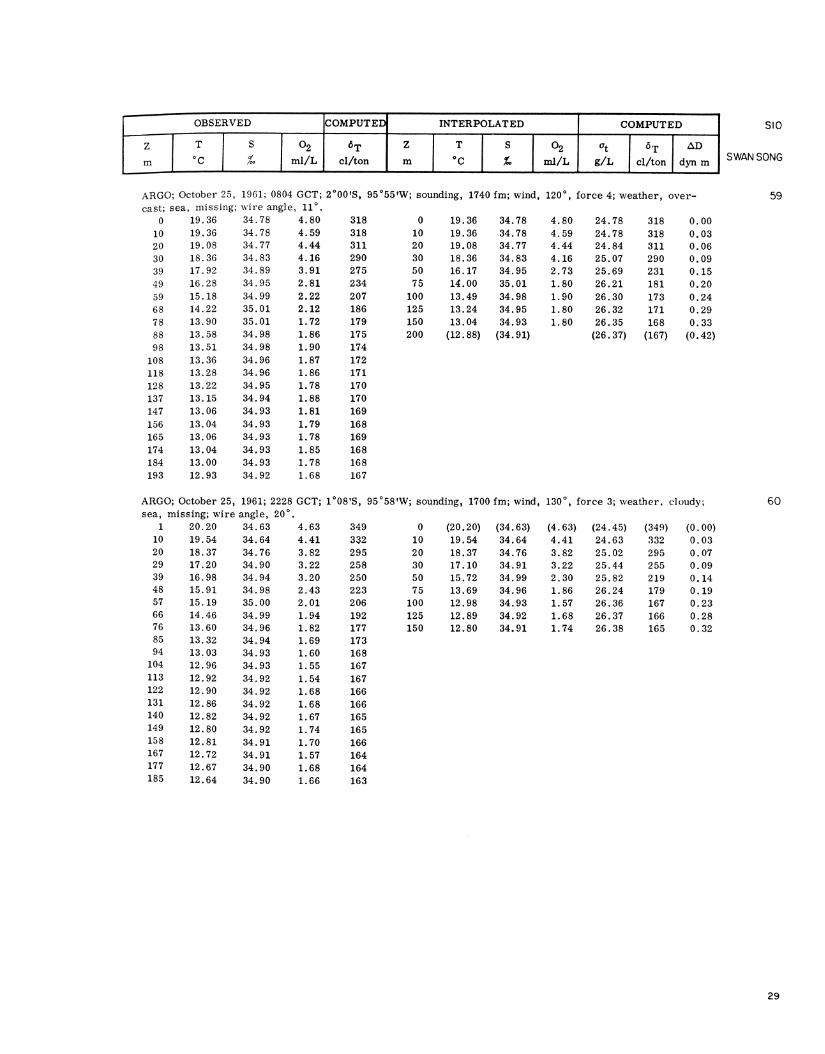
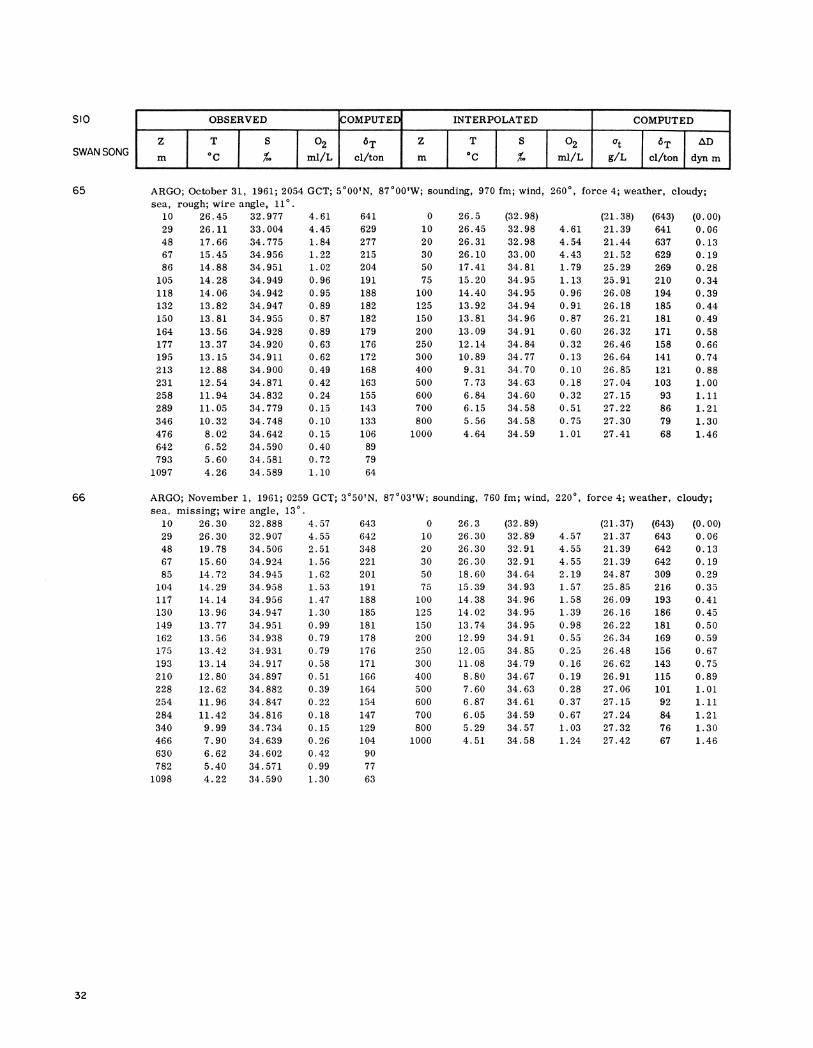
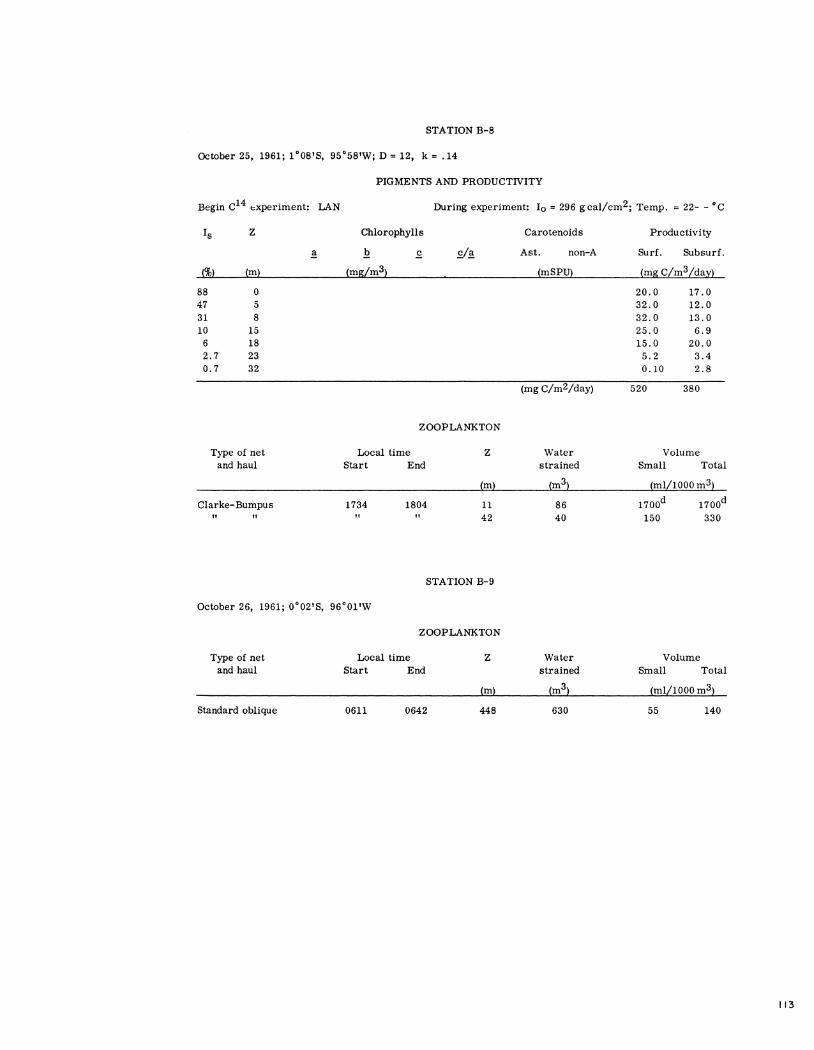
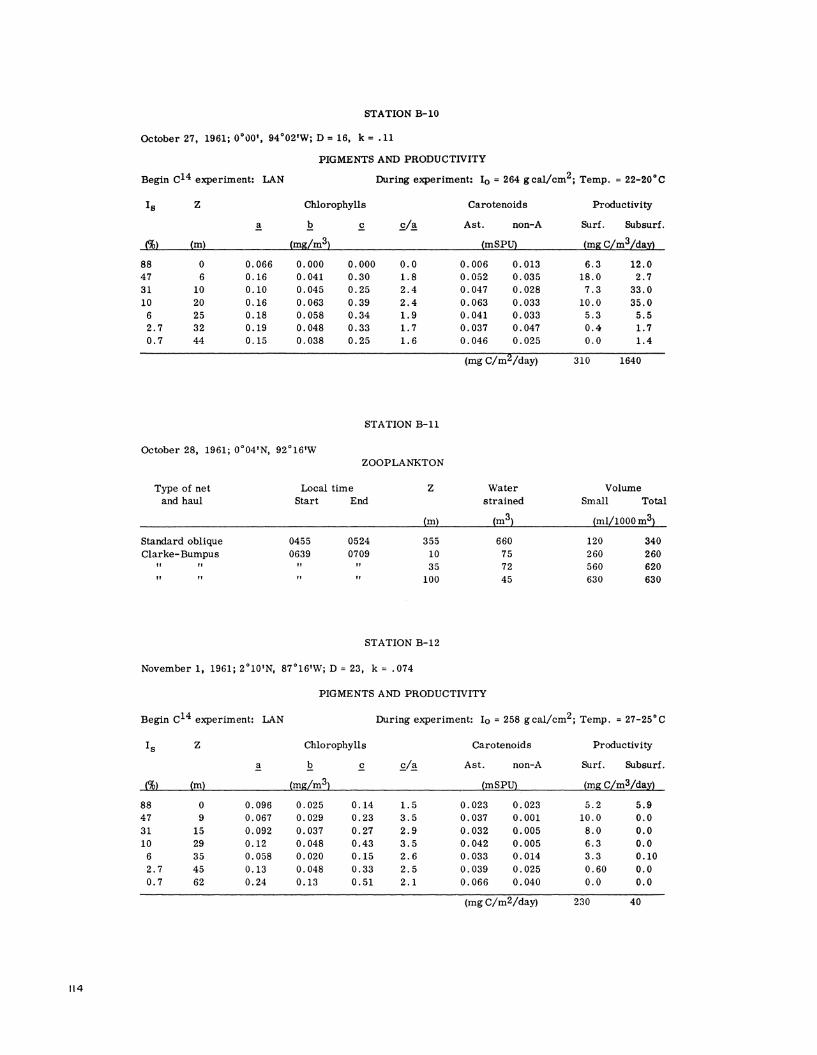
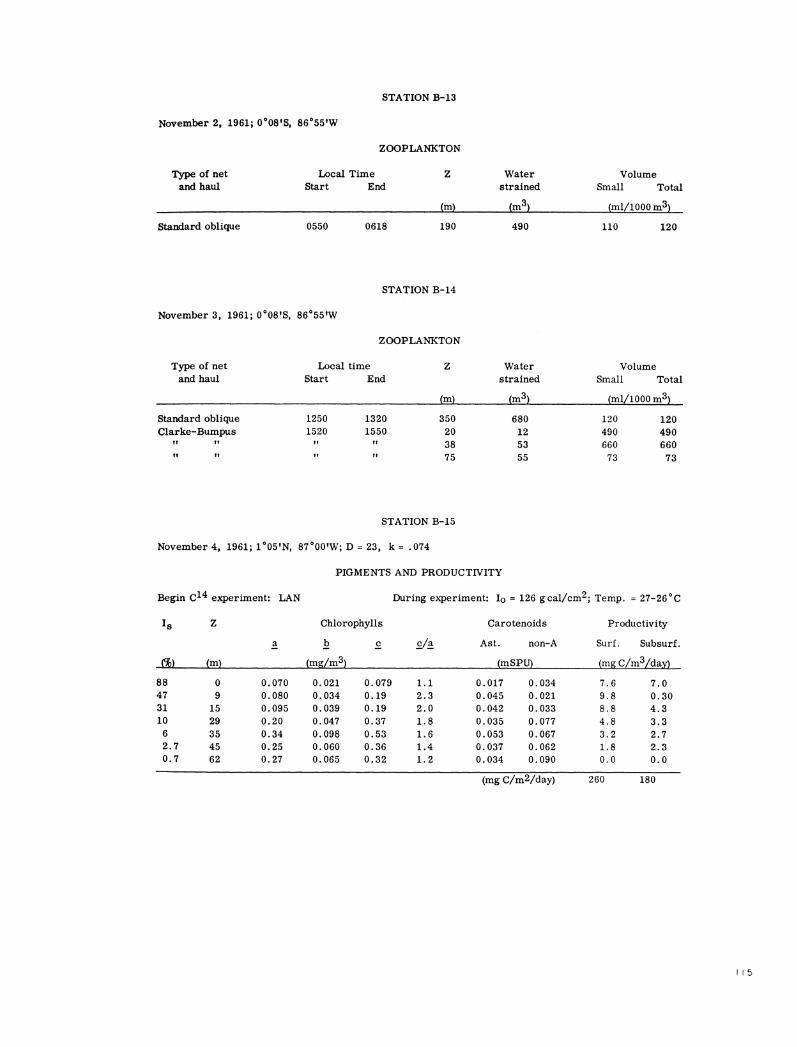
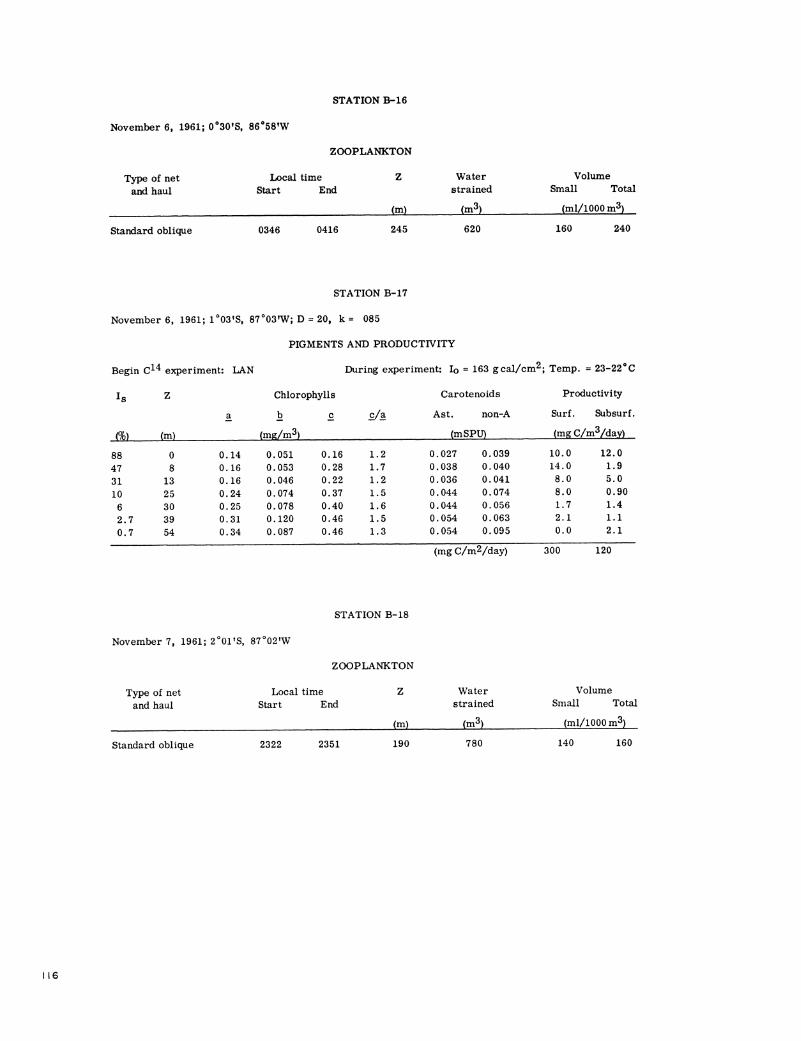
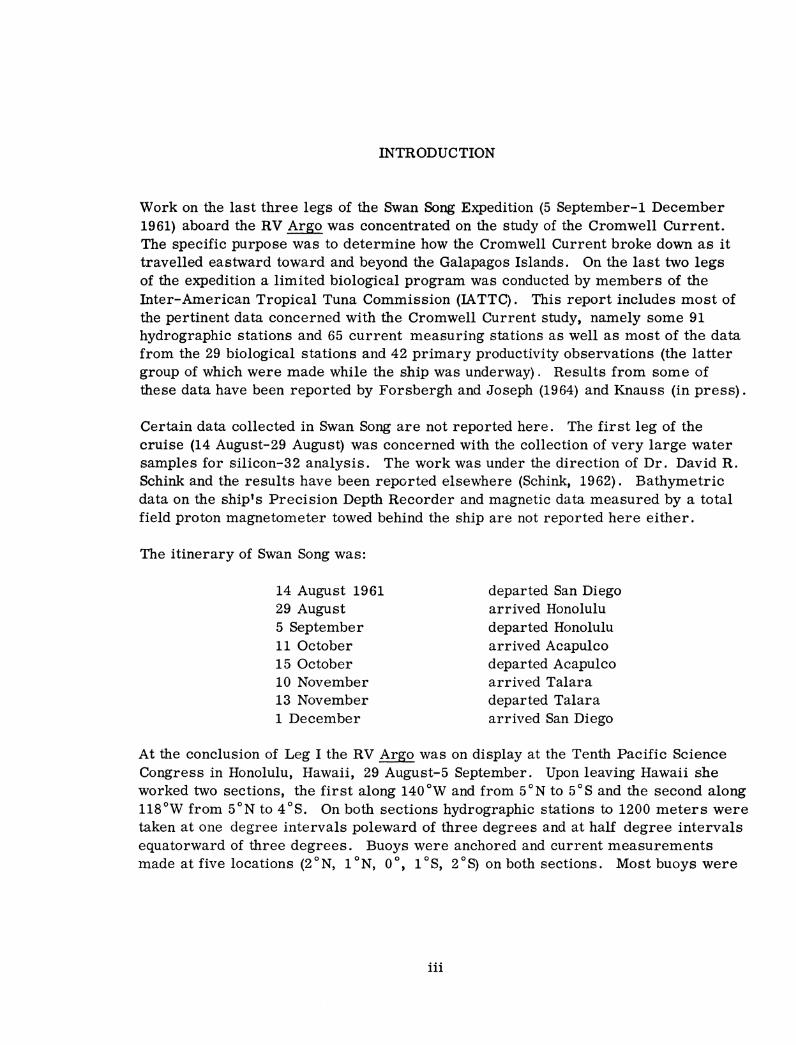
Work on the last three legs of the Swan Song Expedition (5 September-! December 1961) aboard the RV Argo was concentrated on the study of the Cromwell Current. The specific purpose was to determine how the Cromwell Current broke down as it travelled eastward toward and beyond the Galapagos Islands. On the last two legs of the expedition a limited biological program was conducted by members of the Inter-American Tropical Tuna Commission (lA TTC) . This report includes most of the pertinent data concerned with the Cromwell Current study, namely some 91 hydrographic stations and 65 current measuring stations as well as most of the data from the 29 biological stations and 42 primary productivity observations (the latter group of which were made while the ship was underway) . Results from some of these data have been reported by Forsbergh and Joseph (1964) and Knauss (in press).
Certain data collected in Swan Song are not reported here. The first leg of the cruise (14 August-29 August) was concerned with the collection of very large water samples for silicon-32 analysis. The work was under the direction of Dr. David R. Schink and the results have been reported elsewhere (Schink, 1962). Bathymetric data on the ship's Precision Depth Recorder and magnetic data measured by a total field proton magnetometer towed behind the ship are not reported here either.
The itinerary of Swan Song was:
14 August 1961 29 August 5 September 11 October 15 October 10 November 13 November 1 December
departed San Diego arrived Honolulu departed Honolulu arrived Acapulco departed Acapulco arrived Talara departed Talara arrived San Diego
At the conclusion of Leg I the RV Argo was on display at the Tenth Pacific Science Congress in Honolulu, Hawaii, 29 August-5 September. Upon leaving Hawaii she worked two sections, the first along 140°W and from 5°N to 5°S and the second along ll8°W from 5°N to 4 °S. On both sections hydrographic stations to 1200 meters were taken at one degree intervals poleward of three degrees and at half degree intervals equatorward of three degrees. Buoys were anchored and current measurements made at five locations (2°N, 1 °N, 0°, 1 °S, 2°S) on both sections. Most buoys were
iii

revisited and often additional hydrographic stations were made at these times (Fig. 1). At the conclusion of Leg II the Argo put in to Acapulco, Mexico, 11-15 October. On Leg III she occupied two more sections, the first at 96°\V and the second at 87 °W both from 5° N to 5°S. The biological program of the IA TTC began on this leg. The distribution of hydrographic stations and anchored buoys \Vas similar to that on the earlier sections (Fig. 1). In addition hydrographic measurements were made along the equator at two stations; 94 °02'W and 92° 16'W. Current measurements were made at the latter station. The ship stopped at Tagus Cove, Isabela Island in the Galapagos for a 24-hour period beginning the afternoon of October 28.
At the conclusion of Leg III the Argo stopped at Talara, Peru, for the period 10-13 November. After leaving Talara, a series of hydrographic current measuring and biological stations was made north, south and west of the Galapagos (Fig. 2). Work was completed on 23 November and the ship returned to San Diego on 1 December. Support from outside the University of California for this ex-pedition was provided by the Office of Naval Research, the National Science Foundation and the InterAmerican Tropical Tuna Commission.
Personnel: The scientific leader of the expedition was John A. Knauss. The master of the RV Argo was Barnes Collinson. Members of the scientific party for the three legs were as follows:
Allen, William, Jr., SIO* Bronner, Finn E. , General Electric Co. Corrigan, Donald J., SIO Frey, James M., SIO Forsbergh, Eric B., IATTC** Gilley, E. Gene, SIO Gomez, Tomas, L<\TTC Joseph, James, IA TTC Kiwala, Robert S., SIO Knauss, John A., SIO Lawson, Jan B., SIO Murty, C. Balarama, Andrha University, India Psaropulos, Chris T., IA TTC Vicente, Belisario, Servicio de Hidrograffa
Naval, Argentina
*Scripps Institution of Oceanography **Inter-American Tropical Tuna Commission
iv
ParticiJ2ation II, III, IV II, III, IV II II, III, IV
III, IV II, III, IV
III III, IV
II, III, IV II, III, IV II, III, IV II, III, IV II, III, IV
III, IV

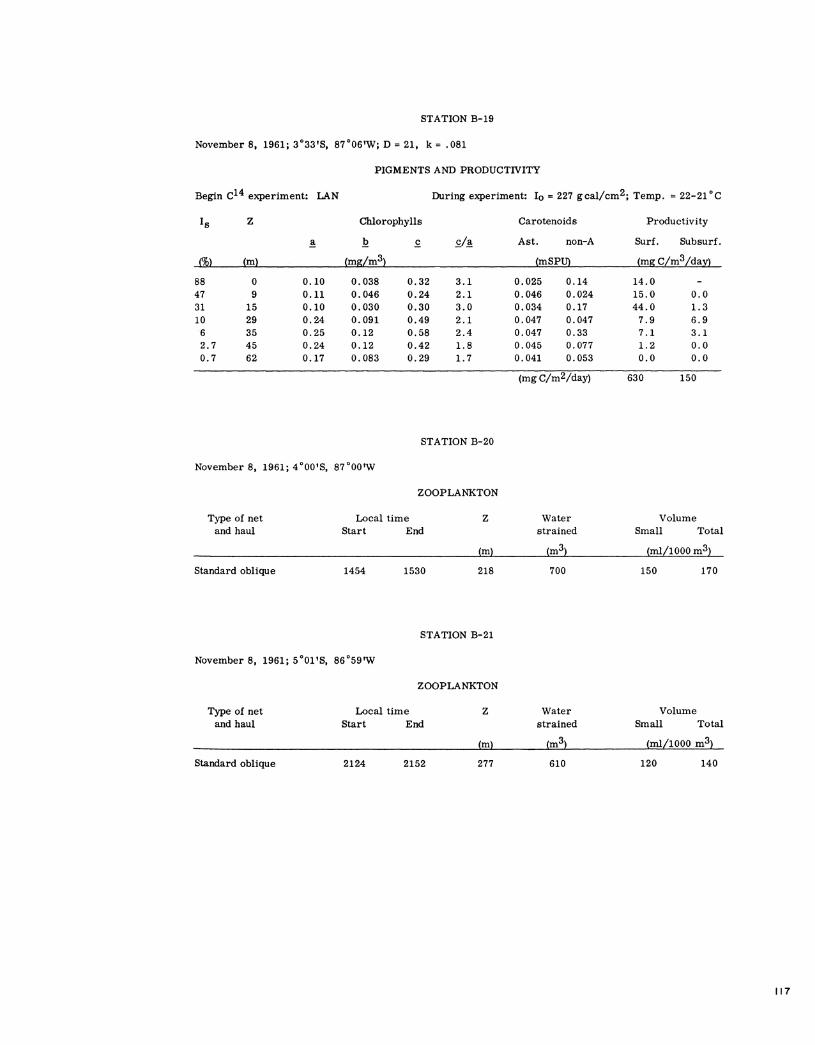
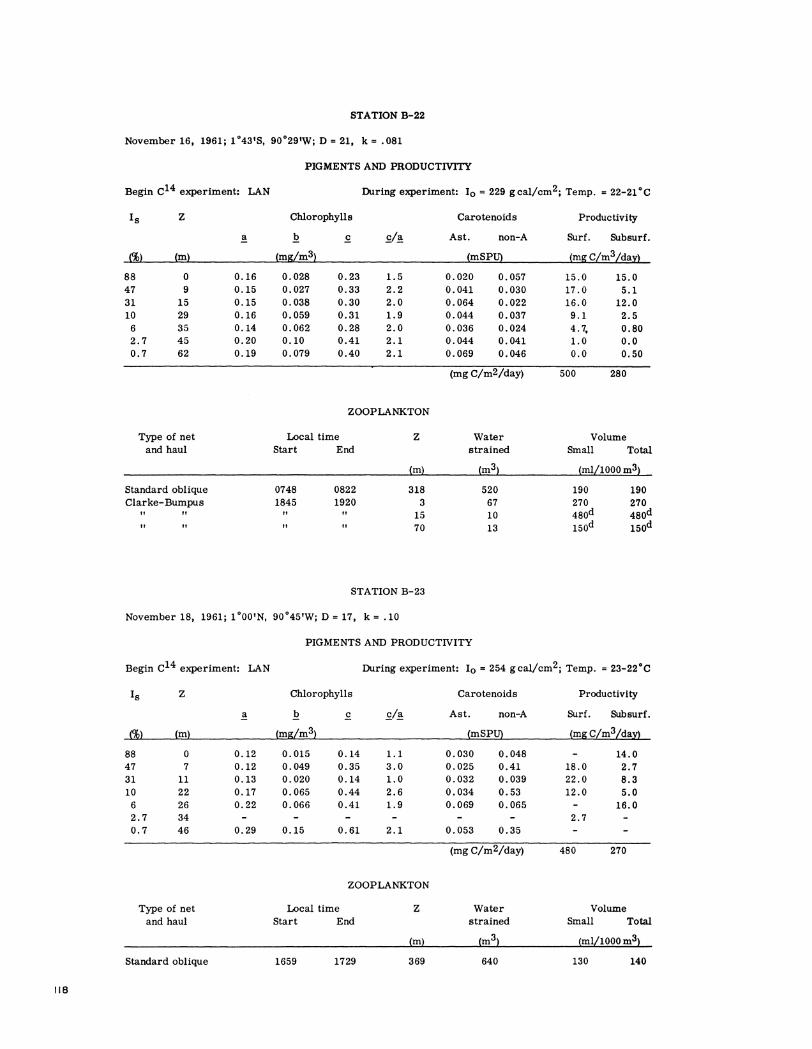
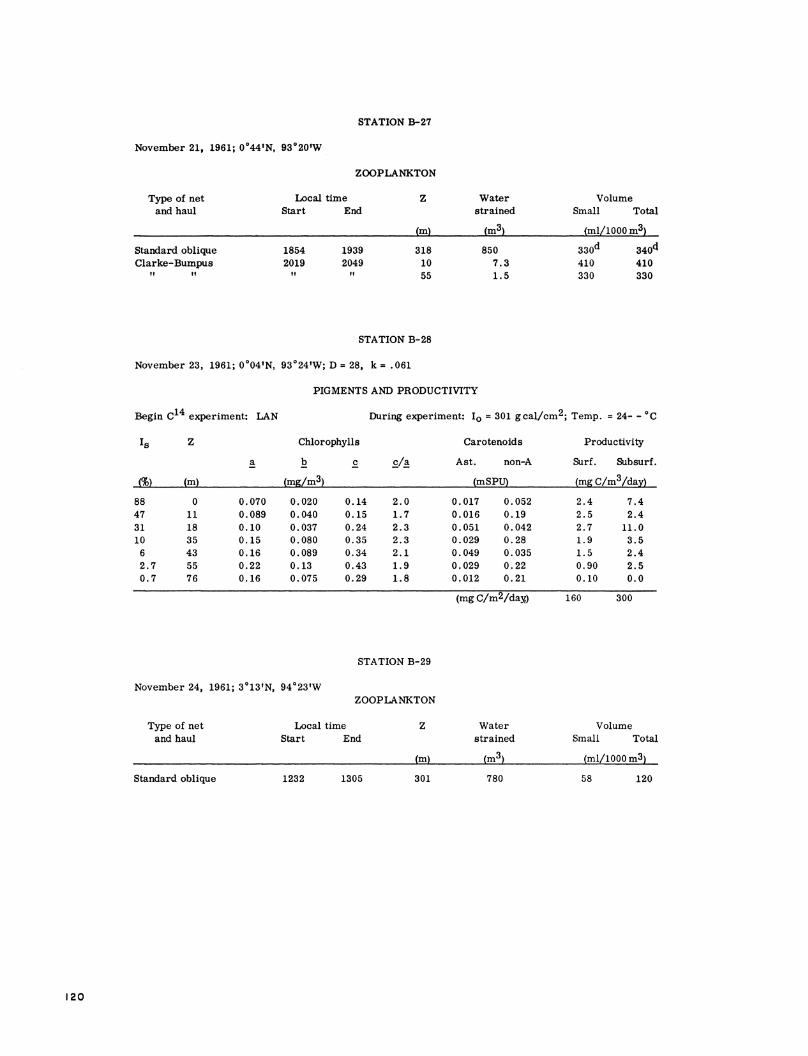
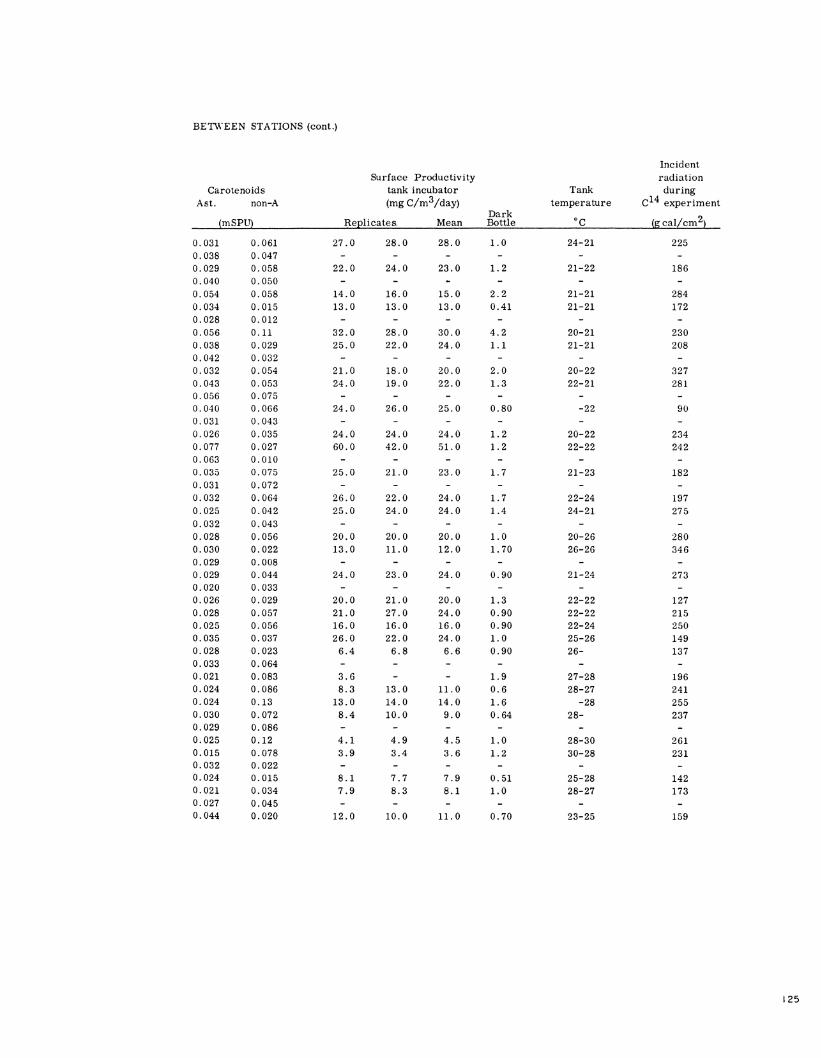
Non-photosynthetic uptake of carbon was measured with dark bottles for surface samples and deepest samples. Surface production was corrected by subtracting surface dark-fixation. Subsurface production was corrected by subtracting the mean of surface and deepest dark-fixation values, since these did not differ greatly.
The procedures and equipment used for measuring the radioactivity of the samples and for standardization of the radiocarbon solution were described in Scripps Inst. Oceanogr. (1961). Before counting, all phytoplankton samples were exposed to vapor of hydrochloric acid for a period of 5 minutes in order to remove any activity due to inorganic carbonate. Two standardizations were performed before the cruise, during August 1961: the mean activity of the aliquots used was 3. 5 x 10⁶ counts per minute per milliliter of solution (c/min/ml) with a coefficient of variation of ±8. 9 per cent. Two additional standardizations were performed after the cruise, in February 1962: the mean activity of the aliquots used was 2. 6 x 10⁶ c/min/ml with a coefficient of variation of ±8. 5 per cent. This difference is unexplained if it is assumed that the activity of the solution in the ampoules did not change appreciably in such a short time and it points to the necessity of using more exact methods of standardization such as that of Jitts and Scott (1961). The value used here to calculate the carbon uptake of the phytoplankton is the mean of all the aliquots used for all standardizations: 3. 0 x 106 c/min/ml, with a coefficient of variation of ± 17 per cent. Precipitate activity was counted to 10, 240 counts and the standard error for the counting rate was ±1. 0 per cent (given by $ 0 ). Sample activity was counted to 2, 560 counts and the standard error was ±2.0 percent for the counting rate.
Values are reported to two significant figures as milligrams of carbon per cubic meter of water per day (mg C/m3 /day), and as milligrams of carbon per square meter of sea surface per day (mg C/m2/day) to the depth of 0. 7 per cent of surface light.
Temperatures of the \Vater flowing through the incubators at the beginning and end of each experiment are given as degrees centigrade ( 0 C). They have been rounded off to whole degrees.
Zooplankton
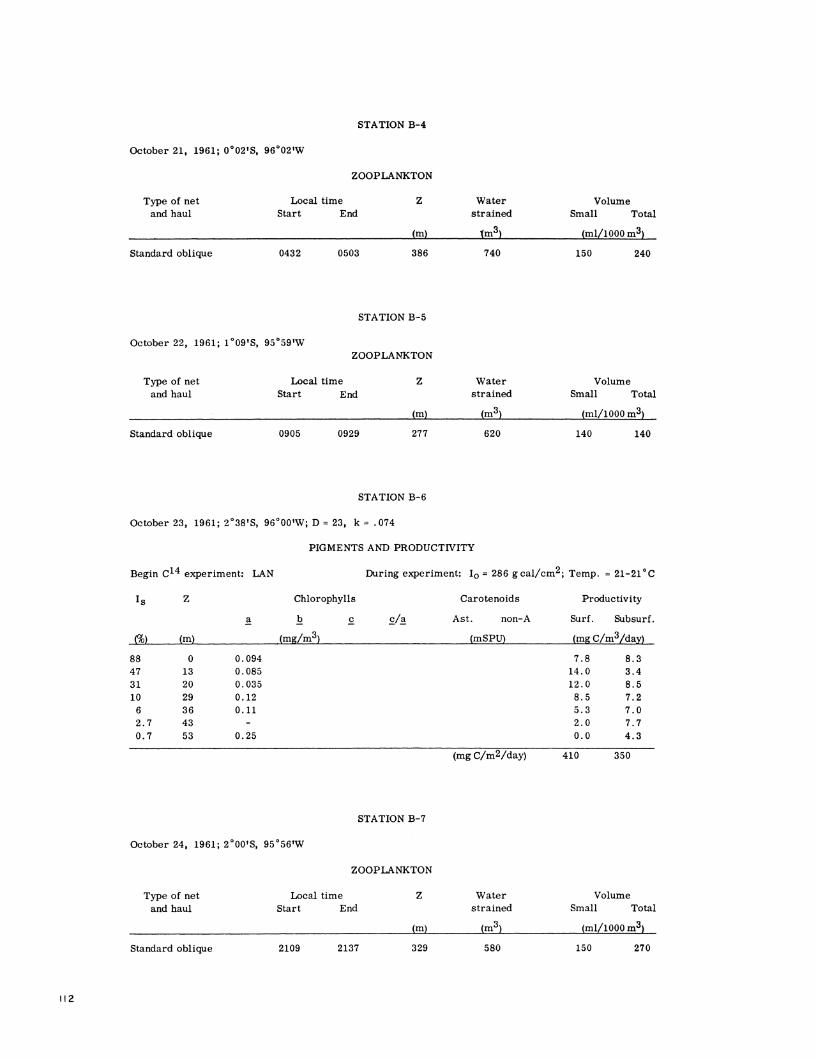
Two types of hauls were made: standard oblique meter-net hauls and simultaneous horizontal closing-net hauls using enlarged Clarke-Bumpus samplers (Paquette, Scott and Sund, 1961). Three Clarke- Bumpus samplers were positioned above, in and below the thermocline. The procedures used throughout the cruise for zooplankton net hauls were the same as those described in Scripps In st. Oceanogr. (1960).
ix

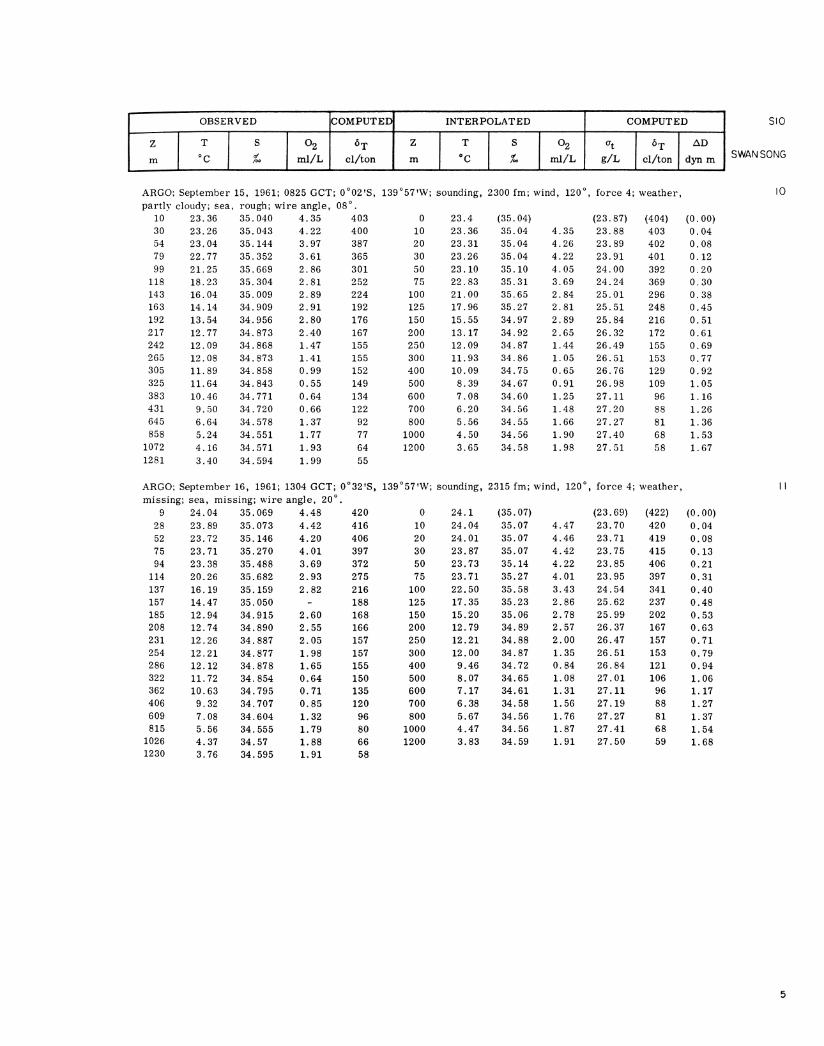
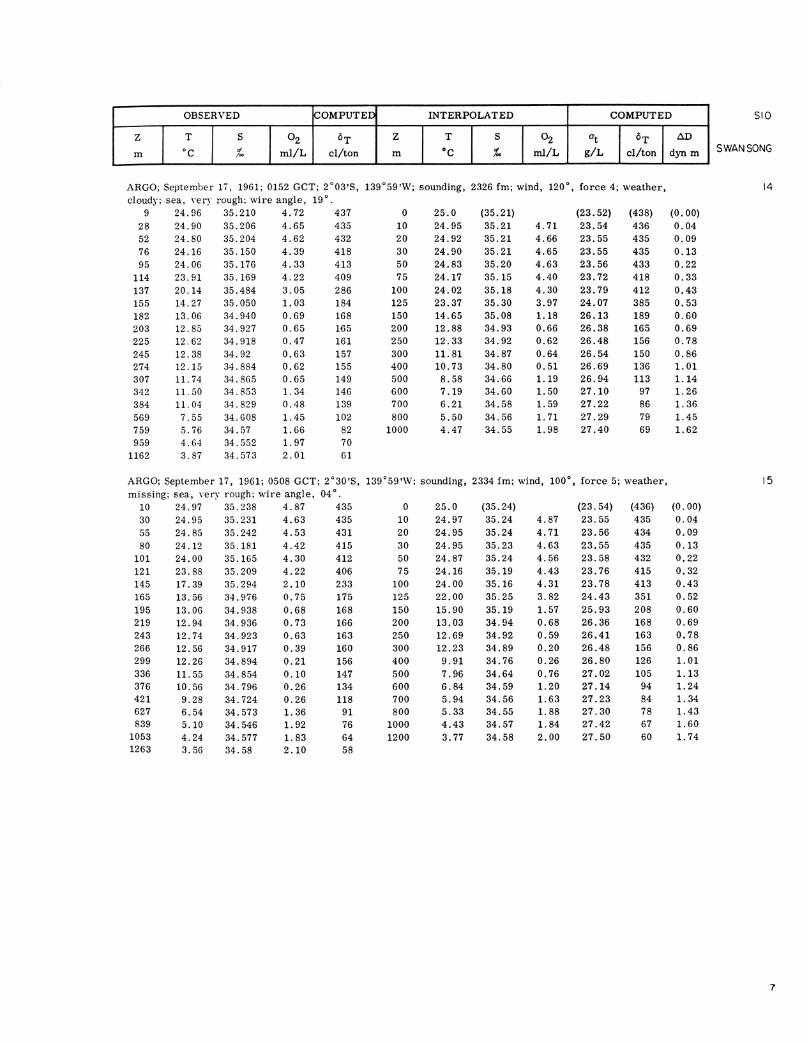
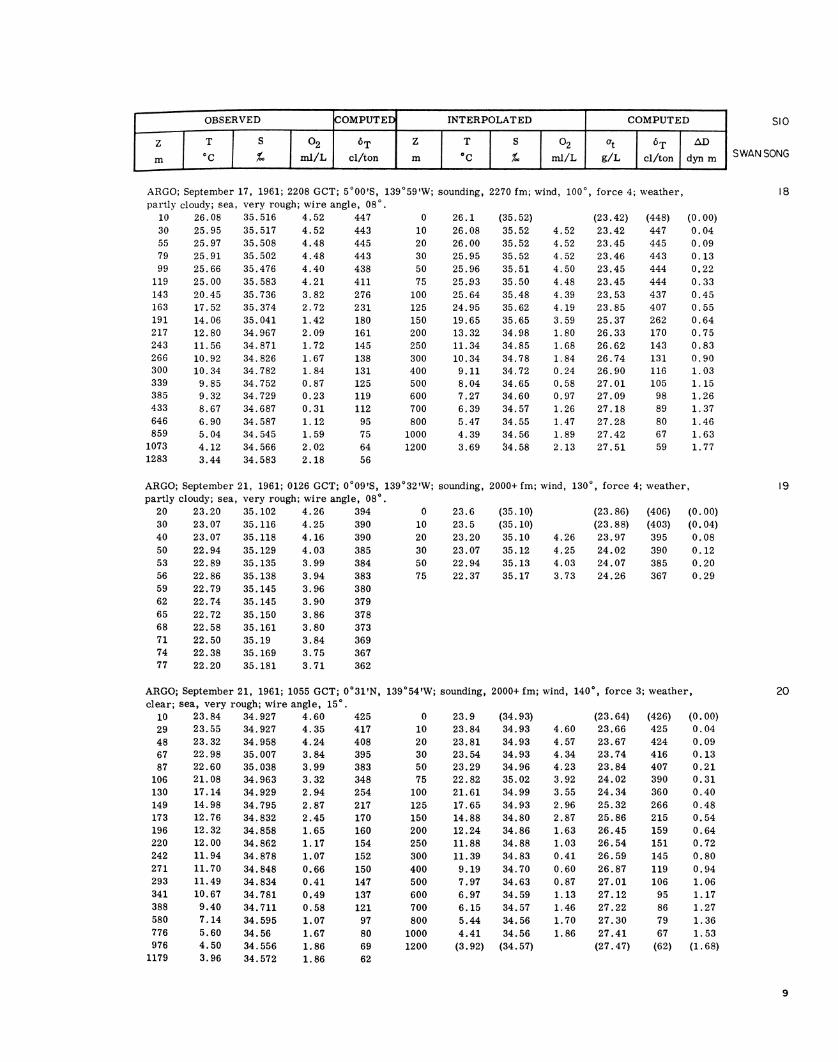
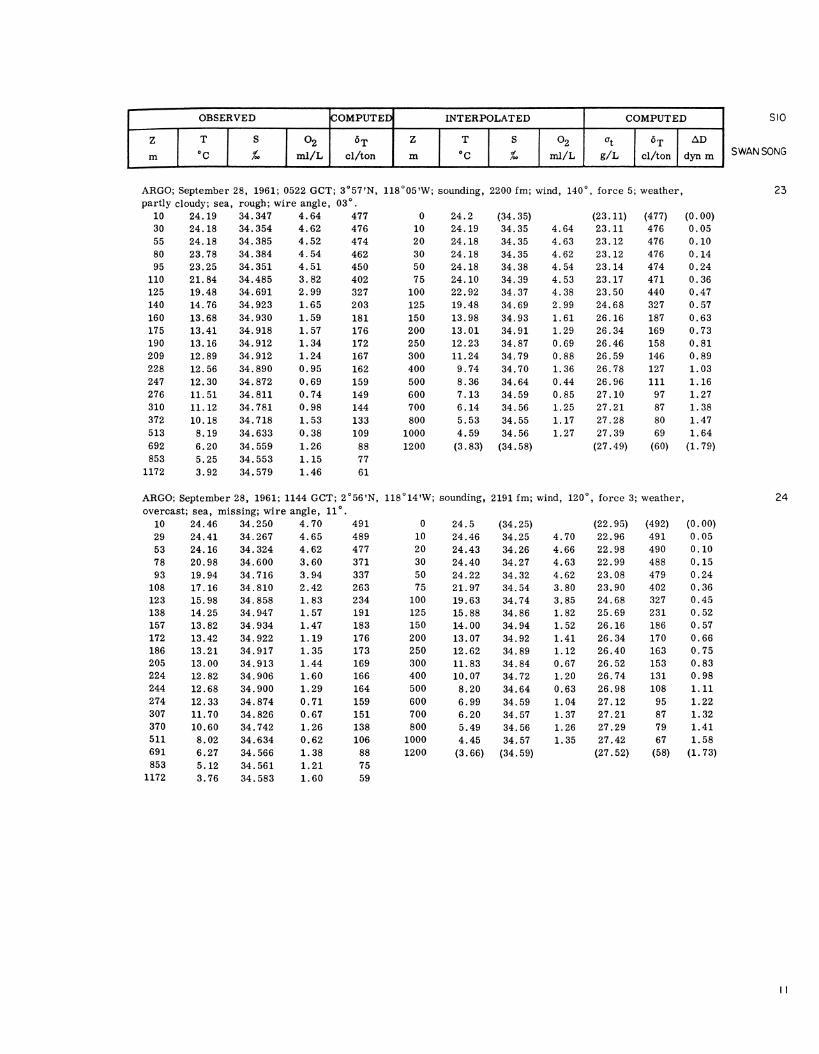
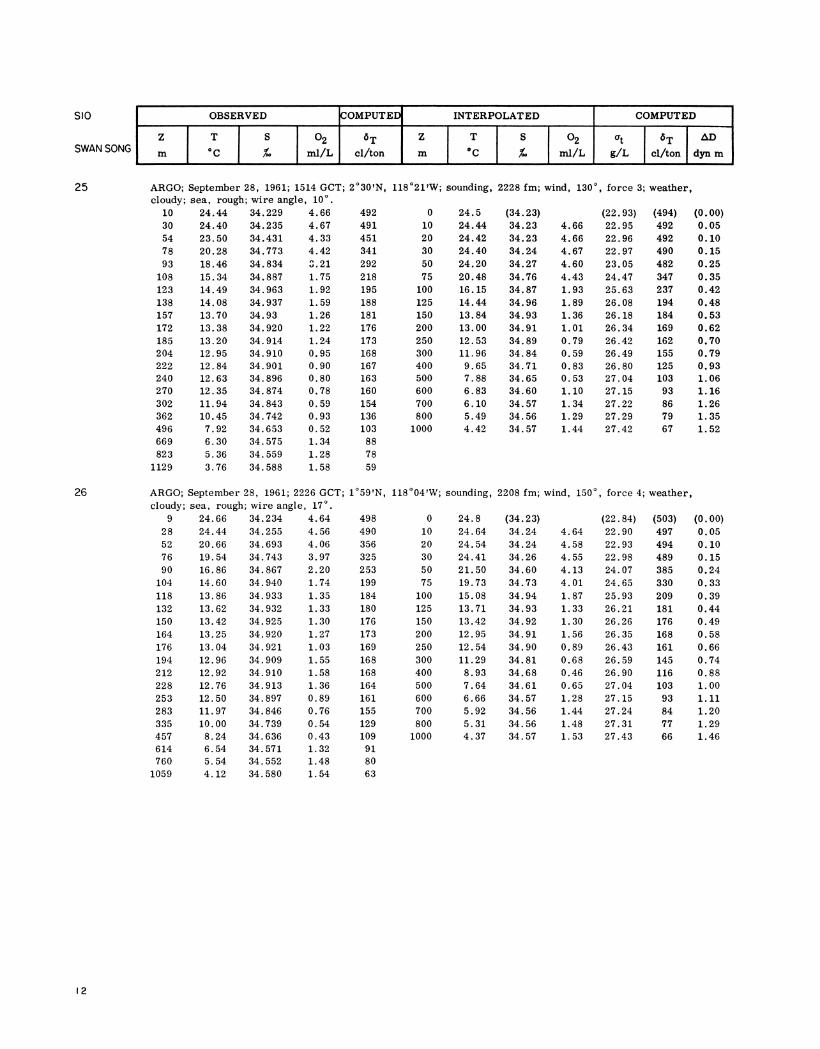
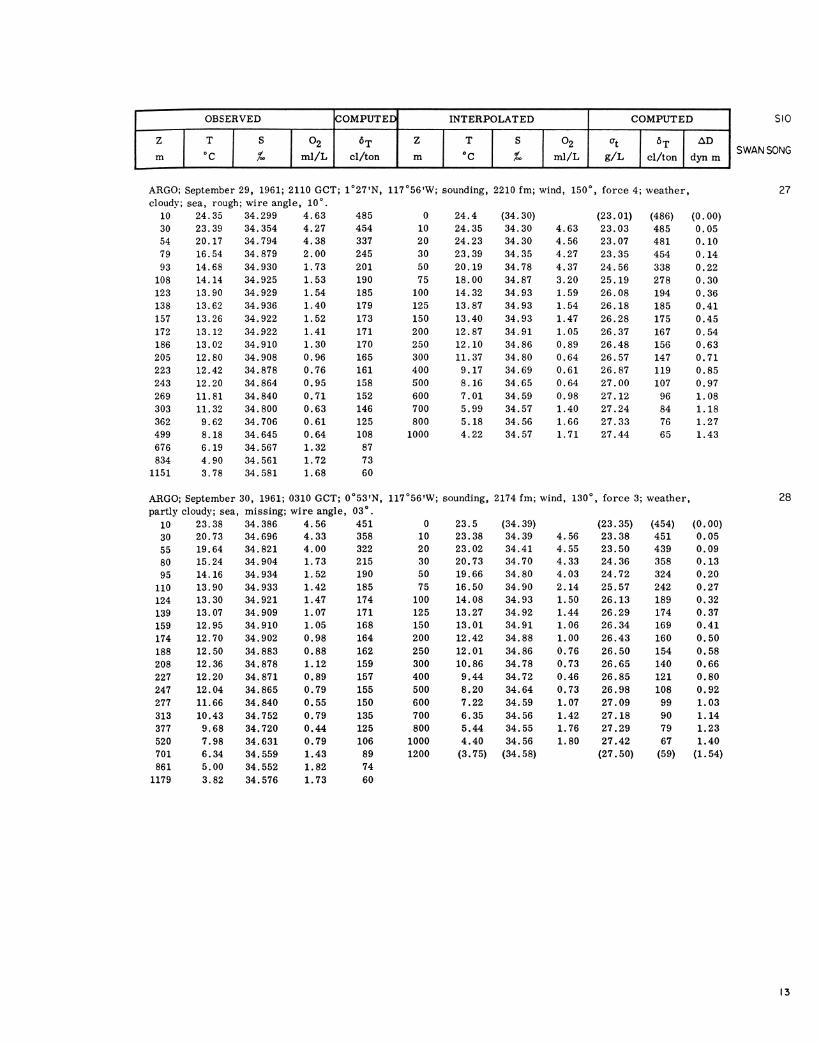
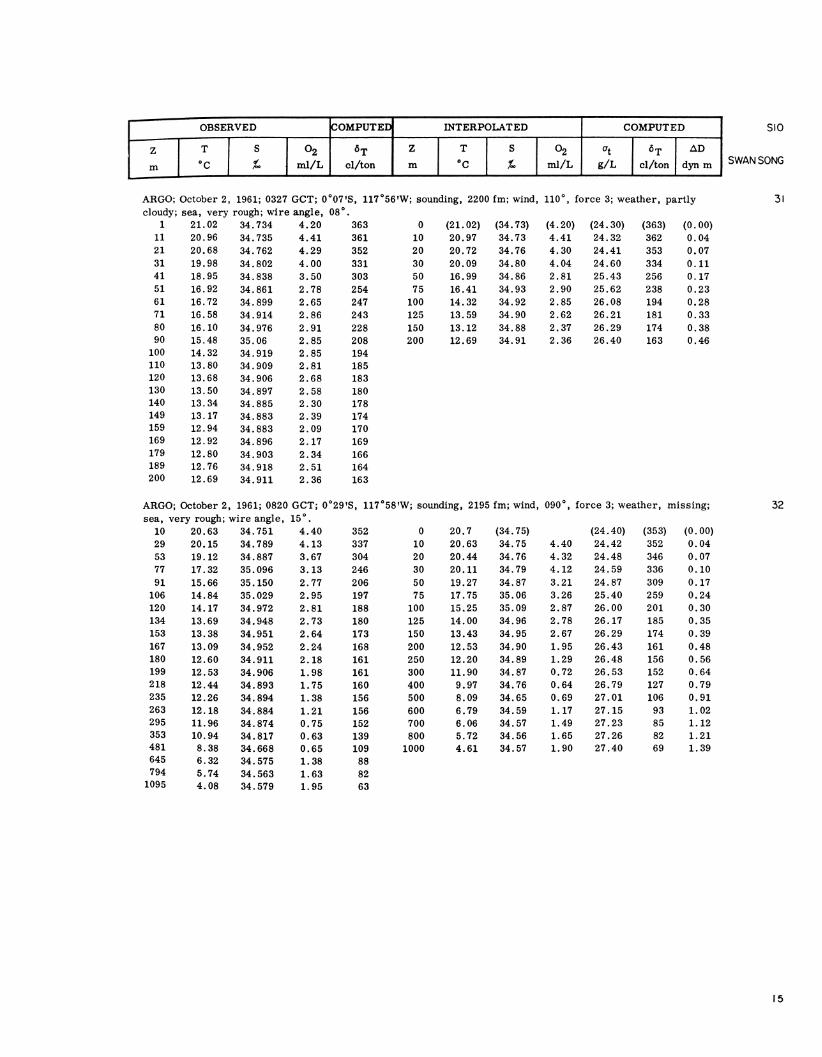
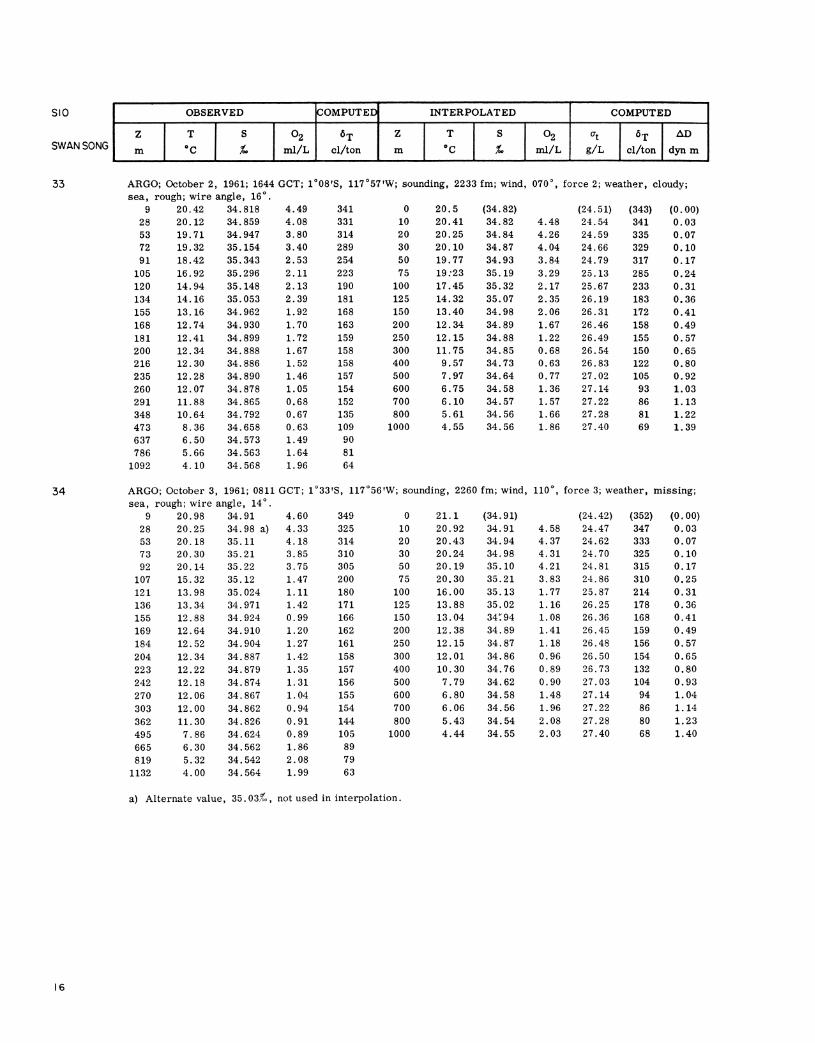
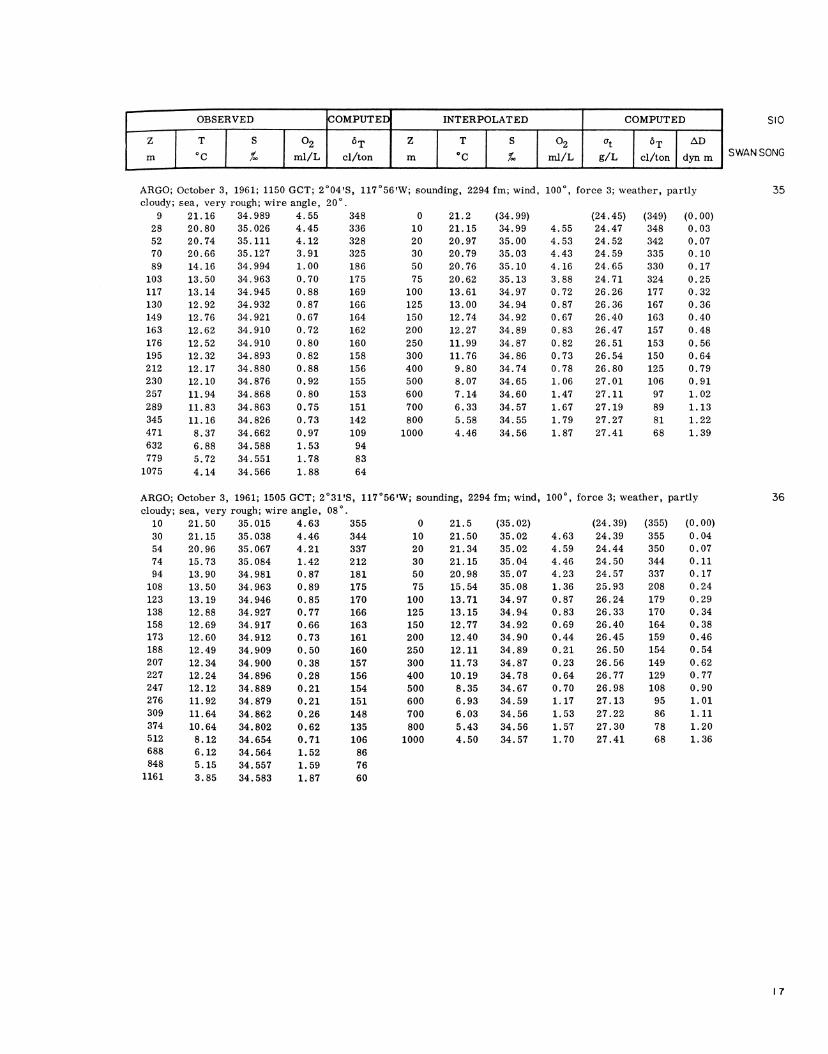
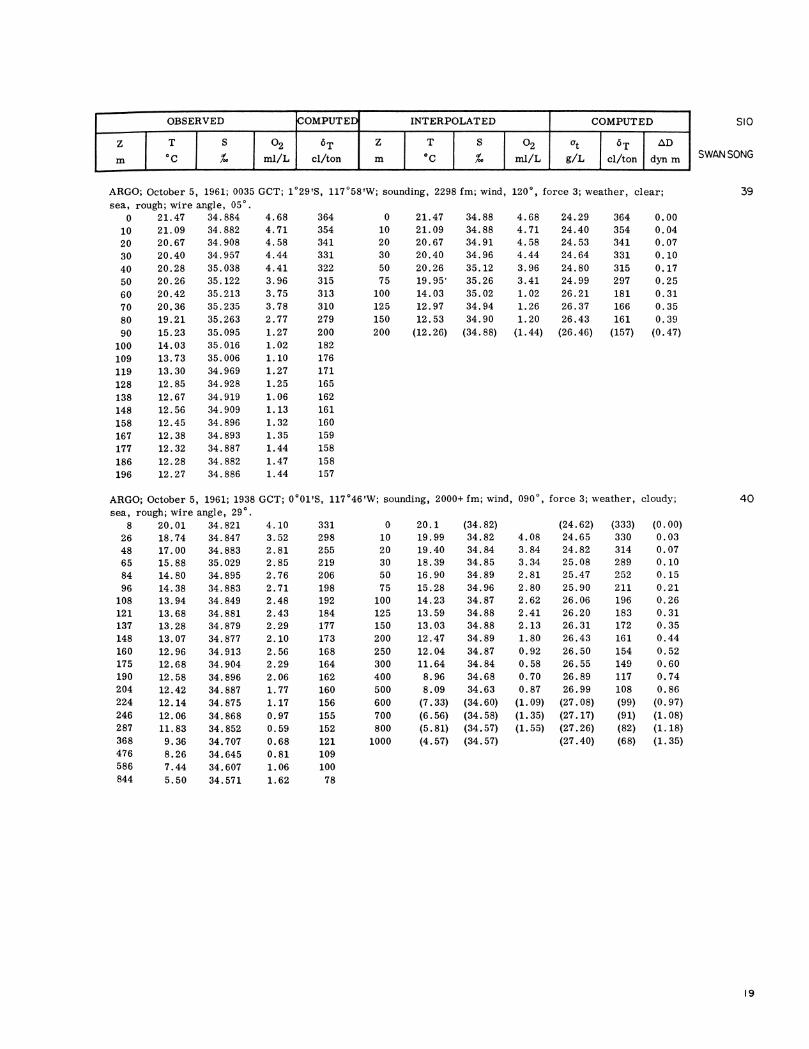
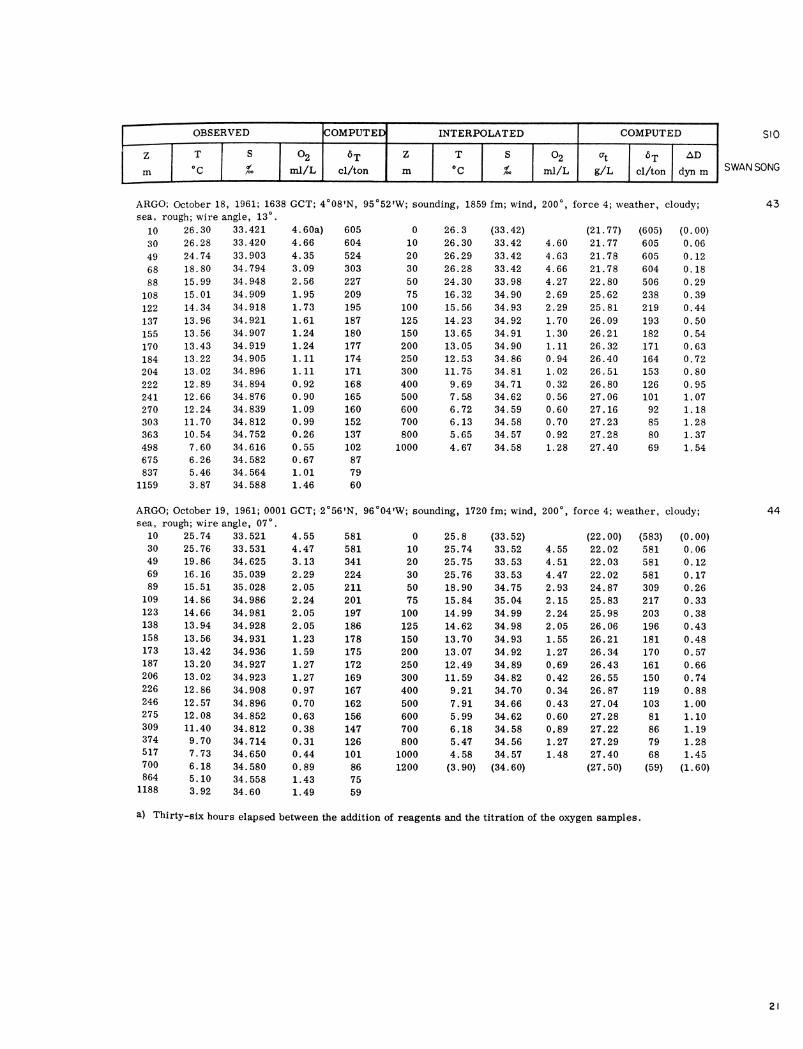
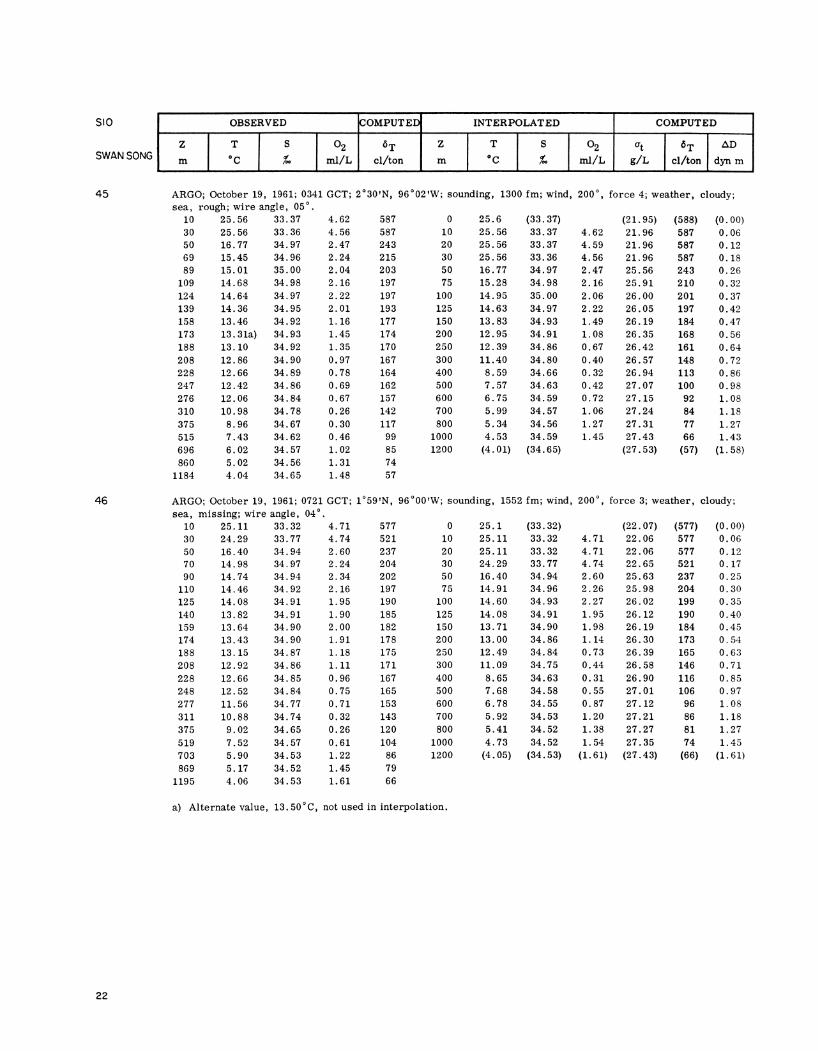
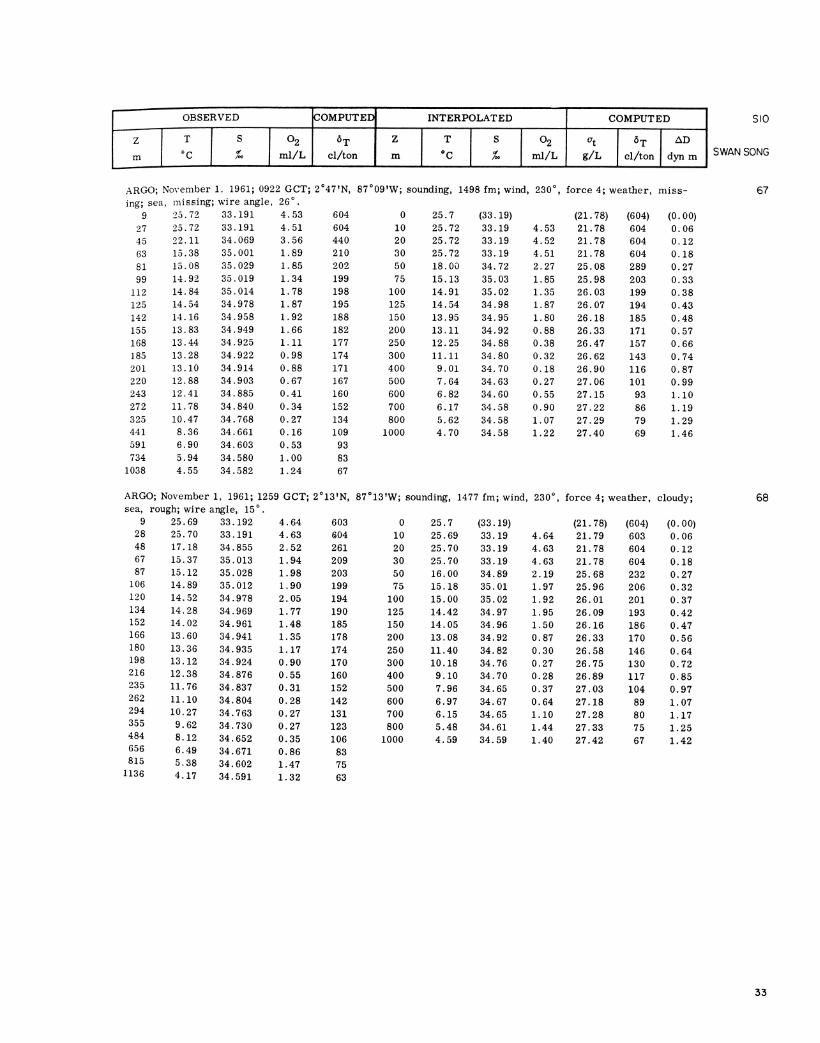
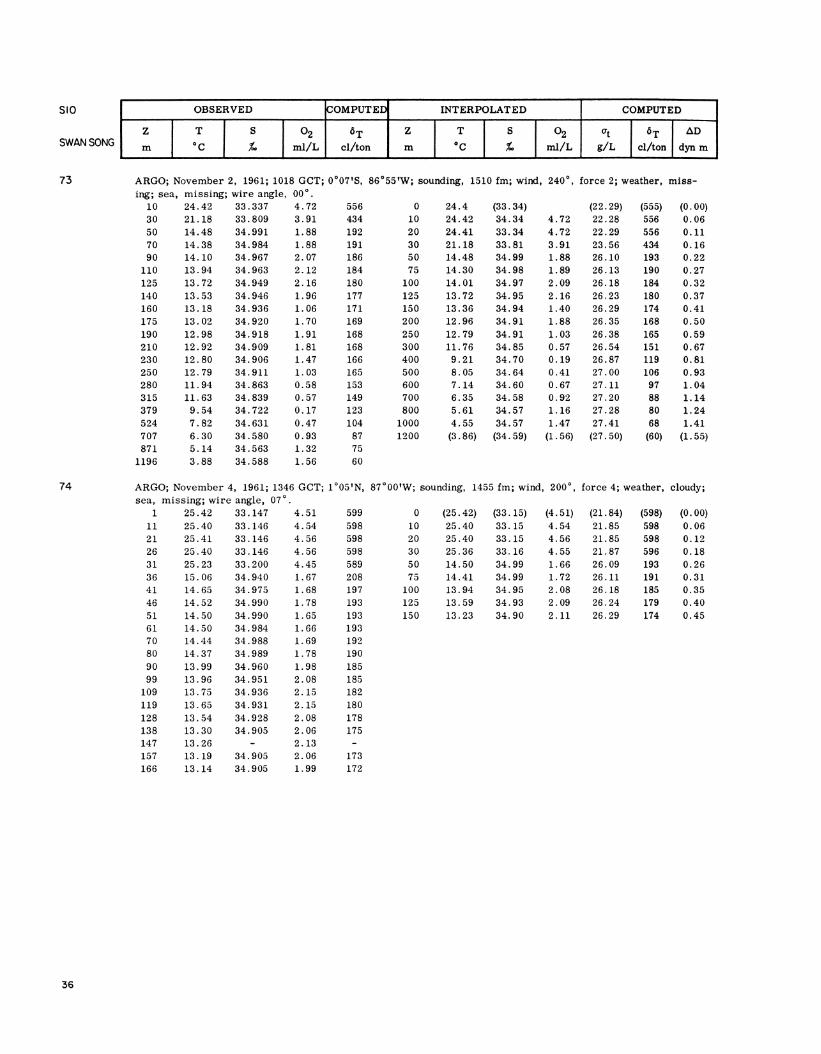
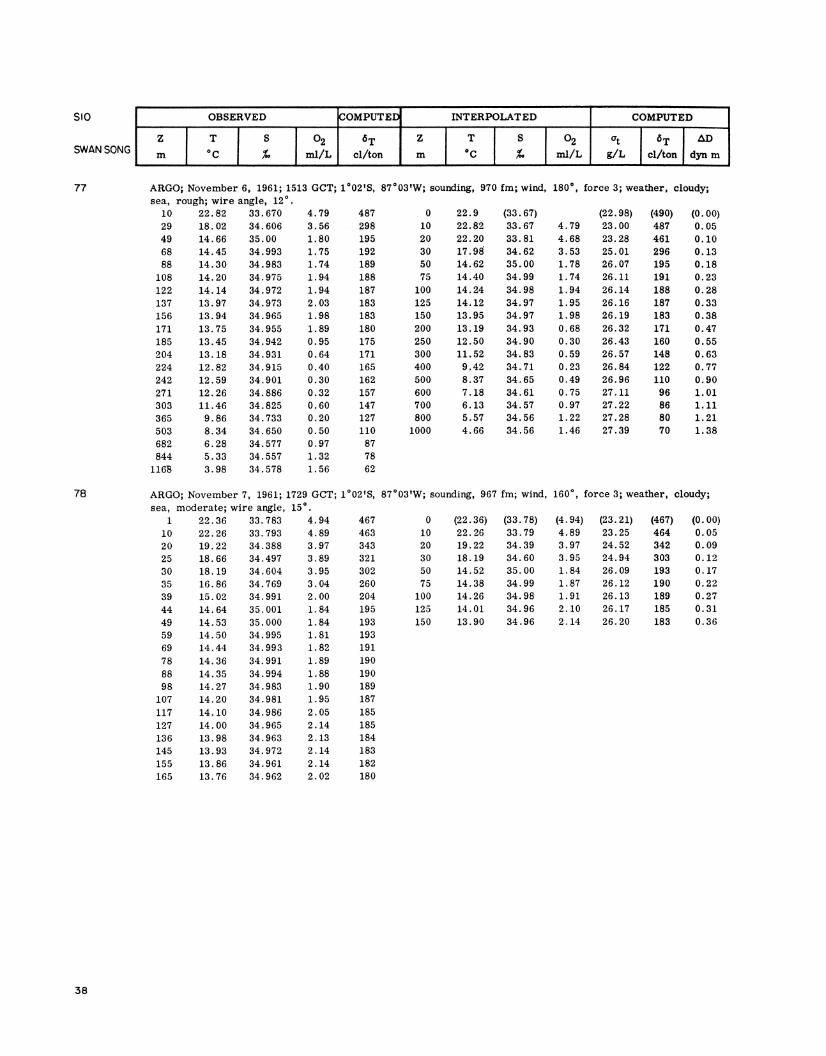
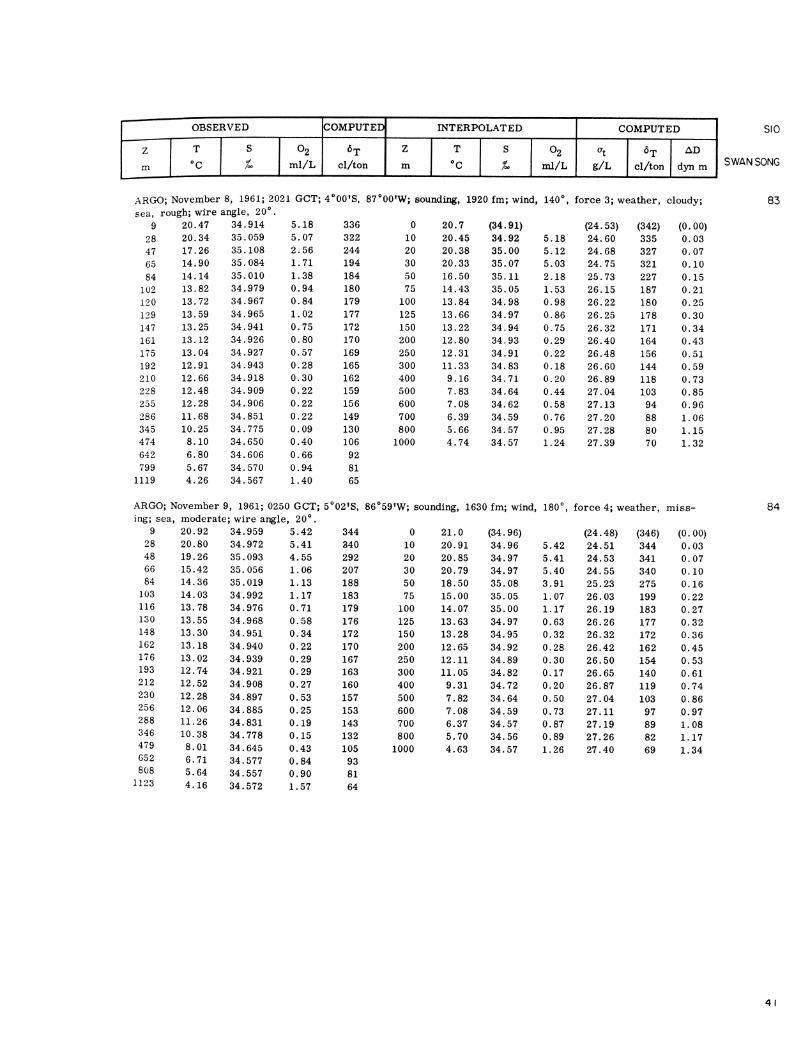
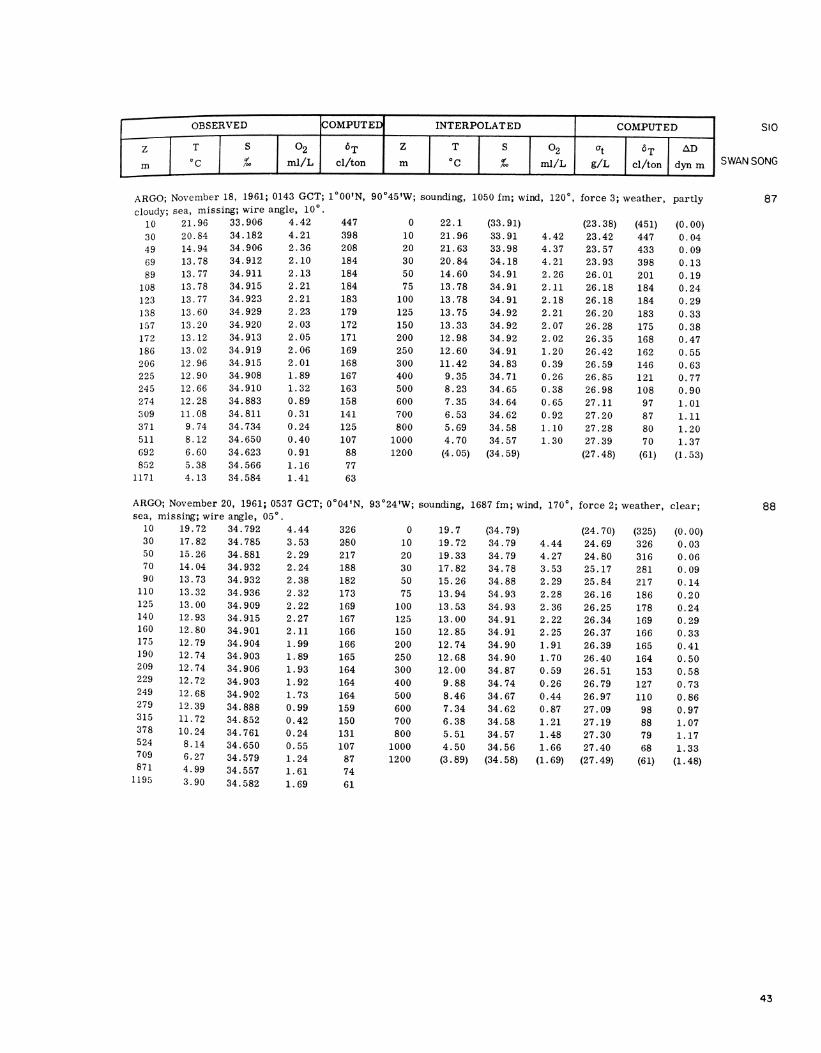
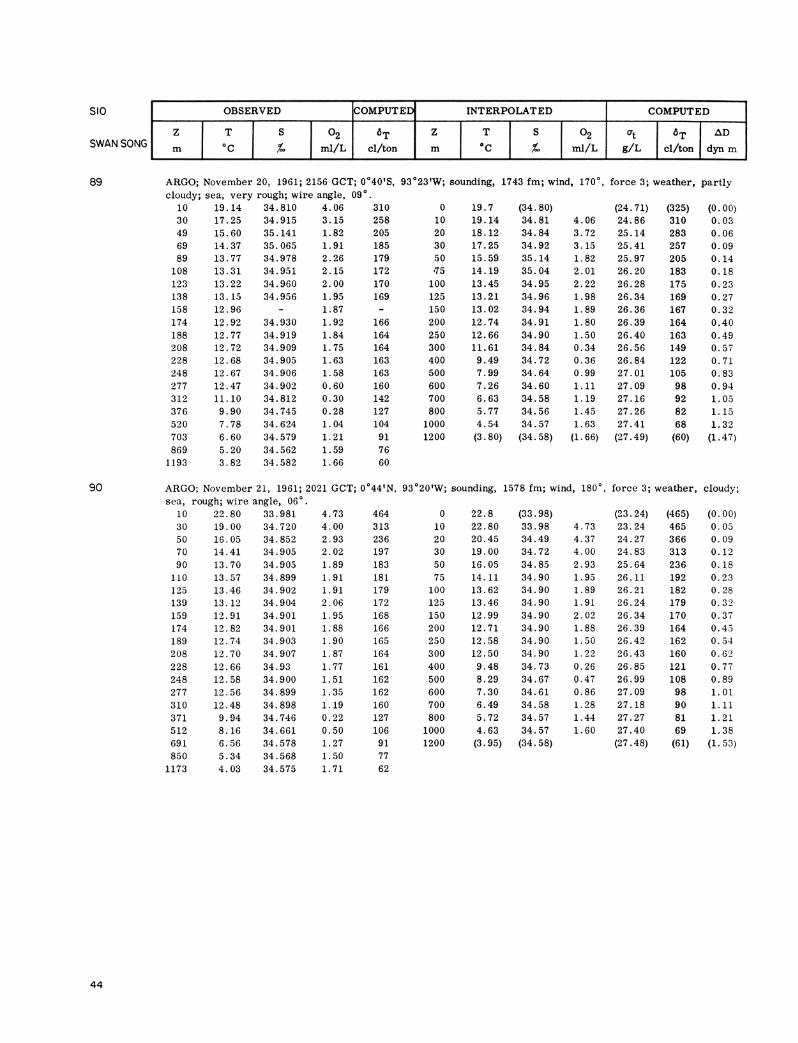
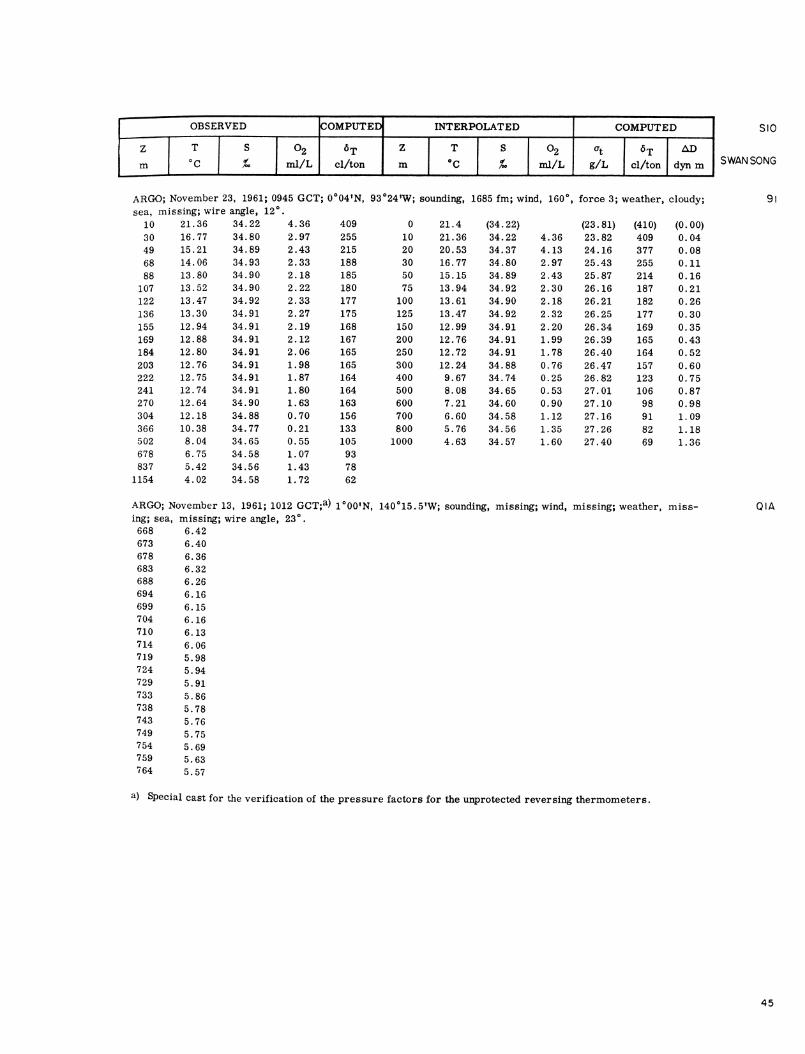
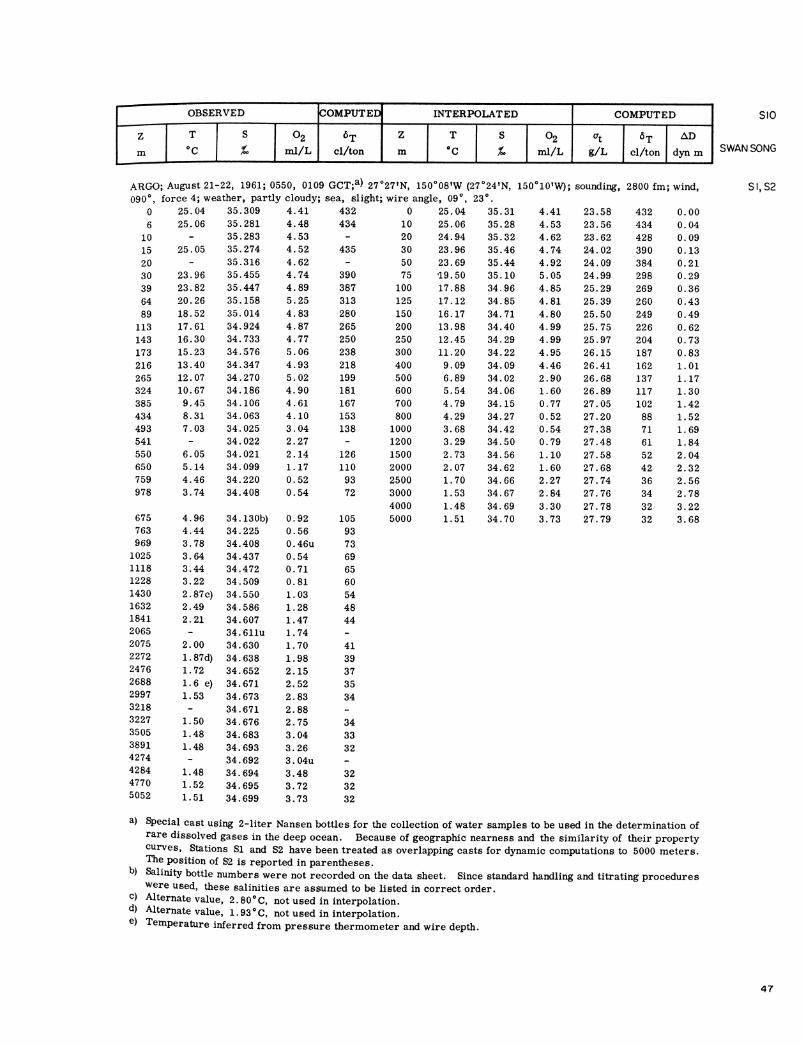
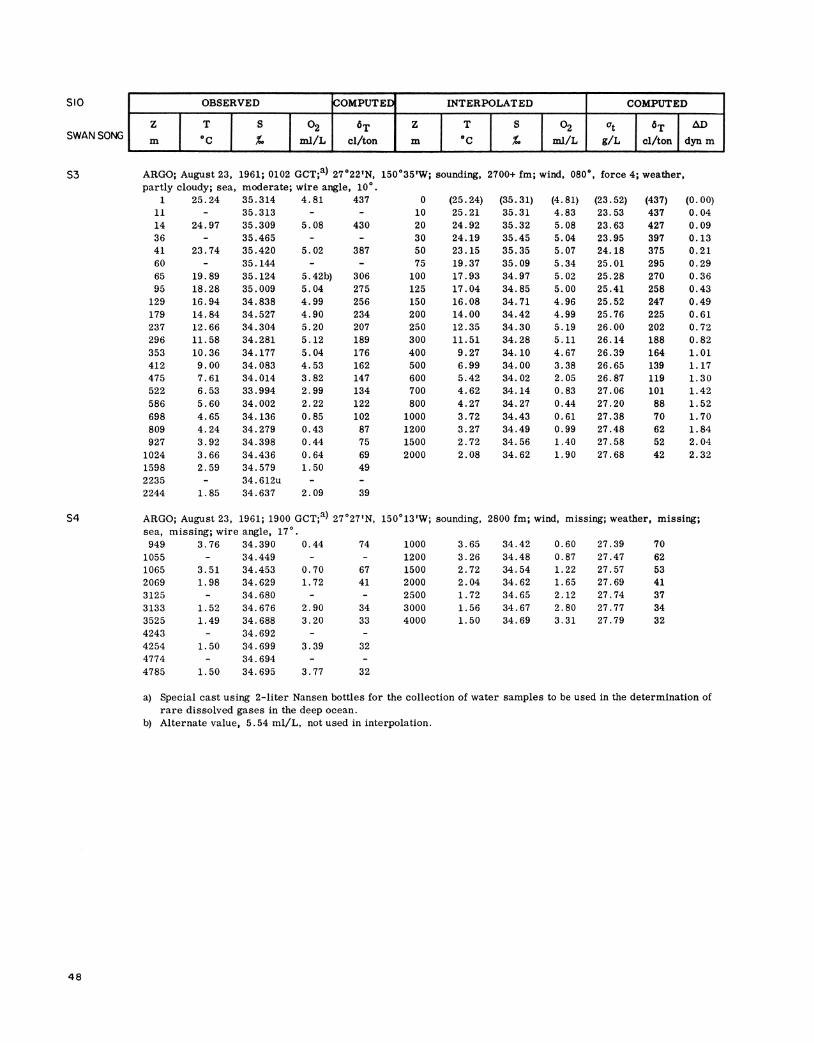
HYDROGRAPHIC STATIONS
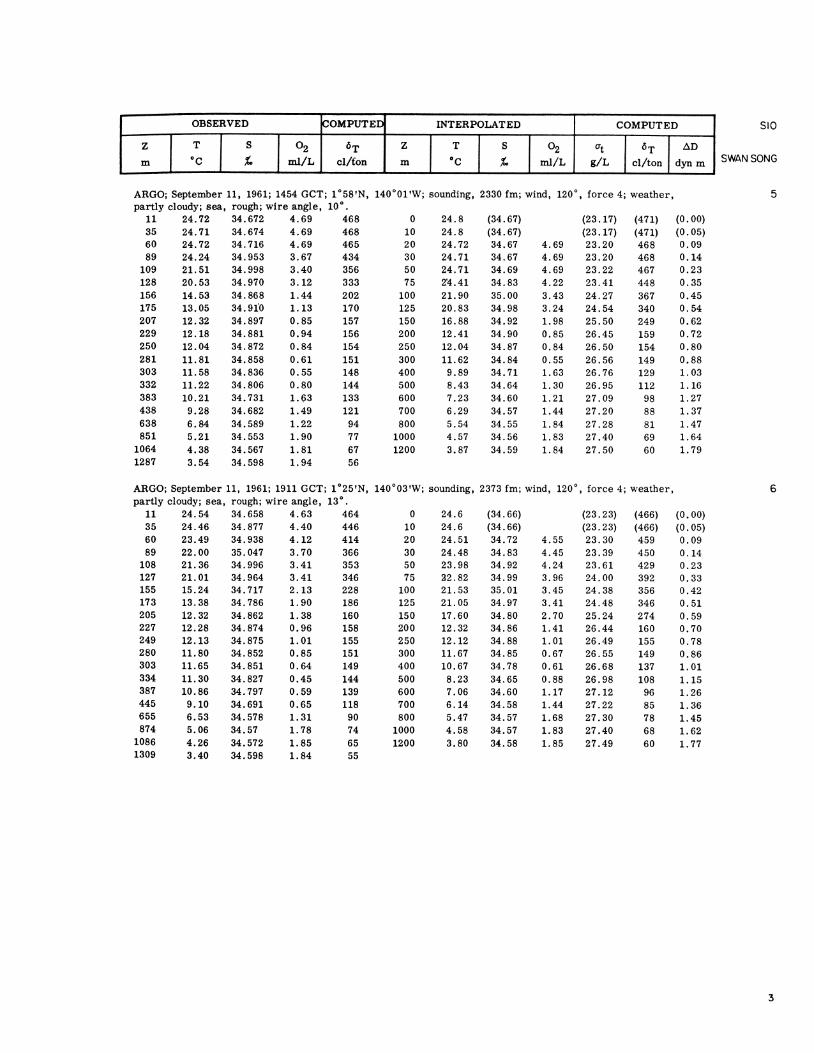
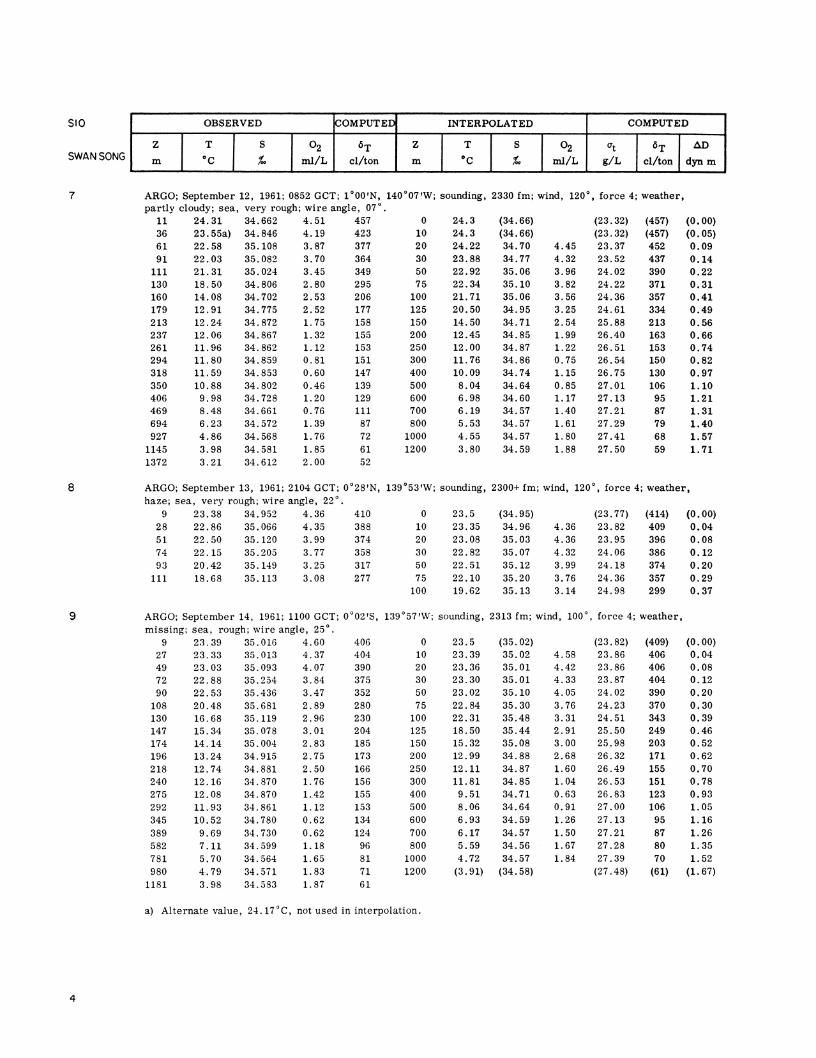
Except for a few 200 meter stations all stations were to 1200 meters. All casts had 21 ~ansen bottles and paired protected reversing thermometers. In addition eleven of the bottles were equipped with unprotected thermometers. It is believed that the temperature data are accurate to ±0.017°C (Wooster and Taft, 1958), and that depth is accurately determined to ±0. 5%.
All Nansen bottles were manufactured at the Scripps Institution and were internally coated with epoxy resin to minimize problems of contamination or oxygen uptake.
Salinity determinations were made in duplicate with a UW-ONL conductivity salinometer. When this instrument is functioning properly its precision is better than ±0. 005%o . The instrument aboard the Argo developed trouble part way through the cruise which was never completely rectified. By frequent standardization with Copenhagen water, however, we are confident that most of the salinity data are known to ±0. 005%o . For those data of which we are not certain, salinities are reported to the nearest hundredth rather than the nearest thousandth. In all cases we believe the salinity is known to at least ±0. 01%o .
Dissolved oxygen was determined by the Winkler method, single determinations being made routinely. Precision is estimated as ±0. 05 ml/L.
Interpolation of the observed properties to standard depths was done graphically by the Data Collection and Processing Group, Scripps Institution of Oceanography, from a method developed by Hans Klein . .!/ Density and dynamic heights at standard depths were machine calculated.
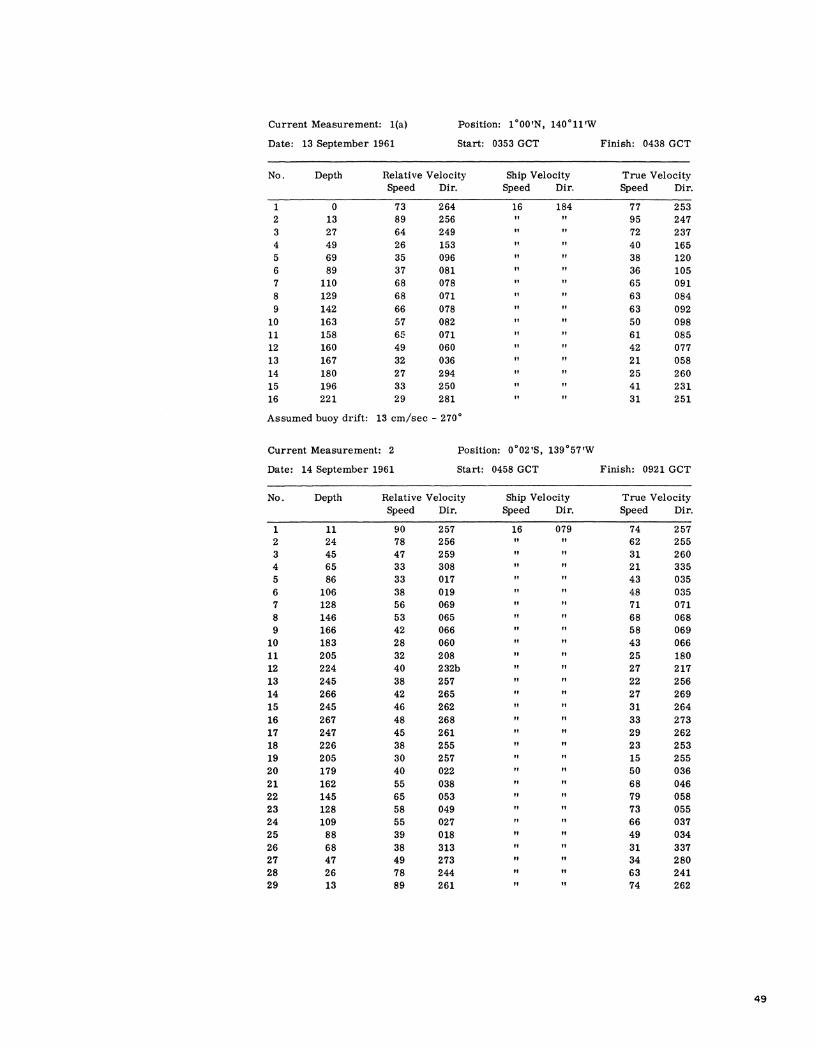
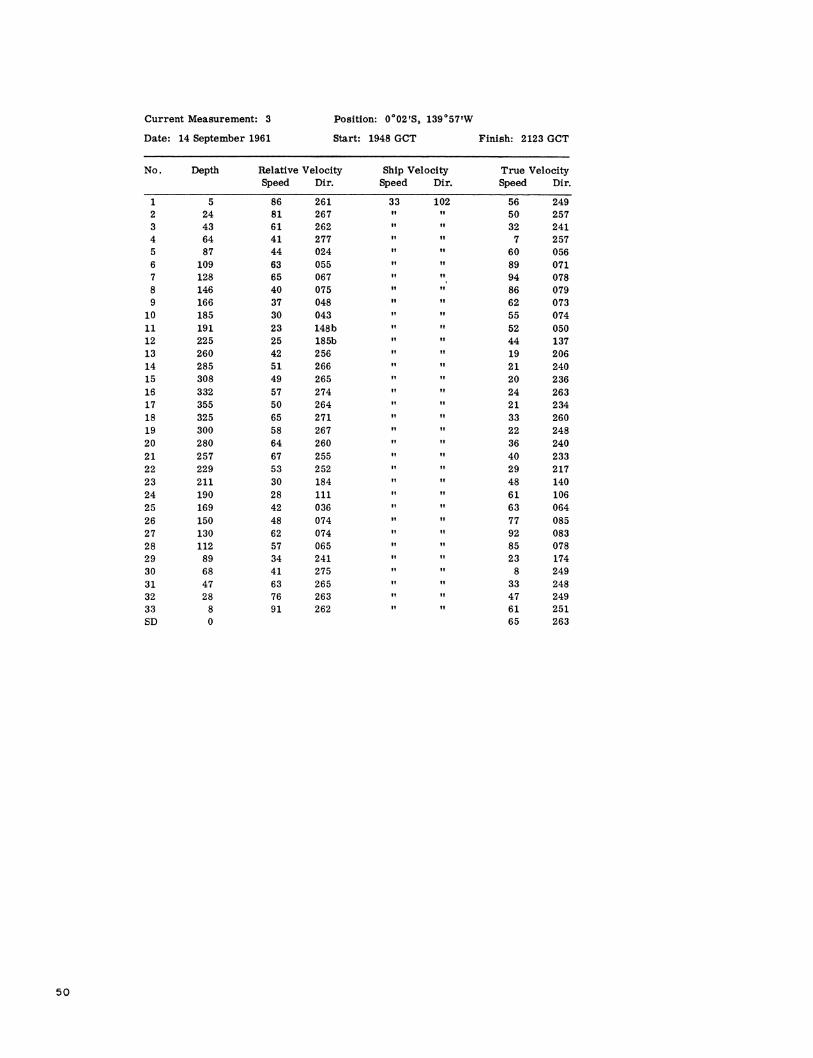
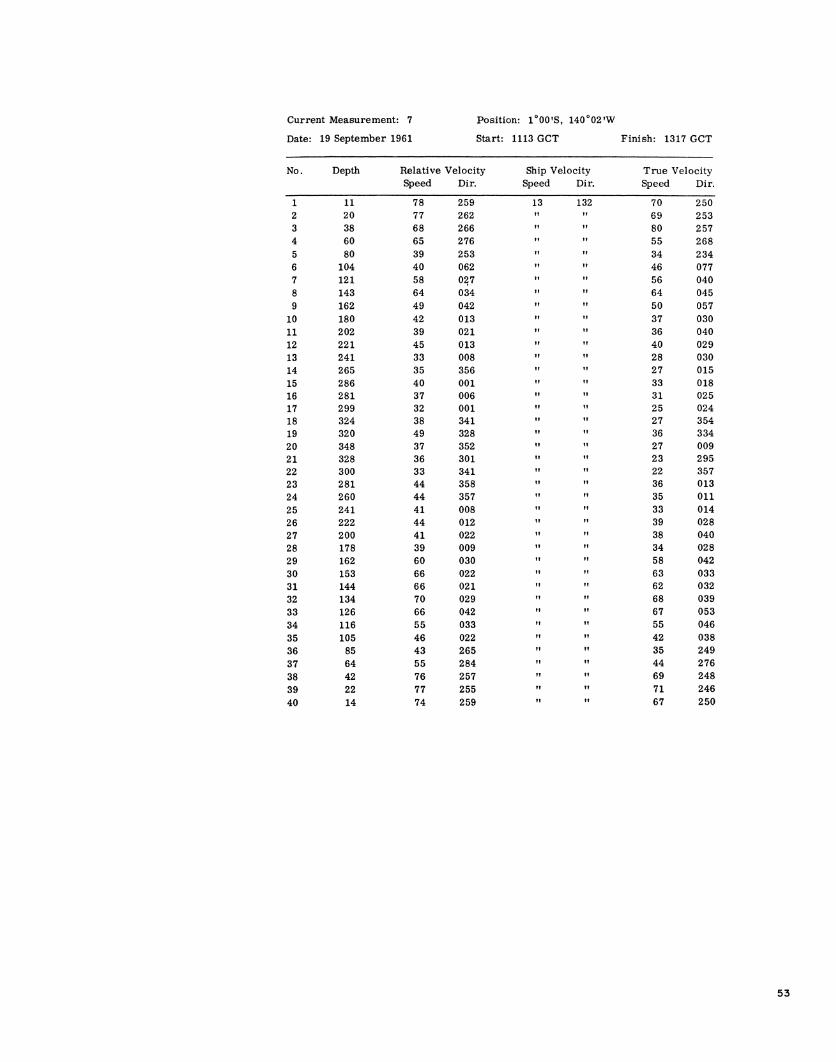
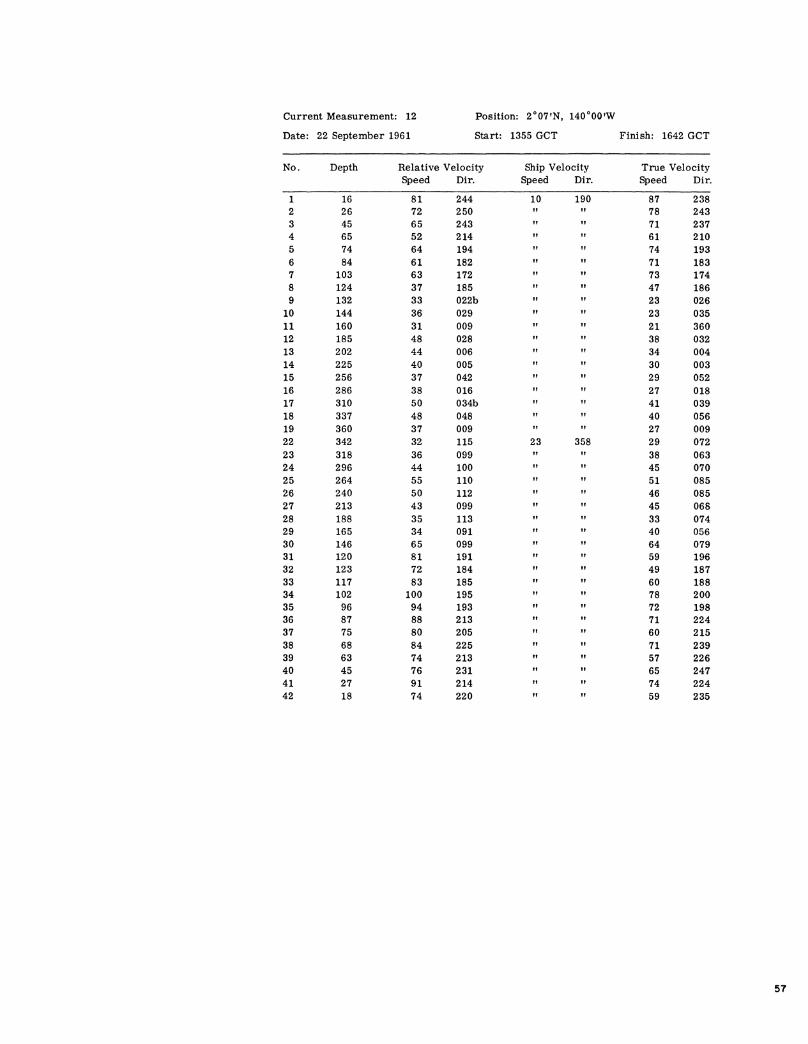
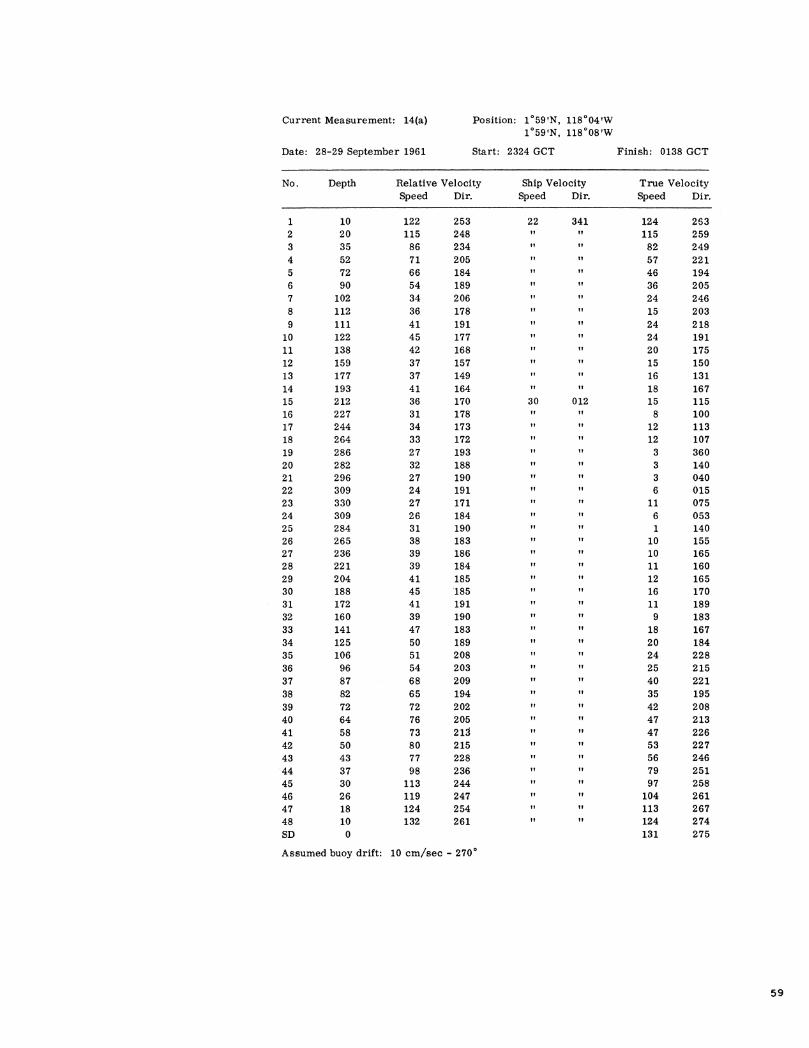
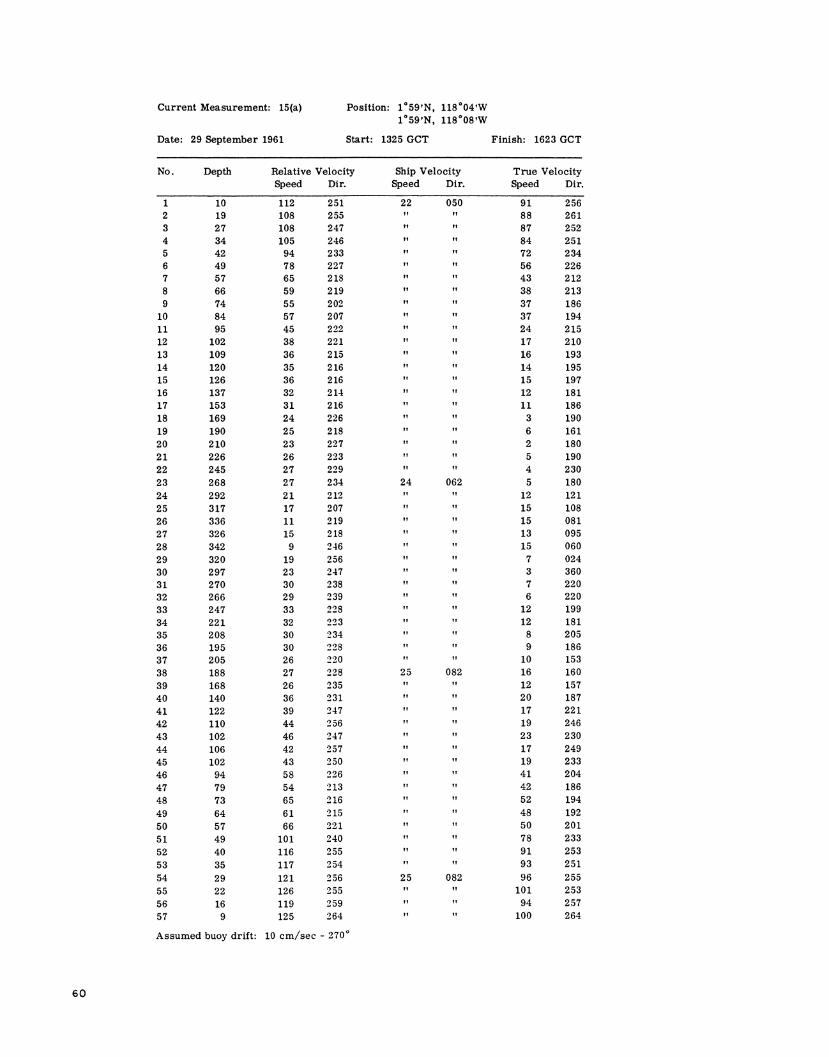
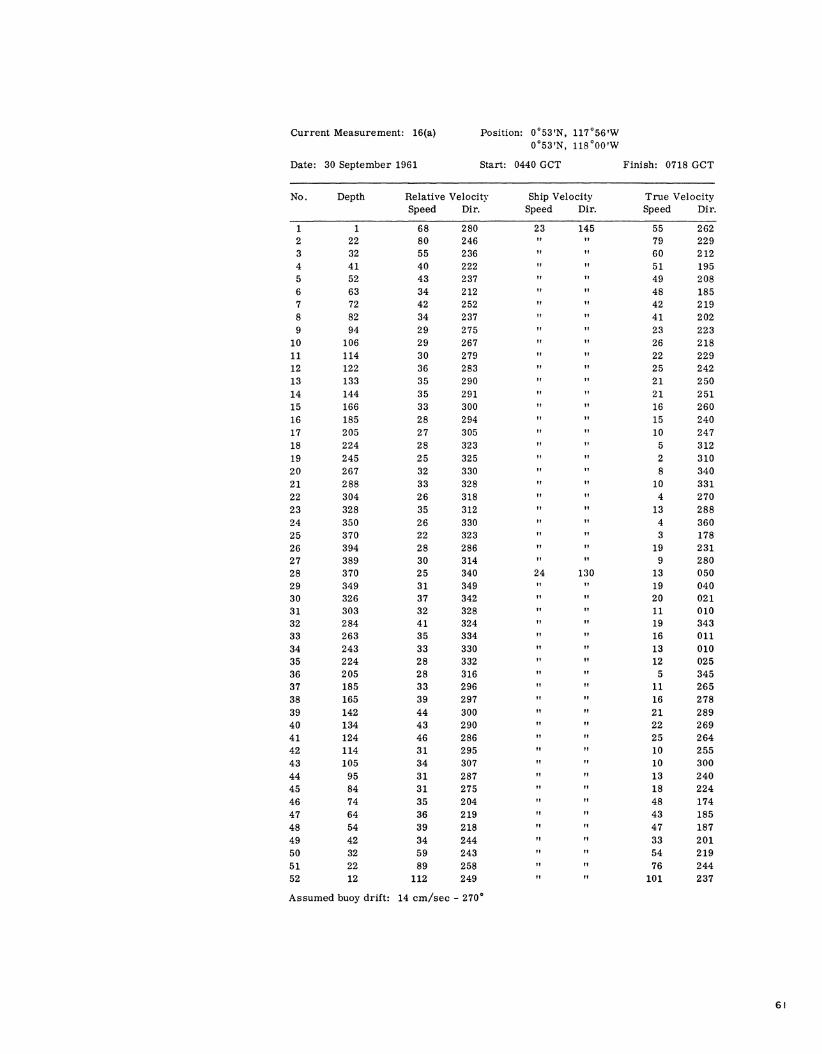
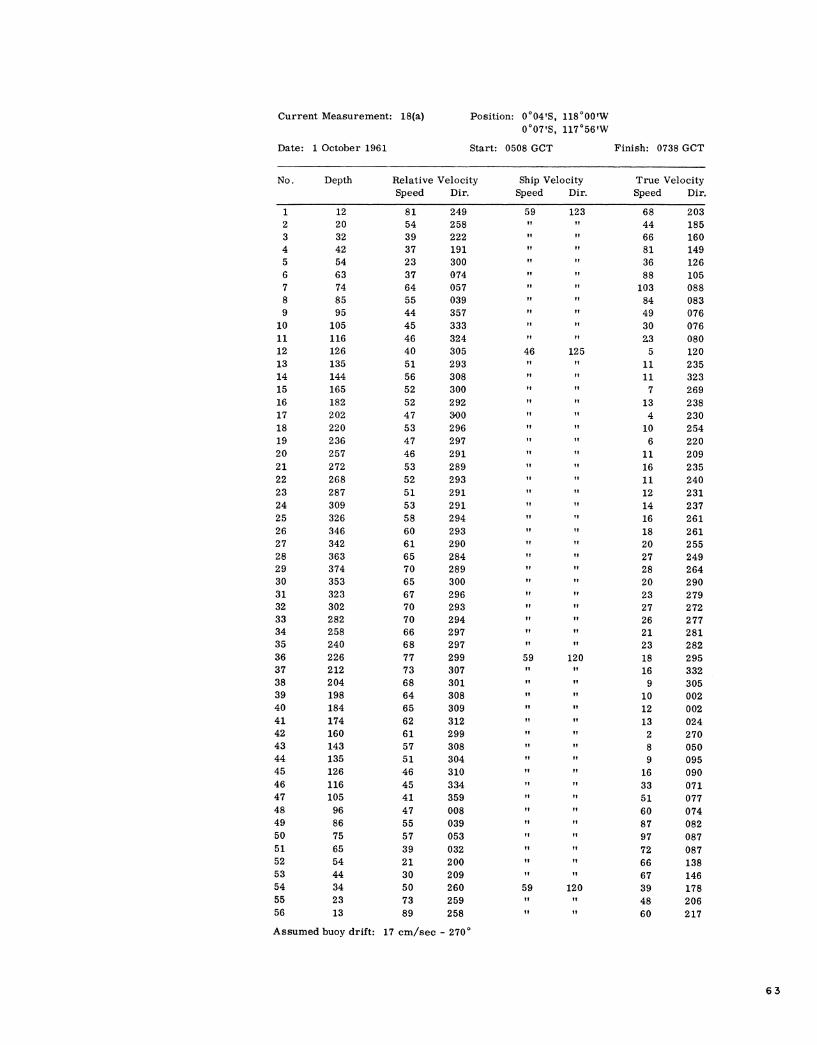
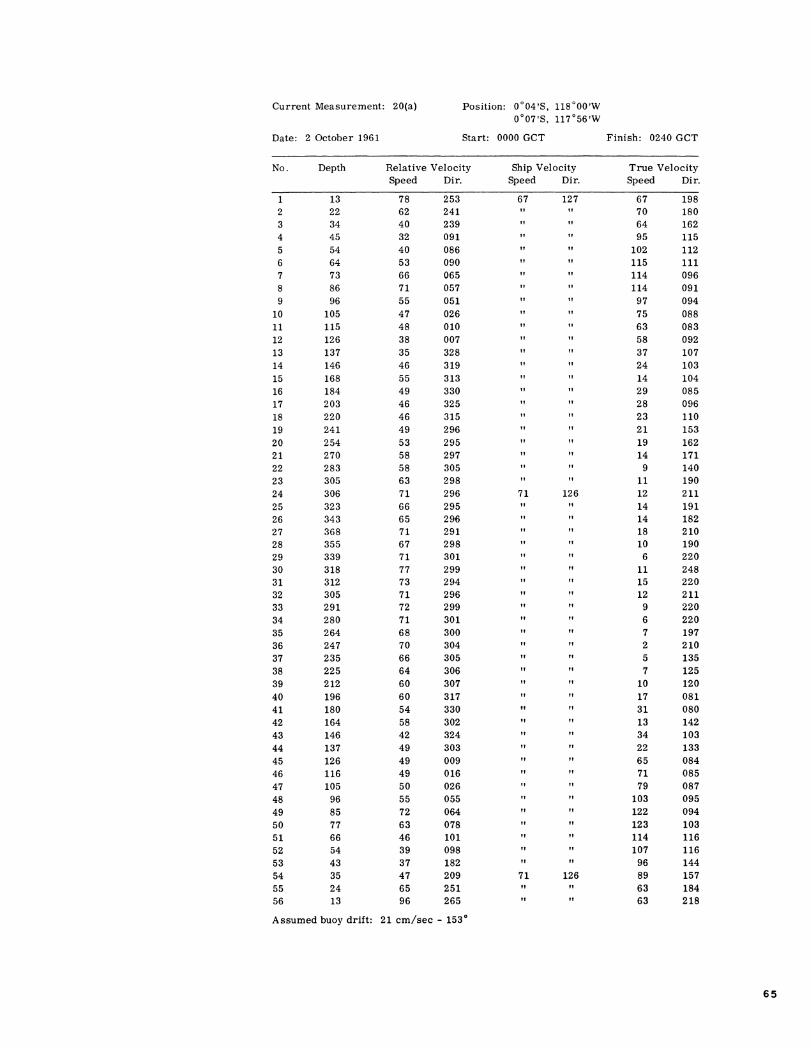
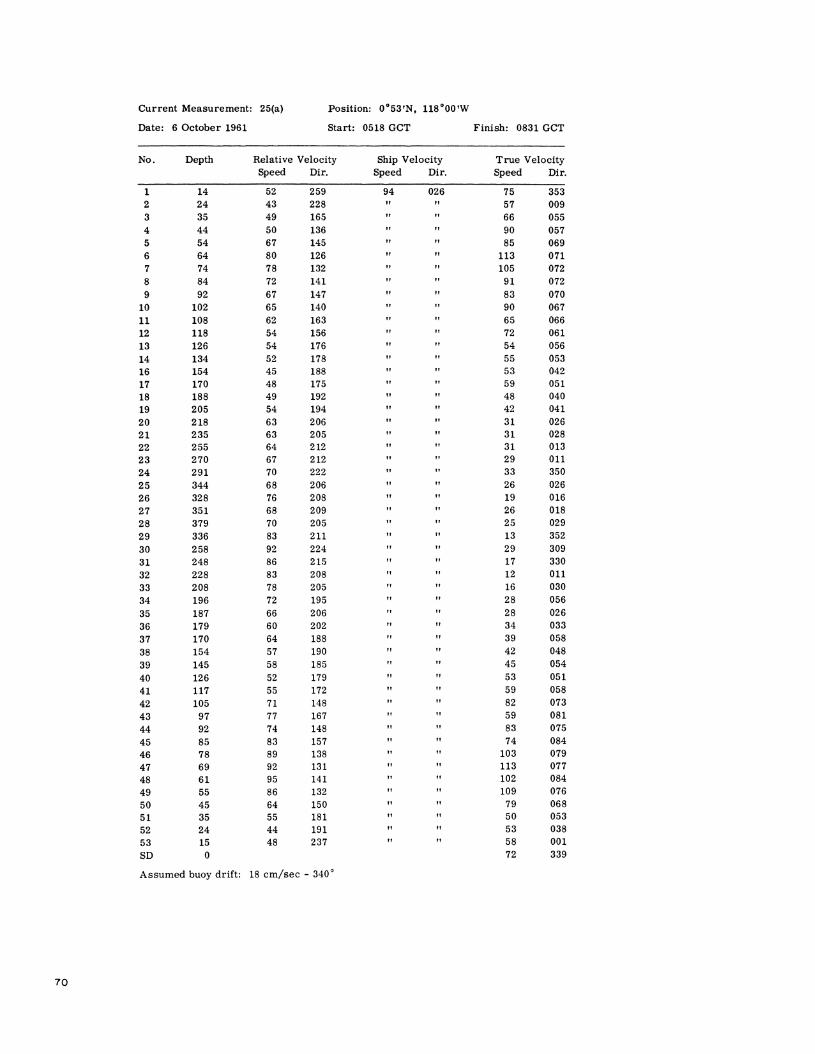
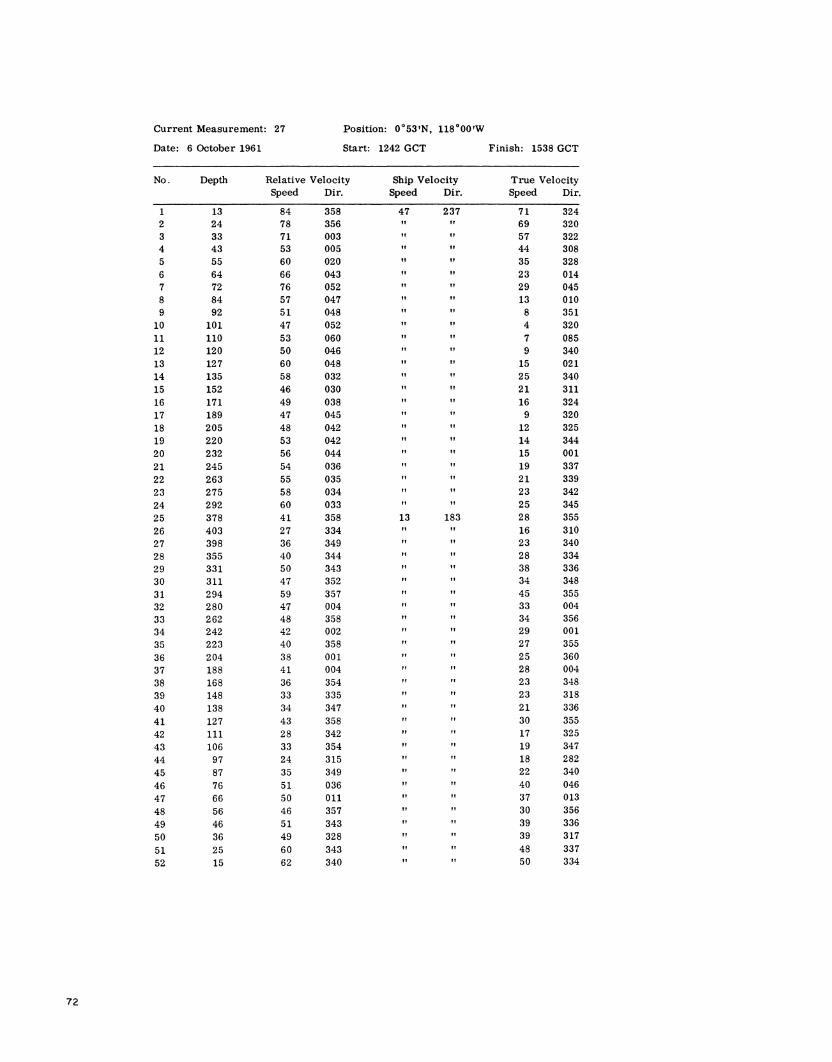
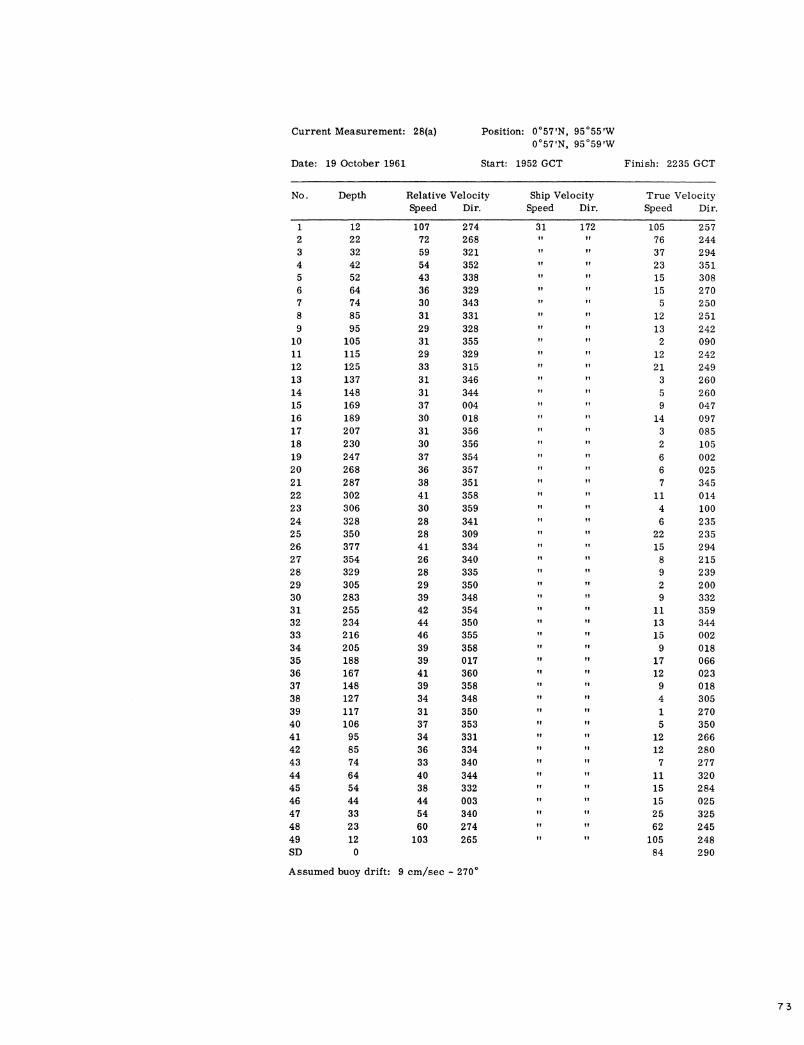
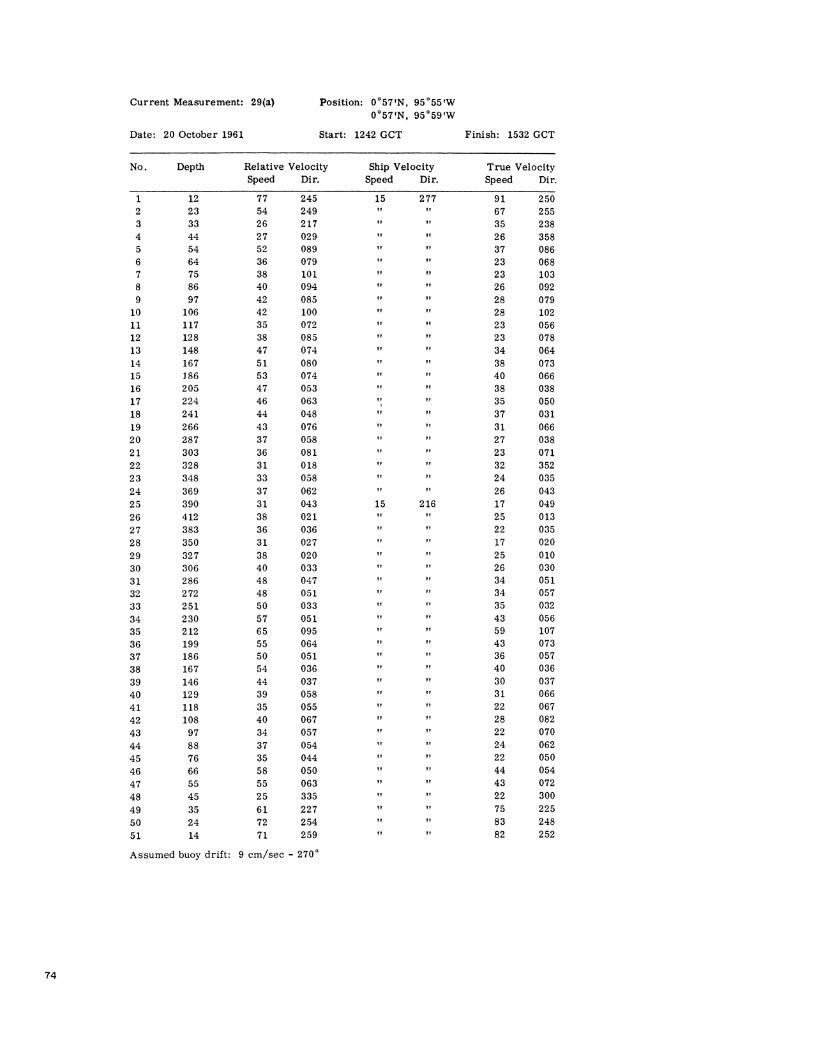
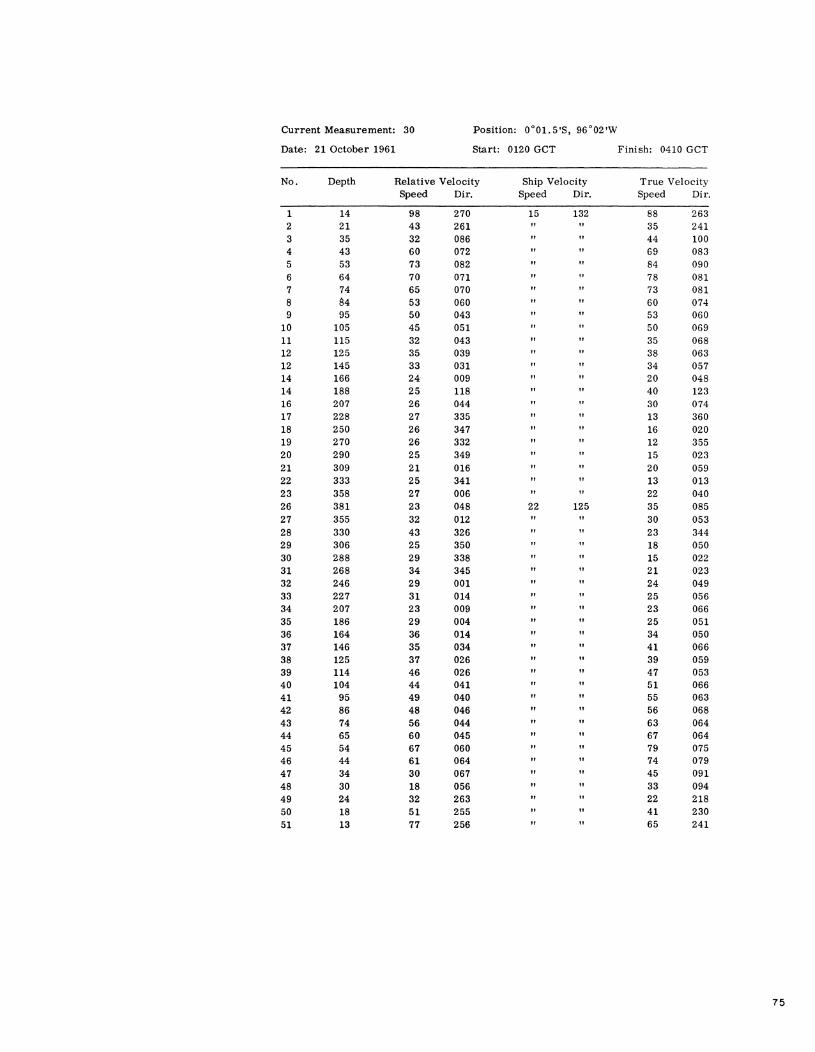
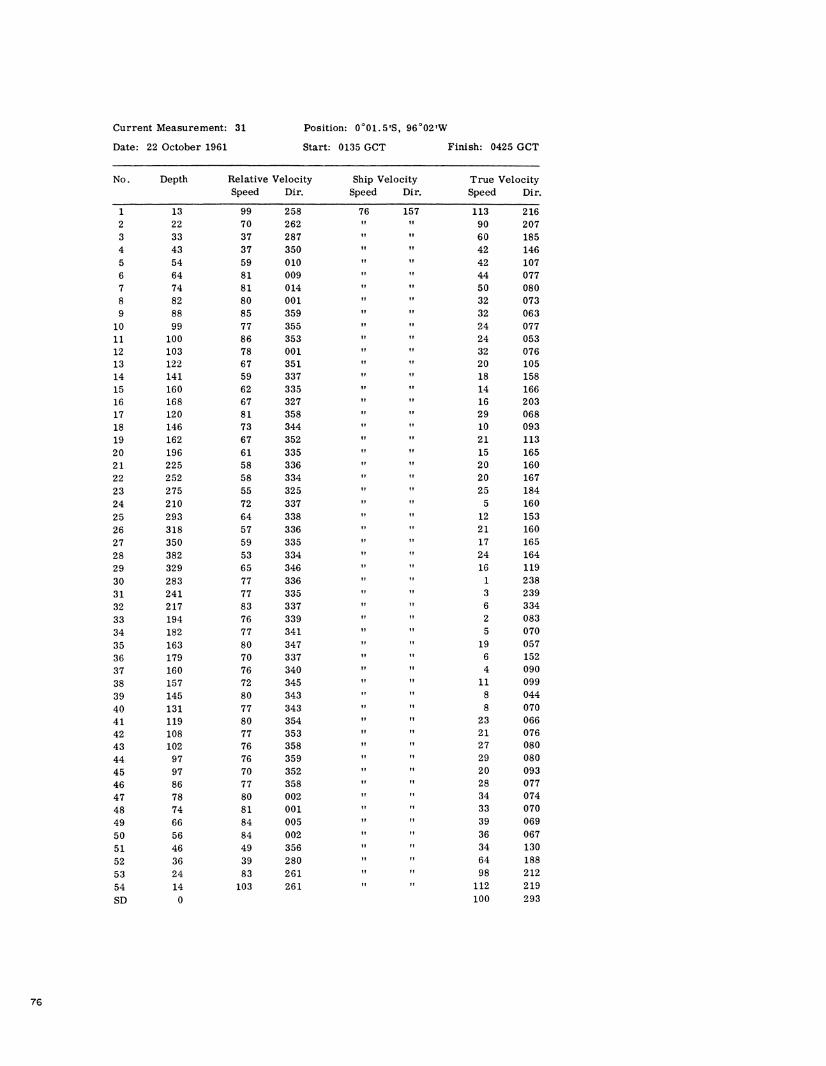
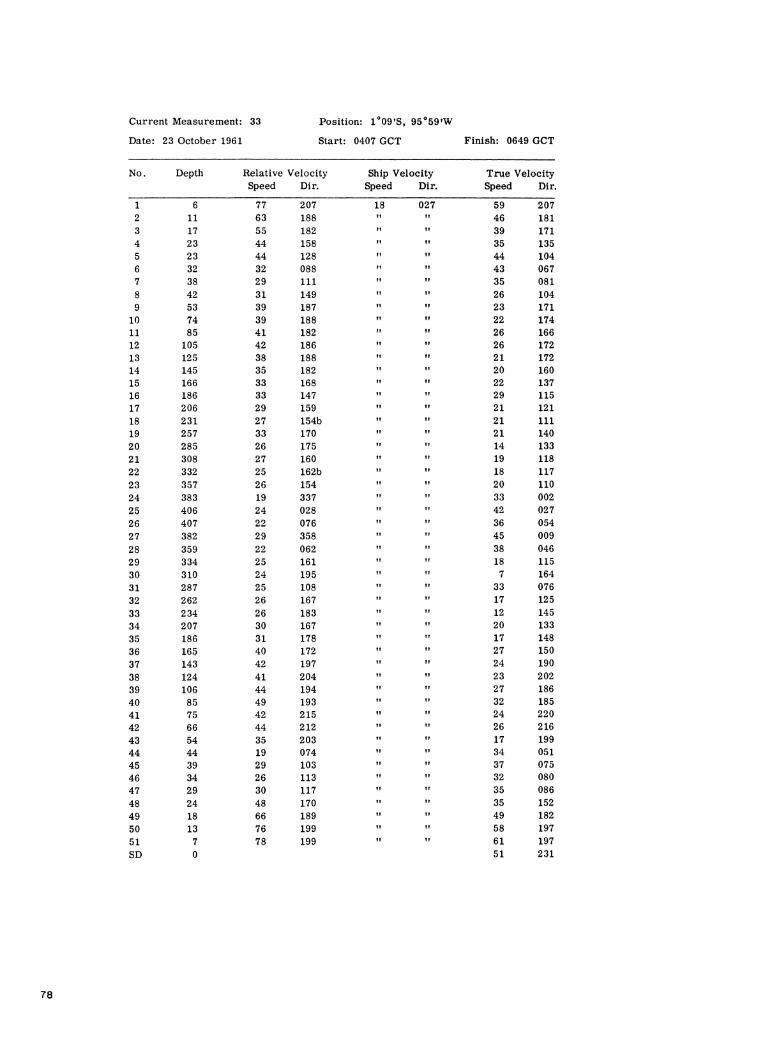
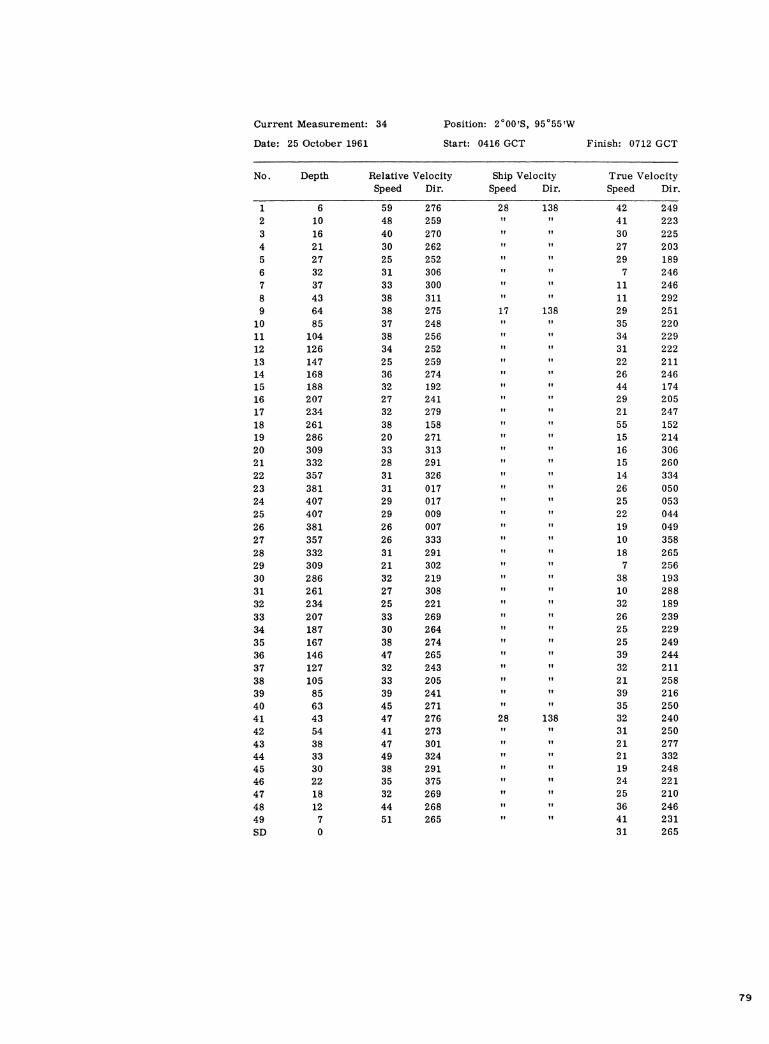
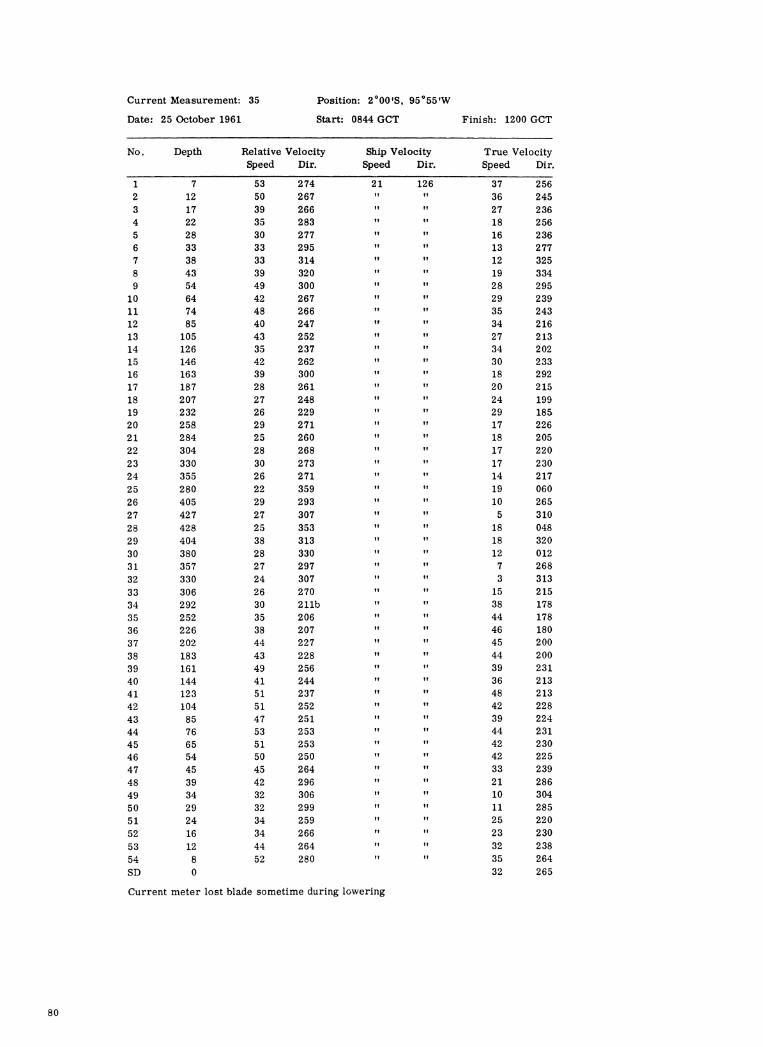
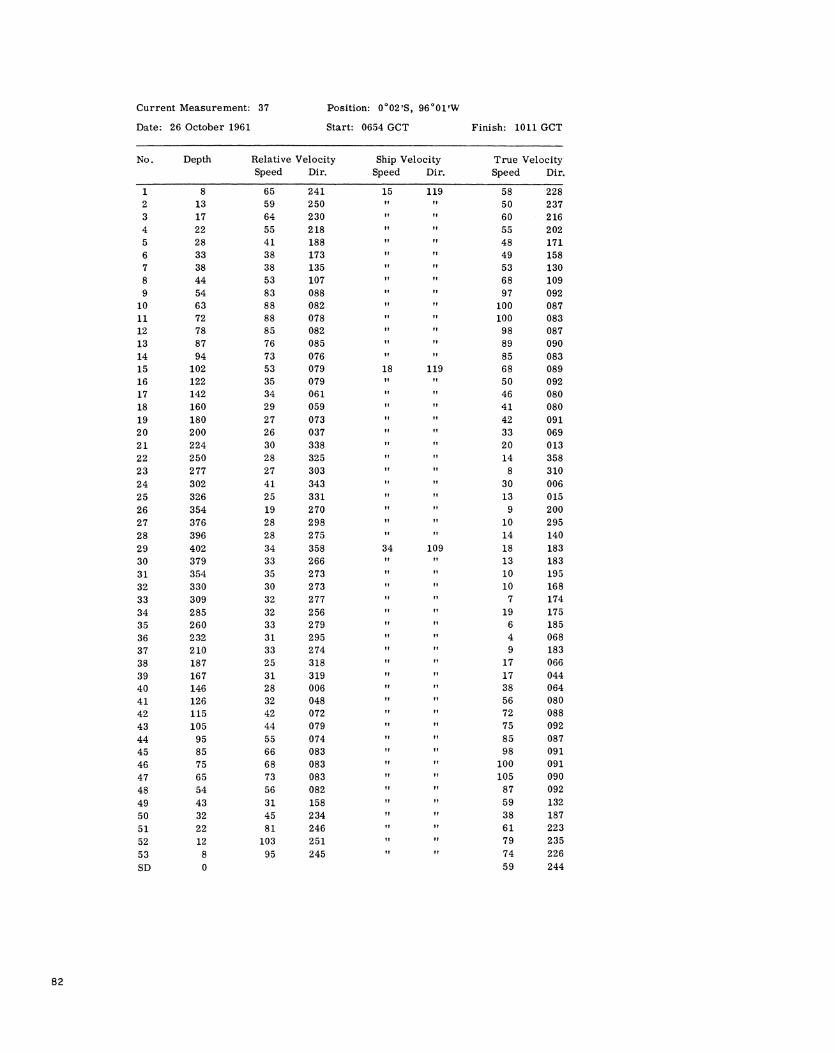
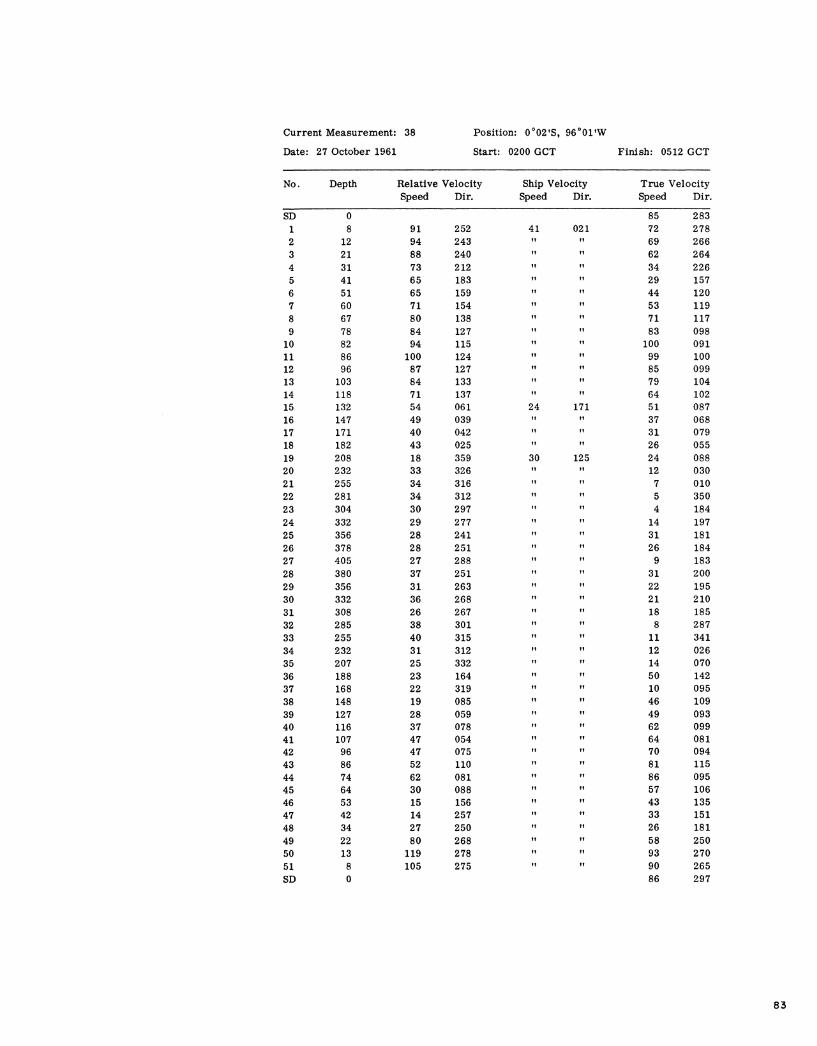
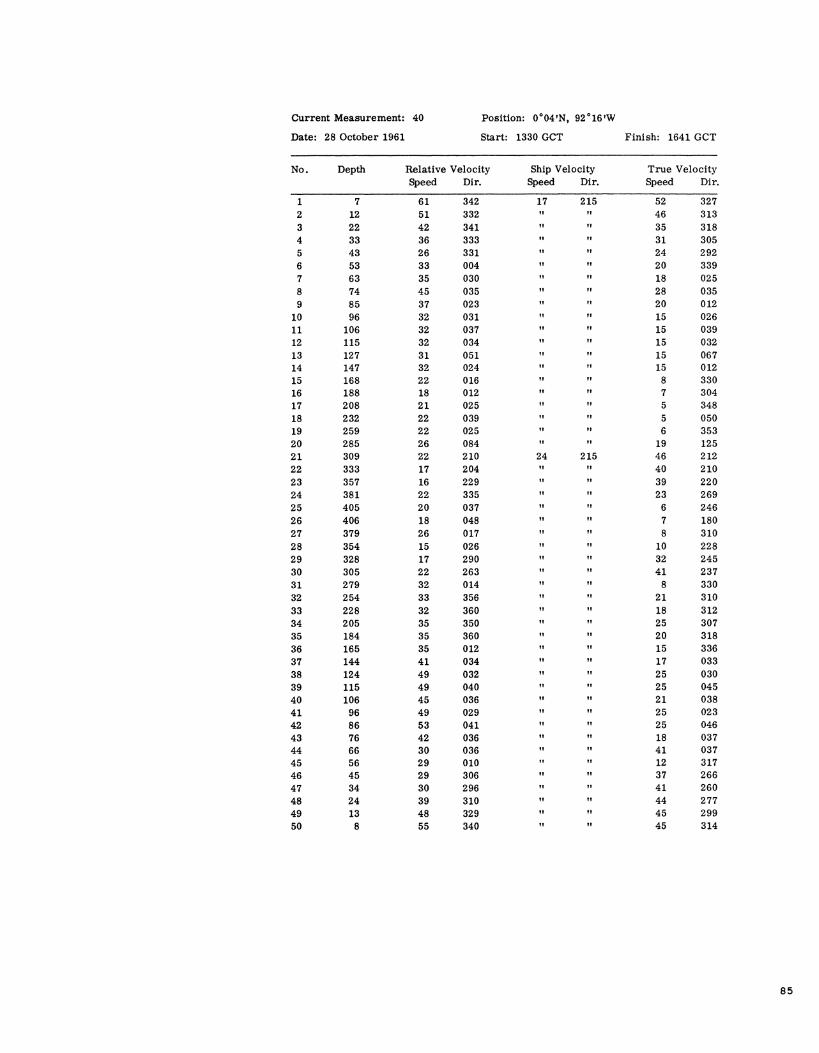
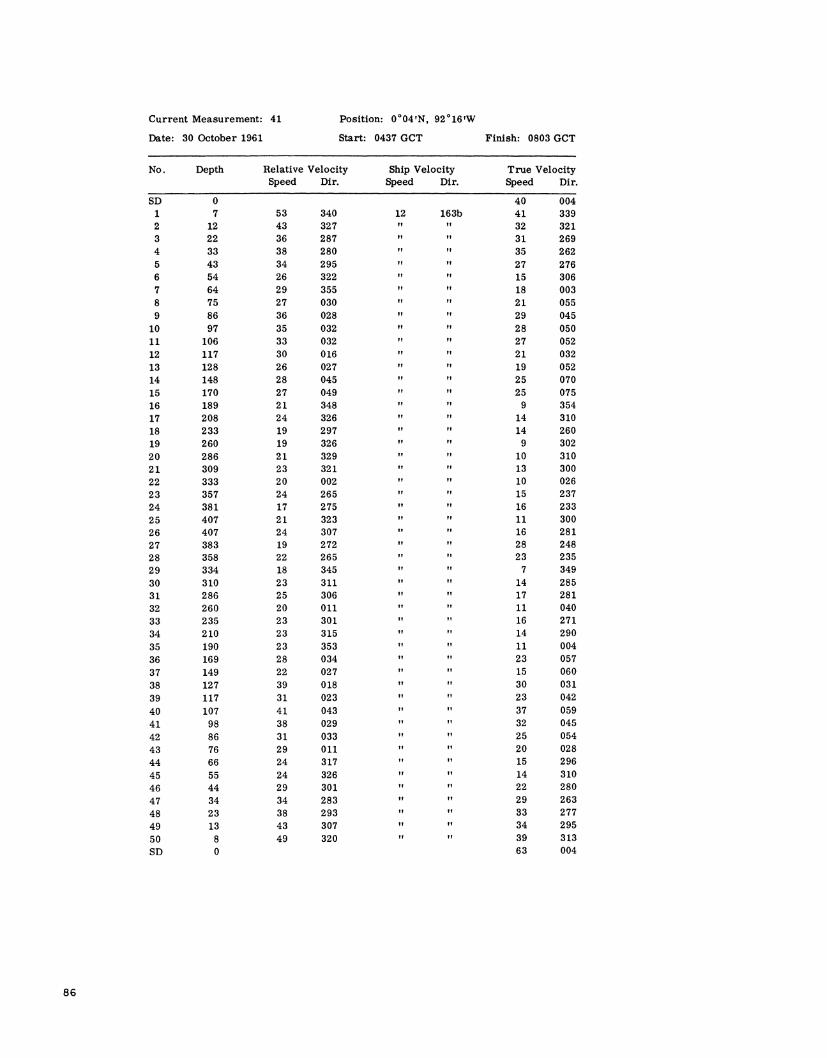
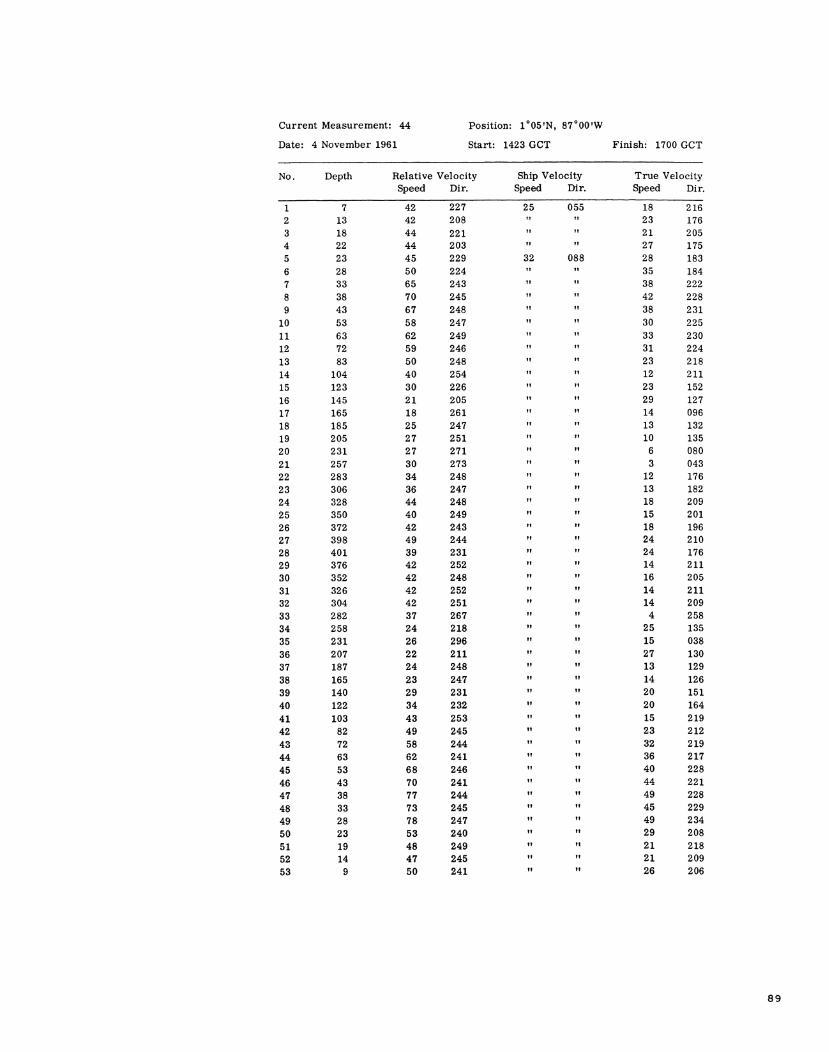
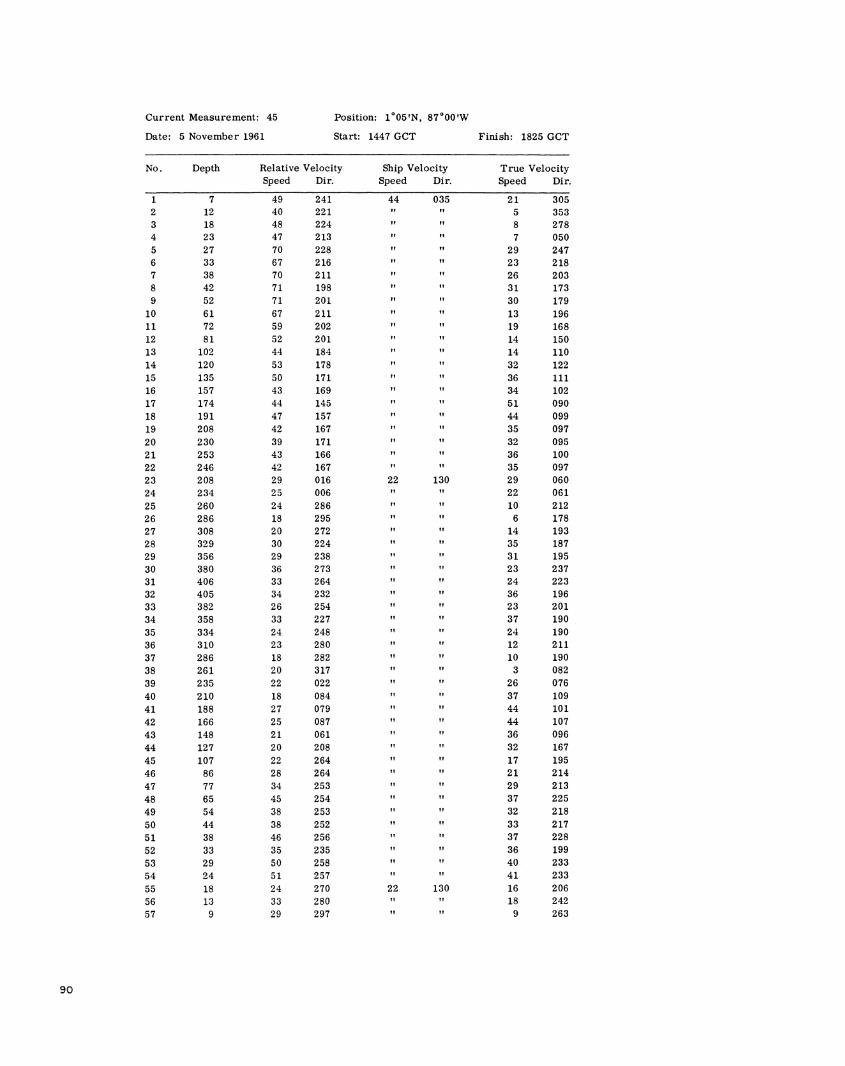
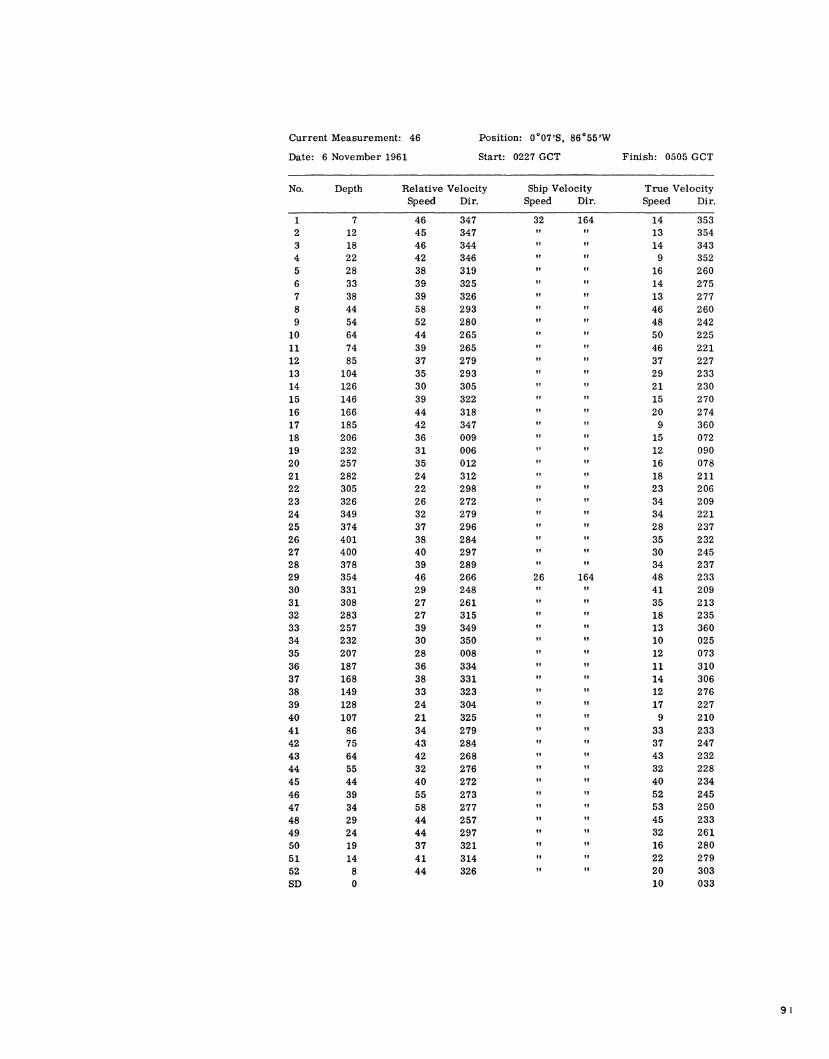
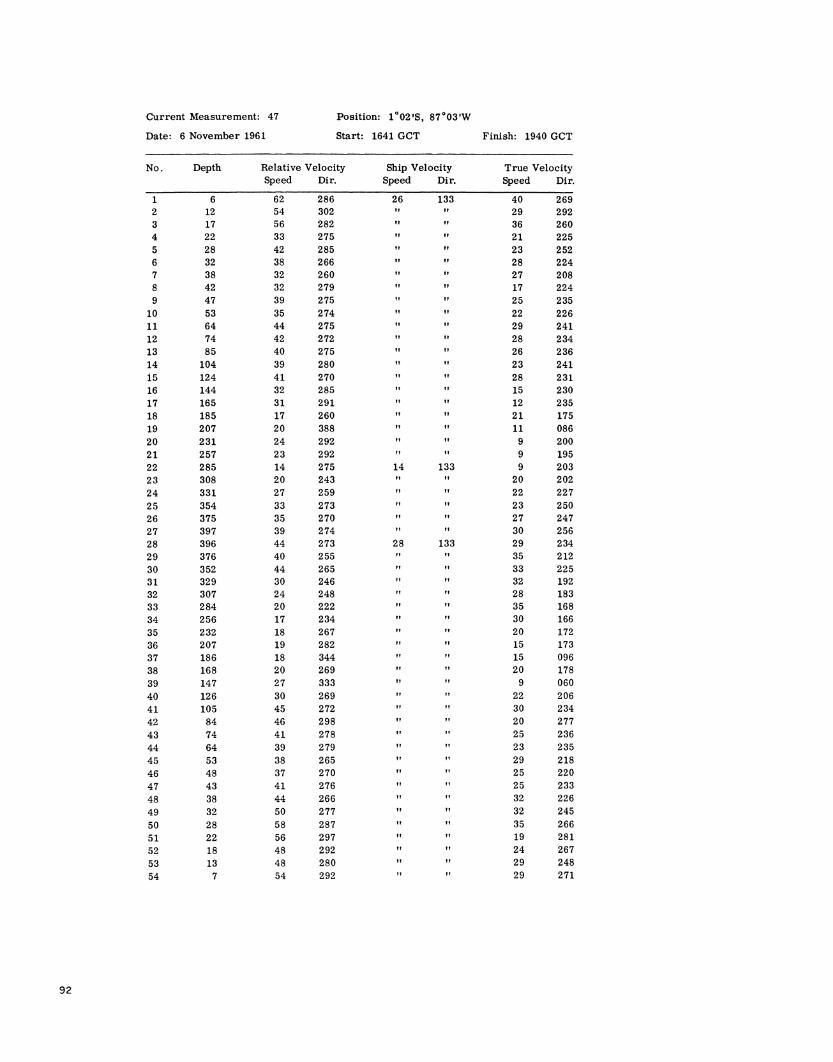
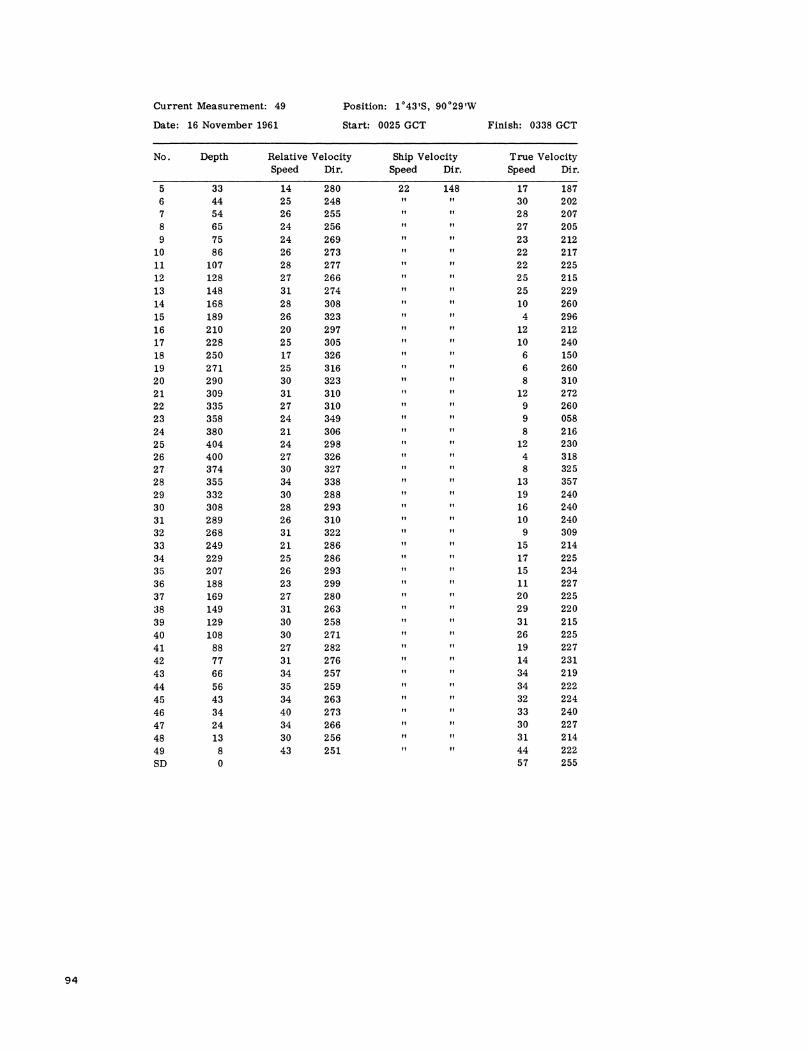
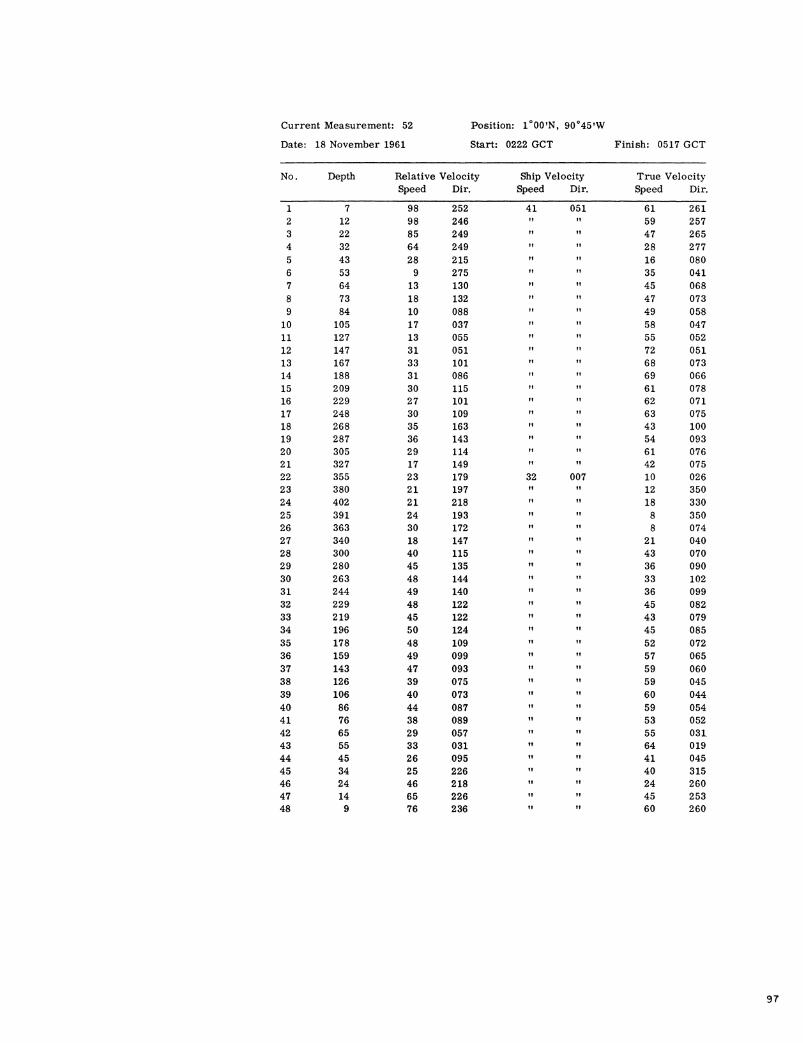
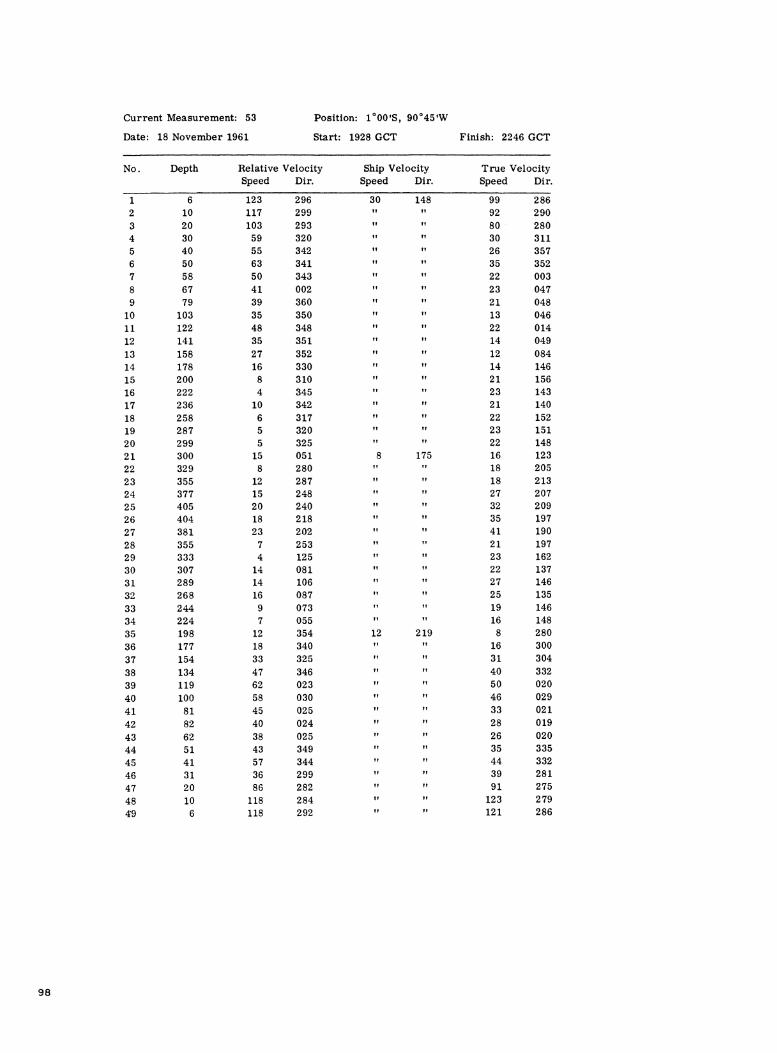
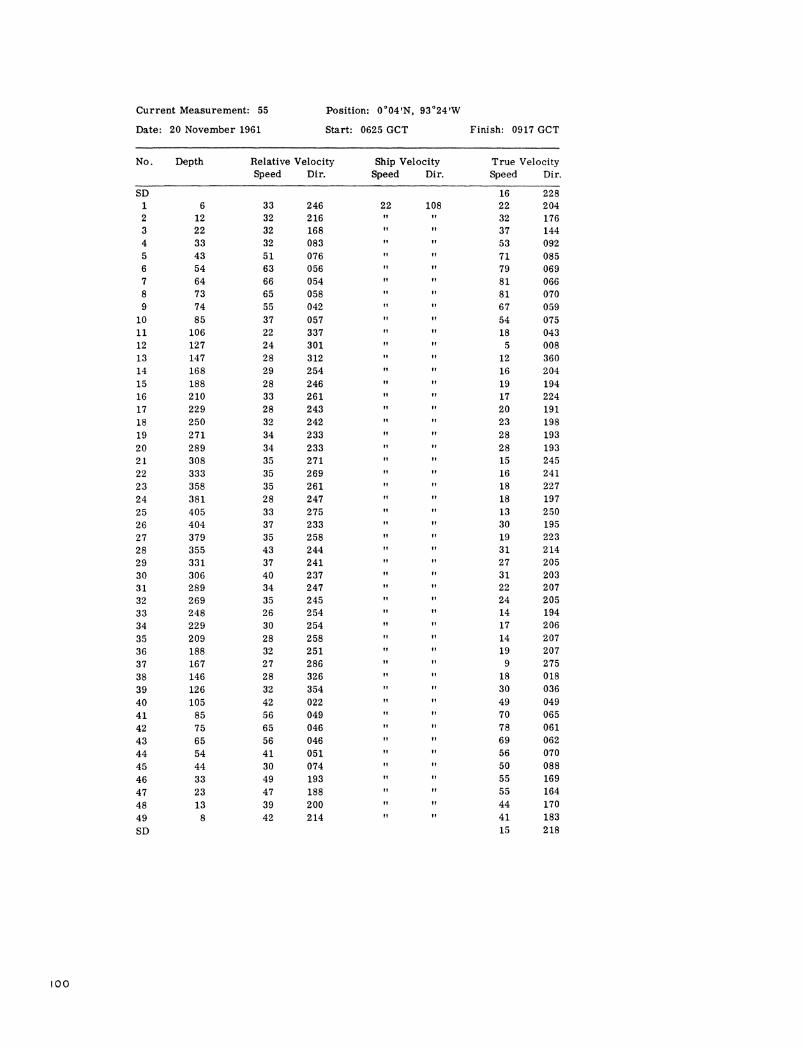
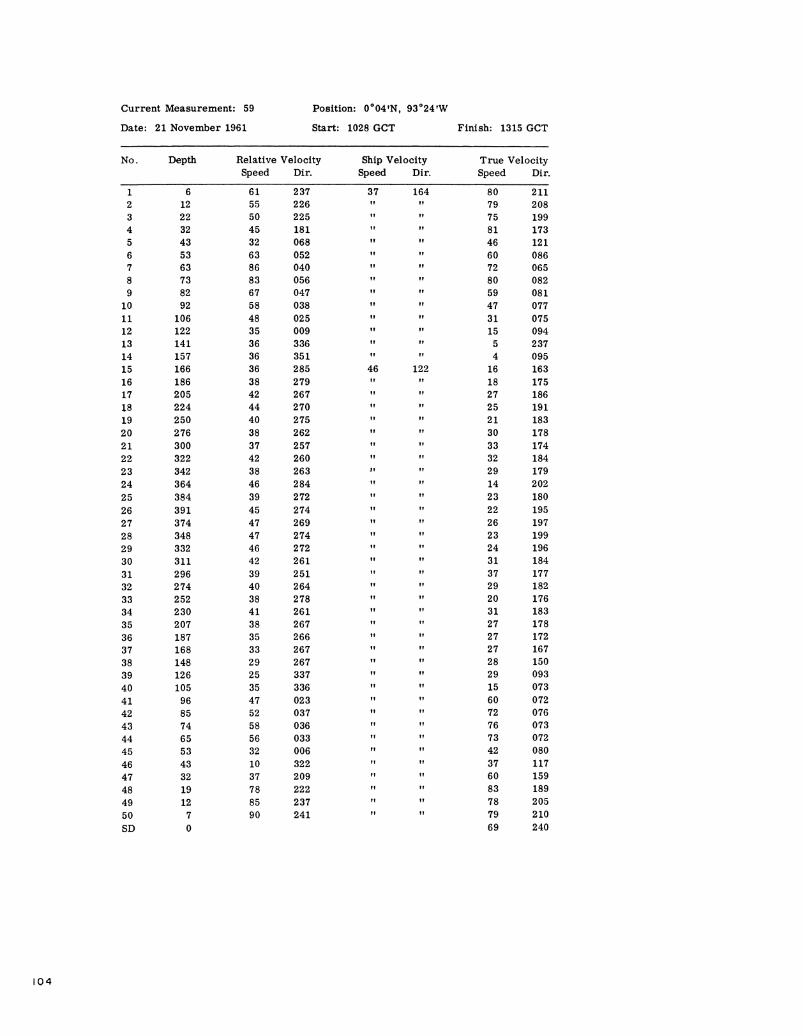
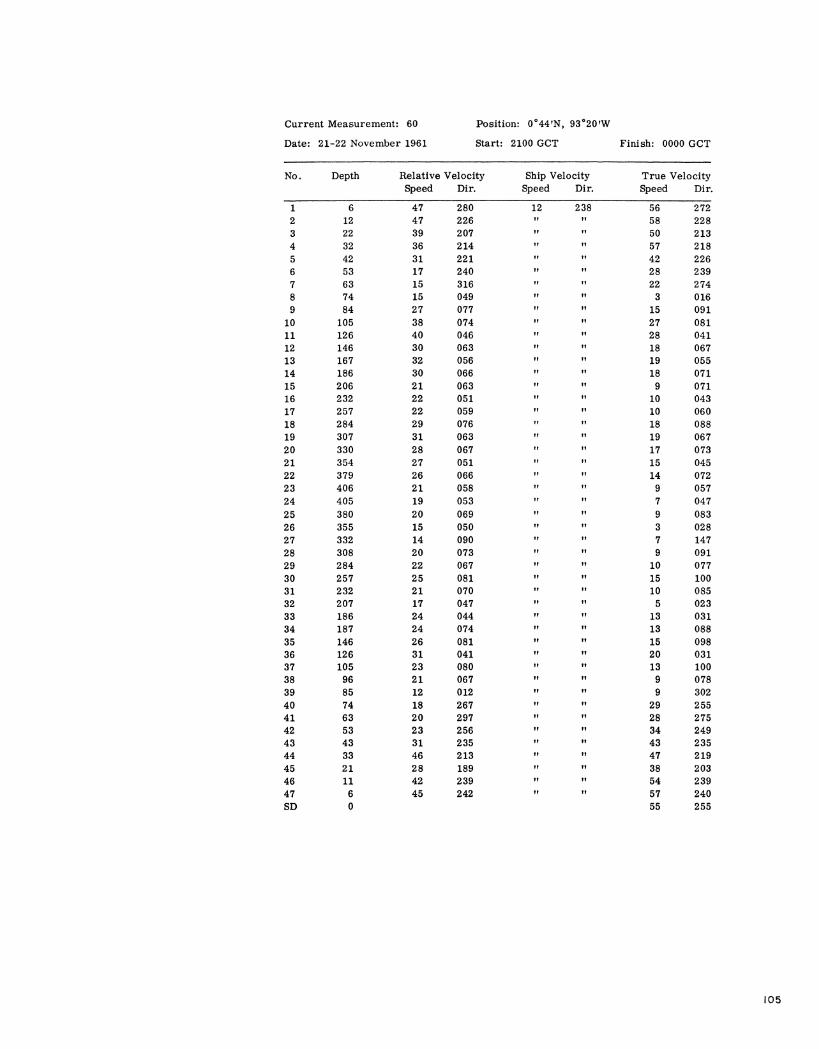
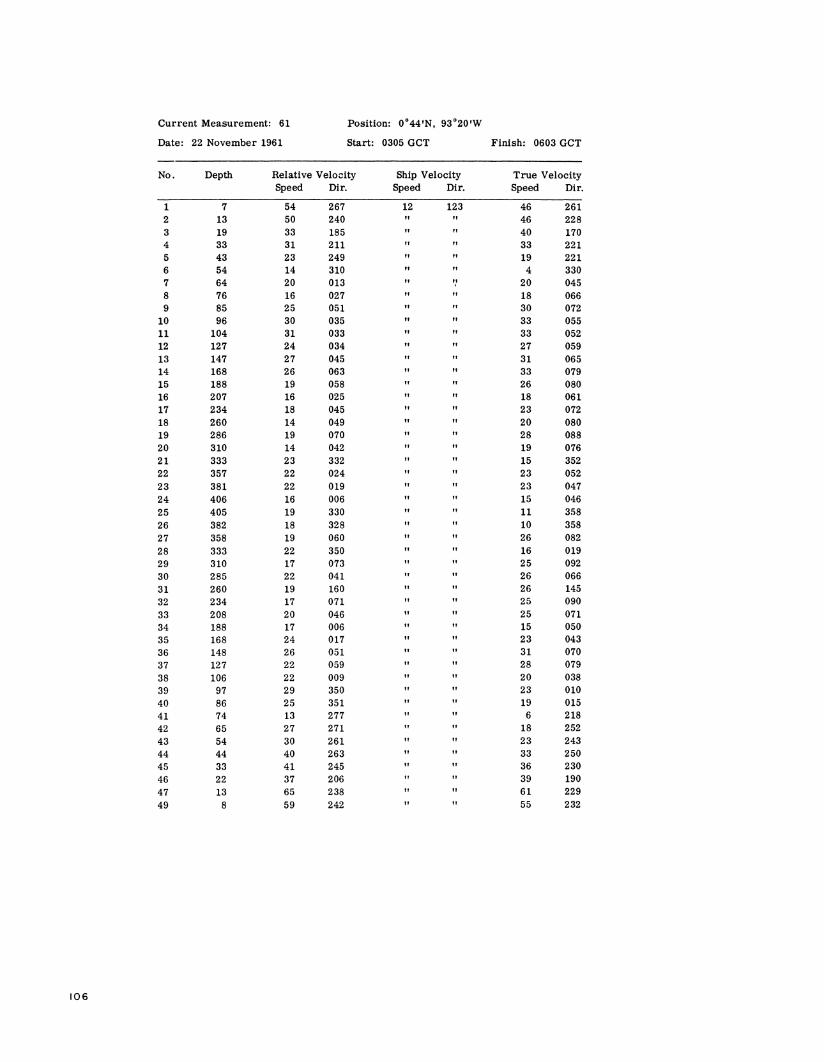
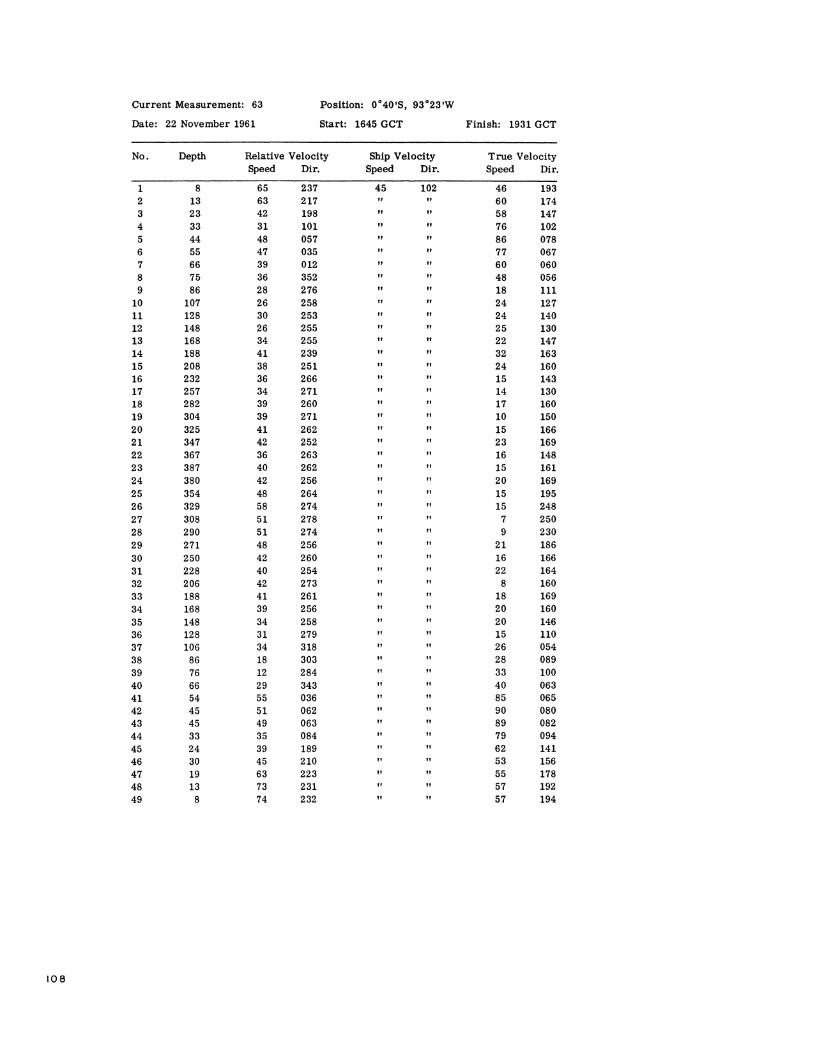
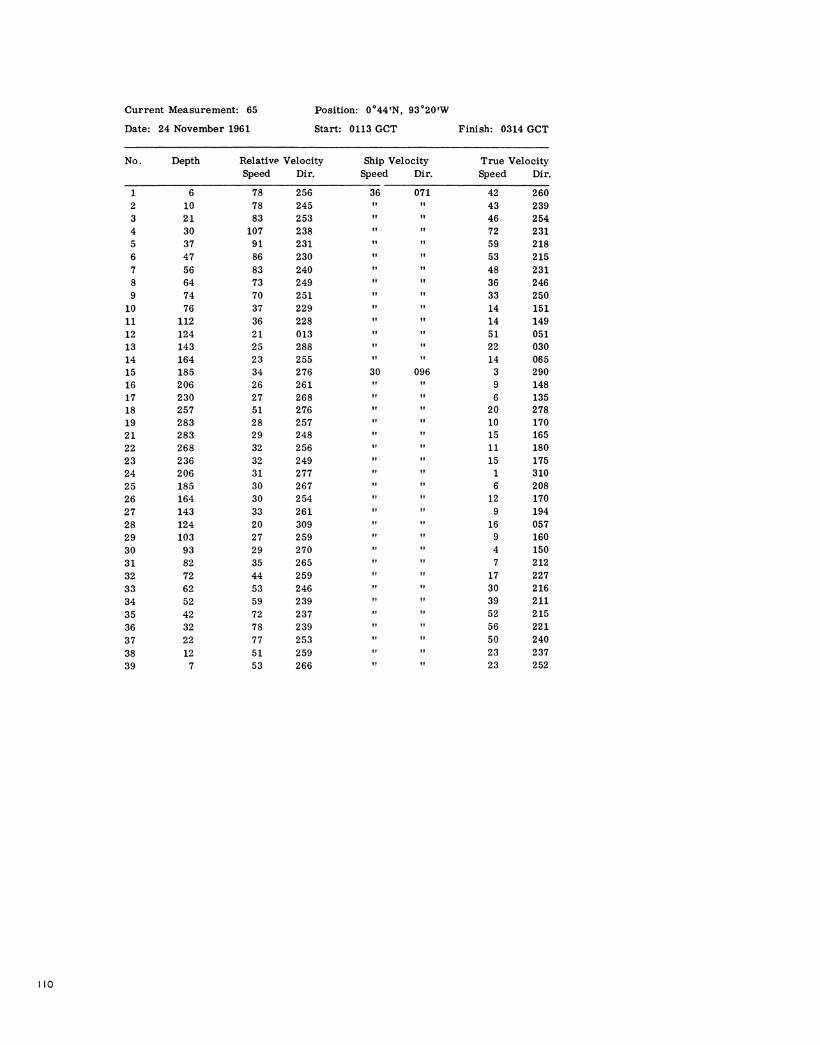
Current Measurements
Observations were made by lowering a modified Roberts meter and a depth gauge from the ship. The meter records on deck the speed and direction of the water. The movement of the ship over the ground was determined by measuring its position by radar from a "taut wire " anchored buoy. True velocity at any depth is determined by vector subtraction of the ship's velocity from the velocity recorded by the meter. The method has been described in some detail by Knauss (1959, 1960).
1/Klein, Hans T. A new technique for processing physical oceanographic data. MS.
v
In an attempt to make the ship velocity a constant for any given set of observations, the ship steamed slowly through the water during the period of measurement. By this technique the crab-like movement a ship usually exhibits while lying-to was eliminated. The current meter was lowered to a certain depth, an observation made, and then was lowered to the next depth. An observation was averaged over a period of two to seven minutes. Measurements were made at approximately 20 levels in the top 350 meters. After the instrument reached its greatest depth, the measurements were repeated as the meter was brought to the surface. Approximately three hours was required to complete a set of observations.
The designation "b" after a direction reading means that the direction observation is questionable, usually--but not always--because the direction values seem to oscillate more than we would like to consider in a "valid" observation.
Except for a few stations where there was indication that the buoy was dragging its anchor, it is believed that all observations are at least as reliable as those discussed by Knauss (1960) i.e. ±15 em/sec. The depth was measured by a Vibratron kept at a constant temperature by a thermostatically controlled heater and was measured to an accuracy of ± 1 meter.
Surface currents were observed with parachute drogues (Volkmann, Knauss and Vine, 1956). The drogue gives the average current on the top five meters, designated "SD" in the table. The drogues were equipped with small wire mesh radar reflectors and surface velocity was determined by radar measurements of the movement of the drogue relative to the anchored buoy. Surface current measurements represent a velocity averaged over a period of at least one hour.
Biological Program
The data fall into three classes with respect to time and position:
a. Data collected on station Chlorophylls ~. !?_ and Q in the euphotic zone Astacin and non-astacin type carotenoids in the euphotic zone Phytoplankton productivity in the euphotic zone Zooplankton volume
b. Data collected between stations Chlorophylls ~. !?_ and Q at the surface Astacin and non-astacin type carotenoids at the surface Phytoplankton productivity at the surface
vi
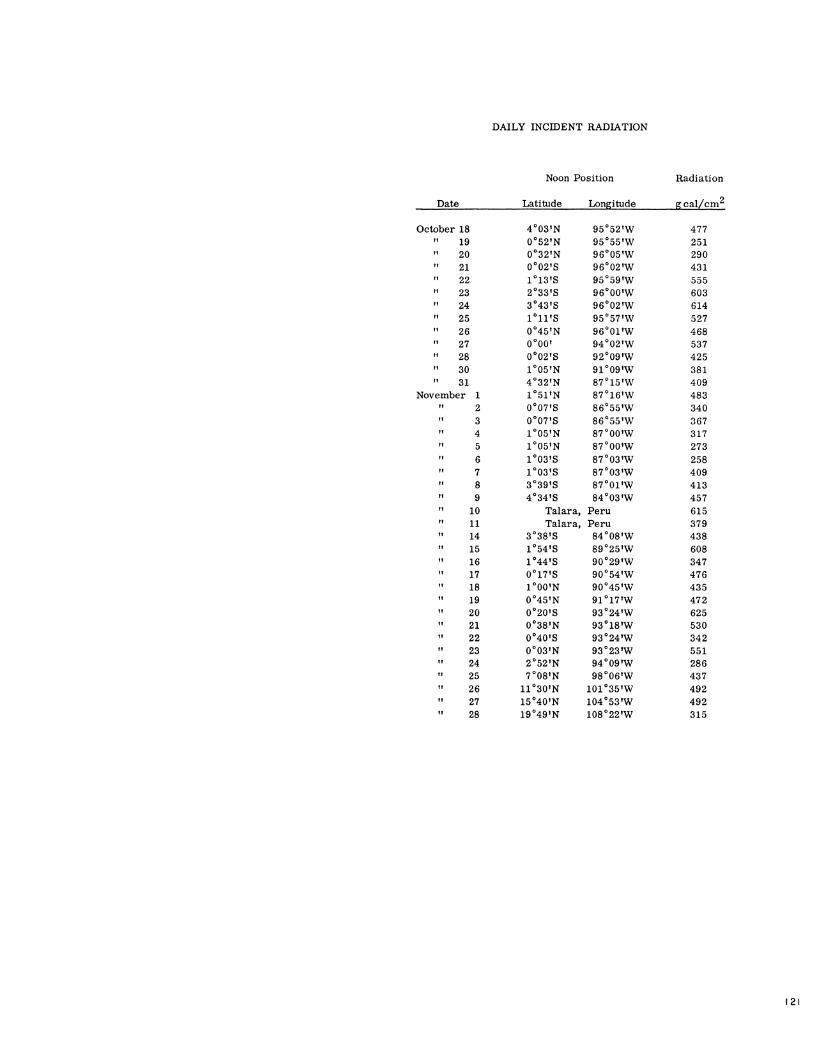
c. Continuously recorded data Incident radiation
Some of the results have been discussed by Forsbergh and Joseph (1964).
METHODS
Incident Radiation
Instruments and methods used were identical to those described by Holmes (1958). The pyrheliometer was mounted at the top of the deck crane free of any shadows cast by the superstructure of the ship. The recorder was kept operating throughout Legs III and IV. Total radiation is reported as gram calories per square centimeter per day (g cal/cm2/day) and as gram calories per square centimeter (g cal/cm2) for the duration of the photosynthesis experiments.
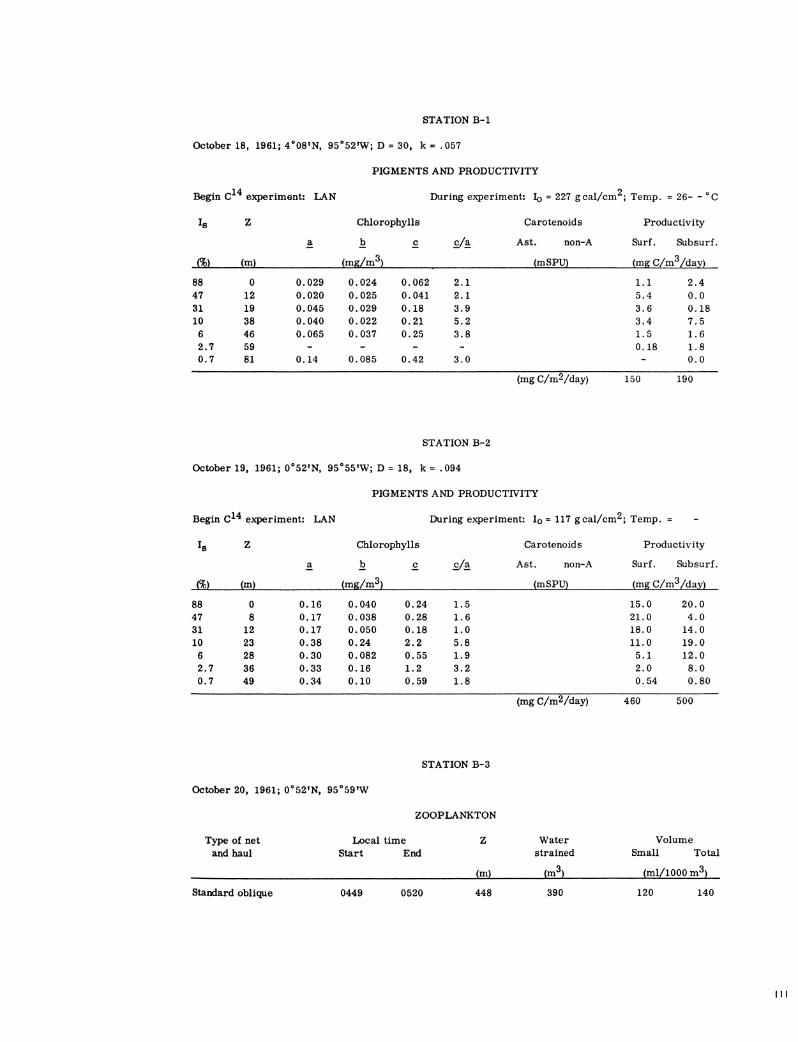
Pigment Analysis
Concentrations of chlorophylls ~. ]2, .2_, astacin and non-astacin type carotenoids at the surface were measured daily at sunrise, LAN and sunset. On selected stations pigment concentrations were measured at the same depths as was primary production. Surface water was collected with a plastic bucket while the ship was underway. Subsurface water was collected with Van Dorn plastic samplers. Water samples were filtered through HA Millipore filters (pore size: 0. 45 microns). The extract was prepared by the method of Creitz and Richards (1955) and the pigment concentrations were determined by the method of Richards with Thompson (1952). The calculations were performed on the CDC 1604 digital computor at the Scripps Institution of Oceanography using a program of Robert W. Holmes. Values are reported to two significant figures as milligrams per cubic meter of water (mg/m3) for chlorophylls ~. 12. and .2. and as Richards milli-specific plant units (mSPU) for astacin and non-astacin type carotenoids.
The ratio of chlorophyll .2. to chlorophyll~ (c/a) is also reported. Strickland (1960) has pointed out that these ratios may reflect changes in the taxonomic composition of the plant populations sampled.
Primary Production
The rate of carbon fixation was measured using the c14 method of Steemann- Nielsen (1952). A plastic bucket was used to take surface samplts and plastic Van Dorn samplers were used to take subsurface samples. Samples were filtered through
vii
zooplankton netting with apertures 0. 5 x 0. 5 mm, in order to remove most of the zooplankters. Glass-stoppered bottles of 250 ml. were used in which the samples were inoculated by the use of a syringe permanently set to deliver one milliliter of radiocarbon solution. All experiments ran one-half day: from sunrise to local apparent noon (LAN) or from LAN to sunset.
Between-stations surface productivity was measured using a tank incubator exposed to sunlight on deck, which consisted of a clear plastic tank, open at the top, in which the bottles were immersed in an upright position in running sea water. It was also used to incubate dark bottles. Water-column productivity was measured using two tubular incubators essentially the same as those described in Scripps Inst. Oceanogr. (1961). Each tubular incubator consisted of seven cells, holding one bottle each, with light transmission values of 88, 47, 31, 10, G, 2. 7 and 0. 7 per cent (the 88 per cent cell was for surface water and had no light filter; the transmission loss was caused by the double layer of plastic from which the incubator was built). These values were determined by the availability of the manufactured screens used as light filters and were measured with a light meter in each cell of the incubator.
Time did not permit the use of a submarine photometer, so a Secchi disk was used to measure light absorption in the water because of the speed of the measurement. Poole and Atkins (19:29) found that the disk disappeared from view at a depth (D) corresponding to 16 per cent of surface light. Harvey (195,)) and Doty (19G1) have also used this value. For simplicity, the absorption coefficient (k) was considered constant throughout the water column; a straight line drawn on semi-log paper through surface light (100 per cent) at zero meters and through 16 per cent surface light at D meters represented the light-depth curve from which depths corresponding to transmission ,·alucs of the tubular incubators could be read. This quick and rough method was considered sufficiently accurate in measuring light distribution to permit a reliable measure of water column productivity.
Water samples were taken at the indicated depths and incubated at the corresponding light levels in one incubator simulating an in situ experiment. No time \\·as available to conduct true in situ experiments but earlier experiments with similar incubators suggest that results of simulated experiments are representative of actual in situ measurements (Scripps Inst. Oceanogr., 1961).
In the other incubator surface water was exposed to the same light \·alues, simulating a sihtation in \Vhich surface phytoplankton were evenly distributed throughout the euphotic zone. Again, the earlier e)<.:periments suggest that productivity of surface \Vater in the incubator is representative of the productivity of surface water placed at the corresponding depths in the ocean.
viii

Wet volumes were measured by displacement and the plankton was divided into two components: organisms smaller than five centimeters in length and those larger than five centimeters. The concentrations of zooplankton are reported as milliliters per 1000 cubic meters of water (ml/1000 m3) and were calculated to two significant figures. The method of calculation is described by the South Pacific Fishery Investigations of the U. S. Fish and Wildlife Service (1953).
X

LITERATURE CITED
CREITZ, GRACE I., and FRANCIS A. RICHARDS 1955 The estimation and characterization of plankton populations by pigment
analysis. III. A note on the use of" Millipore" membrane filters in the estimation of plankton pigments. J. Mar. Res., 14(3): 211-216
DOTY, MAX\\:ELL S. 1961 Algal productivity of the Tropical Pacific as determined by isotope tracer
techniques. Annual Rpt., University of Hawaii: 1-93 FORSBERGH, E. D., and JAMES JOSEPH
1964 Biological production in the eastern Pacific Ocean. Inter-American Tropical Tuna Commission Bulletin, .§.(9): 477-527
HARVEY, H. W. 1955 The chemistry and fertility of sea waters. Cambridge U. Press
HOLMES, ROBERT W., and OTHER MEMBERS OF THE SCRIPPS COOPERATIVE OCEANIC PRODUCTIVITY EXPEDITION (SCOPE)
1958 Physical, chemical, and biological oceanographic observations obtained on Expedition SCOPE in the eastern Tropical Pacific, November -December 1956. Spec. Sci. Rpt. U. S. Fish Wildl. Serv., Fish., No. 279: 1-117
JITTS, H. R., and B. D. SCOTT 1961 The determination of zero-thickness activity in Geiger counting of c14
solutions used in marine productivity studies. Limnol. and Oceanogr., §.(2): 116-123
KNAUSS, J. A. 1959 The Cromwell Current: Univ. of Calif., Scripps Inst. Oceanogr.
dissertation, 49 pp., 31 figs. unpublished manuscript Ph. D.
1960 Measurements of the Cromwell Current. Deep-Sea Res., v. 6, pp. 265-286
Further measurements of the Cromwell Current. (in press) PAQUETTE, ROBERT G., EUGENE L. SCOTT and PAUL N. SUND
1961 An enlarged Clarke-Bumpus plankton sampler. Limnol. and Oceanogr., §.(2): 230-233
POOLE, H. H., and W. R. G. ATKINS 1929 Photo-electric measurements of submarine illumination throughout the
year. J. Mar. Biol. Assoc. UnitedKingdom, 16: 297-324 RICHARDS, FRANCIS A., with THOMAS G. THOMPSON
1952 The estimation and characterization of plankton populations by pigment analyses. II. A spectrophotometric method for the estimation of plankton pigments. J. Mar. Res., .!1J2): 156-172
xi
SCHINK, D. R. 1962 The measurement of dissolved Silicon -32 in sea water. Univ. of Calif.,
Scripps Inst. Oceanogr. Ph. D. dissertation. 178 pp., 23 figs. unpublished manuscript
SCRIPPS INSTITUTION OF OCEANOGRAPHY, UNIV. OF CALIF., SAN DIEGO 1961 STEP-I Expedition, 15 September- 14 December 1960. Preliminary
Report, Part II. Biological, photometric and additional chemical data. SIO Ref. 61-18: 1-66
SCRIPPS INSTITUTION OF OCEANOGRAPHY, UNIV. OF CALIF., SAN DIEGO 1960 Physical, chemical and biological data, Costa Rica Dome cruise. SIO
Ref. 60-20: 1-33 SOUTH PACIFIC FISHERY INVESTIGATIONS
1953 Zooplankton volumes off the Pacific coast, 1952. Spec. Sci. Rep. U. S. Fish Wildl. Serv., Fish. No. 100: 1-41
STEEMANN-NIELSEN, E. 1952 The use of radioactive carbon (C14) for measuring organic production in
the sea. J. Conseil Int. Explor. Mer, .!.§.(2): 117-140 STRICKLAND, J. D. H.
1960 Measuring the production of marine phytoplankton. Fish. Res. Board of Canada. Bulletin 122: 1-172
VOLKMANN, G., J. A. KNAUSS and A. C. VINE 1956 The use of parachute drogues in the measurement of subsurface ocean
currents. Trans. Amer. Geophys. Union, 37 (5): 573-577 WOOSTER, W. S., and B. A. TAFT
1958 On the reliability of field measurements of temperature and salinity of the ocean. J. Mar. Res., 17: 552-566
xii

EXPLANATION OF TABLES AND SYMBOLS
Primary production tables: depths given indicate depths of sampling of subsurface samples; their only relation to surface samples is to indicate the depths at which corresponding light values occur.
LAN Local apparent noon
Z Depth
D Depth at which Secchi disc disappeared
k Vertical absorption coefficient, k = 1. 7 /D (Poole and Atkins, 1929)
Is Submarine light at the surface
Io Incident radiation
No observation attempted, or no computation attempted, or sample lost
d Values doubtful
r Value rejected as questionable
xiii

FOOTNOTES
Extrapolated values and values interpolated between remote observations are entered within parentheses. A hyphen is used to indicate a missing observed value. The time is the time of messenger release. When more than one cast was made on a station, messenger times and wire angles are given in the order of increasing depth. A line is left blank between the observed data of each cast.
On stations where more than one cast is lowered, the various property curves may not agree perfectly. This discrepancy may be caused by changes in geographical position, real property changes with time, slight error in measurement, or a combination of these factors.
To indicate a premature or a delayed reversal of the water-sampling device which results in certain depth and property errors, the following notation is used.
p: pretrip or posttrip.
Values which are not drawn through because they seem to be in error without apparent reason are indicated by the following notation.
FORMAT
u: uncertain value (value may be correct; occasionally it can influence the drawing of the property curve).
These data are typed in the format of the University of California Press publication, Oceanic Observations of the Pacific.
xiv