university of groningen simulations of the formation of ... · chapter 4 thick disc evolution...
TRANSCRIPT
University of Groningen
Simulations of the formation of thick discs in galaxiesVillalobos Cofre, Alvaro Andres
IMPORTANT NOTE: You are advised to consult the publisher's version (publisher's PDF) if you wish to cite fromit. Please check the document version below.
Document VersionPublisher's PDF, also known as Version of record
Publication date:2009
Link to publication in University of Groningen/UMCG research database
Citation for published version (APA):Villalobos Cofre, A. A. (2009). Simulations of the formation of thick discs in galaxies. s.n.
CopyrightOther than for strictly personal use, it is not permitted to download or to forward/distribute the text or part of it without the consent of theauthor(s) and/or copyright holder(s), unless the work is under an open content license (like Creative Commons).
Take-down policyIf you believe that this document breaches copyright please contact us providing details, and we will remove access to the work immediatelyand investigate your claim.
Downloaded from the University of Groningen/UMCG research database (Pure): http://www.rug.nl/research/portal. For technical reasons thenumber of authors shown on this cover page is limited to 10 maximum.
Download date: 28-12-2019
Chapter 4Thick disc evolution induced by thegrowth of an embedded thin disc∗
Abstract
We present a study of the morphological and kinematical evolution of simulatedthick discs responding to the adiabatic growth of an embedded, more massive and
thinner disc. The thick discs used in this analysis are the result of a significant 5:1 massratio merger between a pre-existing disc galaxy and satellite (Chapter 2). This studyexplores the dependences of the final system on the way the adiabatic growth is modelled.We shall see that the final properties of the thick discs after the formation of the newcold disc depend most directly on the total mass and scalelength, and not strongly onscaleheight, growth timescale, initial alignment and sense of rotation. In general we findthat the growth of a new thin disc leads to a strong structural contraction in the thickdiscs (both radially and vertically) which implies a significant migration of thick discstars from the outskirts inwards. Kinematically, it induces a significant increase in themean rotation and internal velocity dispersions of the thick discs.
∗ Paper in preparation, in collaboration with Stelios Kazantzidis and Amina Helmi
90 chapter 4: Thick disc evolution induced by the growth of a thin disc
4.1 Introduction
In the currently popular cosmological paradigm structure forms as gravitational insta-bilities amplify small density perturbations produced at early times. Dark matter, beingthe dominant mass component of the Universe in this model, defines the potential wellsonto which gas eventually cools and condenses to form galaxies. In the ΛCDM modelthe first structures to form are small, and larger systems are built via mergers.
In this context, the formation of a thick disc via the heating of a pre-existing discthrough a minor merger –as modelled in previous chapters, appears to be unavoidable(Kazantzidis et al. 2008, 2009; Purcell et al. 2009). Depending on when such a mergerevent has occurred, one may expect the formation of a new thin disc to take place and beobservable at the present-day. This new disc would result as gas in the halo cools down,looses pressure support and forms a rotationally supported component, as discussed inMo, Mao, & White (1998) and in semi-analytic models of galaxy formation (Baugh 2006)
In this scenario, the dynamical effects of the gas onto the merger remnant could bevery important. In particular, the slow accumulation of gas in the centre of the systemis expected to induce a slow structural contraction in the thick disc due to gravity. Thisprocess is similar in spirit to the adiabatic contraction that dark matter halos experienceduring the cooling of baryons that lead to the formation of galaxies (Barnes & White1984; Mo et al. 1998).
Several previous studies have explored the dynamical heating of disc galaxies viaone or more mergers with smaller systems using N-body simulations with the goal ofestablishing the properties of the remnant system (Quinn & Goodman 1986; Quinn et al.1993; Walker et al. 1996; Huang & Carlberg 1997; Sellwood et al. 1998; Velázquez &White 1999; Font et al. 2001; Ardi et al. 2003; Gauthier et al. 2006; Hayashi & Chiba2006; Kazantzidis et al. 2008; Read et al. 2008; Purcell et al. 2009, and Chapter 2 ofthis thesis). Very few of these studies, however, have focused on the response of thethick disc to the gas accumulation and further formation of a new thin disc (see e.g.Kazantzidis et al. 2009). A full model of thick disc formation including gas dynamics,star formation, and chemical evolution would be ideal in order to obtain a completepicture of the process. Unfortunately this kind of simulations are highly complex andvery costly in terms of computational power although first attempts have recently beenmade (Bournaud et al. 2005; Hopkins et al. 2009).
In this Chapter we present a systematic study to estimate the effect of the adiabaticgrowth of a new thin disc on both the morphology and the kinematics of thick discs usingcollisionless N -body simulations. These numerical simulations focus on the evolution ofa subset of the thick discs produced in Chapter 2. Note that we do not follow this processhydrodynamically but that we restrict ourselves to model the gravitational potential ofa thin disc that slowly grows in mass over time using an N -body model.
We explore several aspects of the growth of the new disc that are likely to havean effect on the morphologic and kinematical evolution of the thick discs, namely, thegrowth timescale of the new disc, its final mass, scalelength, scaleheight, orientation ofits total angular momentum vector (either along that of the thick disc or along the halospin), and sense of rotation with respect to the thick disc (either prograde or retrograde).We also explore the effect the adiabatic growth of a thin disc on thick discs of differentcharacteristics.
The outline of this Chapter is the following. In Section 2 we briefly describe the
4.2: Simulations 91
numerical simulations and the set up of the experiments of this study. In Section 3 wepresent the morphological and kinematical evolution of thick discs. Section 4 comparesthe results of the experiments with the main results of Chapters 2 and 3. In Section 5we summarise our conclusions.
4.2 Simulations
In this Section we describe in detail the initial thick discs used; the method followed toadiabatically grow the new thin disc; and the simulations that have been performed.
4.2.1 Initial thick discs
In Chapter 2, 25 dissipationless N -body simulations were carried out to study the generalproperties of thick discs formed as a result of a significant merger between a pre-existingdisc galaxy and a satellite system.
Those simulations explored the following configurations: (i) two sets of initial con-ditions for the disc galaxy, where (a) its structure and kinematics resemble those of thepresent Milky Way (“z=0” experiments); and (b) they resemble those of the Milky Wayscaled back to redshift z=1 according to the model of Mo et al. (1998) (“z=1” experi-ments); (ii) two stellar morphologies for the satellite, spherical or discy; (iii) two total(and stellar) mass ratios between the satellite and the disc galaxy (10% and 20%); and(iv) three initial orbital inclinations of the satellite (0o, 30o and 60o), in both progradeand retrograde directions with respect to the disc rotation.
Both the disc galaxy and the satellite were modelled self-consistently with both stellarand dark matter (DM) components. The DM halos of both the disc galaxy and thesatellite follow NFW profiles (Navarro et al. 1997), whose structures are adiabaticallycontracted by the presence of the respective stellar component (see e.g. Blumenthal et al.1986; Mo et al. 1998). The stellar component of the satellite was set up with structureand kinematics consistent with the observed fundamental plane of dE+dSphs galaxies (deRijcke et al. 2005). The orbital parameters of the satellite were drawn from cosmologicalstudies of infalling substructure (Benson 2005, see also Tormen 1997; Khochfar & Burkert2006), and the satellite was released far away from the centre of the disc galaxy, ∼35(∼50) times the disc scalelength for “z=0” (“z=1”) experiments.
The simulations of the formation of thick discs have a timespan of 5 Gyr and 4 Gyrfor “z=0” and “z=1” experiments, respectively, where the satellite has typically mergedby t=3 Gyr and t=2 Gyr, respectively. By the final time, the systems are relaxed. Thesimulations were carried out with 5×10⁵ particles in the host halo, and 105 in the hostdisc, satellite halo and satellite stellar components. The interested reader is referred toChapter 2 for a complete description of the experiments.
Since in this Chapter we intend to study the general trends of the evolution of thickdiscs after the formation of the new disc, we only focus on a subset of the 25 thick discs ofChapter 2 (see Section 4.2.3) and these conform the initial thick discs in the experimentspresented here.

92 chapter 4: Thick disc evolution induced by the growth of a thin disc
Table 4.1: Summary of the experiments.Growing thin disc Thick disc
Run Mthin RD,thin z0,thin τ (1) alignment(2) rotation(3) inclination(4)
[× Mthick] [kpc] [pc] [Gyr]Reference 5 3 125 1 halo prograde 30o
modelA1 5 3 125 0 halo prograde 30o
A2 5B1 5 3 125 1 halo prograde 0o
B2 60o
C1 2 3 125 1 halo prograde 30o
C2 5 3 25 1 halo prograde 30o
C3 5 1 125 1 halo prograde 30o
D 5 3 125 1 thick disc prograde 30o
E1 5 3 125 1 halo prograde 0o
E2 retrograde(1) Growth timescale of the thin disc.(2) Alignment of the rotation axis of the growing disc, either along the spin axis of the mainhalo or along the rotation axis of the thick disc.(3) Sense of rotation of the thick disc with respect of the growing thin disc.(4) Original orbital inclination of the satellite used to produce the respective thick disc.
4.2.2 Adiabatic growth of a new thin disc
The growing discs follow an exponential distribution in cylindrical radius R and theirvertical structure is modelled by isothermal sheets:
ρthin(R, z) =Mthin
4πRD,thin2z0,thinexp
(− R
RD,thin
)sech2
(z
2z0,thin
), (4.1)
where Mthin, RD,thin and z0,thin denote the mass, radial scalelength, and (exponential)vertical scaleheight of the disc, respectively.
Each disc growth simulation was performed using the following procedure: (i) Inserta massless Monte Carlo particle realization of the desired disc model inside the heateddiscs. (ii) Increase the mass of this distribution to its final value linearly over a timescaleτ according to the following law:
Mthin(t; τ) ={Mthin τ = 0Mthin
tτ τ > 0
During the growth period, the growing disc remained rigid and its particles are fixedin place, while the dark and stellar components of the thick disc galaxy were allowedto achieve equilibrium with the thin disc as its mass grows. During the experiments,all properties of the growing disc (e.g., scalelength, scaleheight) except the mass werekept constant. All simulations of the growing disc were carried out with the PKDGRAVmulti-stepping, parallel, tree N -body code (Stadel 2001).
4.3: Results 93
4.2.3 New experiments: thick disc + thin disc
In total, we have produced 10 simulations of the adiabatic growth of a new thin discaround the (remnant) thick discs produced in Chapter 2. We have explored severalcharacteristics of the new disc and its growth that are likely to affect the evolution ofthick discs. These features are: the thin disc’s growth timescale (τ=0, 1 and 5 Gyr); finalmass (Mthin=2 and 5Mthick); scaleheight (z0,thin=25 and 125 pc), scalelength (RD,thin=1and 3 kpc); orientation of its angular momentum vector (aligned to either the spin ofthe main halo or the angular momentum vector of the thick disc); and sense of rotationwith respect to the thick disc (prograde or retrograde). Additionally, we also comparethe evolution of different initial thick discs produced after mergers with initial satelliteorbital inclinations 0o, 30o and 60o. The runs have been labelled as A, B, C, D and E andare summarised in Table 4.1. Our reference model has the following properties for thethin disc τ = 1 Gyr, Mthin = 5Mthick, z0,thin = 125 pc, RD,thin=3 kpc, and a thick discthat is the result of a prograde merger with a satellite with initial orbital inclination of30o. In what follows, we shall refer to Experiment “X”, to denote comparisons betweenRun “X” and the reference model, except for Run E.
Unless noted otherwise the experiments above are evolved for t = τ +0.5 Gyr, exceptfor the case of instantaneous growth which is evolved for 1.5 Gyr to match the simulationswith growth timescale τ = 1 Gyr.
A few additional simulations were performed in isolation (without the growth of thenew disc) in order to ensure the stability of the thick discs for 1.5 Gyr. Similar simulationswere performed to check that the final properties of thick discs after the growth of thenew disc were stable. In this case those simulations were evolved in isolation for another4 Gyr.
4.3 Results
4.3.1 Structural evolution of thick discs
General features
In the present study we find that the adiabatic growth of a new disc induces threecharacteristic structural changes in the thick disc that are common to all the experiments.
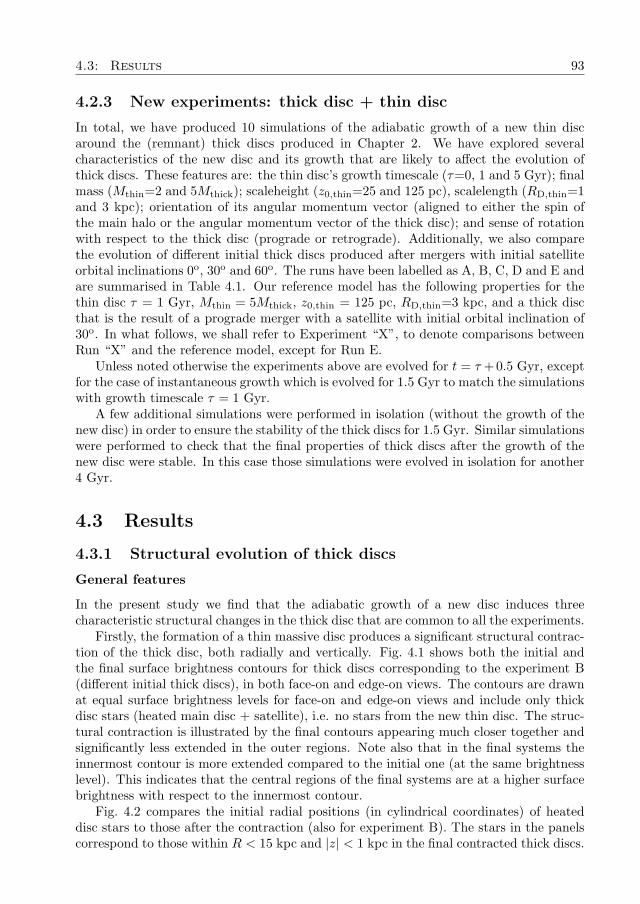
Firstly, the formation of a thin massive disc produces a significant structural contrac-tion of the thick disc, both radially and vertically. Fig. 4.1 shows both the initial andthe final surface brightness contours for thick discs corresponding to the experiment B(different initial thick discs), in both face-on and edge-on views. The contours are drawnat equal surface brightness levels for face-on and edge-on views and include only thickdisc stars (heated main disc + satellite), i.e. no stars from the new thin disc. The struc-tural contraction is illustrated by the final contours appearing much closer together andsignificantly less extended in the outer regions. Note also that in the final systems theinnermost contour is more extended compared to the initial one (at the same brightnesslevel). This indicates that the central regions of the final systems are at a higher surfacebrightness with respect to the innermost contour.
Fig. 4.2 compares the initial radial positions (in cylindrical coordinates) of heateddisc stars to those after the contraction (also for experiment B). The stars in the panelscorrespond to those within R < 15 kpc and |z| < 1 kpc in the final contracted thick discs.
94 chapter 4: Thick disc evolution induced by the growth of a thin disc
Figure 4.1: Radial and vertical contraction in the thick disc structure for experimentB: thin disc growth within thick discs originally formed with satellite orbital inclinations0 (left column), 30 (centre) and 60 (right) degrees. Growth timescale τ=1 Gyr. t=0 Gyr(first/third row), t=1.5 Gyr (second/fourth row). Face-on view, 14 contours: from 20.25to 25.35 in steps of 0.39 mag arcsec−2, V-band. Edge-on view, 17 contours: from 19.09to 25.35 in steps of 0.39 mag arcsec−2, V-band.
4.3: Results 95
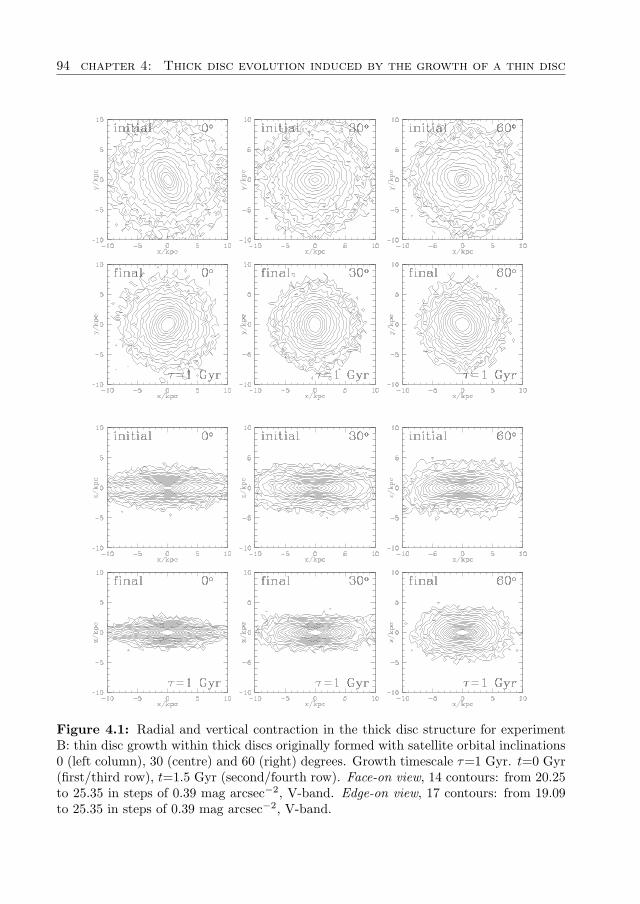
Figure 4.2: Initial (RI) and final (RF) cylindrical radial distance of heated disc starsbefore and after the structural contraction, for experiment B. The dashed line shows thebest linear fit. Only heated disc stars are shown for clarity.
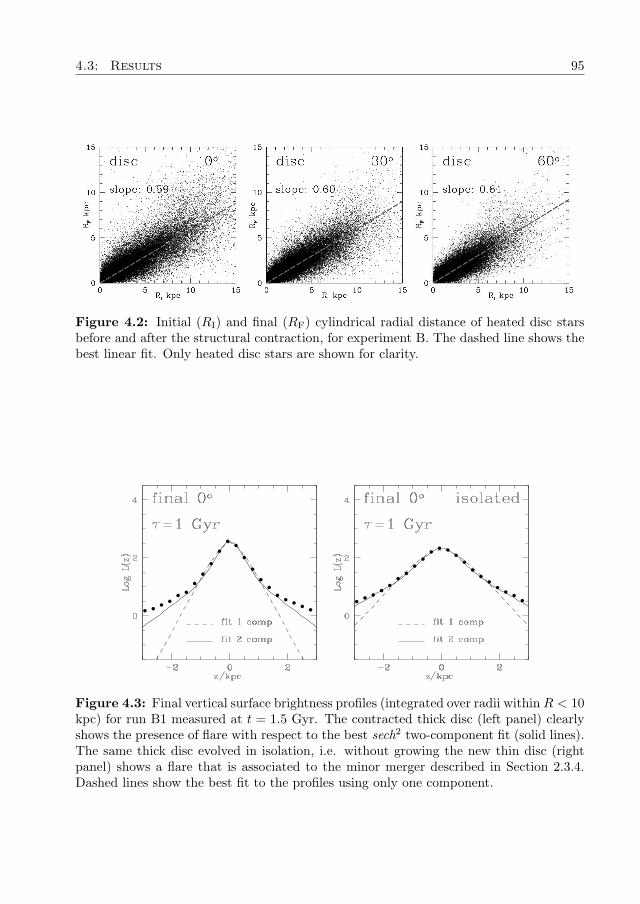
Figure 4.3: Final vertical surface brightness profiles (integrated over radii within R < 10kpc) for run B1 measured at t = 1.5 Gyr. The contracted thick disc (left panel) clearlyshows the presence of flare with respect to the best sech2 two-component fit (solid lines).The same thick disc evolved in isolation, i.e. without growing the new thin disc (rightpanel) shows a flare that is associated to the minor merger described in Section 2.3.4.Dashed lines show the best fit to the profiles using only one component.
96 chapter 4: Thick disc evolution induced by the growth of a thin disc
The linear fit (dashed lines) shows that the relation between initial and final location isremarkably linear in all cases with practically the same slopes. This Figure shows thatthe structural contraction induces a significant migration (inwards) of thick discs stars,e.g. those located at R ∼ 8 kpc after the contraction, were initially located at R ∼ 14kpc.
The second common characteristic present in all the experiments is that the coldcomponent originally present in the thick discs (see Chapter 2) is preserved after thestructural contraction. As we shall see below, after the contraction the mass fractionassociated to these cold and old components of thick discs remains below ∼25% for allthe experiments. These thin remnants could act, in principle, as old populations in thethin discs given their similar spatial distribution and kinematics.
Thirdly, an additional common feature to all experiments is the presence of significantflare in the outer regions of the thick discs after the growth of the new disc. This isillustrated in Fig. 4.3 for run B1 (thick disc formed during a merger with initial inclination0o). The Figure confronts the final vertical surface brightness profile (integrated forR < 10 kpc) of the contracted thick disc (left panel) to that of the thick disc evolvedin isolation (i.e. without the growth of the new disc, right panel) for the same amountof time. As shown in the Figure, the evolution in isolation indicates that the flare seenin the experiments is not linked to secular evolution in the discs. A closer inspection tothe profiles indicates that the flare is confined mostly in the outskirts of the contractedthick discs. In Chapter 2 it was found that the outer isophotes of the final thick discs(measured at surface brightness levels >6 mag the central value) are consistently moreboxy that the inner ones as a result of the merger. This would suggest that the flaredetected in the profiles reflects the presence of outer boxy contours that are broughtwithin R < 10 kpc (i.e. the region considered to make the profiles) after the structuralcontraction induced by the growth of the new disc.
Experiments from A to E
Figs. 4.4 to 4.10 show for all the experiments: (i) the vertical surface brightness profiles atseveral radii (including the best two-components sech2 fits) before and after the growthof the new disc; (ii) the surface density decomposition (into cold/thinner and hot/thickercomponents) of the final thick discs, including the segments of the profiles consideredto estimate the respective scalelengths and the mass fraction associated to the coldcomponent; and (iii) a comparison between scalelengths and scaleheights (for cold andhot components) of the initial thick discs and after the growth of the new disc. Note thatin these Figures we include only the stars from the thick disc (heated disc + satellite).These properties were computed within R < 10 kpc and |z| < 4 kpc.
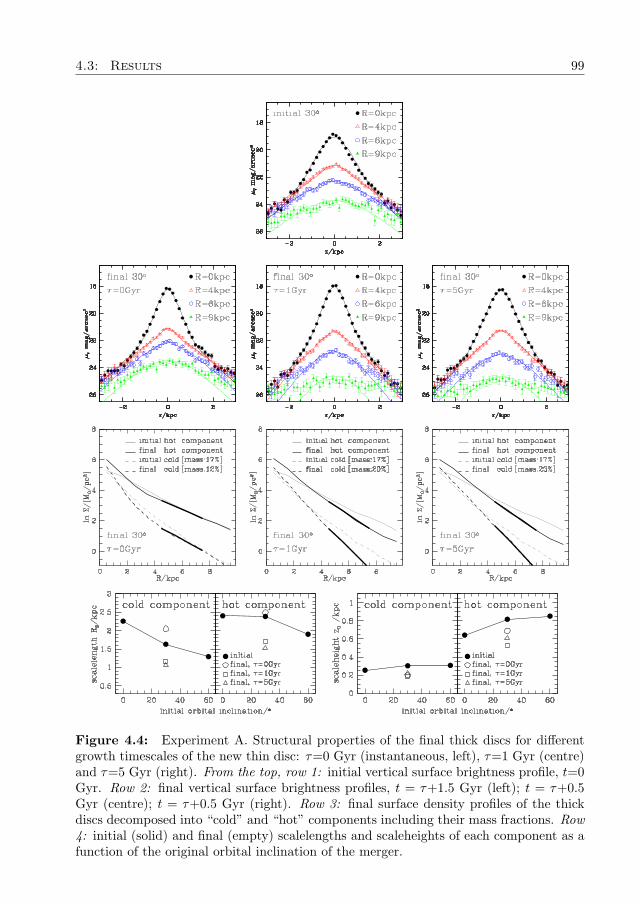
Experiment A (Fig. 4.4) shows that the structural evolution of the thick disc doesnot have a strong dependence on the growth timescale of the new thin disc (τ = 1 Gyror τ = 5 Gyr). These two cases produced vertical surface brightness profiles with anotoriously narrower and higher central peak ∼ 1 magnitude brighter than the initialconfiguration. However for R > 4 kpc, the surface brightness levels near the plane (z = 0kpc) are lower compared to the initial thick disc. These features reflect the radial andvertical contraction described above (see Fig. 4.1). The decrease of the scaleheights is∼33% for both timescales in the cold remnant (leftover after the merger event) andbetween 22–35% in the hot component. The radial surface density profiles are also very
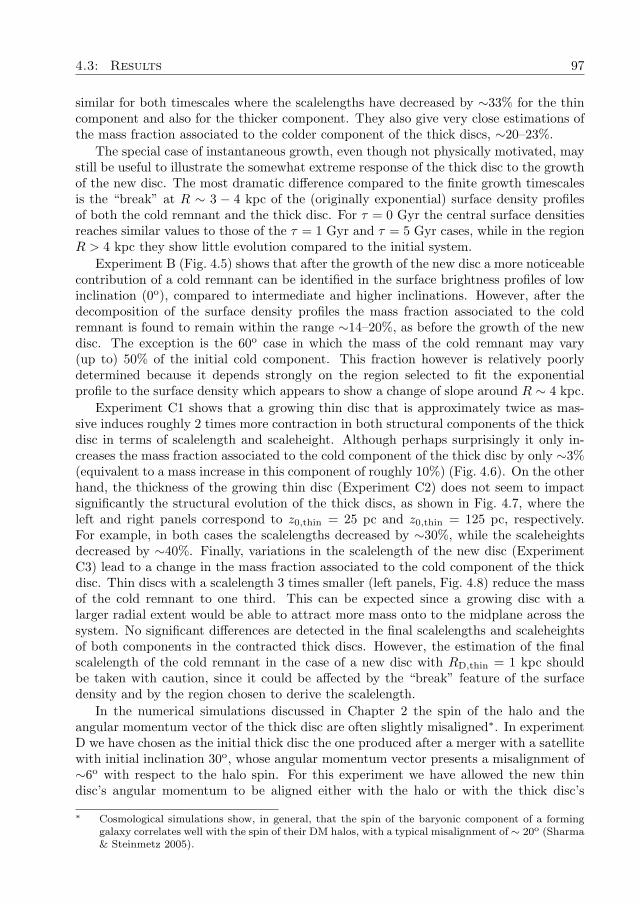
4.3: Results 97
similar for both timescales where the scalelengths have decreased by ∼33% for the thincomponent and also for the thicker component. They also give very close estimations ofthe mass fraction associated to the colder component of the thick discs, ∼20–23%.
The special case of instantaneous growth, even though not physically motivated, maystill be useful to illustrate the somewhat extreme response of the thick disc to the growthof the new disc. The most dramatic difference compared to the finite growth timescalesis the “break” at R ∼ 3 − 4 kpc of the (originally exponential) surface density profilesof both the cold remnant and the thick disc. For τ = 0 Gyr the central surface densitiesreaches similar values to those of the τ = 1 Gyr and τ = 5 Gyr cases, while in the regionR > 4 kpc they show little evolution compared to the initial system.
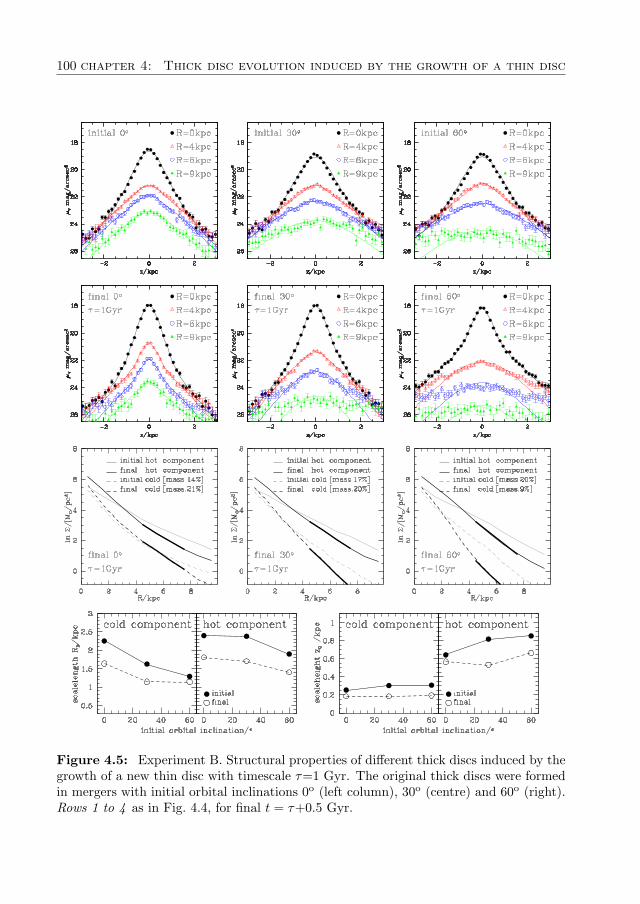
Experiment B (Fig. 4.5) shows that after the growth of the new disc a more noticeablecontribution of a cold remnant can be identified in the surface brightness profiles of lowinclination (0o), compared to intermediate and higher inclinations. However, after thedecomposition of the surface density profiles the mass fraction associated to the coldremnant is found to remain within the range ∼14–20%, as before the growth of the newdisc. The exception is the 60o case in which the mass of the cold remnant may vary(up to) 50% of the initial cold component. This fraction however is relatively poorlydetermined because it depends strongly on the region selected to fit the exponentialprofile to the surface density which appears to show a change of slope around R ∼ 4 kpc.
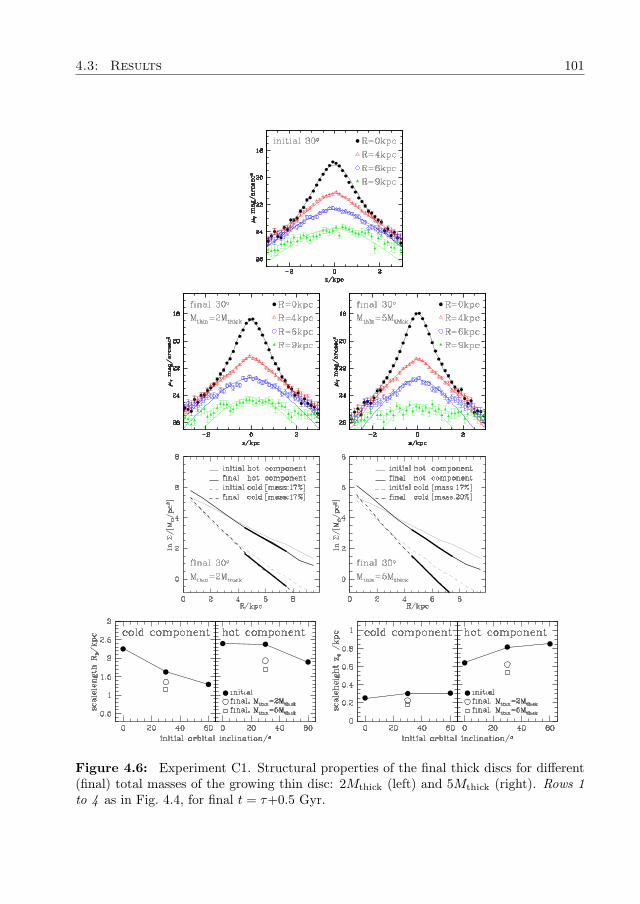
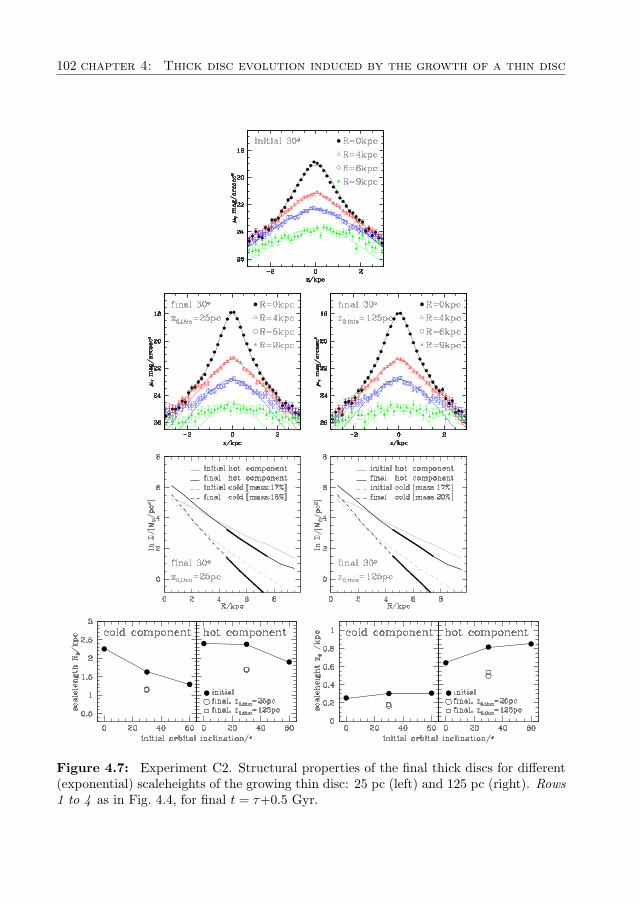
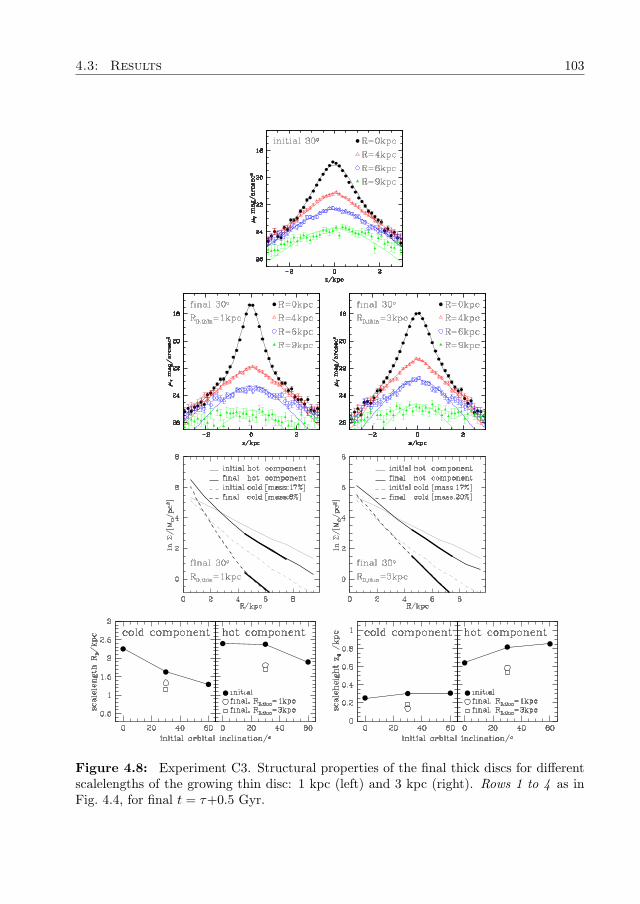
Experiment C1 shows that a growing thin disc that is approximately twice as mas-sive induces roughly 2 times more contraction in both structural components of the thickdisc in terms of scalelength and scaleheight. Although perhaps surprisingly it only in-creases the mass fraction associated to the cold component of the thick disc by only ∼3%(equivalent to a mass increase in this component of roughly 10%) (Fig. 4.6). On the otherhand, the thickness of the growing thin disc (Experiment C2) does not seem to impactsignificantly the structural evolution of the thick discs, as shown in Fig. 4.7, where theleft and right panels correspond to z0,thin = 25 pc and z0,thin = 125 pc, respectively.For example, in both cases the scalelengths decreased by ∼30%, while the scaleheightsdecreased by ∼40%. Finally, variations in the scalelength of the new disc (ExperimentC3) lead to a change in the mass fraction associated to the cold component of the thickdisc. Thin discs with a scalelength 3 times smaller (left panels, Fig. 4.8) reduce the massof the cold remnant to one third. This can be expected since a growing disc with alarger radial extent would be able to attract more mass onto to the midplane across thesystem. No significant differences are detected in the final scalelengths and scaleheightsof both components in the contracted thick discs. However, the estimation of the finalscalelength of the cold remnant in the case of a new disc with RD,thin = 1 kpc shouldbe taken with caution, since it could be affected by the “break” feature of the surfacedensity and by the region chosen to derive the scalelength.
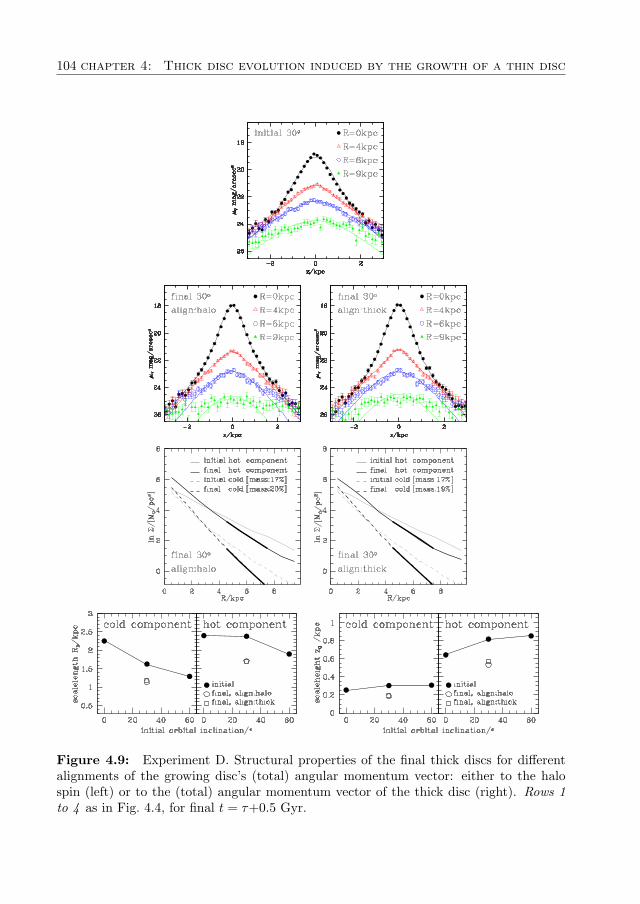
In the numerical simulations discussed in Chapter 2 the spin of the halo and theangular momentum vector of the thick disc are often slightly misaligned∗. In experimentD we have chosen as the initial thick disc the one produced after a merger with a satellitewith initial inclination 30o, whose angular momentum vector presents a misalignment of∼6o with respect to the halo spin. For this experiment we have allowed the new thindisc’s angular momentum to be aligned either with the halo or with the thick disc’s
∗ Cosmological simulations show, in general, that the spin of the baryonic component of a forminggalaxy correlates well with the spin of their DM halos, with a typical misalignment of ∼ 20o (Sharma& Steinmetz 2005).
98 chapter 4: Thick disc evolution induced by the growth of a thin disc
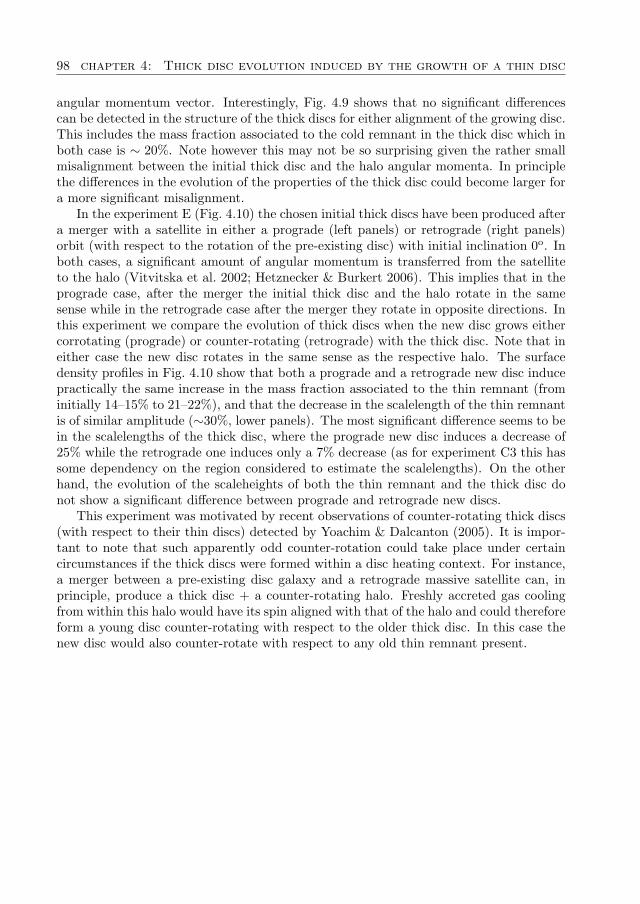
angular momentum vector. Interestingly, Fig. 4.9 shows that no significant differencescan be detected in the structure of the thick discs for either alignment of the growing disc.This includes the mass fraction associated to the cold remnant in the thick disc which inboth case is ∼ 20%. Note however this may not be so surprising given the rather smallmisalignment between the initial thick disc and the halo angular momenta. In principlethe differences in the evolution of the properties of the thick disc could become larger fora more significant misalignment.
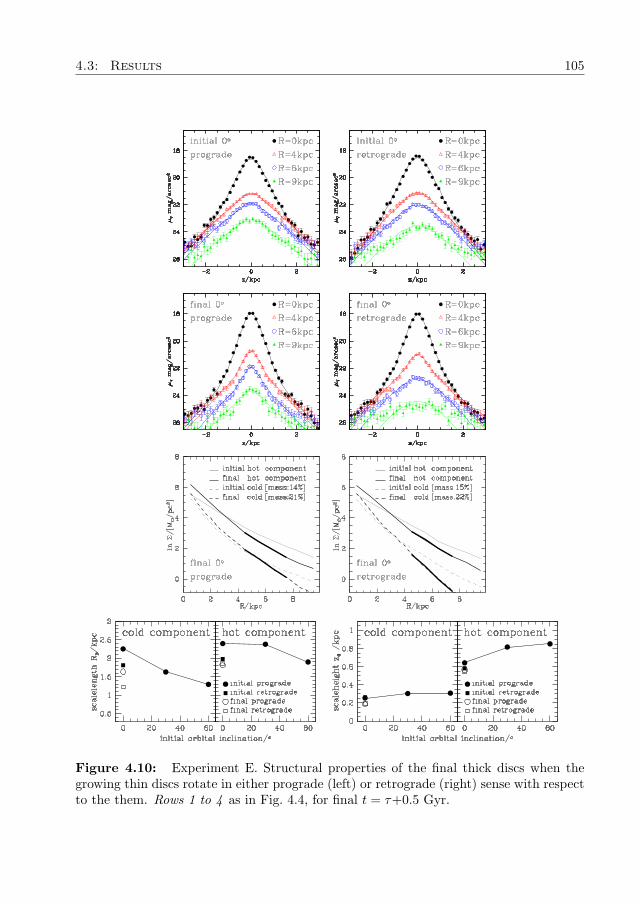
In the experiment E (Fig. 4.10) the chosen initial thick discs have been produced aftera merger with a satellite in either a prograde (left panels) or retrograde (right panels)orbit (with respect to the rotation of the pre-existing disc) with initial inclination 0o. Inboth cases, a significant amount of angular momentum is transferred from the satelliteto the halo (Vitvitska et al. 2002; Hetznecker & Burkert 2006). This implies that in theprograde case, after the merger the initial thick disc and the halo rotate in the samesense while in the retrograde case after the merger they rotate in opposite directions. Inthis experiment we compare the evolution of thick discs when the new disc grows eithercorrotating (prograde) or counter-rotating (retrograde) with the thick disc. Note that ineither case the new disc rotates in the same sense as the respective halo. The surfacedensity profiles in Fig. 4.10 show that both a prograde and a retrograde new disc inducepractically the same increase in the mass fraction associated to the thin remnant (frominitially 14–15% to 21–22%), and that the decrease in the scalelength of the thin remnantis of similar amplitude (∼30%, lower panels). The most significant difference seems to bein the scalelengths of the thick disc, where the prograde new disc induces a decrease of25% while the retrograde one induces only a 7% decrease (as for experiment C3 this hassome dependency on the region considered to estimate the scalelengths). On the otherhand, the evolution of the scaleheights of both the thin remnant and the thick disc donot show a significant difference between prograde and retrograde new discs.
This experiment was motivated by recent observations of counter-rotating thick discs(with respect to their thin discs) detected by Yoachim & Dalcanton (2005). It is impor-tant to note that such apparently odd counter-rotation could take place under certaincircumstances if the thick discs were formed within a disc heating context. For instance,a merger between a pre-existing disc galaxy and a retrograde massive satellite can, inprinciple, produce a thick disc + a counter-rotating halo. Freshly accreted gas coolingfrom within this halo would have its spin aligned with that of the halo and could thereforeform a young disc counter-rotating with respect to the older thick disc. In this case thenew disc would also counter-rotate with respect to any old thin remnant present.
4.3: Results 99
Figure 4.4: Experiment A. Structural properties of the final thick discs for differentgrowth timescales of the new thin disc: τ=0 Gyr (instantaneous, left), τ=1 Gyr (centre)and τ=5 Gyr (right). From the top, row 1: initial vertical surface brightness profile, t=0Gyr. Row 2: final vertical surface brightness profiles, t = τ+1.5 Gyr (left); t = τ+0.5Gyr (centre); t = τ+0.5 Gyr (right). Row 3: final surface density profiles of the thickdiscs decomposed into “cold” and “hot” components including their mass fractions. Row4: initial (solid) and final (empty) scalelengths and scaleheights of each component as afunction of the original orbital inclination of the merger.
100 chapter 4: Thick disc evolution induced by the growth of a thin disc
Figure 4.5: Experiment B. Structural properties of different thick discs induced by thegrowth of a new thin disc with timescale τ=1 Gyr. The original thick discs were formedin mergers with initial orbital inclinations 0o (left column), 30o (centre) and 60o (right).Rows 1 to 4 as in Fig. 4.4, for final t = τ+0.5 Gyr.
4.3: Results 101
Figure 4.6: Experiment C1. Structural properties of the final thick discs for different(final) total masses of the growing thin disc: 2Mthick (left) and 5Mthick (right). Rows 1to 4 as in Fig. 4.4, for final t = τ+0.5 Gyr.
102 chapter 4: Thick disc evolution induced by the growth of a thin disc
Figure 4.7: Experiment C2. Structural properties of the final thick discs for different(exponential) scaleheights of the growing thin disc: 25 pc (left) and 125 pc (right). Rows1 to 4 as in Fig. 4.4, for final t = τ+0.5 Gyr.
4.3: Results 103
Figure 4.8: Experiment C3. Structural properties of the final thick discs for differentscalelengths of the growing thin disc: 1 kpc (left) and 3 kpc (right). Rows 1 to 4 as inFig. 4.4, for final t = τ+0.5 Gyr.
104 chapter 4: Thick disc evolution induced by the growth of a thin disc
Figure 4.9: Experiment D. Structural properties of the final thick discs for differentalignments of the growing disc’s (total) angular momentum vector: either to the halospin (left) or to the (total) angular momentum vector of the thick disc (right). Rows 1to 4 as in Fig. 4.4, for final t = τ+0.5 Gyr.
4.3: Results 105
Figure 4.10: Experiment E. Structural properties of the final thick discs when thegrowing thin discs rotate in either prograde (left) or retrograde (right) sense with respectto the them. Rows 1 to 4 as in Fig. 4.4, for final t = τ+0.5 Gyr.
106 chapter 4: Thick disc evolution induced by the growth of a thin disc
4.3.2 Kinematical evolution of thick discs
General features
Similarly to the structural evolution, the adiabatic growth of a new disc induces twocharacteristic changes in the kinematics of the thick disc that are common to all theexperiments. In particular, an increase in the mean rotational velocity of the thick discand also in the velocity dispersions is observed.
The first kinematical effect, namely the increase in the rotational velocity of the starsin the thick disc, is directly related to the increase in the circular velocity vc at a givenradius R associated to the growth in mass of the thin disc. On the other hand, thehotter kinematics, and in particular the behaviour of σz can be understood as follows.Firstly, as the new disc grows it deposits additional mass in the midplane of the thickdisc, increasing the depth of the potential well of the system. Therefore more kineticenergy is required to climb out of this potential well. Secondly, the growing, massive andthin new disc also causes an increase in the vertical gradient of the potential (i.e. thevertical component of the force Fz = ∂Φ/∂z), i.e. it leads to larger accelerations for thestars as they cross the midplane, which results in an increase in σz.
Experiments from A to E
Figs. 4.11-4.17 show both the initial and the final global kinematics of the simulated thickdiscs as a function of galactocentric radius. They include the mean rotational velocityand the R, φ and z components of the velocity dispersions.
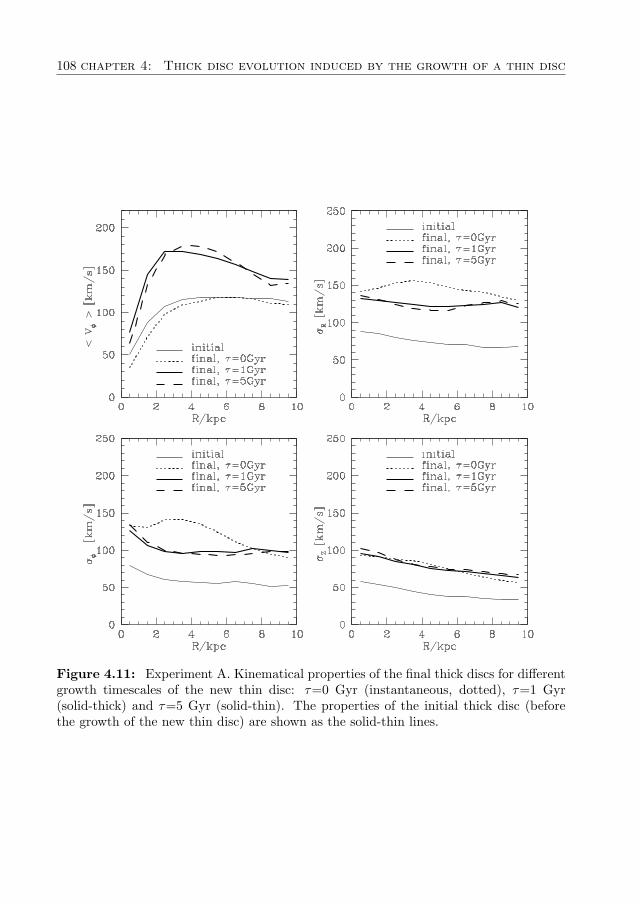
Experiment A (Fig. 4.11) shows, for the τ = 1 Gyr and τ = 5 Gyr cases, that theglobal kinematics of thick discs do not depend on the growth timescale of the new disc.On the other hand, the effect of the instantaneous growth on the global kinematics seemsto be somewhat more complex. First, the mean rotation of the thick disc does not seemto be affected by the growth of the new disc (except by some decrease in the inner region).This is consistent with the respective surface density profile (Fig. 4.4) which overall showslittle variation with respect to the initial configuration (except by the distinctive “break”at R ∼ 4 kpc). Although a significant amount of mass has been added to the system viathe growth of the new thin disc, this growth was far from adiabatic. This implies that theeccentricity of the orbits of the stars in the thick disc must have changed significantly, orequivalently, that the amount of ordered (circular) motion must be much smaller. Thusin practice, the extra potential energy due to the new thin disc must have gone intorandom motions in the plane.
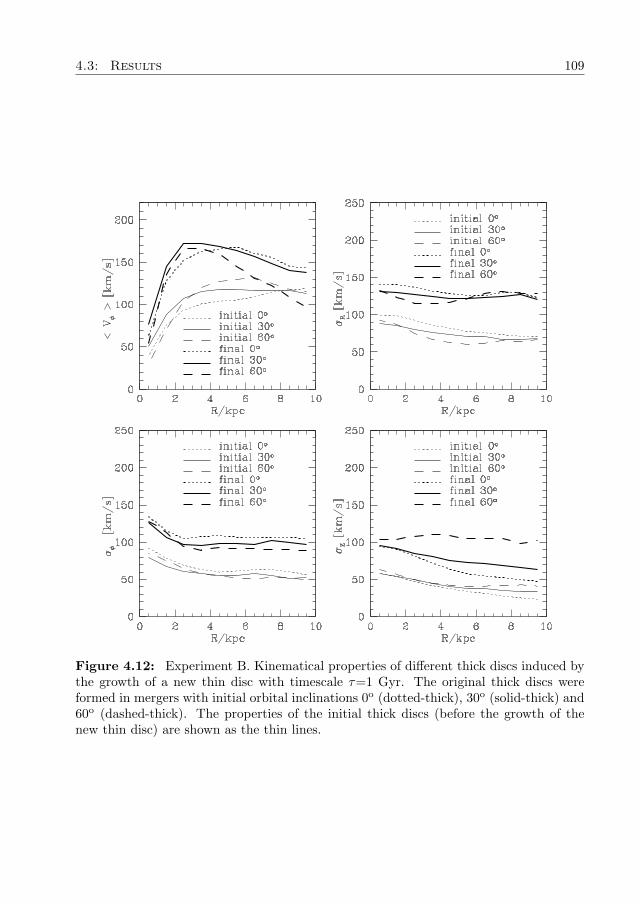
Experiment B (Fig. 4.12) shows that after the growth of the new thin disc, the finalvelocity dispersions of the thick discs tend to maintain the original dependences on theorbital inclination of the satellite (i.e. the hotter the initial thick disc the hotter thefinal one). Note however that the mean rotational velocity in the 60o case shows aclear decrease at larger radii. A closer inspection shows that this is due to the increasingskewness of the total vφ distribution (towards lower velocities) at larger radii which arisesfrom the contribution of the accreted stars, which are preferentially found in the outskirtsand which rotate more slowly.
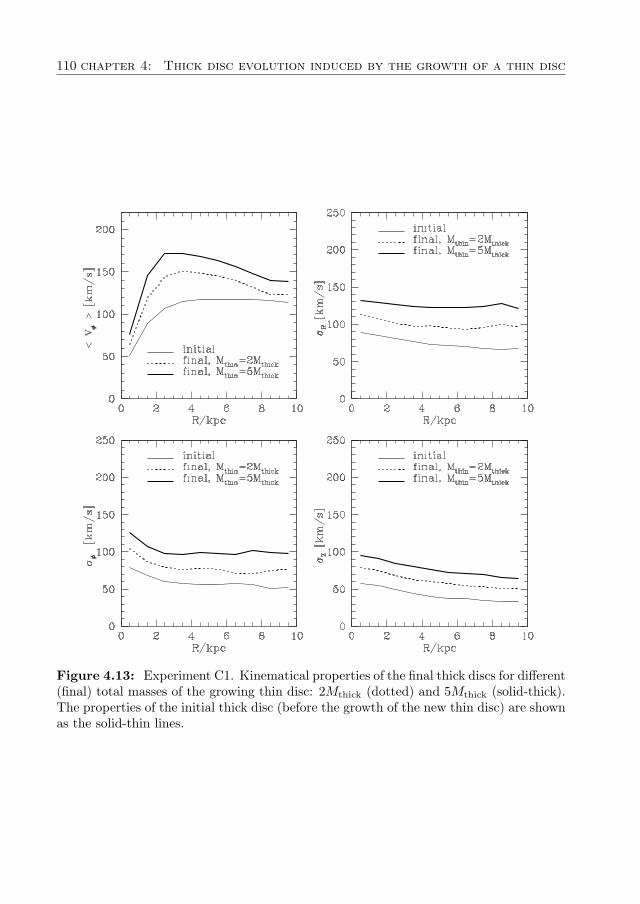
Experiment C1 (Fig. 4.13) shows that a more massive growing disc is able to inducea larger increase in both the mean rotation of the thick disc and the velocity dispersions.This can be expected from the discussion above regarding the deepening of the potential
4.3: Results 107
well induced by a massive growing new disc. Note from the Figure that a new disc thatis roughly twice as massive induces roughly a doubling in all the velocity dispersions.
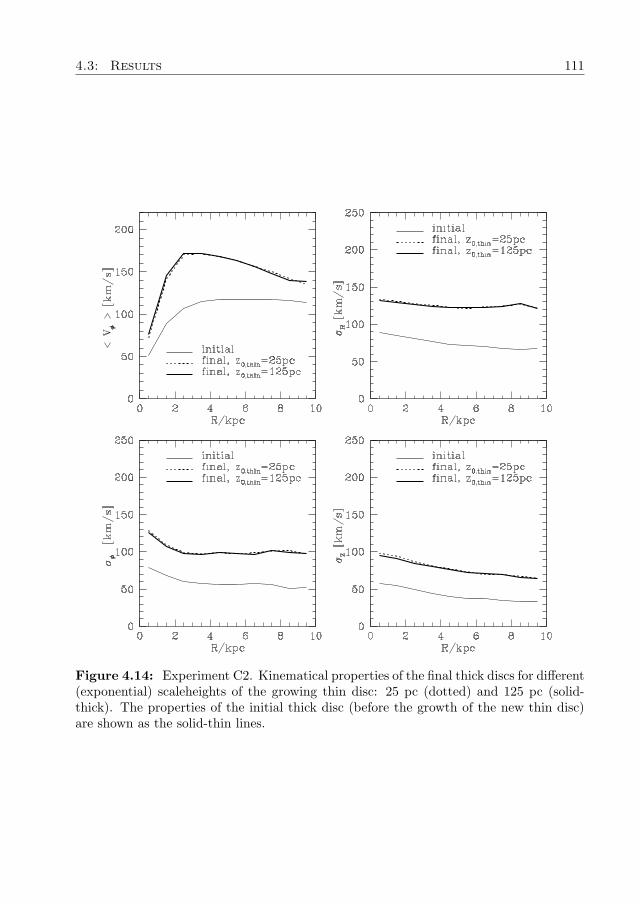
Experiment C2 (Fig. 4.14) shows that the kinematical evolution of thick disc starsdoes not depend on the thinness of the growing new disc (in terms of scaleheight).
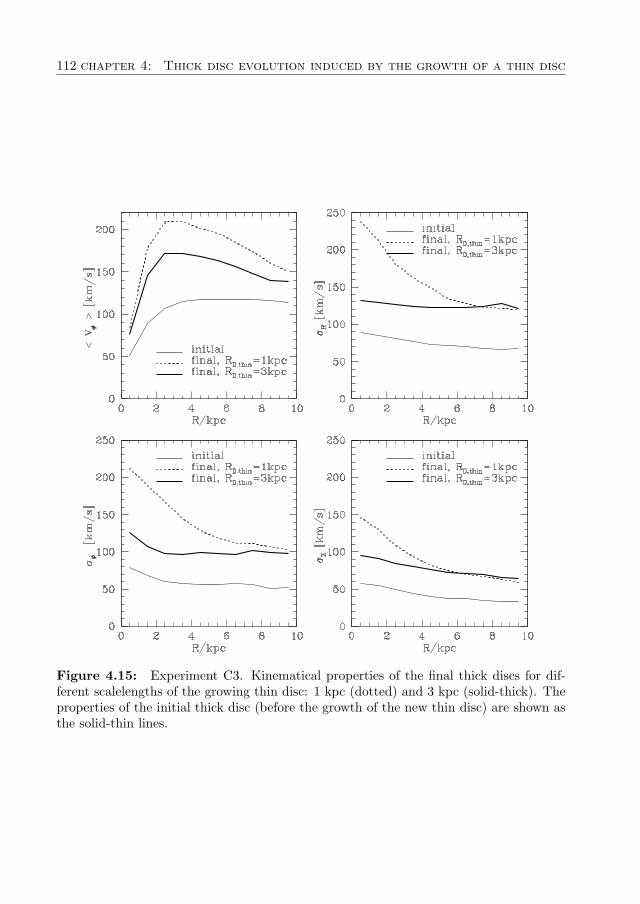
Experiment C3 (Fig. 4.15) shows that when the new disc is more compact in radius (atfixed mass), the larger amount of mass present in the inner regions induces a significantincrease in the mean rotation of the thick disc in this radial regime as expected. Avery noticeable increase in all three components of the velocity ellipsoid is also observed,mainly in the central region, which is probably related to the large gradients in thepotential present in the more compact disc.
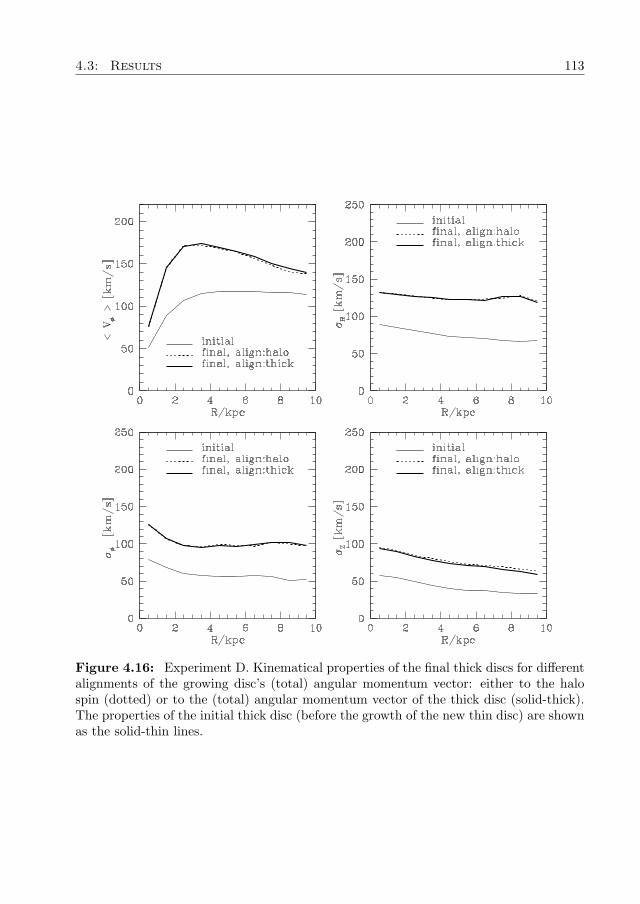
Experiment D (Fig. 4.16) shows that the relative alignment of the new disc (withrespect to either the halo or the thick disc angular momenta) does not seem to affectthe kinematical evolution of the thick discs. This could also have been expected fromthe lack of structural evolution shown in Fig. 4.9. Note however that the misalignmentbetween the halo spin and the angular momentum vector is only ∼ 6o which is possiblytoo small to induce significant differences in both the structure and kinematics of thethick disc.
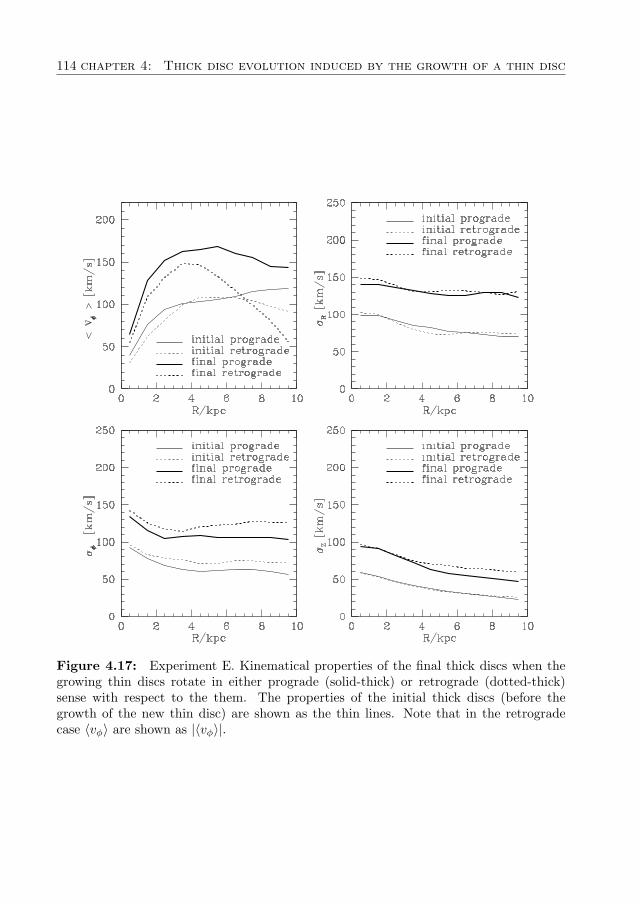
Experiment E (Fig. 4.17) shows that the evolution of all three velocity dispersions isvery similar for both prograde and retrograde growing discs, as expected from Fig. 4.10.Note that for the retrograde case there is a significant decrease in the mean rotation ofthe thick disc at R > 4 kpc. Similarly to experiment B2 a closer inspection shows thatthere is a significant skewness in the distribution of vφ towards lower velocities. This isdue to the contribution of satellite stars at outer radii which rotate more slowly thandisc stars. Overall, a retrograde growing thin disc is observed to induce the very similarevolution in the kinematics of the thick disc in comparison to the prograde case. Themost significant difference is found in σz where the retrograde disc induces a somewhathigher dispersion at large radii.
108 chapter 4: Thick disc evolution induced by the growth of a thin disc
Figure 4.11: Experiment A. Kinematical properties of the final thick discs for differentgrowth timescales of the new thin disc: τ=0 Gyr (instantaneous, dotted), τ=1 Gyr(solid-thick) and τ=5 Gyr (solid-thin). The properties of the initial thick disc (beforethe growth of the new thin disc) are shown as the solid-thin lines.
4.3: Results 109
Figure 4.12: Experiment B. Kinematical properties of different thick discs induced bythe growth of a new thin disc with timescale τ=1 Gyr. The original thick discs wereformed in mergers with initial orbital inclinations 0o (dotted-thick), 30o (solid-thick) and60o (dashed-thick). The properties of the initial thick discs (before the growth of thenew thin disc) are shown as the thin lines.
110 chapter 4: Thick disc evolution induced by the growth of a thin disc
Figure 4.13: Experiment C1. Kinematical properties of the final thick discs for different(final) total masses of the growing thin disc: 2Mthick (dotted) and 5Mthick (solid-thick).The properties of the initial thick disc (before the growth of the new thin disc) are shownas the solid-thin lines.
4.3: Results 111
Figure 4.14: Experiment C2. Kinematical properties of the final thick discs for different(exponential) scaleheights of the growing thin disc: 25 pc (dotted) and 125 pc (solid-thick). The properties of the initial thick disc (before the growth of the new thin disc)are shown as the solid-thin lines.
112 chapter 4: Thick disc evolution induced by the growth of a thin disc
Figure 4.15: Experiment C3. Kinematical properties of the final thick discs for dif-ferent scalelengths of the growing thin disc: 1 kpc (dotted) and 3 kpc (solid-thick). Theproperties of the initial thick disc (before the growth of the new thin disc) are shown asthe solid-thin lines.
4.3: Results 113
Figure 4.16: Experiment D. Kinematical properties of the final thick discs for differentalignments of the growing disc’s (total) angular momentum vector: either to the halospin (dotted) or to the (total) angular momentum vector of the thick disc (solid-thick).The properties of the initial thick disc (before the growth of the new thin disc) are shownas the solid-thin lines.
114 chapter 4: Thick disc evolution induced by the growth of a thin disc
Figure 4.17: Experiment E. Kinematical properties of the final thick discs when thegrowing thin discs rotate in either prograde (solid-thick) or retrograde (dotted-thick)sense with respect to the them. The properties of the initial thick discs (before thegrowth of the new thin disc) are shown as the thin lines. Note that in the retrogradecase 〈vφ〉 are shown as |〈vφ〉|.
4.4: Discussion 115
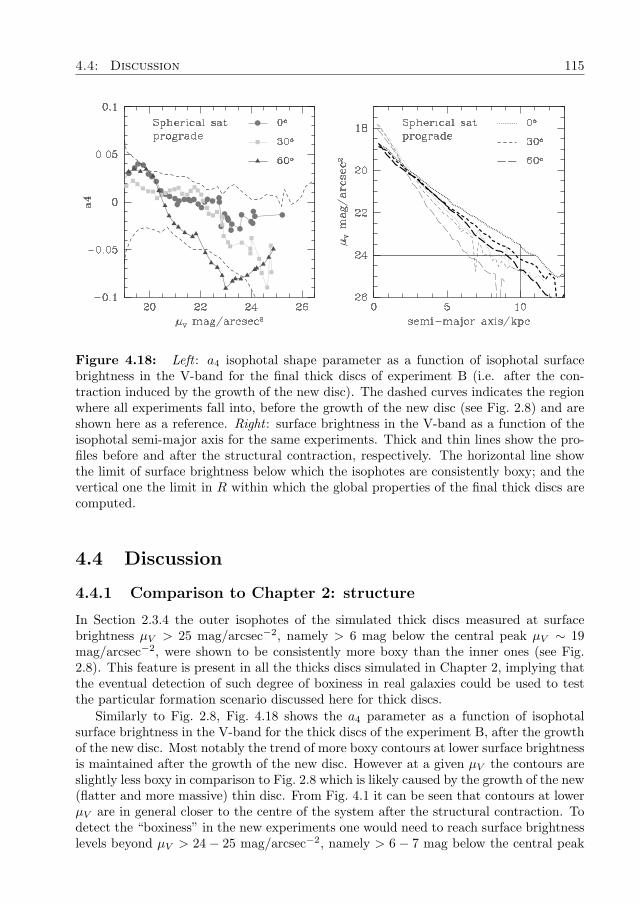
Figure 4.18: Left : a4 isophotal shape parameter as a function of isophotal surfacebrightness in the V-band for the final thick discs of experiment B (i.e. after the con-traction induced by the growth of the new disc). The dashed curves indicates the regionwhere all experiments fall into, before the growth of the new disc (see Fig. 2.8) and areshown here as a reference. Right : surface brightness in the V-band as a function of theisophotal semi-major axis for the same experiments. Thick and thin lines show the pro-files before and after the structural contraction, respectively. The horizontal line showthe limit of surface brightness below which the isophotes are consistently boxy; and thevertical one the limit in R within which the global properties of the final thick discs arecomputed.
4.4 Discussion
4.4.1 Comparison to Chapter 2: structure
In Section 2.3.4 the outer isophotes of the simulated thick discs measured at surfacebrightness µV > 25 mag/arcsec−2, namely > 6 mag below the central peak µV ∼ 19mag/arcsec−2, were shown to be consistently more boxy than the inner ones (see Fig.2.8). This feature is present in all the thicks discs simulated in Chapter 2, implying thatthe eventual detection of such degree of boxiness in real galaxies could be used to testthe particular formation scenario discussed here for thick discs.
Similarly to Fig. 2.8, Fig. 4.18 shows the a4 parameter as a function of isophotalsurface brightness in the V-band for the thick discs of the experiment B, after the growthof the new disc. Most notably the trend of more boxy contours at lower surface brightnessis maintained after the growth of the new disc. However at a given µV the contours areslightly less boxy in comparison to Fig. 2.8 which is likely caused by the growth of the new(flatter and more massive) thin disc. From Fig. 4.1 it can be seen that contours at lowerµV are in general closer to the centre of the system after the structural contraction. Todetect the “boxiness” in the new experiments one would need to reach surface brightnesslevels beyond µV > 24− 25 mag/arcsec−2, namely > 6− 7 mag below the central peak
116 chapter 4: Thick disc evolution induced by the growth of a thin disc
of the thick discs after the growth of the new disc, µV ∼ 18 mag/arcsec−2.The right panel of Fig. 4.18 shows the isophotal surface brightness as a function of
the isophotal semi-major axis, for the experiment B, before and after the growth of thenew disc. As described in Section 4.3.1, this Figure suggests that a possible cause of thelarger degree of flaring observed at the outskirts of the final thick discs in the experimentspresented in this Chapter (see Fig. 4.3), is the structural contraction which brings boxyisophotes within the region R < 10 kpc.
In Section 2.4.2, the structure of the simulated thick discs was shown to be in goodagreement with observations of external galaxies and the Milky Way in terms of thick-to-thin ratios of both scalelengths and scaleheights. The reader should recall that thisresult was based on the strong assumptions that thick disc structure would not be stronglyaffected by the growth of a new thin disc and that this thin disc would follow the samedistribution as the cold remnant of the thick disc. In general, the results of the presentChapter have shown that thick discs do respond to the growth of the thin disc. So thequestion arises: How do the new scale ratios, after the formation of the new thin disc,compare to observations? In our new experiments we find final thick-to-thin scaleheightratio to be ∼ 0.6/0.125 = 4.8, which is still within the range 2.4-5.3 observed in the MilkyWay and in S0 galaxies (see Buser et al. 1999; Pohlen et al. 2004; Yoachim & Dalcanton2006).
If it is assumed that the Galactic thick disc was formed according to the disc heatingscenario explored in this thesis, then it is interesting to use the results described above tospeculate on the original scales of the thick disc of the Milky Way, namely those beforethe structural contraction induced by the formation of the current thin disc, and thoseof the pre-existing disc galaxy, before the merger with the satellite. For example, wetypically find that the scalelength of the thick disc after the merger with the satelliteincreases by a factor fRmerger ∼ 1.3− 1.45, as shown in Section 2.3.4. On the other hand,the formation of a thin disc component with 5× more mass, leads to a contraction inthe scalelength of fRcontr ∼ 0.6. Therefore, this would imply that the scalelength of thepre-existing disc Rinitial
D = (fRmerger × fRcontr)−1 ×RD,thick or Rinitial
D ∼ 1.15RD,thick, i.e. itwould be comparable to the present-day value of the thick disc. This implies that theincrease in extent due to the merger is nearly completely balanced by the contractioninduced by the thin disc in the system. The Galactic pre-existing disc, should it haveexisted, would have had an initial scalelength, using current estimates for the thick discscalelength of RD,thick = 2.5− 3 kpc, Rinitial
D ∼ 2.9− 3.5 kpc. Similarly, we may computethe initial scaleheight of the thick disc from fzmerger ∼ 4.7 and fzcontr ∼ 0.6 (both for a30o inclination encounter). Thus, after assuming for the current thick disc z0,thick = 1kpc, we estimate the scaleheight of the pre-existing disc as zinitial
0 ∼ 340 pc. Therefore,the structure of the pre-existing disc is estimated to be similar to that of the currentGalactic thin disc.
4.4.2 Comparison to Chapter 2: kinematics
In Section 2.3.4 we found that when thick discs are considered as a whole (i.e. withoutdecomposing it into cold and hot components), their mean rotational velocities presentclear gradients as a function of height (see Fig. 2.20). The magnitude of these verti-cal gradients showed a significant dependence with the initial orbital inclination of thesatellite, being the gradients larger for lower inclinations.
4.4: Discussion 117
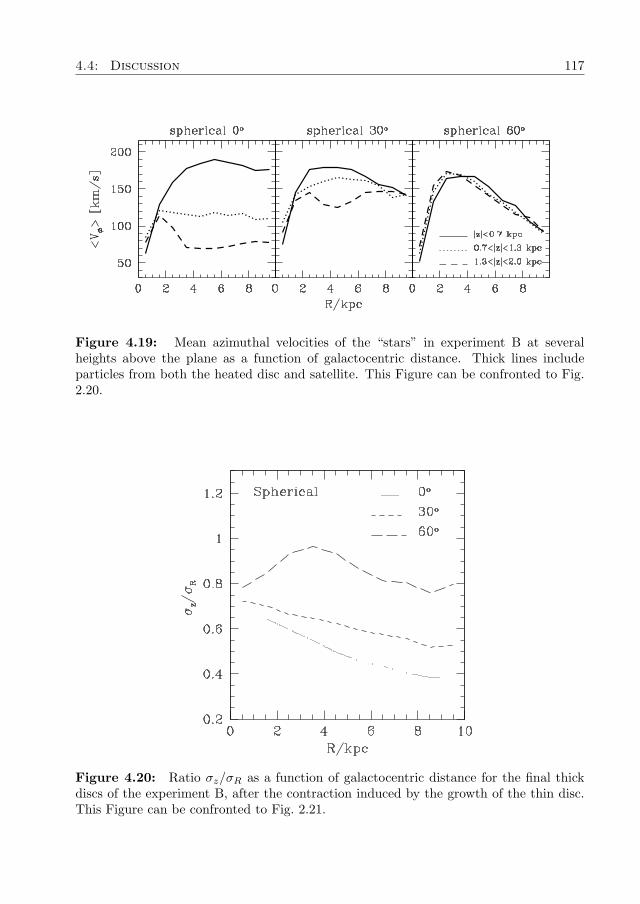
Figure 4.19: Mean azimuthal velocities of the “stars” in experiment B at severalheights above the plane as a function of galactocentric distance. Thick lines includeparticles from both the heated disc and satellite. This Figure can be confronted to Fig.2.20.
Figure 4.20: Ratio σz/σR as a function of galactocentric distance for the final thickdiscs of the experiment B, after the contraction induced by the growth of the thin disc.This Figure can be confronted to Fig. 2.21.
118 chapter 4: Thick disc evolution induced by the growth of a thin disc
Fig. 4.19 shows the variations in the mean rotational velocity of the final thick discsof experiment B as a function of galactocentric distance. It is interesting to see thatafter the growth of the new thin disc the vertical gradients remain in place, maintainingtheir dependence on the initial inclination of the satellite. As concluded in Chapter 2,the possible detection of such vertical gradients in the thick disc of the Milky Way (e.g.Girard et al. 2006; Ivezić et al. 2008) would suggest a merger with low or intermediateinclination if the Galactic thick disc was formed in a disc heating scenario. Note alsothe progressive decrease of the mean rotation at outer radii for larger inclinations. Aswe shall see below, this is due to the fact that stars from the heated disc and those fromsatellite have rather different z-components of angular momentum at those radii (seeFig. 4.21 below).
In Section 2.3.4, we showed that in the simulated thick discs the ratio of velocitydispersions σz/σR appears to be a very good discriminant of the initial orbital inclinationof the accreted satellite (see Fig. 2.21). Recent observations in the Solar neighbourhood(e.g., see Layden et al. 1996; Chiba & Beers 2001; Soubiran et al. 2003; Alcobé & Cubarsi2005; Vallenari et al. 2006) report σz/σR ∼ 0.6 which when confronted to Fig. 2.21 seemto suggest a merger with low/intermediate initial inclination if the Galactic thick discwas formed in a disc heating scenario. Fig. 4.20 shows the σz/σR ratio as a functionof galactocentric distance for the final thick discs in experiment B, after the growth ofthe new disc. This Figure can be confronted directly to Fig. 2.21. It is very interestingto see that the conclusions previously drawn are still valid. For example, this ratiostill suggests a merger with low/intermediate initial inclination for σz/σR ∼ 0.6. It isimportant to highlight that this is also observed in the rest of the experiments presentedin this Chapter.
For the experiment with initial inclination 30o, we find that after the merger with thesatellite the velocity dispersions in the thick disc increase by factors (fR, fφ, fz)merger ∼(2, 1.7, 1.5), which are obtained by measuring the velocity dispersions at 2.4RD (seeTable 2.1 for “z=1”) and at 2.4RD,thick (see Fig. 2.14 for “z=1”). Aditionally, thegrowth of a new disc with 5× more mass further increases the velocity dispersions byfactors (fR, fφ, fz)contr ∼ (1.8, 2, 2.2), where the final velocity dispersions were mea-sured at 2.4Rfinal
D,thick (see bottom panel of Fig. 4.5). As in the case of the estimationsfor the structure of the pre-existing disc, we estimate its initial velocity dispersionsas (σinitial
R , σinitialφ , σinitial
z ) ∼ (18, 16, 12) km s−1, after assuming current values for theGalactic thick disc (65, 54, 38) km s−1. The whole process of heating and subsequentcontraction leads to an increase by a factor of ∼ 3.4 in all velocity dispersions for thisparticular example.
4.4.3 Comparison to Chapter 3
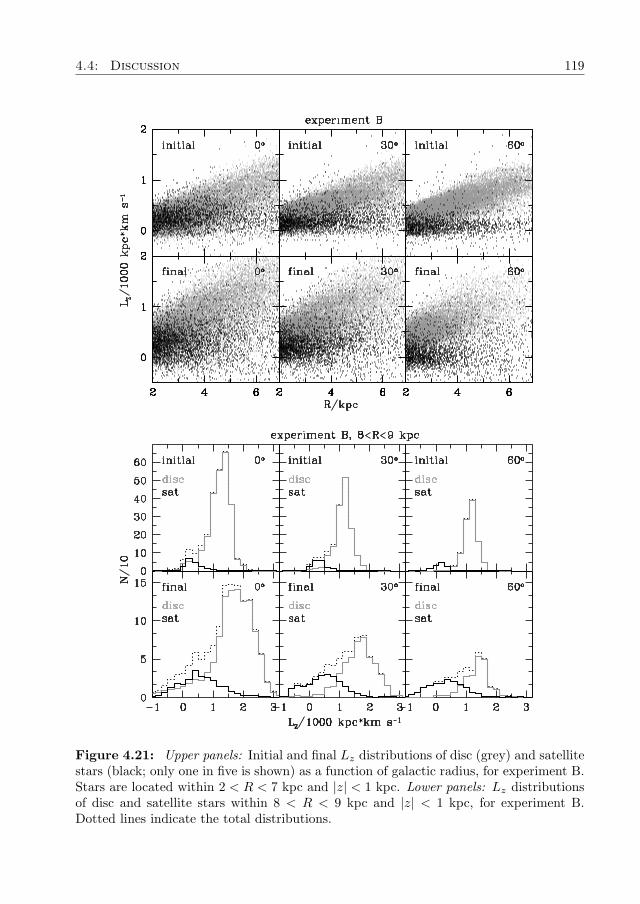
In Section 3.3.2, Fig. 3.6 shows the final distributions of the z-component of the angularmomentum Lz of both disc and satellite stars as a function of galactocentric distance.This Figure presents Lz(R) as a good discriminator to separate heated disc stars fromthose of the satellite, especially at outer radii. Fig. 4.21 (upper panels) shows both theinitial and final Lz distributions of disc (grey) and satellite stars for experiment B. Starsare located within 2 < R < 7 kpc and |z| < 1 kpc. Note that the initial separationbetween disc and satellite stars in experiment B is less clear in comparison to Fig. 3.6which is likely related to differences in the intrinsic kinematics of the satellites used in
4.4: Discussion 119
Figure 4.21: Upper panels: Initial and final Lz distributions of disc (grey) and satellitestars (black; only one in five is shown) as a function of galactic radius, for experiment B.Stars are located within 2 < R < 7 kpc and |z| < 1 kpc. Lower panels: Lz distributionsof disc and satellite stars within 8 < R < 9 kpc and |z| < 1 kpc, for experiment B.Dotted lines indicate the total distributions.
120 chapter 4: Thick disc evolution induced by the growth of a thin disc
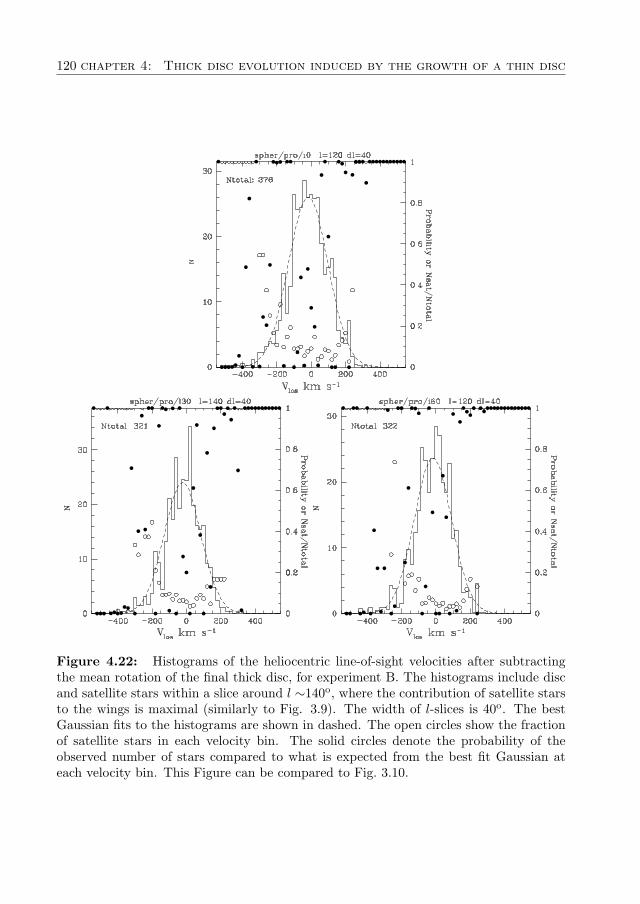
Figure 4.22: Histograms of the heliocentric line-of-sight velocities after subtractingthe mean rotation of the final thick disc, for experiment B. The histograms include discand satellite stars within a slice around l ∼140o, where the contribution of satellite starsto the wings is maximal (similarly to Fig. 3.9). The width of l-slices is 40o. The bestGaussian fits to the histograms are shown in dashed. The open circles show the fractionof satellite stars in each velocity bin. The solid circles denote the probability of theobserved number of stars compared to what is expected from the best fit Gaussian ateach velocity bin. This Figure can be compared to Fig. 3.10.
4.5: Summary and Conclusions 121
each case (spherical vs. discy). After the growth of the new disc the separation betweendisc and satellite stars is even less clear. This is partially because of the larger velocitydispersion induced by the growth of the new disc as described in Section 4.3.2, but alsobecause the number of stars at radii ∼ 6 kpc (and beyond) is smaller, especially fromthe satellite. The lower panels of Fig. 4.21 shows the distributions of disc and satellitestars located with 8 < R < 9 kpc (i.e. at outer radii) and |z| < 1 kpc. The histogramsshow that there is not a clear cut between disc and satellite stars (not even in the initialthick discs, except in the 60o case) but it is possible to distinguish a large contributionof satellite stars in the wings of the distributions of low Lz which causes significantasymmetries in the total distributions. Nevertheless, it is important to notice that thetrend of Lz as function of R of disc stars is maintained and thus should be observablee.g. in the Galactic thick disc if this was formed via the heating of a pre-existing disc.
In Section 3.3.3 it was shown that the wings of the distributions of heliocentric line-of-sight velocities, vlos, measured in small volumes in the final thick discs, contain mostlystars from the satellite. These velocity distributions were found to differ significantlyfrom Gaussians because of the more heavily populated wings (see Fig. 3.10). Fig. 4.22shows a very similar behaviour for the final thick discs of experiment B, after the growthof the new disc. In this case the volumes are located somewhat closer to the centre,at ∼ 3 kpc (1.5 kpc radius) to take into account the radial contraction of the systemsafter the growth of the new disc. However, the reader should recall that the final resultsof the test were not found to be dependent on either the size or the location of thevolumes (Section 3.3.3). Note in the Figures that the dispersion of the vlos distributionsare significantly larger than in Fig. 3.10. Nonetheless the same statistical tests as usedin Chapter 3 now also successfully detect the contribution of satellite stars to the wings.
4.5 Summary and ConclusionsIn this Chapter we have studied a sample of the thick discs from Chapter 2 in order tocharacterise their morphological and kinematical evolution after the adiabatic growth ofa thin and more massive disc.
The simulations presented in this Chapter explore several aspects of the growth of thenew disc that are likely to influence the way the global properties of the thick disc evolve.Specifically we have explored the following variables: (i) three growth timescales (0, 1and 5 Gyr); (ii) three initial thick discs (all originally formed by mergers with progradespherical satellites with initial orbital inclinations 0o, 30o and 60o); (iii) two total masses(2 and 5 times that of the thick disc), (iv) two scaleheights (25 and 125 pc), and (v)two scalelengths for the new disc (1 and 3 kpc); additionally (vi) two alignments of itsangular momentum vector (either with respect to the main halo’s spin axis or to theangular momentum vector of the thick disc); and (vii) two directions of rotation relativeto the thick disc (prograde and retrograde).
Our simulations show that after the adiabatic growth of the new thin disc the struc-tures of the thick discs are characterised by a strong contraction which leads to a signifi-cant decrease in their scalelengths and scaleheights. This contraction is triggered by thedeepening of the potential well of the system due to the steady mass growth associatedwith the new disc. One of the consequences of this contraction is the migration of starsfrom the outskirts inwards. Stars that were typically at R ∼ 15 kpc before the growthof the new disc, are found at R ∼9 kpc after the growth is completed.
122 chapter 4: Thick disc evolution induced by the growth of a thin disc
In spite of the strong contraction, the mass fraction associated to the kinematicallycold component of the final thick discs remains < 25%, as comparable to the masspresent in the remnants of the mergers discussed in Chapter 2. The outskirts of thesediscs (R ∼ 3.8− 5.6RD,thick) present boxy contours at very low surface brightness levels(> 6− 7 mag below the central peak).
We find from the particular experiments performed here that most of the structuraland kinematical evolution of the thick discs is driven by the total mass and scalelength ofthe growing thin disc, with a weak dependence on the characteristics of the initial thickdisc. Conversely, the growth timescale of the formation of the new disc appears to havelittle or no detectable influence on the final structure of the thick discs provided thistimescale is sufficiently long for the process to be considered adiabatic. Similarly, neitherthe thinness (in terms of scaleheight) nor the alignment of its angular momentum vector(either to the halo spin or to that of the thick disc) seem to affect the final properties ofthe thick discs. The sense of rotation of the growing disc (either prograde or retrogradewith respect to the thick disc) has an effect on the radial extension of the cold componentof the thick disc, which is significantly shorter for retrograde rotation.
Kinematically, the main effects on the thick disc induced by the adiabatic growth ofthe new and more massive thin disc are the significant increase in the mean rotation andin all three components of the velocity dispersion. The increase in the mean rotation isassociated to the larger mass deposited at a given radius after the structural contractiondescribed above. Also as a consequence of the structural contraction and additionalmass accumulation at the centre of the system and on the midplane of the thick disc, theincrease in the velocity dispersions is linked to a significant steepening of the gravitationalpotential gradient near the plane of the disc.
AcknowledgementsWe thank Joachim Stadel and Thomas Quinn for allowing us to use their PKDGRAVcode. We are also grateful to the organisers of the Ensenada meeting on “Galaxy Struc-ture and the Structure of Galaxies” for providing the right atmosphere and setting toget this project started.The numerical simulations including a growing disc were performed on the zBox super-computer at the University of Zürich and on the Cosmos cluster at the Jet PropulsionLaboratory (JPL). Cosmos was provided by funding from the JPL Office of the ChiefInformation Officer.The numerical simulations performed to produce the thick discs used as initial conditionsin this study were run in the Linux cluster at the Centre for High Performance Computingand Visualisation (HPC/V) of the University of Groningen in The Netherlands.We acknowledge financial support from the Netherlands Organisation for Scientific Re-search (NWO).