university of michigan hospital nursing department charge...
TRANSCRIPT
University of Michigan Hospital Nursing Department
Charge Nurse Workload Study:
Of the University of Michigan HospitalNursing Units (5A, 5D, 6A, 8C, and Trauma Burn)
April 23, 1998
Program and Operations Analysis:Christen Scozzafave
Kim PargoffMatthew Withey

Table of Contents
Topic: Page:
Executive Summary 1
Introduction and Background 2
Approach and Methodology 3
Current Situation 5
Findings and Conclusions5A 56A 78C 10Trauma Burn 145D 17
Recommendations 19
Action Plan 21
Appendix A: 5A Nursing Unit Charts and Data
Appendix B: 6A Nursing Unit Charts and Data
Appendix C: 8C Nursing Unit Charts and Data
Appendix D: Trauma Burn Nursing Unit Charts and Data
Appendix E: 5D Nursing Unit Charts and Data
Appendix F: Additional Project Materials

Executive Summary
The University of Michigan Hospital (UMH) Nurse Managers and the Program ofOperations and Analysis Department formulated this study to determine the averageproportion of time that charge nurses spend performing patient care activities versuscharge nurse duties in various nursing units throughout the University of MichiganHospital. This report will present information, data, findings and conclusions on how theworkload of the University Hospital Charge Nurses is distributed. We are trying todetermine if the patient care workload that charge nurses are being assigned is too largeto be performed in conjunction with their charge nurse duties.
The University of Michigan Hospital charge nurses performed a two-week randombeeper study in the following units, 5A, 6A, 8C, 5D, and Trauma Bum. Theinvestigation of the six units has resulted in the following findings and conclusions aboutthe distribution of work among the charge nurses in these units. In 5A-Orthopaedics theoverall mean percentage of time spent on charge nurse activities was 28% and patientcare activity consumed 60% of overall time. In 6A-Physical Medicine andRehabilitation, charge nurse activities consumed 28% of overall time and patient careactivity was 61% of overall time. In 8C-Nueropsychiatry, on average, charge nurseactivities took 10% of overall time, and patient care took 76% of overall time. Theintensive care units had a larger percentage of time devoted to charge nurse activities andless time to patient care than the general care units. In the Trauma Burn intensive careunit the overall mean percentage of time spent on charge nurse activities was 53%, whilethe mean percentage of time spent of patient care activity was 37%. 5D-SurgicalIntensive Care Unit showed similar results with charge nurse activities consuming 55%of overall time and patient care activities taking 37% of overall time.
We did further analysis on the breakup of patient care using medicus information and thestated acuity of the charge nurses patient assignments. By investigating the acuity of thecharge nurses’ patient assignments in all units we found that the majority of the time theexpected amount of patient care hours exceeded the available amount of patient carehours. If medicus acuity information is a proper tool for measuring patient care workloadin this study, it reveled that the charge nurses don’t have enough time to performadequate patient care and also perform their charge nurse duties.
The following are general recommendations for all units that could help improve thecharge nurse role. Each unit should have a clearly written definition of expectations andresponsibilities of the charge nurse role. This recommendation could help solve anyconfusion about which charge nurse activities are most time consuming to complete, tomake the position more organized and standardized. Looking at upstream solutions suchas new methods to reduce time spent on staffing, admissions and transfers. These threeactivities consume a lot of the charge nurses’ time and these responsibilities couldpossibly be redistributed or be better predicted before each shift.In most units staffing consumes the most time of all charge nurse activities.We also recommend a future study to investigate the staffing system in all of the units topossibly find new processes to handle staffing and to reduce the large amount of time
UMH/Prog. And Ops. Analysis I C.Scozzafave, M.Withey,K.Pargoff

charge nurses spend on staffing issues. Another way to reduce the time that chargenurses spend on staffing could be to institute a program to decrease absenteeism.Institution of a paid time off policy is being planned for implementation soon, which willtry to reduce sick calls for the nurses. Continuing investigation of the results of the paidtime off program and researching ways for continuous improvement would be a goodidea. Other ongoing efforts throughout the hospital to minimize transferring should beinvestigated to see the resulting progress of this effort and for instituting methods ofcontinuous improvement. In some units the redistributing of the charge nurse’s patientload would bring large improvements. Recommendations such as giving the chargenurses a patient assignment of lower acuity patients and not the same patient load as anormal nurse will lead to more available patient care time and increased quality.
Introduction and BackgroundThis report will present information, data, findings and conclusions on how the workloadof University Hospital Charge Nurses is distributed. The distribution of the workload willbe investigated from numerous different perspectives. Also, recommendations and anaction plan will be presented to give the managers of the charge nurses direction andideas for improving the distribution of work among their nurses. These recommendationswill be focused on changing the distribution of workload so that the job satisfaction of thenurses and the quality of patient care in their respective units increase.
Purpose of Project:To discover the average proportion of time that charge nurses spend performing patientcare activities versus charge nurse duties in various nursing units through out theUniversity of Michigan Hospital. To determine if the patient care workload that chargenurses are being assigned is too large to be performed in conjunction with their chargenurse duties/activities. To test the hypothesis that in some units charge nurse duties createtoo much of a time commitment for these nurses to provide quality patient care to theirassigned patient workload.
Background and environment affecting project:This project was formulated through the joint efforts of the University of MichiganHospital (UMH) Nurse Managers and the Program and Operations Analysis Department.Due to limited resources this project was only previously conducted effectively in onepatient care area. The Nurse Managers, in five different patient care areas, have requesteda second attempt at this study because they want to be better informed about how theworkload of charge nurses is distributed. In addition, the managers may feel the chargenurses are either carrying too much of a patient load or are over-burdened by chargenurse duties.
Goals:To give the nurse managers an accurate picture of how much time their charge nursesspend performing charge nurse activities and patient care duties. To investigate if there isenough time in a shift to perform all of these activities with quality performance, whereneither the patient care nor charge nurse activities are neglected. To recommend change
UMH/Prog. And Ops. Analysis 2 C.Scozzafave, M.Withey,K.Pargoff

that will adjust the charge nurse’s workload so that she/he will be able to perform qualitypatient care and complete all charge nurse duties.
Assumptions/Limitations:Our group is assuming that the workload for a nurse is evenly distributed over the entireday. Also, it is assumed that all the nurses in all the areas have the same standarddefinition of charge nurse activities. A limitations of this project is that, even though thedata collection is random and therefore unbiased, the data collected has the possibility ofstill being inaccurate; therefore, the data is assumed to be the best possible approximationof a charge nurse’s workload.
Approach and Methodology
Involved parties:• Our team — Christen Scozzafave, Kim Pargoff, Matt Withey• The Nurse Managers of UMH 5A, SD, 6A, 8C, and Trauma Burn• The Charge Nurses of UMH 5A, 5D, 6A, SC, and Trauma Burn• Liz Othman - Department of Program and Operations Analysis
Project Steps:Below is a listing of the steps used for completion of this project.• Preliminary meeting with nurse managers of each unit to give overview of study and
arrange dates for study.• Distribution of random beepers, survey directions and cards prior to the start date of
collection in each unit.• Contacted Nurse Managers to confirm the start date of the survey and answer any
question that may have arisen.• Observed and spoke to the charge nurses during the collection period while the
survey is being conducted.• Gave interim report to Nurse Managers during study in their unit.• Gave interim report presentation on March 9.• Collected random beepers, survey directions and cards from each unit after the data
collection period.• Contacted the Nurse Managers to get any missing data or re-collect data due to a
collection error.• Conducted a literature search to find information about other similar surveys that
have been performed.• Performed statistical analysis of the data collected.• Marie initial recommendations.• Upon completion of analysis, a meeting was arranged with Nurse Managers to
discuss our findings and possible recommendations.• Performed additional work or analysis as a result of our meeting with the managers.• Organized and prepared our final presentation.• Gave final presentation to our class on April 20 and to Francene Lundy, Liz Othman,
and Nurse Managers on April 23.
UMH/Prog. And Ops. Analysis 3 C.Scozzafave, M.Withey,K.Pargoff

Methodology:Three methodologies were used to collect data in this study. The first and coremethodology used was a self-administered work sampling study using random beepers.This methodology provided objective data required for the study. The secondmethodology used was a survey that was distributed to charge nurses in each unit. Thisinformation provided subjective data necessary for this study. Finally, the lastmethodology used was observation. These methodologies are detailed in the followingparagraphs.
Self-administered work sampling study utilizing random beepers was the coremethodology used in collecting the data. Charge nurses and any other nurse that wasdelegated charge nurse duties carried one random beeper with them for the duration oftheir charge nurse roles. These beepers were carried by the on duty charge nurses for twoconsecutive weeks in their respective units. Due to time constraints, some of the unitscollected data during the same time frame. The random beepers were programmed to“beep” at an average sampling rate of 3.2 times per hour. Since these beeps are randomlydistributed over time it has been proven that any bias that may exist will be greatlyreduced. Nurses carried with them a pocket sized survey card that categorized theactivities that they may have been performing at any given time. When the randombeepers “beeped” the nurses marked on their cards the category that corresponded to theactivity they were performing. In addition, the cards contained an area to list the names ofthe patients that the nurses were assigned at the beginning and ending of their shifts. Alisting of the acuity for all their beginning of shift patients and end of shift patients wasrequired. This information gave a clearer picture of all the activities the charge nurseswere performing and the time commitment to patient care that could be expected. Basicinformation such as name, date, the start and end time of their shift was also requested oneach card. The cards were given out and collected by the nurse managers.
Distribution and completion of a subjective survey to selected charge nurses in each unitwas the second methodology used. It was very important to gain understanding of howthe charge nurses feel they are performing their job. The survey asked the charge nurseto estimate how much time they spend doing charge nurse duties in a shift, what chargenurse duties consume most of that time, how charge nurse duties affect patient care, andgive an opinion on a reasonable patient load per shift, etc. A copy of this survey can befound in Appendix F. This information compared with the beeper study data helpedformulate recommendations in a given unit.
The third methodology used was observation by members of the group conducting thestudy. This information gave the group a first hand view of how the charge nurses spendtheir time in a given unit. When a charge nurse was performing a specific role it wasnoted and the time for completion of the duty was also noted. This information was alsocompared with information from the other methodologies to make recommendations.
UMHIProg. And Ops. Analysis 4 C.Scozzafave, M.Withey,K.Pargoff

Current Situation
The purpose of this project is to investigate how work is distributed between charge nurseduties and patient care duties among charge nurses. The reason for this investigation isthe hypothesis among charge nurses and/or their nurse managers that charge nurses havea difficult time either completing charge nurse duties or providing quality care to theirassigned patients. The nurse managers believe that many of their charge nurses feeloverstressed or overburdened with work in comparison with the other nurses in the unit.In addition, the nurse managers desired to get a better measurement of the workload oftheir charge nurses to make decisions regarding whether not changes in unit management,staffing, or organization need to be made. This project will try to either validate or rejectthe hypotheses that nurse managers about the current situation regarding the workload ofcharge nurses in their units.
Findings and Conclusions
5A
Data from 5A was similar in both the beeper study and the subjective survey. From thesurvey, charge nurses felt that they spent nearly 25%-30% of their time performingcharge nurse duties. All significant data for the charge nurse workload is displayed intables 1-3. The beeper study revealed that charge nurses spent 27% of their timeperforming charge duties in both shifts. The standard deviation was very small indicatingthat time spent on charge duties is consistent on a daily basis. Of the 26 cards from 5Aused in the study, 22 of them showed charge activities ranged between 10% and 40% ofthe shift (See figure on page 5 of Appendix A). This further confirms that charge activityis very consistent in 5A. Patient care activities were also very consistent for both shiftsand averaged about 59%. Personal and professional time however varied some on bothshifts. This is not significant however due to the randomness of the beeper study.
Overall Nursing Activity for 5AMean Percentage of Time Standard Deviation
Charge Activity 27.5% +1-11.3%Patient Care Activity 58.8% +1-15.3%Professional/Personal Activity 13.7% +/-10.6%Table 1: Distribution of Nursing Activities
Day Shift Nursing Activity for 5AMean Percentage of Time Standard Deviation
Charge Activity 27.5% +/-13.2%Patient Care Activity 61.2% +/-17.4%Professional/Personal Activity 11.3% +/-11.1%Table 2: Distribution oTNursing Activities
UMHIProg. And Ops. Analysis 5 C.Scozzafave, M.Withey,K.Pargoff
Night Shift Nursing Activity for 5AMean Percentage of Time Standard Deviation
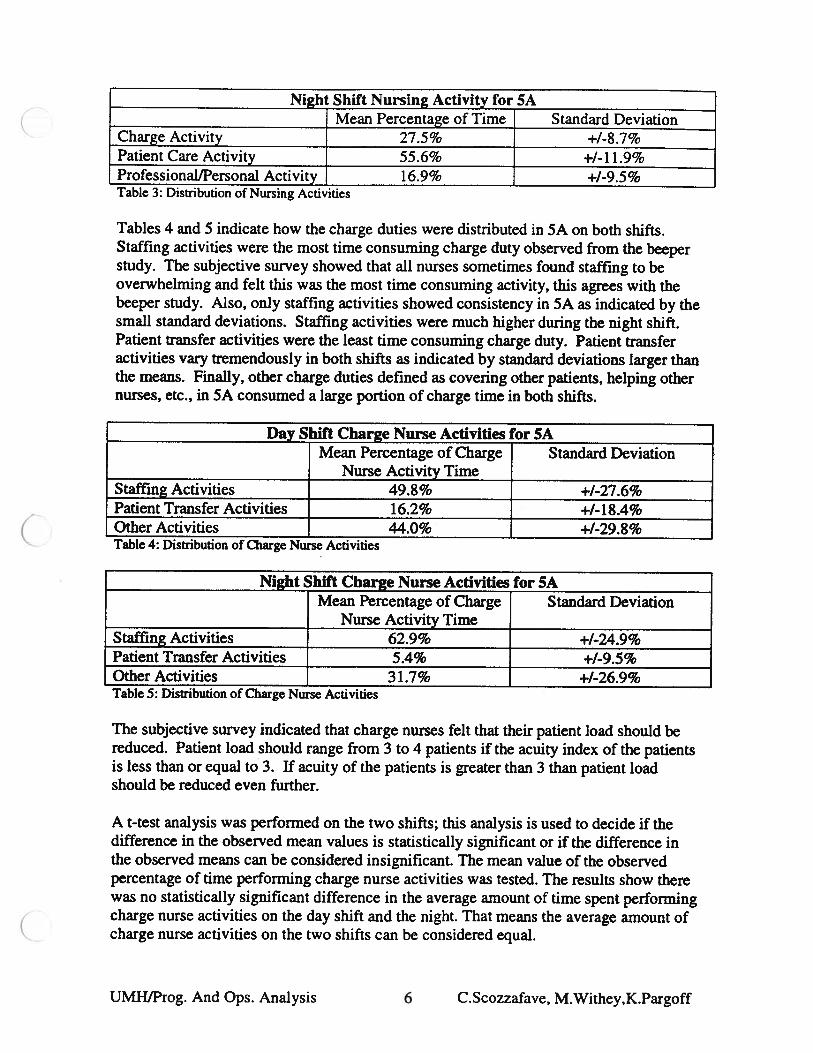
Charge Activity 27.5% +/-8.7%Patient Care Activity 55.6% +1-11.9%ProfessionallPersonal Activity 16.9% +1-9.5%Table 3: Distribution of Nursing Activities
Tables 4 and 5 indicate how the charge duties were distributed in 5A on both shifts.Staffing activities were the most time consuming charge duty observed from the beeperstudy. The subjective survey showed that all nurses sometimes found staffing to beoverwhelming and felt this was the most time consuming activity, this agrees with thebeeper study. Also, only staffing activities showed consistency in 5A as indicated by thesmall standard deviations. Staffing activities were much higher during the night shift.Patient transfer activities were the least time consuming charge duty. Patient transferactivities vary tremendously in both shifts as indicated by standard deviations larger thanthe means. Finally, other charge duties defined as covering other patients, helping othernurses, etc., in SA consumed a large portion of charge time in both shifts.
Day Shift Charge Nurse Activities for SAMean Percentage of Charge Standard Deviation
Nurse Activity TimeStaffing Activities 49.8% +/-27.6%Patient Transfer Activities 16.2% +/-18.4%Other Activities 44.0% +/-29.8%Table 4: Distribution of Charge Nurse Activities
Night Shift Charge Nurse Activities for 5AMean Percentage of Charge Standard Deviation
Nurse_Activity TimeStaffing Activities 62.9% +1-24.9%Patient Transfer Activities 5.4% +1-9.5%Other Activities 3 1.7% +1-26.9%Table 5: Distribution of Charge Nurse Activities
The subjective survey indicated that charge nurses felt that their patient load should bereduced. Patient load should range from 3 to 4 patients if the acuity index of the patientsis less than or equal to 3. If acuity of the patients is greater than 3 than patient loadshould be reduced even further.
A t-test analysis was performed on the two shifts; this analysis is used to decide if thedifference in the observed mean values is statistically significant or if the difference inthe observed means can be considered insignificant. The mean value of the observedpercentage of time performing charge nurse activities was tested. The results show therewas no statistically significant difference in the average amount of time spent performingcharge nurse activities on the day shift and the night. That means the average amount ofcharge nurse activities on the two shifts can be considered equal.
UMHIProg. And Ops. Analysis 6 C.Scozzafave, M.Withey,K.Pargoff
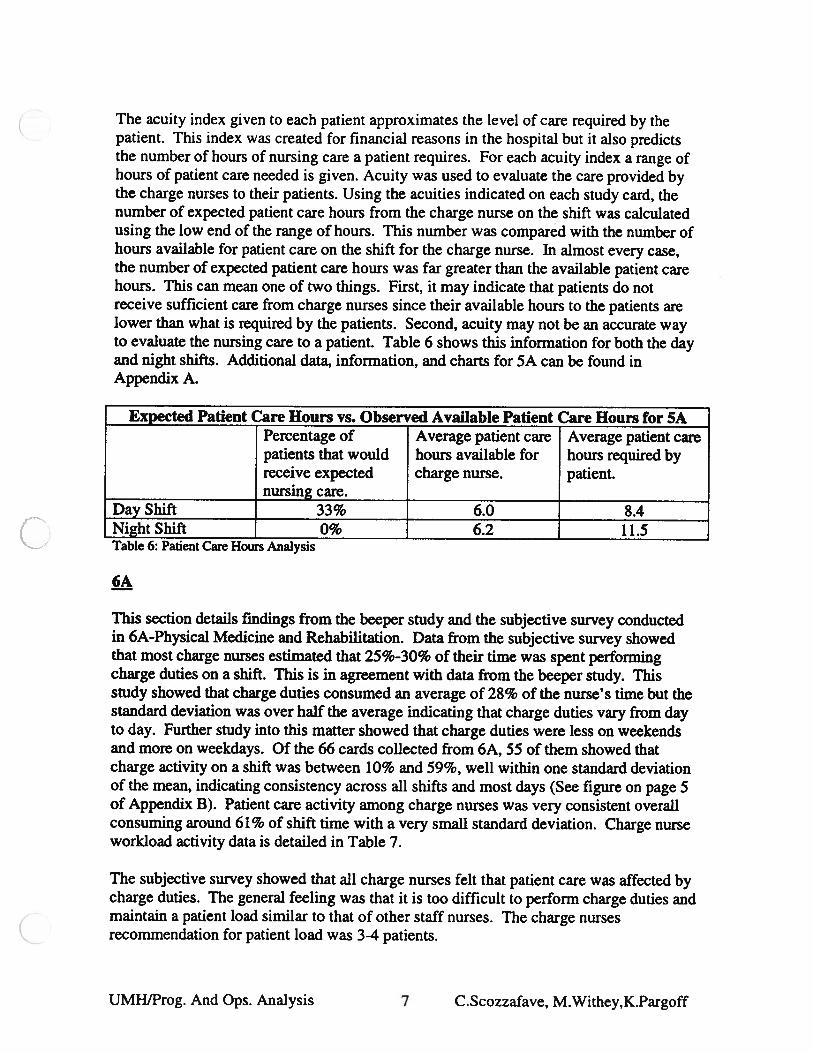
The acuity index given to each patient approximates the level of care required by thepatient. This index was created for financial reasons in the hospital but it also predictsthe number of hours of nursing care a patient requires. For each acuity index a range ofhours of patient care needed is given. Acuity was used to evaluate the care provided bythe charge nurses to their patients. Using the acuities indicated on each study card, thenumber of expected patient care hours from the charge nurse on the shift was calculatedusing the low end of the range of hours. This number was compared with the number ofhours available for patient care on the shift for the charge nurse. In almost every case,the number of expected patient care hours was far greater than the available patient carehours. This can mean one of two things. First, it may indicate that patients do notreceive sufficient care from charge nurses since their available hours to the patients arelower than what is required by the patients. Second, acuity may not be an accurate wayto evaluate the nursing care to a patient. Table 6 shows this information for both the dayand night shifts. Additional data, information, and charts for 5A can be found inAppendix A.
Expected Patient Care Hours vs. Observed Available Patient Care Hours for 5APercentage of Average patient care Average patient carepatients that would hours available for hours required byreceive expected charge nurse. patient.nursing care.
Day Shift 33% 6.0 8.4Night Shift 0% 6.2 1 1.5Table 6: Patient Care Hours Analysis
6A
This section details fmdings from the beeper study and the subjective survey conductedin 6A-Physical Medicine and Rehabilitation. Data from the subjective survey showedthat most charge nurses estimated that 25%-30% of their time was spent performingcharge duties on a shift. This is in agreement with data from the beeper study. Thisstudy showed that charge duties consumed an average of 28% of the nurse’s time but thestandard deviation was over half the average indicating that charge duties vary from dayto day. Further study into this matter showed that charge duties were less on weekendsand more on weekdays. Of the 66 cards collected from 6A, 55 of them showed thatcharge activity on a shift was between 10% and 59%, well within one standard deviationof the mean, indicating consistency across all shifts and most days (See figure on page 5of Appendix B). Patient care activity among charge nurses was very consistent overallconsuming around 61% of shift time with a very small standard deviation. Charge nurseworkload activity data is detailed in Table 7.
The subjective survey showed that all charge nurses felt that patient care was affected bycharge duties. The general feeling was that it is too difficult to perform charge duties andmaintain a patient load similar to that of other staff nurses. The charge nursesrecommendation for patient load was 3-4 patients.
UMHIPr0g. And Ops. Analysis 7 C. Scozzafave, M.Withey,K.Pargoff

Overall Nursing Activity for 5AMean Percentage of Time Standard Deviation
Charge Activity 28.1% +1-16.1%Patient Care Activity 61.2% +1-15.8%Professional/Personal Activity 10.7% +1-10.6%Table 7: Distribution of Nursing Activities
Tables 8-10 detail nursing activities according to shift. Upon reviewing the datasignificant differences and similarities between shifts were found. Charge nurse activitieswere much greater during the day shift than on the evening or night shifts. Patient careactivities were more consistent than charge activities for all shifts as indicated by a smallstandard deviation relative to their means. The night shift and evening shift showed thesmallest variation for all charge activities indicating that activity for these shifts is veryconsistent.
Day Shift Nursing Activity for 5AMean Percentage of Time Standard Deviation
Charge Activity 33.4% +1-21.5%Patient Care Activity 56.9% +1-17.9%ProfessionallPersonal Activity 9.7% +1-9.4%Table 8: Distribution of Nursing Activities
Evening Shift Nursing Activity for 5AMean Percentage of Time Standard Deviation
Charge Activity 27.3% +/-11.8%Patient Care Activity 60.3% +1-16.1%Professional/Personal Activity 12.4% +1-14.5%Table 9: Distribution of Nursing Activities
Night Shift Nursing Activity for 5AMean Percentage of Time Standard Deviation
Charge Activity 23.4% +1-10.9%Patient Care Activity 66.2% +1-12.2%Professional/Personal Activity 10.3% +1-8.4%Table 10: Distribution of Nursing Activities
Determining which charge nurse duties were most and least time consuming was veryimportant. The subjective survey showed that most nurses felt that staffing was the mosttime consuming charge duty along with collecting reports. Tables 11-13 detail chargeduties among all shifts. Only staffing activities had any consistency on all shifts. Datafrom the beeper study showed that staffing activities consume over half the charge dutiesof the charge nurse in all shifts. This is in agreement with findings from the survey.Patient transfer and other charge duties show no consistency for all shifts indicated bystandard deviations much larger than the means. This may be due the randomness andinability to predict these events.
UMHIProg. And Ops. Analysis 8 C.Scozzafave, M.Withey,K.Pargoff

Day Shift Charge Nurse Activities for 6AMean Percentage of Charge Standard Deviation
Nurse_Activity_TimeStaffing Activities 52.1% +1-42.2%
Patient Transfer Activities 18.6% +1-28.7%Other Activities 20.6% +/-29.0%Table 1 1: Distribution of Charge Nurse Activities
Evening Shift Charge Nurse Activities for 6AMean Percentage of Charge Standard Deviation
Nurse_Activity TimeStaffing Activities 58.3% +1-38.7%
Patient Transfer Activities 15.8% +/-29.9%Other Activities 26.0% +/-37.3%Table 12: Distribution of Charge Nurse Activities
Night Shift Charge Nurse Activities for 6AMean Percentage of Charge Standard Deviation
Nurse Activity TimeStaffing Activities 68.1% +/-31 .3%Patient Transfer Activities 14.3% +/-20.8%Other Activities 17.7% +/-29.8%Table 13: Distribution of Charge Nurse Activities
A t-test anaiysis was performed on the three shifts; this analysis is used to decide if thedifference in the observed mean values is statistically significant or if the difference inthe observed means can be considered insignificant. The mean value of the observedpercentage of time performing charge nurse activities was tested. The results show therewas no statistically significant difference in the average amount of time spent performingcharge nurse activities on the day shift, evening shift and night shift. That means theaverage amount of charge nurse activities on the three shifts can be considered equal.
The acuity index given to each patient approximates the level of care required by thepatient. This index was created for financial reasons in the hospital but it also predictsthe number of hours of nursing care a patient requires. For each acuity index a range ofhours of patient care needed is given. Acuity was used to evaluate the care provided bythe charge nurses to their patients. Using the acuities indicated on each study card, thenumber of expected patient care hours from the charge nurse on the shift was calculatedusing the low end of the range of hours. This number was compared with the number ofhours available for patient care on the shift for the charge nurse. In almost every case,the number of expected patient care hours was far greater than the available patient carehours. This is especially true of the night shift. In this shift charge nurses carry morepatients. Also this is when the least patient care is needed and these calculations arebased on the assumption that patient care is evenly distributed over the twenty-four hourday. Also, very few charge nurses on their shifts had enough patient care hours available
UMH/Prog. And Ops. Analysis 9 C.Scozzafave, M.Withey,K.Pargoff

to provide adequate care (as defined by acuity) to their patients. This indicates one oftwo possible explanations for the results. The first being that charge nurses may carry tooheavy of a patient load and are unable to provide sufficient care for the patients whilealso trying to complete charge nurse duties. The second explanation is acuity may not bean accurate way to statistically evaluated patient care. Table 14 shows this data andadditional data, information, and charts for 6A can be found in Appendix B.
Expected Patient Care Hours vs. Obserwed Available Patient Care Hours for 6APercentage of Average patient care Average patient carepatients that would hours available for hours required byreceive expected charge nurse. patient.nursing care.
Day Shift 13% 4.9 8.1Evening Shift 11% 5.6 7.5Night Shift 0% 5.6 12Table 14: Patient Care Hours Analysis
8C
Data collected from the random beeper study was captured in three general categories,charge nurse activities, patient care activities, and professionallpersonal activities. Theaverage percentage of time that each charge nurse spent performing an activity fromthese categories was calculated. Table 15 shows the breakdown of time spent on theseactivities for the 8C unit overall.
Overall Nursing Activity for 8CMean Percentage of Standard Deviation
TimeCharge Nurse Activities 9.9% +1- 12.9%Patient Care Activities 75.5% +1- 17.1%Professional/Personal Activities 14.6% +1- 14.3%Table 15: Distribution of Nursing Activities
When the standard deviation for charge activities and professional/personal activities iscompared to their respective mean percentages of time, it is shown that these two groupsof activities have a very high amount of variability from charge nurse to charge nurse.This represents a general lack of stability in how a charge nurse’s workload is distributed.Since 8C usually has more than one charge nurse per shift this unstable distribution ofwork may be either from nurse to nurse on the same shift or may be from shift to shift.Through informal interviews with several of the charge nurses, it did not seem to be thecase that charge nurses on the same shift often had large differences in the amount oftime they spent on these activities. The nurses suggested that there was cooperation orshared responsibility among the charge nurses to get all the necessary activities done.Therefore, the large variability in these two groups of activities is most likely seen fromshift to shift. Tables 16-18 breakdown by shift of the three general nursing activities thatwere observed.
UMHIProg. And Ops. Analysis 10 C.Scozzafave, M.Withey,K.Pargoff

Day Shift (7am-3pm) Nursing Activity for 8CMean Percentage of Standard Deviation
TimeCharge Nurse Activities 12.6% +1- 10.3%Patient Care Activities 73.7% +1- 14.1%Professional/Personal Activities 13.7% +1- 12.3%Table 16: Distribution of Nursing Activities
Evening Shift (3pm-llpm) Nursing Activity for 8CMean Percentage of Standard Deviation
TimeCharge Nurse Activities 7.6% +1- 17.1%Patient Care Activities 7 1.7% +1- 23.4%Professional/Personal Activities 20.7% +1- 19.7%Table 17: Distribution of Nursing Activities
Night Shift (llpm-7am) Nursing Activity for 8CMean Percentage of Standard Deviation
TimeCharge Nurse Activities 6.9% ÷1- 7.4%Patient Care Activities 83.4% +1- 8.5%Professional/Personal Activities 9.8% +1- 6.5%Table 18: Distribution of Nursing Activities
The amount of time observed performing patient care stayed approximately the same onthe day and evening shift, and it increased slightly on the night shift. The amount of timespent performing professional/personal activities varied on all shifts. The amount of timespent performing charge nurse activities was about the same for the evening and nightshifts, and it increased on the day shift. Relative to the observed means the standarddeviation of charge and professional/personal activities remained significant on all threeshifts which supports the theory that the amount of time spent on these activities often isvery inconsistent. Additionally, a t-test analysis was performed on all the shifts; thisanalysis is used to decide if the difference in the observed mean values is statisticallysignificant or if the difference in the observed means can be considered insignificant. Themean value of the observed percentage of time performing charge nurse activities wastested. The results show that the average amount of time spent performing charge nurseactivities on the day shift and the night are different with statistical significance.
The charge nurse activity portion of the data was analyzed deeper. It was broken downinto three categories, percentage of time spent on staffing activities, percentage of timespent on patient transfer activities, and percentage of time spent on any other chargenurse duties. Table 19 shows the distribution of charge nurse activities as observed in therandom beeper study.
UMHIPr0g. And Ops. Analysis 11 C.Scozzafave, M.Withey,K.Pargoff

Overall Charge Nurse Activities for 8C
Mean Percentage of - Standard DeviationCharge Nurse Activity
TimeStaffing Activities 50.0% +1- 44.8%Patient Transfer Activities 34.7% +1- 44.0%Other Charge Nurse Activities 15.2% +1- 29.4%Table 19: Distribution of Charge Nurse Activities
The majority of the charge nurse activities are related to staffing and patient transfer;however, once again there is a large amount of variability in these means. This continuesto show the inconsistency in the observed workload distribution for nurses. Thisinformation implies that charge nurses do not reliably expect to have a certain percentageof time dedicated to dealing with a specific charge nurse duty. The mean percentage ofcharge nurse activity time does give a decent approximation of how activities aredistributed. The distribution of charge nurse activities on each shift gives an approximatetrend as to how different activities are more expected than others. For example, morepatient transfer activities were observed during the day shift than the evening or nightshifts. Tables 20-22 give the breakdown of charge nurse activities by shift.
Day Shift Charge Nurse Activities for SC
Mean Percentage of Standard DeviationCharge Nurse Activity
TimeStaffing Activities 28.5% +1- 38.8%Patient Transfer Activities 47.0% +1- 46.3%Other Charge Nurse Activities 24.5% +1- 34.1%Table 20: Distribution of Charge Nurse Activities
Evening Shift Charge Nurse Activities for 8CMean Percentage of Standard Deviation
Charge Nurse ActivityTime
Staffing Activities 75.7% -i-I- 39.9%Patient Transfer Activities 15.3% +1- 31.5%Other Charge Nurse Activities 9.1% +1- 30.2%Table 21: Distribution of Charge Nurse Activities
Night Shift Charge Nurse Activities for 8CMean Percentage of Standard Deviation
Charge Nurse ActivityTime
Staffing Activities 67.9% +1- 40.9%Patient Transfer Activities 26.8% +1- 42.1%Other Charge Nurse Activities 5.4% +1- 14.5%Table 22: Distribution of Charge Nurse Activities
UMHJProg. And 0ps. Analysis 12 C. Scozzafave, M.Withey,K.Pargoff

The standard deviation for each type of charge nurse activity is very large. Difficulty incapturing charge nurse activities seemed to be a reason for the large standard deviations.Approximately 64% of the nurses reported several charge nurse activities during a shift;however, there were approximately 36% of data collection cards that reported zerocharge nurse activities observed.
The acuity index given to each patient approximates the level of care required by thepatient. This index was created for financial reasons in the hospital but it also predictsthe number of hours of nursing care a patient requires. For each acuity index a range ofhours of patient care needed is given. To evaluate the care provided by the charge nursesto their patients acuity was used. Using the acuities indicated on each study card, thenumber of patient care hours expected from the charge nurse on the shift was calculatedusing the low end of the range of hours. This number was compared with the number ofhours available for patient care on the shift for the charge nurse. The acuity of patientsranged from type 2 to type 5 in the 8C unit. The beginning of shift acuity of the chargenurse’s patient load was analyzed. The assumption that patient care is evenly distributedover a 24-hour period was made here to help in making the analysis less complicated.Inferences can be made as to how the results could change based on personal knowledgeof what the actual disthbution of patient care is over a 24-hour period. Table 23summarizes the comparison of expected patient care hours per shift and the observednumber of available patient care hours per shift from the random beeper study.
Expected Patient Care Hours vs. Observed Available Patient Care HoursPercentage of Observed Average Calculated Average
Charge Nurses that Number of Number ofcould meet their Available Patient Expected Patient
expected Number of Care Hours Care HoursPatient Care Hours
DayShift 11.8% 6 8.4Evening Shift 12.5% 6 9.6Night Shift 4.8% 7 11.4Table 23: Patient Care Hours Analysis
The above information is approximate, assumes that University of Michigan Hospital’sconversion of patient type to care hours is accurate and that all patient are designated asthe correct type. Given those assumption, the comparison of expected patient care hoursversus observed available patient care hours supports the conclusion supports the claimthat typically the charge nurse’s patient load is too great for them to provide qualityhealth care and perform their charge nurse activities. The majority of charge nurses thatwere interviewed stated the same claim. They felt that an average patient load of threepatients would be ideal for them to provide both quality patient care and be able toreasonably fulfill their charge nurse activities.
Many findings were made in the informal interviews conducted with the charge nurses.Each charge nurse estimated that they spend between 0-2 hours or 2%- 10% of their shift
UMHIProg. And Ops. Analysis 13 C.Scozzafave, M.Withey,K.Pargoff

dealing with charge nurse duties. Staffing, staff conflicts and admissions were given asthe most time consuming charge nurse activities. The charge nurses recommended thatthey should carry a patient load of three, sometimes four if acuity was low. Also, they allfelt that the charge nurse role affects their patient care; however, most seemed to stipulatethat it was noticeably affected most when they were short staffed. It was also stated thatgood organization was important to be able to do both roles. Some nurses felt that thecharge nurse role was complicated by the fact that many of the normal nurses in the unitare either new nurses, traveling nurses or CSR nurses. The charge nurses said that thisforced them to take the hardest patients because the other nurses are not able to handlethem. They stated that turnover has caused this problem to continually persist.From discussions with the charge nurses it seemed that many of them felt overburden oroverstressed when on shift due to the general confusion and instability of their workloads.
AU additional data, information, and charts for 8C can be found in Appendix C.
Trauma Burn
Data collected from the random beeper study was captured in three general categories,charge nurse activities, patient care activities, and professional/personal activities. Theaverage percentage of time that each charge nurse spent performing an activity fromthese categories was calculated. Table 24 shows the breakdown of time spent on theseactivities for the Trauma Burn unit overall.
Overall Nursing Activity for Trauma BurnMean Percentage of Standard Deviation
TimeCharge Nurse Activities 53.2% +1- 16.9%Patient Care Activities 36.2% ÷1- 16.7%Professional/Personal Activities 10.6% -i-I- 6.3%Table 24: Distribution of Nursing Activities
Charge nurses were observed performing patient care for such a small percentage of timein Trauma Burn because they did not normally carry a patient load. Usually the onlypatients that they would take as “their own” would be new admissions into the unit. Inaddition, the majority of the patient care that was observed fell under the category ofrelated to other patients rather than related to patient assignments. This shows that themajority of patient care activities that a charge nurse does are to assist other nurses. Also,due to the nature of the work in the Trauma Burn unit normal nurses sometimes may needto ask for another nurse to cover an assigned patient for a short period of time. Thecovering of patients is normally done by charge nurses and is defined as a charge nurseactivity; furthermore, in Trauma Burn charge nurses have to deal other non-patient careactivities such as road trips. Therefore, the random beeper survey reported a large numberof ‘other’ charge nurse activities, which is the main reason for the amount of charge nurseactivities.
Tables 25 and 26 breakdown by shift of the three general nursing activities that wereobserved.
UMH!Prog. And Ops. Analysis 14 C.Scozzafave, M.Withey,K.Pargoff

Day Shift Nursing Activity for Trauma BurnMean Percentage of Standard Deviation
TimeCharge Nurse Activities 50.7% +1- 15.6%Patient Care Activities 37.6% +1- 13.2%Professional/Personal Activities 11.7% +1- 5.7%Table 25: Distribution of Nursing Activities
Night Shift Nursing Activity for Trauma BurnMean Percentage of Standard Deviation
TimeCharge Nurse Activities 54.4% +1- 18.7%Patient Care Activities 35.2% ÷1- 20.4%Professional/Personal Activities 10.4% +1- 6.6%Table 26: Distribution of Nursing Activities
The amount of time observed in all categories stayed approximately the same on the dayand night shift. Relative to the observed averages the standard deviation of charge andprofessional/personal activities varied slightly more on the night shift than the day shift,which shows that the distribution of work may be more inconsistent from day to day.Additionally, a t-test analysis was performed on the two shifts; this analysis is used todecide if the difference in the observed mean values is statistically significant or if thedifference in the observed means can be considered insignificant. The mean value of theobserved percentage of time performing charge nurse activities was tested. The resultsshow there was no statistically significant difference in the average amount of time spentperforming charge nurse activities on the day shift and the night. That means the averageamount of charge nurse activities on the two shifts can be considered equal.
The charge nurse activity portion of the data was analyzed deeper. It was broken downinto three categories, percentage of time spent on staffing activities, percentage of timespent on patient transfer activities, and percentage of time spent on any other chargenurse duties. As mentioned previously, the other activities categoiy was considered to bean important part of the definition of a charge nurse in Trauma Burn because much timeis spent covering other patients, going on road trips, etc. Table 27 shows the distributionof charge nurse activities as observed in the random beeper study.
Overall Charge Nurse Activities for Trauma BurnMean Percentage of Standard Deviation
Charge Nurse ActivityTime
Staffing Activities 37.7% +1- 13.3%Patient Transfer Activities 13.7% +1- 14.5%Other Charge Nurse Activities 48.6% +1- 18.9%Table 27: Distribution of Charge Nurse Activities
UMHIProg. And Ops. Analysis 15 C.Scozzafave, M.Withey,K.Pargoff

The approximately half of the charge nurse activities are related to staffing and patienttransfer, and the observed workload varied equally at +1- 13%. Therefore, it can beconcluded that a charge nurse spends approximately 25% of their time dealing withstaffing and patient transfer activities (patient transfers include admissions). Thevariability of how workload is distributed into these three categories is moderate, andideally should be lower, possibly below 10%.
The distribution of charge nurse activities on each shift gives an approximate trend as tohow some activities are expected more than others are. For example, more patienttransfer activities were observed during the day shift than the night shift. Tables 28 and29 give the breakdown of charge nurse activities by shift.
Day Shift Charge Nurse Activities for Trauma BurnMean Percentage of Standard Deviation
Charge Nurse ActivityTime
Staffing Activities 39.5% +1- 14.4%Patient Transfer Activities 18.0% +1- 14.9%Other Charge Nurse Activities 42.5% +1- 14.8%Table 28: Distribution of Charge Nurse Activities
Night Shift Charge Nurse Activities for Trauma BurnMean Percentage of Standard Deviation
Charge Nurse ActivityTime
Staffing Activities 35.1% +1- 12.6%Patient Transfer Activities 6.8% ÷1- 7.3%Other Charge Nurse Activities 58.1% +1- 14.4%Table 29: Distribution of Charge Nurse Activities
The acuity index given to each patient approximates the level of care required by thepatient. This index was created for financial reasons in the hospital but it also predictsthe number of hours of nursing care a patient requires. For each acuity index a range ofhours of patient care needed is given. To evaluate the care provided by the charge nursesto their patients acuity was used. Using the acuities indicated on each study card, thenumber of patient care hours expected from the charge nurse on the shift was calculatedusing the low end of the range of hours. This number can be compared with the numberof hours available for patient care on the shift for the charge nurse. The averagepercentage of time performing patient care activities equates to an observed number ofavailable patient care hours per shift, for Trauma Burn the number of available patientcare hours equals just over 4 hours. This means that if the charge nurses in Trauma Burnwere to carry a patient assignment and still perform the same charge duties, they couldonly be assigned either one type 3 patient or two type 2 patients. Inferences can be madeas to how the results could change based on personal knowledge of what the actualdistribution of patient care is over a 24-hour period. The above claim is supported by
UMHIPr0g. And Ops. Analysis 16 C. Scozzafave, M.Withey,K.Pargoff

comments that charge nurses made in informal interviews. They responded that therecommended patient load that they should carry be either zero or one patient to provideboth quality patient care and be able to reasonably fulfill their charge nurse activities.
Several findings were made in the informal interviews conducted with the charge nurses.Each charge nurse estimated that they spend approximately 75% of their shift dealingwith charge nurse duties. This is an overestimate based on our collected data. Therefore,the charge nurses have underestimated the amount of time they have to provide patientcare. Staffing, reporting and helping cover other nurse’s patients were given as the mosttime consuming charge nurse activities. The charge nurses recommended that they shouldcarry a patient load of zero to one.
All additional data, information, and charts for Trauma Burn can be found in AppendixD.
SD
In our investigation of the percentage of time that charge nurses spend on patient care,charge nurses duties and personal and professional activities in the SICU the followingfmdings and conclusions were reached. During a 12 hour shift, on the average the chargenurses spend more than half, approximately 55% or 6.5 hours, of their time on chargenurse activities, either staffing, patient transfers or other. On average, the charge nursesare spending a little less than half of their 12-hour shift on patient care activity,approximately 37% or 4.5 hours. The other 8% or around 1 hour of their time on averageis spent on personal or professional activities. The standard deviations of the abovedivisions are small and show that from day to day these predictions are fairly consistent.Large fluctuations from the above means are unlikely to occur.
Our statistical analysis of the day shift and the night shift independently revealed thatthere is some difference between the percentage of time spent on various activities duringthe day and night shift. The charge nurses on the night shift in comparison with the dayshift spent more time on charge nurse activities and less time on patient care. Whenstudied independently the amount of patient care changed from 40% on day shift to 34%on the night shift. This finding was expected because the patient care workload usuallydecreases during the night shift. Due to this decrease in the patient care load during thenight shift, the nurses have more time to spend on other activities, such as charge nurseactivities that didn’t have priority during the day shift. We found that the priority of thepatient care in the SICU requires patient care to be handled first then charge duties thatare urgent and necessary fill the remaining time. We performed a statistical t- test on thisdifference of the means between the day and night shift and found it to be statisticallyinsignificant. The difference between the means was not large enough to be a concernand will only be covered briefly in the remainder of are report.
When looking at the breakdown of charge nurse activities into the three divisions ofstaffing, patient transfers, and other activities, the most time was spent on the division ofother activities. On average, ‘other’ activities consumed 41% of total charge nurse
UMHIProg. And Ops. Analysis 17 C.Scozzafave, M.Withey,K.Pargoff

activity, staffing 35%, and patient transfers 25%. The standard deviations of eachdivision was small and showed that these above findings are fairly consistent from day today and huge fluctuations of these means don’t normally occur. Analysis of the day andnight shift independently show approximately the same results with insignificantdeviation.
The distribution of overall charge nurse activity was found to have a mean of 55% with adeviation from a normal distribution because of the high number of observations ofcharge nurse activity that were found at the 70%-79% interval. We found that at times inthe SICU the demand of charge nurse activities on the charge nurses can reach a veryhigh level of around 75% of their 12 hour shift. In extreme cases of fluctuation of theamount of charge nurse responsibilities it is much more likely to deviate above the meanof 55% to a high percentage of charge nurse responsibilities, than below the mean to havea lighter percentage of charge nurse responsibilities.
The majority of time that the charge nurses spend on patient care in the SICU is related toother patient assignments and not their own patient assignment. We found that overall58% of patient care time (approximately 4.5 hrs. in a 12 hr shift) was devoted to otherpatients, such as helping with other patients and answering call lights. On the average thecharge nurses only spent 42% of patient care time dealing with their patient assignment.Our study also showed that approximately 75 % of the time a charge nurse had a patientassignment. By analyzing separately only the charge nurses that had a patient assignmentwe still found that they spent 48% of patient care time on other patients and 52% ofpatient care time on their own patient assignment.
Further conclusions were reached about patient care by analyzing the patient assignmentsof the charge nurses using medicus information and the stated acuity of each patient. Theaverage patient in the SICU, approximately 60% of all patients, is acuity 5 and requires 7hours of patient care during a 12-hour shift. Approximately 20% of the patients areacuity 6 patients and require 10 hours of care in a 12-hour period. Twenty percent of thepatients are acuity 4 patients and require S hours of patient care during a 12-hour shift.These calculations were done using the low range medicus numbers, which assume thatthe patient is on the less severe and is less time consuming of a level 5 patient. Evenusing these low range numbers we found that the average charge nurse carrying a level 5patient in the SICU was spending only 4.5 hours on total patient care and their patientassignment requires 10 hours. On the average half of the 4.5 hours on is spent on otherpatients, which is leaving only 2.2 hours for their own patient load. If the medicus acuityinformation is a proper representation of the patient workload then charge nurses areoverloaded and do not have enough time to give quality care to their patients. Theaverage level five patient requires 10 hours of patient care while only 4.5 hours isdevoted to patient care while over half of that time is spent on other patients. Thesefindings are assuming that medicus, acuity information is the appropriate tool to use toanalyze the patient care load in this study. We are also assuming that the patient careload is evenly distributed over a 24 hours period. This assumption is a limitation to ourstudy that we will accept and understand that these are approximate values.
UMH/Prog. And Ops. Analysis 18 C.Scozzafave, M.Withey,K.Pargoff

According to the subjective survey completed by charge nurses in 5D, the time they feelthey spend on charge duties is greater than what the beeper study indicated. The averageresponse was a range of 70%-80%. Most charge nurses felt that staffing was one of themost time consuming activities and this is in agreement with the beeper study. Chargenurses also felt that another time consuming activity was helping other nurses andpatients. This would fall into the ‘other’ category for charge activities. Again, accordingto the beeper study, most of the charge activity time was spent doing ‘other’ activities.The recommended patient load from the charge nurses was 1 patient, or 2 patients at amaximum. However, charge nurses stated to avoid a patient load if possible.
All data, information, and charts for 5D can be found in Appendix E.
Recommendations
General
The following recommendations apply to all units participating in the study.
A written definition of expectations and responsibilities of the charge nurse (specificto each unit) should be made available to all charge nurses.• WHY? — To clarify for the charge nurses the charge nurse activities are most
important to complete, to make the position more organized and standardized, andbecause standardization of work tasks has been found to increase productivity.
• Also, a clear definition of ‘other’ charge duties should be made available to chargenurses. This is especially important since it consumes a large portion of the chargenurse’s time in some units.
• Any means to reduce time spent on dealing with staffing and admissions should beconsidered. This will lead to an increase in possible patient care time, which is value-added time to the patient. Future analysis into changing upstream processes, such asre-engineering the way CSR provides replacement staff to the units or possiblychanging the ways to deal with sick calls. Another suggestion is to decrease staffingwork for charge nurses by instituting program to decrease absenteeism.
• Increase communication between Nurse Managers and the Charge Nurses, possiblythrough monthly meetings to discuss issues.
• UMH is currently working on trying to increase the predictability for admissions tounits and decrease the number of unit to unit transfers. Nurse managers areencouraged to support these efforts because they may decrease charge nurse duties.
• Charge nurses often complained about encountering ‘really bad days’, where theamount of charge nurse duties were unusually high for the unit. It is recommendedthat a contingency plan be created and implemented that shifts some nursingresponsibilities of the charge nurse to other staff in the unit. This leveling of taskswill help to reduce the burden experienced by the charge nurse on these days andpossibly increase the sense of job satisfaction for all staff on the unit.
• Any charge activities that can be transferred to the night shift or to any weekendshifts may be considered.
UMH/Prog. And Ops. Analysis 19 C.Scozzafave, M.Withey,K.Pargoff

Unit Specific Recommendations
6A
After reviewing the data from the beeper study and the subjective surveys the followingrecommendations are being made for 6A-Physical Medicine and Rehabilitation.
• Try to more evenly distribute charge duties among the charge nurse and team leader.This may lead to more patient care hours available for both nurses and may makecharge duties less burdening.
.
SC
• An unstable workload distribution was observed between charge nurses on the sameshift. If assignments can not be adjusted to account for this, it would be worthwhile toconsider assigning the charge nurse duties to one nurse. This would cause a necessaryreduction in the charge nurse’s patient load. It is recommended that the reduction beto 3 patients, which is consistent with the number of patients most charge nurses feltcomfortable carrying.
• Better communication routes need to be established between charge nurses and nursemanager so that management knows when and why charge nurses are havingdifficulty.
• Put limits on the acuity level that charge nurses can carry that is to assign the lessserious patients to charge nurses. Similarly, it may be beneficial if they instead carryfewer high acuity patients.
Trauma Burn and SD
• When possible it is recommended that the charge nurse will not carry a patientassignment. This recommendation was reached because the charge nurses had fouravailable patient care hours based on the beeper study. Therefore, if the charge nurseswere to carry a patient assignment and still perform the same charge duties, theycould only be assigned either one type 3 patient or two type 2 patients. Furthermore,patients with acuities higher than 3 are most common in these areas, and chargenurses typically spend the majority of their patient care duties with other patients.
• The charge nurse spends almost half of its patient care time on other patients andmany times doesn’t have time for both a patient assignment and charge nurseactivities. During the times when the charge nurses activities are at a low the chargenurses can take care of can help with other patients or prepare for a rush
UMHIPr0g. And Ops. Analysis 20 C.Scozzafave, M.Withey,K.Pargoff

Action Plan
Most of our recommendations can be implemented through resources with in the nursingunits. Recommendations that involve changes in the description, responsibilities,expectations, or structure of the charge nurse role should include a charge nurse in theimplementation process. Inclusion of a charge nurse will help validate whether thechanges are beneficial or wasteful. Recommendations that involve changes in processes,especially those upstream or outside of the nursing unit, probably will require assistancefrom other University Of Michigan Hospital resources to implement. For example, therecommendation that addresses decreasing the time it takes for CSR nurses to be obtainedwhen extra staff is needed would be a project that the Program and Operations AnalysisDepartment could possibly pursue. The nurse managers of each respective unit will havethe responsibility of choosing which recommendations would be to implement in theirunit. In some instances, the charge nurses will be responsible for following through onthe implementation and acceptance of these changes in the unit. Most importantlycommunicate with your charge nurse frequently so that feedback received on changesthat have been made and those that still need to be implemented.
UMHIProg. And Ops. Analysis 21 C.Scozzafave, M.Withey,K.Pargoff

Appendix A:
5A Nursing Unit Charts and Data
• Overall Nursing Activity Distribution• Nursing Activity Distribution by Shift• Charge Duty Distribution by Shift (Pie Charts)• Charge Duty Distribution by Shift with Standard Deviation• Frequency Chart of Charge Nurse Activity• T-test Statistics• Raw Data

nn
70%
60% no,
.JU
IO
a) > I- a) U,
.0 040
%I 0 a) 0
)
•3
0%
a) C) a) 0 a) >
2O’/o
ino
,U
/0
no,
V/0
5AN
ursi
ngA
ctiv
ity
byS
hift
OV
ER
AL
LD
AY
SHIF
TN
IGH
TSH
IFT
[.%
Cha
rge%
Pat
ient
Car
eD
%P
rof.
/Per
sona
lj

SA
5A Overall Nursing Activity Distribution
5A Day Shift Nursing Activity Distribution
%Prot/Pers11%
5A Night Shift Nursing Activity Distribution

5A
5A Charge Duty Distribution
% Other33%
% Pt. Trans12%
5A Day Shift Charge Duty Distribution
% Other34%
% Pt.Trans16%
5A Night Shift Charge Duty Distribution

•Mean 49.80% 16.23% 33.97%
DStd. Dev. 27.75% 18.41% 29.76%
5A Night Shift Charge Duty Distribution
80%4
60%
40%
20%
0%
5A Charge Duty Distribution
60% 7150%
40%
30% 420%
10% -
0%
.1 I
% Staff % Pt. Trans
-
%Other
j•Mean 55.36% 11.64% 33.00%
DStd. Dev. 26.62% 15.35% 28.59%
5A Day Shift Charge Duty Distribution
50%/
40%
30%
20%
10%
%Staff % Pt.Trans % Other
z777
A
L% Staff %Pt.Trans % Other
Mean 62.94% 5.39% 31.67%
DStd. Dev. 24.91% 9.54% 26.85%

0 £ 0 0 .0 0 0 4*:
Dis
trib
utio
nof
the
ob
serv
edC
har
ge
Nur
seA
ctiv
ity
(5A
)
Mea
n%
=28%
9 8 7 6 5 4 3 2 1 0
-1
59-5
0%49
-40%
39-3
0%29
-20%
19-1
0%9-
0%
Per
cen
tag
eof
CN
Act
ivit
y
I

5A t-test
t-Test: Two-Sample Assuming Equal Variances
%Charge %ChargeMean 0.275239 0.275509Variance 0.017287 0.007546Observations 15 1 1Pooled Variance 0.013228Hypothesized Mean D 0df 24t Stat -0.005899P(T<=t) one-tail 0.497671t Critical one-tail 1.710882P(T.<=t) two-tail 0.995342t Critical two-tail 2.063898
Since the t Stat is less than the t Critical two-tail, the differences in the MeanPercentaae of Charae Nurse Activity is zero.

024.
PL
I0
30
3I
72
40
2I
I0
•7
I0
I0
I0
4I
12
30
•I
IC
o0
•0
22
70
20
20
•0
20
III
22
•0
16
fl0
03
.I.1
0e.d
TI
330
IIS
Io
344
220
02
t0
I2
212
21
2I
42
II
00
132
03
o24
02
3II
04
134
02
4II
04
o27
01
o32
0I
ot
oI
214
S3
o32
03
I34
I2
o0
0I
o10
0o
120
o17
02
313
I1
70
2ii
0
13
70
24
0011
%2400.11I3
1N
(03
024
31%
242e
%30
13%
430
4.01
1.22
2100
%(2
10%
1210
%2.
3371
13.
3430
1.1%
4000
%31
.42%
2.42
43
33.
11IS
3S%
7012
%11
.0%
3.24
022
031
3000
%34
.78%
30.3
3%2.
334.
174.7
0
3430
%40
12%
3000
%41
050
12.
3230
00%
2303
%24
12%
424
1.31
223
11.1
1%30
14%
000%
000
422
07
011
.73%
7006
%37
11%
01
22.
110.
1010
24%
(018
%31
0%30
030
240.
0323
12%
3000
%11
10%
2.70
434
1.06
2422
%33
23%
4.12
%4
22
700
304
3612
%30
30%
2422
%2.
337.
432.
7031
,70%
7103
%13
.30%
11.1
1.31
3.44
30.1
2%0(
12%
4.31
%41
070
70.
640.
00%
1113
%0.
00%
0.43
3.33
043
3333
%44
,44%
2332
%4.
1711
12.
1825
00%
(000
%35
00%
2.12
5*0
1.21
20.1
7%0(
23%
3210
%2.
6673
1II
I21
17%
6428
%7.
14%
2.42
544
0.03
1710
%62
10%
003%
2.1*
121
03
111
11%
4342
%00
0%21
.371
70
70
18.3
3%13
12%
2530
%2.
110.
102.
34420%
03.7
0%72
0%54
33
30
001
43,3
1%(3
10%
0.00
%2.
2442
10
70
2400
%60
31%
8.00
%2
30
71.0
03
1
3714
%30
.70%
1311
%23
04.
0411
011
27%
1131
%10
12%
1.34
200
1.27
2411
%0(
1.0%
1141
%2.
144.
133.
14
-.
a.,
——
na
—13
1030
010
033
3400
3020
321
1337
1377
037
1303
1030
321
11
710
1112
74
130
3233
1713
11
%*1
43.,
730
324
1103
3077
033
.033
,33
7032
3330
1331
%11
0333
730
324
3311
331
700
1143
3,11
2053
3311
%35
7033
.03.
,30
124.
033
1033
33
1%
I•,
2330
4.0
3333
1071
225U
31
%32
113
2510
2470
2443
3,71
036
1330
3311
242I4
33
730
321
2111
700
2343
.,30
2412
.013
2313
10)
2243
3,30
3032
133
24)3
131
%23
433,
130
124
1323
.30
*003
31%
43
1323
130
31%
23.1
333
730
*21
3323
131
703
2341
3311
%L
I124
11
1103
24
,13
021
1324
0031
7024
43.,
1224
56
1324
4310
02
4,
31%
14
13010
1%23
-533
,*0
2011
433
3010
71%
30.0
3.,
130
3313
2000
700
2444
.,30
2432
103
7111
.27460
31%
022703
1012
27
41
.,73
032
.1%
%I_
%T
a03ag.P
L33.
—
O24
,00%
30.4
3%24
,41%
13II
200
00%
1117
%24
33%
I34
170
00%
1000
%10
,00%
3034
O30
0.70
%00
3%00
0%4
373
5333
%16
17%
(000
%4
710
000%
004%
(013
%II
100
43.1
1%03
246%
070%
334
030
0.00
%00
3%00
0%I
7I
5000
%00
0%10
00%
230
232
.33%
003%
4017
%2
242
11,3
4%10
20%
2417
%7
I1
0210
%30
00%
3310
%0
332
30.0
3%00
0%40
00%
012
025
33%
417%
070%
I21
416
.04%
0,70
%44
,44%
012
I00
0%07
0%10
0.00
%I
433
11%
070%
30.2
3%32
14I
4000
%40
04%
3000
%1
120
300.
70%
070%
000%
7II
010
.00%
070%
1004
%4
413
122%
070%
3017
%I
10o
170.
00%
000%
0(0
%I
132
0000
%00
0%10
00%
437
211
.11%
07,7
1%11
.11%
II17
224
22%
2333
%24
33%
II
273
.43%
0,70
%20
27%
714
1631
%13
1.4%
2500
%30
12%
1020
%30
40%
23 24 24 a 12 33 a 31 a 24 24 27 23 23 Il 30 33 34 14 II I. 33 41 ‘3 21
U-.
31L
Ow
.
0 0 2 2 0 2
P.O
.’

1%o_
.
•a7
%1R
0.
770
00%
2300
%70
00%
7014
070
0.00
%0.
00%
006%
477
ID0.
06%
0.08
%00
17%
II70
I10
00%
006%
0000
%2
ID2
17.7
0%74
.26%
2017
%7
6I
62.0
0%26
00%
7310
%6
24
1141
%00
8%44
.44%
012
444
47%
010%
1032
%2
740
4000
0%00
0%00
0%1
732
0000
%00
6%1
06
77O
77.4
3%02
1%20
.17%
174
10.0
4%6.
21%
2717
%84
17%
0.14
%40
06%
010..
46
10
611.l44p
00610
8080
67%
4000
%37
.42%
141
4.00
0.77
2610
36%
76.0
2%71
6%1.
0062
20.
0617
3434
%40
13%
2100
%43
06.
003.
7317
77.7
6%70
.03%
7710
%0
08
III
07
022
3712
%00
00%
70.7
4%2
30
4.84
1.14
0463
33%
1133
%0.
22%
44
210
07(
1710
16.7
3%00
.02%
4.31
%41
07.
070,
0421
38.2
1%44
.44%
0022
%4.
111.
112.
1024
20.1
7%66
13%
7011
%8.
4071
67.
1401
1010
%1(
12%
2030
%0.
761.
7631
421
3130
%64
00%
1.10
%32
01
000
0021
14%
10.1
7%44
10%
1.76
0.74
711
Ow
.61
0%77
10%
0.46
%71
073
273
11%
80.7
1%04
12%
7116
%34
36.
76II
I
0..
——
——
——
_at
—.,
—0.
7010
108
1770
7477
%72
60.
4711
070
0(1
41.,
1630
22.1
0.71
.16
700
1044
.177
%13
0.70
710
7000
1041
..77
%44
1111
.16
720
7074
0.1
7130
00
31
07
470
830
40..
17%
72.1
32
72
07%
3741
..70
2373
.13
23
60
100
2241
076
3072
61
70
616
4010
46..
7023
41
17fl
4610
223.
(130
01
0.34
6610
034
46..
7130
0.0
0.74
6670
0034
41w
2323
II
31
01
07%
10-1
0.,
77%
171
3207
1070
820
41..
7620
721
32120
7%27
41.,
7010
I
I06
11
07
0C
.61dP
46
710
6.
66
46
1.1
61.4
66
l00
lI.0
0N
70
01(2
0..
027
04
2134
37%
6620
%70
13%
430
0.07
7.32
16I
221
00%
4240
%23
314
4
0%
70
14
%2
011070*Ip
11
2304
%76
.40%
20.4
4%42
III
200
00%
7017
%23
.31%
414
21
133
33%
7417
%00
00%
I7
70
070
006%
008%
006%
I7
•7
046
.71%
0110
%00
6%18
47
02
2332
%00
6%10
17%
384
80
240
00%
000%
4010
%6
720
I0
0222
%01
7%04
0%4
270
01
000%
000%
1000
0%4
I2
21
*0
0%
4030
%76
00%
073
20
463
33%
0.00
%44
17%
470
00
200
00%
010%
6000
%4
•0
070
0.00
%00
0%01
0%I
72II
02
07.7
7%21
.10%
11.1
1%0
773
23
2022
%10
.23%
2321
%4
4
4400
%74
.20%
3017
%27
.71%
7647
%20
.76%
00.
6%06..
——
——
—7
——
a0.
1711
077
%l7
.0J
71
042
1747
704
1100
4720,
770
721
0.71
.60
17
%16
44.1
730
721
1740
764
IOC
O70
40..
2331
41
33010
2240
2341
.,71
00.
13
10
60
1110
2140
..13
073
3364
77%
2341
071
042
60.
1020
77%
1041
011
072
00.
1410
77%
2420.
123
73.1
33010
7630
2040
..17
0II
3771
1676
23Z
7-
730
(2
1.04
1072
%21
34.
714.
1002
2%0
10
410
000
2062
%41
07.
0023
00.
00%
7.20
7034
0.00
2332
%2.
371.
4721
612
.76%
731
0.44
714
1.00
%04
71.
110.4
%10
06%
2.72
6.70
430
010%
2.70
0.34
000
7.74
%2.
421.
400.4
%03
2%30
27.
010
00
732%
042
0.70
067
006%
2.46
4.17
000
7731
%2.
706.
64(3
211
.10%
7.47
234
7.26
636%
2.72
040
061
2440
10%
I6
42
3830
06%
34.7
0%I
I0
0I
11.1
7%04
14%
26
42
2000
00%
1000
%0
300
276
7024
%40
76%
474
06
2701
3%04
26%
037
06
3170
.10%
7706
%0
60
III
611%
0110
%0
II0
230
8000
%62
.00%
040
00
7427
10%
6240
%0
60
774
10.0
7%64
.20%
0II
00
7627
10%
0442
%2
107
247
4310
%41
.71%
I7
00
1344
.71%
61.6
4%
N.
27.0
2%47
.71%
6%
00
073
71%
17.2
0%2
01
0.
7606
%08
10%
710
074
47
110
03
273
26
272
02
2II
04
774
02
072
0I
OII
63
I74
II
041
02
276
02
1LT
Os..
72
40
I0
I0
4I
12
00
•0
70
30
10

Appendix B:
6A Nursing Unit Charts and Data
• Overall Nursing Activity Distribution• Nursing Activity Distribution by Shift• Charge Duty Distribution by Shift (Pie Charts)• Charge Duty Distribution by Shift with Standard Deviation• Frequency Chart of Charge Nurse Activity• T-test Statistics• Raw Data

C
6AN
ursi
ngA
ctiv
ity
byS
hift
70%
60%
£znoI
V a) a) U) 040
%I 0 a)
30%
20%
no
.L
‘0
no’
V/0
I I—...
.
OV
ER
AL
L
IE
VE
NIN
GSH
IFT
DA
YSH
IFT
NIG
HT
SHIF
T

n
6AC
har
ge
Act
ivit
yD
istr
ibut
ion
6AN
ight
Shi
ft-C
harg
eA
ctiv
ityD
istr
ibut
ion
6AD
ayS
hift
-Cha
rge
Act
ivit
yD
istr
ibut
ion
%P
oV
Per
10%
%P,
OI/
Pe,$
10%
Pag
eI

6AC
har
ge
Dut
yD
istr
ibut
ion
6AE
veni
ngS
hift
Char
ge
Dut
yD
istr
ibut
ion
6AD
ayS
hift
Ch
arg
eD
uty
Dis
trib
uti
on
6AN
ight
Shif
tC
har
ge
Dut
yD
istr
ibut
ion
J
%O
ther
%O
ther 2z
J
Page
I

n
6AC
harg
eD
uty
Dis
trib
utio
n
6AN
ight
Shi
ftC
harg
eD
uty
Dis
trib
utio
n
70%
-
60%
——
—----
50%
/
40%
—ii
—•
30%
—--
—iI
1
flO
%S
taff
%P
t.T
ram
s%
Oth
er
68.0
7%14
.28%
17.6
6%
31.2
7%20
.78%
29.7
8%
6AD
ayS
hift
Cha
rge
Dut
yD
istr
ibut
ion
6AE
veni
ngS
hift
Cha
rge
Dut
yD
istr
ibut
ion
IUMea
n
DS
td.
Dev
.

25 20
(0 C 0 4- 4, (0 0 0 41
0 5 0
Dis
trib
utio
nof
the
obse
rved
Char
ge
Nur
seA
ctiv
ity
(6A
)
Mea
n%
=27%
79-7
0%69
-60%
59-5
0%49
-40%
39-3
0%29
-20%
19-1
0%9-
0%
Per
centa
ge
ofC
NA
ctiv
ity

6A t-test
t-Test: Two-Sample Assuming Equal Variances
%Charge %ChargeMean 0.313108 0.234805Variance 0.049576 0.011851Observations 23 23Pooled Variance 0.030713Hypothesized Mean Difference 0df 44tStat 1.515163P(T<=t) one-tail 0.068441t Critical one-tail 1.68023P(T<=t) two-tail 0.136883t Critical two-tail 2.015367
Since the t Stat is less than the t Critical two-tail, the differences in the MeanPercentage of Charge Nurse Activity is zero.

;
•
I
I
1
;iE;i;iii;
i;
“
D

iiiniiiiunnIIIIIIII’I IIIII’IIIIu’IlihIIIIIIIII
nuiiniiinulllllll?IIII’IIIIflhIsIIIIIIIII
nngggggsgg.ggngggggg
p1 eeeee.eeee.eteee.eeen
.I
.....—...—.—.e.——..ea.—
IIiiiiid;;d;ninln;i;’IIftiiiiiftuiiiiiiiIiiiii 1
•eeeeeeSqweeeIe.nie..eeI
ssa.ns..ssnae.sa.s.eI
—e.eefla.eeeess..ae.e.•
I *lS.SSUSISflSSSfl.fl4.S
eee.ne..eeeeeeeeeeeee.
.eeeeeee•.a•ea.e.—eee—eI
•ssstpmmisnznnniies
IIIIiiI5IIIIIII5IIiIiIiIUEHIIIIIEEUIIIUIEEEIEns;s’s;;s’n’;ss’sssa’
iIIIIIiIISSIIiüIEIIIflI
isiiiriiiiiiiliili“IIII1IIIIIflhIlII
‘uhi,fluhIniuhI
g.gg.ggggggg.jn)
p1 Sbflefle.e.Sefleee
I
iiindioi;;iiii;’15IihuIiuuuiiiII 111
ee.eeee....a.i.SaeotI
•B$eeee$ece$e.e$$eee
•e—ee•eeeeeee—•n—
•eeeeeeeeee
I •eeeeeeeeeee—eeeeeI
SIZSGe.*SSISflflhS
i;n;;n;isniini t
iiiiiiiiuiiiiiiiil
IIIIIIIflhIIIIIflhIIuhI
flhhIIIEIliuiiiHhiil?
ggg.ggggkg.sgg’gg.:ggIlp1 •..w..eseeeS$.eee.e.na.
•eeee—e•e—eeee.nee•eeeI
•.eneees•eeeeeeens
11dhIiIiIiiIIIIflhIIIIIi 1isissnsiiuiiusliiliu; 111
•e.nee..SeS,s...eee...tBuJ
IS.ISSt.SeIeZSee.w.eae
•eeeeeeeeeeee.eaeeeeeee
SS.eSSSZtZSeSSs.etqeees
•.ee—eeeaeee.•.ee..e—e.
I seee—eeeeeeeeeee
rrsBsaIBsnBs.s.sassm.ss
Iii;11i1111111H10111d11 1inn;nn;i;iiini;iiiii; 1IIIIIiiiiiiIflhiiiiiuIIuIinnsnnnun;an;snsJ
(ESSESStSiSIISiSiiliESiflS’
Is;;;usnsnnsnsn;as;’
‘PIn111Iii“5
151
UI
‘pInillinin
151
155
SD
D

Appendix C:
8C Nursing Unit Charts and Data
• Overall Nursing Activity Distribution• Nursing Activity Distribution by Shift• Charge Duty Distribution by Shift (Pie Charts)• Charge Duty Distribution by Shift with Standard Deviation• Frequency Chart of Charge Nurse Activity• Bar Chart comparison of data cards with zero recorded charge activities versus data
cards with at least one recorded charge activity• T-test Statistics• Raw Data

nn
8CN
ursi
ngA
ctiv
ity
byS
hift
90%
80%
70%
60
%
4O
%C a) 0 I
20%
10%
no’
I_I
/0
OV
ERA
LLD
AY
SHIF
TEV
ENIN
GSH
IFT
NIG
HT
SHIF
T
rn%
Cha
rge
%P
atie
ntC
are
C%
Prof
./Per
sona
l

n 525
2%
55
55%
50%
%c.w
9.
n
SCN
ursi
ngA
ctiv
ityD
istr
ibut
ion
-11.1
I,L
%c*w
9.%
P.d
%PI
OLJ
PSII
SCS
y.nt
ngS
hill
Nur
sing
Act
ivit
yD
istr
ibut
ion
1217
%.
10% 0%
IN..,
Vu5
o.IS
insd
D.v
.
%C
Iw9.
SCD
ayS
hin
Nu
rsin
gA
ctiv
ity
DI.
trib
uti
cn
us.
SM
..,
Vul
va.
lS1und.
Duo
5413
%
C
%P,
oLP.
o.
ICN
ight
Shi
ftN
ursi
ngA
ctiv
ity
Dts
t,lb
utl
un
%P
lli.
flt
1°—
’77
.
.75,.
I

.Cch..
Diy
Dfl1
aIC
Ew
nkig
simm
Ctw
g.
Dut
yD
4str
IuU
o,.
ICD
aySh
IflC
hug.
Dut
yD
dbutI
o.
ICN
iØit
Shif
tC
hug.
Dut
yD
istr
ibut
ion

n
V
__
V I..
67
40
%7679%
4O
S%
j
SCC
har
g.
Dut
yD
iStr
ibut
ion
SCE
v.n
lng
Shi
ftC
h.r
g,
Dut
yD
i.ib
utio
n
Ez
56%
40%
30%
20%
f0% 0%
SCD
ayS
hift
Char
g.
Dul
yD
istr
ibut
ion
--
94
0’
3015%
j
SCM
ight
Shi
ftC
harg
aM
um.
Dul
yD
iatr
ibul
ion
70%
80%
56%
40%
30%
20% 0%
Iosto
Duo
%C
%..
536
%
447%

n
Dis
trib
utio
nof
the
obse
rved
Cha
rge
Nur
seA
ctiv
ity(8
C)
Mea
n%
=10
%
60
53
50 40
0
30.0 0 0 *
20 10 0
21
11
12
4
7
I79
-70%
69-6
0%59
-50%
49-4
0%39
-30%
Per
centa
ge
ofC
NA
ctiv
ity
29-2
0%19
-10%
9-0%

40%
10%
C
NoneO
bserved
lOne
orM
ore
Obs
erve
dj
90%
80%
Cha
rge
Nur
seD
utie
s:U
nobs
erve
dvs
.O
bser
ved
70%
60%
50%
)‘J
,Q
20% no,
‘J/0
OV
ER
AL
LD
AY
SHIF
TE
VE
NIN
GSH
IFT
NIG
HT
SHIF
T

8C t-test
Day Shift v. Night Shiftt-Test: Two-Sample Assuming Unequal Variances
%Charge %ChargeMean 0.126384 0.068623Variance 0.010623 0.005517Observations 34 23Hypothesized Mean 0df 55t Stat 2.457775P(T<=t) one-tail 0.00858t Critical one-tail 1.673034P(T<=t) two-tail 0.01 716t Critical two-tail 2.004044
Day Shift v. Evening Shiftt-Test: Two-Sample Assuming Unequal Variances
Reject the hypothesis
The means do not equal each other statistically
%Charge %ChargeMean 0.126384 0.075968Variance 0.010623 0.029265Observations 34 26Hypothesized Mean 0df 39t Stat 1.329479P(T<=t) one-tail 0.095707t Critical one-tail 1.684875P(T<=t) two-tail 0.191415t Critical two-tail 2.022689
Since the t Stat is less than the t Critical two-tail, the differences in the MeanPercentage of Charge Nurse Activity is zero.
Evening Shift v. Night Shiftt-Test: Two-Sample Assuming Unequal Variances
%Charge %ChargeMean 0.068623 0.075968Variance 0.005517 0.029265Observations 23 26Hypothesized Mean 0df 35t Stat -0.198776P(T<=t) one-tail 0.421 794t Critical one-tail 1.689573P(T<=t) two-tail 0.843588t Critical two-tail 2.0301 1
[ice the t Stat is less than the t Critical two-tail, the differences in the MeanIfercentage of Charge Nurse Activity is zero.

nC
n00
40It
s)
Too.
4.0
Sod
TIm
e0
,4*
04
942034
Pt
T,.o
.7.o
044w7014107o,r
%0)
4703
99
P7T
,.o.0
09
06i
Pt
0..Ig
n00,0
270
401
PL
C.,
.9
Pt
AoM
go909740
P,.te
t.lo
o.I
P943947
74)4
4%
00.t
go
%P
.4071%
PI4
LP
.,I
7000
034,9
400
77P1
7409
QP
,o,
50420”s
504
Ooo
O,
37
59
407
097
3134
7507
75
07
03
4779
70’
47(2
70’
.079
70!
724
737
00
0%
40%
00
750
90
%2507%
7017%
000
050
700
0332
0002
30
34
03
1710
9470
207
07
00
o77_n
70%
42
3%
702
790
00
0%
0.0%
20
270000%
04200.
741%
230
444
030
3332
333
37034
000
97094
520
75
00
II
00
%00%
700.
0%7
07
70
00
%07%
07
51
)11
%7779%
1711%
061
593
003
2322
2322
031019
7500
4/7
084
2173
94
57
43
77
00
7%
00%
07%
747
75533%
07%
2I
70029%
7105%
070%
040
45
7170
2023
303
2037599
7553
37039
23
(075
I4
0I
000
%00%
00%
724
II70_n
000%
4S
22435%
747T
h0370%
004
545
170
2332
3243032
17034
7000
57330
4000
75
00
00
9077
077’
9079
77’
9759
0074
I75
04
7%
03%
40
740
20
%70000%
07
0%
030
700
007
0231
137080
20
70
52394
730
00
17
00
73_n
20
7%
07%
701
770
97
%57%
27
247007%
7793%
7707%
I44
002
170
4212
4212
0432
57094
2170
30539
730
40
00
00
97
77
0!
9030
74’
9030
70!
740
797
00
0%
00%
27
240
00
%0900%
7104%
000
74
0770
00
10
037090
9370
33099
737
45
07
77
00%
7377
%72%
427
200
09
%44%
47
221
07
%00
71%
7077
%030
740
007
2324
143
3307
9471
050039
7020
70
00
00
9079
77!
9730
70’
907(
777
700
7070
00%
00%
07
704
00
%0170%
02
0%
00
07
71
00
732
332
1222
233390
710
1743
9470
379
40
04
7000
%50%
70%
740
7070
00%
00%
02
4570
00%
7000
%0
20
%70
9000
002
3224
202
253394
7510
13394
2130
90
00
040
7000
0070
70’
9070
70!
230
2370
00%
00%
07
240
00
%45
13%
47
7%
000
70
7033
2023
2320
220
300/
0070
3000094
2007
47
00
770
00%
00%
0.0%
00
070
0.0%
00%
0I
7070
00%
0000
%70
00%
090
420
040
2032
0333394
2370
52789
730
45
07
07
00%
700.
2%00%
727
7270
00%
00%
22
730
07
%20
00%
7431
%007
000
III
2003
2243
2022
13394
7103
32
7.9
473
005
70
0I
7044
%00%
00%
720
7200
0013
00%
0I
747
74
%0
57
7%
77
0%
007
739
55
710
0000
30394
2000
32794
330
40
40
090
01/0
’20
0170
’20
7020
!0
09
700.
0%00%
02
720
00%
7000
%23
00%
0(0
300
720
2403
2312780
745
33794
7330
770
20
73
007%
70%
303%
707
775
04
%07%
20
7777
00%
0477
%77
03%
737
007
737
2022
0022
2330799
740
33784
020
775
00
00
9070
0090
7070
’20
2370
474
074
40
04
%00%
02
II0
00
%0
75
0%
7200%
000
070
037
(022
2022
30739
700
3332
0470
339
57
00
77
00
0%
03%
00%
702
720
33
%70
7%2
377
000%
7055%
2353%
000
400
220
2222
772
7233130
700
50789
13(0
00
20
207%
70
77
%00%
4I
020
.0%
203%
0I
53
00
0%
04
00
%7450%
75
0270
375
7332
333799
7007
50189
2107
40
00
090
1370
’I7’
9(00
70’
47
7007%
43%
04
700
(0%
4007%
0030%
000
373
927
(323
2122
30739
2000
5’22
0473
045
00
00
4072
74’
4077
0!90
7070
’70
3II
233%
707%
47
000
20
%9
00
7%
7000
%300
705
020
4033
33799
2003
30
70
473
095
03
03
00%
4000
%00%
770
777
00
0%
00%
02
321
04
%77
27%
30
0%
770
007
37
723
222
2072
2233539
730
00
73
075
3295
03
03
00%
73
00
%0.
0%7
29
770%
22
2%
02
‘42
14
3%
54
20
%7420%
742
500
727
2320
400790
740
30794
7370
70
07
0I
00%
7000
%00%
770
3770
00%
00%
70
‘002
0%0
34
7%
520%
030
07
7033
3332
3332
37
3/9
070
032
4/04
7030
90
00
00
9030
70’
9030
70!
9077
0’70
074
00
0%
00%
02
II0
00
%0
45
4%
1111%
030
70
4004
2121
322
4/4
43
953
013234
4300
75
I0
44
7003
%74%
03%
07
700
00
%13
0%0
770
00
0%
50
54
%3
29
4%
342
477
23
243
323
03
32
90
2300
51180
7,0
92
02
20
4700%
50
0%
0.0%
730
1170
00%
00%
0I
122
02
3%
7222
%0
04
%793
000
044
3220
033399
733
13
3.9
470
075
07
23
00%
00%
00
0%
100
7073
00%
0.0%
32
2070
0%71
04%
‘32
3%
002
565
754
3423
1423
33
39
490
717
3309
7330
75
27
50
9010
8’90
498’
9043
070
09
70
00
%00%
0I
740
00
%5000%
7300%
000
070
070
2322
204
13
39
475
3037184
2120
I0
00
020
7770
190
7000
’40
790’
214
2170
0010
.00%
04
210
00
%10
000%
00
0%
000
970
000
3332
133
324
43
13
921
03530.9
073
000
07
03
9070
70’
2772
(090
7220
737
14034%
7.1%
00
190
(0%
7300%
25
12
%020
020
22
443052
4042
321
33
90
2100
50
0,9
071
04
45
I0
0I
7300
%44%
07%
792
II0
46
%77
.7%
75
22400%
SlO
t.7104%
032
070
II)
2440
.22
34
39
770
33
4.3
970
3705
03
03
00%
70
00
%04%
0I
09
34
%7
07
%2
772
20
00
%3
00
0%
25
00
%273
42
52
14
2222
223
53
4.9
477
05
04
.99
7345
00
20
00
7000
%00%
00%
774
7710
00%
00%
07
747020%
7007’.
71
0’.
727
464
007
302
435
04
.39
7300
1/00
.99
40
90
I0
00
090
7507
9070
701
9072
7025
025
70
00
%00%
03
200
00
%0
02
9%
7077%
000
77
0490
2134
233034
1503
50
08
023
709
I0
0I
70
00
%00%
00%
140
747
00
0%
00%
42
214
40
%0
09
7%
3474
%030
447
279
324
044
33494
2053
30
5.3
473
090
I7
07
7000
%00%
00%
770
7770
0.0%
00%
07
II0
29
%0441%
540%
040
707
005
7333
443399
700
33594
7530
65
07
0I
00%
100.
0%00%
00
010
00%
00%
02
07777%
00
07
%2222%
094
907
700
2241
3324
13599
700
13
33
977
30705
I0
72
000%
00%
00
0%
200
2070
00%
00%
0I
247
74
%9029’.
35
7%
075
544
030
2021
420
33399
770
33584
7530
440
0I
23
00%
333%
09
7%
740
7473
0.0%
00%
00
2174
05%
4077
%0
00
%II
I70
7030
321.
4340
13094
730
130,9
270
304
0I
0I
00%
70
00
%00%
740
727
00
0%
00%
0I
747
04
%1571%
71
4%
057
040
057
2222
2222
51
33
94
7530
50330
2337
40
03
040
700!
9070
70’
9070
0!0
270
00.0
%200%
4I
120
00
%7103%
2057
%000
577
421
5410
5337
30034
7520
50
39
991
3095
00
00
4013
70!
9075
70’
0070
10’
730
7070
00%
00%
23
10000%
7055%
27
05
%000
07
7774
33
34
404
322
33
67
39
2107
33
78
473
095
00
00
90
73
8’
9072
70’
90
72
0’
211
2295
.0%
20%
04
450
00
%0400%
20
0%
030
74
472
3442
3502
9205
335.
9437
3071
3074
07
70
0I
70
03
%00%
00%
720
7070
0.0%
00%
0I
747
74
%00
77%
71
4%
400
620
050
3303
3353
0333
13794
700
33790
7570
IS0
70
I04%
43
00
%00%
25
744
0%714%
02
707000%
7030%
20
00
%005
640
770
3332
341
33799
775
3377
5473
539
25
02
02
04%
70
04
%00%
‘30
427
00
0%
00%
00
IS‘4
13
%9
00
7%
00
0%
77
0775
000
23
03
4)4
03
37
78
970
5330790
4030
I0
00
090
1570
’90
9274
!40
4907
00
9I0
00
%00%
74
740
(0%
00
00
%7
00
0%
000
500
400
5313
533
13
78
070
3033794
2337
90
00
020
7977
’97
09I7
’97
490’
II3
II0
40
%7
34
%0
174
00
0%
52
40
%774%
030
74
3077
4022
4340
03709
0330
33689
720
I7
00
I7
00
4%
40%
00%
167
720
30
%03%
00
770
22
%07)2
%0
(0%
047
703
020
5331
33790
21
00
33399
730
IS0
00
090
7070
100
7970
140
700!
130
7370
90%
00%
00
740
30
%77003.
00
0%
000
950
000
23
90
0030)4
720
5/2
090
007
I4
00
040
1201
2070
70’
9070
70!
227
234
07
%43%
I0
250
00
%5
44
0%
7154%
030
709
003
533
13094
700
53090
7030
05
I0
I2
000%
00%
00
0%
772
II4
40
%1
04
%0
2II
1111
%74
22%
1057
%004
574
742
0223
423
30
.94
1093
3807
9423
75776
00
7II
9075
0’40
7110
!90
7370
!I
06
7000
%40%
93
II0
00
%5
00
0%
00
00
%000
315
30
052
270
2470
912
035
36
89
21
90
00
03
70
2070
70!
9079
70’
9009
70’
43
II72
.7%
27
3%
44
734
30
%6
40
2%
1544
%000
719
737
353
13099
2100
13099
730
40
30
00
4079
0’44
550’
9075
0!20
014
53
3%
70,7
%4
I37
00
0%
40
77
%3
23
%000
‘43
027
4140
4729
/04
730
5407
9070
072
03
00
4079
0’40
750’
9070
0’3
I4
753%
250%
74
1442
0%40
20%
40
00
%0
03
010
42
043
3333099
710
334.9
475
30I
40
4I
500%
00%
70
0%
II0
II7
00
7%
00%
02
4744)0
%5234%
95
2%
305
010
070
522
42094
1037
10
39
623
37I
30
03
10
00
%00%
00%
90
P7
70
0%
09%
42
II7097%
5000%
2333%
733
490
207
1370
9475
2032034
2130
05
00
33
00%
00%
70
00
%70
272
44
4%
70
7%
30
237104%
027%
3470%
7II
404
205
3333
13
09
41
10
31
33
.94
730
95
00
00
9071
70!
9009
701
9052
70!
230
230
00
%00%
24
270
90
%05)9
’.‘4
41
%000
72
472
303
223
30
94
21
00
13
09
473
005
I0
0I
40
00
%00
%00
%70
070
10
00
%00%
04
‘24
13
%43309.
01
3%
07
11
00
07
133
343390
745
13
53
010
300
23
04
74
00%
79
0%
24
0%
70I
II07
.4%
97%
00
757647%
7333%
00
3.
240
505
00
703
390094
530
53099
73
30
I0
00
020
7570
’‘0
0170
000
7970
10
I7
65
7%
‘01
%3
070
00
0%
7000%
3000’.
003
040
099
077
30030
1543
30
09
42
17
0775
00
00
4070
0!40
108’
4070
0’74
070
73
00
%00%
0)
700
00
%0474%
52
5%
000
74
4047
30594
41
70
331.9
477
045
20
02
000%
04%
04%
140
4410
0.0%
00%
07
774770%
6235%
00
49
.700
700
050
0034
33
79
410%
5,37
.94
7530
35
0S
05
07%
70
00
%00%
00
610
00%
00%
0)
II4540%
4045%
40
5%
200
750
05
00)2
73
07
90
770
31
48
415
304
25
)I
04
500%
000%
00%
450
1570
00%
00%
00
74770%
0044%

1•-i
bW
P.
tt
Wt4
Iam
.P
tP
tC
l..
1t0
,.
%1fr1
%flT
..1
%C
t.t
PtA
.d.
Cl.
.T
PL
C.
%P
ttIle
‘C
...
PA
,C.t
CP
.t..
.tt
%aw
‘,
%?C
.PC
lC
.CC
lCC
CC
Pt
CO
CC
I..
CC
OC
CI€
.CC
.Cp
b17)
CC
tC.
ChIC
0200
I0
00
0•(
0w
h0(0
070
0000
10
I00
007.
007.
II
000(
00%
00
00
00(0
%000
0(0
000
0000
000
00
00
20
2.
0010
02020
0)7
00.
700
00
00
0(0
0)0
(0W
10000
I0
I00
00%
0.0%
10
7)0000.
00)0
%0
00
0.
010
31
0O
Il10
070
02
02
.00
(00
00
00
0000
00
00
00
00000
00070
00000
I1
0770
.0%
070%
00
II0
00
%00
,10%
7000
%0.
000
.2
00
700
00
0
0.0
0*
.00.0
00.
0.0
10
0o0)O
q0
00
0.o
o.
00
.0
.00
000.0
7.1
)01001
%0
00
0..
d.
‘0
)o
o0
00
)0*
.C
O..
1.0
0000.)
10
10
0)0
01
%0000
00
.00
.0.0
00.0
00
To
1000
0.01
1*000C
C000.1
100
00
000..
.0)000
00000.0
CC
C0000000.0
0100
00
0.7
10.0
77.(
0l.
7
0.7
0*
.000)0
1..
000
00
00
02
000100.0
.00
70
00
p%
OO
og
7.0
00.0
7000
%00_
00C
oO
p.
0)1
000)0
00
0..
7.0
00)0
0)0
100—
P0
0)O
.oO
P10)0
0)
0000
1000.0
)01
00
01
01
00
.00
..000(0
.0.0
00
00
00
00
00
).070.7
07000.0
00.0
70000
0.0
b0
10
00
01
00
20071.0
10
0..
70
.O
r1
00
00
00
100
00
oo
O..
1000).
00A
oC
.0)o
70
.10
0..
7.0
0C
oO
p7
.00
P0.0
.00.0
0P
.o...)
O0
00
0p
0001)
00
00
1)0
.0*00(0
.011
00
00
00
00
0)..
02
00
070
00
20
20
0000
00
00
000770
0000
0000
00
00
700%
0000.
000
0000
7.0
00
%0100
000
0)0
0)0
000
o00C
)0
Appendix D:
Trauma Burn Nursing Unit Charts and Data
• Overall Nursing Activity Distribution• Nursing Activity Distribution by Shift• Nursing Activity Distribution by Shift with Standard Deviation• Charge Duty Distribution by Shift (Pie Charts)• Charge Duty Distribution by Shift with Standard Deviation• Frequency Chart of Charge Nurse Activity• T-test Statistics• Raw Data

CC
Ave.PercentageofTimeObservedF\)C)
00fT1C
C)0
0m
>II-
S
C-)
cD
S
-o
0
C-)
cD
D
-U
-I10)
0)
z-I
0
D
Z)
D
>
C,)
zc;)I-IC’)I

Trauma Burn Nursing Activity Distribution
%ProflPers11%
%ChargeI 53%
Trauma Burn Day Shift Nursing Activity Distribution
%ChargeI 50%
%Prof/Pers12%
%Patient’38%
Trauma Bum Night Shift Nursing Activity Distribution
%Prof/Pers10%

10.6%
6.3%
%Prof/Pers
U Mean Values
• Stand 0ev.
C53 2%
Trauma Burn Nursing Activity Distribution
500%
400%
300%
200%
10.0%
0.0%
362%
16.9% 16.7%
I%Charge ‘PatienI
50.72%
Trauma Burn Day Shift Nursing Activity Distribution
60.0%
500%
40.0%
30.0%
20.0%
10.0%
0.0%
37’ 56%
15.55%
U Mean Values
• Stand. 0ev.
13.24%11.73%
%Charge %Patient
54 36%
%Frot/Pers
40.0%
30 0%
35 19%
200%
Trauma burn Night Shift Nursing Activity Distribution
1045%
6.62%
18.74%
100%
20.42%
0 Mean Values
.• Stand. 0ev.
0 0°.
%Chalge %Pat,ent %Prol/Pe,s

nn
Tra
uma
Bum
Ch
arg
.O
uty
Dis
trib
utio
n
48%
Pt.T
,w.
14%
Tra
uma
Bum
sD
ayC
har
g.
Dut
yD
istr
ibut
ion
Tra
uma
Bum
Nig
htC
har
g.
Dut
yD
istr
ibut
ion

mMean 39.51% 18.02% 42.48%
DStd. Dev. 14.36% 14.93% 14.78%
Trauma Burn Night Shift Charge Duty Distribution
Trauma Burn Charge Duty Distribution
50%
40%Z4
__ _ _
30°’
20%,,J
10%4A I1
% Staff % Pt. Trans
•Mean 37.70% 13.65% 48.64%
Std. Dev. 13.33% 14.47% 18.85%
%Other
Trauma Burn Day Shift Charge Duty Distribution
50%
______________________
40% V
30%
_______
20%
0%-IA -
%Statf %Pt. Trans
H%Other
60%
S’°’LI /0
40%
30%
20% z)
0%
I
i1L%Statf %Pt. Trans
UMean 35.09% 6.83% 58.08%
%Other
DStd. Dev. 12.58% 7.26% 14.44%

C 0 a, a, a, 0 ‘4- 0
Dis
trib
utio
nof
the
obse
rved
Char
ge
Nurs
eA
civi
ty(T
BIC
U)
Mea
n%
=53
%
10 9 8 7 6 5 4 3 2 1 0
100-
90%
89-8
0%79
-70%
69-6
0%59
-50%
49-4
0%39
-30%
Per
centa
ge
ofC
har
ge
Nurs
eA
ctiv
ity
29-2
0%19
-10%
9-0%

TB ttest
t-Test: Two-Sample Assuming Equal Variances
%Charge %ChargeMean 0.507174 0.543587Variance 0.02418 0.035135Observations 12 13Pooled Variance 0.029896Hypothesized Mean Difference 0di 23t Stat -0.52606 1P(T<=t) one-tail 0.301 941t Critical one-tail 1.71387P(T.<=t) two-tail 0.603882t Critical two-tail 2.068655
Since the t Stat is less than the t Critical two-tail, the differences in the MeanPercentage of Charge Nurse Activity is zero.

T,i
um
aB
im
Dis
.50
04a
End
TIm
.H
a.W
kd11
./fl
agPt
.T
,wt.
tO
th.
%S
taff
%Pt
.Tm
..16
065.
1T
otal
Chug.
Pt.
Aaa
lgii
3/2/
58.5
2/98
1030
12.6
130
Il64
.17%
0.00
%46
83%
2414
3/2/
0470
03/
2/08
1000
123
37
23.0
8%23
.08%
63.1
6%13
183
3/2.
108
1000
3/3/
0873
0/2
.57
014
33.3
3%0.
00%
86.8
7%2
/6
33(
4/08
750
3/4/
0816
00/2
71
041
.18%
6.68
%52
.04%
/77
331
4/08
1000
3(5/
0873
012
.57
17
48.6
7%8.
67%
48.8
7%16
100
3(6/
0170
0Y
S08
1630
12.5
40
833
.33%
0.00
%86
.67%
120
73/
6/96
1600
3/61
0873
012
.58
28
37.6
0%12
.50%
60.0
0%16
133
3/0/
0170
031
8/08
1000
125
41
00.0
0%40
.00%
10.0
0%10
76
316/
98/9
0031
7/00
730
/2.6
II2
II45
.63%
833%
46.6
3%24
83
3/6/
0810
003/
7/91
730
12.6
64
1223
,81%
10.0
6%57
.14%
2/
76
317/
0810
0031
6156
730
12.5
40
357
.14%
0.00
%42
.66%
77
173(
5108
700
3/6/
0410
3012
.53
02
40.0
0%0.
00%
40.0
0%5
020
3/6/
0810
0031
0/06
700
124
07
38.3
6%0.
00%
6364
%II
3II
3FW
9870
03/
6/68
1000
125
47
31,2
6%26
.00%
43.7
5%16
0/2
31/1
098
700
3/11
098
1000
12II
I6
61.1
1%5.
68%
33.3
3%16
06
3111
001
1000
3/11
/08
730
12.6
122
2720
.27%
4.68
%86
.45%
410
031
1110
870
031
11/0
110
0012
54
133
.33%
26.6
7%40
.00%
152
1031
11/0
110
003/
1319
670
012
72
463
.65%
¶638
%30
.77%
130
1231
)210
170
031
13/9
619
3012
.58
44
42.6
4%28
.57%
28.5
7%14
09
31)2
/06
1030
31)3
1/64
730
126
017
26.0
0%0.
00%
73.6
1%23
9I
31/3
/68
700
3/13
982
)00
14I
717
20.0
0%23
.33%
58.8
7%30
I12
31)3
/06
1000
3/14
/01
730
12.5
20
1018
.87%
0.00
%13
.33%
121
1031
)3/0
82)0
03/
13/0
122
00I
II
060
.00%
60.0
0%0.
00%
20
I31
14/0
870
03/
14/5
816
0012
58
833
.11%
38.1
0%38
.10%
210
631
)4/9
810
303(
1991
730
127
III
26.6
2%3.
66%
69.2
3%26
01
3(19
91/9
3031
)6/0
873
012
64
1322
.73%
11.1
6%69
.09%
2213
0
.1.1
Pl.
Cu.
Pro
t..a
lonal
P,o
n.t
Tot
al%
Chai
g.
%P
.tlo
.I%
PrU
Pu.
HO
NC
hug.
NO
NPt
.N
ON
/70
344
54.5
6%38
64%
662%
662
463
0..
/00
234
31.2
4%66
88%
5.68
%4
66
67/
07)
I0
433
83.6
4%24
24%
12.1
2%706
303
I52
100
330
66,6
7%33
,33%
/00
0%
680
40
0I
20/0
06
3050
.00%
33.3
3%/6
,67%
62
54)7
208
73
022
54,6
6%3
)82
%/3
.64%
662
368
1,70
/62
236
44.4
4%44
.44%
11,1
1%556
556
/30
153
230
33.3
3%50
.00%
/6,6
7%4.
006
00
200
II0
436
6)5
4%
262)
1610
28%
7.60
353
120
150
038
61.3
3%41
.67%
000%
720
52)
00
024
0I
3321
.88%
75.0
0%3.
13%
2.73
638
038
204
S32
16.6
3%62
.50%
21,8
1%1.
667
8)
2.73
140
025
44.0
0%56
00%
0.00
%528
6,72
00
012
I2
3161
.61%
31,7
1%0.
88%
418
466
116
50
427
86.6
7%18
.52%
14.8
1%6.
0022
217
60
04
4501
.11%
0.00
%6.
89%
1138
00
0lI
t12
6I
3345
.45%
3636
%18
11%
5.45
436
2/6
122
43/
41.9
4%31
71%
10.3
5%6.
03466
232
9I
125
64.0
0%36
.00%
8.00
%7.
004
50I
00/0
07
4057
.60%
2500
%17
.60%
60
0300
210
130
144
66.1
6%29
.66%
2.27
%8,
554
/40,
3220
06
3831
.58%
52.6
3%15
.70%
3,05
65
8/0
70
03
86.6
7%33
,33%
0.00
%0
87
03
3000
62
2SI
67.7
4%10
.36%
12.6
0%6.
13232
I65
06
3281
.26%
3.13
%15
.63%
0.75
03
1/8
813
02
3759
.48%
36.1
4%6.
41%
7.14
422
06
5
Sld
D.v
.37
.70%
/3.8
6%48
.86%
¶3.2
3%/4
.47%
18.1
6%U
uo
Vj.
63.2
%36
2%10
.6%
S5
inD
iv.
16.9
%/6
.7%
6.3%
Mad
an66
.27%
36.5
7%10
.48%
6,26
432
130
1168
2.40
2.22
0.77
6.61
42
0/3
4
—65./
1.
1/68
80/6
1/o
n.d
iug
.m
ao.o
n65
8y.o
m.y
.n4.á
lg6
5y
.18
8.11
14ddnll
oni
1414
/6*8
0.61
.61
.61h
SyI
D.y
-7w
iIa
?am

DA
YS
OIL
Y
D118
Sow
.di
End
TIm
eH
is.W
EdIl
afll
ngP
tT
ran
gl
00
w%
S*d
f%
Pt. I
ran
.16
00w
To
ldC
hu
g.
Pt.A
aaI
ToOa
IPtC
a,.
P,o
tmeI
onaI
Pei
son.
ITo
tal
%C
Iwg.
%P1
11.n
t%
ProS
Vue
$014
Chug.
$011
P1.
$014
30/E
lio
i31
2791
1530
12.6
130
Ii64
.17%
0.00
%46
.13%
2414
317
03
4464
.66%
3964
%61
2%682
483
065
3119
970
03’
2198
1900
123
31
23.0
6%23
.06%
83.1
6%13
II3
190
234
3124
%65
88%
588%
456
411
Oil
3147
9170
031
4191
1800
127
19
41.1
8%69
6%62
.94%
177
310
03
3054
67%
3333
%10
00%
68
0400
120
3(59
570
03(
5(84
1930
126
40
833
.33%
0.00
%56
.97%
120
77
30
2254
55%
31.9
2%13
64%
692
399
170
34(8
170
03(
691
1900
126
41
60.0
0%40
.00%
10.0
0%10
78
163
230
33.2
3%60
00%
1667
%400
600
200
3189
610
01(
8794
1930
12.5
30
210
.00%
0.00
%40
.00%
50
2020
43
3016
.63%
62.0
0%21
98%
I96
781
273
3769
670
03(
9194
1900
126
47
31.2
6%26
.00%
43.7
6%II
012
12I
231
61.9
1%31
.71%
9.68
%I
II4
66
I16
3110
199
100
1110
(98
1900
12II
I6
61.1
1%65
1%33
.33%
II0
66
04
2166
67%
1852
%14
81%
801)
222
178
3111
9870
037
11/9
819
0012
54
I33
.33%
21.8
7%40
.00%
162
1012
6I
3346
.45%
36.3
6%18
18%
54
5436
218
3(12
/61
700
3113
191
1930
12.6
I4
442
.96%
28.6
1%26
67%
140
99
11
2561
.00%
38.0
0%6,
00%
700
46
010
03(
1358
700
3111
(81
2100
146
717
20.0
0%23
.33%
6851
%30
I12
430
144
15.1
5%28
.56%
2.21
%955
4.14
023
1114
191
700
1114
/91
1600
126
II
23.8
1%36
.10%
28.1
0%21
0I
62
231
97.7
4%19
.36%
1290
%8
1322
3I
56
36.5
1%11
.02%
42.4
5%hle
enV
aE.
50.7
2%37
51%
1173
%6
28
463
143
1733
Sod.
D.v
.14
,38%
14.9
3%14
.78%
Stan
d.0e
v.15
.56%
13.2
4%6.
11%
204
III
060
M.1
1.n
64.6
6%38
19%
11,4
5%II
I443
131
1401
411
OIL
Y
Dol
eh
art
TE
n.060.
End
TE
n.H
is.
WE
dS
laM
ngP
tT
rana
let
00w
1686
111
1650
. Ira
n.
1600
wT
otal
Ch
ug
.P
t.A
adg
n0
0w
Tot
alP
tCar
.P
,of.
.do
nal
Pu.o
nal
To
ld%
CIw
g.
%Po
lhan
l%
Pio
6et.
$054
Chug.
$011
Pt
1106
400w
112/
9619
0031
3(96
730
126
70
1423
.33%
0.00
%66
.67%
215
36
04
3363
.64%
24.2
4%12
.12%
7.96
303
162
1147
9519
003(
8/91
730
12.6
71
746
.97%
5.67
%44
.67%
1510
010
05
3050
,00%
33,3
3%16
67%
62
64
17206
1(1/
9819
003(
8(96
730
12.5
62
I37
.50%
12.6
0%50
.00%
II13
3II
22
3644
.44%
44.4
4%11
.11%
55
4656
139
IlS
ISI
1000
117/
9673
012
.6II
2II
4693
%8.
33%
45.1
3%24
S3
II0
439
51.5
4%29
.21%
10.2
6%766
353
128
30/E
d1Q
0011
7/91
130
12.6
64
1233
.81%
19.0
6%57
.14%
217
915
00
3656
.33%
4167
%0.
00%
7,25
621
00
03(
7/94
1900
3191
9.1
730
12.6
40
367
.14%
00
0%
42.8
6%7
717
240
I32
21,9
6%76
00%
3.13
%2
73
038
039
3489
1900
30/I
l70
012
40
738
.36%
0.00
%63
.64%
II3
ii14
00
2544
.00%
66.0
0%0.
00%
629
672
000
1110
191
1900
3111
/99
130
12.5
122
2726
27%
4.99
%66
.96%
410
00
04
4591
.11%
000%
180%
1139
00
011
131
1/96
1900
3112
191
100
127
24
63.9
1%15
.31%
20.7
7%13
012
122
431
4494
%38
71%
19.3
6%600
46
6232
1112
.191
1930
1113
’91
730
126
017
24.0
9%0.
00%
73.9
1%23
91
100
740
67.5
0%25
.00%
17.6
0%8
90
30
02
10
3111
196
1900
3114
(94
730
12.5
20
1016
.67%
000%
93.3
3%12
I19
200
IS
I31
,61%
62.6
3%15
.79%
395
66
819
711
14/S
d19
3031
1519
873
012
7I
II26
.52%
3.96
%59
.23%
260
I1
05
3261
.25%
3.13
%16
.83%
9.76
03
8II
I3(
1691
1930
1118
191
730
125
413
22.7
3%11
.11%
66.0
9%22
IS0
130
237
59.4
1%36
.14%
6.41
%71
442
20
65
U.n
.36
.09%
9.93
%54
.09%
Uaw
iVah
i.64
.36%
30.1
9%10
.45%
969
434
128
1231
00.
Ow
12.6
1%7.
29%
14.4
4%hin
d.
0ev.
11.7
4%20
.42%
6.62
%2.
3125
4O
IlU
ndan
57.6
0%36
.14%
11.1
1%9.
90422
139
00.r
wic
.m
TE
n.S
pir
I(h
it)
0.41
-026
-015
(NIG
HT
-D
AY
)

Appendix E:
5D Nursing Unit Charts and Data
• Overall Nursing Activity Distribution• Nursing Activity Distribution by Shift• Charge Duty Distribution by Shift (Pie Charts)• Charge Duty Distribution by Shift with Standard Deviation• Frequency Chart of Charge Nurse Activity• T-test Statistics• Raw Data

n
.
0) 0) C’)
0 E I 0 a) .1-’ C a) C) a) 0 >
10%
NIG
HT
SHIF
T
70%
60%
5DN
urs
ing
Act
ivit
yby
Shi
ft
50%
40%
30%
20%
(0!
U/0
--
OV
ER
AL
LD
AY
SHIF
T
Charge
•%P
aent
Car
eD
%_P
rof.
/Per
sona
lj

5D Overall Nursing Activity Distribution
5D Day Shift Nursing Activity Distribution
% Prol/Pers.9%
5D Night Shift Nursing Activity Distribution
% Prot/Pers.7%

5D Overall Charge Duty Distribution
%Other40%
5D Day Shift Charge Duty Distribution
%Ottier41%
%Pt.Trans23%
50 Night Shift Charge Duty Distribution
%Other41%

50 Charge Duty Distribution
5O%
30%V1
__ _
:,I-i
O%4
•Mean 35.50% 23.41% 41.09%
DStd. Dev 20.51% 14.77% 22.97%
5D Night Shift Charge Duty Distribution
50%
40%
30%
20%
0% 4 A
I
r
%Staff %Pt.Trans
mMean 34.59% 24.55% 40.86%
OStd. Dev 17.84% 18.13% 23.68%
%Other
5D Day Shift Charge Duty Distribution
50%
40%
30% -
20% -
10% -
0% -
%Staff I %Pt.Trans %Other
I
I
U%Statf %Pt.Trans
Mean 31.95% 26.82% 41.23%
DStd. Dev 14.34% 23.14% 26.70%,
%Other

7 6 5
0 C .24
a, U, 0 3*:
2 1 0
89-8
0%
Dis
trib
utio
nof
the
obse
rved
Char
ge
Nur
seA
ctiv
ity
(5D
)
Mea
n%
=55
%
I79
-70%
69-6
0%59
-50%
49-4
0%39
-30%
29-2
0%19
-10%
9-0%
Per
cen
tag
eof
CN
Act
ivit
y

5D ttest
t-Test: Two-Sample Assuming Equal Variances
0.551724 0.761905Mean 0.505822 0.574294Variance 0.033339 0.034256Observations 14 10Pooled Variance 0.033714Hypothesized Mean [ 0df 22t Stat -0.900665P(T<=t) one-tail 0.18876t Critical one-tail 1.7171 44P(T<=t) two-tail 0.377521t Critical two-tail 2.073875
Since the t Stat is less than thet Critical two-tail, the differences in the MeanPercentage of Charge Nurse Activity is zero.

n0.
Iaav
tTh
m0
End
flm
.W
kd$l
aMn
Pt
Tm
n.15
1O
ilie
r%
S*eI
t%
PL
T,.n
s%
O4h
wT
otel
Cli
arg.P
LA
a.lg
nO
ilie
rT
ond
Pt.
Car
.P
iok
e.lo
nd
Per
son
alT
end
%C
her
g.
%Pd
1a41
4%
Pio
f9.c
s.N
Oel
Cha
in.
Noe
lPt
.N
Oll
Oth
er90
4181
700
2124
,81
1530
.00
12.5
10
643
.75%
0.00
%55
.25%
166
I0
40
2066
.17%
31.0
3%13
.70%
60
03
66
172
2124
100
700
2124
101
1530
.00
12.5
00
I0.
00%
0.00
%10
0.00
%I
13I
140
1II
5.25
%67
60%
625%
07
010
040
7621
2418
110
0021
2901
700.
0012
46
2212
.60%
15.1
5%56
.76%
620
17
0S
4276
,16%
16.4
7%7.
14%
614
20
0056
Sf2
951
700
2125
181
1600
.00
124
413
16.0
5%10
.05%
51.5
0%21
11I
120
236
60.5
0%34
25%
5.71
%7
20
411
060
2124
101
700
2129
5116
0000
126
64
47.0
5%25
.41%
23.5
3%17
313
160
236
45.5
7%45
,71%
5.71
%663
540
06
090
7105
700
2127
101
1000
.00
123
05
17.6
5%62
.64%
20.4
1%17
35
120
020
65.6
2%41
35%
000%
72)
407
00
02l
2716
110
0092
1185
730.
0012
.52
010
11.1
7%0.
00%
03.2
3%12
016
151
261
36.7
1%51
.61%
6.45
%4.
046.
461.
212)
2718
118
0021
2510
173
0.00
12.5
43
925
.00%
15.7
6%66
.25%
II0
44
02
2272
.72%
18.1
6%0.
00%
0.00
2,27
114
2129
0170
021
2110
110
00.0
012
66
1054
.76%
21.7
4%43
.45%
230
$6
02
3350
.70%
2424
%4.
06%
6.35
201
073
9110
170
021
1101
1000
.00
127
36
35.5
4%15
.75%
47.3
1%16
74
II0
232
50.3
5%34
35%
626%
7.13
413
01
591
151
700
2111
6115
30,0
012
.54
114
17.3
0%21
.74%
60.5
7%23
42
I0
231
74.1
9%10
35%
545%
027
242
051
2111
0110
0092
111
7300
012
.67
017
20.1
7%0.
00%
70.5
3%24
07
70
223
72.7
2%21
21%
605%
000
26
60.
763(
2181
700
9010
116
00.0
012
46
526
.00%
57.6
0%37
.50%
II7
714
00
3053
.33%
4657
%0
00%
4.40
660
00
021
3181
700
2141
0116
00.0
012
42
344
.44%
22
%33
.23%
09
I15
0I
2535
.00%
6000
%4.
00%
4.32
7.20
045
Sf41
8170
021
4101
1030
.00
12.5
SI
I36
.10%
23.1
1%31
.10%
210
22
07
5010
.00%
5.57
%23
.33%
8.75
083
202
Sf51
0670
095
105
1030
.00
12I
52
11.5
7%60
.00%
33.3
3%6
55
120
321
2667
%67
.14%
14.2
0%343
406
171
Sf31
0110
0021
5105
730.
0012
.6I
46
33.3
3%22
.22%
44.4
4%16
32
60
226
72.0
0%20
00%
6.00
%0
00
26
0I
0095
105
750
Sf11
6115
30.0
01
25
02
081
.62%
1611
%0.
00%
II5
III
01
2347
.53%
47.9
3%4.
36%
60
6505
054
3(71
0116
0031
5611
730.
0012
.63
53
20.0
0%60
.00%
20.0
0%16
152
170
234
44.1
2%60
.00%
565%
661
52
50
1431
5105
1000
2155
523
00.0
04
40
317
.14%
0.00
%42
.55%
1I
0I
00
I57
.60%
1260
%0.
00%
36
00
60
00
0Sf
5101
700
9818
110
00.0
012
83
550
.00%
11.7
5%51
.26%
II0
09
04
2566
.17%
3103
%13
.75%
4.82
312
166
3161
8115
00Sf
1010
172
0.00
12.5
76
641
.10%
20.4
1%20
.41%
173
47
02
2856
.35%
2502
%7.
40%
1,17
337
00
530
161
1000
Sf10
611
730.
0012
.62
32
25.5
7%42
.56%
26.5
7%7
66
101
I16
35.5
4%62
83%
10.6
3%4.
614.
51I
3231
1010
570
0Sf
1018
510
00.0
012
03
360
.00%
20.0
0%20
.00%
157
714
26
3740
.64%
37.5
4%21
.42%
40
6454
259
2115
186
1800
211)
185
730.
0012
.5I
4I
14.5
6%55
.55%
5.06
%II
87
160
226
59.2
5%53
,57%
7.14
%4,
015,
70055
9111
8140
031
1110
111
30.0
012
.60
34
50.0
0%16
.67%
33.5
3%II
27
00
128
54.2
0%32
.14%
3.57
%004
402
04
621
1905
1000
Sf1
981
720.
0012
.53
I0
53.5
3%56
.67%
00
0%
610
010
01
2045
.00%
60.0
0%60
0%643
52
50
63
Mee
t34
.50%
24.5
6%40
.55%
Nin
a54
.14%
37.4
3%7.
03%
445
465
0.05
17.8
4%11
.13%
23.1
1%60
6.0e
v.17
.66%
17.5
4%6.
61%
2.14
2.25
06
066
.17%
34.3
6%5.
25%
6.62
4.13
0.76

60.6
0%40
.34%
8.77
%8
0d
O.
17.8
3%19
.00%
7.06
%56
.17%
37.9
4%9.
26%
8,19
40
010
7218
2.36
08
75,
624.
54075
656
4.14
08
622
12.
310.
366.
633.
37089
nn
Cm
$489
1766
.-
Cm
End
TSR
.H
r..
Whd
8W
86.
Pt.
Tr.
nd.r
OU
i.t
%84
a6%
Pt.
Tri
%O
Ur
To(
aIC
liar
a.P
t.Aed
gmO
lh.r
Tot
eJP
tC
mP
mk
..lo
nd
Pm
oiu
T0
%C
lw.
SP
.9.6
0S
Pro
W..
,.14
044
Chat.
1404
4P
t14
0940
09..
2)24
198
700
3249
9416
30.0
012
.61
00
43.7
6%0.
00%
55.2
5%15
8I
04
020
56,1
7%31
.03%
13.7
9%600
388
172
2.10
4(98
700
2)24
/08
1630
.00
12.5
00
I0.
00%
0.00
%10
0.00
%I
13I
140
III
9.25
%87
.50%
625%
07
81Q
94078
2(26
(05
700
2)26
108
1900
.00
124
413
18.0
6%10
.06%
81.0
0%21
III
120
236
60.0
0%34
.20%
571%
120
411
060
2924
156
700
2/25
(08
1900
.00
12I
54
41.0
1%20
.41%
23.6
3%11
313
IS0
236
48.5
7%46
71%
571%
68
3549
06
921
27/0
870
021
27/0
810
0000
123
06
17.6
6%62
.94%
20.4
1%17
30
120
029
58.8
2%41
.36%
0,00
%703
4.97
000
2/26
0870
027
2890
810
00.0
012
I6
1034
.79%
21.7
4%43
.48%
230
8I
02
3360
.70%
2424
%6.
06%
83
62.
010
73
311/
0170
02)
1/51
1000
.00
127
30
3514
%15
.79%
47.3
7%10
74
II0
233
89.3
6%34
.38%
6.26
%7.
134
130
75
311)
9170
037
1196
1030
.00
12.5
45
1417
.30%
21.7
4%80
.87%
234
26
02
3174
.10%
10.3
6%54
5%9.
272.
4209
121
2)98
700
2)2/
9819
00.0
012
46
I26
.00%
37.6
0%37
.60%
II7
714
00
3063
.33%
46.5
7%0.
00%
6.40
5.60
00
031
3791
700
2)4/
9110
00.0
012
42
344
.44%
22.2
2%33
.33%
89
616
0I
2535
.00%
80.0
0%4,
00%
432
720
04
831
4(96
700
214/
9619
3000
12.5
I6
I31
.10%
23.9
1%31
.10%
210
22
07
3070
.00%
667%
23.3
3%876
063
292
3(2/
9810
031
6/08
1930
.00
121
32
11.1
7%60
.00%
33.3
3%5
93
120
321
28.5
7%57
.14%
14.2
9%3.
438
86
I71
3761
0670
02)
6708
1830
.00
12.6
02
011
.62%
11.1
1%0.
00%
II5
6ii
01
2347
,13%
47.8
3%4.
36%
5.05
5.88
0.54
3169
870
039
696
1900
.00
128
36
60.0
0%18
.76%
31.2
6%16
00
00
425
66.1
7%31
.03%
13.7
9%6.
623.
7216
631
4109
870
021
1101
119
00.0
012
93
360
00%
20.0
0%20
.00%
157
714
25
3740
.54%
37.5
4%21
.62%
4.86
4.54
25
9
U..n
36.6
0%23
.41%
41.0
0%54
4.D
.v20
.51%
14.7
7%22
.97%
59a5
964
45SI
CU
D.
St.
,t7
6..
Cm
End
TIm
.*4
,..654
5188..
Pt.T
m..I.
,086
89%
tWI
%P
tTm
..76
0*66
.1
2/24
/98
2/27
108
2127
198
311/
012)
998
3160
637
606
3160
62
)1011
2)13
191
1900
2/25
/98
700.
0049
002/
28/9
873
0.00
1900
2/26
708
730.
0019
0037
2198
130.
0018
0037
616
730.
0019
002)
6108
730.
0018
0031
6191
2300
.00
1900
2)11
008
730.
0019
0031
1100
173
000
1900
2)11
/91
730.
0049
0031
4218
873
0.00
1212
.512
.512
.512
.612
.5
12.5
12.5
12.6
12.6
45
2212
.50%
20
1016
.67%
43
025
.00%
70
1721
.17%
64
I30
33%
30
320
.00%
40
367
.14%
76
641
.11%
23
228
.57%
I4
I54
.66%
3I
026
.33%
16,1
95.
6.1
07.
00
0%
83.3
3%18
.76%
65.2
5%0.
00%
70.8
3%22
.22%
44.4
4%50
00%
20.0
0%0.
00%
42.8
8%20
.41%
20.4
1%42
.80%
2151
%36
.35%
8.00
%08
.87%
0.00
%
Mm
S44.0
.v
589.
476
Ch.n
..76
P89
.89
7694.0
9.,
.
31.0
1%28
62%
41.2
3%14
.24%
23.1
4%26
.70%
tflM
(6k.,
U7
1U
545
18
.19
%1
0.6
7%
7.14
%12
015
ISI
231
38.7
1%51
,61%
0.68
%II
04
40
222
72.1
3%11
.18%
9.00
%24
07
70
233
72.1
3%24
.21%
6.05
%II
32
60
226
72.0
0%20
.00%
8.00
%lb
162
170
234
44.1
2%50
.00%
5.68
%7
I0
I0
08
91.6
0%12
.50%
0.00
%17
34
70
229
66.3
8%26
,92%
760%
76
610
II
4035
.84%
52.0
3%10
.63%
Il8
716
02
2830
.28%
63.6
7%7.
14%
010
010
0I
2045
.00%
60.0
0%5.
00%
66.1
3%33
.04%
5.93
%54
40ev
.11
.46%
17.2
5%2.
84%
N.d
l.n
56.3
8%26
.92%
7.14
%
814
20
0096
484
645
121
9.09
227
114
900
26
6076
9,00
25
010
066
46
26
074
36
00.
600
00
4.17
3,37
09
646
*658
132
491
6.70
09
06.
636,
250
63
60.8
650
.13

Appendix F:
Additional Project Materials
• Work Sampling Study Directions for Charge Nurses• Data Collection Card• Subjective Survey Form• Article about “The Affects of Randomness”• Article about “Work Sampling as a Management Tool”

University of Michigan Medical Center
Charge Nurse Workload Study
January 1998
What is this about?This study is intended to collect data regarding the Charge Nurse role... specifically, what proportion oftime is spent on “charge nurse duties”, patient assignment and other activities. During the study periodnurses assigned as “charge nurses” are asked to participate.
How long will this go on?Data will be collected over the 24 hours for two weeks if participation is high. If there is incomplete datathe study will have to go on longer. You are asked to complete both sides of the orange-colored datacollection form and the use a random beeper.
What if I “delegate” some charge nurse activities or ask someone to help me?If you delegate any part of your charge nurse function to someone other than another charge nurse it will benecessary for that person to take another beeper and complete a data collection form during the fulltime of the delegation of duties. If this is not done the data will not accurately reflect the charge nurserole. Your Nurse manager will have extra beepers available for this purpose.
Who do I call if I have questions?You can ask your Nurse Manager or you can call Liz Othman at 62469, or you can e-mail one of thefollowing people who are conducting the study from the office of Programs and Operations Analysis.
Kim Pargoff [email protected] Scozzafave [email protected] Whithey [email protected]
If you are not sure how to categorize some activity and assistance is not available, just use your bestjudgment and confer later.
What is a Random Beeper?
The “random beeper” is a specially manufactured beeper designed for “self-collection” of workload data.Statistically, random sampling is considered a very powerful tool and if the sample is large enough, theresults can be used for decision making.
Your beeper has been set to “go off’ at random intervals, 3 times an hour on the average. Thus, forexample, the beeper might not go off at all in one hour and might “go off’ 5 times in another hour. It mayeven “go off’ twice in a one-minute interval!! It is very important that you check off the activity whichbest represents what you are doing at that moment, even if you think the results are skewed and notrepresentative of your work distribution. Please remember that personal rime is okay.
Please remember to turn your beeper “on” and “off’. You can use either the audible or silent mode. Ifyour beeper does not “beep” in a 2-hour period you may need to replace the batteries.

Charge Nurse Activities: Check off activities in this section if they are related to the duties you would
usually do because you are the charge nurse.
Stalling Activities:Check this box if you are doing staffing related activities such as: taking calls from employees,
calling NRP for staff, calling staff at home, arranging for current staff to work extra, making
assignments.
Pt. Transfer Admission Activities:Check this box for transfer/admission duties related to your charge nurse role. These activities
might include taking report, assigning beds, making transfer arrangements, interacting with other
departments.
Other Charge Nurse Activities:Use this box for charge nurse activities that do not fit in the above 2 categories. This box should
also be used when you are “covering” patients because it is a charge nurse duty.
Patient Care Activities: Check off activities in this section for activities related to your patient
assignment or your activities as a nurse doing patient care.
Related to Patient Assignment:Use this box for any direct or indirect care related to your patient assignment such as taking a report,
talking to your patient’s family members, charting, conferring with other personnel regarding your patient.
Related to Other Patients:This box should be checked for activities that are related to the care of other patients that you would
normally do as a member of the care team (being a charge nurse would have no bearing on your
participation in these activities). Such activities might include answering a light, answering the phone,
helping to move a patient.
Other Activities:
Professional Activities:This area is used to indicate activities such as professional development, inservices, unit meetings that are
not related directly to your patient care assignment or chargenurse functions.
Personal Activities: Everyone has down time and this area is used to indicate those times when you might
just be doing nothing, having a personal conversation or on “break”.

Random Beeper Survey: Activities
Charge Nurse Activities
Stattint Activities:‘t. tiC •tiJ. .liIittC 1r tjtI. ,iInmcnis
Pt. Transfer. Admission Activities:tctnt. rrort. a ninC ‘cd. ithr rrangerncnt”
Related to Other Patients:helpint ‘. oh .inuIfler p,iticni. .iti crtn ‘ail Ite!tt.
if OT spei i caiR dci tncu a narge nurc nIc
•
. Other Activities
Professional Activities:(education. meetings, interactions not directly related to
pt. assignment or charge nurse dutiest
Personal Activities:(breaks, bathroom, doing nothine. personal interactions
Random Beeper Survey: Activities
aüenteAçtiyite
Related to Patient Assignment:(direct and indirect care, charting. report. familt
Staffing Activities:taking calls. calling for staff. .tssignments
-..
,
Pt. Transfer, Admission Activities:(taking report. assigning bed. other arrangements)
Other Charge Nurse Activities:(co’erlng other pts. because it is a charge nurse duty
or any other charge nurse “jobs”. meetings or Interactions)
Did you delegate any charge nurse activities’?Yes No
To Whom?
_______________________
Related to Other Patients:I helping with another patient. ans\% ering call lights.
if NOT specificalk defined as charge nurse role)
.
.
•
:. Other Activities.,,,
Personal Activities:(breaks. bathroom, doing nothiniz. personal interactlon%
Professional Activities:(education. meetings, interactions not directly related to
pt. assignment or charge nurse duties
Patient Care Activities
Related o Patient Assignient:dircct a1J InoIrct carc. ‘t.runc. -crort .mii
Other Charge Nurse Activities:)ctcring other pis. because it is a charge nurse duty
or .in other charge nurse ‘iobs”. meetings or interactionsi
Did you delegate any charge nurse activities’?Yes No
To Whom?
______________________
. “—C.•:’

A FEW WORDSEIGHT HOURS AT 2.5 SIGNALS PER HOUR
R probability probability probabilityof exactly or R or of more than
4J3OUPJ R signals fewer R signals
0 .00000 .0000 .9999+1 .00000 .0000 .9999+RANDOMNESS 2 .00000 .0000 .9999+3 .00000 .0000 .9999+
The concept of a random sample is simple: every member of .00001 .0000 .9999+
me population is equally likely to be chosen. In the domain of time 5 .00005 .0001 .9999
rnpling it is convenient to think of a population of seconds, each of 6 .00018 .0003 .9997
-iich is equally Likely to be chosen. Statistics books sometimes 7 .00052 .0008 .9992
ss this in terms of the INTERVALS between samples and some- 8 .00131 .0021 .9979
nes in terms of the NUMBER of samples in a given period. We .0050 .9950
.11 consider the latter here although the other approach is equally 10 .00582 .0108 .9892
did.11 .01058 .0214 .9786
Unfortunately, a random series may not seem random to the 12 .01763 .0390 .9610
sual observer. Apparently it is part of the human mental process 13 .027 12 .066 1 .9339
extract meaningful patterns from data and this is done even 14 .03874 .1049 .8951
nen inappropriate. The gambler who speaks of the dice being “hot” 15 .05 165 .1565 .8435
simply seeing a pattern that isn’t there, if we assume the dice to 16 .06456 .2211 .7789
? honest. Similarly, the user of a Random Reminder will see “clus- 17 .07595 .2970 .7030
rs” of signals that don’t fit an intuitive notion of randomness. 18 .08439 .3814 .6186
athematical analysis of thousands of data points has shown, how. 19 .08883 .4703 .5297
er. that signals from Divilbiss Random Reminders have the cias- 20 .08884 .5591 .4409
c Poisson distribution.21 .08461 .6437 .3563
22 .07691 .7206 .2794
S THE RAM WORKING 23 .06688 .7875 .2125
ROPERL Y?24 .05573 .8432 .1568
25 .04459 .8878 .1122
Since signals from a Random Reminder are completely unpre. 26 .034 29 .922 I .0779
icti,ble, checking the operation is rather different from checking 27 .02540 .9475 .0525
e ‘ation of a calculator or stopwatch. Proper operation means 28 .018 15 .9656 .0344
ri tiat the number of signals in a given period conforms to the 29 .0 1252 .9782 .02 18
Dpropr ate statistical law. Because computation of the Poisson 30 .00834 .9865 .0135
‘ibution is tedious, a few representative cases have been tabulated 31 .00538 .9912 .0088
32 .00336 .9952 .0048
33 .00204 .9973 .0027
34 .00112 .9985 .0015
35 .00068 .9992 .0008
From the table above it can be seen that for an expected value
of 20, actual values of fewer than 8 or more than 35 are quite un
likely. Or. viewed in a slightly different way, there is a 90% probabil
ity that the actual value will lie between 13 and 27. The table above
applies to all situations where the expected value is 20 eigeeI and
not just to the case of eight hours at 2.5 signals/hr.
For a typical study of 200 hours at an average rate of 2.5 sig
naLs per hour, the expected value is 500 but there is only about one
chance in 56 that the actual value will be exactly 500. A simplified
table may help to make this clear.
ONE HOUR AT AN AVERAGE RATEOF 2.5 SIGNALS PER HOUR
R probability probabilityof EXACTLY of R or
probabilityof more thanRsignalsR signals fewer
0 .082 .0821 .9179
1 .205 .2873 .71272 .257 .5438 .4562
3 .213 .7576 .2424
4 .134 .8912 .1088
5 .067 .9580 .0420
6 .028 .9858 .0142
7 .010 .9958 .0042
8 .003 .9989 .0011
9 .001 .9997 .0003
Thus, there is a probability of .082 that there will be zero sig
als during one hour of operation, .205 that there will be exactly one
ignal and so on. If there were ten signals during the hour this
‘ould suggest that something might be wrong since the probability
there being more than nine signals is only .0003 or about one
nance in 3000. On the other hand, failure to beep during a one hour
eriod is not a particularly unlikely event (for the specified rate of
5 ‘md should not be taken as evidence of malfunction. A rea
D test for a Random Reminder is to determine the number of
gns (‘beeps’) that occur during an interval such that the “ex
ected” number of signals is 20. This might be an hour with the rate
et at 20/hour or it might be four hours with the rate set at 5Ihr, etc.
The next table is similar to the preceding one except that the
expected” number of signals is 20. Eight hours at a rate of 2.5 sigaim per hour is common when the Random Reminder is used for
‘lf’obseryation at work.
EXPECTED VALUE = 500
range probability
495-505 .19490-510 .36480-520 .64470-530 .83450-550 .98
In short, there is only a .19 chance of the actual number of
signals being within 1% of the expected value but a very high likeli
hood of being within 10% of the expected value. A 10% variation in
the number of samples will seldom have any effect on the validity of
a study.
© 1982 Divilbiss Electronics

:-
and tahulaung the sampled data from all the operators on thatshift. This was not much of a burden since the sampling ratechosen (0.4 sampleshour) generated only about 20 to 25samples per shift. By combining the sampled data from all theoperators. we accomplished two important objectives. One, wegot an appropnate total sample size while keeping the recordingrequirement extremely low for individual operators. Two, the
process guaranteed anonymity.Anonymity might not bepossible in every situation, hutwhere possible, it is desirable.
Figure 1 summarizes thedata collected over a three-month period and was createdusing nothing more than apencil and a pocket calculator.For operations significantlylarger than our pilot plantoperation. it would bereasonable to use a spreadsheet. It is also true that insome companies, computer-generated reports commandmore respect, the regrettabletriumph of form over content.
The next step is not atraditional one, but it is the keyto this being a win-win tool.Operators and management,working together, wentthrough the table analyzingand discussing every activity.
Was this activity taking toomuch time? Should this activiEybe receiving more emphasis?As an example, activity 5(facility cleaning) shows 61 samples for November and December. As a result of that data, we received additional janitorialsupport in December, which explains why the figure dropped sosharply in January.
Activity 14 (operating systems) represents a fairly highpriority activity that we assumed would take perhaps 3 to 5percent of the operators’ time. When the study made it clearthat the time devoted to this was almost negligible, we had tomove in a new direction. Upper-level management was persuaded that four operators should be released from theirnormal work assignments for four weeks in order to dedicatefull time to this activity. For persuading upper level management, nothing is more effective than having numeric data inhand.
Operators are an expensive resource, and there is alwaysconcern that they are being used effectively. The study served toreassure upper-level management that two potentially troublesome activities are not a problem at all. First, the amount of timetaken by personal (activity 9) is very low considering that thisincludes both lunch and scheduled breaks. The data is reported
( anonymously so we have every reason to believe that the figure isaccurate. Second, waiting (activiw 15) takes so little time that itwill not even be a listed activity in future studies. Operators donot spend much time waiting because there is always a backlogof work to be done, there is no shortage of equipment, they arewell trained, and they have the right attitude.
I want to emphasize that the operators did not merely
a snapshot in time. The realbenefit comes from doingstudies on a continuing basis,
constantly asking the question “Could we be running theoperation better?” We plan to repeat this study at regularintervals, making only some revisions in the activity categories.Some of these revisions will be the result of new governmentalregulations. Others will reflect our attempt to fine tune theoperation. As an example of the latter, we will probably splitoperation (actiitv 1) into two or more sub-activities. Because
operation takes by far the largest amount of time, it representsthe greatest potential payoff through the use of labor savingdevices.
The cost of a studs’ is negligible, it helps us to run theoperation at maximum efficiency, and the employees benefit aswell. It is not every day that you find that kind of managementtool.
Rick Rutter is manager of process operations for G. D. Seorfe in Skokie,Ill. He has a Ph.D. in Chemistry from the University of Illinois atChampaign-Urbana.
- . .- - .., —,-— ;,f:!— __i —-
n
Work Sampling Data Proc Ops. Dept.
agree to take part in the studs’. The’ supported it enthusiasti
cally. Their enthusiasm was certainly warranted when you
consider the following benefits:• They are involved in the management process and canapply their expertise to create a more efficient productiosvs tern:• By documenting what they do, they have increased their
visibility and respect within
the company:
___________________________________________________________
• They now have a tool forjustifring additional equip-Activity Nov. Dec. Jan. Total Percent ment (pumps. cleaning tools,automated controls. etc.) and294 372 349 1015 40.3 support services (ventilation.88 67 39 194 7.7 janitorial. etc.); and24 17 30 71 2.8• Decisions arrived at by23 17 48 88 35 consensus create a feeling of31 30 5 66 2.6 teamwork and a higher level10 6 10 26 1.0 ofjoh satisfaction.14 20 25 59 2.4 From the perspective53 25 26 104 41 of management, the benefit113 107 122 342 13.6 of a time study is a smoother40 16 36 92 3.7
- running, more efficient9 7 12 27 1.1 operation. Less obvious, but6 26 39 71 2.8 equally important, we believe18 31 34 83 3.3 that this kind of study creates10 3 9 22 0.9 a higher level of safety. Safety4 4 5 13 0.5 may seem an odd dividend67 44 65 176 7.0 from a time study, but we17 19 32 68 2.7 believe it comes from thefeeling of teamwork and theTotal Samples 821 811 886 2518 100.0 close attention to detail.
Any single time study’
OperationEquip. CleaningRun PreparationDocumentationFacility CleaningWaste HandlingSupport ActivitiesTrainingPersonalRaw MaterialsOp. SuppliesCant. Impr.Eng. SupportOp. SystemsWaiting limeOperator Comm.Other
FIGURE 1
C
(#0 DIVILBISS— —I 11 ELECTRONICS— —1972 robertdr cflampaign, illinois 67821
(217) 359-3419
C)

Clinic
Models
(Unfocused)
•R
eactive
•Physician
Schedule•
PartialSchedule
Planning•
Disjointed
Staff
•R
N’s
performclerical
tasks•
Mgm
tDependent
Staff
Team
Model
(Patient
Focused)
•Proactive
•P
atientEvent
Schedule•
ScheduleM
anagement
•Interactive
Team
•A
ppropriatestaffperform
tasks(w
orkredesign)
•E
mpow
eredS
taff
Clerk
CC
Doctor
Patien
tM
A
Other
RN
Clinic
Staffing
•1
cz’z’
L_J
ZD
_i
J_—
_}—
--.-;—