university of north dakota grand forks
TRANSCRIPT

UNIVERSITY OF NORTH DAKOTA
Grand Forks
Evaluation of North Dakota’s Asphalt Cement Binder Properties and Performance in Locally
Produced HMA Mixtures
Final Report
December 2005

RCS HHO-30-19
U.S. DEPARTMENT OF TRANSPORTATION FEDERAL HIGHWAY ADMINISTRATION
EXPERIMENTAL PROJECT REPORT
EXPERIMENTAL PROJECT
EXPERIMENTAL PROJECT NO. CONSTRUCTION PROJ NO LOCATION STATE Y EAR NUMBER SURF
8
Grand Forks 28
1 UND 2005 - 01
EVALUATION FUNDING NEEP NO. PROPRIETARY FEATURE?
1 X HP&R 3 DEMONSTRATION Yes
48 2 CONSTRUCTION 4 IMPLEMENTATION 49 51 X No
SHORT TITLE TITLE 52 Evaluation of North Dakota’s Asphalt Cement Binder Properties and Performance in Locally Produced HMA Mixtures
THIS FORM DATE MO. YR. REPORTING
140 12 -- 05 1 INITIAL 2 ANNUAL 3 FINAL X
KEY WORDS
KEY WORD 1 145 ASPHALT
KEY WORD 2 167 PAVEMENT
KEY WORD 3 189 AGGREGATE
KEY WORD 4 211 BINDER
UNIQUE WORD 233 SUPERPAVE
PROPRIETARY FEATURE NAME 255
CHRONOLOGY
Date Work Plan Approved
Date Feature Constructed:
Evaluation Scheduled Until:
Evaluation Extended Until:
Date Evaluation Terminated:
07-2004 12-2005
277 281 285 289 293
QUANTITY AND COST
QUANTITY OF UNITS (ROUNDED TO WHOLE NUMBERS) UNITS UNIT COST (Dollars, Cents)
1 LIN. FT 2 SY 3 SY-IN 4 CY 305
5 TON 6 LBS 7 EACH 8 LUMP SUM
297 306
AVAILABLE EVALUATION
REPORTS
-CONSTRUCTION 315
-PERFORMANCE
FINAL
X
EVALUATION
318
1 2 3 4 5
CONSTRUCTION PROBLEMS NONE SLIGHT MODERATE SIGNIFICANT SEVERE
319
1 2 3 4 5
PERFORMANCE EXCELLENT GOOD SATISFACTORY MARGINAL UNSATISFACTORY
APPLICATION 320
1 ADOPTED AS PRIMARY STD. 2 PERMITTED ALTERNATIVE 3 ADOPTED CONDITIONALLY
4 PENDING 5 REJECTED 6 NOT CONSTRUCTED
(Explain in remarks if 3, 4, 5, or 6 is checked)
321 The HMA with a non-polymer modified binder (partially air-blown) has generally performed well according to the APA depth metric and moisture sensitivity results. Therefore, the PI does not recommend precluding them based on this study. However, the HMA with polymer modification has outperformed the one with non-modified binder; thus, the use of polymer modification is highly recommended.
The results of this study indicate that the addition of a small percentage of lime does help the mix against moisture damage. However, attention should be made so that the %Gmm @ Nmax must not exceed 98%. Accounting for the lime as part of the dust in the aggregate blend could be a safer way of doing it. Further experimentation with lime is necessary such as allowing the lime to cure to gain strength.
REMARKS
Form FHWA 1461

University of North Dakota Department of Civil Engineering
Evaluation of North Dakota’s Asphalt Cement Binder Properties and Performance in Locally Produced HMA Mixtures
Final Report Submitted to the
North Dakota Department of Transportation Bismarck, ND
By:
Dr. Nabil Suleiman, Principal Investigator
December 2005
ii

Disclaimer The contents of this report reflect the views of the author or authors who are responsible for the facts and accuracy of the data presented herein. The contents do not reflect the official views of the North Dakota Department of Transportation or the Federal Highway Administration. This report does not constitute a standard, specification, or regulation.
iii

ACKNOWLEDGMENT
The Principal investigator (PI) wishes to express his sincere gratitude to the officials
of the Materials and Research Division of the North Dakota Department of Transportation
(NDDOT) for the financial support they provided to make this research idea a reality.
Furthermore, the author wishes to thank the NDDOT Asphalt laboratory engineers
and technicians as well as the Grand Forks and Valley City district engineers and technicians
for their help and facility use that contributed to the success of this project. Special thanks
and gratitude are extended to the Dakota Asphalt Pavement Association for the equipment
grant (Asphalt Pavement Analyzer), which is a key factor in accomplishing this research
study.
Finally, the author hopes that NDDOT will continue its research educational
relationship with the CE department at UND in the future.
iv

TABLE OF CONTENTS DISCLAIMER iii
ACKNOWLEDGMENT iv
TABLE OF CONTENTS v
LIST OF TABLES vi
LIST OF FIGURES vii
INTRODUCTION 1
Background 1
Motivation and Benefits 2
Objectives and Scope 3
MATERIAL SELECTION 4
BINDER AND AGGREGATE SELECTION 4
ASPHALT BINDER TESTING 4
Certification Method and Binder Control 4
Asphalt Binder Properties 6
AGGREGATE TESTING 9
Aggregate Properties 10
Aggregate Gradation 12
LABORATORY MIX DESIGN AND ANALYSIS 14
SUPERPAVE MIX DESIGN RESULTS 14
LABORATORY PERFORMANCE TESTING AND ANALYSIS 21
APA RESULTS AND ANALYSIS 22
MOISTURE SENSITIVITY RESULTS AND ANALYSIS 25
SUMMARY, CONCLUSIONS, AND RECOMMENDATIONS 28
REFERENCES 30
APPENDICES 32
v

LIST OF TABLES
Table 1 Properties of the selected Asphalt Binders 7
Table 2 ANOVA Statistical Analysis on Binder Sample Properties from Different Years 8
Table 3 Aggregate Properties for Individual Stockpiles 11
Table 4 Consensus Aggregate Properties 11
Table 5 Aggregate Blend Properties 11
Table 6 Individual Aggregate Gradation 12
Table 7 Aggregate Gradations for the Superpave Blends 12
Table 8 Voids Analysis of Superpave Mixes @ Ndes for Various Binder Contents 16
Table 9 Voids Analysis of Superpave-L Mixes @ Ndes for Various Binder Contents 16
Table 10 Mix Properties at Recommended Asphalt Content for Superpave Mixes 17
Table 11 Mix Properties at Recommended Asphalt Content for Superpave-Lime 17
Table 12 APA Performance Results for the Various Design Cases 22
Table 13 Analysis of Variance (ANOVA) Statistics on the APA Results 24
Table 14 Moisture Sensitivity Test Results 26
vi

LIST OF FIGURES
Figure 1 The 0.45 Power Chart for the Aggregate Blend Gradation 13
Figure 2 Graphs for PM1 Superpave Mix Design at Various %AC 18
Figure 3 APA Average Performance Results for the Different Design Cases 23
Figure 4 Moisture Sensitivity Strength Results 26
Figure 5 Moisture Sensitivity Test (TSR) Results 27
vii

INTRODUCTION
BACKGROUND
The adoption of the Performance Graded (PG) Binder Specifications (1, 2) developed
in the Strategic Highway Research Program Superpave study has improved asphalt concrete
mixture properties, particularly in the northern states. Asphalt, as a viscoelastic material, can
now be specifically engineered for North Dakota’s climatic conditions so that the properties
of the asphalt binder can be specified to provide the high temperature deformation resistant
properties for extreme summer temperatures and the low temperature thermal cracking
resistance necessary for extreme cold winter temperatures (1, 2, 3, 4).
To meet the expanded PG specifications for high traffic volume or extreme
temperature conditions, asphalt suppliers have a number of options including the use of
plastomers and elastomers such as SBS and SBR and other styrene compounds, or turn to
crude treatment alternatives such as acid treatment, foaming, air blowing, and blending (3, 4,
5). However, many states have precluded the use of treated asphalts for fear of artificial
aging effects resulting from such treatment that may not be picked up by specification
property limits and test sensitivity provided by the Rolling Thin Film Oven (RTFO) Test and
Pressure Aging Vessel (PAV) Test included in the PG Binder specification portfolio (2, 6, 7).
North Dakota (8) has an extensive performance history with non-polymer modified asphalts
that meet PG 58-34. The typical consistency and quality of the asphalt produced from this
crude source has for some years been documented.
Although similar in many respects to the normal paving grades of asphalt cement, the
air blowing process provides asphalt materials that soften at higher temperatures than
kneading asphalt cements. Since the higher softening point is the most important and
desirable property of air blown asphalts, they are usually classified in terms of the ring and
ball softening point test, rather than viscosity or penetration. The softening point test is used
as the basic measurement of consistency for grading blown asphalts (3, 5, 6, 7).
The objective of HMA mix design is to develop an economical blend of aggregates
and asphalt. Historically asphalt mix design has been accomplished using either the Marshall
or the Hveem design method. The most common method was the Marshall. It had been used
in about 75% of the DOTs throughout the United States and by the Federal Aviation
1

Administration (FAA) for the design of airfields. In 1995, the Superpave mix design
procedure was introduced into use. It builds on the knowledge from Marshall and Hveem
procedures. The primary differences between the three procedures are the machine used to
compact the specimens and strength tests used to evaluate the mixes (3).
No matter which design procedure is used, the HMA mixture that is placed on the
roadway must have sufficient asphalt to ensure durability, enough stability to satisfy the
demands of traffic without displacement or distortion (rutting), sufficient voids to allow a
slight amount of added compaction under traffic loading without bleeding and loss of
stability, and enough workability to permit placement and proper compaction without
segregation (2).
Environmental factors such as temperature and moisture can have a profound effect
on the durability of hot mix asphalt pavements. When critical environmental conditions are
coupled with poor materials and traffic, premature failure may occur as a result of stripping
of the asphalt binder from the aggregate particles. When the aggregate tends to have a
preference for absorbing water, the asphalt is often “stripped” away. Stripping leads to loss in
quality of mixture and ultimately leads to failure of the pavement as a result of raveling,
rutting, or cracking (2, 13).
Furthermore, loaded wheel testers have gained popularity in recent years. The test
simulates the dynamics of heavy traffic loads by passing laboratory-scale wheels repeatedly
over a pavement surface to measure rutting resistance (9, 10, 11, 12, 13, 14, 15, 16).
Departments of Transportation are increasingly utilizing such tests to improve the
predictability of pavement rutting resistance (11)
MOTIVATION AND BENEFITS
Due to the extreme temperature conditions prevalent in North Dakota, the NDDOT
has used a number of Suppliers of modified asphalt binders including polymer modified and
partially air-blown asphalt binders. Since many states have precluded the use of air blown
asphalts for fear of artificial aging, the NDDOT is keen on knowing and comparing the
properties and performance of the HMA mixtures when different modified binders were
used. With the purchase and installation of the Asphalt Pavement Analyzer (APA) in the PI’s
laboratory a study was devised and conducted to evaluate and compare the hot mix asphalt
2

properties, and performance using Superpave mix design method in locally produced HMA
mixtures.
The primary benefit of the study is to evaluate the effectiveness of using various
asphalt binders on rut resistance and strength parameters of locally produced HMA mixtures.
The addition of lime to the Superpave mix may improve or worsen the pavement mix
performance; hence, the performance results of the various mixes with lime and without lime
will be examined and compared, if possible.
OBJECTIVES AND SCOPE
The main objectives of this research study are: (1) to evaluate the hot mix asphalt
properties and performance Superpave mix design methods utilizing polymer and non-
polymer modified asphalts as binders; and (2) to evaluate and compare the hot mix asphalt
properties and performance when adding 1% lime to the Superpave mix with polymer and
non-polymer modified asphalt binders.
In this research study, a Superpave mix design will be prepared using North Dakota’s
locally processed aggregates which meet the NDDOT specifications (Sections 816 and 410)
that have been historically employed for NDDOT projects. Polymer and non-polymer
modified asphalt binders from three suppliers will be used. Appropriate laboratory tests and
analysis will be done on the HMA mixes to evaluate the effect of the inherent binder
characteristics on the HMA properties and performance.
3
MATERIAL SELECTION AND TESTING BINDER AND AGGREGATE SELECTION
Three asphalt binders from three different sources were chosen for this study. One
asphalt binder was non-polymerized (air blown) and the other two were polymer modified.
All of the binders were taken from field samples and graded at PG 58-34. On the other hand,
the aggregates adopted for this study were from one source [Valley City District, Project NH-
2-281(025)049, Pit Location E ½ 27-138-64] and specified to meet the requirements of
Superpave mixes.
The properties of the selected binders were provided by the NDDOT asphalt
laboratory for proper documentation. The consensus and source properties of aggregates
were conducted on the Superpave blend. The test results are reported in the subsequent
sections.
ASPHALT BINDER TESTING Certification Method and Binder Control (16)
As a prescribe to the combined state binder group on certification method of
acceptance for asphalt binders, North Dakota Department of Transportation (NDDOT)
enjoys the benefits that all asphalt binder suppliers shall furnish all specification tests and
maintain acceptable quality control procedures. The supplier shall maintain the test records
and make them available to the designated representative for a period of five years. The
supplier shall also inspect each transport tank prior to loading to insure suitability for loading
and freedom from containments.
The NDDOT will continue to accept material from a supplier as long as the supplier
is determined to be satisfactorily complying with the procedures and that materials are
conforming to the requirements. However, if an acid modification process or a modifier (as
defined in AASHTO M 320), not including additives such as silicone, is used, the supplier
shall assign the modifying process with a unique name and type of modification to be
provided to the department for tracking and monitoring purposes. If an anti-strip agent is
added at the plant, the HMA producer is considered a supplier and must conform to the
requirements. Full test results with and without anti-strip in the asphalt binder at the required
4

dosage will be required before production begins. The department shall be notified of PG
grade and/or supplier changes.
Minimum sampling and testing are required from the supplier on annual, daily, and
bi-weekly basis. The minimum annual requirements by the certification method of
acceptance program for continuation of a supplier certification indicate that prior to the start
of the shipping season, adequate testing shall be performed to identify characteristics of tank
materials on-hand. Before or at the start of shipping, bi-weekly sample testing shall be
completed on a minimum of one sample for each grade of asphalt material anticipated to be
shipped to department projects. The facility annual inspections as well as the participation in
Combined State Binder Group “Round Robin” program are considered part of the
requirements.
As far as the daily requirements are concerned, sampling, testing, and reporting
requirements are involved. Taking one sample from the tank or blender representing each
grade of material shipped to state work is needed. For material shipped from tanks, the
sample may be taken from the tank, from the line during loading, or from the loaded
transport. Material produced from a blender may be sampled from the line during loading or
from the loaded transport. Performance grade testing: penetration, viscosity measurement, or
dynamic shear is required. The dynamic shear will be required if material is modified. The
reporting requirement involves sending a record of daily quality control results to the
department central laboratory on an approximate weekly basis.
Like the daily requirements, the Bi-Weekly requirements include sampling, testing,
and reporting activities. The sampling activities are similar to those mentioned for the daily
requirements. The test requirements include all of the tests listed in the schedule of tests for
performance graded binder material. The reporting activity requires sending a report of the
test results to the department central laboratory when completed.
NDDOT has the option to obtain samples at the source of supply (refinery/terminal).
The samples shall be taken by supplier personnel at the request and under observation of an
authorized department representative. The supplier shall have equipment and facilities
available to obtain samples safely.
Verification field samples will be obtained. NDDOT project personnel will observe
the contractor obtain random samples from material delivered to the job site. The sampling
5

rate will be a minimum of one sample for every 250 tons (225 Mg) for each supplier and
grade of asphalt cement, or fraction thereof.
A sample will consist of taking two 1-liter (one-quart) samples from the designated
transport. The first sample will be used for testing; the second sample will be a check. Both
samples will be sent to the NDDOT Central Lab. Samples will be identified with the
following information written on the can:
• Project Number-Field Sample Number
• Manifest Number-PG Grade
• Asphalt Supplier-Date
• Original or Check
Project personnel will also obtain samples as directed by the project engineer at any time
extra samples are determined to be necessary.
Asphalt Binder Properties
The approach to the PG system represents a change in philosophy. The specification
uses tests which evaluate the fundamental material properties (stress, strain, and strain rate).
Changes in asphalt properties due to temperature, rate of loading, and the effect of aging are
also considered. The specification requirement does not change, rather the temperature which
the specification value has to meet, changes with grade (1, 2).
The high temperature stiffness is measured with the dynamic shear rheometer (DSR)
using the binder in two different aging conditions. The RTFO-aged residue is checked to
ensure that the material has sufficient stiffness after mixing with the aggregate in the plant.
For fatigue cracking, the DSR is used a third time, to measure an intermediate stiffness on the
PAV-aged residual. This is a check to see how stiff the binder will be after it has been in
service for a period of time. For low temperature cracking the binder is aged in the PAV. The
binder is tested with the bending beam rheometer (BBR) for a maximum stiffness (≤ 300
MPa) and a minimum m-value (m ≥ 0.30).
Other miscellaneous requirements that have been used for years include viscosity,
flash point, solubility, and mass loss. The viscosity requirement obtained by the rotational
viscometer (also referred to as a Brookfield viscometer) is there to insure that the material
6

can be pumped properly. The flash point is there for safety reasons. Mass loss indicates the
amount of volatiles evaporating during the mixing and construction process (2).
The binder properties for this study (displayed in Table 1) were provided by the
NDDOT asphalt laboratory. The terms PM1, PM2, and NPM refer to polymer-modified
binder number 1, polymer-modified binder number 2, and non-polymer modified binder,
respectively.
Table 1 Properties of the selected Asphalt Binders
Binder Tests and Related Specifications
AASHTO Designation
PM1 2003
PM1 2005
NPM 2003
NPM 2004
PM2 2004
PM2 2005
Solubility Point ≥ 99.00% AASHTO T44 99.98 99.95 99.98 99.97 99.93 99.93
Flash Point ≥ 230 oC AASHTO T48 278 N/A 242 240 N/A N/A
Brookfield Viscosity Pa.s @ 135 oC ≤ 3.000
AASHTO T316-02 0.653 0.755 0.303 0.310 0.503 0.395
Brookfield Viscosity Pa.s @ 165 oC (for information only)
AASHTO T316-02 0.228 0.270 0.095 0.108 0.185 0.163
Original Binder DSR G*/sinδ ≥ 1.00 kPa @58.0 oC
AASHTO T315-02 1.590 1.673 1.244 1.305 1.394 1.349
RTFO Mass Loss (+ or -), ≤ 1%, Nearest 0.001%
AASHTO T240-00 - 0.357 - 0.449 - 0.993 - 0.875 - 0.685 - 0.690
RTFO Residue DSR G*/sinδ ≥ 2.20 kPa @16.0 oC
AASHTO T315-02 3.153 3.346 3.714 3.567 2.967 2.707
PAV Residue AASHTO R28-02 DSR (G*)(sinδ) ≤ 5000 kPa @58.0 oC
AASHTO T315-02 2070 2095 3552 3353 2674 2719
PAV Residue BBR Estimated Creep Stiffness @ 60 sec ≤ 300 MPa @ -24.0 oC
AASHTO T313-02 232 224 284 273 252 255
PAV Residue BBR m-slope @ 60 sec ≥ 0.300 @ -24.0 oC
AASHTO T313-02 0.329 0.326 0.308 0.315 0.316 0.306
As shown in the table above, all binders have met the specified specifications.
Therefore, there is no reason for concern or any reservation on using all the selected binders
for this study. The properties of each binder sampled from two different years were very
similar, thus, statistical analysis using analysis of variance (ANOVA) was performed on each
set of binders for validation. The null hypothesis, Ho, was that the mean values of the binder
properties from two different years were equal. The alternate hypothesis, H1, was that the
mean values of the binder properties from two different years were not equal. Failing to
reject the null hypothesis at the 5% significance level constituted validation.
7

The results of the ANOVA statistical analysis (as shown in Table 2 ) illustrate that the
p-value for each case was much larger than the 0.05 significance level (p > 0.05), which
means failure to reject the null hypothesis, thus the property values of each binder from two
different years were considered statistically the same.
Table 2 ANOVA Statistical Analysis on Binder Sample Properties from Different Years (a)PM1-2003 PM1-2005 Anova: Single Factor
99.98 99.95 SUMMARY0.653 0.755 Groups Count Sum Average Variance0.228 0.27 PM1-2003 9 2407.58 267.5084 463085.81.59 1.673 PM1-2005 9 2424.87 269.4301 474484.1
-0.357 -0.449 ANOVA3.153 3.346 Source of Variation SS df MS F P-value F crit2070 2095 Between Groups 16.61761 1 16.61761 3.54E-05 0.995323 4.494232 224 Within Groups 7500559 16 468784.9
0.329 0.326 Total 7500576 17(b)PM2-2004 PM2-2005 Anova: Single Factor
99.93 99.93 SUMMARY0.503 0.395 Groups Count Sum Average Variance0.185 0.163 PM2-2004 9 3030.61 336.7344 775408.41.394 1.349 PM2-2005 9 3078.16 342.0178 801899.6-0.685 -0.69 ANOVA2.967 2.707 Source of Variation SS df MS F P-value F crit2674 2719 Between Groups 125.6112 1 125.6112 0.000159 0.990087 4.494252 255 Within Groups 12618463 16 788654
0.316 0.306 Total 12618589 17(c )
NPM-2003 NPM-2004 Anova: Single Factor99.98 99.97 SUMMARY242 240 Groups Count Sum Average Variance
0.303 0.31 NPM-2003 9 4182.34 464.7048 13527980.095 0.108 NPM-2004 9 3970.39 441.1539 12041501.244 1.305 ANOVA-0.993 -0.875 Source of Variation SS df MS F P-value F crit3.714 3.567 Between Groups 2495.9 1 2495.9 0.001952 0.965304 4.4943552 3353 Within Groups 20455578 16 1278474284 273 Total 20458074 17
8

AGGREGATE TESTING
Once aggregate samples were obtained, several tests were conducted on individual
aggregate stockpiles and on the aggregate blend. Consensus and source properties, specific
gravities, percent absorption, and gradation were performed on the aggregate samples to test
the Superpave blends.
Consensus properties are those which the SHRP researches believed to be critical in
achieving high performance HMA (1, 2). These properties must be realized at various levels
depending on the traffic volume and positioning within the pavement (1, 2). These properties
include: coarse aggregate angularity (CAA), fine aggregate angularity (FAA), flat and
elongated particles, and clay content (or sand equivalence) (1, 2, 17, 18).
CAA is the percentage by weight of aggregate larger than 4.75 mm with one or more
fractured faces. This property ensures a high degree of aggregate internal friction and rutting
resistance. FAA is the percentage of air voids present in loosely compacted aggregates
smaller than 2.36 mm (or US Sieve #8). The FAA property ensures a high degree of fine
aggregate internal friction and rutting resistance. More fractured faces means higher void
content. The flat and elongated particles characteristic is the percentage of mass of coarse
aggregates that have a maximum to minimum dimension ratio greater than five. Flat and
elongated particles are undesirable because they have a tendency to break during construction
and loading. Clay content is the percentage of clay material contained in the aggregate
fraction that is finer that 4.75 mm (US #4) sieve. High clay content causes tender mixes (1, 2,
17, 18).
Source properties are those which agencies often use to qualify local sources of
aggregate. Although important, these properties are source specific, therefore SHRP does not
specify critical values. These properties include: toughness, soundness, and deleterious
materials.
Toughness is the percent loss of material from an aggregate blend during the Los
Angeles Abrasion test. Toughness test estimates the resistance of coarse aggregate to
abrasion and mechanical degradation during handling and construction while in service.
Soundness is the percent loss of material from an aggregate blend during the sodium or
magnesium sulfate soundness test. The soundness test estimates the resistance of aggregate to
in-service weathering (durability). Deleterious materials are defined as the mass percentage
9

of contaminants such as clay lumps, shale, wood, mica, and coal in the blended aggregate.
This is usually performed by placing the aggregate in a solution with a specific gravity of
1.95. When placed in this solution, the deleterious materials (basically shale) will float.
Toughness and shale tests were specified and examined in this study.
Aggregate specific gravities and gradations also play a crucial role in the HMA. To
specify aggregate gradation, Superpave utilizes a 0.45 power gradation chart with initial
control limits and a restricted zone (2, 17).
The aggregate tests conducted for this study that related to the Superpave blend were
(17, 18): splitting of aggregate samples using ASTM D75 and AASHTO T248; sieve analysis
of the fine and coarse aggregates using AASHTO T11 and T27; bulk specific gravity of fine
and coarse aggregates using AASHTO T84 and T85; lightweight pieces of aggregate using
AASHTO T113; coarse aggregate angularity according to NDDOT Field Sampling and
Testing Manual (one fractured face requirement); the L.A. Abrasion Test using AASHTO
T96; fine aggregate angularity using AASHTO T304; clay content using AASHTO T176;
and flat & elongated particles using ASTM D 4791.
Aggregate Properties
Specific gravities for coarse and fine aggregates, water absorption, and consensus
properties for individual stockpiles were conducted. Table 3 displays the aggregate bulk and
apparent specific gravities and absorption properties for individual stockpiles. Table 4 shows
the consensus aggregate properties for both individual stockpiles as well as the aggregate
blend. Table 5 illustrates additional aggregate blend properties.
By observing the above aggregate properties, one can conclude that the blend has met
and exceeded the consensus aggregate properties. The aggregate blend has enough crushed
material (%CAA = 100.0 > 75.0, and %FAA = 45.1 > 45.0) to help produce stable and rut
resistant mix. The blend also contains low clay content (% sand equivalence value = 59.0 >
40.0) that helps prevent a tender mix. The low percentage of flat & elongated pieces (1.1 <
10.0) gives the blend added stability without risk of breaking under traffic loading.
10

Table 3 Aggregate Properties for Individual Stockpiles
Agg #1 Agg #2 Agg #3 Agg #4 Rock Crushed Fines Nat. Fines 1 Nat. Fines 2 Bulk SpG (Gsb) Coarse 2.628 2.628 2.628 2.628 Fine 2.631 2.631 2.572 2.543 Apparent SpG (Gsa) Coarse 2.774 2.774 2.774 2.774 Fine 2.771 2.771 2.733 2.736 Water Absorption Coarse 2.000 2.000 2.000 2.000 Fine 1.920 1.920 2.280 2.770 Combined Bulk SpG (Gsb) 2.628 2.631 2.580 2.558 Apparent SpG (Gsa) 2.774 2.771 2.739 2.743 Water Absorption 1.998 1.924 2.235 2.588
Table 4 Consensus Aggregate Properties
Agg #1 Agg #2 Agg #3 Agg #4 Aggregate Properties
Rock Crushed Fines
Nat. Fines 1
Nat. Fines 2
Agg. Blend Spec’s
Fine Agg. Angularity (% FAA) 47.4 47.4 40.9 42.8 45.1 45 Min
Clay Content (% Sand Equivalent) 71 71 37 47 59.0 40 Min
Coarse Agg. Angularity (%) On Plus #4 Material 100.00 75 Min Thin & Elongated Pieces 1.1 10 Max
Table 5 Aggregate Blend Properties
Bulk SpG (Gsb) 2.607 Apparent SpG (Gsa) 2.762 Water Absorption (%) 2.108 Light Wt Particles (%) 1.14 Toughness (% Loss) 22.6
The aggregate blend has exceeded the toughness requirement (%loss =22.6 < 40.0)
and has very few light weight pieces (1.14% < 5.00%). Conversely, the percent water
absorption of 2.108 is relatively high. Overall, the aggregate blend used for this study has
met the Superpave aggregate requirements. Since the aggregate was kept the same
throughout this research study, there is no specific evaluation or comparisons to be made.
11
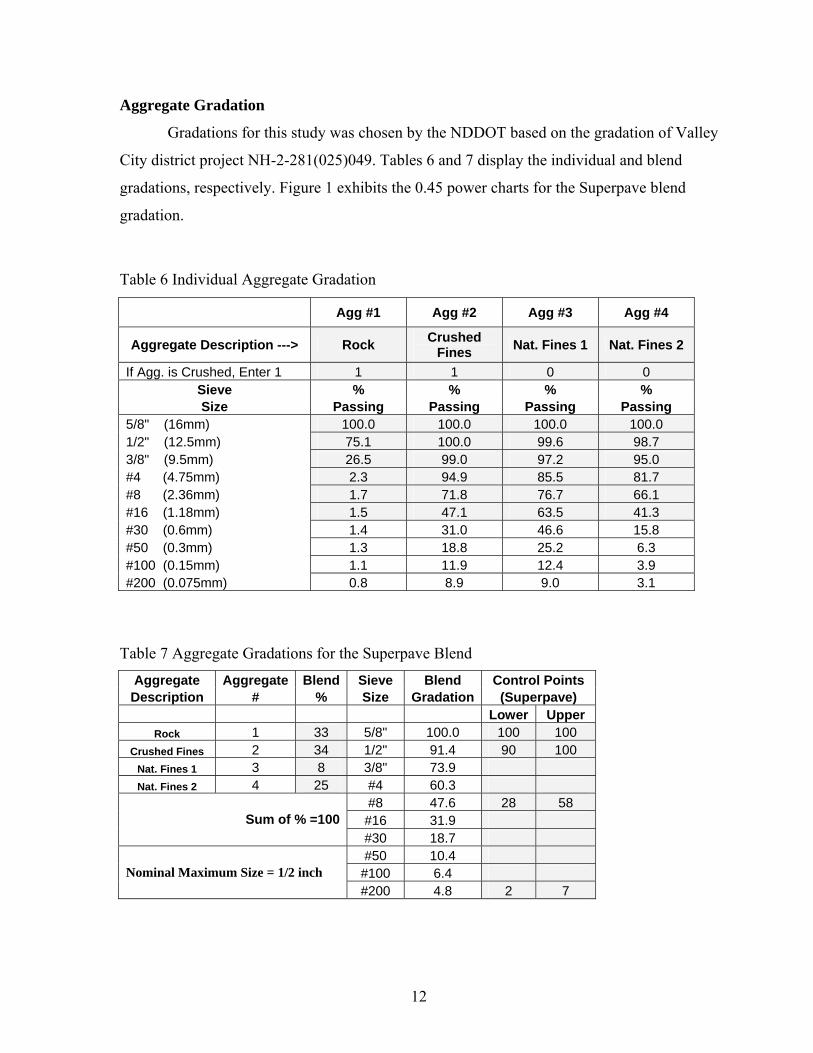
Aggregate Gradation
Gradations for this study was chosen by the NDDOT based on the gradation of Valley
City district project NH-2-281(025)049. Tables 6 and 7 display the individual and blend
gradations, respectively. Figure 1 exhibits the 0.45 power charts for the Superpave blend
gradation.
Table 6 Individual Aggregate Gradation
Agg #1 Agg #2 Agg #3 Agg #4
Aggregate Description ---> Rock Crushed Fines Nat. Fines 1 Nat. Fines 2
If Agg. is Crushed, Enter 1 1 1 0 0 Sieve % % % % Size Passing Passing Passing Passing
5/8" (16mm) 100.0 100.0 100.0 100.0 1/2" (12.5mm) 75.1 100.0 99.6 98.7 3/8" (9.5mm) 26.5 99.0 97.2 95.0 #4 (4.75mm) 2.3 94.9 85.5 81.7 #8 (2.36mm) 1.7 71.8 76.7 66.1 #16 (1.18mm) 1.5 47.1 63.5 41.3 #30 (0.6mm) 1.4 31.0 46.6 15.8 #50 (0.3mm) 1.3 18.8 25.2 6.3 #100 (0.15mm) 1.1 11.9 12.4 3.9 #200 (0.075mm) 0.8 8.9 9.0 3.1
Table 7 Aggregate Gradations for the Superpave Blend
Aggregate Aggregate Blend Sieve Blend Control Points Description # % Size Gradation (Superpave)
Lower Upper Rock 1 33 5/8" 100.0 100 100
Crushed Fines 2 34 1/2" 91.4 90 100 Nat. Fines 1 3 8 3/8" 73.9 Nat. Fines 2 4 25 #4 60.3
#8 47.6 28 58 #16 31.9 Sum of % =100#30 18.7 #50 10.4
#100 6.4 Nominal Maximum Size = 1/2 inch #200 4.8 2 7
12

0.45 Power Chart
0
10
20
30
40
50
60
70
80
90
100
Sieve Size (mm^0.45)
% P
assi
ng
Lower Control Point Upper Control Point MDL Blend Gradation
Figure 1 The 0.45 Power Chart for the Aggregate Blend Gradation
13

LABORATORY MIX DESIGN AND ANALYSIS
Volumetric calculations are the foundation of any good mix design. As with
aggregates, it is the specific gravities of materials which define the relationships between
mass and the volume it occupies. Air voids, VMA, and voids filled with asphalt (VFA) are
the volumetric measurements which are used in mix design calculations (1, 2, 3). Mass
determinations are usually simple and can be done by placing a material on a scale and
reading the mass. However, determining volumes can be very difficult. Since the aggregate
has surface voids, some of the asphalt fills a portion of these voids. The remainder of the
asphalt remains on the surface of the aggregate. This is the asphalt that is available for
“sticking” the aggregate together and is referred to as the “effective” asphalt. When the
sample is compacted, the total volume will also contain a percentage of air voids (Va). VMA
is the sum of the air voids and the volume of effective asphalt (i.e., the asphalt film). VFA is
the volume of the effective asphalt and is expressed as the percent of the VMA which is
asphalt. Since specific gravities relate mass to volume, their role in volumetric calculations is
very important (1, 2).
This research study entailed six mix designs: three Superpave and three Superpave
mix designs with the addition of 1% lime (Superpave-L). The aggregate blend used was the
same in all the mix designs (Superpave with FAA ≥ 45). The binder grade was also the same
in all of the mix designs (PG 58-34). Each set of three mix designs included binders from
three different sources: two polymer modified (PM1 and PM2), and one without polymer
modification (NPM).
Several measurements and calculations were performed to obtain the various
mixtures’ volumetric properties. The methods used were consistent with the modified
procedures of the NDDOT Field Sampling and Testing Manual. The volumetric results and
their specifications are presented in the following subsections.
SUPERPAVE MIX DESIGN RESULTS
Superpave is a mixture design procedure for HMA pavements that was developed
from the Strategic Highway Research Program (SHRP) with the potential to simulate the
actual conditions in the field such as traffic loading and short term aging of the mix before
14

compaction. The Superpave gyratory compactor (SGC) uses 150 mm molds to allow for
larger aggregates, and monitors compaction throughout the process providing a measure of
how the mix will compact during construction. The gyratory equipment could also be used
for field quality control purposes (1, 2, 3).
After mixing, short term aging of 2 hours is used to simulate what is happening in the
hot mix plant during the mixing, storage and placement operations. Mixing and compaction
temperatures are dependent on binder viscosity, especially in the case of polymer
modification (2).
Using the measured bulk specific gravity of the final specimen and the recorded
change in height during compaction, the change in density (%Gmm) with number of
gyrations can be calculated and plotted on a semi-log scale. A smooth sided cylinder is
assumed initially and then later corrected based on the measured value for specific gravity.
There are three critical points (Ninitial, Ndesign, and Nmaximum) on the SGC
compactor curve that are evaluated in Superpave (1, 2). Ninitial is of importance because it is
desirable not to have mixes that compact too easily (2). Nmaximum is also important to
prevent having mixes that continue to compact under traffic loading (2). The level of
Ndesign is based on the climate and traffic levels (1, 2). For this study, Ninitial, Ndesign, and
Nmaximum were 7, 75, and 115 gyrations, respectively. These numbers correspond to traffic
levels of 0.3 to < 3.0 million ESALs.
The results of the void analysis and mix properties for Superpave and Superpave-L
mixes are displayed in the Tables and Figures below. Tables 8 and 9 show the voids analysis
for Superpave and Superpave-L mixes at 5.0, 5.5, 6.0, and 6.5 AC contents, respectively.
Tables 10 and 11 present the mix properties at the design (optimal) AC for Superpave and
Superpave-L, respectively. The terms PM1, PM2, and NPM refer to the mix designs (design
cases) that include the corresponding binder. PM1-L, PM2-L, and NPM-L refer to the mix
designs (design cases) that include the corresponding binder with the addition of 1% lime.
Figure 2 shows the plots of unit weight, air voids, VMA, VFA, % Gmm @ Ninitial, and the
theoretical maximum specific gravity versus %AC content for PM1 Superpave mix design.
The remainders of the plots are included in Appendix B and Appendix C. Discussion of the
analysis results will follow.
15

Table 8 Voids Analysis of Superpave Mixes @ Ndes for Various Binder Contents Superpave Mix Designs Properties @ Different AC Contents
AC Content (%) 5.0 5.5 6.0 6.5 PM1
Bulk Specific Gravity of the Mix (Gmb) 2.301 2.326 2.366 2.379 Percent Aggregate 95 94.5 94 93.5 Theor. Maximum SpG of Mix (Gmm) 2.484 2.462 2.454 2.437 Air Voids, Va (%) 7.3 5.5 3.6 2.4 Voids in Mineral Agg. (VMA) 16.1 15.7 14.7 14.7 Voids in Mineral Agg. Filled (VFA) 54.6 64.9 75.8 83.7
PM2 Bulk Specific Gravity of the Mix (Gmb) 2.261 2.289 2.301 2.345 Percent Aggregate 95 94.5 94 93.5 Theor. Maximum SpG of Mix (Gmm) 2.449 2.429 2.396 2.385 Air Voids, Va (%) 7.7 5.7 4.0 1.7 Voids in Mineral Agg. (VMA) 17.6 17.0 17.0 15.9 Voids in Mineral Agg. Filled (VFA) 56.5 66.3 76.7 89.5
NPM Bulk Specific Gravity of the Mix (Gmb) 2.297 2.343 2.379 2.402 Percent Aggregate 95 94.5 94 93.5 Theor. Maximum SpG of Mix (Gmm) 2.496 2.490 2.463 2.447 Air Voids, Va (%) 8.0 5.9 3.4 1.9 Voids in Mineral Agg. (VMA) 16.3 15.1 14.2 13.9 Voids in Mineral Agg. Filled (VFA) 51.2 60.9 75.9 86.6
Table 9 Voids Analysis of Superpave-L Mixes @ Ndes for Various Binder Contents
Superpave-L Mix Designs Properties @ Different AC Contents AC Content (%) 5.0 5.5 6.0 6.5
PM1-L Bulk Specific Gravity of the Mix (Gmb) 2.298 2.325 2.340 2.346 Percent Aggregate 95 94.5 94 93.5 Theor. Maximum SpG of Mix (Gmm) 2.484 2.459 2.433 2.420 Air Voids, Va (%) 7.5 5.4 3.8 3.1 Voids in Mineral Agg. (VMA) 16.3 15.7 15.6 15.9 Voids in Mineral Agg. Filled (VFA) 54.1 65.4 75.6 80.7
PM2-L Bulk Specific Gravity of the Mix (Gmb) 2.289 2.317 2.359 2.343 Percent Aggregate 95 94.5 94 93.5 Theor. Maximum SpG of Mix (Gmm) 2.473 2.453 2.451 2.426 Air Voids, Va (%) 7.4 5.5 3.7 3.4 Voids in Mineral Agg. (VMA) 16.6 16.0 14.9 16.0 Voids in Mineral Agg. Filled (VFA) 55.2 65.4 75.0 78.6
NPM-L Bulk Specific Gravity of the Mix (Gmb) 2.296 2.316 2.358 2.343 Percent Aggregate 95 94.5 94 93.5 Theor. Maximum SpG of Mix (Gmm) 2.479 2.466 2.451 2.437 Air Voids, Va (%) 7.4 6.1 3.8 3.9 Voids in Mineral Agg. (VMA) 16.3 16.1 15.0 16.0 Voids in Mineral Agg. Filled (VFA) 54.9 62.1 74.7 75.8
16

Table 10 Mix Properties at Recommended Asphalt Content for Superpave Mixes Mix Properties PM1 PM2 NPM Specification
Optimum AC (%) 5.8 6.0 5.8 Density (pcf) 147.0 143.6 148.0 Air Voids (%) 4.0 4.0 4.0 3.0-5.0 VMA (%) 14.7 17.0 14.6 14.0 Min VFA (%) 73.0 76.7 69.9 65.0-78.0 %Gmm @ Ninitial 87.9 87.8 87.5 89.0 Max %Gmm @ Nmaximum 95.6 98.5 94.6 98.0 Max AC Film Thickness (m) 9.5 11.5 9.0 7.5-13.0 Dust/Effective AC Ratio 1.0 0.8 1.1 0.6-1.3 Asphalt Absorption (%) 1.16 0.34 1.43 Maximum SpG @ Ndes 2.454 2.397 2.462 Effective (Gme) 2.686 2.630 2.705 Table 11 Mix Properties at Recommended Asphalt Content for Superpave-Lime
Mix Properties PM1-L PM2-L NPM-L Specification Optimum AC (%) 6.0 5.9 5.9 Density (pcf) 146.0 146.7 146.7 Air Voids (%) 4.0 4.0 4.0 3.0-5.0 VMA (%) 15.6 15.1 15.2 14.0 Min VFA (%) 75.0 73.1 72.2 65.0-78.0 %Gmm @ Ninitial 87.5 87.4 86.9 89.0 Max %Gmm @ Nmaximum 97.4 97.4 97.5 98.0 Max AC Film Thickness (m) 10.3 10.0 9.8 7.5-13.0 Dust/Effective AC Ratio 0.9 1.0 1.0 0.6-1.3 Asphalt Absorption (%) 0.97 1.01 1.15 Maximum SpG @ Ndes 2.437 2.449 2.449 Effective (Gme) 2.673 2.676 2.686
17

Unit Weight Vs % AC
140.0
145.0
150.0
5.0 5.5 6.0 6.5
% AC by Weight of Mix
Uni
t Wei
ght (
lbs)
Air Voids Vs % AC
2.03.04.05.06.07.08.0
5.0 5.5 6.0 6.5
% AC by Weight of Mix
% A
ir V
oids
- Tot
al
Mix
VMA Vs % AC
14.5
15.5
16.5
5.0 6.0 6.5% AC by Weight of Mix
Voi
ds in
Min
eral
A
ggre
gate
(VM
A)
VFA Vs % AC
50.0
60.0
70.0
80.0
90.0
5.0 5.5 6.0 6.5
% AC by Weight of Mix
% A
ggre
gate
Voi
ds
Fille
d (V
FA)
%Gmm at Nini Vs % AC
84.085.086.087.088.089.090.0
5.0 5.5 6.0 6.5
% AC by Weight of Mix
% G
mm
at N
initi
al
Theo. Max. SpG Vs % AC
2.420
2.440
2.460
2.480
2.500
5.0 5.5 6.0 6.5
% AC by Weight of Mix
Avg
The
oret
ical
Max
S
pG
Figure 2 Graphs for PM1 Superpave Mix Design at Various %AC
18
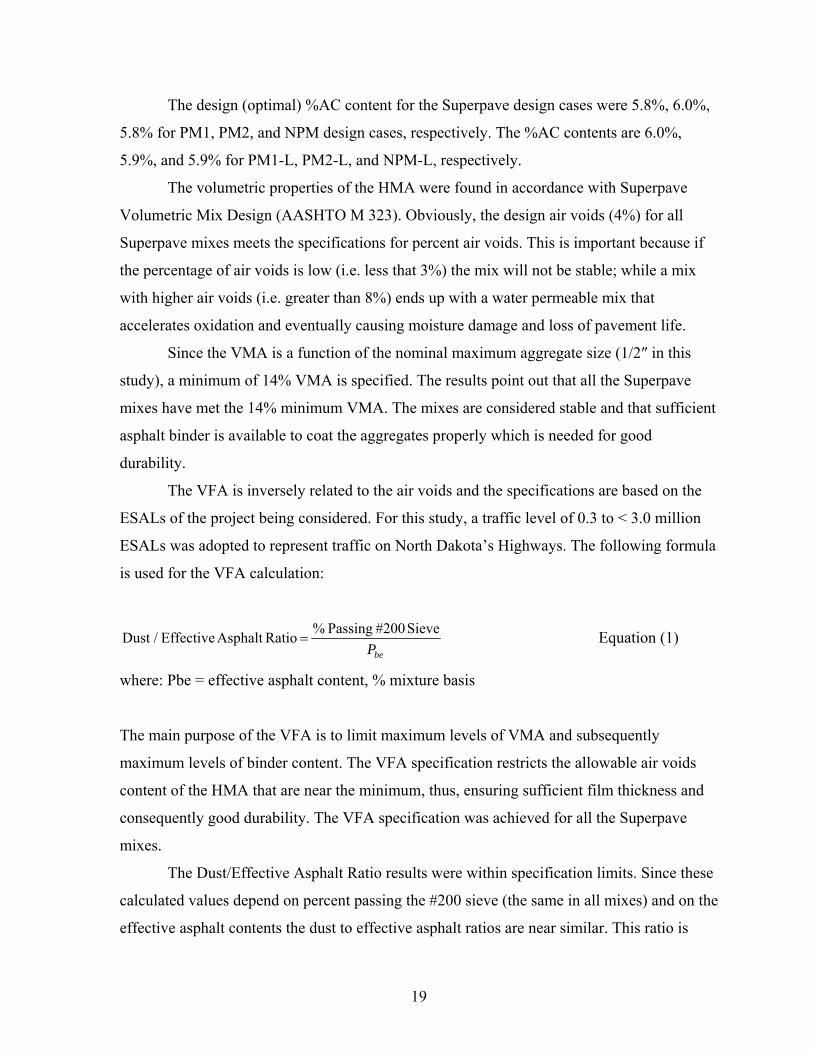
The design (optimal) %AC content for the Superpave design cases were 5.8%, 6.0%,
5.8% for PM1, PM2, and NPM design cases, respectively. The %AC contents are 6.0%,
5.9%, and 5.9% for PM1-L, PM2-L, and NPM-L, respectively.
The volumetric properties of the HMA were found in accordance with Superpave
Volumetric Mix Design (AASHTO M 323). Obviously, the design air voids (4%) for all
Superpave mixes meets the specifications for percent air voids. This is important because if
the percentage of air voids is low (i.e. less that 3%) the mix will not be stable; while a mix
with higher air voids (i.e. greater than 8%) ends up with a water permeable mix that
accelerates oxidation and eventually causing moisture damage and loss of pavement life.
Since the VMA is a function of the nominal maximum aggregate size (1/2″ in this
study), a minimum of 14% VMA is specified. The results point out that all the Superpave
mixes have met the 14% minimum VMA. The mixes are considered stable and that sufficient
asphalt binder is available to coat the aggregates properly which is needed for good
durability.
The VFA is inversely related to the air voids and the specifications are based on the
ESALs of the project being considered. For this study, a traffic level of 0.3 to < 3.0 million
ESALs was adopted to represent traffic on North Dakota’s Highways. The following formula
is used for the VFA calculation:
bePSieve #200 Passing %RatioAsphalt EffectiveDust / = Equation (1)
where: Pbe = effective asphalt content, % mixture basis
The main purpose of the VFA is to limit maximum levels of VMA and subsequently
maximum levels of binder content. The VFA specification restricts the allowable air voids
content of the HMA that are near the minimum, thus, ensuring sufficient film thickness and
consequently good durability. The VFA specification was achieved for all the Superpave
mixes.
The Dust/Effective Asphalt Ratio results were within specification limits. Since these
calculated values depend on percent passing the #200 sieve (the same in all mixes) and on the
effective asphalt contents the dust to effective asphalt ratios are near similar. This ratio is
19

proportional to the air voids in the mixture and aids in the quality of the HMA by producing
mastic that is neither very stiff nor very soft.
The Film Thickness was calculated from the following formula:
)(100)4885(
SAP
FT be= , Equation (2)
where:
SA = surface area of aggregates passing #4 sieve, and
Pbe = effective asphalt content, % mixture basis
The low value of the specification is designed to ensure sufficient asphalt binder covering the
aggregates, thus improving durability. The upper value of the specification is to safeguard
from excessive asphalt binder that may drain down or cause bleeding. The results show that
all Superpave mixes were with limits of this specification.
The %Gmm @ Nini and Nmax were also within specification limits except for PM2.
The %Gmm @ Nini is a measure of consolidation at a low number of gyrations. The
specification limit of 89% is specified to ensure that the mix does not compact too easily.
Mixes that compact easily are usually tender or unstable. Therefore, this parameter is a
performance indicator of the aggregate and binder properties.
The %Gmm @ Nmax specifies the %Gmm (consolidation) at a high number of
gyrations. The importance of this parameter is to prevent having mixes that continue to
compact under traffic loading. Therefore, this parameter works as a safety factor if traffic
levels increase. The %Gmm @ Nmax for PM2 was 98.5% which exceeded the 98.0%
specification. This was the only violation of the mix properties.
20

LABORATORY PERFORMANCE TESTING AND ANALYSIS
Since the Superpave mixture design and analysis system was developed under the
Strategic Highway Research Program (SHRP), many highway agencies in the United States
have adopted the volumetric mixture design method (1, 2). There is no current strength test to
compliment the volumetric mixture design method. The addition of a torture test to evaluate
the rutting potential of an asphalt mixture would be welcomed by industry and DOT
practitioners (1, 2, 3).
It has been recognized that the fundamental tests are very complex while simulative
tests are relatively easy to perform. The Asphalt Pavement Analyzer, first manufactured in
1996 by Pavement Technology, Inc, is an automated, new generation of Georgia Load Wheel
Tester (GLWT). The APA has been used to evaluate rutting, fatigue, and moisture resistance
of HMA mixtures (9, 10, 11). In this study, testing with the APA was conducted according to
63-03 “Standard Method of Test for Determining Rutting Susceptibility of Asphalt Paving
Mixtures,” a provisional AASHTO designation with modifications to accommodate NDDOT
project requirements (9, 10, 11, 12, 13, 14, 15).
In this study, Superpave specimens were tested at 58oC, corresponding with the high
temperature of the binder’s performance grades. Testing was carried out to 8,000 cycles for
dry condition and 25,000 cycles for submerged (wet) condition. Specimens were conditioned
in a 58oC water bath for 24 hours before moisture susceptibility testing. All specimens were
prepared at 7.0 ± 0.5% air voids to conform to new construction field density conditions.
Moisture susceptibility is an HMA mixture's tendency toward stripping (2). Stripping
is the loss of bond between the asphalt and aggregate. To combat moisture susceptibility,
proper mix design is essential. If a mix is properly designed, but not compacted correctly, it
still may be susceptible to moisture damage. An HMA design should be tested in a situation
where moisture does infiltrate air voids of the mixture. For this reason many tests are
performed at 7% air voids (2).
The modified Lottman Test (or TSR) was used to test resistance of compacted
bituminous mixtures to moisture induced damage (AASHTO T283) on Marshall specimens
at 7.0 ± 0.5% air voids. TSR value of less than 70% is considered to be moisture susceptible.
21

The NDDOT modified procedure according to Field Sampling and Testing Manual was used
for this study. The TSR results were then compared with the APA results.
APA RESULTS AND ANALYSIS
The APA performance results for the Superpave and Superpave-L mix designs are
shown in Table 12 and Figure 3 below. The numbers 1 through 72 in Table 12 represent the
specimens used for all the design cases. For example, the numbers 1 through 6 represent the
specimens used in testing the PM1 design case; where specimens 1 and 2 were placed under
the left wheel, specimens 3 and 4 were placed under the center wheel, and specimens 5 and 6
were placed under the right wheel. The values shown represent the rut depth (in mm) under
the corresponding wheel of the APA.
Table 12 APA Performance Results for the Various Design Cases Design Left Side Depth Center Depth Right Side Depth AVE Cases (mm) (mm) (mm) (mm)
1 2 3 4 5 6 PM1 Dry 4.106 4.400 3.568 4.081 4.354 4.592
4.183
7 8 9 10 11 12 PM2 Dry 4.965 4.528 4.607 4.725 4.416 4.945 4.698
13 14 15 16 17 18 NPM Dry 4.171 4.520 5.026 5.418 3.396 3.492
4.337
19 20 21 22 23 24 PM1-L Dry 4.411 4.418 3.946 4.427 4.148 3.849
4.200
25 26 27 28 29 30 PM2-L Dry 4.365 4.068 3.710 4.182 4.325 4.398 4.175
31 32 33 34 35 36 NPM-L Dry 4.735 5.546 4.913 5.028 4.898 4.768 4.981
37 38 39 40 41 42 PM1 Wet 5.536 5.375 6.805 7.117 5.669 4.904
5.901
43 44 45 46 47 48 PM2 Wet 6.221 5.707 5.620 5.212 5.297 6.281 5.723
49 50 51 52 53 54 NPM Wet 5.585 5.697 8.413 8.960 7.031 7.134
7.137
55 56 57 58 59 60 PM1-L Wet 5.814 5.750 6.324 5.818 4.854 5.251
5.635
61 62 63 64 65 66 PM2-L Wet 5.030 5.434 5.021 5.303 4.818 4.989 5.099
67 68 69 70 71 72 NPM-L Wet 6.777 7.183 7.498 7.864 6.687 6.154 7.027
22

0.000
1.000
2.000
3.000
4.000
5.000
6.000
7.000
8.000A
PA A
ve R
ut D
epth
(mm
)
PM1 Dry
PM2 Dry
NPM Dry
PM1-L D
ry
PM2-L D
ry
NPM-L D
ry
PM1 Wet
PM2 W
et
NPM Wet
PM1-L W
et
PM2-L W
et
NPM-L W
et
Design Cases
APA Performance Results
Figure 3 APA Average Performance Results for the Different Design Cases
The Analysis of Variance (ANOVA) statistical analysis was performed on all the
APA results, the wet versus dry, and the lime versus no lime subsets. The ANOVA statistical
analysis of the APA results is presented in Table 13 below. The null hypothesis is given as,
Ho: the means of the results are equal. On the other hand, the alternate hypothesis, H1: the
means of the results are not equal. Rejection of the null hypothesis indicates that the results
are significantly different and can be compared.
Observation of the statistical results indicates that the P-value is less than the
significance value (P < 0.05); therefore, the null hypothesis is rejected. This means that the
results within all the subsets of wet versus dry, dry versus dry, and wet versus wet whether
with lime or with no lime added are significantly different and can be compared.
23

Table 13 Analysis of Variance (ANOVA) Statistics on the APA Results SUMMARY
Groups Count Sum Average VariancePM1 Dry 6 25.101 4.1835 0.1276335PM2 Dry 6 28.186 4.697666667 0.049946267NPM Dry 6 26.023 4.337166667 0.660766567PM1-L Dry 6 25.199 4.199833333 0.066798967PM2-L Dry 6 25.048 4.174666667 0.067210267NPM-L Dry 6 29.888 4.981333333 0.087766267PM1 Wet 6 35.406 5.901 0.7507212PM2 Wet 6 34.338 5.723 0.202566NPM Wet 6 42.82 7.136666667 1.889010667PM1-L Wet 6 33.811 5.635166667 0.262178567PM2-L Wet 6 30.595 5.099166667 0.051149367NPM-L Wet 6 42.163 7.027166667 0.377394967
ANOVASource of Variation SS df MS F P-value F crit
Between Groups 72.85695494 11 6.62335954 17.30412517 9.3561E-15 1.952212614Within Groups 22.965713 60 0.382761883
Total 95.82266794 71
In comparing the results, the APA performance specification adopted in this study is
an average of 7 mm rut depth under the APA wheels (for traffic levels of 0.3 to < 3 million
design ESALs). The expression wet here refers to a 24-hour submersion in a 58 oC water
bath followed by APA testing (also submerged at 58 oC). The 58 oC was chosen because it is
the high temperature of the binder grade (PG 58-34).
The results indicate that each single binder performed better when tested dry rather
than wet (or conditioned). The 24-hour conditioning effect can be seen when comparing wet
versus dry results.
Traditionally, the addition of lime tends to improve the mix properties when moisture
is present (durability), and sometimes the lime stiffens the dry mix. In this study, the results
suggest that the addition of lime in Superpave mix design has improved the mix performance
in dry and wet samples for the polymer modified cases. For non polymer modified, the
addition of lime slightly improved the wet case but was unfavorable in the dry case.
24

MOISTURE SENSITIVITY RESULTS AND ANALYSIS
AASHTO accepted the Modified Lottman Test (AASHTO T-283) in 1985. It is a
combination of the Lottman Test, and the Tunnicliff and Root Test. The AASHTO T-283, as
modified by the NDDOT Field Sampling and Testing Manual, was adopted for this study.
The specimens were produced using the conventional Marshall Mix Design method. Six
specimens were produced with air voids of 7.0 ± 0.5%. The higher percentage of air voids
helps to accelerate moisture damage on the cores. Two groups of three specimens were used.
The first group is the control group (dry). The second group is vacuum saturated between 70
and 80 percent and is placed in a water bath at 140°F (60°C) for 24 hours. After conditioning,
the indirect tensile strength (ITS) test was performed. The ITS Test was performed on both
the dry and conditioned specimen sets at 77°F (25°C) with a loading rate of 2 in/min. The
minimum acceptable TSR used is 70%.
The moisture sensitivity test results for each mix design case are shown in Table 14
and graphically plotted in Figures 4 and 5. The wet and dry strengths are given in pounds per
square inch (psi) units, and the TSR values are in percentage (%).
All mix designs passed the TSR metric of 70%. The addition of lime has improved all
the mix design cases (PM1, PM2, and NPM) by 12%, 2%, and 7%, respectively. The wet
strength of the PM1, PM2, and NPM cases were influenced by the addition of lime by 8%,
3%, and 15%. The dry strengths of the same designs have also been affected by the addition
of lime by -3%, 1%, and 7%, respectively.
Generally, TSR values have improved in all the cases with varying degree of
increase. The wet strength has also improved with the addition of lime, but the dry strength
produced mixed results.
25

Table 14 Moisture Sensitivity Test Results Date Binder Wet Strength (psi) Dry Strength (psi) TSR (%)
30-May PM1 69.5 88.0 79.030-May PM2 55.0 62.5 87.930-Jun NPM 55.7 66.4 83.98-Jun PM1-L 75.2 85.4 88.1
30-May PM2-L 56.8 63.1 90.030-May NPM-L 64.1 71.1 90.1
Modified Lottman Test Strength Results
0.0
10.0
20.0
30.0
40.0
50.0
60.0
70.0
80.0
90.0
100.0
PM1 PM2 NPM PM1-L PM2-L NPM-L
Mix Design Cases
Stre
ngth
(psi
)
Wet Strength (psi)Dry Strength (psi)
Figure 4 Moisture Sensitivity Strength Results
26

Modified Lottman Test (TSR) Results
72.0
74.0
76.0
78.0
80.0
82.0
84.0
86.0
88.0
90.0
92.0
PM1 PM2 NPM PM1-L PM2-L NPM-LMix Design Cases
%TS
R
TSR
Figure 5 Moisture Sensitivity Test (TSR) Results
27
SUMMARY, CONCLUSIONS AND RECOMMENDATIONS
Several laboratory tests, data analysis, and result comparisons were carried out to
complete this research study. First, the aggregate and the binders were selected. The
aggregate was obtained from Valley City District project and considered constant for all mix
designs. The asphalt binders were obtained from field tanks and provided by the NDDOT.
The binder types included two polymer modified (PM1 and PM2) and one non polymer
modified (NPM) asphalt binders.
Second, the aggregate and binder properties were tested. Aggregates consensus and
source properties were within specification limits for Superpave blends. Binder properties
also conformed to the PG binder specifications.
Third, mix designs were conducted and tested, and then volumetric properties were
calculated and analyzed. Three Superpave mix designs were established based on the three
binder types. Three Superpave-L mix designs were also conducted from the same binders and
the addition of 1% lime. Volumetric properties suggest that all mix designs were within their
prospected specifications. The importance of key properties was discussed.
Fourth, the APA was used to test the performance of the Superpave mixes, while
moisture sensitivity was used to test the performance of the Marshall mixes. Statistical
analysis was performed on the APA results and found that the data results were significantly
different and can be compared. A 7 mm depth specification was adopted for this study (9).
Observation of the APA results indicates that dry samples performed better than wet
samples. The addition of lime in the Superpave mix design has improved the mix
performance in wet samples. In dry samples, the effect of lime on the mix was not conclusive
with little or no improvement in the polymer modified and non polymer modified cases. The
HMA that contained polymer modified binder outperformed the one without polymer
modification in all the design cases. Examining and comparing the polymer modified cases
shows that PM1 slightly outperforms PM2 in dry cases (with or without lime) while PM2
outperforms PM1 design cases in wet conditions (with or without lime). Generally all the
design cases pass the 7 mm specification. The wet NPM design cases lie slightly above or
below the specification.
28

Inspection of the moisture sensitivity test results indicate that all the mix design cases
have passed the TSR metric of 70%. The TSR values have improved with the addition of
lime in all the design cases with varying degrees. The wet strength has also improved with
the addition of lime, but the dry strength produced mixed results.
The HMA with a non polymer modified binder has generally performed well
according to the APA depth metric and moisture sensitivity results. The PI does not
recommend precluding their use based on this study. However, the HMA with polymer
modification has outperformed the one with non modified binder.
The results of this study indicate that the addition of a small percentage of lime does
help the mix against moisture damage. Attention should be made so that the %Gmm @
Nmax must not exceed 98%. Accounting for the lime as part of the dust in the aggregate
blend could be more appropriate. Further experimentation with lime is needed to determine
the strength gain as the lime is allowed to cure.
29

REFERENCES 1. Asphalt Institute. Superpave Mix design. Asphalt Institute Superpave Series No. 2 (SP-2).
Lexington, Ky, 1996. 2. Roberts, F. L., P. S. Kandhal, E. R. Brown, D. Y. Lee, and T. W. Kennedy. Hot Mix
Asphalt Materials, Mixture Design, and Construction. National Asphalt Pavement Association (NAPA) Research and Education Foundation, Lanham, MD, 1996.
3. NCHRP. Characterization of Modified Asphalt Binders in Superpave Mix Design.
NCHRP Report No. 459. NCHRP, Transportation Research Board, 2001. 4. Kim, S., and S. Sargand. Performance Evaluation of Polymer Modified Superpave Mixes
Using Laboratory Tests And Accelerated Pavement Load Facility. CD-ROM. Transportation Research Board, National Research Council, Washington, D.C., 2003.
5. Sirin, O., H. Kim, M. Tia, B. Choubane, and T. Byron. Evaluation of Rutting Resistance
of Superpave Mixtures With and Without SBS Modification by Means of Accelerated Pavement Testing. CD-ROM. Transportation Research Board, National Research Council, Washington, D.C., 2003.
6. Knorr, D., Jr., R. Davison, and C. Glover. The Effect of Various Aging Techniques on
Asphalt Low-Temperature Properties. CR-ROM. Transportation Research Board, National Research Council, Washington, D.C., 2002.
7. Juristyarini, P., and R. Davidson. Development of an Asphalt Aging Procedure to Assess
Long-Term Binder Performance. CD-ROM. Transportation Research Board, National Research Council, Washington, D.C., 2003.
8. NDDOT. Standard Specifications for Road and Bridge Construction. Volume 1 of 2.
Prepared by the North Dakota Department of Transportation (NDDOT), Bismarck, ND, 2002.
9. Kandhal, P. S., and L. A. Cooley, Jr. Accelerated Laboratory Rutting Tests: Evaluation of
the Asphalt Pavement Analyzer. NCHRP Report 508. NCHRP, Transportation Research Board, 2003.
10. Kandhal, P., and R. Mallick. Evaluation of Asphalt Pavement Analyzer (APA) For HMA
Mix Design. National Center for Asphalt Technology (NCAT) Report 99-4, Auburn University, Alabama, 1999.
11. Cooley, L. A. Jr., P. S. Kandhal, M. Buchanan, F. Fee, and A. Epps. Loaded Wheel
Testers in the United States: State of the Practice. Transportation Research E-Circular No. E-C016 and NCAT Report 2000-4, Auburn University, Alabama, 2002.
30

12. Uzarowski, L., M. Paradis, and P. Lum. Accelerated Performance Testing of Canadian Asphalt Mixes Using Three Different Wheel Rut Testers. In the Accelerated Field and Laboratory Pavement Testing. CD-ROM. Transportation Association of Canada, 2004.
13. West, R., and L. A. Cooley, Jr. Evaluation of Asphalt Pavement Analyzer for Moisture
Sensitivity Testing. NCAT Report 04-04, Auburn University, Alabama, 2004. 14. Zhang, J., L. A. Cooley, Jr., and P. S. Kandhal. Comparison of Fundamental and
Simulative Test Methods for Evaluating Permanent Deformation of Hot Mix Asphalt. NCAT Report 02-07, Auburn University, Alabama, 2002.
15. Kandhal, P. S., and L. A. Cooley, Jr. Evaluation of Permanent Deformation of Asphalt
Mixtures Using Loaded Wheel Tester. NCAT Report 2002-08. Auburn University, Alabama, 2002.
16. Combined State Binder Group. Certification Method of Acceptance for Asphalt Binders.
North Central Superpave Center, Purdue University, West Lafayette, IN. http://bridge.ecn.purdue.edu/~spave/Round%20Robin/CSBG_2005_Document.pdf. Accessed August 2005.
17. NDDOT. Field Sampling and Testing Manual. Prepared by the North Dakota Department
of Transportation (NDDOT), Materials and Research Division, Bismarck, ND, 2000. 18. AASHTO. Standard Specifications for Transportation Materials and Methods of
Sampling and Testing. Parts 1A and 1B: Specifications. American Association of State Highway and Transportation Officials, Washington, D.C., 2004.
31

APPENDECIES
32

APPENDIX A
Aggregates Properties and Gradations
33

A-1 General Information – Aggregate / Superpave GENERAL INFORMATION and AGGREGATE GRADATIONS/BLENDSUPERPAVE MIX DESIGNDepartment of Transportation, Materials and Research (Rev. 7-04)
GENERAL INFORMATION
Enter data in shaded boxes.Absent sieve calculator is at the bottom of the sheet.
Project: NDDOT Phase 1 Pit #1 Location: E 1/2 27-138-64Pit #2 Location:
Location: UND Pit #3 Location:District: Pit Owner(s): Richard KloseCounty:Date (MM/DD/YY): 3/4/05
AC Specific Gravity: 1.03Lab Number: Project Spec (408 or 409) 410 SuperpaveType of AC (Top Lift): PG 58-34 Length of Project:Type of AC (Bot. Lift): PG 58-34 Asphalt Supplier: CenexLetting Date: 11/21/03 Contractor:
INDIVIDUAL AGGREGATE GRADATIONS
Agg #1 Agg #2 Agg #3 Agg #4 Agg #5 Agg #6Aggregate---> Rock Crushed Fines Nat. Fines 1 Nat. Fines 2Description-->
If Agg. is Crushed, Enter 1 1 1 0 0Sieve % % % % % %Size Passing Passing Passing Passing Passing Passing
5/8" (16mm) 100.0 100.0 100.0 100.01/2" (12.5mm) 75.1 100.0 99.6 98.73/8" (9.5mm) 26.5 99.0 97.2 95.0#4 (4.75mm) 2.3 94.9 85.5 81.7#8 (2.36mm) 1.7 71.8 76.7 66.1#16 (1.18mm) 1.5 47.1 63.5 41.3#30 (0.6mm) 1.4 31.0 46.6 15.8#50 (0.3mm) 1.3 18.8 25.2 6.3#100 (0.15mm) 1.1 11.9 12.4 3.9#200 (0.075mm) 0.8 8.9 9.0 3.1
BLEND GRADATION
Aggregate Aggregate Blend Sieve Blend Lower UpperDescription # % Size Gradation Control Pt Control Pt
Rock 1 33 5/8" 100.0 100 100Crushed Fines 2 34 1/2" 91.4 90 100
Nat. Fines 1 3 8 3/8" 73.9Nat. Fines 2 4 25 #4 60.3
5 #8 47.6 28 58 6 #16 31.9 Sum of % = 100 #30 18.7
#50 10.4#100 6.4#200 4.8 2 7
% Fine Aggregate Mechanically Produced (Fractured) : 54.8% Coarse Aggregate Mechanically Produced (Fractured) : 85.6
34

A-1 General Information – Aggregate / Superpave - Contiued % PASSING FOR ABSENT SIEVES
Fill in sieve size with metric equivalent and the % passing from the sieves larger and smaller then the absent sieve.
Sieve % Sieve Sizes A-2 0.45 Power Chart / Superpave
0.45 Power Chart for Superpave
0
10
20
30
40
50
60
70
80
90
100
Sieve Size (mm^0.45)
% P
assi
ng
Lower Control Point Upper Control Point MDL Blend Gradation
Size(m) Passing Metricrgest sieve w/data Standard Equivalent
mallest sieve w/dataarget sieve size 5/8" 0.0159
1/2" 0.0125Power chart: 0.45 3/8" 0.0095
#4 0.004750Percent Passing Absent Sieve: #DIV/0! #8 0.002360
#16 0.001180#30 0.000600#50 0.000300#100 0.000150#200 0.000075
LaST
35

A-3 Aggregate Properties / Superpave A
GGREGATE PROPERTIES NDDOT Phase RPAVE MIX DESIGN tment of Transportation, Materials and Research (Rev. 7-04) 3/4/05
GGREGATE PROPERTIES
SUPEDepar
A
Agg #1 Agg #2 Agg #3 Agg #4Rock Crushed Fines Nat. Fines 1 Nat. Fines 2
lk SpG (Gsb)se 2.628 2.628 2.628 2.628
ine 2.631 2.631 2.572 2.543pparent SpG (Gsa)
se 2.774 2.774 2.774 2.774ine 2.771 2.771 2.733 2.736ater Absorption
se 2.000 2.000 2.000 2.000ine 1.920 1.920 2.280 2.770
mbinedk SpG (Gsb) 2.628 2.631 2.580 2.558
(Gsa) 2.774 2.771 2.739 2.743ater Absorption 1.998 1.924 2.235 2.588
Aggregate Bulk SpG (Gsb) = 2.607Blend Apparent SpG (Gsa)= 2.762
Properties Water Absorption = 2.108
RPAVE CONSENSUS AGGREGATE PROPERTIES
BuCoarFACoarFWCoarFCoBulApparent SpGW
SUPE
Agg #1 Agg #2 Agg #3 Agg #4Rock Crushed Fines Nat. Fines 1 Nat. Fines 2
ne Agg. Angularity FAA 47.4 47.4 40.9 42.8
Content Sand Equivalent 71 71 37 47
oarse Aggregate Angularity (+ No. 4 Material)
Fi%Clay%
C
Nominal maximum Size Sample Size Wt. of Total Sample = 740.73/8" (9.5 mm) 200 g Wt. of Fractured Material = 740.7½" (12.5 mm) 500 g Wt. of Questionable Material = 03/4" (19 mm) 1500 g Wt. of Uncrushed Material = 0
at and Elongated ParticlesFl
Nominal maximum Size Sample Size Wt. of Total Sample = 5379.33/8" (9.5 mm) 1000 g Wt. of Material Larger then 3/8" = 212.8½" (12.5 mm) 2000 g Wt. of Flat and Elongated Particles = 2.33/4" (19 mm) 5000 g
Superpave Fine Agg. Angularity % = 45.1Consensus Sand Equivalent % = 59.0Aggregate Coarse Agg. Angularity % = 100.0Properties Thin & Elongated Pieces % = 1.1
36

A-4 Batch Weights / Superpave Batch Weights NDDOT Phase 1Superpave Mix Design Department of Transportation, Materials and Research (Rev. 7-04) 3/4/05
MIX DESIGN BATCH WEIGHTS
Batch 1 Batch 2 Batch 3 Batch 4AC Contents Used in Mix Design (%): 5.0 5.5 6.0 6.5
Aggregate Wt per Batch (g): 4500# of AC Percentages used in Design: 4
Batch WeightsAgg #1 Agg #2 Agg #3 Agg #4 Agg #5
Rock Crushed Fines Nat. Fines 1 Nat. Fines 2 Tot./Batch (g) 1485 1530 360 1125 0
COURSE+3/8 Material 1091.5 15.3 10.1 56.3 0.0-3/8, +#4 Material 359.4 62.7 42.1 149.6 0.0-#4 Material 34.2 1452.0 307.8 919.1 0.0
AC and Total Batch WeightAC Content (%) 5.0 5.5 6.0 6.5Weight AC (g) 236.8 261.9 287.2 312.8Total Batch Wt (g) 4736.8 4761.9 4787.2 4812.8
37

APPENDIX B
Superpave Mix Design
38

B-1 Summary Sheet for PM1 Superpave Mix Design HOT MIX DESIGN DATA - SUPERPAVEDepartment of Transportation, Materials and Research (Rev. 7-04) 3/4/05
Lab. No. Location UND Project Specification 410 SuperpaveProject NDDOT Phase 1 Type of AC (top lift) PG 58-34
Type of AC (bot lift) PG 58-34District Letting Date 11/21/03County Plus #4 (%) 39.7Date 3/4/2005 0:00 Minus #4 (%) 60.3Pit Owner(s) Richard Klose
Gyratory Compactive EffortPit #1 Location E 1/2 27-138-64 Ninitial 7Pit #2 Location Ndesign 75Pit #3 Location Nmaximum 115
Mix Properties at Recommended Asphalt Content Summary of AggregateMix Design Specification Characteristics from Mix Design
Optimum AC (%) 5.8Density (pcf) 147.0 Gradation (% passing)Air Voids (%) 4.0 3.0-5.0 5/8" 100.0VMA (%) 14.7 14.0 Min 1/2" 91.4VFA (%) 73.0 65-78 3/8" 73.9%Gmm @ Ninitial 87.9 89 Max #4 60.3%Gmm @ Nmaximum 95.6 98Max #8 47.6AC Film Thickness (m) 9.5 7.5-13 #16 31.9Dust/Effective AC Ratio 1.0 0.6-1.3 #30 18.7Fine Agg Angularity (%) 45.1 45 Min #50 10.4Sand Equivalent (%) 59.0 40 Min #100 6.4Coarse Agg Angularity (%) 100.0 75 Min #200 4.8Flat/Elongated Pieces (%) 1.1 10 Max
Maximum SpG @ Ndes 2.454 Asphalt Absorption (%) 1.16Water Absorption (%) 2.11
Frac. Faces Fine (%) 54.8 Light Wt Particles (%) 1.1Frac. Faces Course (%) 85.6 Toughness (% Loss) 22.6
Final Aggregate Blend (%) Specific Gravity Information33 Rock 34 Crushed Fines Bulk (Gsb) 2.6078 Nat. Fines 1 Apparent (Gsa) 2.76225 Nat. Fines 2 Effective (Gme) 2.686
Remarks:Aggregate properties from project NH-2-281(025)049
Polymer Modified (PM1) mix design
Distribution:Materials and Research 0
39

B-2 Mix Data for PM1 Superpave Mix Design SUPERPAVE MIX DESIGN DATA NDDOT Phase 1Department of Transportation, Materials and Research (Rev. 7-04)
3/4/05Bulk Specific Gravity of the Mix (Gmb) @ Ndes
%AC Weight SSD Weight Volume Gmb Unit Specimen# in Air Weight in Water @Ndes Weight
5.0A 4675.7 4708.8 2668.5 2040.3 2.292 143.0B 4634.2 4649.5 2644.3 2005.2 2.311 144.2
Average = 2022.8 2.301 143.65.5A 4762.2 4773.0 2730.3 2042.7 2.331 145.5B 4823.5 4837.7 2760.1 2077.6 2.322 144.9
Average = 2060.2 2.326 145.26.0A 4758.7 4761.9 2757.1 2004.8 2.374 148.1B 4711.6 4718.6 2721.6 1997.0 2.359 147.2
Average = 2000.9 2.366 147.76.5A 4840.6 4842.3 2816.3 2026.0 2.389 149.1B 4794.3 4796.4 2771.8 2024.6 2.368 147.8
Average = 2025.3 2.379 148.4
Rice Test: Theoretical Maximum SpG of the Mix (Gmm) @ Ndes
AC % = 5.0 AC % = 5.5 AC % = 6.0 AC % = 6.5Flask Number 1 2 1 2 1 2 1 2Samp., Cont. & Sol. 3926.5 3925.3 3917.7 3922.9 3919.4 3938.1 3920.7 3920.2Cont. & Sol. (g) 3274.6 3275.1 3274.6 3275.1 3274.6 3275.1 3274.6 3275.1Samp. in Air (g) 1091.1 1088.7 1084.0 1089.8 1090.0 1117.4 1096.4 1093.3Samp. in Sol. (g) 651.9 650.2 643.1 647.8 644.8 663 646.1 645.1Vol. of Voidless Mix 439.2 438.5 440.9 442 445.2 454.4 450.3 448.2Theoretical Max. SpG 2.484 2.483 2.459 2.466 2.448 2.459 2.435 2.439Difference Between 0.002 0.007 0.011 0.004Flasks In Tolerance In Tolerance In Tolerance In ToleranceAvg Theor. Max. SpG 2.484 2.462 2.454 2.437Effective SpG 2.683 2.679 2.691 2.693Effective SpG (each plug) 2.684 2.682 2.675 2.683 2.684 2.698 2.690 2.696AC Absorption 1.1 1.1 1.2 1.3
Avg Effective SpG: 2.686
Voids Analysis of the Mix @ Ndes
AC Content (%) 5.0 5.5 6.0 6.5Bulk Specific Gravity of the Mix (Gmb) 2.301 2.326 2.366 2.379Percent Aggregate 95 94.5 94 93.5Theor. Maximum SpG of Mix (Gmm) 2.484 2.462 2.454 2.437Air Voids, Va (%) 7.3 5.5 3.6 2.4Voids in Mineral Agg. (VMA) 16.1 15.7 14.7 14.7Voids in Mineral Agg. Filled (VFA) 54.6 64.9 75.8 83.7Asphalt Absorption (%) 1.16
40

B-3 Gyratory Data for PM1 Superpave Mix Design SUPERPAVE MIX DESIGN NDDOT Phase 1Gyratory Compactor Information Department of Transportation, Materials and Research (Rev. 7-04) 3/4/05
Superpave Gyratory Compaction Effort
Number of Gyrations @ Ninitial: 7Number of Gyrations @ Ndesign: 75Number of Gyrations @ Nmaximum: 115
Gyratory Plugs Compacted to Ninital and Ndesign
AC % = 5.0 AC % = 5.5 AC % = 6.0 AC % = 6.5Plug Number 1 2 1 2 1 2 1 2Plug Weight (g) 4675.7 4634.2 4762.2 4823.5 4758.7 4711.6 4840.6 4794.3Plug Height @ Nini (mm) 127.7 126.0 128.3 130.2 124.9 125.0 126.1 127.1Plug Height @ Ndes (mm) 117.0 115.6 117.6 119.4 115.1 114.9 116.3 116.3% Gmm initial 84.9 85.0 86.6 86.7 88.9 88.7 90.0 89.3Avg. % Gmm initial 85.0 86.6 88.8 89.7
Gyratory Plugs Compacted to Nmaximum at Design Optimum Asphalt Content
%AC @ Optimum Weight SSD Weight Volume Gmb Unit Specimen# in Air Weight in Water @Ndes Weight
5.8A 4805.4 4810.4 2773.0 2037.4 2.359 147.2B 4663.6 4670.9 2671.7 1999.2 2.333 145.6
Average = 2018.3 2.346 146.4
%Gmm at Nmaximum = 95.6
41

B-4 Graphs for PM1 Superpave Mix Design SUPERPAVE HOT MIX DESIGN GRAPHS NDDOT Phase 1 3/4/05Department of Transportation, Materials and Research (Rev. 7-04)
AC% UNIT AC% AirWT. Voids
5.0 143.6 5.0 7.35.5 145.2 5.5 5.56.0 147.7 6.0 3.66.5 148.4 6.5 2.4
AC% VMA AC% VFA
5.0 16.1 5.0 54.65.5 64.9
6.0 14.7 6.0 75.86.5 14.7 6.5 83.7
AC% %Gmm AC% MaxSpG
5.0 85.0 5.0 2.4845.5 86.6 5.5 2.4626.0 88.8 6.0 2.4546.5 89.7 6.5 2.437
Air Voids Vs % AC
2.0
3.0
4.0
5.0
6.0
7.0
8.0
5.0 5.5 6.0 6.5% AC by Weight of Mix
% A
ir Vo
ids-
Tot
al M
ix
Unit Weight Vs % AC
140.0
145.0
150.0
5.0 5.5 6.0 6.5
% AC by Weight of Mix
Uni
t Wei
ght (
lbs)
VFA Vs % AC
50.0
55.0
60.0
65.0
70.0
75.0
80.0
85.0
90.0
5.0 5.5 6.0 6.5
% AC by Weight of Mix
% A
ggre
gate
Voi
ds F
illed
(VFA
)
VMA Vs % AC
14.5
15.5
16.5
5.0 6.0 6.5% AC by Weight of Mix
Void
s in
Min
eral
Ag
greg
ate(
VM
A)
%Gmm at Nini Vs % AC
84.0
85.0
86.0
87.0
88.0
89.0
90.0
5.0 5.5 6.0 6.5% AC by Weight of Mix
% G
mm
at N
initi
al
Theo. Max. SpG Vs % AC
2.420
2.430
2.440
2.450
2.460
2.470
2.480
2.490
2.500
5.0 5.5 6.0 6.5% AC by Weight of Mix
Avg
Theo
retic
al M
ax S
pG
42

B-5 Summary Sheet for PM2 Superpave Mix Design HOT MIX DESIGN DATA - SUPERPAVEDepartment of Transportation, Materials and Research (Rev. 7-04) 3/4/05
Lab. No. 1Location UND Project Specification 410 SuperpaveProject NDDOT Phase 1 Type of AC (top lift) PG 58-34
Type of AC (bot lift) PG 58-34District Letting Date 11/21/03County Plus #4 (%) 39.7Date 3/4/2005 0:00 Minus #4 (%) 60.3Pit Owner(s) Richard Klose
Gyratory Compactive EffortPit #1 Location E 1/2 27-138-64 Ninitial 7Pit #2 Location Ndesign 75Pit #3 Location Nmaximum 115
Mix Properties at Recommended Asphalt Content Summary of AggregateMix Design Specification Characteristics from Mix Design
Optimum AC (%) 6.0Density (pcf) 143.6 Gradation (% passing)Air Voids (%) 4.0 3.0-5.0 5/8" 100.0VMA (%) 17.0 14.0 Min 1/2" 91.4VFA (%) 76.7 65-78 3/8" 73.9%Gmm @ Ninitial 87.8 89 Max #4 60.3%Gmm @ Nmaximum 98.5 98Max #8 47.6AC Film Thickness (m) 11.5 7.5-13 #16 31.9Dust/Effective AC Ratio 0.8 0.6-1.3 #30 18.7Fine Agg Angularity (%) 45.1 45 Min #50 10.4Sand Equivalent (%) 59.0 40 Min #100 6.4Coarse Agg Angularity (%) 100.0 75 Min #200 4.8Flat/Elongated Pieces (%) 1.1 10 Max
Maximum SpG @ Ndes 2.397 Asphalt Absorption (%) 0.34Water Absorption (%) 2.11
Frac. Faces Fine (%) 54.8 Light Wt Particles (%) 1.1Frac. Faces Course (%) 85.6 Toughness (% Loss) 22.6
Final Aggregate Blend (%) Specific Gravity Information33 Rock 34 Crushed Fines Bulk (Gsb) 2.6078 Nat. Fines 1 Apparent (Gsa) 2.76225 Nat. Fines 2 Effective (Gme) 2.630
Remarks:Aggregate properties from project NH-2-281(025)049
PM2 mix design (all points redone)
43

B-6 Mix Data for PM2 Superpave Mix Design SUPERPAVE MIX DESIGN DATA NDDOT Phase 1Department of Transportation, Materials and Research (Rev. 7-04)
Bulk Specific Gravity of the Mix (Gmb) @ Ndes
%AC Weight SSD Weight Volume Gmb Unit Specimen# in Air Weight in Water @Ndes Weight
5.0A 4728.0 4753.3 2671.0 2082.3 2.271 141.7B 4727.3 4762.1 2661.5 2100.6 2.250 140.4
Average = 2091.5 2.261 141.15.5A 4765.7 4788.7 2706.4 2082.3 2.289 142.8B 4726.0 4745.8 2681.5 2064.3 2.289 142.9
Average = 2073.3 2.289 142.86.0A 4746.2 4758.9 2698.2 2060.7 2.303 143.7B 4736.3 4748.8 2688.5 2060.3 2.299 143.4
Average = 2060.5 2.301 143.66.5A 4796.9 4802.9 2745.7 2057.2 2.332 145.5B 4791.9 4799.6 2768.0 2031.6 2.359 147.2
Average = 2044.4 2.345 146.3
Rice Test: Theoretical Maximum SpG of the Mix (Gmm) @ Ndes
AC % = 5.0 AC % = 5.5 AC % = 6.0 AC % = 6.5Flask Number 1 2 1 2 1 2 1 2Samp., Cont. & Sol. 3962.1 3977.0 8215.5 8128.5 8178.5 8173.7 3905.3 3904.5Cont. & Sol. (g) 3274.6 3275.1 7556.8 7558.8 7556.8 7558.8 3274.6 3275.1Samp. in Air (g) 1161.7 1186.9 1120.3 968.0 1066.9 1055.3 1085.8 1084.2Samp. in Sol. (g) 687.5 701.9 658.7 569.7 621.7 614.9 630.7 629.4Vol. of Voidless Mix 474.2 485 461.6 398.3 445.2 440.4 455.1 454.8Theoretical Max. SpG 2.450 2.447 2.427 2.430 2.396 2.396 2.386 2.384Difference Between 0.003 0.003 0.000 0.002Flasks In Tolerance In Tolerance In Tolerance In ToleranceAvg Theor. Max. SpG 2.449 2.429 2.396 2.385Effective SpG 2.640 2.637 2.618 2.625AC Absorption 0.5 0.4 0.2 0.3
Avg Effective SpG: 2.630
Voids Analysis of the Mix @ Ndes
AC Content (%) 5.0 5.5 6.0 6.5Bulk Specific Gravity of the Mix (Gmb) 2.261 2.289 2.301 2.345Percent Aggregate 95 94.5 94 93.5Theor. Maximum SpG of Mix (Gmm) 2.449 2.429 2.396 2.385Air Voids, Va (%) 7.7 5.7 4.0 1.7Voids in Mineral Agg. (VMA) 17.6 17.0 17.0 15.9Voids in Mineral Agg. Filled (VFA) 56.5 66.3 76.7 89.5Asphalt Absorption (%) 0.34
44

B-7 Gyratory Data for PM2 Superpave Mix Design SUPERPAVE MIX DESIGN NDDOT Phase 1Gyratory Compactor Information Department of Transportation, Materials and Research (Rev. 7-04) 3/4/05
Superpave Gyratory Compaction Effort
Number of Gyrations @ Ninitial: 7Number of Gyrations @ Ndesign: 75Number of Gyrations @ Nmaximum: 115
Gyratory Plugs Compacted to Ninital and Ndesign
AC % = 5.0 AC % = 5.5 AC % = 6.0 AC % = 6.5Plug Number 1 2 1 2 1 2 1 2Plug Weight (g) 4728.0 4727.3 4765.7 4726.0 4746.2 4736.3 4796.9 4791.9Plug Height @ Nini (mm) 131.7 132.5 130.2 127.7 127.9 129.8 129.2 127.1Plug Height @ Ndes (mm) 120.1 121.0 119.4 117.3 116.9 118.6 118.0 116.3% Gmm initial 84.2 84.3 86.4 86.6 87.8 87.7 89.8 90.0Avg. % Gmm initial 84.3 86.5 87.8 89.9
Gyratory Plugs Compacted to Nmaximum at Design Optimum Asphalt Content
%AC @ Optimum Weight SSD Weight Volume Gmb Unit Specimen# in Air Weight in Water @Ndes Weight
6.0A 4772.4 4776.3 2750.3 2026.0 2.356 147.0B 4794.8 4797.5 2769.9 2027.6 2.365 147.6
Average = 2026.8 2.360 147.3
%Gmm at Nmaximum = 98.5
45

B-8 Graphs for PM2 Superpave Mix Design SUPERPAVE HOT MIX DESIGN GRAPHS NDDOT Phase 1 3/4/05Department of Transportation, Materials and Research (Rev. 7-04)
AC% UNIT AC% AirWT. Voids
5.0 141.1 5.0 7.75.5 142.8 5.5 5.76.0 143.6 6.0 4.06.5 146.3 6.5 1.7
AC% VMA AC% VFA
5.0 17.6 5.0 56.55.5 17.0 5.5 66.36.0 17.0 6.0 76.76.5 15.9 6.5 89.5
AC% %Gmm AC% MaxSpG
5.0 84.3 5.0 2.4495.5 86.5 5.5 2.4296.0 87.8 6.0 2.3966.5 89.9 6.5 2.385
Air Voids Vs % AC
1.02.03.04.05.06.07.08.0
5.0 5.5 6.0 6.5
% AC by Weight of Mix
% A
ir Vo
ids-
Tot
al M
ix
Unit Weight Vs % AC
140.0
145.0
150.0
5.0 5.5 6.0 6.5
% AC by Weight of Mix
Uni
t Wei
ght (
lbs)
VFA Vs % AC
55.060.065.070.075.080.085.090.095.0
5.0 5.5 6.0 6.5
% AC by Weight of Mix
% A
ggre
gate
Voi
ds F
illed
(VFA
)
VMA Vs % AC
14.0
15.0
16.0
17.0
18.0
19.0
20.0
5.0 5.5 6.0 6.5
% AC by Weight of Mix
Voi
ds in
Min
eral
Ag
greg
ate(
VMA
)
%Gmm at Nini Vs % AC
83.0
88.0
93.0
5.0 5.5 6.0 6.5
% AC by Weight of Mix
% G
mm
at N
initi
al
Theo. Max. SpG Vs % AC
2.300
2.350
2.400
2.450
2.500
2.550
2.600
5.0 5.5 6.0 6.5
% AC by Weight of Mix
Avg
Theo
retic
al M
ax S
pG
46
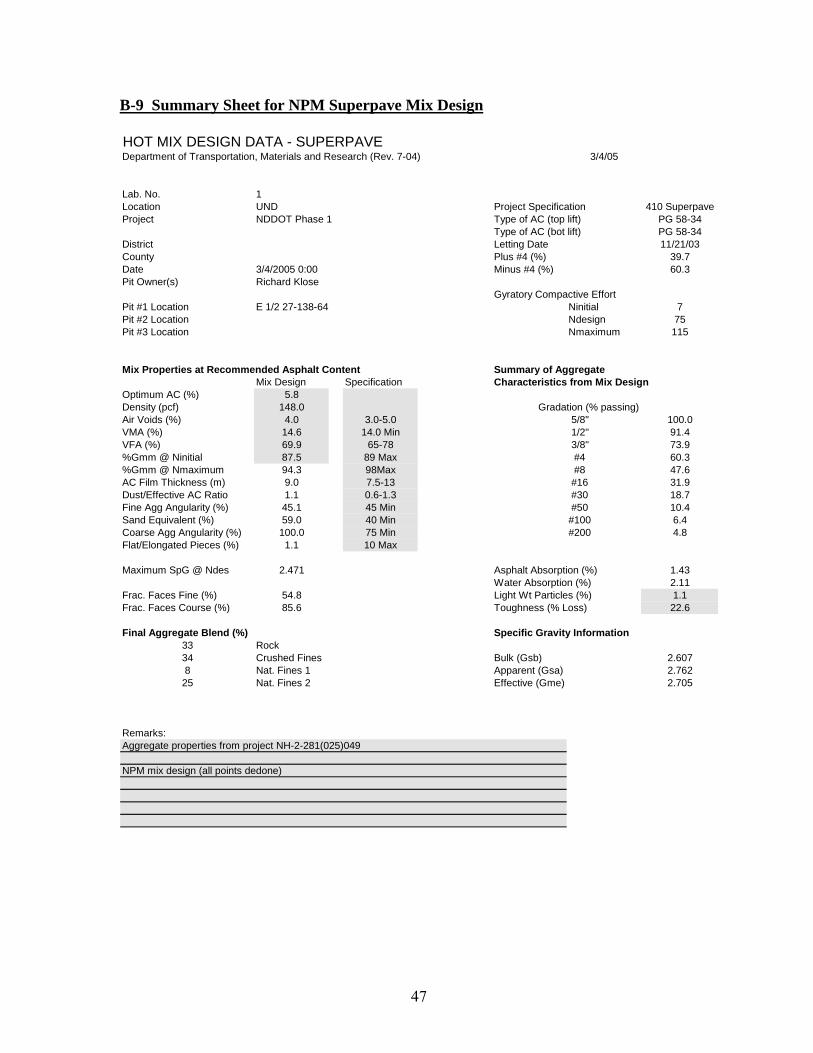
B-9 Summary Sheet for NPM Superpave Mix Design HOT MIX DESIGN DATA - SUPERPAVEDepartment of Transportation, Materials and Research (Rev. 7-04) 3/4/05
Lab. No. 1Location UND Project Specification 410 SuperpaveProject NDDOT Phase 1 Type of AC (top lift) PG 58-34
Type of AC (bot lift) PG 58-34District Letting Date 11/21/03County Plus #4 (%) 39.7Date 3/4/2005 0:00 Minus #4 (%) 60.3Pit Owner(s) Richard Klose
Gyratory Compactive EffortPit #1 Location E 1/2 27-138-64 Ninitial 7Pit #2 Location Ndesign 75Pit #3 Location Nmaximum 115
Mix Properties at Recommended Asphalt Content Summary of AggregateMix Design Specification Characteristics from Mix Design
Optimum AC (%) 5.8Density (pcf) 148.0 Gradation (% passing)Air Voids (%) 4.0 3.0-5.0 5/8" 100.0VMA (%) 14.6 14.0 Min 1/2" 91.4VFA (%) 69.9 65-78 3/8" 73.9%Gmm @ Ninitial 87.5 89 Max #4 60.3%Gmm @ Nmaximum 94.3 98Max #8 47.6AC Film Thickness (m) 9.0 7.5-13 #16 31.9Dust/Effective AC Ratio 1.1 0.6-1.3 #30 18.7Fine Agg Angularity (%) 45.1 45 Min #50 10.4Sand Equivalent (%) 59.0 40 Min #100 6.4Coarse Agg Angularity (%) 100.0 75 Min #200 4.8Flat/Elongated Pieces (%) 1.1 10 Max
Maximum SpG @ Ndes 2.471 Asphalt Absorption (%) 1.43Water Absorption (%) 2.11
Frac. Faces Fine (%) 54.8 Light Wt Particles (%) 1.1Frac. Faces Course (%) 85.6 Toughness (% Loss) 22.6
Final Aggregate Blend (%) Specific Gravity Information33 Rock 34 Crushed Fines Bulk (Gsb) 2.6078 Nat. Fines 1 Apparent (Gsa) 2.76225 Nat. Fines 2 Effective (Gme) 2.705
Remarks:Aggregate properties from project NH-2-281(025)049
NPM mix design (all points dedone)
47

B-10 Mix Data for NPM Superpave Mix Design SUPERPAVE MIX DESIGN DATA NDDOT Phase 1Department of Transportation, Materials and Research (Rev. 7-04)
3/4/05Bulk Specific Gravity of the Mix (Gmb) @ Ndes
%AC Weight SSD Weight Volume Gmb Unit Specimen# in Air Weight in Water @Ndes Weight
5.0A 4747.6 4769.2 2702.9 2066.3 2.298 143.4B 4698.8 4722.5 2676.9 2045.6 2.297 143.3
Average = 2056.0 2.297 143.45.5A 4763.3 4770.9 2735.3 2035.6 2.340 146.0B 4754.3 4762.2 2735.9 2026.3 2.346 146.4
Average = 2031.0 2.343 146.26.0A 4777.0 4778.9 2779.6 1999.3 2.389 149.1B 4769.5 4771.5 2757.6 2013.9 2.368 147.8
Average = 2006.6 2.379 148.46.5A 4806.9 4808.1 2806.3 2001.8 2.401 149.8B 4794.7 4796.0 2800.5 1995.5 2.403 149.9
Average = 1998.7 2.402 149.9
Rice Test: Theoretical Maximum SpG of the Mix (Gmm) @ Ndes
AC % = 5.0 AC % = 5.5 AC % = 6.0 AC % = 6.5Flask Number 1 2 1 2 1 2 1 2Samp., Cont. & Sol. 8217.9 8141.7 4094.5 4188.6 4038.2 4249.7 4111.1 4175.2Cont. & Sol. (g) 7556.8 7558.8 3275.0 3398.5 3275.0 3398.5 3275.0 3398.5Samp. in Air (g) 1103.3 972.3 1368.4 1321.4 1282.8 1435.1 1413.4 1313.7Samp. in Sol. (g) 661.1 582.9 819.5 790.1 763.2 851.2 836.1 776.7Vol. of Voidless Mix 442.2 389.4 548.9 531.3 519.6 583.9 577.3 537Theoretical Max. SpG 2.495 2.497 2.493 2.487 2.469 2.458 2.448 2.446Difference Between 0.002 0.006 0.011 0.002Flasks In Tolerance In Tolerance In Tolerance In ToleranceAvg Theor. Max. SpG 2.496 2.490 2.463 2.447Effective SpG 2.698 2.714 2.703 2.706AC Absorption 1.3 1.6 1.4 1.4
Avg Effective SpG: 2.705
Voids Analysis of the Mix @ Ndes
AC Content (%) 5.0 5.5 6.0 6.5Bulk Specific Gravity of the Mix (Gmb) 2.297 2.343 2.379 2.402Percent Aggregate 95 94.5 94 93.5Theor. Maximum SpG of Mix (Gmm) 2.496 2.490 2.463 2.447Air Voids, Va (%) 8.0 5.9 3.4 1.9Voids in Mineral Agg. (VMA) 16.3 15.1 14.2 13.9Voids in Mineral Agg. Filled (VFA) 51.2 60.9 75.9 86.6Asphalt Absorption (%) 1.43
48

B-11 Gyratory Data for NPM Superpave Mix Design SUPERPAVE MIX DESIGN NDDOT Phase 1Gyratory Compactor Information Department of Transportation, Materials and Research (Rev. 7-04)
Superpave Gyratory Compaction Effort
Number of Gyrations @ Ninitial: 7Number of Gyrations @ Ndesign: 75Number of Gyrations @ Nmaximum: 115
Gyratory Plugs Compacted to Ninital and Ndesign
AC % = 5.0 AC % = 5.5 AC % = 6.0 AC % = 6.5Plug Number 1 2 1 2 1 2 1 2Plug Weight (g) 4747.6 4698.8 4763.3 4754.3 4777.0 4769.5 4806.9 4794.7Plug Height @ Nini (mm) 126.9 126.9 127.7 127.4 125.0 126.2 124.9 124.1Plug Height @ Ndes (mm) 116.6 116.6 117.0 116.5 114.7 115.6 114.8 114.2% Gmm initial 84.6 84.6 86.2 86.0 88.6 88.5 90.2 90.3Avg. % Gmm initial 84.6 86.1 88.5 90.3
Gyratory Plugs Compacted to Nmaximum at Design Optimum Asphalt Content
%AC @ Optimum Weight SSD Weight Volume Gmb Unit Specimen# in Air Weight in Water @Ndes Weight
5.8A 4768.6 4776.5 2743.1 2033.4 2.345 146.3B 4747.1 4758.5 2706.3 2052.2 2.313 144.3
Average = 2042.8 2.329 145.3
%Gmm at Nmaximum = 94.3
49

B-12 Graphs for NPM Superpave Mix Design SUPERPAVE HOT MIX DESIGN GRAPHS NDDOT Phase 1 3/4/05Department of Transportation, Materials and Research (Rev. 7-04)
AC% UNIT AC% AirWT. Voids
5.0 143.4 5.0 8.05.5 146.2 5.5 5.96.0 148.4 6.0 3.46.5 149.9 6.5 1.9
AC% VMA AC% VFA
5.0 16.3 5.0 51.25.5 15.1 5.5 60.96.0 14.2 6.0 75.96.5 13.9 6.5 86.6
AC% %Gmm AC% MaxSpG
5.0 84.6 5.0 2.4965.5 86.1 5.5 2.4906.0 88.5 6.0 2.4636.5 90.3 6.5 2.447
Air Voids Vs % AC
1.02.03.04.05.06.07.08.09.0
5.0 5.5 6.0 6.5
% AC by Weight of Mix
% A
ir V
oids
- Tot
al M
ix
Unit Weight Vs % AC
140.0
150.0
160.0
5.0 5.5 6.0 6.5
% AC by Weight of Mix
Uni
t Wei
ght (
lbs)
VFA Vs % AC
50.055.060.065.070.075.080.085.090.0
5.0 5.5 6.0 6.5
% AC by Weight of Mix
% A
ggre
gate
Voi
ds F
illed
(VFA
)
VMA Vs % AC
12.5
13.5
14.5
15.5
16.5
5.0 5.5 6.0 6.5
% AC by Weight of Mix
Voi
ds in
Min
eral
A
ggre
gate
(VM
A)
%Gmm at Nini Vs % AC
80.082.084.086.088.090.092.094.0
5.0 5.5 6.0 6.5
% AC by Weight of Mix
% G
mm
at N
initi
al
Theo. Max. SpG Vs % AC
2.300
2.360
2.420
2.480
2.540
2.600
5.0 5.5 6.0 6.5
% AC by Weight of Mix
Avg
Theo
retic
al M
ax S
pG
50

APPENDIX C
Superpave-L Mix Design (1% Lime Added)
51

C-1 Summary Sheet forPM1-L Superpave Mix Design with Lime HOT MIX DESIGN DATA - SUPERPAVEDepartment of Transportation, Materials and Research (Rev. 7-04) 3/4/05
Lab. No. 1Location UND Project Specification 410 SuperpaveProject NDDOT Phase 1 Type of AC (top lift) PG 58-34
Type of AC (bot lift) PG 58-34District Letting Date 11/21/03County Plus #4 (%) 39.7Date 3/4/2005 0:00 Minus #4 (%) 60.3Pit Owner(s) Richard Klose
Gyratory Compactive EffortPit #1 Location E 1/2 27-138-64 Ninitial 7Pit #2 Location Ndesign 75Pit #3 Location Nmaximum 115
Mix Properties at Recommended Asphalt Content Summary of AggregateMix Design Specification Characteristics from Mix Design
Optimum AC (%) 6.0Density (pcf) 146.0 Gradation (% passing)Air Voids (%) 4.0 3.0-5.0 5/8" 100.0VMA (%) 15.6 14.0 Min 1/2" 91.4VFA (%) 75.0 65-78 3/8" 73.9%Gmm @ Ninitial 87.5 89 Max #4 60.3%Gmm @ Nmaximum 97.4 98Max #8 47.6AC Film Thickness (m) 10.3 7.5-13 #16 31.9Dust/Effective AC Ratio 0.9 0.6-1.3 #30 18.7Fine Agg Angularity (%) 45.1 45 Min #50 10.4Sand Equivalent (%) 59.0 40 Min #100 6.4Coarse Agg Angularity (%) 100.0 75 Min #200 4.8Flat/Elongated Pieces (%) 1.1 10 Max
Maximum SpG @ Ndes 2.437 Asphalt Absorption (%) 0.97Water Absorption (%) 2.11
Frac. Faces Fine (%) 54.8 Light Wt Particles (%) 1.1Frac. Faces Course (%) 85.6 Toughness (% Loss) 22.6
Final Aggregate Blend (%) Specific Gravity Information33 Rock 34 Crushed Fines Bulk (Gsb) 2.6078 Nat. Fines 1 Apparent (Gsa) 2.76225 Nat. Fines 2 Effective (Gme) 2.673
Remarks:Aggregate properties from project NH-2-281(025)049
Polymer Modified (1) with 1% lime added to total batch weight
52

C-2 Mix Data for PM1-L Superpave Mix Design with Lime SUPERPAVE MIX DESIGN DATA NDDOT Phase 1Department of Transportation, Materials and Research (Rev. 7-04)
3/4/05Bulk Specific Gravity of the Mix (Gmb) @ Ndes
%AC Weight SSD Weight Volume Gmb Unit Specimen# in Air Weight in Water @Ndes Weight5.0
A 4775.3 4793.9 2716.7 2077.2 2.299 143.5B 4761.0 4782.3 2710.5 2071.8 2.298 143.4
Average = 2074.5 2.298 143.45.5
A 4809.2 4818.0 2745.2 2072.8 2.320 144.8B 4773.9 4782.8 2733.7 2049.1 2.330 145.4
Average = 2061.0 2.325 145.16.0
A 4787.3 4792.3 2737.1 2055.2 2.329 145.4B 4809.2 4812.5 2766.2 2046.3 2.350 146.7
Average = 2050.8 2.340 146.06.5
A 4857.3 4859.6 2789.5 2070.1 2.346 146.4B 4851.7 4855.1 2786.5 2068.6 2.345 146.4
Average = 2069.4 2.346 146.4 Rice Test: Theoretical Maximum SpG of the Mix (Gmm) @ Ndes
AC % = 5.0 AC % = 5.5 AC % = 6.0 AC % = 6.5Flask Number 1 2 1 2 1 2 1 2Samp., Cont. & Sol. 8192.7 8163.7 8210.4 8161.2 8173.6 8198.8 8202.5 8163.0Cont. & Sol. (g) 7556.7 7556.7 7557.1 7558.4 7557.1 7558.4 7557.1 7558.4Samp. in Air (g) 1063.4 1017.2 1100.8 1016.4 1046.7 1087.5 1101.5 1028.8Samp. in Sol. (g) 636 607 653.3 602.8 616.5 640.4 645.4 604.6Vol. of Voidless Mix 427.4 410.2 447.5 413.6 430.2 447.1 456.1 424.2Theoretical Max. SpG 2.488 2.480 2.460 2.457 2.433 2.432 2.415 2.425Difference Between 0.008 0.002 0.001 0.010Flasks In Tolerance In Tolerance In Tolerance In ToleranceAvg Theor. Max. SpG 2.484 2.459 2.433 2.420Effective SpG 2.683 2.675 2.664 2.671Effective SpG (each plug) 2.688 2.678 2.676 2.673 2.665 2.664 2.664 2.677AC Absorption 1.1 1.0 0.8 0.9
Avg Effective SpG: 2.673
Voids Analysis of the Mix @ Ndes
AC Content (%) 5.0 5.5 6.0 6.5Bulk Specific Gravity of the Mix (Gmb) 2.298 2.325 2.340 2.346Percent Aggregate 95 94.5 94 93.5Theor. Maximum SpG of Mix (Gmm) 2.484 2.459 2.433 2.420Air Voids, Va (%) 7.5 5.4 3.8 3.1Voids in Mineral Agg. (VMA) 16.3 15.7 15.6 15.9Voids in Mineral Agg. Filled (VFA) 54.1 65.4 75.6 80.7Asphalt Absorption (%) 0.97
53

C-3 Gyratory Data for PM1-L Superpave Mix Design with Lime SUPERPAVE MIX DESIGN NDDOT PhasGyratory Compactor Information Department of Transportation, Materials and Research (Rev. 7-04) 3/4/05
Superpave Gyratory Compaction Effort
Number of Gyrations @ Ninitial: 7Number of Gyrations @ Ndesign: 75Number of Gyrations @ Nmaximum: 115
Gyratory Plugs Compacted to Ninital and Ndesign
AC % = 5.0 AC % = 5.5 AC % = 6.0 AC % = 6.5Plug Number 1 2 1 2 1 2 1 2Plug Weight (g) 4775.3 4761.0 4809.2 4773.9 4787.3 4809.2 4857.3 4851.7Plug Height @ Nini (mm) 130.4 130.2 130.1 129.2 130.2 129.3 130.8 131.2Plug Height @ Ndes (mm) 119.3 119.2 119.1 117.9 118.3 117.7 119.1 119.3% Gmm initial 84.7 84.7 86.6 86.3 87.4 87.6 88.3 88.1Avg. % Gmm initial 84.7 86.4 87.5 88.2
Gyratory Plugs Compacted to Nmaximum at Design Optimum Asphalt Content
%AC @ Optimum Weight SSD Weight Volume Gmb Unit Specimen# in Air Weight in Water @Ndes Weight6.0
A 4878.4 4881.8 2826.6 2055.2 2.374 148.1B 4790.3 4794.6 2776.2 2018.4 2.373 148.1
Average = 2036.8 2.374 148.1
%Gmm at Nmaximum = 97.4
54

C-4 Graphs for PM1-L Superpave Mix Design with Lime SUPERPAVE HOT MIX DESIGN GRAPHS NDDOT Phase 1 3/4/05Department of Transportation, Materials and Research (Rev. 7-04)
AC% UNIT AC% AirWT. Voids
5.0 143.4 5.0 7.55.5 145.1 5.5 5.46.0 146.0 6.0 3.86.5 146.4 6.5 3.1
AC% VMA AC% VFA
5.0 16.3 5.0 54.15.5 15.7 5.5 65.46.0 15.6 6.0 75.66.5 15.9 6.5 80.7
AC% %Gmm AC% MaxSpG
5.0 84.7 5.0 2.4845.5 86.4 5.5 2.4596.0 87.5 6.0 2.4336.5 88.2 6.5 2.420
Air Voids Vs % AC
1.0
2.0
3.0
4.0
5.0
6.0
7.0
8.0
5.0 5.5 6.0 6.5% AC by Weight of Mix
% A
ir Vo
ids-
Tot
al M
ix
Unit Weight Vs % AC
140.0
145.0
150.0
5.0 5.5 6.0 6.5% AC by Weight of Mix
Uni
t Wei
ght (
lbs)
VFA Vs % AC
50.0
55.0
60.0
65.0
70.0
75.0
80.0
85.0
5.0 5.5 6.0 6.5% AC by Weight of Mix
% A
ggre
gate
Voi
ds F
illed
(VFA
)
VMA Vs % AC
15.0
16.0
5.0 5.5 6.0 6.5% AC by Weight of Mix
Void
s in
Min
eral
Ag
greg
ate(
VMA)
%Gmm at Nini Vs % AC
84.0
85.0
86.0
87.0
88.0
89.0
90.0
5.0 5.5 6.0 6.5% AC by Weight of Mix
% G
mm
at N
initi
al
Theo. Max. SpG Vs % AC
2.400
2.420
2.440
2.460
2.480
2.500
5.0 5.5 6.0 6.5% AC by Weight of Mix
Avg
Theo
retic
al M
ax S
pG
55

C-5 Summary Sheet forPM2-L Superpave Mix Design with Lime HOT MIX DESIGN DATA - SUPERPAVEDepartment of Transportation, Materials and Research (Rev. 7-04) 3/4/05
Lab. No. 1Location UND Project Specification 410 SuperpaveProject NDDOT Phase 1 Type of AC (top lift) PG 58-34
Type of AC (bot lift) PG 58-34District Letting Date 11/21/03County Plus #4 (%) 39.7Date 3/4/2005 0:00 Minus #4 (%) 60.3Pit Owner(s) Richard Klose
Gyratory Compactive EffortPit #1 Location E 1/2 27-138-64 Ninitial 7Pit #2 Location Ndesign 75Pit #3 Location Nmaximum 115
Mix Properties at Recommended Asphalt Content Summary of AggregateMix Design Specification Characteristics from Mix Design
Optimum AC (%) 5.9Density (pcf) 146.7 Gradation (% passing)Air Voids (%) 4.0 3.0-5.0 5/8" 100.0VMA (%) 15.1 14.0 Min 1/2" 91.4VFA (%) 73.1 65-78 3/8" 73.9%Gmm @ Ninitial 87.4 89 Max #4 60.3%Gmm @ Nmaximum 97.4 98Max #8 47.6AC Film Thickness (m) 10.0 7.5-13 #16 31.9Dust/Effective AC Ratio 1.0 0.6-1.3 #30 18.7Fine Agg Angularity (%) 45.1 45 Min #50 10.4Sand Equivalent (%) 59.0 40 Min #100 6.4Coarse Agg Angularity (%) 100.0 75 Min #200 4.8Flat/Elongated Pieces (%) 1.1 10 Max
Maximum SpG @ Ndes 2.449 Asphalt Absorption (%) 1.01Water Absorption (%) 2.11
Frac. Faces Fine (%) 54.8 Light Wt Particles (%) 1.1Frac. Faces Course (%) 85.6 Toughness (% Loss) 22.6
Final Aggregate Blend (%) Specific Gravity Information33 Rock 34 Crushed Fines Bulk (Gsb) 2.6078 Nat. Fines 1 Apparent (Gsa) 2.76225 Nat. Fines 2 Effective (Gme) 2.676
Remarks:Aggregate properties from project NH-2-281(025)049
PM2-L (1% lime added to total batch weight)
56

C-6 Mix Data forPM2-L Superpave Mix Design with Lime SUPERPAVE MIX DESIGN DATA NDDOT Phase 1Department of Transportation, Materials and Research (Rev. 7-04)
3/4/05Bulk Specific Gravity of the Mix (Gmb) @ Ndes
%AC Weight SSD Weight Volume Gmb Unit Specimen# in Air Weight in Water @Ndes Weight
5.0A 4749.2 4772.5 2695.9 2076.6 2.287 142.7B 4775.8 4794.7 2710.8 2083.9 2.292 143.0
Average = 2080.3 2.289 142.95.5A 4785.8 4793.6 2737.7 2055.9 2.328 145.3B 4783.3 4795.7 2721.2 2074.5 2.306 143.9
Average = 2065.2 2.317 144.66.0A 4793.9 4799.7 2754.0 2045.7 2.343 146.2B 4817.9 4820.0 2791.3 2028.7 2.375 148.2
Average = 2037.2 2.359 147.26.5A 4832.6 4835.0 2778.0 2057.0 2.349 146.6B 4831.4 4834.4 2767.3 2067.1 2.337 145.8
Average = 2062.1 2.343 146.2
Rice Test: Theoretical Maximum SpG of the Mix (Gmm) @ Ndes
AC % = 5.0 AC % = 5.5 AC % = 6.0 AC % = 6.5Flask Number 1 2 1 2 1 2 1 2Samp., Cont. & Sol. 8208.2 8159.4 8185.5 8185.6 8185.9 8180.0 8165.4 8210.5Cont. & Sol. (g) 7556.8 7558.7 7556.8 7558.7 7556.8 7558.8 7558.7 7556.8Samp. in Air (g) 1095.2 1006.9 1062.9 1056.9 1064.4 1047.7 1033.5 1110.5Samp. in Sol. (g) 651.4 600.7 628.7 626.9 629.1 621.2 606.7 653.7Vol. of Voidless Mix 443.8 406.2 434.2 430 435.3 426.5 426.8 456.8Theoretical Max. SpG 2.468 2.479 2.448 2.458 2.445 2.457 2.422 2.431Difference Between 0.011 0.010 0.011 0.010Flasks In Tolerance In Tolerance In Tolerance In ToleranceAvg Theor. Max. SpG 2.473 2.453 2.451 2.426Effective SpG 2.670 2.667 2.687 2.679AC Absorption 0.9 0.9 1.2 1.1
Avg Effective SpG: 2.676
Voids Analysis of the Mix @ Ndes
AC Content (%) 5.0 5.5 6.0 6.5Bulk Specific Gravity of the Mix (Gmb) 2.289 2.317 2.359 2.343Percent Aggregate 95 94.5 94 93.5Theor. Maximum SpG of Mix (Gmm) 2.473 2.453 2.451 2.426Air Voids, Va (%) 7.4 5.5 3.7 3.4Voids in Mineral Agg. (VMA) 16.6 16.0 14.9 16.0Voids in Mineral Agg. Filled (VFA) 55.2 65.4 75.0 78.6Asphalt Absorption (%) 1.01
57

C-7 Gyratory Data forPM2-L Superpave Mix Design with Lime SUPERPAVE MIX DESIGN NDDOT Phase 1Gyratory Compactor Information Department of Transportation, Materials and Research (Rev. 7-04) 3/4/05
Superpave Gyratory Compaction Effort
Number of Gyrations @ Ninitial: 7Number of Gyrations @ Ndesign: 75Number of Gyrations @ Nmaximum: 115
Gyratory Plugs Compacted to Ninital and Ndesign
AC % = 5.0 AC % = 5.5 AC % = 6.0 AC % = 6.5Plug Number 1 2 1 2 1 2 1 2Plug Weight (g) 4749.2 4775.8 4785.8 4783.3 4793.9 4817.9 4832.6 4831.4Plug Height @ Nini (mm) 131.1 131.5 129.6 131.5 129.5 131.4 130.4 131.3Plug Height @ Ndes (mm) 119.5 120.1 118.5 119.7 118.1 119.5 118.7 119.3% Gmm initial 84.4 84.5 86.4 86.0 87.8 87.5 87.9 87.8Avg. % Gmm initial 84.5 86.2 87.7 87.8
Gyratory Plugs Compacted to Nmaximum at Design Optimum Asphalt Content
%AC @ Optimum Weight SSD Weight Volume Gmb Unit Specimen# in Air Weight in Water @Ndes Weight
5.9A 4809.8 4813.2 2786.8 2026.4 2.374 148.1B 4813.8 4815.5 2808.0 2007.5 2.398 149.6
Average = 2017.0 2.386 148.9
%Gmm at Nmaximum = 97.4
58

C-8 Graphs forPM2-L Superpave Mix Design with Lime SUPERPAVE HOT MIX DESIGN GRAPHS NDDOT Phase 1 PM2-L(6.0) 3/4/05Department of Transportation, Materials and Research (Rev. 7-04)
AC% UNIT AC% AirWT. Voids
5.0 142.9 5.0 7.45.5 144.6 5.5 5.56.0 147.2 6.0 3.76.5 146.2 6.5 3.4
AC% VMA AC% VFA
5.0 16.6 5.0 55.25.5 16.0 5.5 65.46.0 14.9 6.0 75.06.5 16.0 6.5 78.6
AC% %Gmm AC% MaxSpG
5.0 84.5 5.0 2.4735.5 86.2 5.5 2.4536.0 87.7 6.0 2.4516.5 87.8 6.5 2.426
Air Voids Vs % AC
2.0
3.0
4.0
5.0
6.0
7.0
8.0
5.0 5.5 6.0 6.5
% AC by Weight of Mix
% A
ir Vo
ids-
Tot
al M
ix
Unit Weight Vs % AC
140.0
145.0
150.0
5.0 5.5 6.0 6.5
% AC by Weight of Mix
Uni
t Wei
ght (
lbs)
VFA Vs % AC
50.055.060.065.070.075.080.085.0
5.0 5.5 6.0 6.5
% AC by Weight of Mix
% A
ggre
gate
Voi
ds F
illed
(VFA
)
VMA Vs % AC
13.5
14.5
15.5
16.5
17.5
5.0 5.5 6.0 6.5
% AC by Weight of Mix
Void
s in
Min
eral
A
ggre
gate
(VM
A)
%Gmm at Nini Vs % AC
80.0
85.0
90.0
5.0 5.5 6.0 6.5
% AC by Weight of Mix
% G
mm
at N
initi
al
Theo. Max. SpG Vs % AC
2.400
2.420
2.440
2.460
2.480
2.500
5.0 5.5 6.0 6.5
% AC by Weight of Mix
Avg
The
oret
ical
Max
SpG
59

C-9 Summary Sheet for NPM-L Superpave Mix Design with Lime HOT MIX DESIGN DATA - SUPERPAVEDepartment of Transportation, Materials and Research (Rev. 7-04) 3/4/05
Lab. No. 1Location UND Project Specification 410 SuperpaveProject NDDOT Phase 1 Type of AC (top lift) PG 58-34
Type of AC (bot lift) PG 58-34District Letting Date 11/21/03County Plus #4 (%) 39.7Date 3/4/2005 0:00 Minus #4 (%) 60.3Pit Owner(s) Richard Klose
Gyratory Compactive EffortPit #1 Location E 1/2 27-138-64 Ninitial 7Pit #2 Location Ndesign 75Pit #3 Location Nmaximum 115
Mix Properties at Recommended Asphalt Content Summary of AggregateMix Design Specification Characteristics from Mix Design
Optimum AC (%) 5.9Density (pcf) 146.7 Gradation (% passing)Air Voids (%) 4.0 3.0-5.0 5/8" 100.0VMA (%) 15.2 14.0 Min 1/2" 91.4VFA (%) 72.2 65-78 3/8" 73.9%Gmm @ Ninitial 86.9 89 Max #4 60.3%Gmm @ Nmaximum 97.5 98Max #8 47.6AC Film Thickness (m) 9.8 7.5-13 #16 31.9Dust/Effective AC Ratio 1.0 0.6-1.3 #30 18.7Fine Agg Angularity (%) 45.1 45 Min #50 10.4Sand Equivalent (%) 59.0 40 Min #100 6.4Coarse Agg Angularity (%) 100.0 75 Min #200 4.8Flat/Elongated Pieces (%) 1.1 10 Max
Maximum SpG @ Ndes 2.449 Asphalt Absorption (%) 1.15Water Absorption (%) 2.11
Frac. Faces Fine (%) 54.8 Light Wt Particles (%) 1.1Frac. Faces Course (%) 85.6 Toughness (% Loss) 22.6
Final Aggregate Blend (%) Specific Gravity Information33 Rock 34 Crushed Fines Bulk (Gsb) 2.6078 Nat. Fines 1 Apparent (Gsa) 2.76225 Nat. Fines 2 Effective (Gme) 2.686
Remarks:Aggregate properties from project NH-2-281(025)049
NPM with 1% lime added to total batch weight
60

C-10 Mix Data for NPM-L Superpave Mix Design with Lime SUPERPAVE MIX DESIGN DATA NDDOT Phase 1Department of Transportation, Materials and Research (Rev. 7-04)
3/4/05Bulk Specific Gravity of the Mix (Gmb) @ Ndes
%AC Weight SSD Weight Volume Gmb Unit Specimen# in Air Weight in Water @Ndes Weight
5.0A 4731.3 4765.1 2706.8 2058.3 2.299 143.4B 4773.3 4795.7 2714.8 2080.9 2.294 143.1
Average = 2069.6 2.296 143.35.5A 4746.4 4762.1 2714.1 2048.0 2.318 144.6B 4762.5 4774.9 2716.8 2058.1 2.314 144.4
Average = 2053.1 2.316 144.56.0A 4786.4 4790.8 2764.5 2026.3 2.362 147.4B 4796.4 4801.9 2764.6 2037.3 2.354 146.9
Average = 2031.8 2.358 147.26.5A 4839.4 4845.8 2749.1 2096.7 2.308 144.0B 4844.7 4847.0 2810.3 2036.7 2.379 148.4
Average = 2066.7 2.343 146.2
Rice Test: Theoretical Maximum SpG of the Mix (Gmm) @ Ndes
AC % = 5.0 AC % = 5.5 AC % = 6.0 AC % = 6.5Flask Number 1 2 1 2 1 2 1 2Samp., Cont. & Sol. 8181.9 8191.0 8185.2 8193.3 8187.9 8191.6 8147.8 8226.8Cont. & Sol. (g) 7556.8 7558.8 7556.8 7558.8 7556.8 7558.8 7556.8 7558.8Samp. in Air (g) 1046.4 1061.0 1056.2 1068.1 1064.4 1070.6 1001.2 1133.8Samp. in Sol. (g) 625.1 632.2 628.4 634.5 631.1 632.8 591 668Vol. of Voidless Mix 421.3 428.8 427.8 433.6 433.3 437.8 410.2 465.8Theoretical Max. SpG 2.484 2.474 2.469 2.463 2.456 2.445 2.441 2.434Difference Between 0.009 0.006 0.011 0.007Flasks In Tolerance In Tolerance In Tolerance In ToleranceAvg Theor. Max. SpG 2.479 2.466 2.451 2.437Effective SpG 2.677 2.684 2.688 2.693AC Absorption 1.0 1.1 1.2 1.3
Avg Effective SpG: 2.686
Voids Analysis of the Mix @ Ndes
AC Content (%) 5.0 5.5 6.0 6.5Bulk Specific Gravity of the Mix (Gmb) 2.296 2.316 2.358 2.343Percent Aggregate 95 94.5 94 93.5Theor. Maximum SpG of Mix (Gmm) 2.479 2.466 2.451 2.437Air Voids, Va (%) 7.4 6.1 3.8 3.9Voids in Mineral Agg. (VMA) 16.3 16.1 15.0 16.0Voids in Mineral Agg. Filled (VFA) 54.9 62.1 74.7 75.8Asphalt Absorption (%) 1.15
61

C-11 Gyratory Data for NPM-L Superpave Mix Design with Lime SUPERPAVE MIX DESIGN NDDOT Phase 1Gyratory Compactor Information Department of Transportation, Materials and Research (Rev. 7-04) 3/4/05
Superpave Gyratory Compaction Effort
Number of Gyrations @ Ninitial: 7Number of Gyrations @ Ndesign: 75Number of Gyrations @ Nmaximum: 115
Gyratory Plugs Compacted to Ninital and Ndesign
AC % = 5.0 AC % = 5.5 AC % = 6.0 AC % = 6.5Plug Number 1 2 1 2 1 2 1 2Plug Weight (g) 4731.3 4773.3 4746.4 4762.5 4786.4 4796.4 4839.4 4844.7Plug Height @ Nini (mm) 130.2 130.9 131.7 131.5 131.2 132.7 133.6 129.6Plug Height @ Ndes (mm) 118.7 119.4 119.7 119.3 119.3 120.2 120.7 117.3% Gmm initial 84.4 84.5 85.3 85.2 87.5 87.2 86.9 87.0Avg. % Gmm initial 84.5 85.3 87.3 86.9
Gyratory Plugs Compacted to Nmaximum at Design Optimum Asphalt Content
%AC @ Optimum Weight SSD Weight Volume Gmb Unit Specimen# in Air Weight in Water @Ndes Weight
5.9A 4821.1 4823.3 2800.1 2023.2 2.383 148.7B 4806.7 4808.9 2801.2 2007.7 2.394 149.4
Average = 2015.5 2.389 149.0
%Gmm at Nmaximum = 97.5
62

C-12 Graphs for NPM-L Superpave Mix Design with Lime SUPERPAVE HOT MIX DESIGN GRAPHS NDDOT Phase 1 NPM-L(5.5&6.0) 3/4/05Department of Transportation, Materials and Research (Rev. 7-04)
AC% UNIT AC% AirWT. Voids
5.0 143.3 5.0 7.45.5 144.5 5.5 6.16.0 147.2 6.0 3.86.5 146.2 6.5 3.9
AC% VMA AC% VFA
5.0 16.3 5.0 54.95.5 16.1 5.5 62.16.0 15.0 6.0 74.76.5 16.0 6.5 75.8
AC% %Gmm AC% MaxSpG
5.0 84.5 5.0 2.4795.5 85.3 5.5 2.4666.0 87.3 6.0 2.4516.5 86.9 6.5 2.437
Air Voids Vs % AC
1.0
3.0
5.0
7.0
9.0
5.0 5.5 6.0 6.5
% AC by Weight of Mix
% A
ir Vo
ids-
Tot
al M
ix
Unit Weight Vs % AC
140.0
145.0
150.0
5.0 5.5 6.0 6.5
% AC by Weight of Mix
Uni
t Wei
ght (
lbs)
VFA Vs % AC
40.045.050.055.060.065.070.075.080.0
5.0 5.5 6.0 6.5
% AC by Weight of Mix
% A
ggre
gate
Voi
ds F
illed
(VFA
)
VMA Vs % AC
14.0
15.0
16.0
17.0
18.0
5.0 5.5 6.0 6.5
% AC by Weight of Mix
Void
s in
Min
eral
A
ggre
gate
(VM
A)
%Gmm at Nini Vs % AC
80.082.084.086.088.090.092.094.0
5.0 5.5 6.0 6.5
% AC by Weight of Mix
% G
mm
at N
initi
al
Theo. Max. SpG Vs % AC
2.420
2.440
2.460
2.480
2.500
5.0 5.5 6.0 6.5
% AC by Weight of Mix
Avg
Theo
retic
al M
ax S
pG
63

APPENDIX D
Asphalt Pavement Analyzer (APA) Testing
64

D-1 APA Rutting Test Chart for a Dry Test (8,000 Cycles)
Rut Depth
0
2
4
6
8
10
12
14
0 300 600 900 1200 1500 1801 2101 2401 2702 3002 3302 3603 3903 4203 4504 4804 5104 5405 5705 6005 6306 6606 6906 7207 7507 7808Cycles
Dep
th(M
M)
Left Center Right
65

D-2 APA Data Sheet for a Dry Rutting Test (8,000 Cycles)
Project No. Test No. TemperatureMix ID No. Test Date Wheel LoadMix Type Data File Hose Pressure
Mold Type Operator Lab ID
STROKE COUNT F C 1 2 3 4 5Man Average
Depth APA Average Percent Change0 32 0 025 138.2 59 0.248447418 0.066745758 0 -0.185409546 -0.745342255 -0.153889656
4000 138.2 59 3.189023972 2.855289459 0 2.681005478 2.621675491 2.8367486 105.42%7975 138.2 59 3.926950455 3.485677719 0 3.411514282 3.278020859 3.525540829 19.54%8000 32 0 0
STROKE COUNT F C 1 2 3 4 5Man Average
Depth APA Average Percent Change0 32 025 138.2 59 0.269012451 0.108352661 0 -0.089670181 -0.32131958 -0.008406162
4000 138.2 59 3.097366333 2.843299866 0 2.675168991 2.671432495 2.821816921 100.30%7975 138.2 59 4.094949722 3.254289627 0 3.153409958 3.116046906 3.404674053 17.12%8000 32 0
STROKE COUNT F C 1 2 3 4 5Man Average
Depth APA Average Percent Change0 32 025 138.2 59 0.356664658 0.323226929 0 0.248922348 0.12260437 0.262854576
4000 138.2 59 4.101640701 3.852720261 0 4.514034271 5.190210342 4.414651394 94.05%7975 138.2 59 5.13448143 5.227363586 0 6.698604584 6.390237808 5.862671852 24.70%8000 32 0
Temperature
RUTTING TEST DATA SHEET
Bulk S Gravity Left Sample ID
% Air Void
% Air Void
% Air VoidDepth Gauge Reading
Temperature Depth Gauge Reading
Temperature Depth Gauge Reading
Center Sample ID
Right Sample ID Bulk S Gravity
Bulk S Gravity
66

D-3 APA Raw Data for a Dry Rutting Test (8,000 Cycles)
Left Stroke Count
Left Depth
Value 1
Left Depth
Value 2
Left Depth
Value 3
Left Depth
Value 4
Left Depth
Value 5
Center Stroke Count
Center Depth
Value 1
Center Depth
Value 2
Center Depth
Value 3
Center Depth
Value 4
Center Depth
Value 5
Right Stroke Count
Right Depth
Value 1
Right Depth
Value 2
Right Depth
Value 3
Right Depth
Value 4
Right Depth
Value 5Cabin Temp
Water Temp
Add Stroke L Avg C Avg R Avg
0 0 0 0 0 0 0 0 0 0 0 0 0 0 0 0 0 0 58 59 0 0 0 01 0.0630379 -0.114954 0 -0.3782349 -0.9047928 1 0.1643963 -0.0448341 0 -0.2316475 -0.523077 1 0.0445843 0.0408688 0 -0.0817356 -0.1634712 59 59 1 -0.3337359 -0.1587906 -0.03993842 0.0630379 -0.114954 0 -0.3782349 -0.9047928 2 0.1643963 -0.0448341 0 -0.2316475 -0.523077 2 0.0445843 0.0408688 0 -0.0817356 -0.1634712 59 59 2 -0.3337359 -0.1587906 -0.03993843 0.0630379 -0.114954 0 -0.3782349 -0.9047928 3 0.1643963 -0.0448341 0 -0.2316475 -0.523077 3 0.0445843 0.0408688 0 -0.0817356 -0.1634712 59 59 3 -0.3337359 -0.1587906 -0.03993844 0.0630379 -0.114954 0 -0.3782349 -0.9047928 4 0.1643963 -0.0448341 0 -0.2316475 -0.523077 4 0.0445843 0.0408688 0 -0.0817356 -0.1634712 59 59 4 -0.3337359 -0.1587906 -0.03993845 0.0630379 -0.114954 0 -0.3782349 -0.6192646 5 0.1643963 -0.0448341 0 -0.2316475 -0.1494503 5 0.0445843 0.0408688 0 -0.0817356 -0.0037155 59 59 5 -0.2623539 -0.0653839 4.768E-076 0.0630379 -0.114954 0 -0.5710583 -0.6192646 6 0.1643963 -0.0448341 0 -0.4072533 -0.1494503 6 0.0445843 0.0408688 0 -0.0185757 -0.0037155 59 59 6 -0.3105597 -0.1092854 0.01579057 0.0630379 -0.114954 0 -0.5710583 -0.5895996 7 0.1643963 -0.0448341 0 -0.4072533 -0.1569233 7 0.0445843 0.0408688 0 -0.0185757 0.0222931 59 59 7 -0.3031435 -0.1111536 0.02229268 0.0927029 -0.114954 0 -0.5710583 -0.5895996 8 0.0224171 -0.0448341 0 -0.4072533 -0.1569233 8 0.1040287 0.0408688 0 -0.0185757 0.0222931 59 59 8 -0.2957273 -0.1466484 0.03715379 0.0927029 -0.114954 0 -0.5710583 -0.5710583 9 0.0224171 -0.0448341 0 -0.4072533 -0.1270332 9 0.1040287 0.0408688 0 -0.0185757 0.0520134 59 59 9 -0.2910919 -0.1391759 0.0445838
10 0.1372013 -0.114954 0 -0.5710583 -0.5710583 10 0.0186825 -0.0448341 0 -0.4072533 -0.1270332 10 0.1374645 0.0408688 0 -0.0185757 0.0520134 59 59 10 -0.2799673 -0.1401095 0.052942811 0.1372013 -0.114954 0 -0.5710583 -0.5710583 11 0.0186825 -0.0448341 0 -0.4072533 -0.1270332 11 0.1374645 0.0408688 0 -0.0185757 0.0520134 59 59 11 -0.2799673 -0.1401095 0.052942812 0.1631584 -0.114954 0 -0.2706966 -0.5710583 12 0.295166 -0.0448341 0 -0.2615376 -0.1270332 12 0.2006245 0.0408688 0 0.0965977 0.0520134 59 59 12 -0.1983876 -0.0345597 0.097526113 0.1631584 -0.114954 0 -0.2706966 -0.8232136 13 0.295166 -0.0448341 0 -0.2615376 -0.3810997 13 0.2006245 0.0408688 0 0.0965977 0 59 59 13 -0.2614264 -0.0980763 0.084522714 0.1631584 -0.114954 0 -0.2706966 -0.8232136 14 0.295166 -0.0448341 0 -0.2615376 -0.3810997 14 0.2006245 0.0408688 0 0.0965977 0 59 59 14 -0.2614264 -0.0980763 0.084522715 0.1631584 -0.114954 0 -0.2706966 -0.8232136 15 0.295166 -0.0448341 0 -0.2615376 -0.3810997 15 0.2006245 0.0408688 0 0.0965977 0 59 59 15 -0.2614264 -0.0980763 0.0845227
4000 3.189024 2.8552895 0 2.6810055 2.6216755 4000 3.0973663 2.8432999 0 2.675169 2.6714325 4000 4.1016407 3.8527203 0 4.5140343 5.1902103 59 59 4000 2.8367486 2.8218169 4.41465144001 3.189024 2.8552895 0 2.6810055 2.6216755 4001 3.0973663 2.8432999 0 2.675169 2.667696 4001 4.1016407 3.8527203 0 4.5140343 5.2496548 59 59 4001 2.8367486 2.8208828 4.42951254002 3.189024 2.8552895 0 2.6810055 2.6216755 4002 3.0973663 2.8432999 0 2.6789036 2.667696 4002 4.1016407 3.8527203 0 4.4285831 5.2496548 59 59 4002 2.8367486 2.8218164 4.40814974003 3.189024 2.8552895 0 2.6921291 2.5994263 4003 3.0973663 2.8432999 0 2.6901131 2.6714325 4003 4.1016407 3.8527203 0 4.7220898 5.271946 59 59 4003 2.8339672 2.8255529 4.48709924004 3.189024 2.8552895 0 2.6921291 2.5994263 4004 3.0973663 2.8432999 0 2.6901131 2.6714325 4004 4.1016407 3.8527203 0 4.7220898 5.271946 59 59 4004 2.8339672 2.8255529 4.48709924005 3.189024 2.8552895 0 2.6921291 2.5957184 4005 3.0973663 2.8432999 0 2.6901131 2.6714325 4005 4.1016407 3.8527203 0 4.7220898 5.2459393 59 59 4005 2.8330402 2.8255529 4.48059754006 3.189024 2.8552895 0 2.7180882 2.5957184 4006 3.0973663 2.8432999 0 2.6863766 2.6714325 4006 4.1016407 3.8527203 0 4.6552143 5.2459393 59 59 4006 2.83953 2.8246188 4.46387864007 3.189024 2.8552895 0 2.7180882 2.6031342 4007 3.0973663 2.8432999 0 2.6863766 2.6789036 4007 4.1016407 3.8527203 0 4.6552143 5.2013569 59 59 4007 2.8413839 2.8264866 4.4527334008 3.189024 2.8552895 0 2.7180882 2.6031342 4008 3.0973663 2.8432999 0 2.6863766 2.6789036 4008 4.1016407 3.8527203 0 4.6552143 5.2013569 59 59 4008 2.8413839 2.8264866 4.4527334009 3.189024 2.8552895 0 2.7143784 2.5994263 4009 3.0973663 2.8432999 0 2.6863766 2.6826401 4009 4.1016407 3.8527203 0 4.81497 5.2830925 59 59 4009 2.8395295 2.8274207 4.51310594010 3.189024 2.8552895 0 2.7143784 2.5994263 4010 3.0973663 2.8432999 0 2.6863766 2.6826401 4010 4.1016407 3.8527203 0 4.81497 5.2830925 59 59 4010 2.8395295 2.8274207 4.51310594011 3.189024 2.8552895 0 2.7143784 2.6031342 4011 3.0973663 2.8432999 0 2.6863766 2.6975861 4011 4.1016407 3.8527203 0 4.81497 5.1604881 59 59 4011 2.8404565 2.8311572 4.48245484012 3.189024 2.8552895 0 2.7106705 2.6031342 4012 3.0973663 2.8432999 0 2.6863766 2.6975861 4012 4.1016407 3.8527203 0 4.7629566 5.1604881 59 59 4012 2.8395295 2.8311572 4.46945144013 3.189024 2.8552895 0 2.7106705 2.5994263 4013 3.0973663 2.8432999 0 2.6863766 2.667696 4013 4.1016407 3.8527203 0 4.7629566 5.271946 59 59 4013 2.8386025 2.8236847 4.49731594014 3.189024 2.8552895 0 2.6995468 2.5994263 4014 3.0973663 2.8432999 0 2.7125301 2.667696 4014 4.1016407 3.8527203 0 4.7146587 5.271946 59 59 4014 2.8358216 2.8302231 4.48524144015 3.189024 2.8552895 0 2.7069626 2.606842 4015 3.0973663 2.8432999 0 2.7050591 2.6639595 4015 4.1016407 3.8527203 0 4.7480965 5.2645168 59 59 4015 2.8395295 2.8274212 4.4917436 7980 3.9269505 3.4856777 0 3.4115143 3.2780209 7980 4.0949497 3.2542896 0 3.15341 3.1160469 7980 5.1344814 5.2273636 0 6.6986046 6.3902378 59 59 7980 3.5255408 3.4046741 5.86267197981 3.9269505 3.4856777 0 3.4115143 3.2780209 7981 4.0949497 3.2542896 0 3.15341 3.1160469 7981 5.1344814 5.2273636 0 6.6986046 6.3902378 59 59 7981 3.5255408 3.4046741 5.86267197982 3.9269505 3.4856777 0 3.4115143 3.2780209 7982 4.0949497 3.2542896 0 3.15341 3.1160469 7982 5.1344814 5.2273636 0 6.6986046 6.3902378 59 59 7982 3.5255408 3.4046741 5.86267197983 3.9269505 3.4856777 0 3.4115143 3.2780209 7983 4.0949497 3.2542896 0 3.15341 3.1160469 7983 5.1344814 5.2273636 0 6.6986046 6.3902378 59 59 7983 3.5255408 3.4046741 5.86267197984 3.9269505 3.4856777 0 3.4115143 3.2780209 7984 4.0949497 3.2542896 0 3.15341 3.1160469 7984 5.1344814 5.2273636 0 6.6986046 6.3902378 59 59 7984 3.5255408 3.4046741 5.86267197985 3.9269505 3.4448891 0 3.4115143 3.2780209 7985 4.0949497 3.7400036 0 3.15341 3.1160469 7985 5.1344814 5.0267391 0 6.6986046 6.3902378 59 59 7985 3.5153437 3.5261025 5.81251577986 3.9269505 3.4448891 0 3.4115143 3.2780209 7986 4.0949497 3.7400036 0 3.15341 3.1160469 7986 5.1344814 5.0267391 0 6.6986046 6.3902378 59 59 7986 3.5153437 3.5261025 5.81251577987 3.9269505 3.4448891 0 3.4115143 3.3113937 7987 4.0949497 3.7400036 0 3.15341 3.1272564 7987 5.1344814 5.0267391 0 6.6986046 6.4088135 59 59 7987 3.5236869 3.5289049 5.81715977988 3.9269505 3.4448891 0 3.3744335 3.3113937 7988 4.0949497 3.7400036 0 3.3663769 3.1272564 7988 5.1344814 5.0267391 0 6.6428757 6.4088135 59 59 7988 3.5144167 3.5821466 5.80322747989 3.9269505 3.4448891 0 3.3744335 3.2965622 7989 4.0949497 3.7400036 0 3.3663769 3.1272564 7989 5.1344814 5.0267391 0 6.6428757 6.7246113 59 59 7989 3.5107088 3.5821466 5.88217697990 3.9269505 3.4448891 0 3.3670158 3.2965622 7990 4.0949497 3.7400036 0 3.3850594 3.1272564 7990 5.1344814 5.0267391 0 6.2341976 6.7246113 59 59 7990 3.5088544 3.5868173 5.78000747991 3.9269505 3.4448891 0 3.3670158 3.2854366 7991 4.0949497 3.7400036 0 3.3850594 3.1272564 7991 5.1344814 5.0267391 0 6.2341976 6.6725979 59 59 7991 3.506073 3.5868173 5.7670047992 3.8157043 3.4448891 0 3.3670158 3.2854366 7992 3.6690159 3.7400036 0 3.3850594 3.1272564 7992 5.1790657 5.0267391 0 6.2341976 6.6725979 59 59 7992 3.4782615 3.4803338 5.77815017993 3.8157043 3.4448891 0 3.3670158 3.2854366 7993 3.6690159 3.7400036 0 3.3850594 3.1272564 7993 5.1790657 5.0267391 0 6.2341976 6.6725979 59 59 7993 3.4782615 3.4803338 5.77815017994 3.8268299 3.4448891 0 3.3855572 3.2854366 7994 3.6615429 3.7400036 0 3.1608829 3.1272564 7994 5.1864948 5.0267391 0 6.743187 6.6725979 59 59 7994 3.4856782 3.4224215 5.90725477995 3.941782 3.4448891 0 3.3855572 3.2854366 7995 4.0575867 3.7400036 0 3.1608829 3.1272564 7995 5.1976414 5.0267391 0 6.743187 6.6725979 59 59 7995 3.5144162 3.5214324 5.91004137996 3.8268299 3.4448891 0 3.3855572 3.2854366 7996 3.7885761 3.7400036 0 3.1608829 3.1272564 7996 5.1790657 5.0267391 0 6.743187 6.6725979 59 59 7996 3.4856782 3.4541798 5.90539747997 3.9491997 3.4448891 0 3.3855572 3.2557716 7997 4.0463791 3.7400036 0 3.1608829 3.1571465 7997 5.2013569 5.0267391 0 6.743187 6.4571133 59 59 7997 3.5088544 3.526103 5.85709917998 3.8268299 3.4448891 0 3.3855572 3.2557716 7998 3.7736301 3.7400036 0 3.1683559 3.1571465 7998 5.1716347 5.0267391 0 6.7952003 6.4571133 59 59 7998 3.4782619 3.459784 5.86267197999 3.8268299 3.4448891 0 3.3855572 3.2631874 7999 3.7736301 3.7400036 0 3.1683559 3.1085758 7999 5.1716347 5.0267391 0 6.7952003 6.5351334 59 59 7999 3.4801159 3.4476414 5.88217698000 3.8268299 3.4448891 0 3.3855572 3.2631874 8000 3.7250595 3.7400036 0 3.1683559 3.1085758 8000 5.1827812 5.0267391 0 6.7952003 6.5351334 59 59 8000 3.4801159 3.4354987 5.8849635
0 0 0 0 0 0 0 0 0 0 0 0 0 0 0 0 0 0 59 59 0 0 0 0
67

D-4 APA Rutting Test Chart for a Wet Test (25,000 Cycles)
Rut Depth
0
2
4
6
8
10
12
14
010
0020
0030
0040
0050
0060
0070
0080
0090
0010
000
1100
012
000
1300
014
000
1500
016
000
1700
018
000
1900
020
000
2100
022
000
2300
024
000
Cycles
Dep
th(M
M)
Left Center Right
68

D-5 APA Data Sheet for a Wet Rutting Test (25,000 Cycles)
Project No. NDDOT Phase I Test No. Temperature 58 oCMix ID No.CHK Confirm Block 2 Test Date Wheel Load 100 psiMix Type Superpave 7% air Data File Hose Pressure 100 psi
Mold Type 75 mm Operator Suleiman Lab ID UND
C1, C2
H1, H2
K1, K2
STROKE COUNT F C 1 2 3 4 5Man Average
Depth APA Average Percent Change0 32 0 01 136.4 58 0.085338593 -0.137285233 0 -0.515750885 -0.474935532 -0.260658264
25000 136.4 58 6.882862091 6.675077438 0 6.949649811 6.292901993 6.700122833 103.89%25000 136.4 58 6.882862091 6.463582993 0 6.949649811 6.292901993 6.647249222 -0.80%25000 32 0 0
STROKE COUNT F C 1 2 3 4 5Man Average
Depth APA Average Percent Change0 32 01 136.4 58 0.070978165 -0.138221741 0 -0.564094543 -0.339950562 -0.24282217
25000 136.4 58 7.98324585 8.775220871 0 8.741598129 8.274633408 8.443674564 102.88%25000 136.4 58 7.98324585 8.244747162 0 8.741598129 8.274633408 8.311056137 -1.60%25000 32 0
STROKE COUNT F C 1 2 3 4 5Man Average
Depth APA Average Percent Change0 32 01 136.4 58 0.13007164 -0.349334717 0 -0.386497498 -0.237844467 -0.21090126
25000 136.4 58 6.663373947 6.626211166 0 6.711685181 6.603912354 6.651295662 103.17%25000 136.4 58 6.663373947 6.529584885 0 6.711685181 6.603912354 6.627139091 -0.36%25000 32 0
Temperature Depth Gauge Reading
% Air Void ID Bulk S Gravity
Temperature Depth Gauge Reading
Temperature Depth Gauge Reading
Bulk S Gravity ID % Air Void
Bulk S Gravity ID
MOISTURE TEST DATA SHEET
Right Sample
Center Sample
Left Sample % Air Void
69
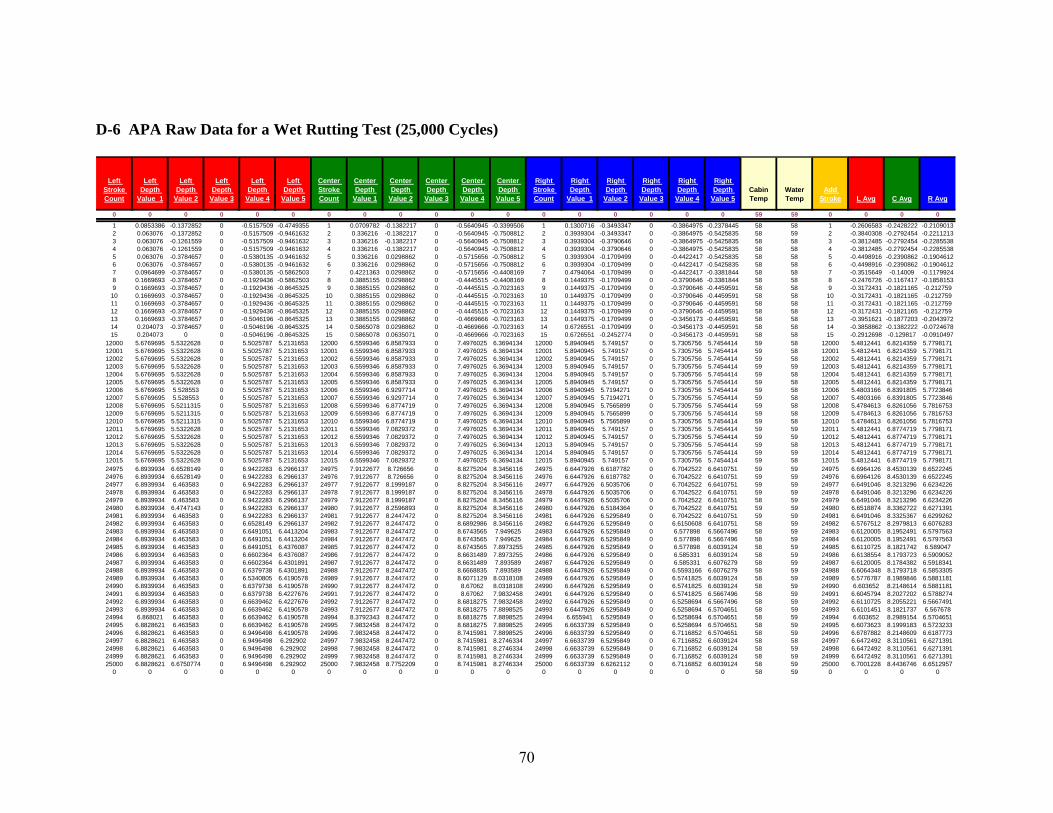
D-6 APA Raw Data for a Wet Rutting Test (25,000 Cycles)
Left Stroke Count
Left Depth
Value 1
Left Depth
Value 2
Left Depth
Value 3
Left Depth
Value 4
Left Depth
Value 5
Center Stroke Count
Center Depth
Value 1
Center Depth
Value 2
Center Depth
Value 3
Center Depth
Value 4
Center Depth
Value 5
Right Stroke Count
Right Depth
Value 1
Right Depth
Value 2
Right Depth
Value 3
Right Depth
Value 4
Right Depth
Value 5Cabin Temp
Water Temp
Add Stroke L Avg C Avg R Avg
0 0 0 0 0 0 0 0 0 0 0 0 0 0 0 0 0 0 59 59 0 0 0 0
1 0.0853386 -0.1372852 0 -0.5157509 -0.4749355 1 0.0709782 -0.1382217 0 -0.5640945 -0.3399506 1 0.1300716 -0.3493347 0 -0.3864975 -0.2378445 58 58 1 -0.2606583 -0.2428222 -0.21090132 0.063076 -0.1372852 0 -0.5157509 -0.9461632 2 0.336216 -0.1382217 0 -0.5640945 -0.7508812 2 0.3939304 -0.3493347 0 -0.3864975 -0.5425835 58 59 2 -0.3840308 -0.2792454 -0.22112133 0.063076 -0.1261559 0 -0.5157509 -0.9461632 3 0.336216 -0.1382217 0 -0.5640945 -0.7508812 3 0.3939304 -0.3790646 0 -0.3864975 -0.5425835 58 58 3 -0.3812485 -0.2792454 -0.22855384 0.063076 -0.1261559 0 -0.5157509 -0.9461632 4 0.336216 -0.1382217 0 -0.5640945 -0.7508812 4 0.3939304 -0.3790646 0 -0.3864975 -0.5425835 58 58 4 -0.3812485 -0.2792454 -0.22855385 0.063076 -0.3784657 0 -0.5380135 -0.9461632 5 0.336216 0.0298862 0 -0.5715656 -0.7508812 5 0.3939304 -0.1709499 0 -0.4422417 -0.5425835 58 58 5 -0.4498916 -0.2390862 -0.19046126 0.063076 -0.3784657 0 -0.5380135 -0.9461632 6 0.336216 0.0298862 0 -0.5715656 -0.7508812 6 0.3939304 -0.1709499 0 -0.4422417 -0.5425835 58 58 6 -0.4498916 -0.2390862 -0.19046127 0.0964699 -0.3784657 0 -0.5380135 -0.5862503 7 0.4221363 0.0298862 0 -0.5715656 -0.4408169 7 0.4794064 -0.1709499 0 -0.4422417 -0.3381844 58 58 7 -0.3515649 -0.14009 -0.11799248 0.1669693 -0.3784657 0 -0.1929436 -0.5862503 8 0.3885155 0.0298862 0 -0.4445515 -0.4408169 8 0.1449375 -0.1709499 0 -0.3790646 -0.3381844 58 58 8 -0.2476726 -0.1167417 -0.18581539 0.1669693 -0.3784657 0 -0.1929436 -0.8645325 9 0.3885155 0.0298862 0 -0.4445515 -0.7023163 9 0.1449375 -0.1709499 0 -0.3790646 -0.4459591 58 58 9 -0.3172431 -0.1821165 -0.212759
10 0.1669693 -0.3784657 0 -0.1929436 -0.8645325 10 0.3885155 0.0298862 0 -0.4445515 -0.7023163 10 0.1449375 -0.1709499 0 -0.3790646 -0.4459591 58 58 10 -0.3172431 -0.1821165 -0.21275911 0.1669693 -0.3784657 0 -0.1929436 -0.8645325 11 0.3885155 0.0298862 0 -0.4445515 -0.7023163 11 0.1449375 -0.1709499 0 -0.3790646 -0.4459591 58 58 11 -0.3172431 -0.1821165 -0.21275912 0.1669693 -0.3784657 0 -0.1929436 -0.8645325 12 0.3885155 0.0298862 0 -0.4445515 -0.7023163 12 0.1449375 -0.1709499 0 -0.3790646 -0.4459591 58 58 12 -0.3172431 -0.1821165 -0.21275913 0.1669693 -0.3784657 0 -0.5046196 -0.8645325 13 0.3885155 0.0298862 0 -0.4669666 -0.7023163 13 0.1449375 -0.1709499 0 -0.3456173 -0.4459591 58 58 13 -0.3951621 -0.1877203 -0.204397214 0.204073 -0.3784657 0 -0.5046196 -0.8645325 14 0.5865078 0.0298862 0 -0.4669666 -0.7023163 14 0.6726551 -0.1709499 0 -0.3456173 -0.4459591 58 58 14 -0.3858862 -0.1382222 -0.072467815 0.204073 0 0 -0.5046196 -0.8645325 15 0.5865078 0.0635071 0 -0.4669666 -0.7023163 15 0.6726551 -0.2452774 0 -0.3456173 -0.4459591 58 58 15 -0.2912698 -0.129817 -0.0910497
12000 5.6769695 5.5322628 0 5.5025787 5.2131653 12000 6.5599346 6.8587933 0 7.4976025 6.3694134 12000 5.8940945 5.749157 0 5.7305756 5.7454414 59 58 12000 5.4812441 6.8214359 5.779817112001 5.6769695 5.5322628 0 5.5025787 5.2131653 12001 6.5599346 6.8587933 0 7.4976025 6.3694134 12001 5.8940945 5.749157 0 5.7305756 5.7454414 59 58 12001 5.4812441 6.8214359 5.779817112002 5.6769695 5.5322628 0 5.5025787 5.2131653 12002 6.5599346 6.8587933 0 7.4976025 6.3694134 12002 5.8940945 5.749157 0 5.7305756 5.7454414 59 58 12002 5.4812441 6.8214359 5.779817112003 5.6769695 5.5322628 0 5.5025787 5.2131653 12003 6.5599346 6.8587933 0 7.4976025 6.3694134 12003 5.8940945 5.749157 0 5.7305756 5.7454414 59 59 12003 5.4812441 6.8214359 5.779817112004 5.6769695 5.5322628 0 5.5025787 5.2131653 12004 6.5599346 6.8587933 0 7.4976025 6.3694134 12004 5.8940945 5.749157 0 5.7305756 5.7454414 59 58 12004 5.4812441 6.8214359 5.779817112005 5.6769695 5.5322628 0 5.5025787 5.2131653 12005 6.5599346 6.8587933 0 7.4976025 6.3694134 12005 5.8940945 5.749157 0 5.7305756 5.7454414 59 58 12005 5.4812441 6.8214359 5.779817112006 5.6769695 5.528553 0 5.5025787 5.2131653 12006 6.5599346 6.9297714 0 7.4976025 6.3694134 12006 5.8940945 5.7194271 0 5.7305756 5.7454414 59 58 12006 5.4803166 6.8391805 5.772384612007 5.6769695 5.528553 0 5.5025787 5.2131653 12007 6.5599346 6.9297714 0 7.4976025 6.3694134 12007 5.8940945 5.7194271 0 5.7305756 5.7454414 59 58 12007 5.4803166 6.8391805 5.772384612008 5.6769695 5.5211315 0 5.5025787 5.2131653 12008 6.5599346 6.8774719 0 7.4976025 6.3694134 12008 5.8940945 5.7565899 0 5.7305756 5.7454414 59 58 12008 5.4784613 6.8261056 5.781675312009 5.6769695 5.5211315 0 5.5025787 5.2131653 12009 6.5599346 6.8774719 0 7.4976025 6.3694134 12009 5.8940945 5.7565899 0 5.7305756 5.7454414 59 58 12009 5.4784613 6.8261056 5.781675312010 5.6769695 5.5211315 0 5.5025787 5.2131653 12010 6.5599346 6.8774719 0 7.4976025 6.3694134 12010 5.8940945 5.7565899 0 5.7305756 5.7454414 59 58 12010 5.4784613 6.8261056 5.781675312011 5.6769695 5.5322628 0 5.5025787 5.2131653 12011 6.5599346 7.0829372 0 7.4976025 6.3694134 12011 5.8940945 5.749157 0 5.7305756 5.7454414 59 59 12011 5.4812441 6.8774719 5.779817112012 5.6769695 5.5322628 0 5.5025787 5.2131653 12012 6.5599346 7.0829372 0 7.4976025 6.3694134 12012 5.8940945 5.749157 0 5.7305756 5.7454414 59 59 12012 5.4812441 6.8774719 5.779817112013 5.6769695 5.5322628 0 5.5025787 5.2131653 12013 6.5599346 7.0829372 0 7.4976025 6.3694134 12013 5.8940945 5.749157 0 5.7305756 5.7454414 59 58 12013 5.4812441 6.8774719 5.779817112014 5.6769695 5.5322628 0 5.5025787 5.2131653 12014 6.5599346 7.0829372 0 7.4976025 6.3694134 12014 5.8940945 5.749157 0 5.7305756 5.7454414 59 59 12014 5.4812441 6.8774719 5.779817112015 5.6769695 5.5322628 0 5.5025787 5.2131653 12015 6.5599346 7.0829372 0 7.4976025 6.3694134 12015 5.8940945 5.749157 0 5.7305756 5.7454414 59 58 12015 5.4812441 6.8774719 5.7798171 24975 6.8939934 6.6528149 0 6.9422283 6.2966137 24975 7.9122677 8.726656 0 8.8275204 8.3456116 24975 6.6447926 6.6187782 0 6.7042522 6.6410751 59 59 24975 6.6964126 8.4530139 6.652224524976 6.8939934 6.6528149 0 6.9422283 6.2966137 24976 7.9122677 8.726656 0 8.8275204 8.3456116 24976 6.6447926 6.6187782 0 6.7042522 6.6410751 59 59 24976 6.6964126 8.4530139 6.652224524977 6.8939934 6.463583 0 6.9422283 6.2966137 24977 7.9122677 8.1999187 0 8.8275204 8.3456116 24977 6.6447926 6.5035706 0 6.7042522 6.6410751 59 59 24977 6.6491046 8.3213296 6.623422624978 6.8939934 6.463583 0 6.9422283 6.2966137 24978 7.9122677 8.1999187 0 8.8275204 8.3456116 24978 6.6447926 6.5035706 0 6.7042522 6.6410751 59 59 24978 6.6491046 8.3213296 6.623422624979 6.8939934 6.463583 0 6.9422283 6.2966137 24979 7.9122677 8.1999187 0 8.8275204 8.3456116 24979 6.6447926 6.5035706 0 6.7042522 6.6410751 58 59 24979 6.6491046 8.3213296 6.623422624980 6.8939934 6.4747143 0 6.9422283 6.2966137 24980 7.9122677 8.2596893 0 8.8275204 8.3456116 24980 6.6447926 6.5184364 0 6.7042522 6.6410751 59 59 24980 6.6518874 8.3362722 6.627139124981 6.8939934 6.463583 0 6.9422283 6.2966137 24981 7.9122677 8.2447472 0 8.8275204 8.3456116 24981 6.6447926 6.5295849 0 6.7042522 6.6410751 59 59 24981 6.6491046 8.3325367 6.629926224982 6.8939934 6.463583 0 6.6528149 6.2966137 24982 7.9122677 8.2447472 0 8.6892986 8.3456116 24982 6.6447926 6.5295849 0 6.6150608 6.6410751 58 59 24982 6.5767512 8.2979813 6.607628324983 6.8939934 6.463583 0 6.6491051 6.4413204 24983 7.9122677 8.2447472 0 8.6743565 7.949625 24983 6.6447926 6.5295849 0 6.577898 6.5667496 58 59 24983 6.6120005 8.1952491 6.579756324984 6.8939934 6.463583 0 6.6491051 6.4413204 24984 7.9122677 8.2447472 0 8.6743565 7.949625 24984 6.6447926 6.5295849 0 6.577898 6.5667496 58 59 24984 6.6120005 8.1952491 6.579756324985 6.8939934 6.463583 0 6.6491051 6.4376087 24985 7.9122677 8.2447472 0 8.6743565 7.8973255 24985 6.6447926 6.5295849 0 6.577898 6.6039124 58 59 24985 6.6110725 8.1821742 6.58904724986 6.8939934 6.463583 0 6.6602364 6.4376087 24986 7.9122677 8.2447472 0 8.6631489 7.8973255 24986 6.6447926 6.5295849 0 6.585331 6.6039124 58 59 24986 6.6138554 8.1793723 6.590905224987 6.8939934 6.463583 0 6.6602364 6.4301891 24987 7.9122677 8.2447472 0 8.6631489 7.893589 24987 6.6447926 6.5295849 0 6.585331 6.6076279 58 59 24987 6.6120005 8.1784382 6.591834124988 6.8939934 6.463583 0 6.6379738 6.4301891 24988 7.9122677 8.2447472 0 8.6668835 7.893589 24988 6.6447926 6.5295849 0 6.5593166 6.6076279 58 59 24988 6.6064348 8.1793718 6.585330524989 6.8939934 6.463583 0 6.5340805 6.4190578 24989 7.9122677 8.2447472 0 8.6071129 8.0318108 24989 6.6447926 6.5295849 0 6.5741825 6.6039124 58 59 24989 6.5776787 8.1989846 6.588118124990 6.8939934 6.463583 0 6.6379738 6.4190578 24990 7.9122677 8.2447472 0 8.67062 8.0318108 24990 6.6447926 6.5295849 0 6.5741825 6.6039124 58 59 24990 6.603652 8.2148614 6.588118124991 6.8939934 6.463583 0 6.6379738 6.4227676 24991 7.9122677 8.2447472 0 8.67062 7.9832458 24991 6.6447926 6.5295849 0 6.5741825 6.5667496 58 59 24991 6.6045794 8.2027202 6.578827424992 6.8939934 6.463583 0 6.6639462 6.4227676 24992 7.9122677 8.2447472 0 8.6818275 7.9832458 24992 6.6447926 6.5295849 0 6.5258694 6.5667496 58 59 24992 6.6110725 8.2055221 6.566749124993 6.8939934 6.463583 0 6.6639462 6.4190578 24993 7.9122677 8.2447472 0 8.6818275 7.8898525 24993 6.6447926 6.5295849 0 6.5258694 6.5704651 58 59 24993 6.6101451 8.1821737 6.56767824994 6.868021 6.463583 0 6.6639462 6.4190578 24994 8.3792343 8.2447472 0 8.6818275 7.8898525 24994 6.655941 6.5295849 0 6.5258694 6.5704651 58 59 24994 6.603652 8.2989154 6.570465124995 6.8828621 6.463583 0 6.6639462 6.4190578 24995 7.9832458 8.2447472 0 8.6818275 7.8898525 24995 6.6633739 6.5295849 0 6.5258694 6.5704651 58 59 24995 6.6073623 8.1999183 6.572323324996 6.8828621 6.463583 0 6.9496498 6.4190578 24996 7.9832458 8.2447472 0 8.7415981 7.8898525 24996 6.6633739 6.5295849 0 6.7116852 6.5704651 58 59 24996 6.6787882 8.2148609 6.618777324997 6.8828621 6.463583 0 6.9496498 6.292902 24997 7.9832458 8.2447472 0 8.7415981 8.2746334 24997 6.6633739 6.5295849 0 6.7116852 6.6039124 58 58 24997 6.6472492 8.3110561 6.627139124998 6.8828621 6.463583 0 6.9496498 6.292902 24998 7.9832458 8.2447472 0 8.7415981 8.2746334 24998 6.6633739 6.5295849 0 6.7116852 6.6039124 58 59 24998 6.6472492 8.3110561 6.627139124999 6.8828621 6.463583 0 6.9496498 6.292902 24999 7.9832458 8.2447472 0 8.7415981 8.2746334 24999 6.6633739 6.5295849 0 6.7116852 6.6039124 58 59 24999 6.6472492 8.3110561 6.627139125000 6.8828621 6.6750774 0 6.9496498 6.292902 25000 7.9832458 8.7752209 0 8.7415981 8.2746334 25000 6.6633739 6.6262112 0 6.7116852 6.6039124 58 59 25000 6.7001228 8.4436746 6.6512957
0 0 0 0 0 0 0 0 0 0 0 0 0 0 0 0 0 0 58 59 0 0 0 0
70

APPENDIX E
Moisture Sensitivity Testing (Modified Lottman)
71
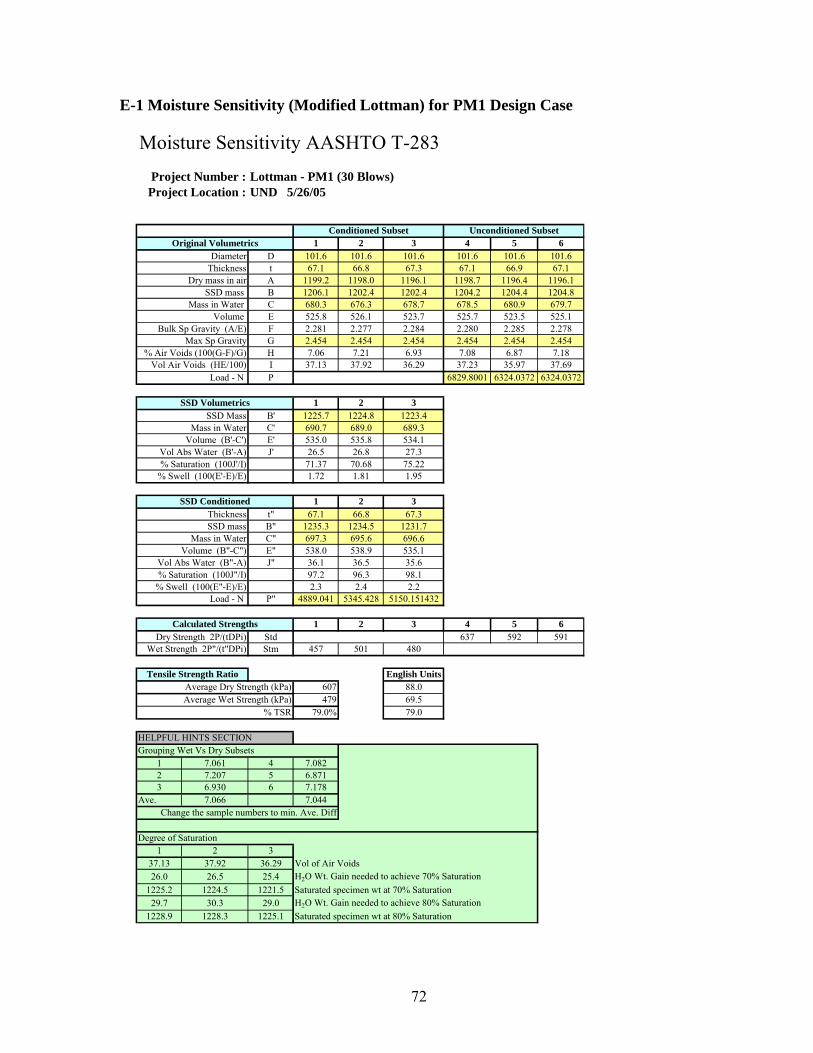
E-1 Moisture Sensitivity (Modified Lottman) for PM1 Design Case
Moisture Sensitivity AASHTO T-283Project Number :Project Location :
1 2 3 4 5 6D 101.6 101.6 101.6 101.6 101.6 101.6t 67.1 66.8 67.3 67.1 66.9 67.1A 1199.2 1198.0 1196.1 1198.7 1196.4 1196.1B 1206.1 1202.4 1202.4 1204.2 1204.4 1204.8C 680.3 676.3 678.7 678.5 680.9 679.7E 525.8 526.1 523.7 525.7 523.5 525.1F 2.281 2.277 2.284 2.280 2.285 2.278G 2.454 2.454 2.454 2.454 2.454 2.454H 7.06 7.21 6.93 7.08 6.87 7.18I 37.13 37.92 36.29 37.23 35.97 37.69P 6829.8001 6324.0372 6324.0372
1 2 3B' 1225.7 1224.8 1223.4C' 690.7 689.0 689.3E' 535.0 535.8 534.1J' 26.5 26.8 27.3
71.37 70.68 75.221.72 1.81 1.95
1 2 3t" 67.1 66.8 67.3B" 1235.3 1234.5 1231.7C" 697.3 695.6 696.6E" 538.0 538.9 535.1J" 36.1 36.5 35.6
97.2 96.3 98.12.3 2.4 2.2
P" 4889.041 5345.428 5150.151432
1 2 3 4 5 6Std 637 592 591Stm 457 501 480
English Units607 88.0479 69.5
79.0% 79.0
HELPFUL HINTS SECTIONGrouping Wet Vs Dry Subsets
1 7.061 4 7.0822 7.207 5 6.8713 6.930 6 7.178
Ave. 7.066 7.044Change the sample numbers to min. Ave. Diff
Degree of Saturation1 2 3
37.13 37.92 36.29 Vol of Air Voids26.0 26.5 25.4 H2O Wt. Gain needed to achieve 70% Saturation
1225.2 1224.5 1221.5 Saturated specimen wt at 70% Saturation29.7 30.3 29.0 H2O Wt. Gain needed to achieve 80% Saturation
1228.9 1228.3 1225.1 Saturated specimen wt at 80% Saturation
Bulk Sp Gravity (A/E)Max Sp Gravity
Lottman - PM1 (30 Blows)UND 5/26/05
Conditioned Subset Unconditioned Subset
Vol Air Voids (HE/100)Load - N
% Saturation (100J'/I)
Volume (B'-C')Vol Abs Water (B'-A)
SSD MassMass in Water
% Swell (100(E'-E)/E)
SSD Volumetrics
Original VolumetricsDiameter
ThicknessDry mass in air
SSD mass Mass in Water
Volume
% Air Voids (100(G-F)/G)
% TSR
Dry Strength 2P/(tDPi)Wet Strength 2P"/(t"DPi)
ThicknessSSD mass
Mass in WaterVolume (B"-C")
Tensile Strength Ratio
SSD Conditioned
Calculated Strengths
Vol Abs Water (B"-A)% Saturation (100J"/I)
% Swell (100(E"-E)/E)Load - N
Average Dry Strength (kPa)Average Wet Strength (kPa)
72

E-2 Moisture Sensitivity (Modified Lottman) for PM1-L Design Case
Moisture Sensitivity AASHTO T-283Project Number :Project Location :
1 2 3 4 5 6D 101.6 101.6 101.6 101.6 101.6 101.6t 64.2 64.4 65.3 64.4 65.1 64.2A 1143.4 1146.0 1148.0 1146.3 1147.7 1149.1B 1149.0 1151.0 1157.2 1151.0 1152.8 1153.4C 643.1 642.6 642.3 639.5 639.7 645.6E 505.9 508.4 514.9 511.5 513.1 507.8F 2.260 2.254 2.230 2.241 2.237 2.263G 2.437 2.437 2.437 2.437 2.437 2.437H 7.26 7.50 8.51 8.04 8.22 7.14I 36.72 38.15 43.83 41.13 42.15 36.28P 6062.9266 5997.9825 6128.3154
1 2 3B' 1169.8 1172.9 1179.0C' 659.5 660.3 662.9E' 510.3 512.6 516.1J' 26.4 26.9 31.0
71.90 70.51 70.730.86 0.82 0.23
1 2 3t" 64.2 64.4 65.3B" 1178.2 1182.4 1189.5C" 667.7 668.7 669.2E" 510.5 513.7 520.3J" 34.8 36.4 41.5
94.8 95.4 94.70.9 1.0 1.0
P" 5541.15 5606.539 4889.0408
1 2 3 4 5 6Std 590 578 598Stm 541 545 469
English Units588 85.4518 75.2
88.1% 88.1
HELPFUL HINTS SECTIONGrouping Wet Vs Dry Subsets
1 7.258 4 8.0402 7.504 5 8.2153 8.512 6 7.144
Ave. 7.758 7.800Change the sample numbers to min. Ave. Diff
Degree of Saturation1 2 3
36.72 38.15 43.83 Vol of Air Voids25.7 26.7 30.7 H2O Wt. Gain needed to achieve 70% Saturation
1169.1 1172.7 1178.7 Saturated specimen wt at 70% Saturation29.4 30.5 35.1 H2O Wt. Gain needed to achieve 80% Saturation
1172.8 1176.5 1183.1 Saturated specimen wt at 80% Saturation
Tensile Strength Ratio
SSD Conditioned
Calculated Strengths
Vol Abs Water (B"-A)% Saturation (100J"/I)
% Swell (100(E"-E)/E)Load - N
Average Dry Strength (kPa)Average Wet Strength (kPa)
% TSR
Dry Strength 2P/(tDPi)Wet Strength 2P"/(t"DPi)
ThicknessSSD mass
Mass in WaterVolume (B"-C")
% Swell (100(E'-E)/E)
SSD Volumetrics
Original VolumetricsDiameter
ThicknessDry mass in air
SSD mass Mass in Water
Volume
% Air Voids (100(G-F)/G)
% Saturation (100J'/I)
Volume (B'-C')Vol Abs Water (B'-A)
SSD MassMass in Water
Bulk Sp Gravity (A/E)Max Sp Gravity
Lottman - PM1-L with Lime (27 Blows)UND 6/8/05
Conditioned Subset Unconditioned Subset
Vol Air Voids (HE/100)Load - N
73

E-3 Moisture Sensitivity (Modified Lottman) for PM2 Design Case
Moisture Sensitivity AASHTO T-283Project Number :Project Location :
1 2 3 4 5 6D 101.6 101.6 101.6 101.6 101.6 101.6t 66.2 65.9 66.3 65.9 66.0 66.2A 1188.5 1185.5 1188.9 1187.4 1186.5 1189.7B 1190.6 1188.0 1191.9 1189.6 1187.9 1193.2C 666.4 667.5 667.8 667.8 663.2 671.0E 524.2 520.5 524.1 521.8 524.7 522.2F 2.267 2.278 2.268 2.276 2.261 2.278G 2.432 2.432 2.432 2.432 2.432 2.432H 6.77 6.35 6.72 6.43 7.02 6.32I 35.51 33.04 35.24 33.56 36.83 33.01P 4367.2644 4628.375 4628.375
1 2 3B' 1214.4 1209.9 1214.2C' 688.8 688.5 686.7E' 525.6 521.4 527.5J' 25.9 24.4 25.3
72.94 73.85 71.790.27 0.17 0.64
1 2 3t" 66.2 65.9 66.3B" 1220.9 1212.8 1220.9C" 692.5 690.2 692.9E" 528.4 522.6 528.0J" 32.4 27.3 32.0
91.2 82.6 90.80.8 0.4 0.7
P" 3845.488 3975.821 4171.542592
1 2 3 4 5 6Std 415 439 438Stm 364 378 394
English Units431 62.5379 55.0
87.9% 87.9
HELPFUL HINTS SECTIONGrouping Wet Vs Dry Subsets
1 6.774 4 6.4322 6.348 5 7.0193 6.724 6 6.322
Ave. 6.615 6.591Change the sample numbers to min. Ave. Diff
Degree of Saturation1 2 3
35.51 33.04 35.24 Vol of Air Voids24.9 23.1 24.7 H2O Wt. Gain needed to achieve 70% Saturation
1213.4 1208.6 1213.6 Saturated specimen wt at 70% Saturation28.4 26.4 28.2 H2O Wt. Gain needed to achieve 80% Saturation
1216.9 1211.9 1217.1 Saturated specimen wt at 80% Saturation
Bulk Sp Gravity (A/E)Max Sp Gravity
Lottman - PM2 (29 Blows)UND 5/30/05
Conditioned Subset Unconditioned Subset
Vol Air Voids (HE/100)Load - N
% Saturation (100J'/I)
Volume (B'-C')Vol Abs Water (B'-A)
SSD MassMass in Water
% Swell (100(E'-E)/E)
SSD Volumetrics
Original VolumetricsDiameter
ThicknessDry mass in air
SSD mass Mass in Water
Volume
% Air Voids (100(G-F)/G)
% TSR
Dry Strength 2P/(tDPi)Wet Strength 2P"/(t"DPi)
ThicknessSSD mass
Mass in WaterVolume (B"-C")
Tensile Strength Ratio
SSD Conditioned
Calculated Strengths
Vol Abs Water (B"-A)% Saturation (100J"/I)
% Swell (100(E"-E)/E)Load - N
Average Dry Strength (kPa)Average Wet Strength (kPa)
74

E-4 Moisture Sensitivity (Modified Lottman) for PM2-L Design Case
Moisture Sensitivity AASHTO T-283Project Number :
Project Location :
1 2 3 4 5 6D 101.6 101.6 101.6 101.6 101.6 101.6t 66.5 66.3 66.5 66.3 67.5 67.2A 1186.8 1187.7 1184.9 1186.5 1187.9 1188.5B 1190.4 1191.2 1189.2 1190.2 1193.4 1196.5C 665.2 666.0 663.8 666.2 665.0 669.4E 525.2 525.2 525.4 524.0 528.4 527.1F 2.260 2.261 2.255 2.264 2.248 2.255G 2.434 2.434 2.434 2.434 2.434 2.434H 7.16 7.09 7.34 6.97 7.64 7.36I 37.61 37.24 38.59 36.53 40.36 38.81P 4693.319 4236.9315 5019.3737
1 2 3B' 1214.0 1215.1 1212.5C' 686.4 687.3 684.5E' 527.6 527.8 528.0J' 27.2 27.4 27.6
72.33 73.58 71.520.45 0.49 0.49
1 2 3t" 66.5 66.3 66.5B" 1218.9 1219.3 1216.8C" 690.1 689.8 687.3E" 528.8 529.5 529.5J" 32.1 31.6 31.9
85.4 84.9 82.70.7 0.8 0.8
P" 3780.544 4693.319 3975.820824
1 2 3 4 5 6Std 443 393 468Stm 356 443 375
English Units435 63.1391 56.8
90.0% 90.0
HELPFUL HINTS SECTIONGrouping Wet Vs Dry Subsets
1 7.161 4 6.9722 7.090 5 7.6373 7.345 6 7.363
Ave. 7.198 7.324Change the sample numbers to min. Ave. Diff
Degree of Saturation1 2 3
37.61 37.24 38.59 Vol of Air Voids26.3 26.1 27.0 H2O Wt. Gain needed to achieve 70% Saturation
1213.1 1213.8 1211.9 Saturated specimen wt at 70% Saturation30.1 29.8 30.9 H2O Wt. Gain needed to achieve 80% Saturation
1216.9 1217.5 1215.8 Saturated specimen wt at 80% Saturation
Tensile Strength Ratio
SSD Conditioned
Calculated Strengths
Vol Abs Water (B"-A)% Saturation (100J"/I)
% Swell (100(E"-E)/E)Load - N
Average Dry Strength (kPa)Average Wet Strength (kPa)
% TSR
Dry Strength 2P/(tDPi)Wet Strength 2P"/(t"DPi)
ThicknessSSD mass
Mass in WaterVolume (B"-C")
% Swell (100(E'-E)/E)
SSD Volumetrics
Original VolumetricsDiameter
ThicknessDry mass in air
SSD mass Mass in Water
Volume
% Air Voids (100(G-F)/G)
% Saturation (100J'/I)
Volume (B'-C')Vol Abs Water (B'-A)
SSD MassMass in Water
Bulk Sp Gravity (A/E)Max Sp Gravity
Lottman - PM2-L with Lime (22 Blows)UND 5/30/05
Conditioned Subset Unconditioned Subset
Vol Air Voids (HE/100)Load - N
75

E-5 Moisture Sensitivity (Modified Lottman) for NPM Design Case
Moisture Sensitivity AASHTO T-283Project Number :Project Location :
1 2 3 4 5 6D 101.6 101.6 101.6 101.6 101.6 101.6t 62.1 64.8 65.1 64.3 64.5 64.2A 1138.0 1148.0 1149.2 1151.3 1149.3 1148.3B 1140.3 1153.4 1155.6 1157.4 1153.3 1154.7C 647.7 639.4 641.2 649.0 640.4 647.0E 492.6 514.0 514.4 508.4 512.9 507.7F 2.310 2.233 2.234 2.265 2.241 2.262G 2.454 2.454 2.454 2.454 2.454 2.454H 5.86 8.99 8.96 7.72 8.69 7.83I 28.87 46.19 46.10 39.25 44.56 39.77P 4562.986128 4954.4297 4562.9861
1 2 3B' 1160.3 1180.4 1184.9C' 667.9 663.7 662.9E' 492.4 516.7 522.0J' 22.3 32.4 35.7
77.25 70.14 77.43-0.04 0.52 1.46
1 2 3t" 62.1 64.8 65.1B" 1168.8 1192.4 1191.1C" 672.4 670.4 671.0E" 496.4 522.0 520.1J" 30.8 44.4 41.9
106.7 96.1 90.90.8 1.6 1.1
P" 5606.539 3845.488 4106.59855
1 2 3 4 5 6Std 445 482 446Stm 565 372 395
English Units English Units - Modified457 457.4 66.4 66.4444 384 64.5 55.7
97.1% 83.9 97.1 83.9
HELPFUL HINTS SECTIONGrouping Wet Vs Dry Subsets
1 5.860 4 7.7202 8.987 5 8.6883 8.963 6 7.833
Ave. 7.937 8.081Change the sample numbers to min. Ave. Diff
Degree of Saturation1 2 3
28.87 46.19 46.10 Vol of Air Voids20.2 32.3 32.3 H2O Wt. Gain needed to achieve 70% Saturation
1158.2 1180.3 1181.5 Saturated specimen wt at 70% Saturation23.1 37.0 36.9 H2O Wt. Gain needed to achieve 80% Saturation
1161.1 1185.0 1186.1 Saturated specimen wt at 80% Saturation
Bulk Sp Gravity (A/E)Max Sp Gravity
Lottman - NPM (37 Blows)UND 6/30/05
Conditioned Subset Unconditioned Subset
Vol Air Voids (HE/100)Load - N
% Saturation (100J'/I)
Volume (B'-C')Vol Abs Water (B'-A)
SSD MassMass in Water
% Swell (100(E'-E)/E)
SSD Volumetrics
Original VolumetricsDiameter
ThicknessDry mass in air
SSD mass Mass in Water
Volume
% Air Voids (100(G-F)/G)
% TSR
Dry Strength 2P/(tDPi)Wet Strength 2P"/(t"DPi)
ThicknessSSD mass
Mass in WaterVolume (B"-C")
Tensile Strength Ratio
SSD Conditioned
Calculated Strengths
Vol Abs Water (B"-A)% Saturation (100J"/I)
% Swell (100(E"-E)/E)Load - N
Average Dry Strength (kPa)Average Wet Strength (kPa)
76

E-6 Moisture Sensitivity (Modified Lottman) for NPM-L Design Case
Moisture Sensitivity AASHTO T-283Project Number :Project Location :
1 2 3 4 5 6D 101.6 101.6 101.6 101.6 101.6 101.6t 67.0 66.1 66.0 66.3 67.9 67.6A 1187.4 1184.1 1186.0 1186.6 1188.1 1187.8B 1192.2 1187.0 1188.6 1193.9 1197.8 1194.5C 666.9 665.4 668.0 672.1 670.3 667.7E 525.3 521.6 520.6 521.8 527.5 526.8F 2.260 2.270 2.278 2.274 2.252 2.255G 2.437 2.437 2.437 2.437 2.437 2.437H 7.25 6.85 6.52 6.69 7.58 7.48I 38.06 35.72 33.94 34.89 39.97 39.40P 5476.2061 4889.0408 5410.8172
1 2 3B' 1218.5 1210.5 1209.7C' 688.1 685.9 687.2E' 530.4 524.6 522.5J' 31.1 26.4 23.7
81.71 73.92 69.840.96 0.57 0.36
1 2 3t" 67.0 66.1 66.0B" 1221.4 1213.6 1212.5C" 690.5 688.6 689.7E" 530.9 525.0 522.8J" 34.0 29.5 26.5
89.3 82.6 78.11.1 0.7 0.4
P" 4841.89 4628.375 4562.986128
1 2 3 4 5 6Std 518 451 502Stm 453 439 433
English Units490 71.1442 64.1
90.1% 90.1
HELPFUL HINTS SECTIONGrouping Wet Vs Dry Subsets
1 7.246 4 6.6862 6.847 5 7.5783 6.519 6 7.479
Ave. 6.871 7.248Change the sample numbers to min. Ave. Diff
Degree of Saturation1 2 3
38.06 35.72 33.94 Vol of Air Voids26.6 25.0 23.8 H2O Wt. Gain needed to achieve 70% Saturation
1214.0 1209.1 1209.8 Saturated specimen wt at 70% Saturation30.4 28.6 27.1 H2O Wt. Gain needed to achieve 80% Saturation
1217.8 1212.7 1213.1 Saturated specimen wt at 80% Saturation
Tensile Strength Ratio
SSD Conditioned
Calculated Strengths
Vol Abs Water (B"-A)% Saturation (100J"/I)
% Swell (100(E"-E)/E)Load - N
Average Dry Strength (kPa)Average Wet Strength (kPa)
% TSR
Dry Strength 2P/(tDPi)Wet Strength 2P"/(t"DPi)
ThicknessSSD mass
Mass in WaterVolume (B"-C")
% Swell (100(E'-E)/E)
SSD Volumetrics
Original VolumetricsDiameter
ThicknessDry mass in air
SSD mass Mass in Water
Volume
% Air Voids (100(G-F)/G)
% Saturation (100J'/I)
Volume (B'-C')Vol Abs Water (B'-A)
SSD MassMass in Water
Bulk Sp Gravity (A/E)Max Sp Gravity
Lottman - NPM-L with Lime (25 Blows)UND 5/30/05
Conditioned Subset Unconditioned Subset
Vol Air Voids (HE/100)Load - N
77