unlocking the potential of the telecommunications sector to support networked readiness harvard...
Post on 21-Dec-2015
216 views
TRANSCRIPT

Unlocking the Potential of the Telecommunications Sector to Support Networked Readiness
Unlocking the Potential of the Telecommunications Sector to Support Networked Readiness
Harvard University – March 14, 2002
This report is solely for the use of client personnel. No part of it may be circulated, quoted, or reproduced for distribution outside the client organisation without prior written approval
from McKinsey & Company. This material was used by McKinsey & Company during an oral presentation; it is not a complete record of the discussion.

2
• Impact of telecommunications sector reform• Impact of telecommunications sector reform
AgendaAgenda
• Importance of reform going forward• Importance of reform going forward
• Priorities for reform• Priorities for reform

3
Lower high income countries
4747 3333 202010 - 20 15
Emerging countries
4343 2525 32323 - 10 28
Developingcountries
3333 262641413 85
Spread of sector reform Spread of sector reform No reform
Privatization only
Liberalization
Share of countries having undergone sector reform, %
Real GDP per capita$000
No. of countries
Upper high income countries
100100
100%
20 21
Fixed voice telephony, status end of year 2000Fixed voice telephony, status end of year 2000

4
Value impactIncumbent market capitalization, $ billions
Value impactIncumbent market capitalization, $ billions
933
60
January 18, 2002
993
-24%
+105%744
85
Flotation +3 years
829 CAGR 3%
CAGR 18%
456
78
At flotation
Emerging and developing countries
High-income countries
534

5
+21+13
+3
Teledensity growth Change in teledensity between 1996 and 2000
Teledensity growth Change in teledensity between 1996 and 2000 No reform
Privatization only
Liberalization
+48
+20
+5
Lower high income Emerging countries Developing countries
+53
+26
+5
+54
Upper high
income

6
+11
+4+1
+25
+1
+8
+31
Internet penetration % change in Internet users per 100 inhabitants from 1996-2000
Internet penetration % change in Internet users per 100 inhabitants from 1996-2000
+15
+6
+1
Lower high income Emerging countries Developing countries Upper high
income
No reform
Privatization only
Liberalization

7
Options to reach Internet penetrationStatus end of year 2000
Options to reach Internet penetrationStatus end of year 2000
1
2
3
4
5
6
0 10 20 30 40 50 60 70 80 90 100 110 120 130 140 150 160 170
Teledensity (Lines per 100 inhabitants)
75
50
37.5
17.5
25
1052.50.5
Internet penetration(%)
6060
5050
4040
3030
2020
1010
Use
r In
ten
sit
y (
Inte
rnet
use
rs
per
10
0 li
ne
s)
ESP
CHL

8
Multiple tradeoffsMultiple tradeoffsIndustry Industry growthgrowth
Industry Industry growthgrowth
SocietySociety
• Government• Employees,
unions
• Government• Employees,
unions
Equipment providersEquipment providers
• Domestic• Foreign• Domestic• Foreign
CustomersCustomers
• Business• Residential• Business• Residential
OperatorsOperators
• Incumbent(s)• New entrant(s)• Incumbent(s)• New entrant(s)
Investors Investors

9
Priorities among multiple objectivesPriorities among multiple objectives
Promoted tele-density and additional investments
Promoted tele-density and additional investments
Compromised between efficiency, privatization proceeds and teledensity
Compromised between efficiency, privatization proceeds and teledensity
Broadly favored market efficiency and competition
Broadly favored market efficiency and competition
Similar emphasis
Networkedreadiness
Efficient industry
Attract investments
New Zealand
De
ve
lop
ing
c
ou
ntr
ies
D
ev
elo
pin
g
co
un
trie
s
Argentina (2)
Czech Republic
De
ve
lop
ed
co
un
trie
s
De
ve
lop
ed
co
un
trie
s
Malaysia
Em
erg
ing
co
un
trie
sE
me
rgin
g c
ou
ntr
ies
India Indonesia Philippines
China
Germany France U.K. (1)U.K. (2)Sweden U.S. Australia
Japan South Korea
Argentina (1)
Mexico (1)Mexico (2)
Russia Poland
South Africa
Brazil
Chile (2) Chile (1)
Hungary
Country Proceeds for government
Universal service
Benefits to customers
EXAMPLES

10
Measurable dimensionsMeasurable dimensions
*Footnote
Source: Source
• Teledensity Universal access• Teledensity Universal access
• Incumbent performance Proceeds to government• Incumbent performance Proceeds to government
• Price levels Benefits to consumers• Price levels Benefits to consumers

11
Universal ServiceCumulative growth of fixed-line Teledensity 3 years post-reform
Universal ServiceCumulative growth of fixed-line Teledensity 3 years post-reform
Source:ITU; Espicom; McKinsey
Developing countries
China India Indonesia Philippines Senegal
All with priority on Universal Service
739097
62
31111
15021111
Emerging countries Increase in lines per 100
Change Percent
Priority on Universal Service
No priority on Universal Service
Czech Republic
Hungary
Poland Brazil
Malaysia Chile (2)
Chile (1)South Africa
6971
534339
3529
6112
3012
6
Mexico (2)
Mexico (1)Argentina (1)Argentina (2)
9888343
32211
Teledensity at time of reform
121015198
119
510
61020

12
-28
-21
-21
-20
-16
0
11
Indonesia
Countries that did not emphasize benefits to customers
Mexico (2)
U.K. (1)
Argentina (2)
Japan
Poland
Brazil
Chile (2) Sweden
New ZealandAustralia (2)
Australia (1)
U.S.U.K. (2)
Countries that emphasized benefits to customers
South Korea
France
-65
-60
-45
-43
-34
-32
-20
-17
-13
0
Germany
Benefits to customersLong distance cumulative price change Incumbent tariffs 3 years post-reform, %
Benefits to customersLong distance cumulative price change Incumbent tariffs 3 years post-reform, %

13
Proceeds to GovernmentChange in performance and relative value of incumbent% median values
Proceeds to GovernmentChange in performance and relative value of incumbent% median values
At flotationFlotation + 3 years
4146
5343
Countries with priority on proceeds to Government
Countries with no priority on proceeds to Government
EBITDA
2130
2617
EBIT
32
51
28 27
P/E premium over main stock market index

14
Overview of regulatory levers
Pricing
Interconnection
IndustryStructure
CustomerAccess
UniversalService
PerformanceLevels
RegulatoryLevers

15
Detail of fixed and mobile regulatory leversDetail of fixed and mobile regulatory levers
Regulatory Levers
Industry Structure
Pricing
Inter-connection
Customer Access
Universal Service
Example of fixed and mobile regulatory levers
• Number of competitors• Ownership and control rules, including restrictions on foreign investment• Networks and services open to competition• Licensing procedures and conditions
• Price caps / tariff rebalancing • Access deficit compensation• Pricing constraints on local calls• Constraints on roaming charges
• Rights and obligations to interconnect• Structure and level of charges• Collocation and infrastructure sharing• Conditions for unbundling network elements• Interconnection for ISPs• Obligations and rights for virtual network mobile operators (MVNO’s)
• Numbering plan• Number portability • Length and ease of carrier pre-fixes• Subscription mechanism for carrier pre-selection
• Universal access and service obligation definitions• Universal service funding mechanism• Penetration targets• Network rollout and coverage targets
• Service quality targetsPerformance Levels
Source: McKinsey

16
Continued importance of reformContinued importance of reform
Source: McKinsey
AccessAccess
• Teledensity low in most developing world (>800 million households stilll without a phone line)
• Teledensity low in most developing world (>800 million households stilll without a phone line)
Internet and usage intensityInternet and usage intensity
• Increase usage of existing infrastructure already enabled for Internet
• 5.7 billion inhabitants are not using the Internet
• Increase usage of existing infrastructure already enabled for Internet
• 5.7 billion inhabitants are not using the Internet
QualityQuality
• Steps to ensure broadband reaches 187 million connections by 2005
• $150-200 billion to support rollout of 3G mobile technology
• Steps to ensure broadband reaches 187 million connections by 2005
• $150-200 billion to support rollout of 3G mobile technology
$150–200 billion in
value
$150–200 billion in
value
Value has been
unlocked
Value has been
unlocked

17
438
4,534
Developingcountries
220
614
Emergingcountries
TeledensityMillion access lines/population
TeledensityMillion access lines/population
Source: McKinsey
1,064
948
High-incomecountries
Access lines
Population

18
Lower incomedeveloped
31+
Developed
Highest in group
Median
Lowest in group
41+
Potential to increase usage intensityPotential to increase usage intensity
Internet user intensity
Emerging 38+
Developing 63+
Access availability
Price
Competition
Enabled line
Choice of service
Interconnection

19
2001 fixed lines
2001 fixed lines
Broadband penetration Broadband penetration
% of global access lines% of global access lines
Infrastructure challenge
Infrastructure challenge
20012001 20052005
20012001
20052005
Broadband access lines, millionBroadband access lines, million
20
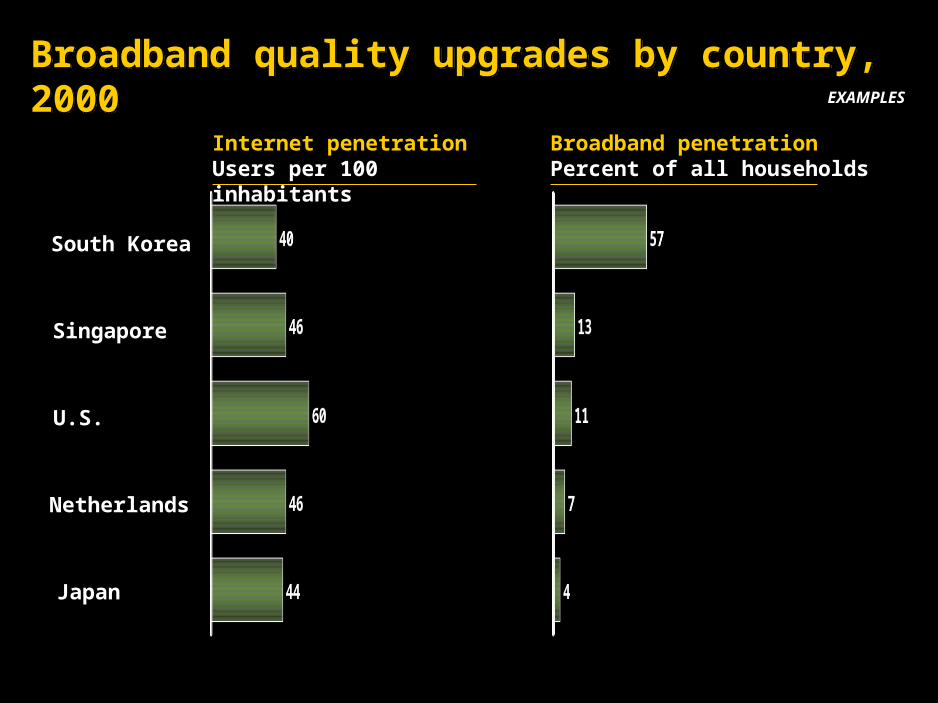
Broadband quality upgrades by country, 2000Broadband quality upgrades by country, 2000EXAMPLES
U.S.
Japan
Netherlands
Singapore
South Korea
Internet penetrationUsers per 100 inhabitants
Broadband penetrationPercent of all households

21
3G challenges3G challenges
• No deployment, available only in Japan
• US$130 bn paid in license auctions in Europe alone
• Unclear initial consumer value
• Additional US$150–200bn to deploy networks in Europe alone

22
What can be done?What can be done?
Source: McKinsey
Promote accessPromote access
• Developing countries
• Encourage and attract investment
• Explore mobile options
• Recognize mobile options
• Slow gradual process
• Developing countries
• Encourage and attract investment
• Explore mobile options
• Recognize mobile options
• Slow gradual process
Encourage Internet and usage intensityEncourage Internet and usage intensity
• All countries
• Stimulate demand
• Encourage competition and choice
• Fine tune and revise
• Iterating process
• All countries
• Stimulate demand
• Encourage competition and choice
• Fine tune and revise
• Iterating process
Fund quality improvementsFund quality improvements
• Mostly developed, but significant variation by country
• Require significant upgrades
• Explore funding options
• Experiment multiple approaches
• New approaches needed
• Mostly developed, but significant variation by country
• Require significant upgrades
• Explore funding options
• Experiment multiple approaches
• New approaches needed

Unlocking the Potential of the Telecommunications Sector to Support Networked Readiness
Unlocking the Potential of the Telecommunications Sector to Support Networked Readiness
Harvard University – March 14, 2002
This report is solely for the use of client personnel. No part of it may be circulated, quoted, or reproduced for distribution outside the client organisation without prior written approval
from McKinsey & Company. This material was used by McKinsey & Company during an oral presentation; it is not a complete record of the discussion.