unlocking the value peter johnson george wimpey plc 27 april 2001
TRANSCRIPT

Unlocking the Value
Peter Johnson
George Wimpey PLC
27 April 2001

• George Wimpey has the potential to compete with and
better the performance of its peers. My objective today
is to show you how we are bringing this about.
Unlocking the Value
• George Wimpey has earned lower margins than its main
competitors - there is no good reason why it should
continue to do so.

Agenda
• Wimpey today - where we start from
• The sources of value and how we will unlock them

Wimpey Today

Wimpey today
• 2000 Results - P&L Account
Revenue £m
Operating Profit £m
Profit Before Tax £m
Tax %
Earnings per Share p
Dividend per Share p
1702
170
146
24
30.0
7.5
1527
119
113
22
24.5
6.6
+11%
+43%
+30%
N/A
+22%
+14%
2000 1999 % Change

Wimpey today
• 2000 Results - Balance Sheet
Shareholders Funds£m
Net Debt £m
Capital Employed £m
Shareholders Fundsp
Gearing %
Interest Cover
673
220
893
182
33
7.1
584
179
763
158
31
7.4
2000 1999

Wimpey today
• 2000 Completions
UK PD
UK Social
UK Total
USA Total
Group Total
£112
£50
$227
£116
+16%
+6%
+15%
+16%
Average Price
10823
614
11437
2638
14175
-7%
-19%
-8%
+2%
-5%
Completions
£109 +16%
No. % Change £/$000’s % Change

Wimpey today
• Segmental Analysis
UK
USA
Corp.
Group
143
35
170
+40%
+29%
+37%
Operating Profit
1254
405
43
1702
+8.0%
+22%
+10%
Revenue
(7)
£m % Change £m % Change
11.4
8.6
10.0
+2.6%
+0.5%
+2.0%
Operating Margin
% % Change

The sources of increased value
• Land: strengthening our land-bank
• Building: building high quality and reducing costs
• Product: widening our range, better pricing and options
• Overheads: getting the benefits from restructuring
• USA: the growth potential and lessons to learn
• Partners and people: working with the best

Land

Strengthening our land bank
• We were
– competing internally
– reacting to local demands of
regions
– trying to get 29 regions to critical
mass
– rationing on first come first
served basis
• Result was
– land in the wrong place
– bought at poor margins
• We now have
– prioritised land acquisitions
based on our business strategy
– all regions with critical mass
– workable landbanks in all regions
– raised our target returns
• Result is
– we are buying land where we
want it
– at much better margins

Strengthening our land bank
• Completions Before and After
– Regional Businesses now up to critical mass
Scotland
North
Midlands
South
UK Total
2
6
7
21
780
560
480
540
2001 After
4
8
8
9
29
390
420
390
370
390
2001 Before
6 520
No of BU’s Ave. PC’s per BU No of BU’s Ave. PC’s per BU

Short Term Land
• Short-term land bank:
– 24000 plots owned
– 9450 plots controlled
– total 33450 equals 3.1 years supply
• 2000 UK land spend of £420 million increased owned
plots by 1350 (6%)

Short Term Land
Short Term Land Bank at end 2000 (Plots)
LondonBristol
Birmingham
Manchester
Leeds
Liverpool
Newcastle
EdinburghGlasgow
2,800
7,900
3,650
4,200
2,250
6,100
6,550
Total = 33,450 Plots

LondonBristol
Birmingham
Manchester
Leeds
Liverpool
Newcastle
EdinburghGlasgow
Short Term Land
Short Term Land Bank at end 2000 (Years)
2.5
3.7
2.9
2.8
1.9
4.2
2.8
Average = 3.1 Years

LondonBristol
Birmingham
Manchester
Leeds
Liverpool
Newcastle
EdinburghGlasgow
Short Term Land
Cost of Short Term Land Bank at end 2000 (£millions)
65.3m
85.9m
125.7m
161.7m
50.3m
42.2m
158.6m
Total = 689.7m

Strategic Land

Strategic Land
• We were
– managing strategic land outside
UK housing business
– focusing on number of plots, not
when they were available for use
– and on adding plots not getting
planning on existing plots
– we had no geographical strategy
– and had not amended approach
in light of PPG3
• We now have
– fully integrated strategic land into
the UK business
– created a smaller, more focused
resource working closely with our
regions
– prioritised action to bring existing
sites through planning
– focused our efforts on high value
and brownfield sites

Strategic Land
Capital Locked Up in Strategic Land
Scotland & North East 5.4m
North West & Yorkshire 1.6m
West Midlands 2.3m
East Midlands 3.5m
East & South East 1.8m
Total 35.8m
South 21.2m

Stategic Land
Where is our Strategic Land?
LondonBristol
Birmingham
Manchester
Leeds
Liverpool
Newcastle
EdinburghGlasgow
813
6
22
9
31
Category 1 Sites
(developable within 2-3 years)
•Total Number of Sites = 89
•Average estimated plots per site = 150
•Total estimated plots = 13350
0%
20%
40%
60%
80%
100%
WITH OPP
ALLOCATED in ALP
ALLOCATED in DDLP
ALLOCATED in CDLP
NOT ALLOCATED

LondonBristol
Birmingham
Manchester
Leeds
Liverpool
Newcastle
EdinburghGlasgow
0%
20%
40%
60%
80%
100%
WITH OPP
ALLOCATED in DDLP
ALLOCATED in CDLP
STRUCTURE PLAN
NOT ALLOCATED
Stategic Land
Where is our Strategic Land?
1512
1
32
22
26
Category 2 Sites
(developable within 5 years)
•Total Number of Sites = 108
•Average estimated plots per site = 175
•Total estimated plots = 18900
Stategic Land
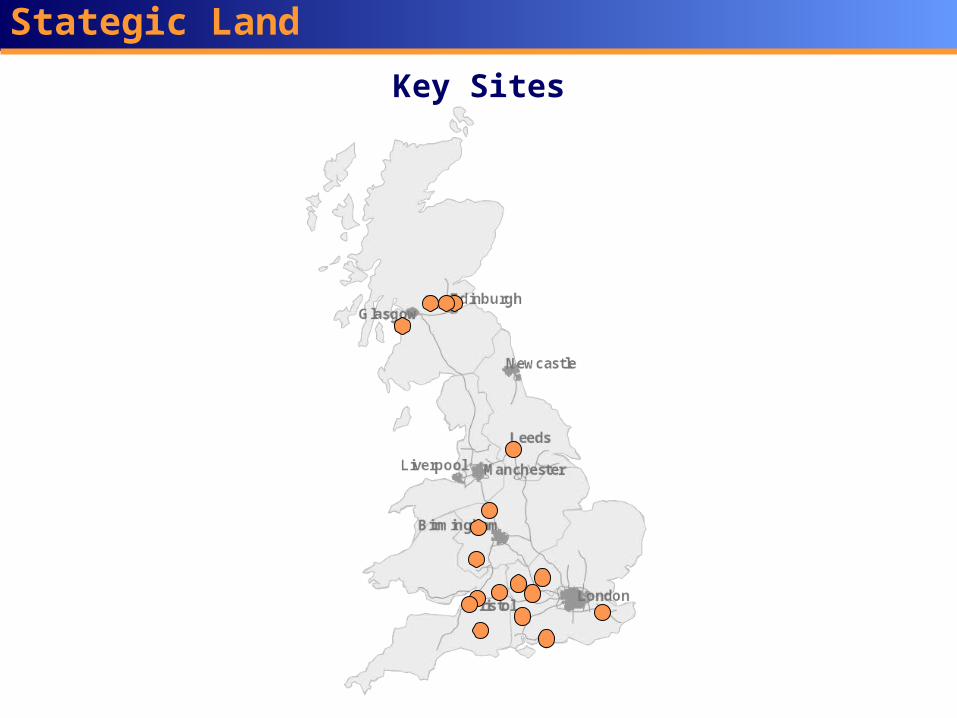
Key Sites

Stategic Land
Key SitesBradbury Estate - A Brownfield Site
HerefordTown
HerefordshireCounty
50 AcresGross Area
36 AcresNet Area
500Expected Plots

Stategic Land
Key SitesEastanton Manor Farm - A Greenfield Site
AndoverTown
HampshireCounty
253 AcresGross Area
109 AcresNet Area
1350Expected Plots

Building

Building high quality and reducing costs
• We build well
• Our competitors say so
• The NHBC says so
• The facts confirm they’re right

Building high quality and reducing costs
NHBC Quality Awards
1999
2000
0
10
20
30
40
50
60
70
80
90
GeorgeWimpey
Barratt Wilson McAlpine Bellway Redrow Beazer Berkeley Persimmon Bryant

Building high quality and reducing costs
NHBC Top 100 Site Manager Awards
1999
2000
0
5
10
15
20
25
30
GeorgeWimpey
Barratt Wilcon McAlpine Bellway Redrow Beazer Berkeley Persimmon Bryant

Building high quality and reducing costs
Recommend without being asked
I am pleased I bought this home
Quality of construction is very good
Overall I am very satisfied
29%
94%
46%
56%
20%
85%
36%
45%
George WimpeyUK
NationalAverage
Housing Forum Customer Satisfaction Survey
Survey involved over 10,000 Home Buyers Nationally
Overall I am fairly or very satisfied 93% 87%

Building high quality and reducing costs
• Build Costs
– McLean Build Costs more than 10% cheaper than Wimpey
• Build time
– McLean 12 Weeks
– Wimpey 16 -19 Weeks

Building high quality and reducing costs
• We were using
– Wimpey central design:
• expensive design features
• not adapted to local markets
• costly to adapt to PPG3
• We now have
– local design (per McLean)
• savings identified
• adapted locally
• easier for PPG3
• benchmark costs
House Design

-Reduction of roof complexity - £1000-Reduction of special features - £600-Positioning - £500
Building high quality and reducing costs
Before
After
Front Right
Redesign of Vaudeville House Type by Leicester Office

-Reduction of roof complexity - £1000-Reduction of special features - 600Total Saving = £2,100
Building high quality and reducing costs
Before
After
Front Right
Redesign of Vaudeville House Type by Leicester Office

Building high quality and reducing costs
• We were using
– Wimpey central buying:
• inflexible service
• not suited to local needs
• inhibited upgrades
• high prices
Procurement

Building high quality and reducing costs
• Central Purchasing not working
– Bricks
• Wimpey National deal cost £12 per thousand more than McLean
– Sanitary Ware
• McLean co-ordinated approach bought sanitary ware sets £300
cheaper than Wimpey
Procurement

Building high quality and reducing costs
• We were using
– Wimpey central buying:
• inflexible service
• not suited to local needs
• inhibited upgrades
• high prices
• We now have
– Product Consultation Groups
• national deals supported by
regional management
• national scale with knowledge
on the ground
• procurement co-ordinated with
site/sub-contractor needs
• benchmarking of costs
Procurement

Product

Product - Range
• Continued increase in product selling price
• Continued progression to larger house types
• Continued increase in Bespoke

Product - Range
0
5
10
15
20
25
30
35
40
0-50 51-75 76-100 101-125 126-150 151+House Price Bands (£000's)
%
98 99 00
Movement of product range to higher selling prices

Product - Range
Product Mix
0%
10%
20%
30%
40%
50%
60%
5 Bed 4 Bed 3 Bed 3 Bed Semi/ Terraced
2 Bed Flats
%
98 99 00
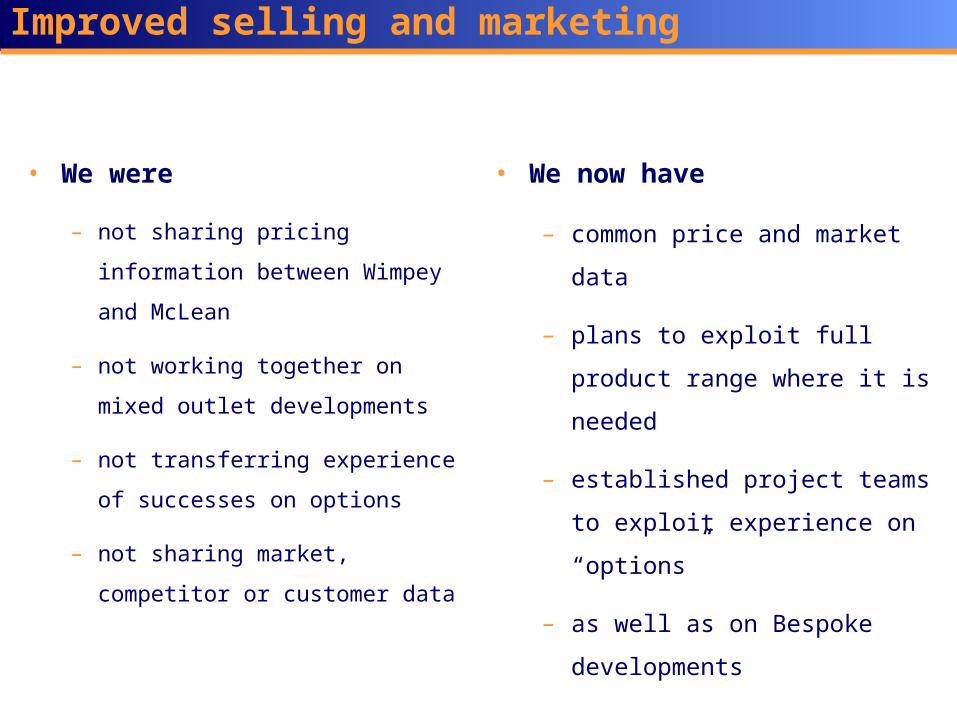
Improved selling and marketing
• We were • We now have
– common price and market data
– plans to exploit full product range
where it is needed
– established project teams to exploit
experience on “options”
– as well as on Bespoke
developments
– not sharing pricing information
between Wimpey and McLean
– not working together on mixed
outlet developments
– not transferring experience of
successes on options
– not sharing market, competitor or
customer data

Product - Options
Top 10 Options for 2000
Margin on Options between 20% and 30%
Option
Electrical Sockets/PointingCoving
Glazed Doors
>40%
25%-40%
Take up as% of PC’s
Garden LandscapingBurglar AlarmsFire Surrounds
Additional Lighting
20%-25%
DownlightsKitchen Flooring - Ceramic
Carpets

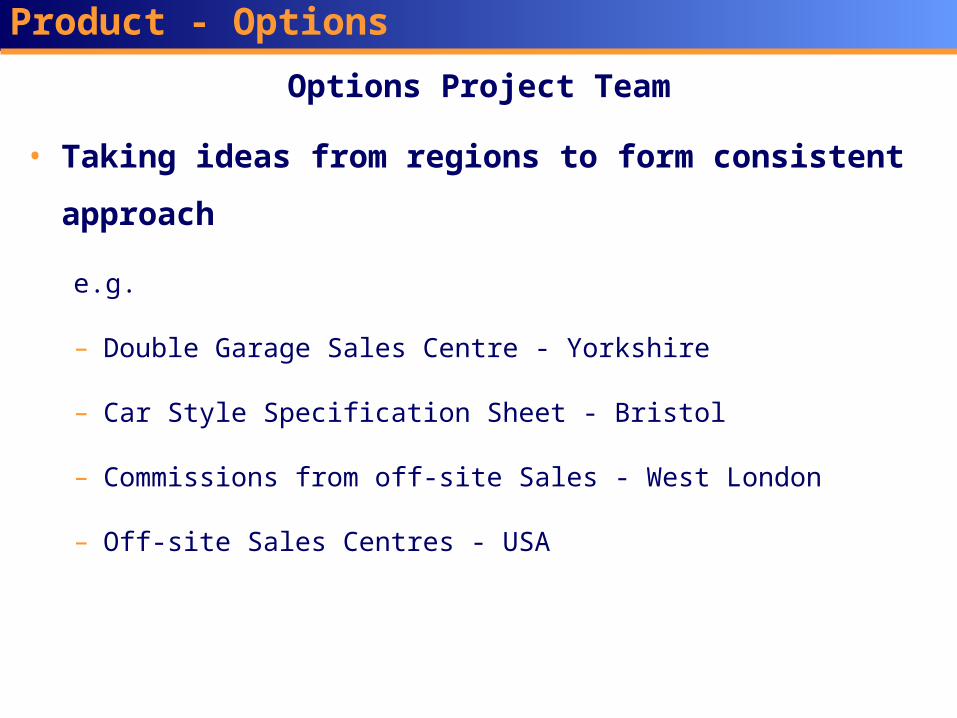
Product - Options
• Taking ideas from regions to form consistent approach
Options Project Team
e.g.
– Double Garage Sales Centre - Yorkshire

Product - Options
• Taking ideas from regions to form consistent approach
e.g.
– Double Garage Sales Centre - Yorkshire
Options Project Team
– Car Style Specification Sheet - Bristol

Product - Options
• Taking ideas from regions to form consistent approach
e.g.
– Double Garage Sales Centre - Yorkshire
– Car Style Specification Sheet - Bristol
– Commissions from off-site Sales - West London
Options Project Team
Product - Options
• Taking ideas from regions to form consistent approach
e.g.
– Double Garage Sales Centre - Yorkshire
– Car Style Specification Sheet - Bristol
– Commissions from off-site Sales - West London
– Off-site Sales Centres - USA
Options Project Team

Product - Options
LondonBristol
Birmingham
Manchester
Leeds
Liverpool
Newcastle
EdinburghGlasgow
£3,100
£2,800
£3,500
£4,100
£2,600
£2,750
£2,950
Sales of Options per House in 2000 (£’s)
National Average = £3,100

Product - Options
LondonBristol
Birmingham
Manchester
Leeds
Liverpool
Newcastle
EdinburghGlasgow
2.8%
3.1%
2.2%
2.9%
2.9%
3.1%
2.6%
Sales of Options as Percentage of House Price in 2000
National Average = 2.8%

Overheads

Getting the benefits from restructuring
• Reduced Overheads
– Reduction in Staff - 435
– Completions per member of Office Staff increased by >40%
– Overhead Savings - £20 million
– Impact on Margin for 2002 - 1.7%

Getting the benefits from restructuring
WHH Top Management 10
Central & DuplicatedFunctions 35
9 Closed BU’s 235
New Staff Profile 100
Handover Staff (Apr/May) 55
Total 435
Summary of Redundancies

Closed Businesses
McLean East Scotland
Wimpey West Scotland
Wimpey Yorkshire
Rivermead
McLean East Midlands
Wimpey Northern Home Counties
Wimpey South East
Thameswey
Wimpey South Wales (kept as satellite)
New Business
Central London
Getting the benefits from restructuring

Getting the benefits from restructuring
LondonBristol
Birmingham
Manchester
Leeds
Liverpool
Newcastle
EdinburghGlasgow
Business Unit
Distribution of Remaining Offices

Getting the benefits from restructuring
• Completions Before and After
– Regional Businesses now up to critical mass
Scotland
North
Midlands
South
UK Total
2
6
7
21
780
560
480
540
2001 After
4
8
8
9
29
390
420
390
370
390
2001 Before
6 520
No of BU’s Ave. PC’s per BU No of BU’s Ave. PC’s per BU

USA

USA - a growth opportunity
• located in growing markets
– 5 of 6 States with greatest job creation
– well positioned in higher value segments
• with a structure to support growth
– mature businesses to generate cash
– well established growing businesses
– development businesses established for future growth
• potential to grow through satellites or small acquisitions

USA - a growth opportunity
SacramentoEast Bay Area
San Joaquin Valley
Current Morrison Markets
AtlantaJacksonville
OrlandoTampa
SarasotaAustin
San AntonioDallas/Ft Worth
Houston
Phoenix

USA - a growth opportunity
Where the Jobs are.
Sarasota, Florida5.9%
Austin, Texas4.7%
Tucson, Arizona5.4%
Tampa, Florida4.9%
Orlando, Florida5.1%
Job Growth Rates over the Last 4 QuartersSource: The Meyers Group, Inc. 2001

USA - a growth opportunity
Where the jobs are.
Even the most pessimistic forecasts for housing starts this year (~1.5 million) is higer than the previous peak years. Better still, economists agree that many areas of the country - notably the West, parts of the Northeast, Texas and Florida - will experience strong housing growth in 2001. Depending on where you build and, to a lesser degree, for whom, the slower gowing economy will be felt differently.
-Taken from article in Professional Builder Magazine

USA - Regional Analysis
Orlando
Local economy satistics
1.00
1.10
1.20
1.30
1.40
1.50
1.60
1.70
1998 1999 2000
Po
pu
lati
on
(00
0,00
0's)
Population
400
500
600
700
800
900
1,000
1998 1999 2000
To
tal
Em
plo
ymen
t (0
00's
)
Total Employment
30
35
40
45
50
55
1998 1999 2000
Ho
use
ho
ld I
nco
me
(000
's)
Median Household Income
Average population change = 3.2%
Average employment change = 4.7%
Average Income change = 3.7%

USA - Regional Analysis
Orlando
Largest Private Employers
Walt Disney World
Publix Supermarkets
Florida Hospital
Winn Dixie Stores, inc.
Harris Corporation
Orlando Regional Healthcare
Universal Studios Florida
Central Florida Investments
Central Florida Healthcare
Sun Trust Bank
55,000
15,141
11,210
8,978
8,500
8,200
7,000
5,000
4,500
4,244
Tourism
Retail Grocery
Healthcare
Retail Grocery
Aerospace
Healthcare
Tourism
Financial
Healthcare
Financial
Employees IndustryCompany

USA - Regional Analysis
Orlando
Top 10 House Builders

USA - Regional Analysis
Orlando Market Position
Morrison Homes: 452
223
62
45
95
27
Total Market: 11,759
764
1,234
1,090
2,030
2,375
2,637
1,629
0%
20%
40%
60%
80%
100%
Morrison Homes: 452
223
62
45
95
27
Morrison Homes: 452
223
62
45
95
27
Total Market: 11,759
764
1,234
1,090
2,030
2,375
2,637
1,629
Total Market: 11,759
764
1,234
1,090
2,030
2,375
2,637
1,629
0%
20%
40%
60%
80%
100%
0-100 101-125 126-150 151-175 176-200 201-250 251+0-100 101-125 126-150 151-175 176-200 201-250 251+

USA - Regional Analysis
Orlando Market Segmentation
North South East West NE Lake/NE Polk
0-100
101-125
126-150
151-175
176-200
201-250
251+
North South East West NE Lake/NE Polk
0-100
101-125
126-150
151-175
176-200
201-250
251+
0-100 101-125 126-150 151-175 176-200 201-250 251+0-100 101-125 126-150 151-175 176-200 201-250 251+

USA - Options
Top 5 Options in Morrisons
Category
FlooringCarpet/Vinyl/Tile/Hardwood
StructuralFlexible Designs/Bonus Room/Elevation
CabinetryCabinetry/Countertop
Non-StandardsCustom changes per buyer request
PoolOption only in Tampa and Orlando
Total Revenue
$25m
$9m
$7m
$3m
$3m

USA - Options
• Total revenue from options in 2000 - $55m
• Options revenue per house - $20,850
• Options revenue as percentage of house price - 9.2%
• Margins between 20% and 50%

Partners and people

Partners & People
• we are able to attract top quality partners
– suppliers and subcontractors
– partners in major development schemes
– our own staff and management

0
5
10
15
20
25
30
0-5 5-10 10-15 15-20 20-25 25-30 30-35 35+
Total Regional Management
Managing Directors
Partners & People
Years within George Wimpey

Partners & People
0
5
10
15
20
25
30
20-30 30-35 35-40 40-45 45-50 50-55 55-60 60+
Total Regional Management
Managing Directors
Age of Regional Management

Partners & People
• Graduate Intake in 2000
– 4 Oxbridge, Sheffield, Manchester, UCL, Newcastle
– Two 1s and Five 2:1s
• Graduate Intake for 2001
– 5 Oxbridge, Warwick, York, St Andrews
– Chemistry, Engineering, History, Law, Biosciences etc
• 16 Women in Regional Boards or above
• 2 Women are Managing Directors
Strengthening our Staff

What this means for our shareholders

What this means for our shareholders
• Margins will increase
– £20 million overhead cost reductions
– land is being bought at better margins
– benefits from improved design/procurement
– prices will improve through better product and geographical mix
– increased options/extras

• George Wimpey has the potential to compete with and
better the performance of its peers. We are putting in
place the organisation and processes to ensure it does.
What this means for our shareholders
• George Wimpey has earned lower margins than its main
competitors - there is no good reason why it should
continue to do so.