unlocking turkey's tight gas potential - valeura energy
TRANSCRIPT
A GLOBAL ENERGY COMPANY FOCUSED ON EXCEPTIONAL VALUE CREATION
UNLOCKING TURKEY’S TIGHT GAS POTENTIAL CORPORATE PRESENTATION NOVEMBER 2013

2
Corporate Profile Valeura Energy Inc. (VLE – TSX) is a Canada-based oil and gas company with core assets
in Turkey
Interests in 16 leases & licences in Turkey: 1.2 MM acres (gross); 0.5 MM acres (net)
Focused on development of tight gas in the Thrace Basin with multi-stage fracs in vertical and horizontal wells
Corporate Q3 2013 production 1,011 boe/d (up 17% from Q2 2013) (1) :
− 5.7 MMcf/d (net) in Turkey at average wellhead price of $10.13/Mcf
− Operating netback $45.07/boe
− Funds flow from operations $3.1 MM
57.9 MM shares outstanding; $0.40 share price; $23 MM market capitalization
Significant discovered resource base in Turkey at YE 2012:
− Proved plus probable reserves (2P) 4.5 Mmboe (net) (2)
− Best estimate contingent resources (2C) 108.7 Mmboe (net) (2)
Corporate 2P reserves value $93 MM (discounted at 10% before tax) at YE 2012 or $1.61 per share (3)
$9.0 MM working capital surplus at September 30, 2013; no debt (1) Barrel of oil equivalent (“boe”) may be misleading, particularly if used in isolation. A boe conversion ratio of 6.0 Mcf to 1.0 bbl is based on an energy equivalency
conversion method primarily applicable at the burner tip and does not represent a value equivalency at the wellhead. (2) DeGolyer and MacNaughton (“D&M”) of Dallas, Texas estimates of reserves and contingent resources as at December 31, 2012 in their separate reserves and
contingent resources reports dated March 13, 2013. These reports were prepared in accordance with NI 51-101 guidelines and COGE Handbook. Additional reserves and resources disclosure is included in the Corporation’s 2012 Annual Information Form (“2012 AIF”) filed on SEDAR.
(3) Based on aggregate of the D&M evaluation for the Turkish properties in its report dated March 13, 2013 and the GLJ Petroleum Consultants Ltd. (“GLJ”) evaluation of the Canadian properties in its report dated February 27, 2013 as described more fully in the 2012 AIF.
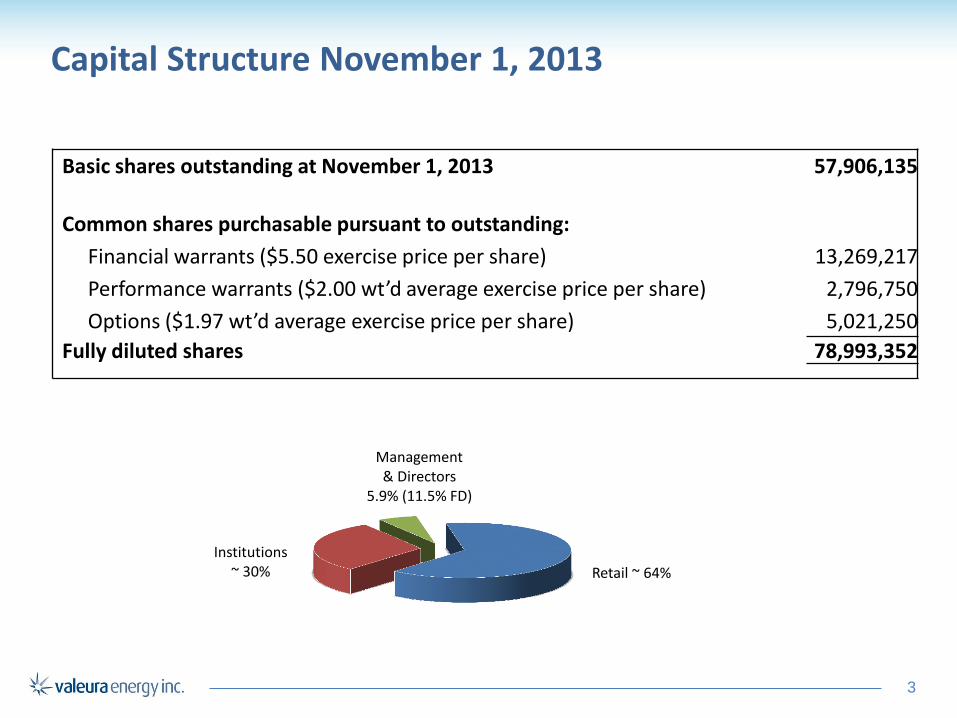
Basic shares outstanding at November 1, 2013 57,906,135
Common shares purchasable pursuant to outstanding:
Financial warrants ($5.50 exercise price per share) 13,269,217
Performance warrants ($2.00 wt’d average exercise price per share) 2,796,750
Options ($1.97 wt’d average exercise price per share) 5,021,250
Fully diluted shares 78,993,352
3
Capital Structure November 1, 2013
Retail ~ 64%
Institutions ~ 30%
Management & Directors
5.9% (11.5% FD)
4
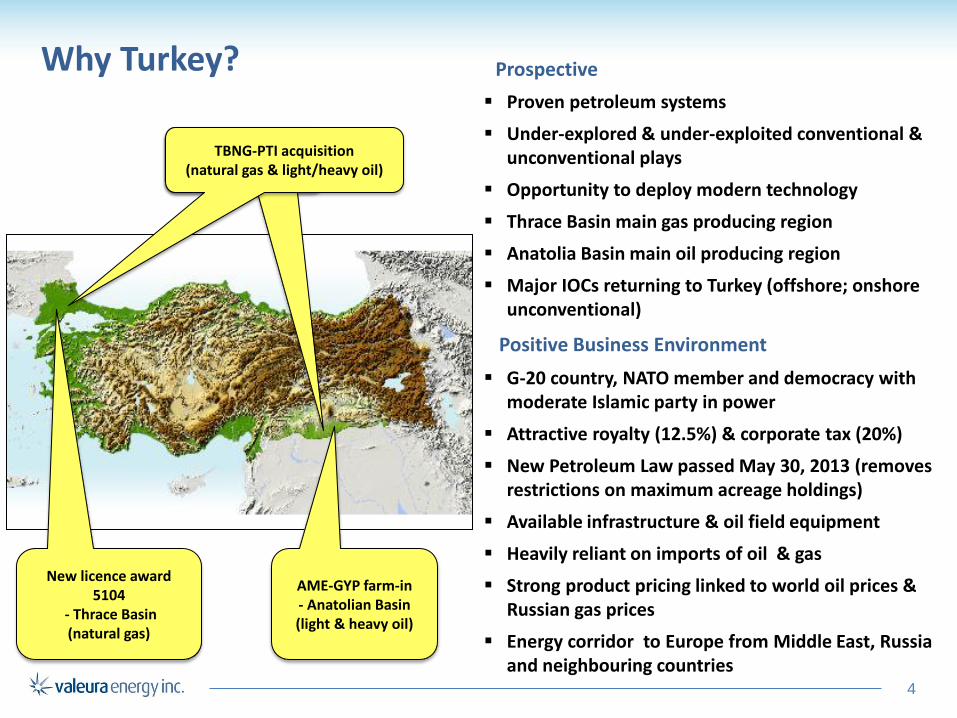
Why Turkey?
Prospective
Proven petroleum systems
Under-explored & under-exploited conventional & unconventional plays
Opportunity to deploy modern technology
Thrace Basin main gas producing region
Anatolia Basin main oil producing region
Major IOCs returning to Turkey (offshore; onshore unconventional)
Positive Business Environment
G-20 country, NATO member and democracy with moderate Islamic party in power
Attractive royalty (12.5%) & corporate tax (20%)
New Petroleum Law passed May 30, 2013 (removes restrictions on maximum acreage holdings)
Available infrastructure & oil field equipment
Heavily reliant on imports of oil & gas
Strong product pricing linked to world oil prices & Russian gas prices
Energy corridor to Europe from Middle East, Russia and neighbouring countries
AME-GYP farm-in - Anatolian Basin (light & heavy oil)
New licence award 5104
- Thrace Basin (natural gas)
TBNG-PTI Acquisition opportunity
TBNG-PTI acquisition (natural gas & light/heavy oil)
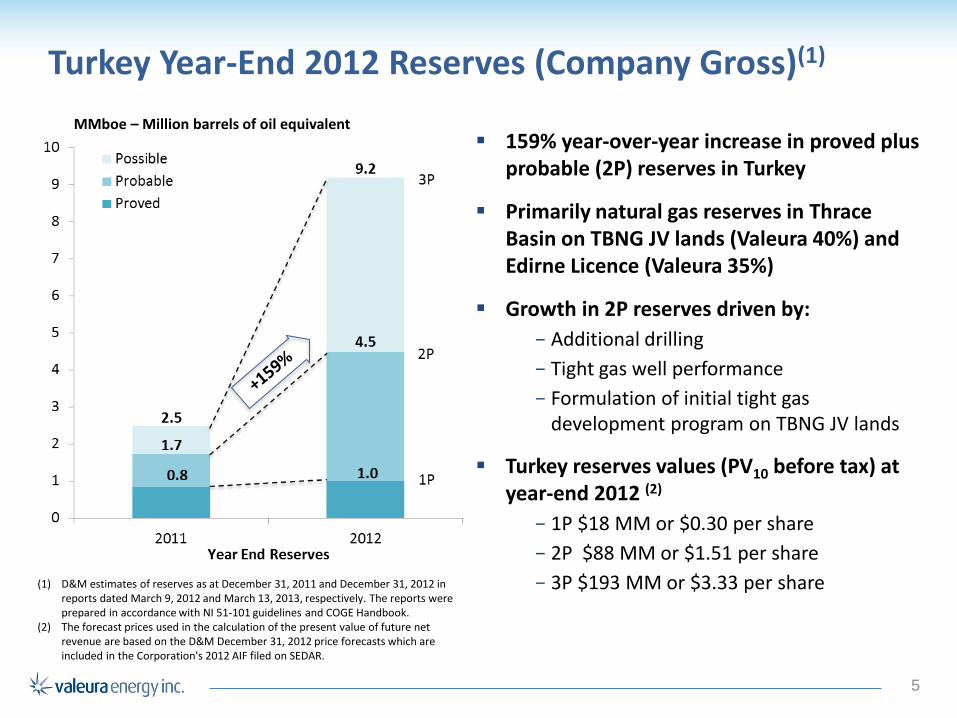
Turkey Year-End 2012 Reserves (Company Gross)(1)
159% year-over-year increase in proved plus probable (2P) reserves in Turkey
Primarily natural gas reserves in Thrace Basin on TBNG JV lands (Valeura 40%) and Edirne Licence (Valeura 35%)
Growth in 2P reserves driven by:
− Additional drilling
− Tight gas well performance
− Formulation of initial tight gas development program on TBNG JV lands
Turkey reserves values (PV10 before tax) at year-end 2012 (2)
− 1P $18 MM or $0.30 per share
− 2P $88 MM or $1.51 per share
− 3P $193 MM or $3.33 per share
MMboe – Million barrels of oil equivalent
(1) D&M estimates of reserves as at December 31, 2011 and December 31, 2012 in reports dated March 9, 2012 and March 13, 2013, respectively. The reports were prepared in accordance with NI 51-101 guidelines and COGE Handbook.
(2) The forecast prices used in the calculation of the present value of future net revenue are based on the D&M December 31, 2012 price forecasts which are included in the Corporation's 2012 AIF filed on SEDAR.
5
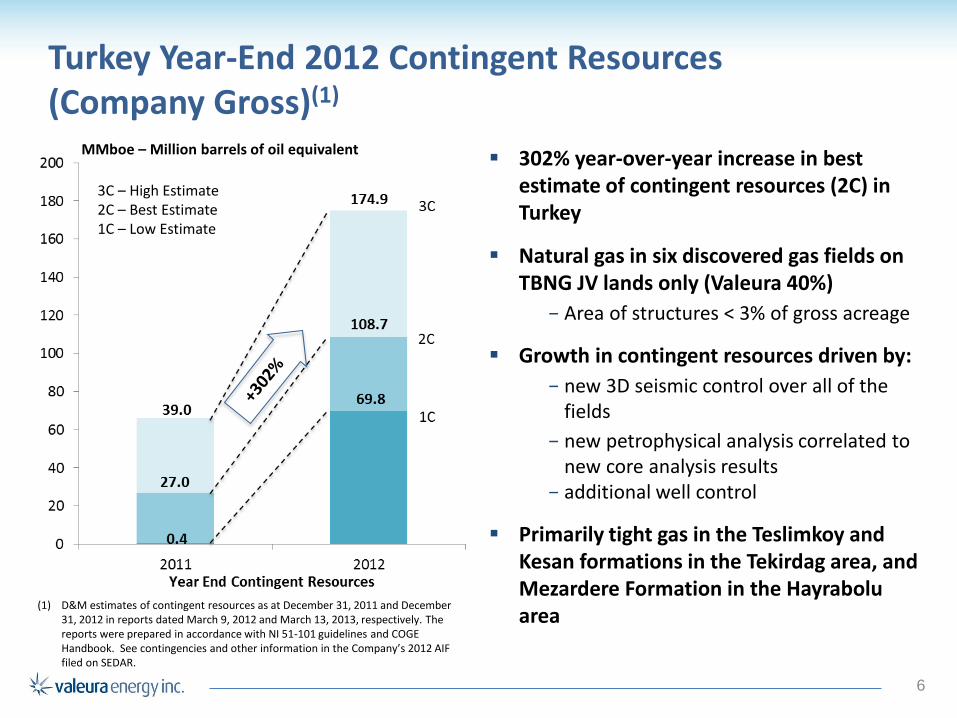
Turkey Year-End 2012 Contingent Resources (Company Gross)(1)
302% year-over-year increase in best estimate of contingent resources (2C) in Turkey
Natural gas in six discovered gas fields on TBNG JV lands only (Valeura 40%)
− Area of structures ˂ 3% of gross acreage
Growth in contingent resources driven by:
− new 3D seismic control over all of the fields
− new petrophysical analysis correlated to new core analysis results
− additional well control
Primarily tight gas in the Teslimkoy and Kesan formations in the Tekirdag area, and Mezardere Formation in the Hayrabolu area
MMboe – Million barrels of oil equivalent
(1) D&M estimates of contingent resources as at December 31, 2011 and December 31, 2012 in reports dated March 9, 2012 and March 13, 2013, respectively. The reports were prepared in accordance with NI 51-101 guidelines and COGE Handbook. See contingencies and other information in the Company’s 2012 AIF filed on SEDAR.
6
3C – High Estimate 2C – Best Estimate 1C – Low Estimate
7
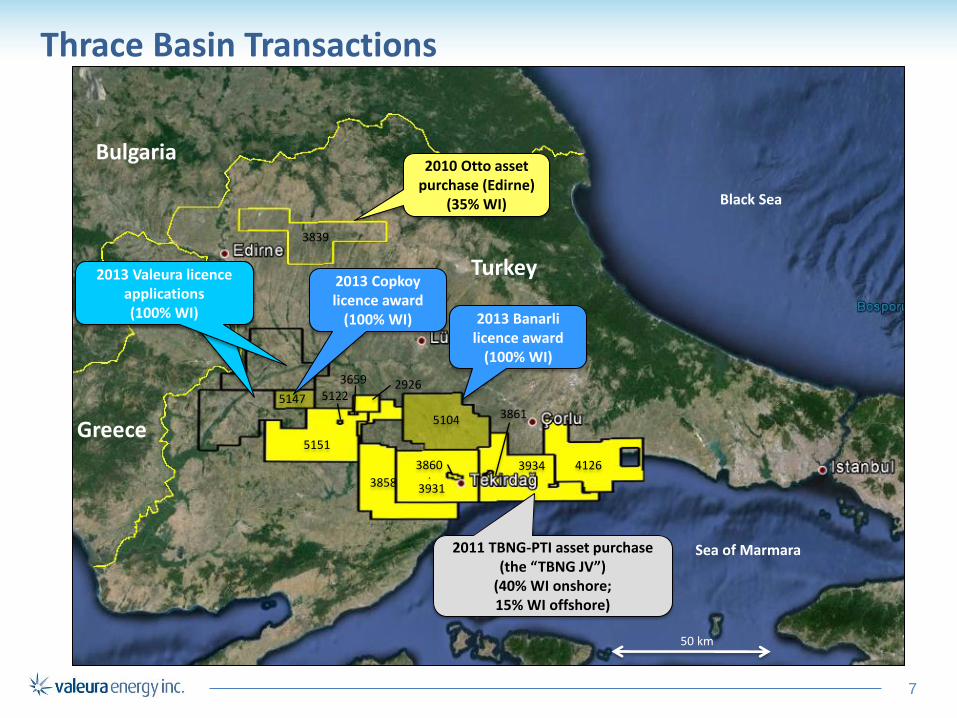
Thrace Basin Transactions
3934
4126 3858
3860
3931
3861
3659 5122
3839
50 km
Bulgaria
Turkey
Greece
2010 Otto asset purchase (Edirne)
(35% WI)
2011 TBNG-PTI asset purchase (the “TBNG JV”)
(40% WI onshore; 15% WI offshore)
2926
Black Sea
Sea of Marmara
2013 Banarli licence award
(100% WI)
Valeura licence applications (100% WI)
2013 Valeura licence applications (100% WI)
5104
5151
5147
2013 Copkoy licence award
(100% WI)
8
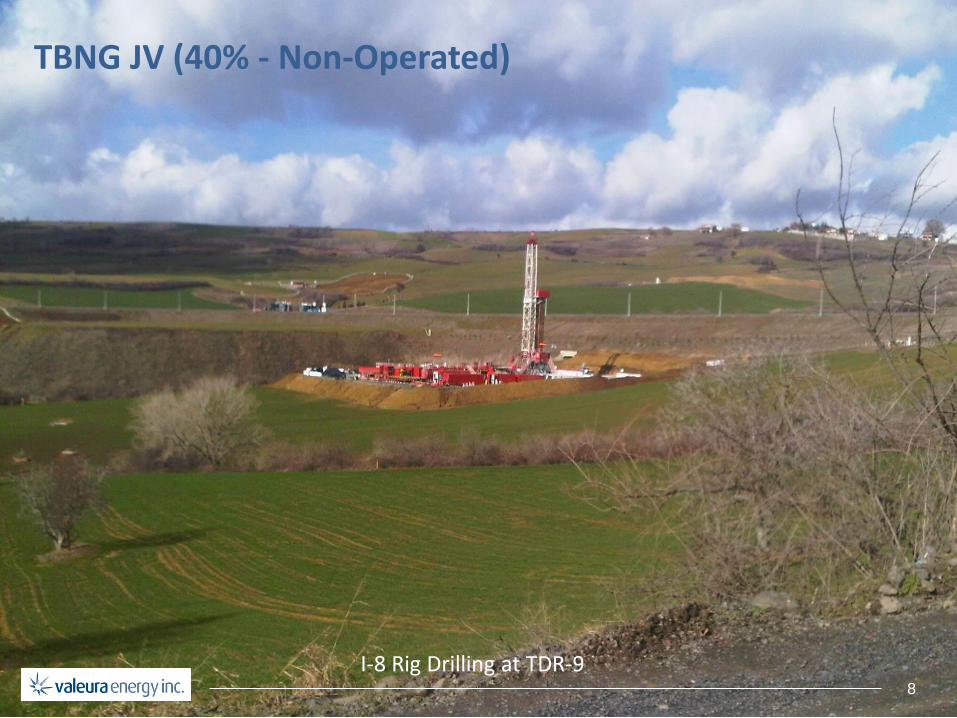
I-8 Rig Drilling at TDR-9
TBNG JV (40% - Non-Operated)
9
TBNG JV (1)
Interests in 10 leases & licences in Thrace Basin (0.5 MM gross acres onshore)
Established shallow gas production and marketing business:
- ~95 producing wells in 15 shallow gas fields in onshore lands
- Owned compression facilities & distribution lines
- Direct sales to 50+ commercial & end user customers
- Pursuing workovers & recompletions on existing wells and drilling selectively on new 3D seismic acquired in late 2011
Exposure to a significant tight gas resource play in the Thrace Basin in deeper sands in the Mezardere, Teslimkoy and Kesan Formations:
- Applying multi-stage fracture stimulation technology, and deeper vertical and horizontal drilling
Large discovered natural gas resource base at YE 2012:
- Proved plus probable reserves (2P) 65.0 Bcf (gross); 25.7 Bcf (net VLE) (2)
- Best estimate contingent resources (2C) 1,676 Bcf (gross); 652 Bcf (net VLE) (3)
Q3 2013 gas production 13.5 MMcf/d (gross) & 5.4 MMcf/d (net VLE):
− Approximately 50% shallow gas; 50% tight gas
− $10.20/Mcf average wellhead price in Q3 2013 (1) Thrace Basin Natural Gas Turkiye Corporation (“TBNG” - 41.5% and Operator); VLE (40%); Pinnacle Turkey Inc. (“PTI” - 18.5%) (the “TBNG JV”).
(2) D&M estimates of reserves as at December 31, 2012 in its report dated March 13, 2013. The report was prepared in accordance with NI 51-101 guidelines and COGE Handbook. Reserves shown here include those for the TBNG-PTI lands only.
(3) D&M estimates of contingent resources as at December 31, 2012 in its report dated March 13, 2013. The report was prepared in accordance with NI 51-101 guidelines and COGE Handbook. Contingent resources are assessed for the TBNG JV lands only.
10
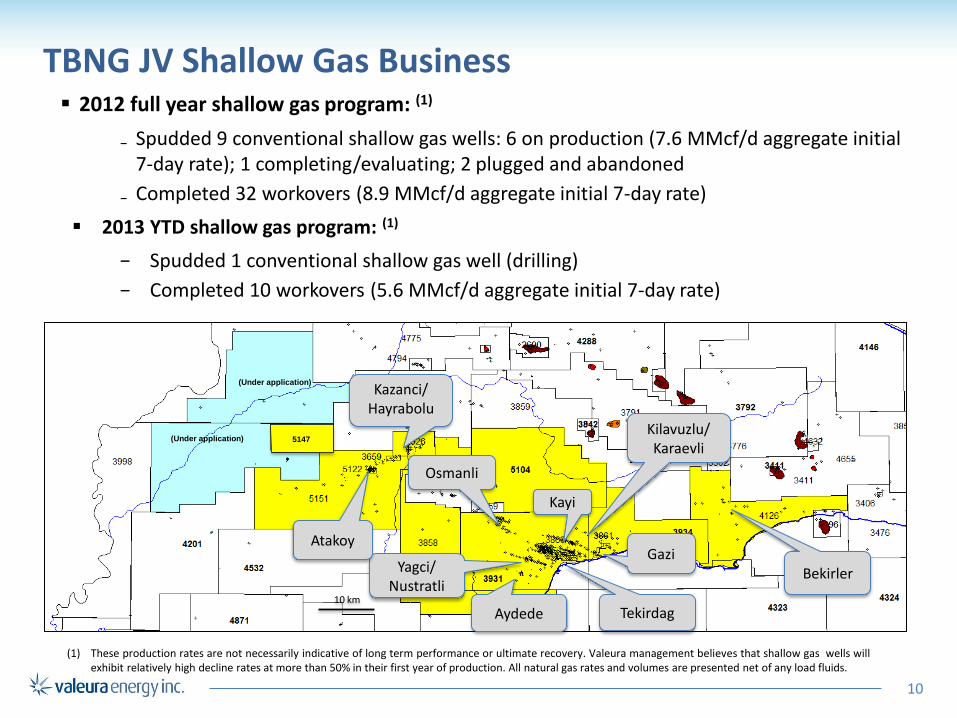
TBNG JV Shallow Gas Business 2012 full year shallow gas program: (1)
₋ Spudded 9 conventional shallow gas wells: 6 on production (7.6 MMcf/d aggregate initial 7-day rate); 1 completing/evaluating; 2 plugged and abandoned
₋ Completed 32 workovers (8.9 MMcf/d aggregate initial 7-day rate)
2013 YTD shallow gas program: (1)
− Spudded 1 conventional shallow gas well (drilling)
− Completed 10 workovers (5.6 MMcf/d aggregate initial 7-day rate)
(1) These production rates are not necessarily indicative of long term performance or ultimate recovery. Valeura management believes that shallow gas wells will exhibit relatively high decline rates at more than 50% in their first year of production. All natural gas rates and volumes are presented net of any load fluids.
Aydede
Yagci/ Nustratli
Kilavuzlu/ Karaevli
Atakoy
Bekirler Gazi
10 km
5122
(Under application)
Kazanci/ Hayrabolu
(Under application)
Kayi
Osmanli
Tekirdag
5147
11
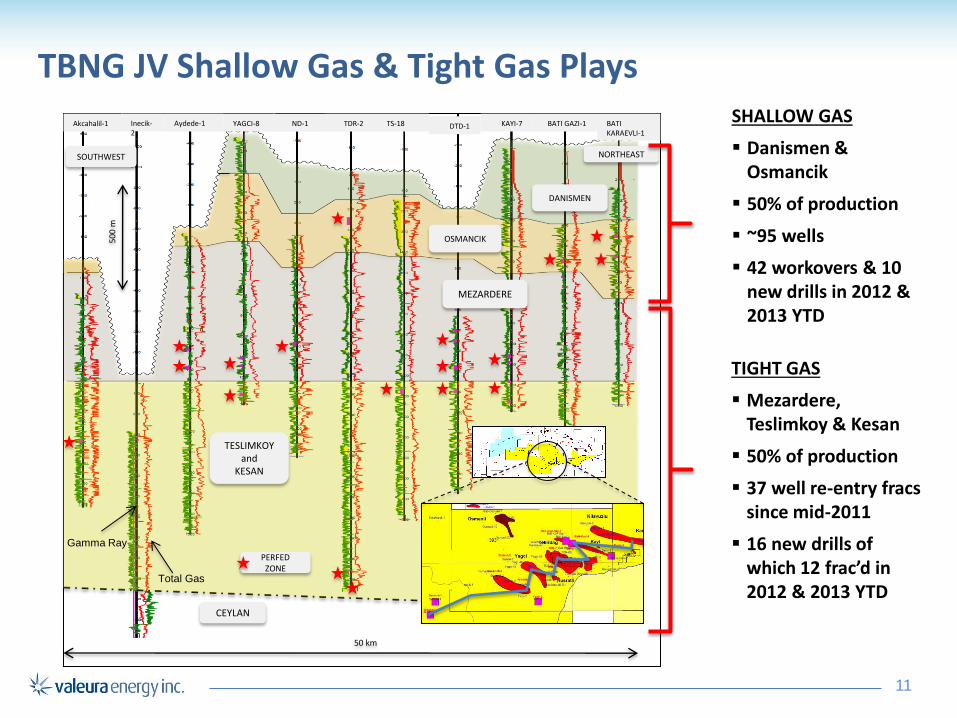
TIGHT GAS
Mezardere, Teslimkoy & Kesan
50% of production
37 well re-entry fracs since mid-2011
16 new drills of which 12 frac’d in 2012 & 2013 YTD
SHALLOW GAS
Danismen & Osmancik
50% of production
~95 wells
42 workovers & 10 new drills in 2012 & 2013 YTD
TBNG JV Shallow Gas & Tight Gas Plays
ND-1 Aydede-1 Inecik-2
Akcahalil-1 TDR-2 YAGCI-8 TS-18 DTD-1 KAYI-7 BATI KARAEVLI-1
BATI GAZI-1
DANISMEN
OSMANCIK
MEZARDERE
TESLIMKOY and
KESAN
50
0 m
50 km
CEYLAN
SOUTHWEST NORTHEAST
PERFED ZONE
Gamma Ray
Total Gas
12
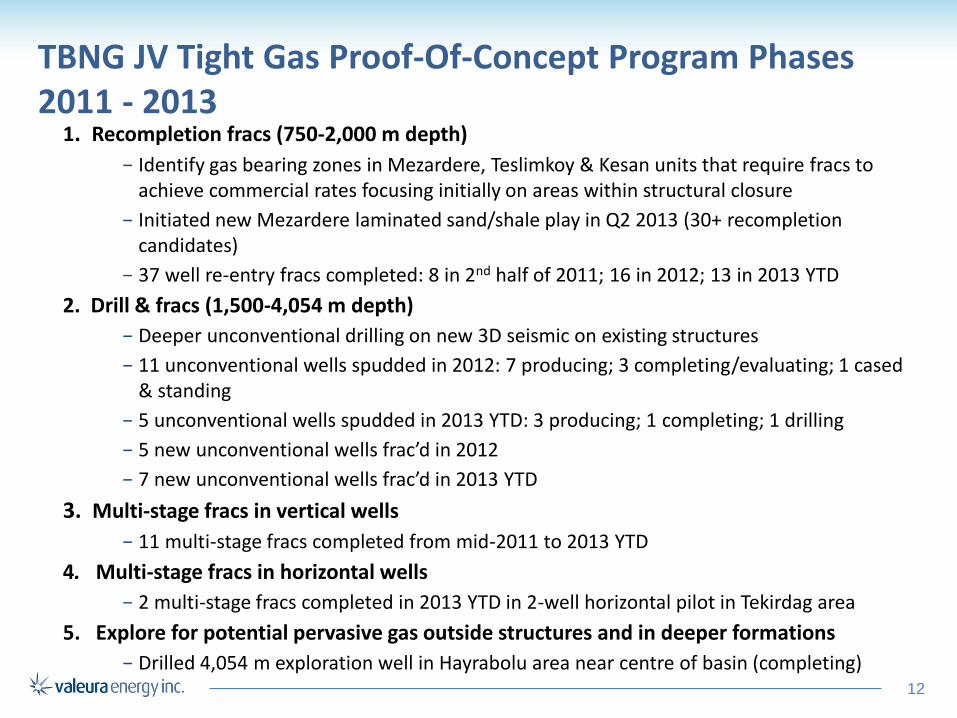
1. Recompletion fracs (750-2,000 m depth)
− Identify gas bearing zones in Mezardere, Teslimkoy & Kesan units that require fracs to achieve commercial rates focusing initially on areas within structural closure
− Initiated new Mezardere laminated sand/shale play in Q2 2013 (30+ recompletion candidates)
− 37 well re-entry fracs completed: 8 in 2nd half of 2011; 16 in 2012; 13 in 2013 YTD
2. Drill & fracs (1,500-4,054 m depth)
− Deeper unconventional drilling on new 3D seismic on existing structures
− 11 unconventional wells spudded in 2012: 7 producing; 3 completing/evaluating; 1 cased & standing
− 5 unconventional wells spudded in 2013 YTD: 3 producing; 1 completing; 1 drilling
− 5 new unconventional wells frac’d in 2012
− 7 new unconventional wells frac’d in 2013 YTD
3. Multi-stage fracs in vertical wells
− 11 multi-stage fracs completed from mid-2011 to 2013 YTD
4. Multi-stage fracs in horizontal wells
− 2 multi-stage fracs completed in 2013 YTD in 2-well horizontal pilot in Tekirdag area
5. Explore for potential pervasive gas outside structures and in deeper formations
− Drilled 4,054 m exploration well in Hayrabolu area near centre of basin (completing)
TBNG JV Tight Gas Proof-Of-Concept Program Phases 2011 - 2013
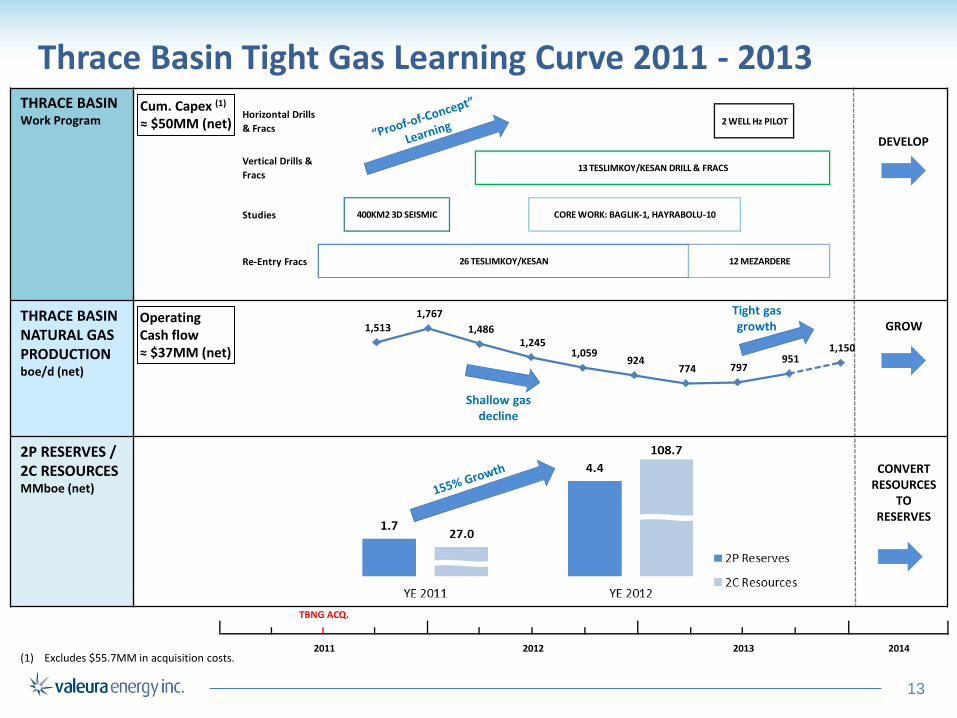
Thrace Basin Tight Gas Learning Curve 2011 - 2013 THRACE BASIN Work Program
THRACE BASIN NATURAL GAS PRODUCTION boe/d (net)
2P RESERVES / 2C RESOURCES MMboe (net)
Operating Cash flow ≈ $37MM (net)
GROW
CONVERT RESOURCES
TO RESERVES
DEVELOP
TBNG ACQ.
26 TESLIMKOY/KESAN 12 MEZARDERERe-Entry Fracs
CORE WORK: BAGLIK-1, HAYRABOLU-10
13 TESLIMKOY/KESAN DRILL & FRACS
2 WELL Hz PILOT
400KM2 3D SEISMIC
Horizontal Drills
& Fracs
Vertical Drills &
Fracs
Studies
Cum. Capex (1) ≈ $50MM (net)
1,513 1,767
1,486 1,245
1,059 924
774 797 951
1,150
Shallow gas decline
Tight gas growth
TBNG ACQ.
20142011 2012 2013
26 TESLIMKOY/KESAN 12 MEZARDERERe-Entry Fracs
(1) Excludes $55.7MM in acquisition costs.
13
14
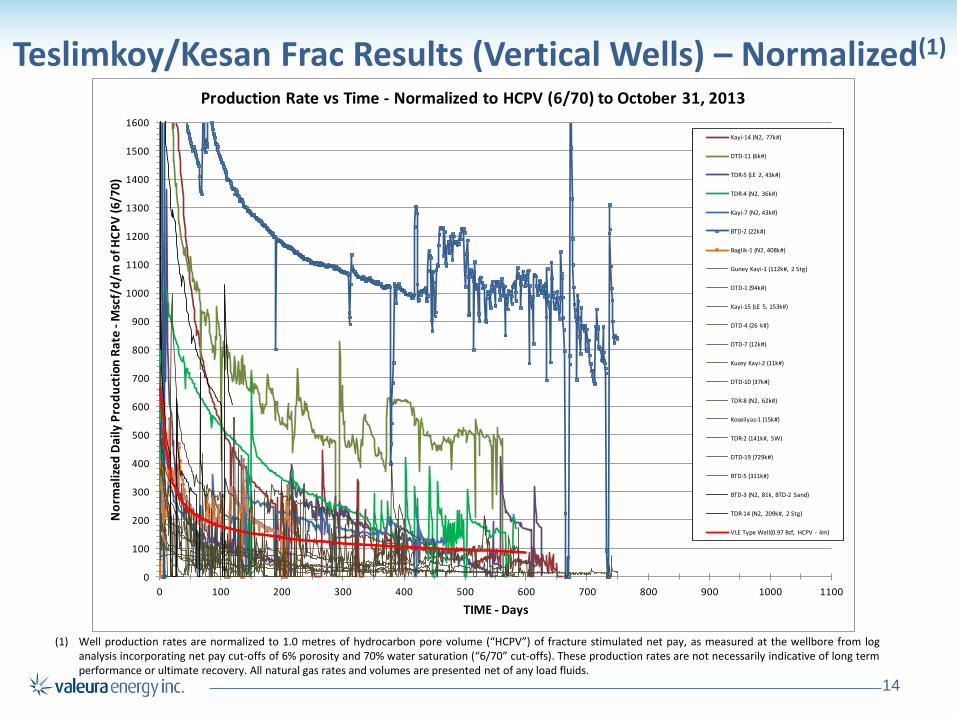
(1) Well production rates are normalized to 1.0 metres of hydrocarbon pore volume (“HCPV”) of fracture stimulated net pay, as measured at the wellbore from log analysis incorporating net pay cut-offs of 6% porosity and 70% water saturation (“6/70” cut-offs). These production rates are not necessarily indicative of long term performance or ultimate recovery. All natural gas rates and volumes are presented net of any load fluids.
Teslimkoy/Kesan Frac Results (Vertical Wells) – Normalized(1)
0
100
200
300
400
500
600
700
800
900
1000
1100
1200
1300
1400
1500
1600
0 100 200 300 400 500 600 700 800 900 1000 1100
No
rma
lize
d D
aily
Pro
du
ctio
n R
ate
-M
scf/
d/m
of H
CP
V (6
/70
)
TIME - Days
Production Rate vs Time - Normalized to HCPV (6/70) to October 31, 2013
Kayi-14 (N2, 77k#)
DTD-11 (6k#)
TDR-5 (LE 2, 43k#)
TDR-4 (N2, 36k#)
Kayi-7 (N2, 43k#)
BTD-2 (22k#)
Baglik-1 (N2, 408k#)
Guney Kayi-1 (112k#, 2 Stg)
DTD-1 (94k#)
Kayi-15 (LE 5, 153k#)
DTD-4 (26 k#)
DTD-7 (12k#)
Kuzey Kayi-2 (11k#)
DTD-10 (37k#)
TDR-8 (N2, 62k#)
Koseilyas-1 (15k#)
TDR-2 (141k#, SW)
DTD-19 (729k#)
BTD-5 (311k#)
BTD-3 (N2, 81k, BTD-2 Sand)
TDR-14 (N2, 209k#, 2 Stg)
VLE Type Well(0.97 Bcf, HCPV - 4m)
15
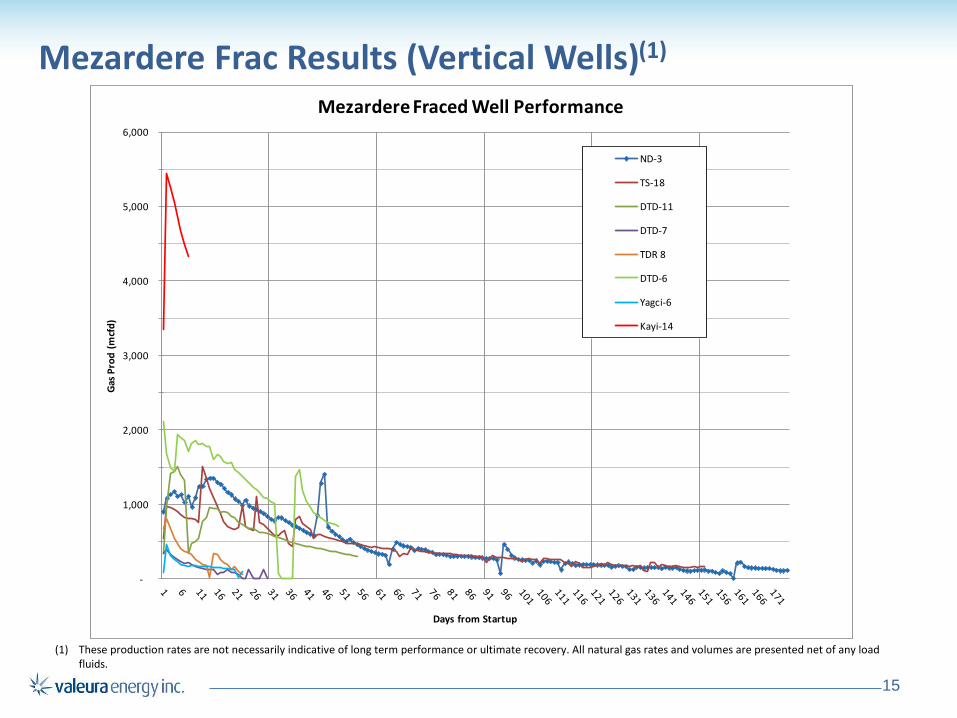
Mezardere Frac Results (Vertical Wells)(1)
(1) These production rates are not necessarily indicative of long term performance or ultimate recovery. All natural gas rates and volumes are presented net of any load fluids.
-
1,000
2,000
3,000
4,000
5,000
6,000
Gas
Pro
d (
mcf
d)
Days from Startup
Mezardere Fraced Well Performance
ND-3
TS-18
DTD-11
DTD-7
TDR 8
DTD-6
Yagci-6
Kayi-14
16
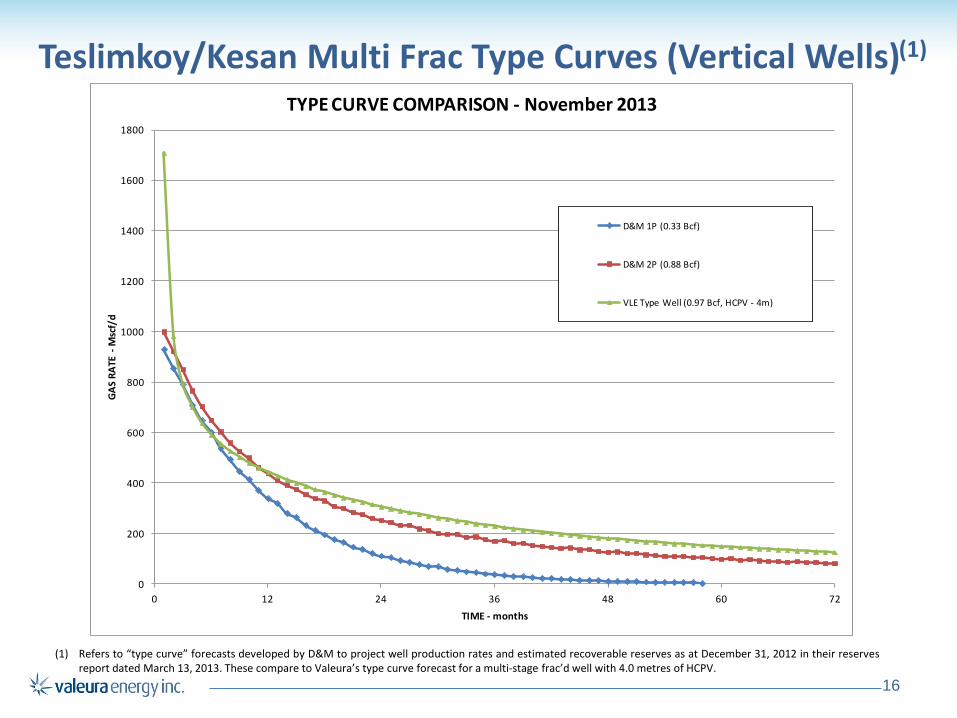
Teslimkoy/Kesan Multi Frac Type Curves (Vertical Wells)(1)
(1) Refers to “type curve” forecasts developed by D&M to project well production rates and estimated recoverable reserves as at December 31, 2012 in their reserves report dated March 13, 2013. These compare to Valeura’s type curve forecast for a multi-stage frac’d well with 4.0 metres of HCPV.
0
200
400
600
800
1000
1200
1400
1600
1800
0 12 24 36 48 60 72
GA
S R
ATE
-M
scf/
d
TIME - months
TYPE CURVE COMPARISON - November 2013
D&M 1P (0.33 Bcf)
D&M 2P (0.88 Bcf)
VLE Type Well (0.97 Bcf, HCPV - 4m)
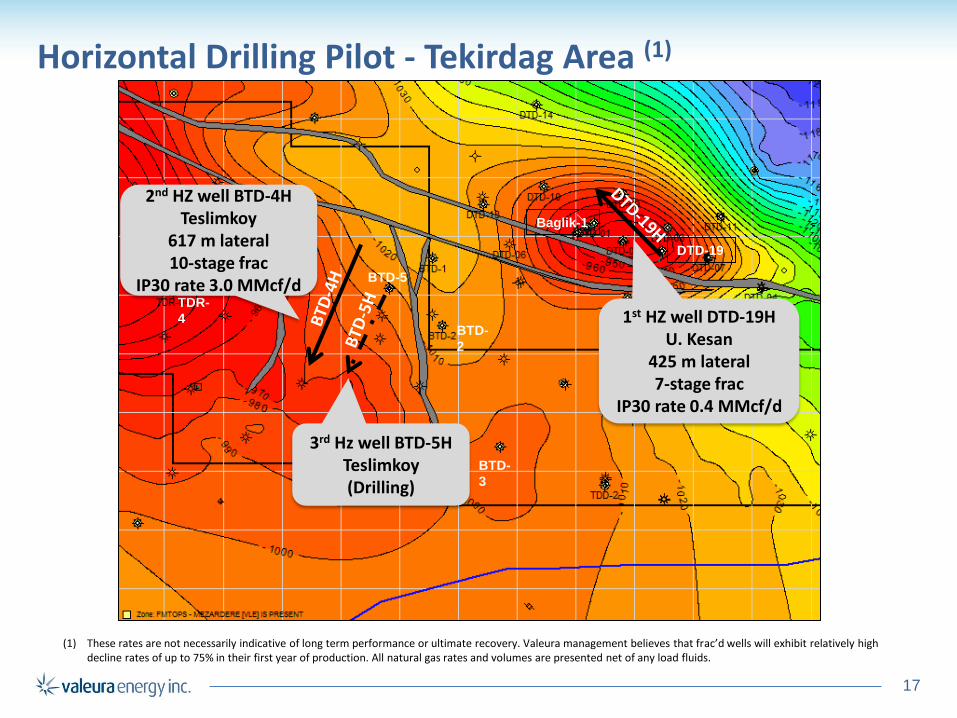
Horizontal Drilling Pilot - Tekirdag Area (1)
17
Baglik-1
BTD-
2
BTD-5
TDR-
4
DTD-19
BTD-
3
1st HZ well DTD-19H U. Kesan
425 m lateral 7-stage frac
IP30 rate 0.4 MMcf/d
2nd HZ well BTD-4H Teslimkoy
617 m lateral 10-stage frac
IP30 rate 3.0 MMcf/d
(1) These rates are not necessarily indicative of long term performance or ultimate recovery. Valeura management believes that frac’d wells will exhibit relatively high decline rates of up to 75% in their first year of production. All natural gas rates and volumes are presented net of any load fluids.
3rd Hz well BTD-5H Teslimkoy (Drilling)
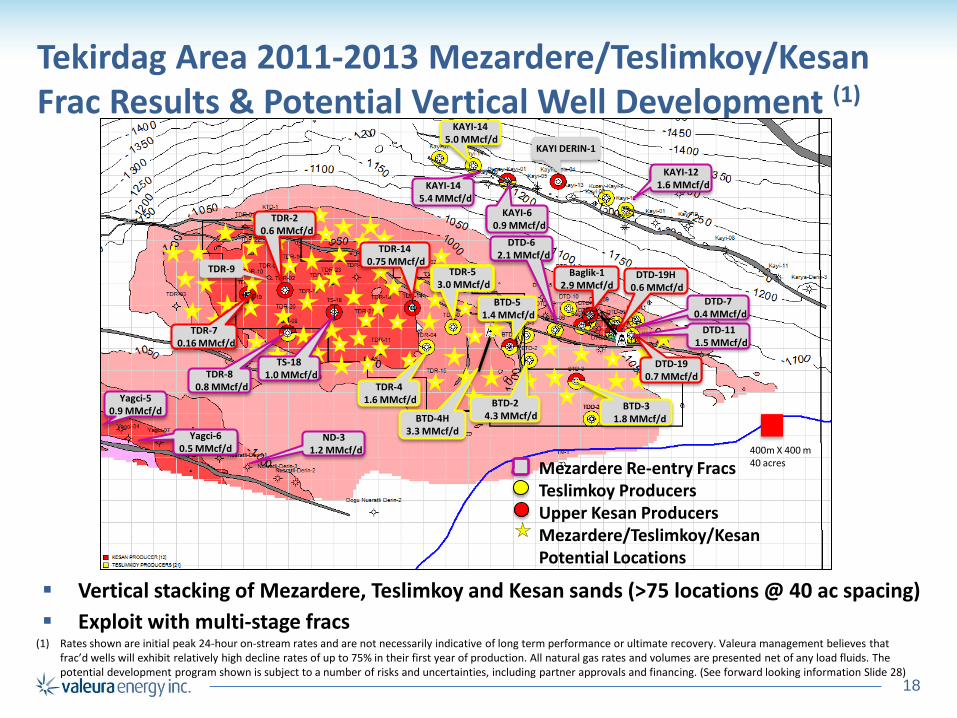
Tekirdag Area 2011-2013 Mezardere/Teslimkoy/Kesan Frac Results & Potential Vertical Well Development (1)
18
Vertical stacking of Mezardere, Teslimkoy and Kesan sands (>75 locations @ 40 ac spacing)
Exploit with multi-stage fracs
400m X 400 m 40 acres Mezardere Re-entry Fracs
Teslimkoy Producers Upper Kesan Producers Mezardere/Teslimkoy/Kesan Potential Locations
KAYI-14 5.0 MMcf/d
KAYI DERIN-1
TDR-14 0.75 MMcf/d
TDR-2 0.6 MMcf/d
TDR-9
TDR-4 1.6 MMcf/d
TDR-7 0.16 MMcf/d
TS-18 1.0 MMcf/d TDR-8
0.8 MMcf/d
ND-3 1.2 MMcf/d
Yagci-5 0.9 MMcf/d
BTD-5 1.4 MMcf/d
TDR-5 3.0 MMcf/d
BTD-2 4.3 MMcf/d BTD-4H
3.3 MMcf/d
BTD-3 1.8 MMcf/d
DTD-6 2.1 MMcf/d
DTD-19H 0.6 MMcf/d
DTD-19 0.7 MMcf/d
Baglik-1 2.9 MMcf/d
DTD-7 0.4 MMcf/d
DTD-11 1.5 MMcf/d
(1) Rates shown are initial peak 24-hour on-stream rates and are not necessarily indicative of long term performance or ultimate recovery. Valeura management believes that frac’d wells will exhibit relatively high decline rates of up to 75% in their first year of production. All natural gas rates and volumes are presented net of any load fluids. The potential development program shown is subject to a number of risks and uncertainties, including partner approvals and financing. (See forward looking information Slide 28)
KAYI-14 5.4 MMcf/d
KAYI-6 0.9 MMcf/d
KAYI-12 1.6 MMcf/d
Yagci-6 0.5 MMcf/d
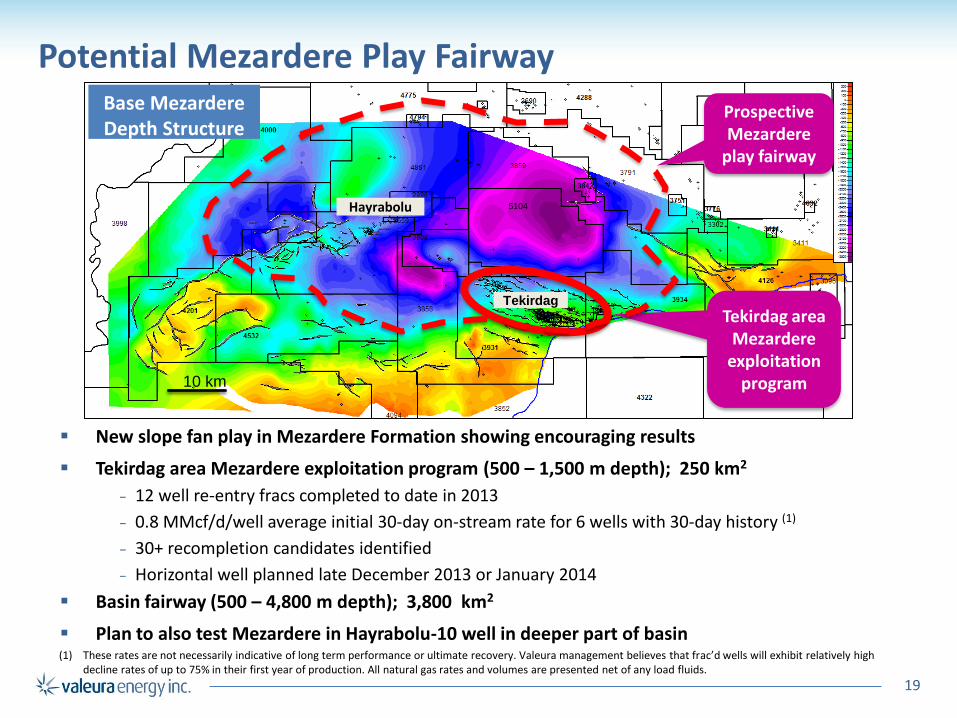
Potential Mezardere Play Fairway
19
Alacaogl
u
Mezarder
e Kitchen
Base Mezardere Depth Structure
Tekirdag
10 km
Prospective Mezardere
play fairway
5104
Tekirdag area Mezardere
exploitation program
Hayrabolu
New slope fan play in Mezardere Formation showing encouraging results
Tekirdag area Mezardere exploitation program (500 – 1,500 m depth); 250 km2
− 12 well re-entry fracs completed to date in 2013
− 0.8 MMcf/d/well average initial 30-day on-stream rate for 6 wells with 30-day history (1)
− 30+ recompletion candidates identified
− Horizontal well planned late December 2013 or January 2014
Basin fairway (500 – 4,800 m depth); 3,800 km2
Plan to also test Mezardere in Hayrabolu-10 well in deeper part of basin (1) These rates are not necessarily indicative of long term performance or ultimate recovery. Valeura management believes that frac’d wells will exhibit relatively high
decline rates of up to 75% in their first year of production. All natural gas rates and volumes are presented net of any load fluids.

27
I-8 Rig Drilling at TDR-9
Banarli Licence (100% - Operated)
20
Banarli Seismic Acquisition – June 2013
21
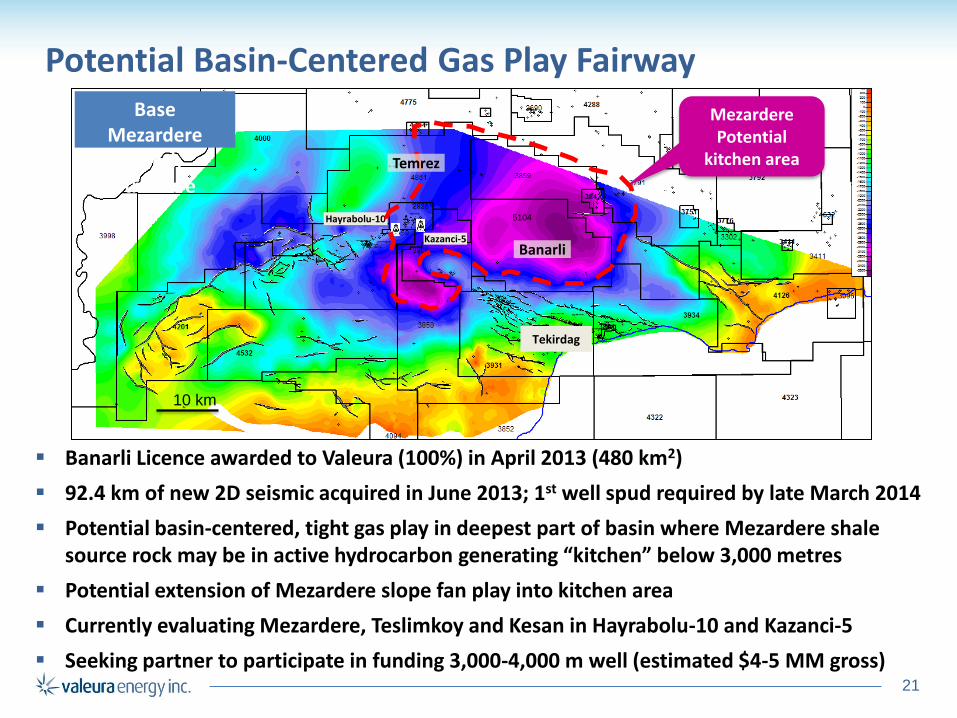
Potential Basin-Centered Gas Play Fairway
Banarli Licence awarded to Valeura (100%) in April 2013 (480 km2)
92.4 km of new 2D seismic acquired in June 2013; 1st well spud required by late March 2014
Potential basin-centered, tight gas play in deepest part of basin where Mezardere shale source rock may be in active hydrocarbon generating “kitchen” below 3,000 metres
Potential extension of Mezardere slope fan play into kitchen area
Currently evaluating Mezardere, Teslimkoy and Kesan in Hayrabolu-10 and Kazanci-5
Seeking partner to participate in funding 3,000-4,000 m well (estimated $4-5 MM gross)
Alacaogl
u
Mezardere
Kitchen
Base Mezardere
Depth Structure
Tekirdag
10 km
Kazanci-5
Mezardere Potential
kitchen area
Hayrabolu-10 5104
Temrez
Banarli
22
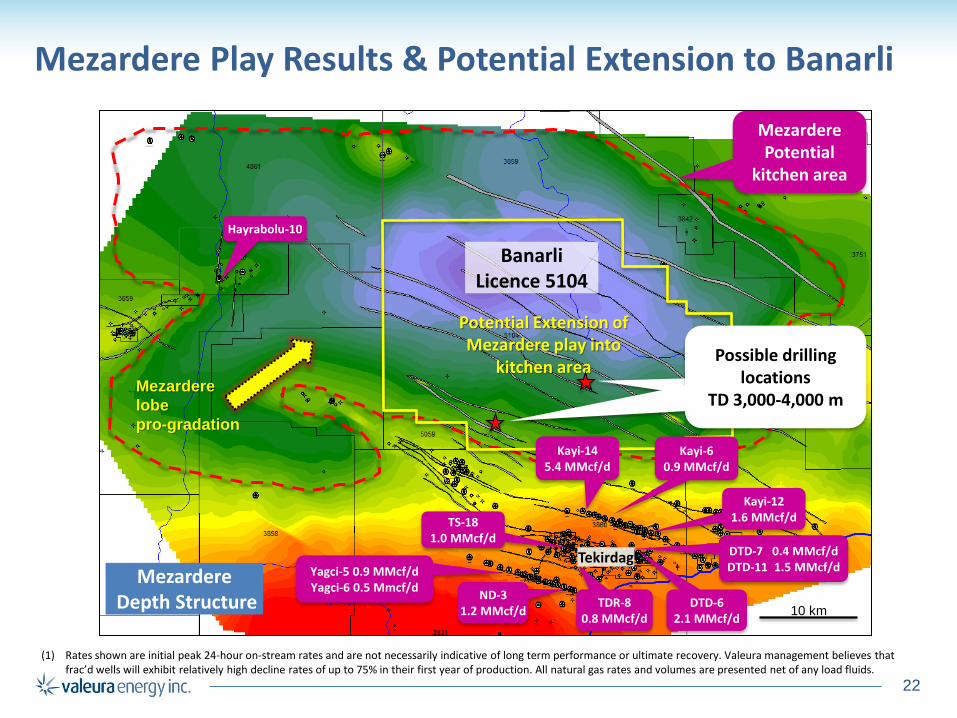
Mezardere Play Results & Potential Extension to Banarli
10 km
Mezardere Potential
kitchen area
5104
Mezardere Depth Structure
Banarli Licence 5104
TS-18 1.0 MMcf/d
DTD-6 2.1 MMcf/d
ND-3 1.2 MMcf/d
DTD-7 0.4 MMcf/d DTD-11 1.5 MMcf/d Yagci-5 0.9 MMcf/d
Yagci-6 0.5 Mmcf/d TDR-8
0.8 MMcf/d
Tekirdag
Potential Extension of Mezardere play into
kitchen area Mezardere
lobe
pro-gradation
Kayi-12 1.6 MMcf/d
Kayi-14 5.4 MMcf/d
Hayrabolu-10
Kayi-6 0.9 MMcf/d
Possible drilling
locations
Possible drilling locations
TD 3,000-4,000 m
(1) Rates shown are initial peak 24-hour on-stream rates and are not necessarily indicative of long term performance or ultimate recovery. Valeura management believes that frac’d wells will exhibit relatively high decline rates of up to 75% in their first year of production. All natural gas rates and volumes are presented net of any load fluids.
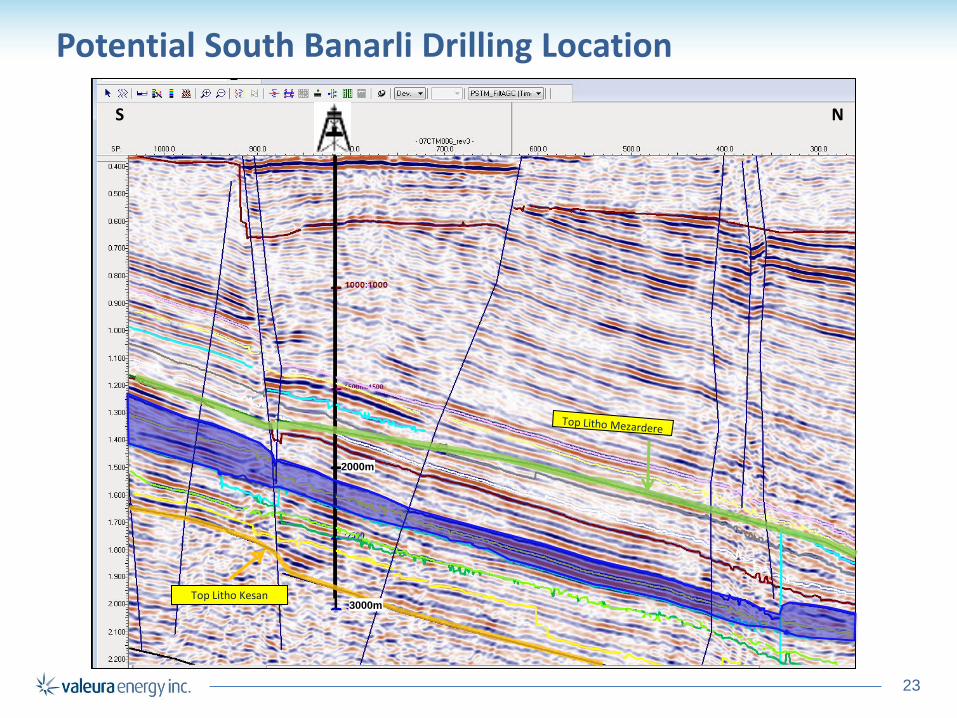
23
Top Litho Kesan
Potential South Banarli Drilling Location
S N
2000m
3000m
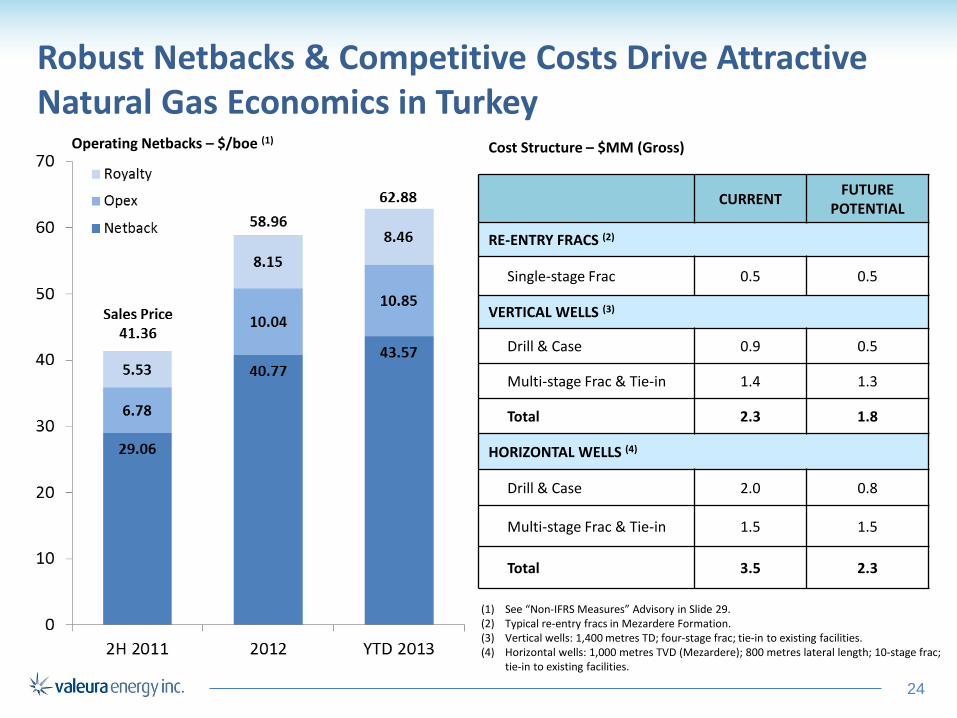
Robust Netbacks & Competitive Costs Drive Attractive Natural Gas Economics in Turkey
Operating Netbacks – $/boe (1)
(1) See “Non-IFRS Measures” Advisory in Slide 29. (2) Typical re-entry fracs in Mezardere Formation. (3) Vertical wells: 1,400 metres TD; four-stage frac; tie-in to existing facilities. (4) Horizontal wells: 1,000 metres TVD (Mezardere); 800 metres lateral length; 10-stage frac;
tie-in to existing facilities.
CURRENT FUTURE
POTENTIAL
RE-ENTRY FRACS (2)
Single-stage Frac 0.5 0.5
VERTICAL WELLS (3)
Drill & Case 0.9 0.5
Multi-stage Frac & Tie-in 1.4 1.3
Total 2.3 1.8
HORIZONTAL WELLS (4)
Drill & Case 2.0 0.8
Multi-stage Frac & Tie-in 1.5 1.5
Total 3.5 2.3
Cost Structure – $MM (Gross)
24
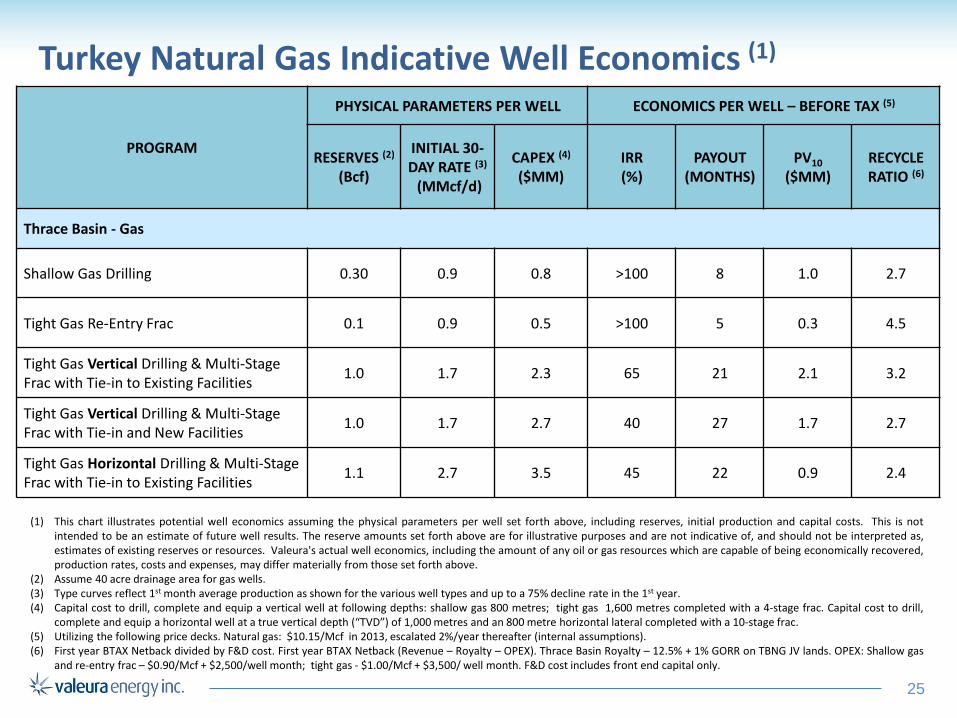
25
PROGRAM
PHYSICAL PARAMETERS PER WELL ECONOMICS PER WELL – BEFORE TAX (5)
RESERVES (2)
(Bcf)
INITIAL 30-DAY RATE (3)
(MMcf/d)
CAPEX (4)
($MM) IRR
(%) PAYOUT
(MONTHS) PV10
($MM) RECYCLE RATIO (6)
Thrace Basin - Gas
Shallow Gas Drilling 0.30 0.9 0.8 >100 8 1.0 2.7
Tight Gas Re-Entry Frac 0.1 0.9 0.5 >100 5 0.3 4.5
Tight Gas Vertical Drilling & Multi-Stage Frac with Tie-in to Existing Facilities
1.0 1.7 2.3 65 21 2.1 3.2
Tight Gas Vertical Drilling & Multi-Stage Frac with Tie-in and New Facilities
1.0 1.7 2.7 40 27 1.7 2.7
Tight Gas Horizontal Drilling & Multi-Stage Frac with Tie-in to Existing Facilities
1.1 2.7 3.5 45 22 0.9 2.4
Turkey Natural Gas Indicative Well Economics (1)
(1) This chart illustrates potential well economics assuming the physical parameters per well set forth above, including reserves, initial production and capital costs. This is not intended to be an estimate of future well results. The reserve amounts set forth above are for illustrative purposes and are not indicative of, and should not be interpreted as, estimates of existing reserves or resources. Valeura's actual well economics, including the amount of any oil or gas resources which are capable of being economically recovered, production rates, costs and expenses, may differ materially from those set forth above.
(2) Assume 40 acre drainage area for gas wells. (3) Type curves reflect 1st month average production as shown for the various well types and up to a 75% decline rate in the 1st year. (4) Capital cost to drill, complete and equip a vertical well at following depths: shallow gas 800 metres; tight gas 1,600 metres completed with a 4-stage frac. Capital cost to drill,
complete and equip a horizontal well at a true vertical depth (“TVD”) of 1,000 metres and an 800 metre horizontal lateral completed with a 10-stage frac. (5) Utilizing the following price decks. Natural gas: $10.15/Mcf in 2013, escalated 2%/year thereafter (internal assumptions). (6) First year BTAX Netback divided by F&D cost. First year BTAX Netback (Revenue – Royalty – OPEX). Thrace Basin Royalty – 12.5% + 1% GORR on TBNG JV lands. OPEX: Shallow gas
and re-entry frac – $0.90/Mcf + $2,500/well month; tight gas - $1.00/Mcf + $3,500/ well month. F&D cost includes front end capital only.
26
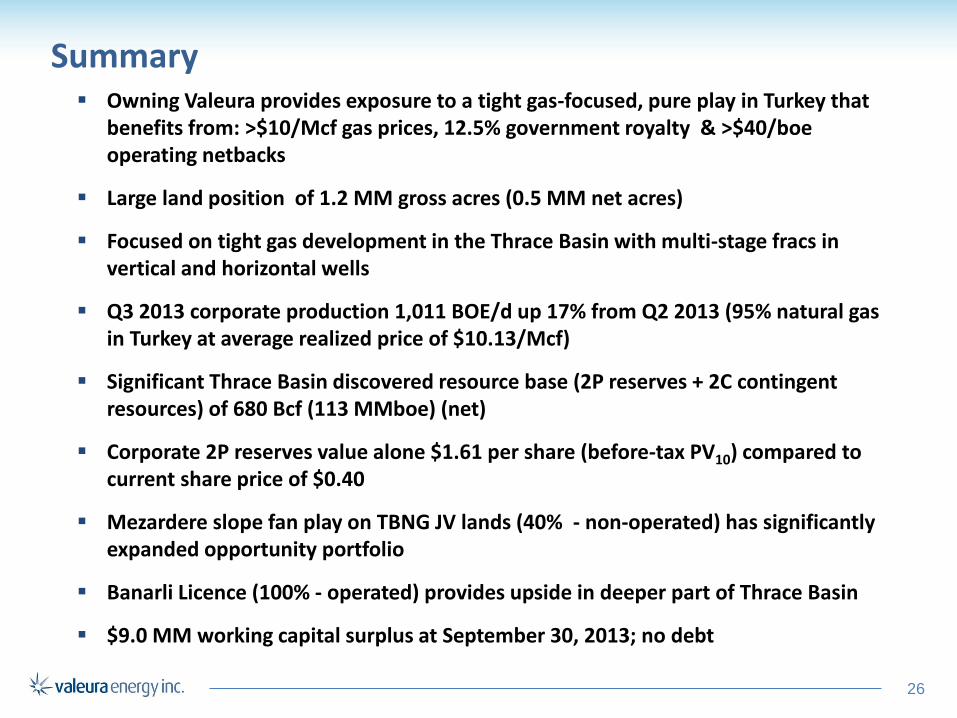
Summary
Owning Valeura provides exposure to a tight gas-focused, pure play in Turkey that benefits from: >$10/Mcf gas prices, 12.5% government royalty & >$40/boe operating netbacks
Large land position of 1.2 MM gross acres (0.5 MM net acres)
Focused on tight gas development in the Thrace Basin with multi-stage fracs in vertical and horizontal wells
Q3 2013 corporate production 1,011 BOE/d up 17% from Q2 2013 (95% natural gas in Turkey at average realized price of $10.13/Mcf)
Significant Thrace Basin discovered resource base (2P reserves + 2C contingent resources) of 680 Bcf (113 MMboe) (net)
Corporate 2P reserves value alone $1.61 per share (before-tax PV10) compared to current share price of $0.40
Mezardere slope fan play on TBNG JV lands (40% - non-operated) has significantly expanded opportunity portfolio
Banarli Licence (100% - operated) provides upside in deeper part of Thrace Basin
$9.0 MM working capital surplus at September 30, 2013; no debt
A GLOBAL ENERGY COMPANY FOCUSED ON EXCEPTIONAL VALUE CREATION
SUPPLEMENTARY INFORMATION

28
Disclaimer/Forward Looking Information
This presentation contains certain forward-looking statements including, but not limited to: plans for the tight gas delineation and development program in the Thrace Basin, the potential number of wells to be drilled and the ability to finance development; anticipated work programs, budgets and operational plans, including targeted seismic, drilling, completions, workovers, well re-entry fracs and fracs on new wells, the continued drilling of horizontal wells with multi-stage frac completions and the expected impact and timing thereof; the future development program in the Thrace Basin; the potential for re-completions and a follow-on development program in the Mezardere formation, and the number of re-completion candidates; the timing, costs and ability to fund each of the foregoing; and, the plans for and prospectivity of the Banarli Licence 5104 and other licences. Forward-looking information typically contains statements with words such as "anticipate", "estimate", "expect", "target", "potential", "could", "should", "would" or similar words suggesting future outcomes. The Corporation cautions readers and prospective investors in the Corporation’s securities to not place undue reliance on forward-looking information, as by its nature, it is based on current expectations regarding future events that involve a number of assumptions, inherent risks and uncertainties, which could cause actual results to differ materially from those anticipated by the Corporation. Statements related to "reserves" or “contingent resources" are deemed forward-looking statements as they involve the implied assessment, based on certain estimates and assumptions, that the reserves and resources can be profitably produced in the future.
Forward looking information is based on management's current expectations and assumptions regarding, among other things: continued political stability of the areas in which the Corporation is operating and completing transactions; continued operations of and approvals forthcoming from the General Directorate of Petroleum Affairs of the Republic of Turkey ("GDPA") in a manner consistent with past conduct; results of future seismic programs; future drilling and fracing activity, including the extent and pace of tight gas development drilling in the Tekirdag area and the funding thereof; the ability to manage water production; future production rates and associated cash flow; future capital and other expenditures (including the amount and nature thereof); the ability to meet drilling deadlines and other requirements under licences and leases, including spudding deadlines under the Banarli Licence 5104 and Copkoy Licence 5147; the ability to attract partners and negotiate farm-in arrangements; future sources of funding; future economic conditions; future currency and exchange rates; and the Corporation's continued ability to obtain and retain qualified staff and equipment in a timely and cost efficient manner. In addition, budgets are based upon the Corporation's current work programs proposed by partners and associated exploration plans and anticipated costs, which are subject to change based on, among other things, the actual results of drilling and related activity, availability of fracing and other specialized oilfield equipment and service providers and unexpected delays and changes in market conditions. Although the Corporation believes the expectations and assumptions reflected in such forward-looking information are reasonable, they may prove to be incorrect.
Forward-looking information involves significant known and unknown risks and uncertainties. Exploration, appraisal, and development of oil and natural gas reserves are speculative activities and involve a significant degree of risk. A number of factors could cause actual results to differ materially from those anticipated by the Corporation including, but not limited to: risks associated with the oil and gas industry (e.g. operational risks in exploration, inherent uncertainties in interpreting geological data, and changes in plans with respect to exploration or capital expenditures, the uncertainty of estimates and projections in relation to costs and expenses, and health, safety, and environmental risks); uncertainty regarding the sustainability of initial production rates and decline rates thereafter; uncertainty regarding the ability to address technical drilling challenges and manage water production; uncertainty regarding the state of capital markets and the availability of future financings; the risk of being unable to meet drilling deadlines and the requirements under licences and leases (including Banarli Licence 5104 and Copkoy Licence 5147); the ability to attract partners and negotiate farm-in arrangements; future sources of funding; uncertainty regarding the manner in which the new Turkish Petroleum Law and associated regulations will be implemented; the risks of disruption to operations and access to worksites, threats to security and safety of personnel and potential property damage related to political issues, terrorist attacks, insurgencies or civil unrest (particularly in the southeastern part of Turkey); the risks of increased costs and delays in timing related to protecting the safety and security of Valeura's personnel and property; the risk of commodity and BOTAS pricing and foreign exchange rate fluctuations; the uncertainty associated with negotiating with third parties in countries other than Canada; the risk of partners having different views on work programs and potential disputes among partners; the uncertainty regarding government or other approvals; potential changes in laws and regulations; risks associated with weather delays and natural disasters; and, the risk associated with international activity. The forward-looking information included in this news release is expressly qualified in its entirety by this cautionary statement. The forward-looking information included herein is made as of the date hereof and Valeura assumes no obligation to update or revise any forward-looking information to reflect new events or circumstances, except as required by law.
See Valeura's 2012 Annual Information Form (“2012 AIF”) for a detailed discussion of the risk factors.
29
Oil and Gas Terms and Advisories
"reserves" are estimated remaining quantities of oil and natural gas and related substances anticipated to be recoverable from known accumulations, as of a given date, based on analysis of drilling, geological, geophysical and engineering data; the use of established technology; and specified economic conditions which are generally accepted as being reasonable.
"proved reserves" are those reserves that can be estimated with a high degree of certainty to be recoverable. It is likely that the actual remaining quantities recovered will exceed the estimated proved reserves.
"probable reserves" are those additional reserves that are less certain to be recovered than proved reserves. It is equally likely that the actual remaining quantities recovered will be greater or less than the sum of the estimated proved + probable reserves.
"Possible reserves” are those additional reserves that are less certain to be recovered than probable reserves. It is unlikely that the actual remaining quantities recovered will exceed the sum of the estimated proved plus probable plus possible reserves. There is a 10% probability that the quantities actually recovered will equal or exceed the sum of the proved plus probable plus possible reserves.
"contingent resources” are those quantities of petroleum estimated, as of a given date, to be potentially recoverable from known accumulations using established technology or technology under development, but which are not currently considered to be commercially recoverable due to one or more contingencies. Contingent resources have an associated chance of development (economic, regulatory, market and facility, corporate commitment or political risks). The estimates herein have not been risked for the chance of development. There is no certainty that the contingent resources will be developed and, if they are developed, there is no certainty as to the timing of such development or that it will be commercially viable to produce any portion of the contingent resources.
Estimates of reserves for individual properties in this presentation may not reflect the same confidence level as estimates of reserves and future net revenue for all properties, due to the effects of aggregation.
Additional reserves information as required under NI 51-101, together with additional disclosure on contingent resources and related contingencies, are included in the Corporation’s 2012 AIF filed on SEDAR.
NON-IFRS MEASURES The financial information contained here-in includes non-IFRS measures, which may not be comparable to other companies. Funds flow from operations is calculated as net loss for the period adjusted for non-cash items in the statement of cash flows. Operating netback (or operating cash flow) is calculated as petroleum and natural gas sales less royalties, production expenses and transportation costs. See MD&A for further discussion.
30
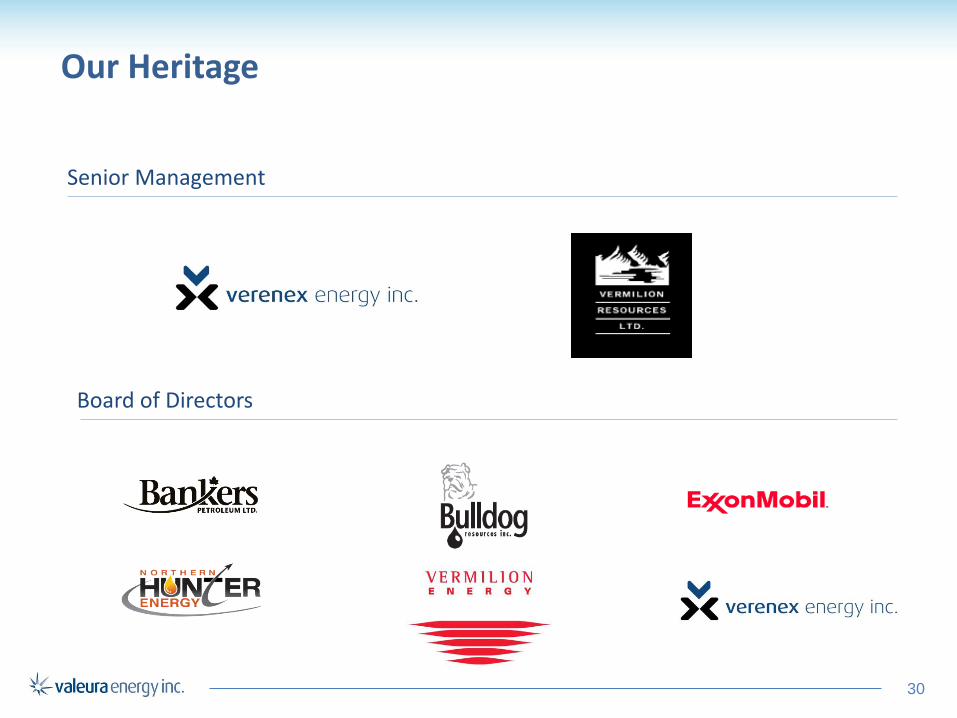
Our Heritage
Senior Management
Board of Directors
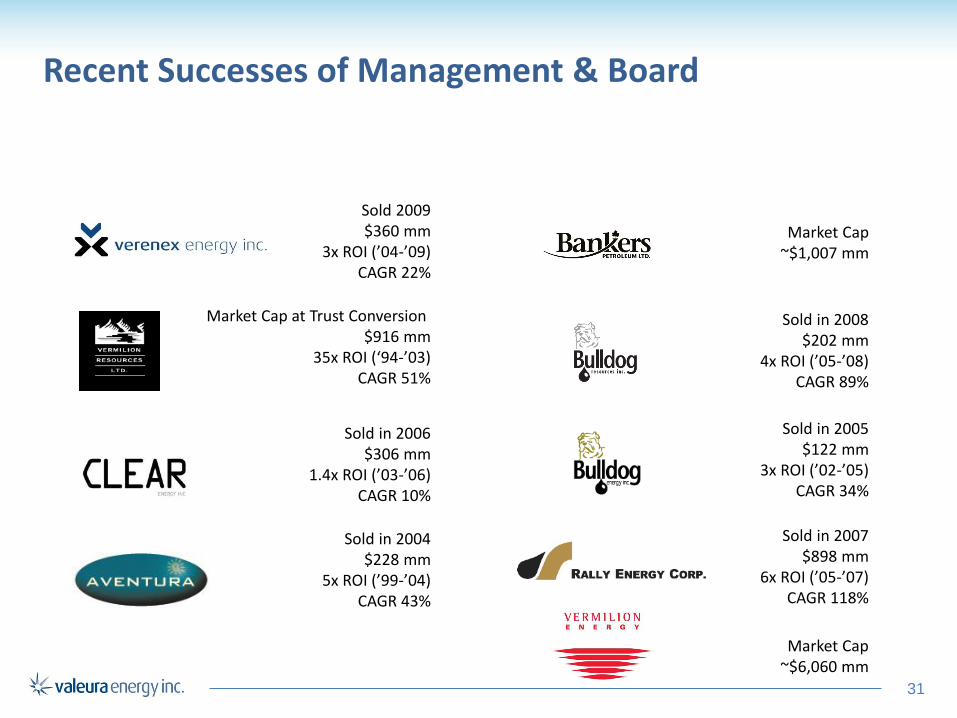
Recent Successes of Management & Board
Market Cap ~$6,060 mm
Sold in 2004 $228 mm
5x ROI (’99-’04) CAGR 43%
Sold 2009 $360 mm
3x ROI (’04-’09) CAGR 22%
Market Cap at Trust Conversion $916 mm
35x ROI (‘94-’03) CAGR 51%
Sold in 2006 $306 mm
1.4x ROI (’03-’06) CAGR 10%
Sold in 2007 $898 mm
6x ROI (’05-’07) CAGR 118%
Sold in 2008 $202 mm
4x ROI (’05-’08) CAGR 89%
Market Cap ~$1,007 mm
Sold in 2005 $122 mm
3x ROI (’02-’05) CAGR 34%
31
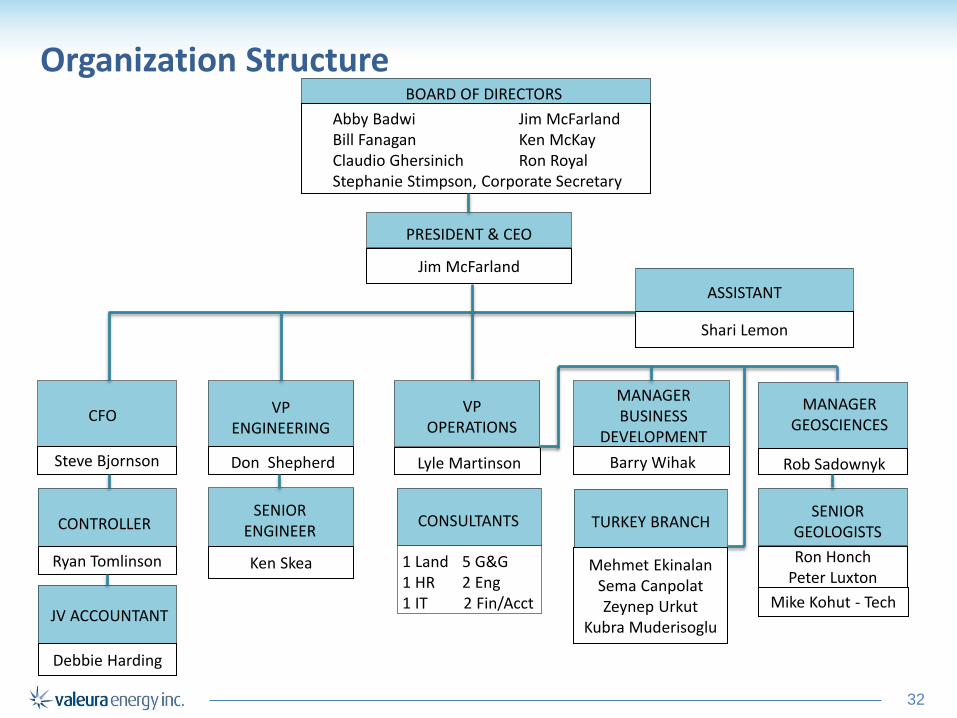
Organization Structure
32
BOARD OF DIRECTORS
Jim McFarland
PRESIDENT & CEO
Shari Lemon
ASSISTANT
Abby Badwi Jim McFarland Bill Fanagan Ken McKay Claudio Ghersinich Ron Royal Stephanie Stimpson, Corporate Secretary
VP ENGINEERING
MANAGER BUSINESS
DEVELOPMENT
VP OPERATIONS
Don Shepherd Lyle Martinson Barry Wihak
CFO
Steve Bjornson Rob Sadownyk
Peter Luxton
SENIOR GEOLOGISTS
Ron Honch Peter Luxton
1 Land 5 G&G 1 HR 2 Eng 1 IT 2 Fin/Acct
CONSULTANTS
Ryan Tomlinson
CONTROLLER TURKEY BRANCH
MANAGER GEOSCIENCES
Ken Skea Mehmet Ekinalan Sema Canpolat Zeynep Urkut
Kubra Muderisoglu
Mike Kohut - Tech JV ACCOUNTANT
Debbie Harding
SENIOR ENGINEER
33
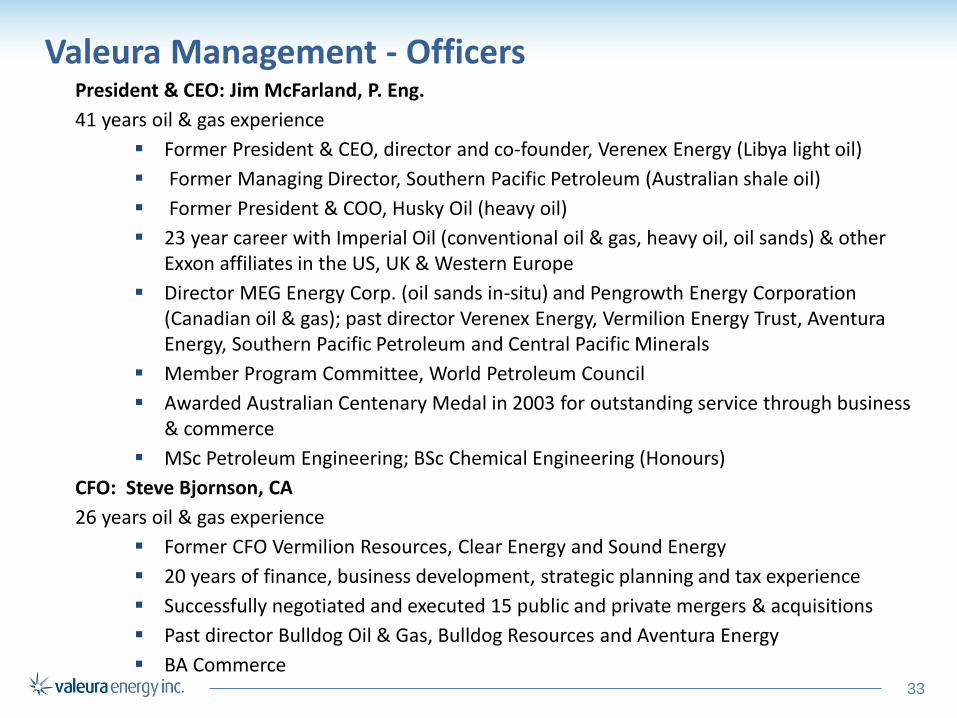
Valeura Management - Officers
President & CEO: Jim McFarland, P. Eng.
41 years oil & gas experience
Former President & CEO, director and co-founder, Verenex Energy (Libya light oil)
Former Managing Director, Southern Pacific Petroleum (Australian shale oil)
Former President & COO, Husky Oil (heavy oil)
23 year career with Imperial Oil (conventional oil & gas, heavy oil, oil sands) & other Exxon affiliates in the US, UK & Western Europe
Director MEG Energy Corp. (oil sands in-situ) and Pengrowth Energy Corporation (Canadian oil & gas); past director Verenex Energy, Vermilion Energy Trust, Aventura Energy, Southern Pacific Petroleum and Central Pacific Minerals
Member Program Committee, World Petroleum Council
Awarded Australian Centenary Medal in 2003 for outstanding service through business & commerce
MSc Petroleum Engineering; BSc Chemical Engineering (Honours)
CFO: Steve Bjornson, CA
26 years oil & gas experience
Former CFO Vermilion Resources, Clear Energy and Sound Energy
20 years of finance, business development, strategic planning and tax experience
Successfully negotiated and executed 15 public and private mergers & acquisitions
Past director Bulldog Oil & Gas, Bulldog Resources and Aventura Energy
BA Commerce
34
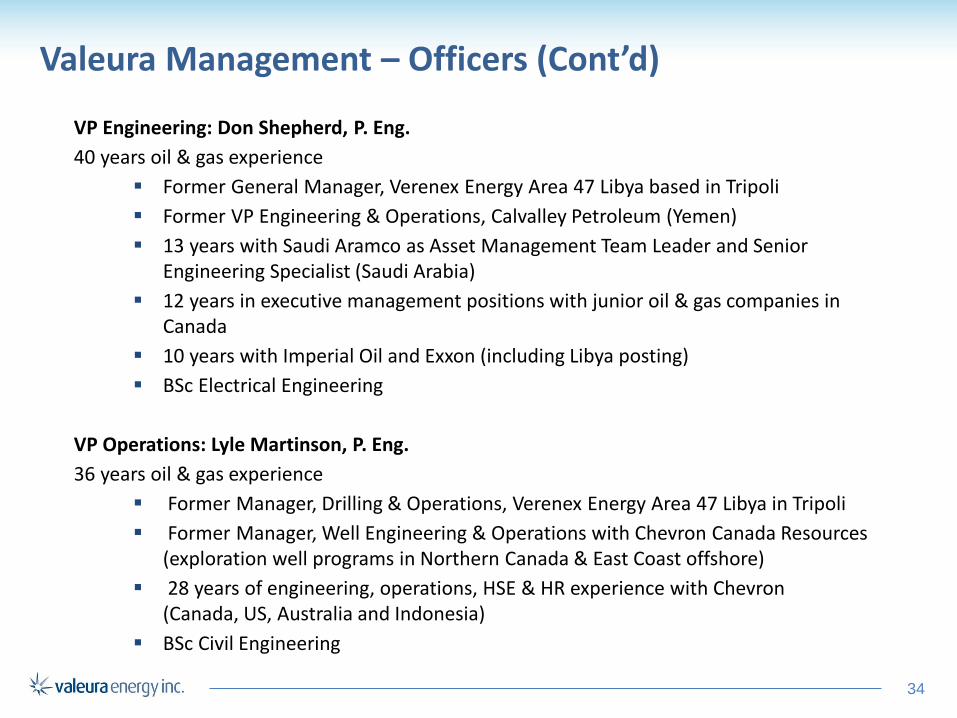
Valeura Management – Officers (Cont’d)
VP Engineering: Don Shepherd, P. Eng.
40 years oil & gas experience
Former General Manager, Verenex Energy Area 47 Libya based in Tripoli
Former VP Engineering & Operations, Calvalley Petroleum (Yemen)
13 years with Saudi Aramco as Asset Management Team Leader and Senior Engineering Specialist (Saudi Arabia)
12 years in executive management positions with junior oil & gas companies in Canada
10 years with Imperial Oil and Exxon (including Libya posting)
BSc Electrical Engineering
VP Operations: Lyle Martinson, P. Eng.
36 years oil & gas experience
Former Manager, Drilling & Operations, Verenex Energy Area 47 Libya in Tripoli
Former Manager, Well Engineering & Operations with Chevron Canada Resources (exploration well programs in Northern Canada & East Coast offshore)
28 years of engineering, operations, HSE & HR experience with Chevron (Canada, US, Australia and Indonesia)
BSc Civil Engineering
35
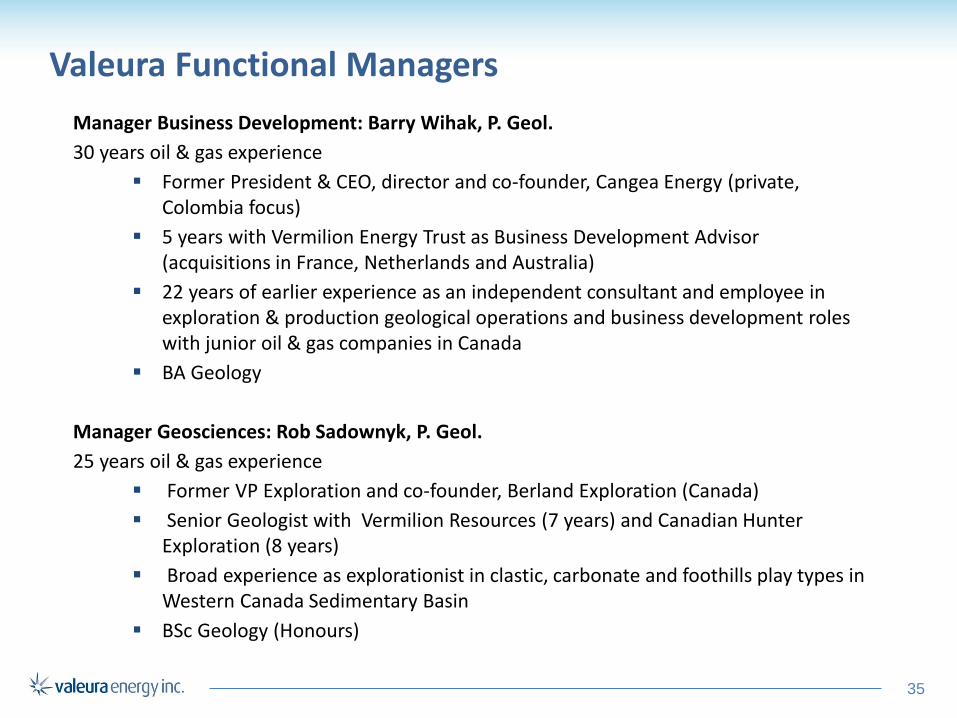
Manager Business Development: Barry Wihak, P. Geol.
30 years oil & gas experience
Former President & CEO, director and co-founder, Cangea Energy (private, Colombia focus)
5 years with Vermilion Energy Trust as Business Development Advisor (acquisitions in France, Netherlands and Australia)
22 years of earlier experience as an independent consultant and employee in exploration & production geological operations and business development roles with junior oil & gas companies in Canada
BA Geology
Manager Geosciences: Rob Sadownyk, P. Geol.
25 years oil & gas experience
Former VP Exploration and co-founder, Berland Exploration (Canada)
Senior Geologist with Vermilion Resources (7 years) and Canadian Hunter Exploration (8 years)
Broad experience as explorationist in clastic, carbonate and foothills play types in Western Canada Sedimentary Basin
BSc Geology (Honours)
Valeura Functional Managers
36
Country Representative: Mehmet Ekinalan
6 years oil & gas experience
21 years telecommunications experience (Turkey and USA)
Former Resident Representative of Thrace Basin Natural Gas Turkiye Corporation
Former CEO and Board member of Turkish Telecom
Former CEO of AYCELL (Turkey)
15 years of management and technical roles in Omni Communications (USA), NEC (Turkey), Turkish Telecom (Turkey) and Radiocom (Turkey)
MSc General Administration; BSc Electronics and Telecommunications
Valeura Functional Managers (Cont’d)
37
Board of Directors
Abby Badwi, P. Geol. Vice-Chairman, Bankers Petroleum Ltd.
Geological background
Bill Fanagan, CA (Chair)
Former Chairman, Verenex Energy Inc.
Former President & CEO, Gulf Indonesia Resources Limited
Financial background (Audit Chair)
Claudio Ghersinich, P. Eng. Co-founder & former EVP Business Development, Vermilion Energy Trust
Former Director, Verenex Energy Inc.
Business and engineering background
Jim McFarland, P. Eng.
President & CEO
Engineering background
Ken McKay, P. Geol.
Former Executive Chairman, Bulldog Oil & Gas Inc.
Geological background
Ron Royal, P. Eng.
Former President & GM, Esso Chad
Engineering background
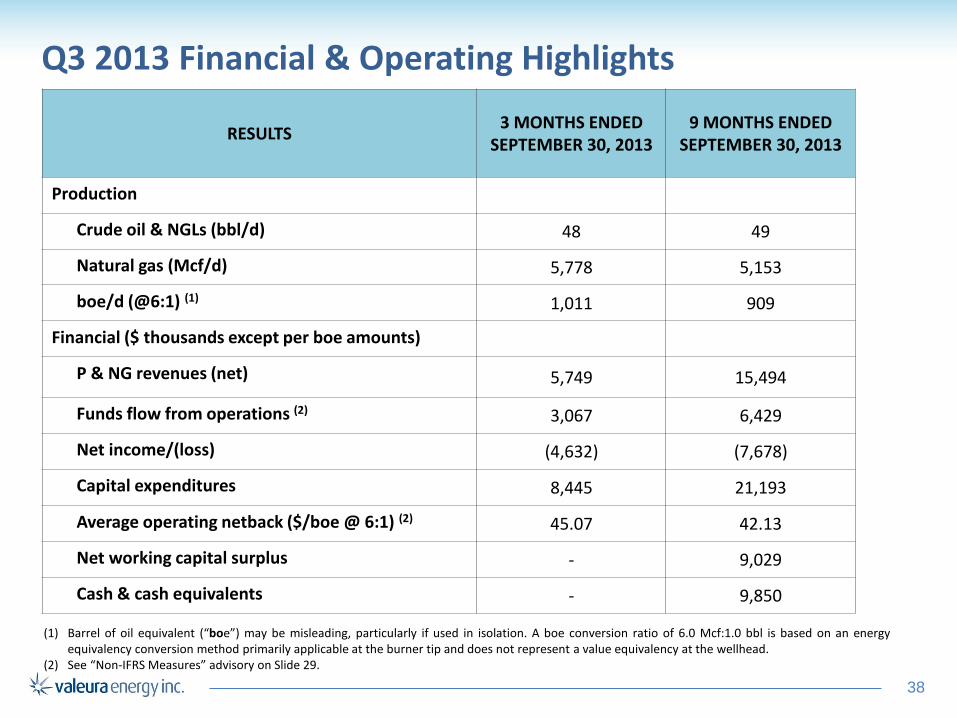
Q3 2013 Financial & Operating Highlights
RESULTS
3 MONTHS ENDED SEPTEMBER 30, 2013
9 MONTHS ENDED SEPTEMBER 30, 2013
Production
Crude oil & NGLs (bbl/d) 48 49
Natural gas (Mcf/d) 5,778 5,153
boe/d (@6:1) (1) 1,011 909
Financial ($ thousands except per boe amounts)
P & NG revenues (net) 5,749 15,494
Funds flow from operations (2) 3,067 6,429
Net income/(loss) (4,632) (7,678)
Capital expenditures 8,445 21,193
Average operating netback ($/boe @ 6:1) (2) 45.07 42.13
Net working capital surplus - 9,029
Cash & cash equivalents - 9,850
(1) Barrel of oil equivalent (“boe”) may be misleading, particularly if used in isolation. A boe conversion ratio of 6.0 Mcf:1.0 bbl is based on an energy equivalency conversion method primarily applicable at the burner tip and does not represent a value equivalency at the wellhead.
(2) See “Non-IFRS Measures” advisory on Slide 29.
38
39
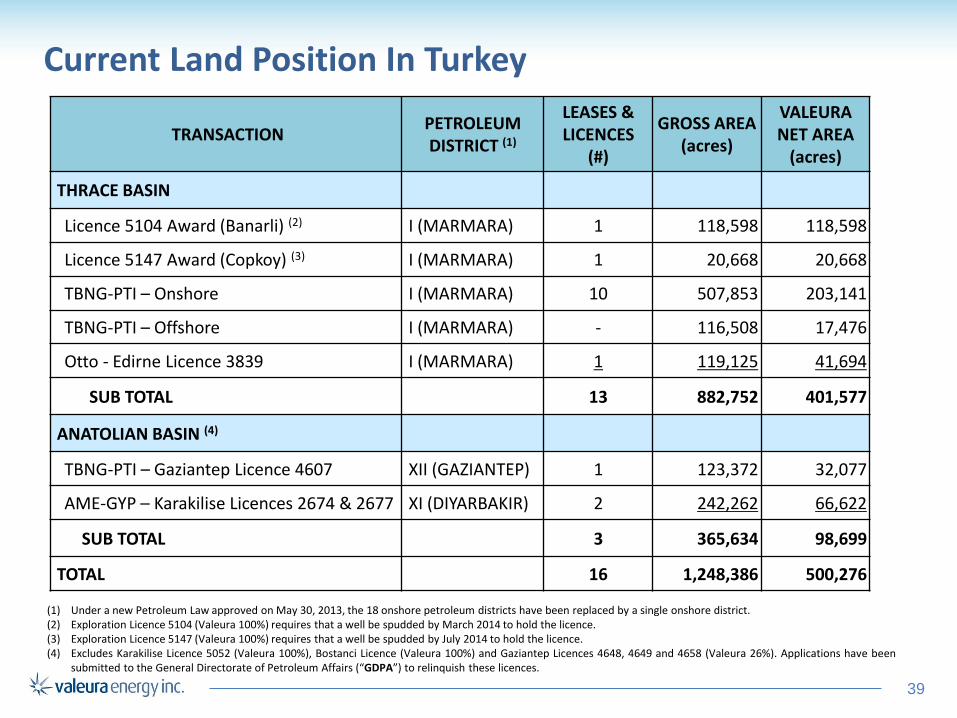
Current Land Position In Turkey
TRANSACTION
PETROLEUM DISTRICT (1)
LEASES & LICENCES
(#)
GROSS AREA (acres)
VALEURA NET AREA
(acres)
THRACE BASIN
Licence 5104 Award (Banarli) (2) I (MARMARA) 1 118,598 118,598
Licence 5147 Award (Copkoy) (3) I (MARMARA) 1 20,668 20,668
TBNG-PTI – Onshore I (MARMARA) 10 507,853 203,141
TBNG-PTI – Offshore I (MARMARA) - 116,508 17,476
Otto - Edirne Licence 3839 I (MARMARA) 1 119,125 41,694
SUB TOTAL 13 882,752 401,577
ANATOLIAN BASIN (4)
TBNG-PTI – Gaziantep Licence 4607 XII (GAZIANTEP) 1 123,372 32,077
AME-GYP – Karakilise Licences 2674 & 2677 XI (DIYARBAKIR) 2 242,262 66,622
SUB TOTAL 3 365,634 98,699
TOTAL 16 1,248,386 500,276
(1) Under a new Petroleum Law approved on May 30, 2013, the 18 onshore petroleum districts have been replaced by a single onshore district. (2) Exploration Licence 5104 (Valeura 100%) requires that a well be spudded by March 2014 to hold the licence. (3) Exploration Licence 5147 (Valeura 100%) requires that a well be spudded by July 2014 to hold the licence. (4) Excludes Karakilise Licence 5052 (Valeura 100%), Bostanci Licence (Valeura 100%) and Gaziantep Licences 4648, 4649 and 4658 (Valeura 26%). Applications have been
submitted to the General Directorate of Petroleum Affairs (“GDPA”) to relinquish these licences.
40
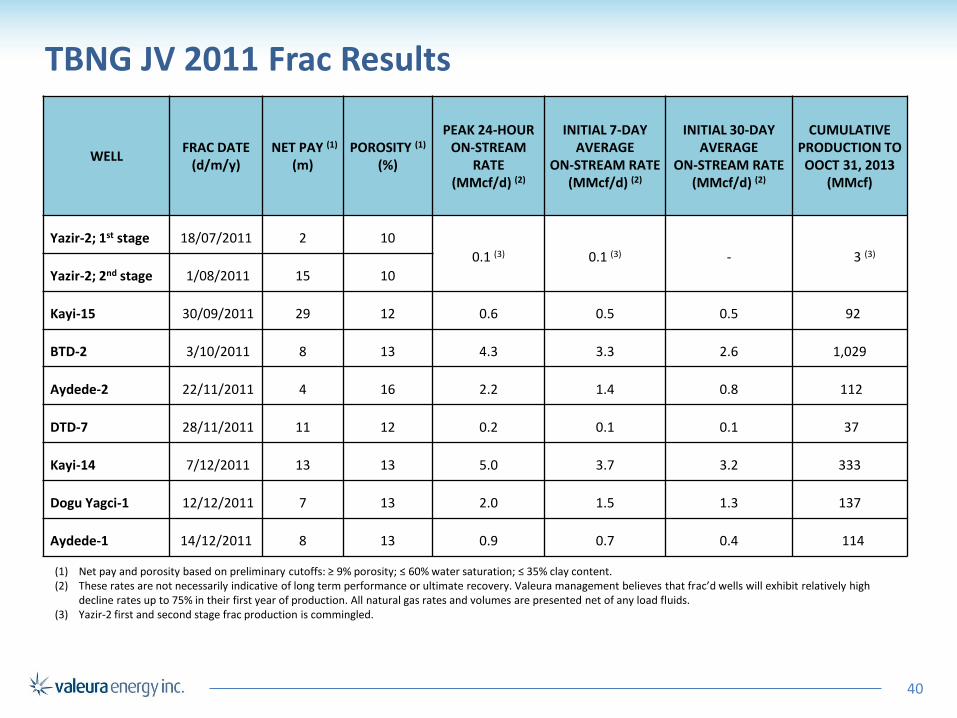
TBNG JV 2011 Frac Results
WELL FRAC DATE
(d/m/y) NET PAY (1)
(m) POROSITY (1)
(%)
PEAK 24-HOUR ON-STREAM
RATE (MMcf/d) (2)
INITIAL 7-DAY AVERAGE
ON-STREAM RATE (MMcf/d) (2)
INITIAL 30-DAY AVERAGE
ON-STREAM RATE (MMcf/d) (2)
CUMULATIVE PRODUCTION TO
OOCT 31, 2013 (MMcf)
Yazir-2; 1st stage 18/07/2011 2 10
0.1 (3) 0.1 (3) - 3 (3)
Yazir-2; 2nd stage 1/08/2011 15 10
Kayi-15 30/09/2011 29 12 0.6 0.5 0.5 92
BTD-2 3/10/2011 8 13 4.3 3.3 2.6 1,029
Aydede-2 22/11/2011 4 16 2.2 1.4 0.8 112
DTD-7 28/11/2011 11 12 0.2 0.1 0.1 37
Kayi-14 7/12/2011 13 13 5.0 3.7 3.2 333
Dogu Yagci-1 12/12/2011 7 13 2.0 1.5 1.3 137
Aydede-1 14/12/2011 8 13 0.9 0.7 0.4 114
(1) Net pay and porosity based on preliminary cutoffs: ≥ 9% porosity; ≤ 60% water saturation; ≤ 35% clay content. (2) These rates are not necessarily indicative of long term performance or ultimate recovery. Valeura management believes that frac’d wells will exhibit relatively high
decline rates up to 75% in their first year of production. All natural gas rates and volumes are presented net of any load fluids. (3) Yazir-2 first and second stage frac production is commingled.
41
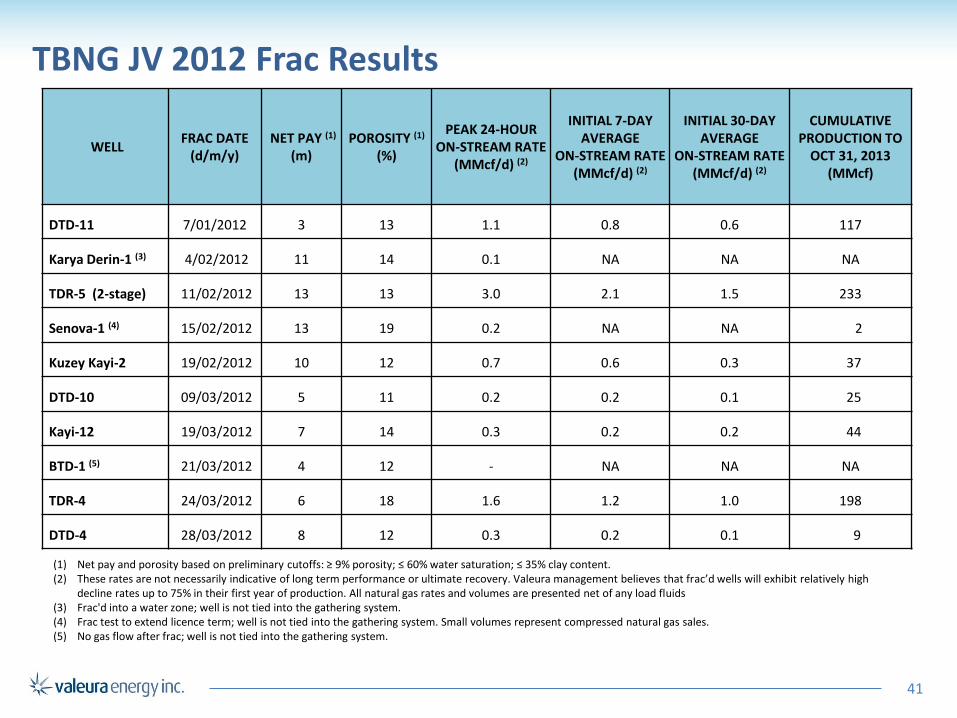
TBNG JV 2012 Frac Results
WELL
FRAC DATE (d/m/y)
NET PAY (1)
(m) POROSITY (1)
(%)
PEAK 24-HOUR ON-STREAM RATE
(MMcf/d) (2)
INITIAL 7-DAY AVERAGE
ON-STREAM RATE (MMcf/d) (2)
INITIAL 30-DAY AVERAGE
ON-STREAM RATE (MMcf/d) (2)
CUMULATIVE PRODUCTION TO
OCT 31, 2013 (MMcf)
DTD-11 7/01/2012 3 13 1.1 0.8 0.6 117
Karya Derin-1 (3) 4/02/2012 11 14 0.1 NA NA NA
TDR-5 (2-stage) 11/02/2012 13 13 3.0 2.1 1.5 233
Senova-1 (4) 15/02/2012 13 19 0.2 NA NA 2
Kuzey Kayi-2 19/02/2012 10 12 0.7 0.6 0.3 37
DTD-10 09/03/2012 5 11 0.2 0.2 0.1 25
Kayi-12 19/03/2012 7 14 0.3 0.2 0.2 44
BTD-1 (5) 21/03/2012 4 12 - NA NA NA
TDR-4 24/03/2012 6 18 1.6 1.2 1.0 198
DTD-4 28/03/2012 8 12 0.3 0.2 0.1 9
(1) Net pay and porosity based on preliminary cutoffs: ≥ 9% porosity; ≤ 60% water saturation; ≤ 35% clay content. (2) These rates are not necessarily indicative of long term performance or ultimate recovery. Valeura management believes that frac’d wells will exhibit relatively high
decline rates up to 75% in their first year of production. All natural gas rates and volumes are presented net of any load fluids (3) Frac'd into a water zone; well is not tied into the gathering system. (4) Frac test to extend licence term; well is not tied into the gathering system. Small volumes represent compressed natural gas sales. (5) No gas flow after frac; well is not tied into the gathering system.
42
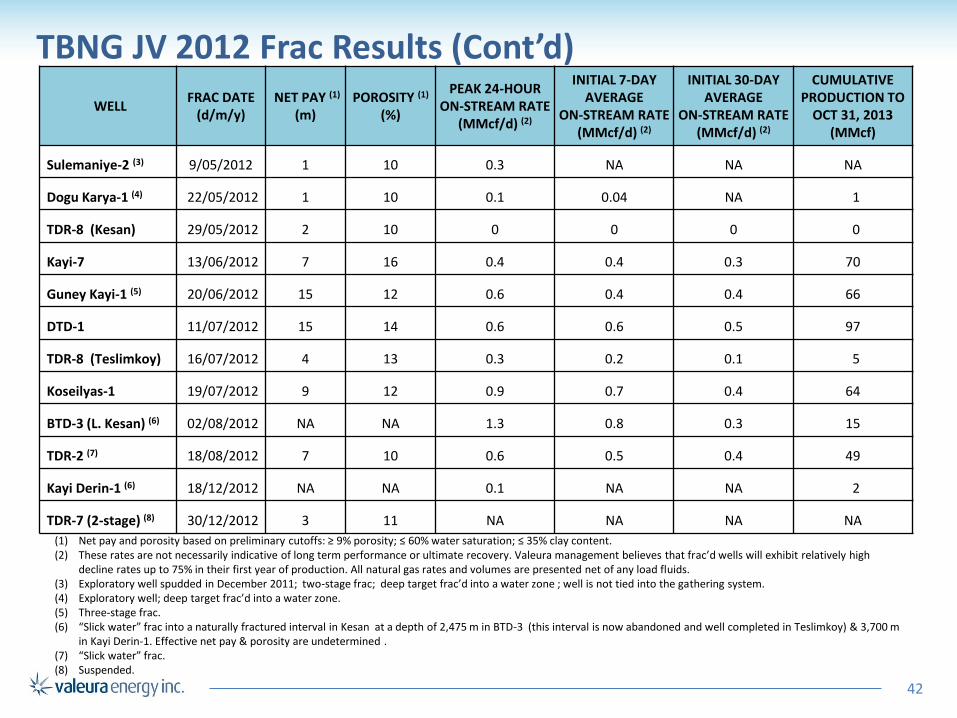
TBNG JV 2012 Frac Results (Cont’d)
WELL FRAC DATE
(d/m/y) NET PAY (1)
(m) POROSITY (1)
(%)
PEAK 24-HOUR ON-STREAM RATE
(MMcf/d) (2)
INITIAL 7-DAY AVERAGE
ON-STREAM RATE (MMcf/d) (2)
INITIAL 30-DAY AVERAGE
ON-STREAM RATE (MMcf/d) (2)
CUMULATIVE PRODUCTION TO
OCT 31, 2013 (MMcf)
Sulemaniye-2 (3) 9/05/2012 1 10 0.3 NA NA NA
Dogu Karya-1 (4) 22/05/2012 1 10 0.1 0.04 NA 1
TDR-8 (Kesan) 29/05/2012 2 10 0 0 0 0
Kayi-7 13/06/2012 7 16 0.4 0.4 0.3 70
Guney Kayi-1 (5) 20/06/2012 15 12 0.6 0.4 0.4 66
DTD-1 11/07/2012 15 14 0.6 0.6 0.5 97
TDR-8 (Teslimkoy) 16/07/2012 4 13 0.3 0.2 0.1 5
Koseilyas-1 19/07/2012 9 12 0.9 0.7 0.4 64
BTD-3 (L. Kesan) (6) 02/08/2012 NA NA 1.3 0.8 0.3 15
TDR-2 (7) 18/08/2012 7 10 0.6 0.5 0.4 49
Kayi Derin-1 (6) 18/12/2012 NA NA 0.1 NA NA 2
TDR-7 (2-stage) (8) 30/12/2012 3 11 NA NA NA NA
(1) Net pay and porosity based on preliminary cutoffs: ≥ 9% porosity; ≤ 60% water saturation; ≤ 35% clay content. (2) These rates are not necessarily indicative of long term performance or ultimate recovery. Valeura management believes that frac’d wells will exhibit relatively high
decline rates up to 75% in their first year of production. All natural gas rates and volumes are presented net of any load fluids. (3) Exploratory well spudded in December 2011; two-stage frac; deep target frac’d into a water zone ; well is not tied into the gathering system. (4) Exploratory well; deep target frac’d into a water zone. (5) Three-stage frac. (6) “Slick water” frac into a naturally fractured interval in Kesan at a depth of 2,475 m in BTD-3 (this interval is now abandoned and well completed in Teslimkoy) & 3,700 m
in Kayi Derin-1. Effective net pay & porosity are undetermined . (7) “Slick water” frac. (8) Suspended.
43
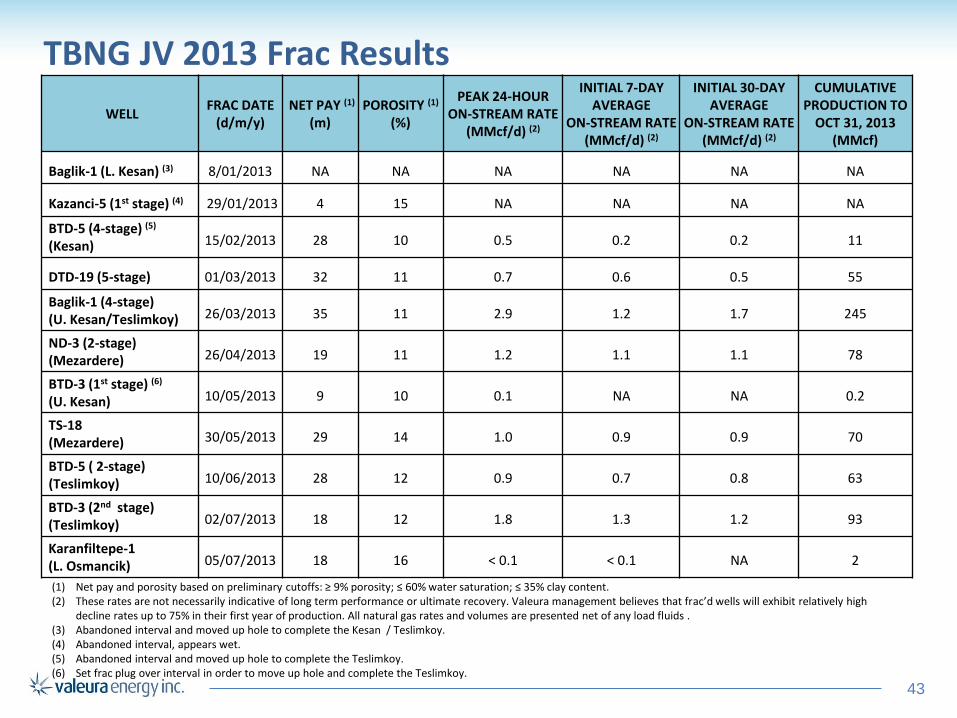
TBNG JV 2013 Frac Results
WELL FRAC DATE
(d/m/y) NET PAY (1)
(m) POROSITY (1)
(%)
PEAK 24-HOUR ON-STREAM RATE
(MMcf/d) (2)
INITIAL 7-DAY AVERAGE
ON-STREAM RATE (MMcf/d) (2)
INITIAL 30-DAY AVERAGE
ON-STREAM RATE (MMcf/d) (2)
CUMULATIVE PRODUCTION TO
OCT 31, 2013 (MMcf)
Baglik-1 (L. Kesan) (3) 8/01/2013 NA NA NA NA NA NA
Kazanci-5 (1st stage) (4) 29/01/2013 4 15 NA NA NA NA
BTD-5 (4-stage) (5)
(Kesan) 15/02/2013 28 10 0.5 0.2 0.2 11
DTD-19 (5-stage) 01/03/2013 32 11 0.7 0.6 0.5 55
Baglik-1 (4-stage) (U. Kesan/Teslimkoy) 26/03/2013 35 11 2.9 1.2 1.7 245
ND-3 (2-stage) (Mezardere) 26/04/2013 19 11 1.2 1.1 1.1 78
BTD-3 (1st stage) (6)
(U. Kesan) 10/05/2013 9 10 0.1 NA NA 0.2
TS-18 (Mezardere) 30/05/2013 29 14 1.0 0.9 0.9 70
BTD-5 ( 2-stage) (Teslimkoy) 10/06/2013 28 12 0.9 0.7 0.8 63
BTD-3 (2nd stage)
(Teslimkoy) 02/07/2013 18 12 1.8 1.3 1.2 93
Karanfiltepe-1 (L. Osmancik) 05/07/2013 18 16 ˂ 0.1 ˂ 0.1 NA 2
(1) Net pay and porosity based on preliminary cutoffs: ≥ 9% porosity; ≤ 60% water saturation; ≤ 35% clay content. (2) These rates are not necessarily indicative of long term performance or ultimate recovery. Valeura management believes that frac’d wells will exhibit relatively high
decline rates up to 75% in their first year of production. All natural gas rates and volumes are presented net of any load fluids . (3) Abandoned interval and moved up hole to complete the Kesan / Teslimkoy. (4) Abandoned interval, appears wet. (5) Abandoned interval and moved up hole to complete the Teslimkoy. (6) Set frac plug over interval in order to move up hole and complete the Teslimkoy.

44
TBNG JV 2013 Frac Results (Cont’d)
WELL FRAC DATE
(d/m/y) NET PAY (1)
(m) POROSITY (1)
(%)
PEAK 24-HOUR ON-STREAM RATE
(MMcf/d) (2)
INITIAL 7-DAY AVERAGE
ON-STREAM RATE (MMcf/d) (2)
INITIAL 30-DAY AVERAGE
ON-STREAM RATE (MMcf/d) (2)
CUMULATIVE PRODUCTION TO
OCT 31, 2013 (MMcf)
Karanfiltepe-6 (L. Osmancik) 12/07/2013 21 15 3.4 2.0 2.3 253
Yagci-5 (Mezardere) 19/07/2013 29 10 0.9 NA NA NA
DTD-19H (7-stage) (3)
(Upper Kesan) 26/07/2013 NA NA 0.6 0.5 0.4 26
BTD-1
(Teslimkoy) 30/07/2013 9 11 0.2 0.2 0.1 4
TDR-14 (U. Kesan) 05/08/2013 5 13 0.8 0.6 0.4 21
DTD-11 (Mezardere) 14/08/2013 28 17 1.5 1.2 0.8 36
DTD-7 (2-stage) (Mezardere) 17/08/2013 13 28 0.4 0.3 0.1 4
TDR-8 (Mezardere) 26/08/2013 14 15 0.8 0.6 0.3 7
DTD-6 (Mezardere) 03/09/2013 24 14 2.1 1.8 1.5 63
Karaevli-4 (Mezardere) 08/09/2013 32 11 NA NA NA NA
BTD-4H (10-stage) (4)
(Teslimkoy) 19/09/2013 NA NA 3.4 3.0 3.0 103
(1) Net pay and porosity based on preliminary cutoffs: ≥ 9% porosity; ≤ 60% water saturation; ≤ 35% clay content. (2) These rates are not necessarily indicative of long term performance or ultimate recovery. Valeura management believes that frac’d wells will exhibit relatively high
decline rates up to 75% in their first year of production. All natural gas rates and volumes are presented net of any load fluids . (3) Partially cleaned out well (five frac balls, ball seats and sand) with service rig and coiled tubing unit. Well is tied into gathering system but likely only five intervals are
contributing to flow. (4) Unsuccessful in cleaning out frac balls and seats with coiled tubing unit. Therefore unlikely that all 10 frac’d intervals are contributing to flow.
45
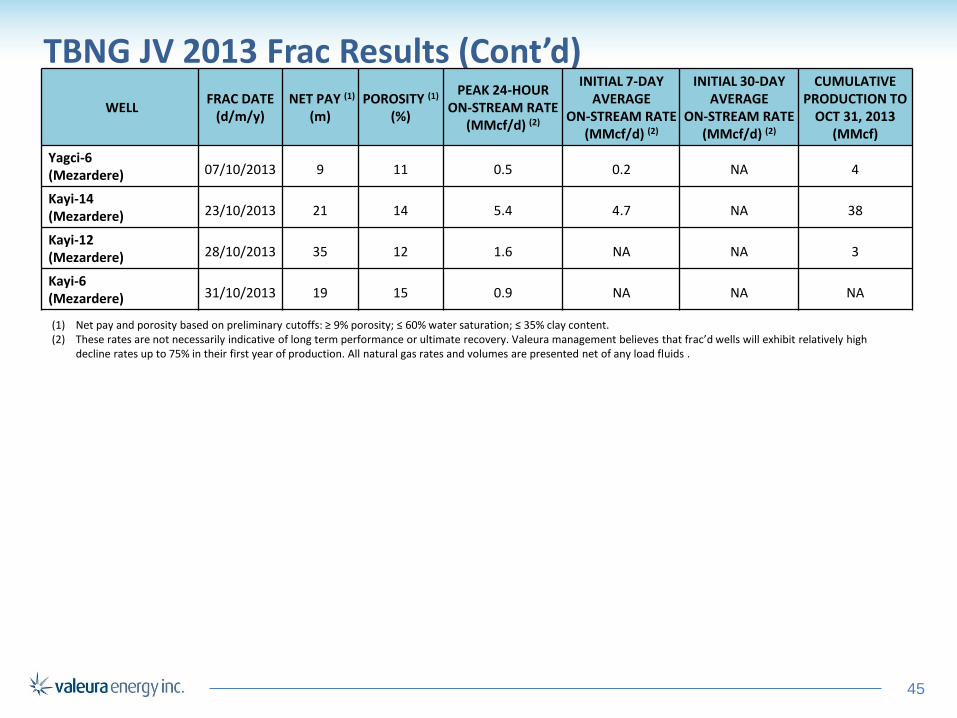
TBNG JV 2013 Frac Results (Cont’d)
WELL FRAC DATE
(d/m/y) NET PAY (1)
(m) POROSITY (1)
(%)
PEAK 24-HOUR ON-STREAM RATE
(MMcf/d) (2)
INITIAL 7-DAY AVERAGE
ON-STREAM RATE (MMcf/d) (2)
INITIAL 30-DAY AVERAGE
ON-STREAM RATE (MMcf/d) (2)
CUMULATIVE PRODUCTION TO
OCT 31, 2013 (MMcf)
Yagci-6 (Mezardere) 07/10/2013 9 11 0.5 0.2 NA 4
Kayi-14 (Mezardere) 23/10/2013 21 14 5.4 4.7 NA 38
Kayi-12 (Mezardere) 28/10/2013 35 12 1.6 NA NA 3
Kayi-6 (Mezardere) 31/10/2013 19 15 0.9 NA NA NA
(1) Net pay and porosity based on preliminary cutoffs: ≥ 9% porosity; ≤ 60% water saturation; ≤ 35% clay content. (2) These rates are not necessarily indicative of long term performance or ultimate recovery. Valeura management believes that frac’d wells will exhibit relatively high
decline rates up to 75% in their first year of production. All natural gas rates and volumes are presented net of any load fluids .
46
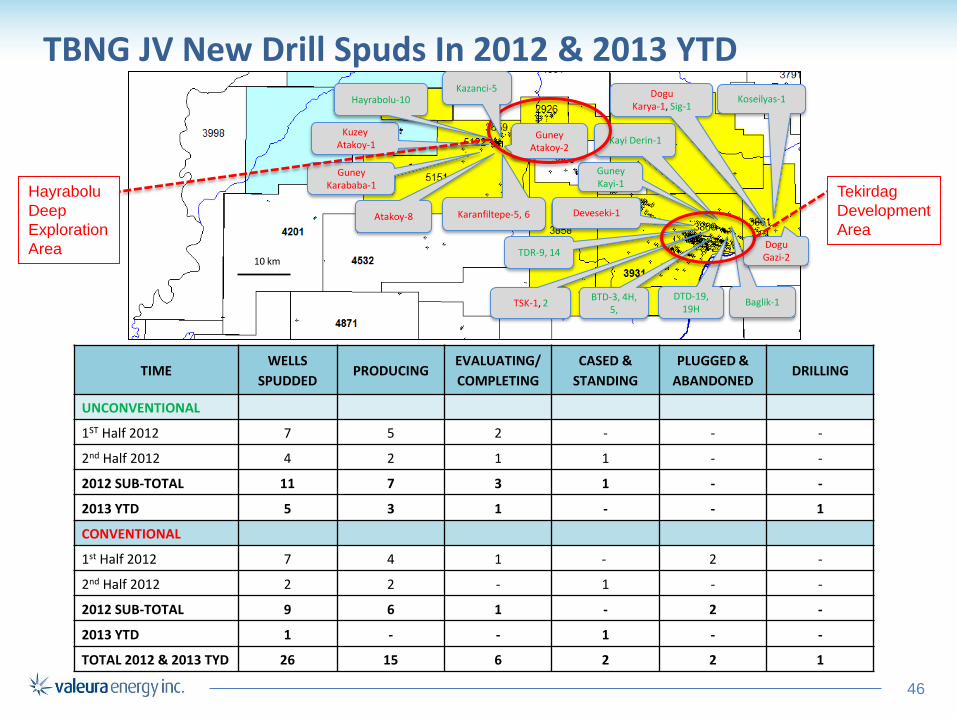
TBNG JV New Drill Spuds In 2012 & 2013 YTD
TIME WELLS
SPUDDED PRODUCING
EVALUATING/
COMPLETING
CASED &
STANDING
PLUGGED &
ABANDONED DRILLING
UNCONVENTIONAL
1ST Half 2012 7 5 2 - - -
2nd Half 2012 4 2 1 1 - -
2012 SUB-TOTAL 11 7 3 1 - -
2013 YTD 5 3 1 - - 1
CONVENTIONAL
1st Half 2012 7 4 1 - 2 -
2nd Half 2012 2 2 - 1 - -
2012 SUB-TOTAL 9 6 1 - 2 -
2013 YTD 1 - - 1 - -
TOTAL 2012 & 2013 TYD 26 15 6 2 2 1
Guney Kayi-1
Baglik-1
Dogu Karya-1, Sig-1
BTD-3, 4H, 5,
TSK-1, 2
Guney Karababa-1
Dogu Gazi-2
Kayi Derin-1
10 km
Guney Atakoy-2
Koseilyas-1
Deveseki-1 Atakoy-8 Karanfiltepe-5, 6
DTD-19, 19H
TDR-9, 14
Kuzey Atakoy-1
Tekirdag
Development
Area
Hayrabolu
Deep
Exploration
Area
Hayrabolu-10 Kazanci-5
47
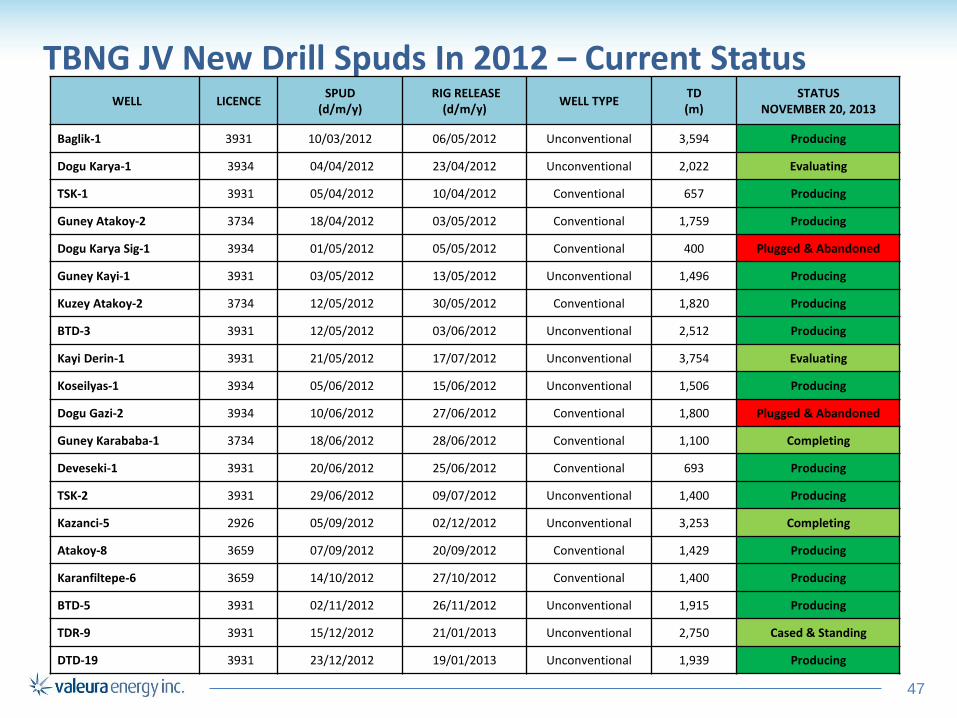
TBNG JV New Drill Spuds In 2012 – Current Status
WELL LICENCE SPUD
(d/m/y) RIG RELEASE
(d/m/y) WELL TYPE
TD (m)
STATUS NOVEMBER 20, 2013
Baglik-1 3931 10/03/2012 06/05/2012 Unconventional 3,594 Producing
Dogu Karya-1 3934 04/04/2012 23/04/2012 Unconventional 2,022 Evaluating
TSK-1 3931 05/04/2012 10/04/2012 Conventional 657 Producing
Guney Atakoy-2 3734 18/04/2012 03/05/2012 Conventional 1,759 Producing
Dogu Karya Sig-1 3934 01/05/2012 05/05/2012 Conventional 400 Plugged & Abandoned
Guney Kayi-1 3931 03/05/2012 13/05/2012 Unconventional 1,496 Producing
Kuzey Atakoy-2 3734 12/05/2012 30/05/2012 Conventional 1,820 Producing
BTD-3 3931 12/05/2012 03/06/2012 Unconventional 2,512 Producing
Kayi Derin-1 3931 21/05/2012 17/07/2012 Unconventional 3,754 Evaluating
Koseilyas-1 3934 05/06/2012 15/06/2012 Unconventional 1,506 Producing
Dogu Gazi-2 3934 10/06/2012 27/06/2012 Conventional 1,800 Plugged & Abandoned
Guney Karababa-1 3734 18/06/2012 28/06/2012 Conventional 1,100 Completing
Deveseki-1 3931 20/06/2012 25/06/2012 Conventional 693 Producing
TSK-2 3931 29/06/2012 09/07/2012 Unconventional 1,400 Producing
Kazanci-5 2926 05/09/2012 02/12/2012 Unconventional 3,253 Completing
Atakoy-8 3659 07/09/2012 20/09/2012 Conventional 1,429 Producing
Karanfiltepe-6 3659 14/10/2012 27/10/2012 Conventional 1,400 Producing
BTD-5 3931 02/11/2012 26/11/2012 Unconventional 1,915 Producing
TDR-9 3931 15/12/2012 21/01/2013 Unconventional 2,750 Cased & Standing
DTD-19 3931 23/12/2012 19/01/2013 Unconventional 1,939 Producing
48
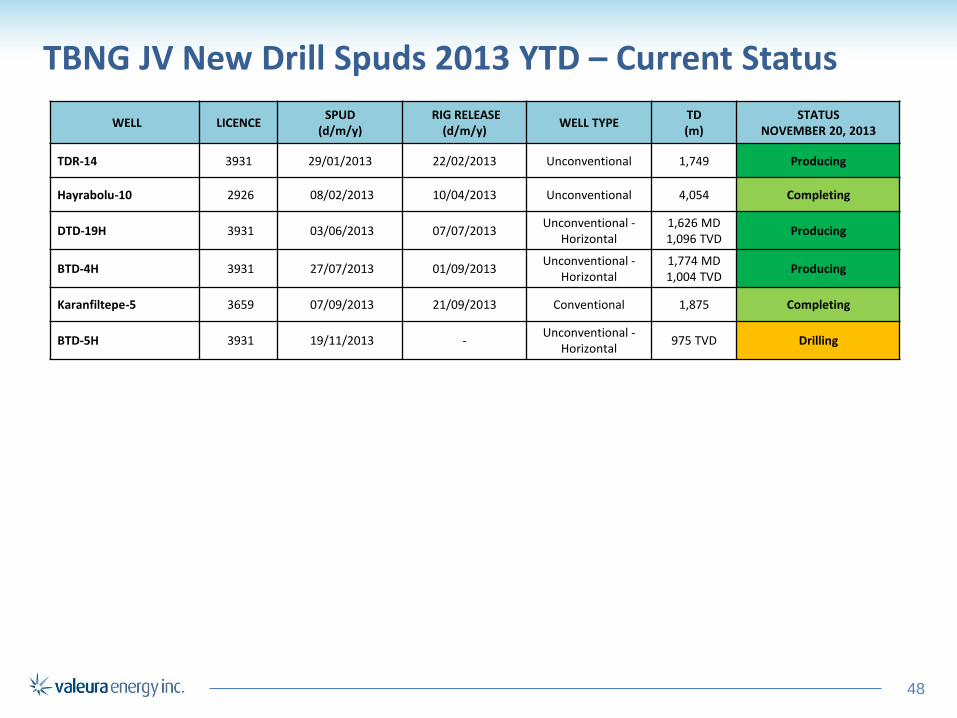
TBNG JV New Drill Spuds 2013 YTD – Current Status
WELL LICENCE SPUD
(d/m/y) RIG RELEASE
(d/m/y) WELL TYPE
TD (m)
STATUS NOVEMBER 20, 2013
TDR-14 3931 29/01/2013 22/02/2013 Unconventional 1,749 Producing
Hayrabolu-10 2926 08/02/2013 10/04/2013 Unconventional 4,054 Completing
DTD-19H 3931 03/06/2013 07/07/2013 Unconventional -
Horizontal 1,626 MD 1,096 TVD
Producing
BTD-4H 3931 27/07/2013 01/09/2013 Unconventional -
Horizontal 1,774 MD 1,004 TVD
Producing
Karanfiltepe-5 3659 07/09/2013 21/09/2013 Conventional 1,875 Completing
BTD-5H 3931 19/11/2013 - Unconventional -
Horizontal 975 TVD Drilling
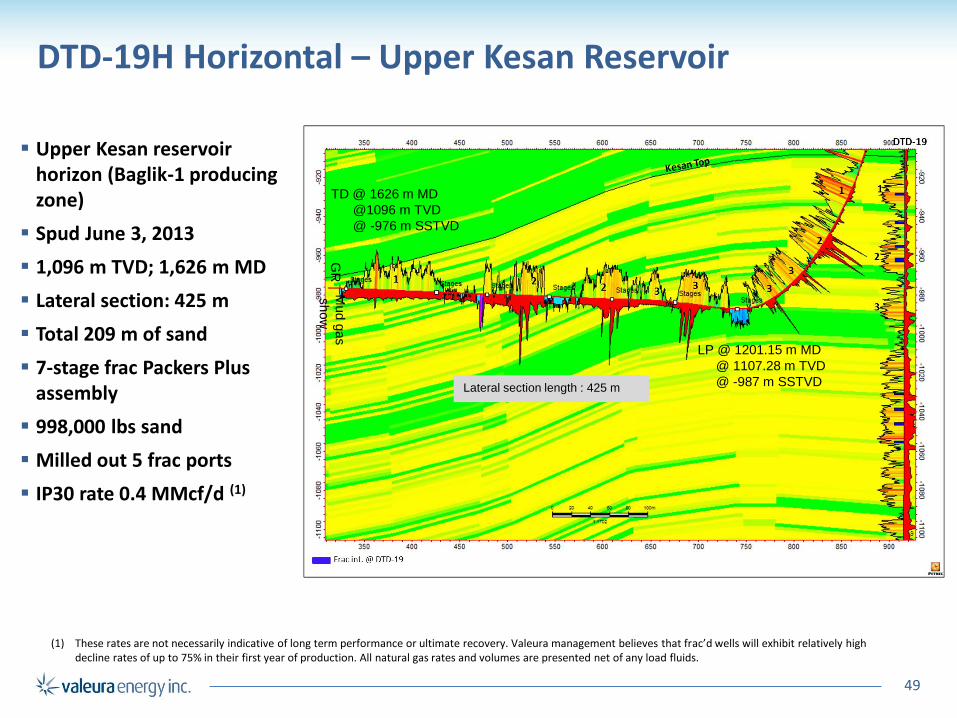
DTD-19H Horizontal – Upper Kesan Reservoir
Upper Kesan reservoir horizon (Baglik-1 producing zone)
Spud June 3, 2013
1,096 m TVD; 1,626 m MD
Lateral section: 425 m
Total 209 m of sand
7-stage frac Packers Plus assembly
998,000 lbs sand
Milled out 5 frac ports
IP30 rate 0.4 MMcf/d (1)
49
LP @ 1201.15 m MD
@ 1107.28 m TVD
@ -987 m SSTVD
Mud g
as
show
G
R
TD @ 1626 m MD
@1096 m TVD
@ -976 m SSTVD
Lateral section length : 425 m
(1) These rates are not necessarily indicative of long term performance or ultimate recovery. Valeura management believes that frac’d wells will exhibit relatively high decline rates of up to 75% in their first year of production. All natural gas rates and volumes are presented net of any load fluids.
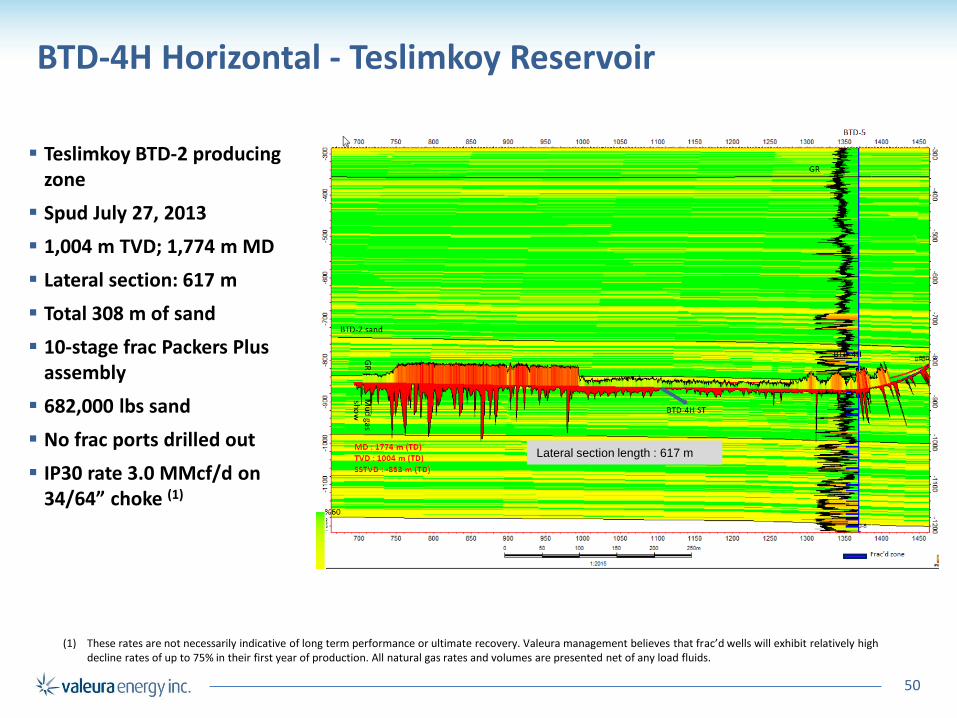
BTD-4H Horizontal - Teslimkoy Reservoir
50
Teslimkoy BTD-2 producing zone
Spud July 27, 2013
1,004 m TVD; 1,774 m MD
Lateral section: 617 m
Total 308 m of sand
10-stage frac Packers Plus assembly
682,000 lbs sand
No frac ports drilled out
IP30 rate 3.0 MMcf/d on 34/64” choke (1)
Lateral section length : 617 m
(1) These rates are not necessarily indicative of long term performance or ultimate recovery. Valeura management believes that frac’d wells will exhibit relatively high decline rates of up to 75% in their first year of production. All natural gas rates and volumes are presented net of any load fluids.

51
Mezardere Slope Fan Model
Single Stage Re-entry Frac
Frac: 97,000 lbs, 431 bbls XL gel/ 46-53% N2
Peak 24 hour on stream rate: 2.1 MMcf/d
DTD-6
DTD-6
DTD-7
DTD-11
Kayi-14
Kayi-6
Kayi-12
5 km
Meandering Slope Channel
Basin Floor Fans
3931
3934
Gazi
Karaevli
Mezardere consists of a north-easterly pro-grading slope fan complex, deposited within delta front and pro-delta setting
Potential reservoirs include:
− Porous channel and basin floor sands
− Interlaminated sands and shales from channel abandonment, overbank, distal apron facies
− Organic shale source intervals
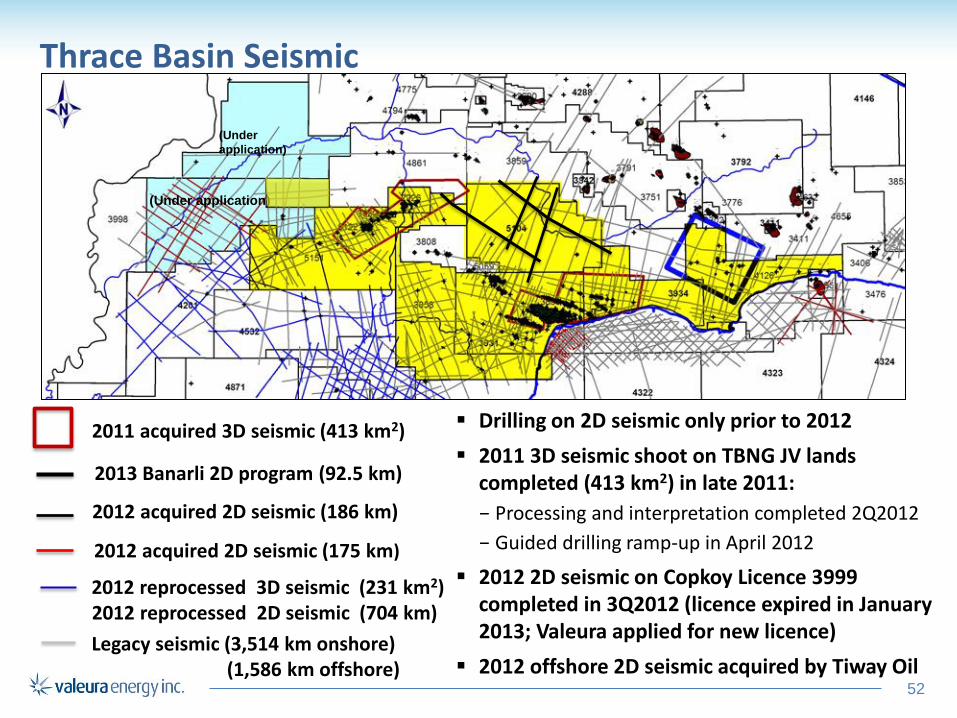
Thrace Basin Seismic
2011 acquired 3D seismic (413 km2) Drilling on 2D seismic only prior to 2012
2011 3D seismic shoot on TBNG JV lands completed (413 km2) in late 2011:
− Processing and interpretation completed 2Q2012
− Guided drilling ramp-up in April 2012
2012 2D seismic on Copkoy Licence 3999 completed in 3Q2012 (licence expired in January 2013; Valeura applied for new licence)
2012 offshore 2D seismic acquired by Tiway Oil
2012 reprocessed 3D seismic (231 km2) 2012 reprocessed 2D seismic (704 km)
2012 acquired 2D seismic (175 km)
2012 acquired 2D seismic (186 km)
2013 Banarli 2D program (92.5 km)
52
Legacy seismic (3,514 km onshore) (1,586 km offshore)
(Under application)
(Under
application)
53
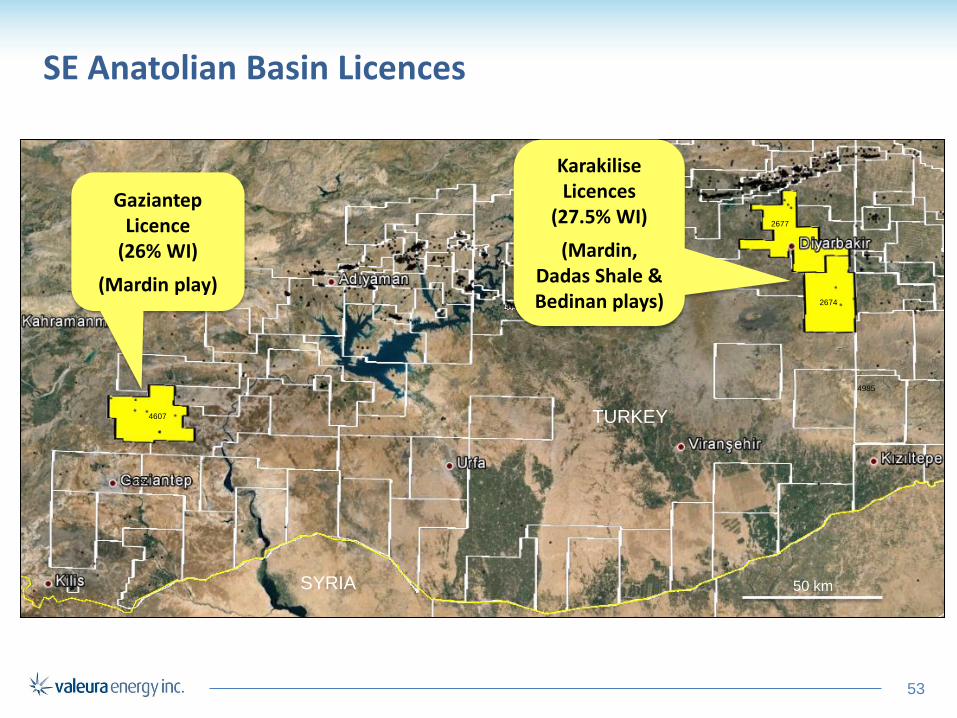
SE Anatolian Basin Licences
2674
2677
5052
4607
4658
4985
TURKEY
SYRIA 50 km
Gaziantep Licence
(26% WI)
(Mardin play)
Karakilise Licences
(27.5% WI)
(Mardin, Dadas Shale & Bedinan plays)

54
Gaziantep Licence 4607 – Alibey-1 Horizontal
123,372 gross acres (26% WI)
Operated by TransAtlantic
Alibey-1 Hz drilled in July 2012 as 414 m horizontal side-track in original Alibey-1 vertical well, which flowed heavy oil from the Mardin Group
Sidetrack intersected 80 m of horizontal fractured pay
Logged and cased to TD (2,354 m) (TVD 1,868 m)
Completed 56 m gross interval at toe of well indicating initial productivity of 150 bopd (2)
Perforated additional pay but tested small amounts of oil (10-15 bopd) at a high water-cut; under evaluation
Alibey-1 HZ (completing)
10 km
4607
Mardin Time Structure - 2D Seismic (1)
(1) Seismic map from TransAtlantic August 2012 corporate presentation. (2) January 2, 2013 TransAtlantic press release (Alibey-1 productivity based on swabbing operations). These rates are
not necessarily indicative of long term performance or ultimate recovery.
55
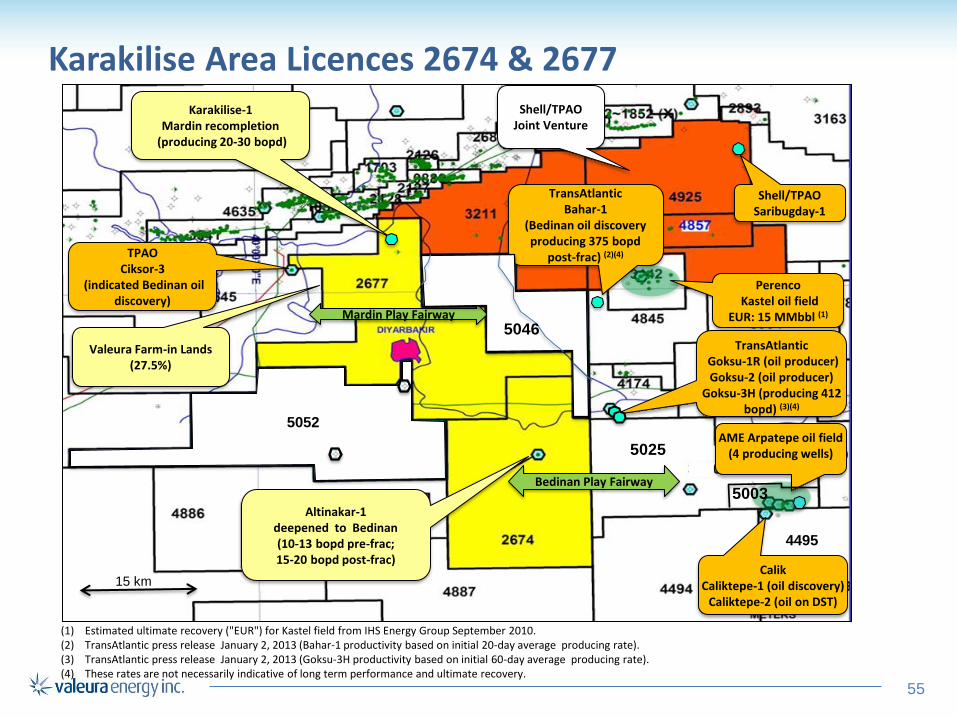
Karakilise Area Licences 2674 & 2677
(1) Estimated ultimate recovery ("EUR") for Kastel field from IHS Energy Group September 2010. (2) TransAtlantic press release January 2, 2013 (Bahar-1 productivity based on initial 20-day average producing rate). (3) TransAtlantic press release January 2, 2013 (Goksu-3H productivity based on initial 60-day average producing rate). (4) These rates are not necessarily indicative of long term performance and ultimate recovery.
5025
Altinakar-1 deepening
(spudded Jan 6 ’12)
Perenco Kastel oil field
EUR: 15 MMbbl (1)
TransAtlantic
Goksu-1R (oil producer) Goksu-2 (oil producer)
Goksu-3H (producing 412 bopd) (3)(4)
Calik Caliktepe-1 (oil discovery)
Caliktepe-2 (oil on DST)
Altinakar-1
deepened to Bedinan (10-13 bopd pre-frac; 15-20 bopd post-frac)
4495
Karakilise-1
Mardin recompletion (producing 20-30 bopd)
TPAO Ciksor-3
(indicated Bedinan oil discovery)
Valeura Farm-in Lands
(27.5%)
Shell/TPAO Joint Venture
15 km
TransAtlantic Bahar-1
(Bedinan oil discovery producing 375 bopd
post-frac) (2)(4)
Mardin Play Fairway
5052
AME Arpatepe oil field (4 producing wells)
Bedinan Play Fairway
5025
Shell/TPAO Saribugday-1
5046
5003
56
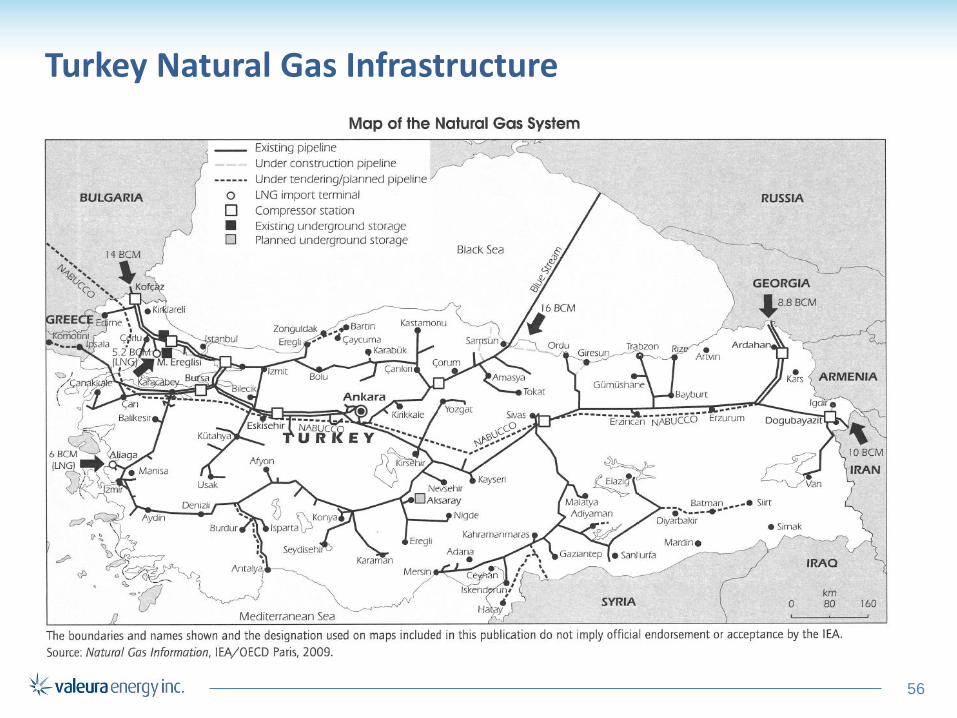
Turkey Natural Gas Infrastructure
57
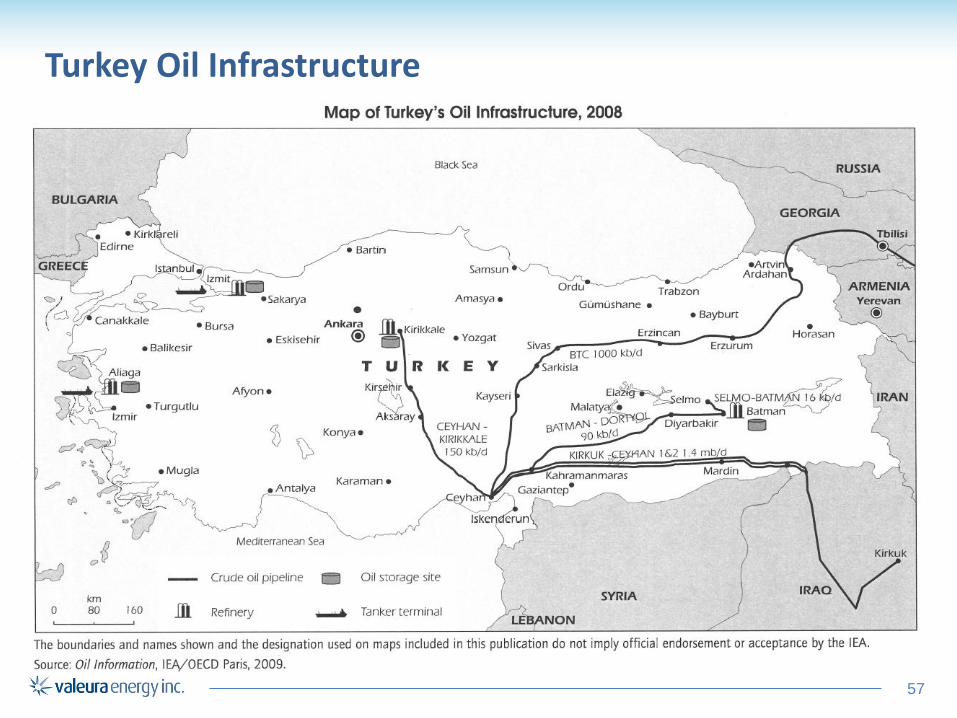
Turkey Oil Infrastructure
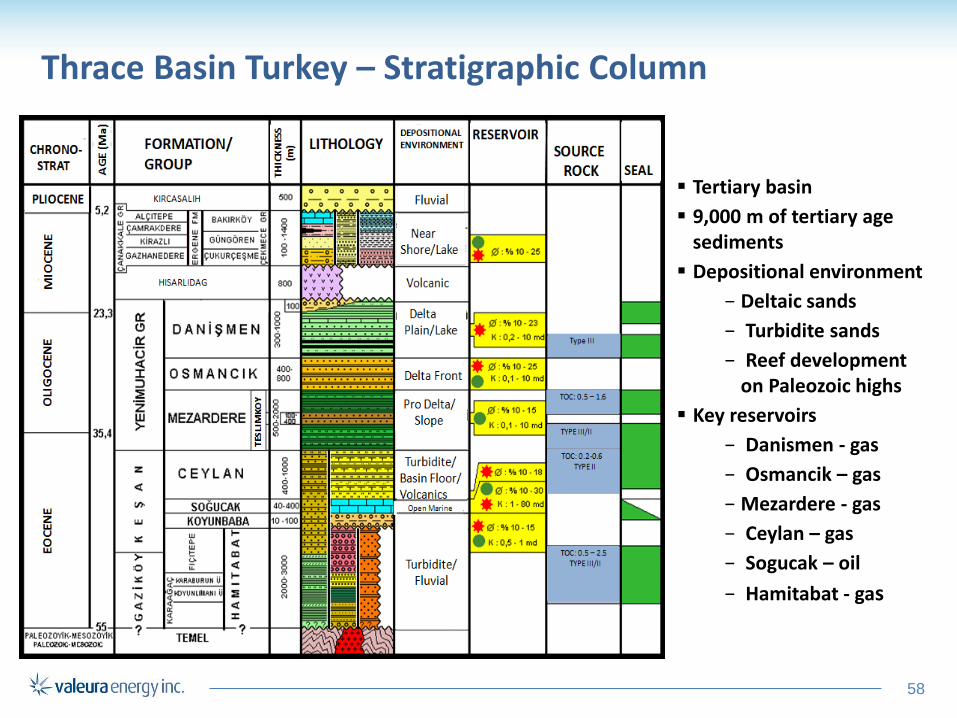
Thrace Basin Turkey – Stratigraphic Column
Tertiary basin
9,000 m of tertiary age sediments
Depositional environment
− Deltaic sands
− Turbidite sands
− Reef development on Paleozoic highs
Key reservoirs
− Danismen - gas
− Osmancik – gas
− Mezardere - gas
− Ceylan – gas
− Sogucak – oil
− Hamitabat - gas
58
59
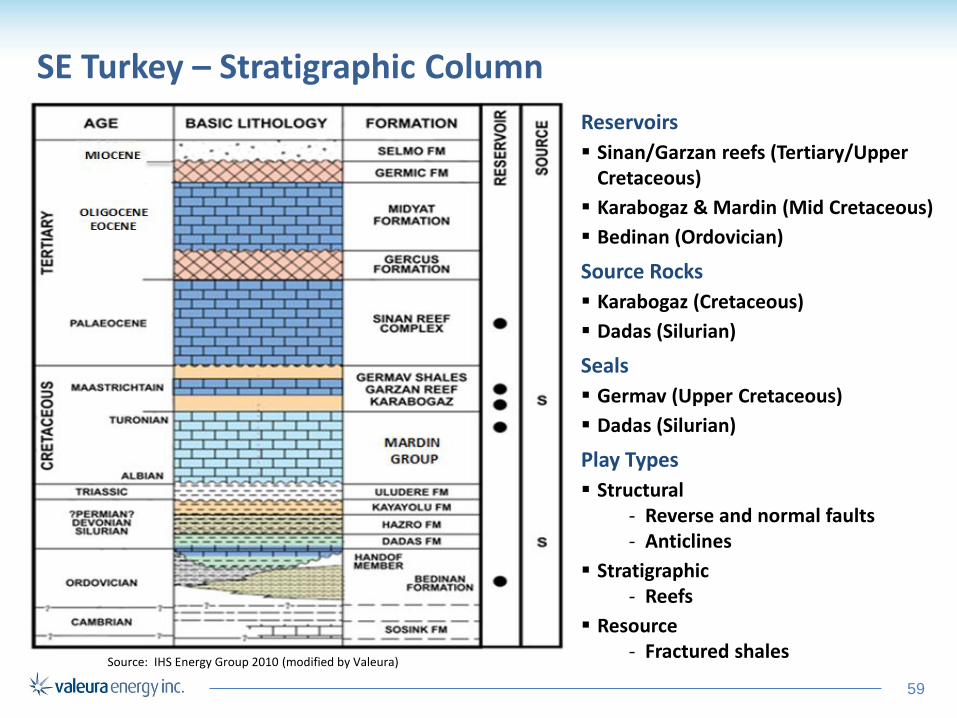
SE Turkey – Stratigraphic Column
Reservoirs
Sinan/Garzan reefs (Tertiary/Upper Cretaceous)
Karabogaz & Mardin (Mid Cretaceous)
Bedinan (Ordovician)
Source Rocks
Karabogaz (Cretaceous)
Dadas (Silurian)
Seals
Germav (Upper Cretaceous)
Dadas (Silurian)
Play Types
Structural - Reverse and normal faults - Anticlines
Stratigraphic - Reefs
Resource - Fractured shales
Source: IHS Energy Group 2010 (modified by Valeura)
60
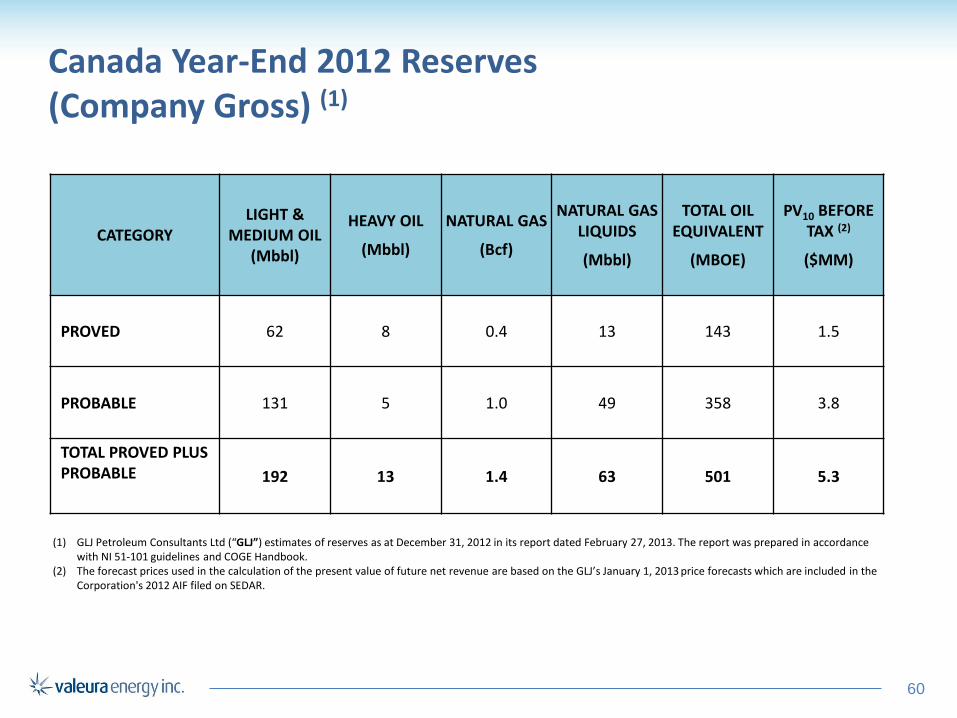
Canada Year-End 2012 Reserves (Company Gross) (1)
CATEGORY LIGHT &
MEDIUM OIL (Mbbl)
HEAVY OIL
(Mbbl)
NATURAL GAS
(Bcf)
NATURAL GAS LIQUIDS
(Mbbl)
TOTAL OIL EQUIVALENT
(MBOE)
PV10 BEFORE TAX (2)
($MM)
PROVED 62 8 0.4 13 143 1.5
PROBABLE 131 5 1.0 49 358 3.8
TOTAL PROVED PLUS PROBABLE 192 13 1.4 63 501 5.3
(1) GLJ Petroleum Consultants Ltd (“GLJ”) estimates of reserves as at December 31, 2012 in its report dated February 27, 2013. The report was prepared in accordance with NI 51-101 guidelines and COGE Handbook.
(2) The forecast prices used in the calculation of the present value of future net revenue are based on the GLJ’s January 1, 2013 price forecasts which are included in the Corporation's 2012 AIF filed on SEDAR.