unpredictability in economic analysis, econometric modeling and
TRANSCRIPT
Unpredictability in Economic Analysis, Econometric Modelingand Forecasting
David F. HendryDepartment of Economics, and Institute for Economic Modelling,
Oxford Martin School, University of Oxford, UK.
Grayham E. MizonFaculty of Social and Human Sciences, University of Southampton
and Institute for Economic Modelling, Oxford Martin School, University of Oxford, UK.∗
Abstract
Unpredictability arises from intrinsic stochastic variation, unexpected instances of outliers, andunanticipated extrinsic shifts of distributions. We analyze their properties, relationships, and differ-ent effects on the three arenas in the title, which suggests considering three associated informationsets. The implications of unanticipated shifts for forecasting, economic analyses of efficient mar-kets, conditional expectations, and inter-temporal derivations are described. The potential successof general-to-specific model selection in tackling location shifts by impulse-indicator saturation iscontrasted with the major difficulties confronting forecasting.
JEL classifications:C51, C22.
Keywords: Unpredictability; ‘Black Swans’; Distributional shifts; Forecast failure; Model selection;Conditional expectations.
1 Introduction
Unpredictability has been formalized as intrinsic stochastic variation in a known distribution, where
conditioning on available information does not alter the outcome from the unconditional distribution, as
in the well-known prediction decomposition, or sequentialfactorization, of a density (see Doob, 1953).
Such variation can be attributed (inter alia) to chance distribution sampling, ‘random errors’, incomplete
information, or in economics, many small changes in the choices by individual agents. A variable that is
intrinsically unpredictable cannot be modeled or forecastbetter than its unconditional distribution.
However, the converse does not hold: a variable that is not intrinsically unpredictable may still be
essentially unpredictable because of two additional aspects of unpredictability. The first concerns in-
dependent draws from fat-tailed or heavy-tailed distributions, which leads to a notion we call ‘instance
∗This research was supported in part by grants from the Open Society Foundations and the Oxford Martin School. Weare indebted to Gunnar Bardsen, Jennifer L. Castle, Neil R.Ericsson, Søren Johansen, Bent Nielsen, Ragnar Nymoen, FelixPretis, Norman Swanson and two anonymous referees for helpful comments on earlier versions. Forthcoming,Journal ofEconometrics. Contact details: [email protected] and [email protected].
1
unpredictability’. Here the distribution of a variable that is not intrinsically unpredictable is known, as
are all conditional and unconditional probabilities, but there is a non-negligible probability of a very
discrepant outcome. While that probability is known, it is not known on which draw the discrepant out-
come will occur, nor its magnitude, leading to a ‘Black Swan’(as in Taleb, 2007), with potentially large
costs when that occurs (see Barro, 2009). The third aspect wecall ‘extrinsic unpredictability’, which
derives from unanticipated shifts of the distribution itself at unanticipated times, of which location shifts
(changes in the means of distributions) are usually the mostpernicious. Intrinsic and instance unpre-
dictability are close to ‘known unknowns’ in that the probabilities of various outcomes can be correctly
pre-calculated, as in rolling dice, whereas extrinsic unpredictability is more like ‘unknown unknowns’ in
that the conditional and unconditional probabilities of outcomes cannot be accurately calculated in ad-
vance (as in the first quote of Clements and Hendry, 1998). Therecent financial crisis and ensuing deep
recession have brought both instance and extrinsic unpredictability into more salient focus (see Taleb,
2009, and Soros, 2008, 2010, respectively).
These three aspects of unpredictability suggest that different information sets might explain at least a
part of their otherwise unaccounted variation. This is wellestablished both theoretically and empirically
for intrinsic unpredictability, where ‘regular’ explanatory variables are sought. Empirically, population
distributions are never known, so even to calculate the probabilities for instance unpredictability, it will
always be necessary to estimate the distributional form from available evidence, albeit few ‘tail draws’
will occur from which to do so. New aspects of distributions have to be estimated when extrinsic unpre-
dictability occurs. Consequently, each type of unpredictability has substantively different implications
for economic analyses, econometric modeling, and economicforecasting. Specifically, inter-temporal
economic theory, forecasting, and policy analyses could goawry facing extrinsic unpredictability, yetex
post, the outcomes that eventuated are susceptible to being modeled. We briefly discuss the possible role
of impulse-indicator saturation for detecting and removing in-sample location shifts. The availability of
such tools highlights the contrast between the possibilities of modeling extrinsic unpredictabilityex post
against the difficulties confronting successfulex anteforecasting, where one must forecast outliers or
shifts, which are demanding tasks. However, transformations of structural models that make them robust
after shifts, mitigating systematic forecast failure, arefeasible.
The structure of the paper is as follows. Section 2 considersintrinsic unpredictability in§2.1; instance
unpredictability in§2.2; and extrinsic unpredictability in§2.3. Theoretical implications are drawn in
section 3, with the relationships between intrinsic, instance and extrinsic unpredictability in§3.1, and
the impact of reduced information in§3.2. The possibility of three distinct information sets associated
2
respectively with ‘normal causality’, the timing of outliers, and the occurrence of distributional shifts is
discussed in§3.3. The difficulties both economists and economic agents confront facing unanticipated
breaks are analyzed in§3.4. Section 4 investigates some consequences for empirical applications. The
fundamental separation between modeling and forecasting from instance and extrinsic unpredictability—
but not intrinsic unpredictability—is discussed in§4.1. Then§4.2 considers the relationships between the
three aspects of unpredictability for model selection in processes with unanticipated breaks, leading to a
reconsideration of the role of congruent modeling for forecasting in§4.3. These analyses are illustrated
in §4.4 by an empirical application of robust forecasting. Section 5 concludes.
2 Unpredictability
We now consider the three distinct sources of unpredictability. Were it the case that the data generation
process (DGP) changed unexpectedly at almost every data point, then reliable inferences would be ren-
dered essentially impossible. Fortunately, the various sources of unpredictability are less extreme than
this, so inference remains possible subject to thecaveatsdiscussed in the following.
2.1 Intrinsic unpredictability
Definition 1 A non-degeneraten-dimensional vector random variableǫt is an intrinsically unpre-
dictable process with respect to an information setIt−1, which always includes the sigma-field generated
by the past ofǫt, denotedσ [Et−1], over a time periodT if the conditional distributionDǫt (ǫt|It−1)
equals the unconditional distributionDǫt (ǫt):
Dǫt (ǫt | It−1) = Dǫt (ǫt) ∀t ∈ T . (1)
Intrinsic unpredictability is so-called as it is an intrinsic property ofǫt in relation toIt−1, not de-
pendent on knowledge aboutDǫt (·), so is tantamount to independence betweenǫt andIt−1. When
It−1 = σ [Xt−1] (say) is the ‘universal’ information set, (1) clarifies whyǫt is intrinsically unpredictable.
Intrinsic unpredictability applies equally to explainingthe past (i.e., modelingǫt, t = 1, . . . , T) and
forecasting the future fromT (i.e., ofǫt, t = T + 1, . . . , T + h): the best that can be achieved in both
settings is the unconditional distribution, andIt−1 is of no help in reducing either uncertainty.
Expectations formed at timet using a distributionft are denotedEft [·], and the variance is denoted
Vft [·] for each point inT .
3
Theorem 1 When the relevant moments exist, intrinsic unpredictability in distribution entails unpre-
dictability in mean and variance:
Eft [ǫt | It−1] = Eft [ǫt] and Vft [ǫt | It−1] = Vft [ǫt] . (2)
However, neither the former nor the latter alone need imply the other. As a well known example,ǫt ∼
INn [µ,Ωǫ], denoting an independently distributed Gaussian variablewith expected valueEft [ǫt] = µ
and varianceVft [ǫt] = Ωǫ, is an intrinsically unpredictable process.
Intrinsic unpredictability is only invariant under non-singular contemporaneous transformations, as
inter-temporal transforms must affect (1), implying that no unique measure of forecast accuracy exists
(see e.g., Leitch and Tanner, 1991, Clements and Hendry, 2005, and Granger and Pesaran, 2000a, 2000b).
Thus, predictability requires combinations withIt−1, as in, for example:
yt = ψt (Xt−1) + ǫt where ǫt ∼ IDn [0,Ωǫ] (3)
soyt depends on both the information set and the innovation component. Then:
Dyt (yt | It−1) 6= Dyt (yt) ∀t ∈ T . (4)
In (3), yt is predictable in mean even ifǫt is unpredictable as:
EDyt[yt | It−1] = ψt (Xt−1) 6= EDyt
[yt] ,
in general. Since:
VDyt[yt | It−1] < VDyt
[yt] when Vt [ψt (Xt−1)] 6= 0 (5)
predictability ensures a variance reduction, consistent with its nomenclature, since unpredictability en-
tails equality in (5), and the ‘smaller’ the conditional variance matrix, the less uncertain is the prediction
of yt from It−1.
2.2 Instance unpredictability
Definition 2 The vector random variableǫt is an instanceunpredictable process over a time periodT
if there is a non-negligible probability of ‘extreme draws’of unknown magnitudes and timings.
4
As Taleb (2007, 2009) has stressed, rare large-magnitude events, or ‘Black Swans’, do unexpectedly
occur. One formulation of that insight is to interpret ‘Black Swans’ as highly discrepant draws from fat-
tailed distributions, where there is a constant, but small,probability of such an occurrence each period.
Both the timing and the magnitude of the discrepant events are then unpredictable, even when the form
of the distribution is known and constant over time. When a large outcome materializes unexpectedly at
time τ , say, substantial costs or benefits can result, sometimes both, but for different groups of agents.
Barro (2009) estimates very high costs from ‘consumption disasters’, finding 84 events over approxi-
mately the last 150 years with falls of more than 10% per capita, cumulating to a total duration of almost
300 ‘bad’ years across his sample of 21 countries, mainly dueto wars. However, there is a marked
reduction in their frequency after World War II.
Recent research on many financial variables has revealed a proliferation of ‘jumps’, as measured
by bipower variation (see e.g., Barndorff-Nielsen and Shephard, 2004, 2006). These seem to beex
ante instance unpredictable events, superimposed on the underlying Ornstein–Uhlenbeck processes. To
mitigate possibly large costs from financial outliers, Taleb (2009) argues for more robust systems that
avoid dependence on the non-occurrence of very large draws:for example, systems with more nodes and
less interdependence.
Empirically, the distributions of extreme future events cannot be known: tail properties are especially
difficult to estimate from available data, and distributions may also shift over time. If ‘Black Swans’ are
indeed genuinely independent large draws from fat-tailed distributions, no information could reveal their
timings or magnitudes, so success in forecasting such drawsis most unlikely without a crystal ball.
However, such draws may not be independent of all possible information, so may be partially open to
anticipation in some instances. A ‘Black Swan’ is often viewed as a large deviation in a differenced
variable, as in asset market returns or price changes. If notrapidly reversed, such a jump, or collapse,
entails a location shift in the corresponding level. Thus, instance unpredictability in the differences of
variables entails extrinsic unpredictability in the levels (andvice versa), the topic to which we now turn.
2.3 Extrinsic unpredictability
Definition 3 The vector random variableǫt is anextrinsically unpredictable process over a time period
T if there are intrinsically unpredictable shifts in its distribution:
Dǫt+1(·) 6= Dǫt (·) for some t ∈ T . (6)
5
The key feature of extrinsic unpredictability is that the distributional shift is unanticipated, even for
variables that would be partly predictable in the absence ofa shift, as in:
Dyt+1(yt | ·) 6= Dyt (yt | ·) ∀t ∈ T (7)
An important difference between instance unpredictability and extrinsic unpredictability arises under
independent sampling. In the former, a ‘Black Swan’ relative to the usual outcomes is unlikely to also
occur on the next draw, and even less likely in several successive outcomes. For example, there are
potentially extreme draws from a Student’st3, but those should occur rarely, and would be equally
likely in either tail, although that would not be true for, say, a log-normal or some other extreme-value
distributions. In general, from Chebyshev’s inequality, whenE[y] = µ <∞ andE[(y−µ)2] = σ2 <∞
with σ > 0, for any real numbers > 0:
Pr(|y − µ| ≥ sσ) ≤1
s2(8)
Thus, two successive ‘10σ’ draws have a probability of less than one in 10,000: flocks of‘Black Swans’
are improbable.1
However, when the mean of a distribution changes, as in some of the examples cited below, as well
as in Barro (2009), successive outcomes are likely to be around the new mean, so a cluster appears.
Although the first outcome after a mean shift would initiallyappear to be a ‘Black Swan’, even with
independent draws it would be followed by many more outcomesthat were discrepant relative to the
original distribution, but not relative to its mean-shifted replacement.
Empirically, there have been many major shifts since 1400, or indeed any epoch longer than 50
years, in demography (average age of death changing from around 40 to around 80, with the average
number of births per female falling dramatically), real outcomes such as incomes per capita (increasing
6-8 fold), and all nominal variables (some 1000 fold since 1850). Current outcomes in the Western world
are not highly discrepant draws from the distributions relevant in the Middle Ages, but ‘normal’ draws
from distributions with very different means. Such shifts can be precipitated by changes in legislation,
advances in science, technology and medicine, financial innovation, climatic and geological shifts, or
political and economic regimes, among other sources. Whilethese examples are of major shifts over long
periods, the recent financial crisis, and the many similar examples in the last quarter of the 20th Century,
1This only applies to draws from a given distribution. As Gillian Tett, Financial Times Magazine, March 26/27, p54,remarks ‘Indeed, black swans have suddenly arrived in such aflock...’, as can happen when considering many distributions ofeconomic, political, natural and environmental phenomena.
6
demonstrate that sudden large shifts occur (see the cases documented by Barrell, Dury, Holland, Pain and
te Velde, 1998, and Barrell, 2001,inter alia). In asset markets, endogenous changes in agents’ behavior
can alter the underlying ‘reality’, as argued by Soros (2008, 2010) in his concept of reflexivity, inducing
feedbacks that can lead to dramatic changes as agents’ viewsmove together, changing the system, which
thereby ends in a different state.
Moreover, the distributions of the differences of many economic variables have also changed radi-
cally, and are also not stationary. For example, real growthper capita was a fraction of one percent per
annum till the Industrial Revolution (see Apostolides, Broadberry, Campbell, Overton and van Leeuwen,
2008, for the evidence, and Allen, 2009, for an insightful analysis of the Industrial Revolution), remained
low for the next couple of hundred years, but is now around 2% pa in OECD countries, and much higher
in emerging economies borrowing modern Western technology.
Shifts of distributions remain common, and would be unproblematicper seif they could be mod-
eled and predicted. Co-breaking, where location shifts cancel, would enable some aspects to be forecast
even when breaks themselves could not (see Hendry and Massmann, 2007), analogously to cointegra-
tion reducing stochastic trends in someI(1) variables to stationarity. Differencing plays a similar role,
removing unit roots and converting location shifts to impulses. Many of the examples of demographic
shifts noted earlier have such a property: annual changes inaverage age of death in OECD countries have
been remarkably constant at about a weekend a week since around 1860, other than a major temporary
shift during the First World War and the ensuing flu’ epidemic. However, the distributions of changes
in many economic variables also shift unexpectedly, especially distributions of nominal variables, but
the change in the change may be more constant as few variablespermanently accelerate (e.g., as with
‘inflation surprises’, where∆2pt, say, is sometimes treated as intrinsically unpredictable).
3 Theoretical implications
We now consider the theoretical implications of, and links between, the three sources of unpredictability,
and in section 4, discuss their practical consequences.
7
3.1 Intrinsic, instance and extrinsic unpredictability
When (3) holds,yT+1 is not intrinsically unpredictable, but there are four reasons whyyT+1 may not be
usefully predicted from timeT using an estimated version of:
yT+1|T = ψT+1 (XT ) (9)
The first is that in practice, (9) is never available, so instead forecasters must use:
yT+1|T = ψT+1 (XT ) (10)
whereψT+1 (·) is a forecast of whatψT+1 (·) will be. The second is thatXT may not be known atT ,
or may be incorrectly measured by a flash or nowcast estimate.
The third reason is instance unpredictability, which arises when the draw ofǫT+1 in (3) induces
outcomesyT+1 that are far from the forecastyT+1|T in the metric ofΩǫ, so that:
ǫT+1|T = yT+1 − yT+1|T
is unexpectedly large (as in Taleb, 2009). That problem can occur even whenψT+1 (·) is known.
The fourth reason is that the distribution shifts in unanticipated ways at unexpected time points:
DyT+1(·) 6= DyT (·) (11)
Thus, even ifyT+1 was predictable according to (4) whenXT was known at timeT , the lack of knowl-
edge ofψT+1 (·) in (9), or more realistically, of an accurate valueψT+1 (·), makesyT+1 extrinsically
unpredictable. That problem will be exacerbated by any in-sample non-constancy of the distribution
making empirical modeling difficult. To successfully forecast from (10) not only entails accurate data on
XT , but also requires both a ‘normal’ drawǫT+1 (or forecasting the outliers) and thatψT+1 (·) be close
to ψT+1 (·) even though shifts occur, together essentially needing a crystal ball. A process is doubly
unpredictable when it is both intrinsically and extrinsically unpredictable, so the pre-existing uncondi-
tional distribution does not match that holding in the next period. For example,ǫt ∼ INn [µt,Ωǫ] will
be less predictable than expected from probabilities calculated usingΩǫ when future changes inµt can-
not be determined in advance. Location shifts induce systematic forecast failure, so will be specifically
considered below.
8
Nevertheless, there may exist additional information sets, denotedLT andKT , which could respec-
tively help predict the outliers or the shifts in (11), as discussed in section 3.3. Importantly, once a shift
has happened, it may be explicable (at worst by indicator variables), so there is a potentially major dif-
ference between modeling and forecasting when (11) holds, an aspect addressed in section 4.2. First, we
use the preceding analyses to resolve an apparent paradox from Clements and Hendry (2005), namely
that the costs of using less information are small, whereas there can be large costs from not having
information about shifts.
3.2 Prediction from a reduced information set
Theorem 4 Predictions remain unbiased, although less accurate, whenusing a subset of information,
Jt−1 ⊂ It−1 whereJt−1 = σ [Zt−1].
Proof. When the DGP is (3), sinceEDyt−1[ǫt|It−1] = 0, so ǫt is unpredictable given all the
information, it must be unpredictable from a subset so that:
EDyt−1[ǫt | Jt−1] = 0. (12)
From (3):
EDyt−1[yt | Jt−1] = EDyt−1
[ψt (It−1) | Jt−1] = φt−1 (Zt−1) (13)
say. Lettinget = yt − φt−1 (Zt−1) be the unexplained component from (13), then:
EDyt−1[et | Jt−1] = EDyt−1
[yt | Jt−1]−φt−1 (Zt−1) = 0 (14)
soet remains a mean innovation with respect toJt−1 whenDyt−1is used.
However, since:
et = ǫt +ψt (Xt−1)− φt−1 (Zt−1) (15)
taking expectations with respect to the complete information setIt−1:
EDyt−1[et | It−1] = ψt (Xt−1)−EDyt−1
[φt−1 (Jt−1) | It−1
]= ψt (Xt−1)−φt−1 (Zt−1) 6= 0 (16)
Thus,et is not an innovation relative toIt−1 so from (15) and (16):
VDyt−1[et] = VDyt−1
[ǫt] + VDyt−1
[ψt (Xt−1)− φt−1 (Zt−1)
]≥ VDyt−1
[ǫt] (17)
9
so larger variance predictions will usually result, again consistent with the concept of predictability.
Thus, in the context of intrinsic unpredictability, more relevant information improves the accuracy
of prediction, but less information by itself does not lead to biased outcomes relative toDyt−1. Such a
result conflicts with the intuition that a loss of information about what causes shifts can lead to badly
biased forecasts. The resolution of this apparent paradox lies in the assumption in equations like (12),
thatDyt−1is the relevant distribution for the calculations, which itis not when location shifts occur. As
yt = ψt (Xt−1) + ǫt was generated byDyt(·), that must embody any distributional shift, and hence:
EDyt[ψt (It−1) | Jt−1] = φt (Zt−1) (18)
so that:
EDyt[et | Jt−1] = EDyt
[ψt (Xt−1) | Jt−1]− φt−1 (Zt−1) = φt (Zt−1)− φt−1 (Zt−1) 6= 0. (19)
Consequently, when a distribution shift occurs,et is not a mean innovation with respect toJt−1 when
the relevant distributionDyt is used. Without a crystal-ball predictor, the absence of which is precisely
the fundamental forecasting problem, the future distribution will be unknown, andex post, φt−1 (Zt−1)
will be a biased predictor. The crucial information reduction is fromDyt to Dyt−1, which would have
major costs facing non-constancy, as will occur under extrinsic unpredictability.
3.3 Three information sets
If the universal information setIt−1 does not enable predictability, then the random variable inquestion
is intrinsically unpredictable. That result applies equally to modeling and forecasting: nothing useful
can be said beyond the unconditional distribution. Few observable economic variables are intrinsically
unpredictable fromIt−1, although modelers often seek an error that is, an issue addressed in section 4.3.
In practice, the available informationJt−1 ⊂ It−1 that investigators use facilitates some predictability
whenJ t−1 = σ[Zt−1] denotes known ‘standard economic forces’ (e.g., for money demand, these would
be incomes, prices, interest rates and lags thereof as in, e.g., Hendry and Ericsson, 1991). Whenyt is not
intrinsically unpredictable, butDyt (yt|Jt−1) 6= Dyt (yt) because of instance or extrinsic unpredictabil-
ity, neverthelessyT+1 may sometimes be predictable atT using two additional information sets, denoted
LT andKT above, that are not subsets ofJT .
The possible information setLT is one that would help predict the timing of a bad draw from a
known fat-tailed distribution. The considerations involved seem close to those for predicting shifts of
10

distributions discussed below, although instance unpredictability is a known unknown as theex ante
probability can be calculated. Empirically, however, instance unpredictability is usually an unknown
unknown, because the relevant distribution is not known in advance, although characteristics thereof,
such as having a fat tail, may be.
The third possible source of information,KT , is one that might help reduce extrinsic unpredictability.
We assume thatLt−1 ⊂ Kt−1 since timing predictability is needed to predict location shifts. Then,
let the universal information set determining the DGP ofyt be It−1 = (Jt−1,Kt−1,Mt−1) where
Kt−δ = σ[Wt−δ ] (say) which if known would explain some of the changes fromDyt−1(·) to Dyt(·)
where0 ≤ δ ≤ 1, andMt−1 is a relevant source of information that is unknown to investigators. Write
the DGP ofyt as:
yt = ΓXvt−1 + ǫt (20)
wherev denotes column vectoring. Using onlyJt−1 entails marginalizingIt−1 with respect toMt−1
andKt−1, soJt−1 no longer characterizes the DGP ofyt, only its local DGP (LDGP):
yt = ΨtZvt−1 + et (21)
When the resulting parameterΨt is non-constant, butΓ is constant, then the information inK andM
must ‘explain’ the breaks in (21). Shifts then alter the ‘regular relationship’ (e.g., in inflation relative
to its usual determinants, as occurs when wars start: see Hendry, 2001). When(Jt−1,Kt−δ) are both
known, this leads to a different LDGP, marginalized with respect toMt−1 only. WhenKt−δ is indeed the
information set that induces a constant LDGP, it must do so byaccounting for shifts inΨt, so assuming
the simplest linear setting to illustrate:
yt = Φ1Zvt−1 +Φ2W
vt−δ + vt (22)
Here,Wvt−δ is dated almost contemporaneously withΨt (and thereforeyt) to produce a constant rela-
tionship, so an investigator may still need to forecast shifts inWt−δ at timet (hence very high frequency
information may help). Thus,Wt−1 may not help in forecasting even ifWt would capture the shift
in the relationship betweent − 1 andt due to changes in (inter alia) legislation, financial innovation,
technology, and policy regimes. Castle, Fawcett and Hendry(2011) discuss a variety of information sets
that may improve the predictability of shifts, including leading indicators and survey data, disaggregation
over time and variables,Google Trends(see Choi and Varian, 2012) and prediction markets data (like the
11
Iowa electronic market), although none need help in any given instance.
WhenM accounts for the distributional shifts, such that knowingJ andK does not lead to a constant
LDGP, the only viable modeling approach seems to be to removepast location shifts in-sample, although
that still leaves forecasting hazardous. To induce (21) from the LDGP in (22) requires a relation like:
Wvt = ΠtZ
vt−1 + ηt (23)
where (23) is a projection, so does not entail an ability to forecastWt fromZt−1 becauseΠt is unknown
(and perhaps unknowable) att−1: see Hendry (1988). To paraphrase Cartwright (1989), ‘Breaks out (as
in (21)) need breaks in (as in (23))’, so it cannot be logically impossible to foresee some shifts—though
it may be difficult in practice.
3.4 Extrinsic unpredictability and economic analyses
Due to shifts in the underlying distributions, all expectations operators must be three-way time dated,
to denote the relevant random variables, the distributionsbeing integrated over, and the available infor-
mation at the time the expectations are formed, as inEDǫt[ǫt+1|It−1], which denotes the conditional
expectation ofǫt+1 formed at timet given the information setIt−1.
Definition 5
EDǫt[ǫt+1 | It−1] =
∫ǫt+1Dǫt (ǫt+1|It−1)dǫt+1 (24)
The formulation in (24) allows for a random variable being unpredictable in mean or variance because
its conditional distribution shifts in unanticipated waysrelative to the conditioning information, which is
perhaps the most relevant state of nature for economics.
3.4.1 Conditional expectations
Conditional expectations are often proved to be unbiased byarguments like the following. Let:
yt+1 = E [yt+1 | It] + vt+1 (25)
Then taking conditional expectations of both sides:
E[vt+1 | It] = 0 (26)
12
This result can be misinterpreted as showing that the expectation in (25) is unbiased foryt+1, but the
analysis suffers from essentially the same difficulty as theapparent paradox discussed above. Formally:
Theorem 6 Whenǫt ∼ INn [µt,Ωǫ] is extrinsically unpredictable, because future changes inµt cannot
be established in advance, the conditional expectationEDǫt[ǫt+1 | It−1] need not be unbiased for the
outcome att+ 1.
Proof. From (24):
EDǫt[ǫt+1 | It−1] =
∫ǫt+1Dǫt (ǫt+1|It−1) dǫt+1 =
∫ǫt+1Dǫt (ǫt+1)dǫt+1 = µt (27)
whereas:
EDǫt+1[ǫt+1 | It−1] =
∫ǫt+1Dǫt+1
(ǫt+1|It−1)dǫt+1 =
∫ǫt+1Dǫt+1
(ǫt+1) dǫt+1 = µt+1 (28)
so thatEDǫt[ǫt+1|It−1] does not correctly predictµt+1.
Thus, the conditional expectationEDǫt[ǫt+1|It−1] formed att is not an unbiased predictor of the outcome
µt+1 at t+ 1, although the ‘crystal-ball’ predictorEDǫt+1[ǫt+1|It−1] remains unbiased.
Returning to (25) at timet and subscripting the expectations operator as in (24):
yt+1 = EDyt[yt+1 | It] + vt+1 (29)
so (26) becomes:
EDyt[vt+1 | It] = 0 (30)
which does not entail that:
EDyt+1[vt+1 | It] = 0 (31)
whereas (31) is required for an unbiased prediction. Only (29) is available to economic agents or fore-
casters, and after a location shift, the resulting bias can cause forecast failure, as in section 4.1.
It seems unlikely that economic agents are any more successful than professional economists in
foreseeing when breaks will occur, or divining their type from one or two observations after they have
happened. That link with forecast failure has important implications for economic theories about agents’
expectations formation in a world with extrinsic unpredictability. General equilibrium theories rely heav-
ily on ceteris paribusassumptions, especially that equilibria do not shift unexpectedly. The conditional
expectation is the minimum mean-square error predictor in an intrinsically unpredictable process only
13
when the distribution remains constant, and fails under extrinsic unpredictability. Thus, it would not be
rational to use the conditional expectation under extrinsic unpredictability, which may lead agents to use
forecasting devices that are robust after location shifts.Moreover, as we now show the law of iterated
expectations does not apply inter-temporally when the distributions that enter the formulation change
over time.
3.4.2 The law of iterated expectations facing unanticipated shifts
Theorem 7 Whenh(y, z) = f(y|z)g(z) = p (y)ψ (z|y) is the joint distribution of(y, z) and all the
distributions involved are constant, the law of iterated expectations entails:
Ez [Ey [y | z]] = Ey [y] (32)
While well known, the following proof reveals the problems that will ensue when distributions shift:
Proof.
Ez [Ey [y | z]] =
∫
Z
(∫
Yyf (y|z) dy
)g (z) dz =
∫
Z
∫
Yyf (y|z) g (z)dzdy
=
∫
Yy
(∫
Zh (y, z) dz
)dy =
∫
Yyp (y)dy = Ey [y]
where∫Z h (y, z) dz = p (y) .
When the variables correspond to a common set at different dates drawn from the same distribution,
then (32) becomes:
Eyt
[Eyt+1
[yt+1 | yt]]= Eyt+1
[yt+1] .
The formal derivation is close to that in (32), namely:
Proof.
Eyt
[Eyt+1
[yt+1 | yt]]=
∫
yt
(∫
yt+1
yt+1f (yt+1|yt) dyt+1
)p (yt)dyt
=
∫
yt
∫
yt+1
yt+1f (yt+1|yt) p (yt)dytdyt+1
=
∫
yt+1
yt+1
(∫
yt
h (yt+1, yt)dyt
)dyt+1
=
∫
yt+1
yt+1p (yt+1) dyt+1 = Eyt+1[yt+1] (33)
14
Thus, if the distributions remain constant, the law of iterated expectations holds.
Theorem 8 The law of iterated expectations need not hold when distributions shift:
Eyt
[Eyt+1
[yt+1 | yt]]6= Eyt+1
[yt+1]
Proof.
Eyt
[Eyt+1
[yt+1 | yt]]=
∫
yt
(∫
yt+1
yt+1fyt+1(yt+1|yt) dyt+1
)pyt (yt) dyt
=
∫
yt
∫
yt+1
yt+1fyt+1(yt+1|yt) pyt (yt) dytdyt+1
=
∫
yt+1
yt+1
(∫
yt
fyt+1(yt+1|yt) pyt (yt) dyt
)dyt+1
6=
∫
yt+1
yt+1pyt+1(yt+1) dyt+1 = Eyt+1
[yt+1] (34)
asfyt+1(yt+1|yt) pyt (yt) 6= fyt+1
(yt+1|yt) pyt+1(yt) unlike the situation in (33) where there is no shift
in distribution.
There are two sources of updating from, say,Eyt [yt+1|yt−1] to Eyt+1[yt+1|yt]: new information is
embodied inyt−1 becomingyt; and shifts in the distribution are implied by a change fromEyt to Eyt+1.
Much of the economics literature (see e.g., Campbell and Shiller, 1987) assumes that the former is an
unanticipated change, written asE [yt+1|yt] − E [yt+1|yt−1], being an innovation,νt, as the relevant
information becomes known only one period later. However, that need not be not true of the latter, when
the new distributional form has to be learned over time–and may have shifted again in the meantime.
Even if the distribution, denotedft+1 (yt+1|yt), became known one period later:
Eyt+1[yt+1 | yt]− Eyt [yt+1 | yt−1] = Eyt+1
[yt+1|yt]− Eyt+1[yt+1|yt−1]
+(Eyt+1
[yt+1|yt−1]− Eyt [yt+1|yt−1])
= νt +
∫yt+1ft+1 (yt+1|yt−1)dyt+1 −
∫yt+1ft (yt+1|yt−1)dyt
= νt +(µt+1 − µt
)
In practice, both means need to be estimated, a nearly intractable task for agents–or statisticians and
econometricians–when distributions are shifting.
15
The derivation deducing a martingale difference sequence (MDS) from ‘no arbitrage’ in, e.g., Jensen
and Nielsen (1996), also explicitly requires no shifts in the underlying probability distributions. Once
that is assumed, a MDS allows deducing the intrinsic unpredictability of equity price changes and hence
market (informational) efficiency. Unanticipated shifts also imply unpredictability, but need not entail
efficiency: informational efficiency does not follow from unpredictability per se, when the source is
extrinsic rather than intrinsic. Distributional shifts occur in financial markets, as illustrated by the chang-
ing market-implied probability distributions of the S&P500 in the Bank of EnglandFinancial Stability
Report, June 2010.
In other arenas, location shifts can play a positive role in clarifying both causality, as demonstrated
in White and Kennedy (2009), and super exogeneity (see Hendry and Santos, 2010). Also White (2006)
considers estimating the effects of natural experiments, many of which involve large location shifts.
Thus, while more general theories of the behavior of economic agents and their methods of expectations
formation are required under extrinsic unpredictability,and forecasting becomes prone to failure, large
shifts could also help reveal the linkages between variables.
4 Consequences for empirical applications
The main empirical arenas on which instance and extrinsic unpredictability impact are forecasting and
modeling, so we consider these in turn.
4.1 Instance and extrinsic unpredictability in forecasting
Although no information could make the timing and magnitudeof genuinely independent large draws
predictable, once a shift has occurred, appropriate indicator variables can remove the problem from
a model, even when the ‘causes’ are unknown. If the causes areknown, the relevant variable(s) can be
added. Nevertheless, knowing and adding such variables need not help in forecasting, unless one can also
forecast future shifts in them. For example, oil price changes can have an important impact on inflation,
and are often significant in empirical models of price inflation, but remain at least as difficult to forecast
as the inflation change itself. Thus, both instance and extrinsic unpredictability may be susceptible toex
postmodeling, yet not improveex anteforecasting when future shifts cannot be accurately forecast.
WhenψT+1(·) in (9) changes withKT+1, and thereby induces location shifts, we can write that
dependence as:
EDyT+1[yT+1 | JT ,KT+1] = ψ0 (ZT ) +ψ1 (WT+1) (35)
16
whereψ0(·) is constant. The second term is zero, except for shifts, accounted for by step functions or
non-linear responses. AtT + 1− δ, however, an investigator at best knowsZT , WT+1−δ andDyT+1−δ,
in which case:
EDyT+1−δ[yT+1 | JT ,KT+1−δ ] = ψ0 (ZT ) + EDyT+1−δ
[ψ1 (KT+1) | KT+1−δ] (36)
If a location shift is unpredictable, soEDyT+1−δ
[ψ1 (KT+1) |KT+1−δ
]= 0, there will be no perceptible
difference from the information set that entersψT+1 (JT ). The aim, therefore, must be to ascertain
available informationKT+1−δ such thatEDyT+1−δ
[ψ1 (KT+1) |KT+1−δ
]≃ ψ1 (WT+1), a daunting,
but not impossible task, dependent on the specifics of the problem, although it is likely that some outliers
and breaks will not be anticipated, so forecasts that are robust after breaks will often be needed.
4.2 Unpredictability and model selection
All three forms of unpredictability impinge on econometricmodeling and model selection. A process that
is intrinsically unpredictable cannot be modeled better than its unconditional distribution. For economic
data, the only relevant situation where that might apply is to the error processes in models, and we
consider that aspect in§4.3.
The timings and magnitudes of large draws or shifts are unanticipatedex antewith instance or ex-
trinsic unpredictability, but once they have occurred, they can be taken into accountex postand so can
be modeled. Thus, although unanticipated shifts may be highly detrimental to both economic analyses
and forecasting, they need not impugn empirical modeling ormodel selection when correctly handled.
Moreover, shifts that are not modeled can be disastrous for estimation and inference. However, impulse-
indicator saturation (IIS: see Hendry, Johansen and Santos, 2008, and Johansen and Nielsen, 2009) can
handle multiple location shifts as well as ‘remove’ most of the outliers from a fat-tailed distribution. IIS
creates a complete set of indicator variables1j=t
= 1 whenj = t and0 otherwise forj = 1, . . . , T
givenT observations, then adds theseT impulse indicators to the set of candidate variables. Multi-path
search algorithms with tight critical values can handle more candidate variables,N , thanT . As imple-
mented in automatic model selection algorithms likeAutometrics(see Doornik, 2009), IIS enables jointly
locating breaks with selection over variables, functionalforms and lags: see Castle, Doornik and Hendry
(2012). Some well-known procedures are variants of IIS, such as the Chow (1960) test (sub-sample IIS
overT − k + 1 to T without selection), and recursive estimation, which is equivalent to IIS over future
samples, reducing indicators one at a time.
17
Castleet al. (2011) show that IIS can avoid unmodeled outliers contaminating the selection of non-
linear models for forecasting shifts and during shifts. However, care is required in interpreting empirical
models with substantively important indicator variables,when the shifts they represent could recur. Fu-
ture draws are likely to include either outliers or shifts, so measures of uncertainty need to reflect that
possibility, as emphasized by Hendry (2001) and Pesaran, Pettenuzzo and Timmermann (2006).
4.3 Congruent modeling for forecasting
The result in (17) underpins general-to-specific (Gets) model selection and the related use of congruence
and encompassing as a basis for econometric model selection(see e.g., Doornik and Hendry, 2009). In
terms of Gets, less is learned fromJt−1 thanIt−1, and the variance (when it exists) of the unpredictable
component is larger. In terms of encompassing (see Bontempsand Mizon, 2003, 2008, for recent results),
a later investigator may discover additional information in It−1 beyondJt−1 which explains part of a
previously unpredictable error. Nevertheless, a congruent model need not outperform in forecasting even
when it coincides with the in-sample DGP, clarifying a number of findings in the empirical forecasting
literature. For example, Allen and Fildes (2001) among others, find no relationship between congruence,
as exemplified by rigorous mis-specification testing, and subsequent forecasting performance. Since
systematic forecast failure is primarily due to extrinsically unpredictable shifts in future distributions,
such a finding makes sense, but raises the question: what is the role for congruent models in forecasting?
There are four potential advantages of using a congruent encompassing model for forecasting despite the
omnipresent possibility of unanticipated breaks.
First, such models deliver the smallest variance for the innovation error, a key determinant of forecast-
error variances, especially important when breaks do not occur over the forecast horizon. However, in-
sample dominance does not ensure the avoidance of forecast failure, and Clements and Hendry (1998) es-
tablish the robustness after location shifts of double-differenced forecasting devices, such as∆xT+1|T =
∆xT , which can outperform despite their non-congruence and non-encompassing. Clements and Hendry
(2001) use that analysis to explain the outcomes of forecasting competitions, where the simplicity of a
model is viewed as essential for success (see e.g., Makridakis and Hibon, 2000), but argue that is due
to confounding parsimony with robustness, as such competitions did not include non-parsimonious but
robust models. Castle, Fawcett and Hendry (2010) highlightthe forecasting advantages of transform-
ing a non-parsimonious model to be robust after breaks, and show that it can then even outperform the
highly parsimonious yet robust device∆xT+1|T = ∆xT after a break at timeT − 1: how a congruent
encompassing in-sample model is used in the forecast periodmatters when there are location shifts.
18
Secondly, modeling mean shifts in-sample removes one of thesources of systematic mis-forecasting,
as illustrated by Hendry and Mizon (2011). All taxonomies offorecast errors show that the equilib-
rium mean plays a key role therein (see e.g., Clements and Hendry, 1998): shifts, mis-estimation, or
mis-specification of the equilibrium mean all induce non-zero mean forecast errors. Shifts can only
be avoided by either forecasting their arrival, or using a formulation that is robust after breaks, as just
discussed; mis-estimation should be small in a constant well-specified model, where the free intercept
represents the mean of the dependent variable; and removingin-sample location shifts and outliers re-
duces that source of mis-specification.
Thirdly, eliminating from a selected model irrelevant variables that might break in the forecast period
avoids a further source of forecast failure. Model selection at tight significance levels can achieve that aim
jointly with selecting relevant variables, non-linear functions and lags thereof, and removing in-sample
location shifts and outliers by IIS. Moreover, bias corrections after selection also reduce the impact of
any adventitiously significant irrelevant variables whichmight shift.
Fourthly, in congruent models, decisions during model selection can be based on conventional in-
ference procedures, such ast-tests even forI(1) data: see Sims, Stock and Watson (1990). However,
when unmodeled breaks occur, heteroskedastic-consistentstandard errors (HCSEs), and autocorrelation-
consistent (HACSEs ) generalizations thereof (see e.g., White, 1980, and Andrews, 1991) appear to be
needed. Because of the unmodeled shifts, residuals will exhibit heteroskedasticity and autocorrelation,
even though those features are not present in the errors. However, HCSEs and HACSEs will incorrectly
attribute the underlying uncertainty to the problems for which they were respectively designed, rather
than the correct source of unmodeled shifts.
A further important issue is the ratio of the largest eigenvalue of the data second-moment matrix
(sayλ1) to the smallest (λn), albeit that is not just a problem for congruent models. Castle et al. (2010)
show that location shifts reduce the collinearities between variables, having the greatest impact on the
smallest eigenvalues, and since mean square forecast errors (MSFEs) depend most onλ1/λn, changes
in collinearity after a break adversely increase forecast uncertainty. This effect cannot be avoided by
deleting the collinear variables, nor is the problem mitigated by orthogonalizing the variables, which can
transform an external break (one affecting marginal processes) to an internal one (shifting the conditional
model of interest). However, eliminating low-significancevariables by model selection, and rapidly
updating after a shift, especially by a relatively short moving window, can both help alleviate this problem
(see e.g., Phillips, 1995, and Pesaran and Timmermann, 2007, respectively).
19
4.4 Empirical application of robust forecasting
We now illustrate that robust transforms are a feasible toolto mitigate location shifts by pseudoex ante
forecasting of Japanese exports using monthly data over 2008(7)–2011(6), when they fell unexpect-
edly and drastically by more than70% year on year. As an autoregressive model is often difficult to
outperform in forecasting, we contrast that with the robustvariant of the same equation obtained by
differencing.
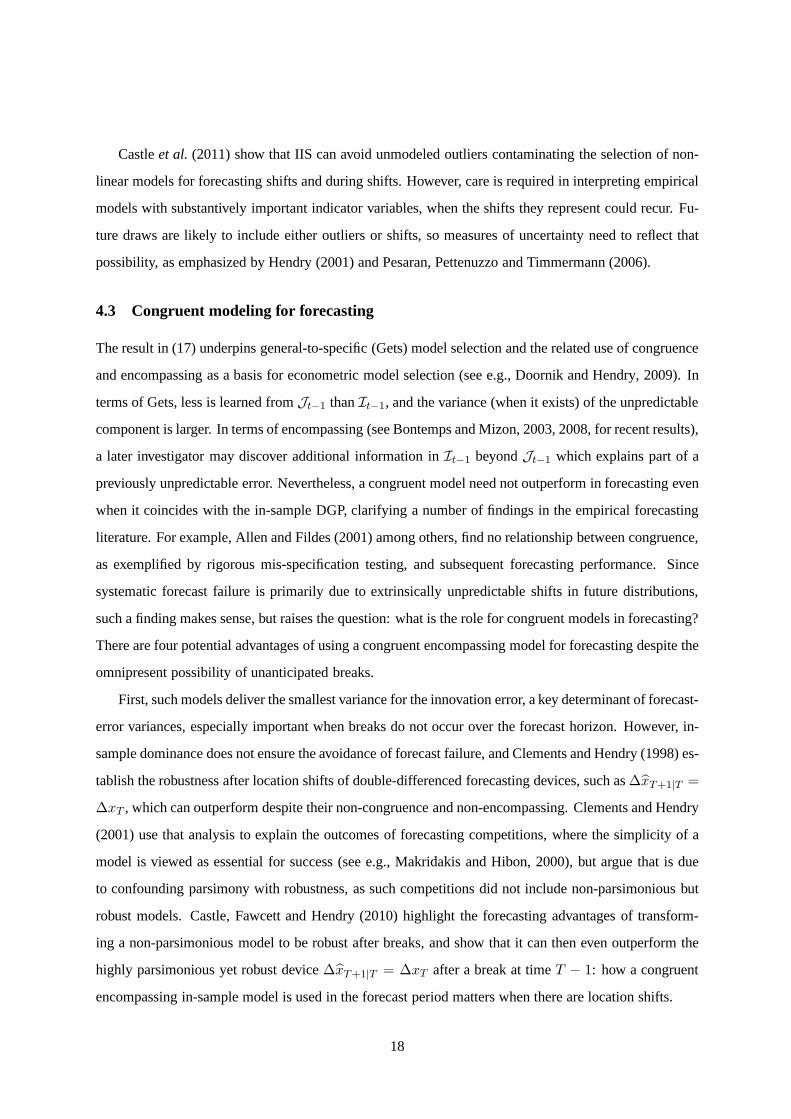
The autoregressive model selected at 1% byAutometricsover 2000(1)–2008(6) was:
yt = 0.68
(0.091)
yt−1 + 0.26
(0.090)
yt−3 + 0.12
(0.04)
12000(2) + 0.12
(0.04)
12002(1)
σ = 0.039 χ2 (2) = 0.65
Fhet(4, 95) = 1.02 Far(6, 92) = 0.97 Freset(2, 96) = 2.1 (37)
whereyt denotes the annual change in the log of constant price Japanese exports, and1200z(x) are indi-
cators for200z(x). The selected model is in fact already almost ‘robust’ by having a near second unit
root.
yT+h|T+h−1 yT+h
2007 2008 2009 2010 2011-0.8
-0.6
-0.4
-0.2
0.0
0.2
0.4
0.6
yT+h|T+h−1 yT+h
~yT+h|T+h−1 yT+h
2007 2008 2009 2010 2011-0.8
-0.6
-0.4
-0.2
0.0
0.2
0.4
0.6~yT+h|T+h−1 yT+h
Figure 1: Forecasts of year-on-year changes in Japan’s exports, 2008(7)–2011(6)
From (37), the corresponding robust device was just the simplified difference:
yt = yt−1 + 0.95∆yt−1 σ = 0.0755 (38)
20
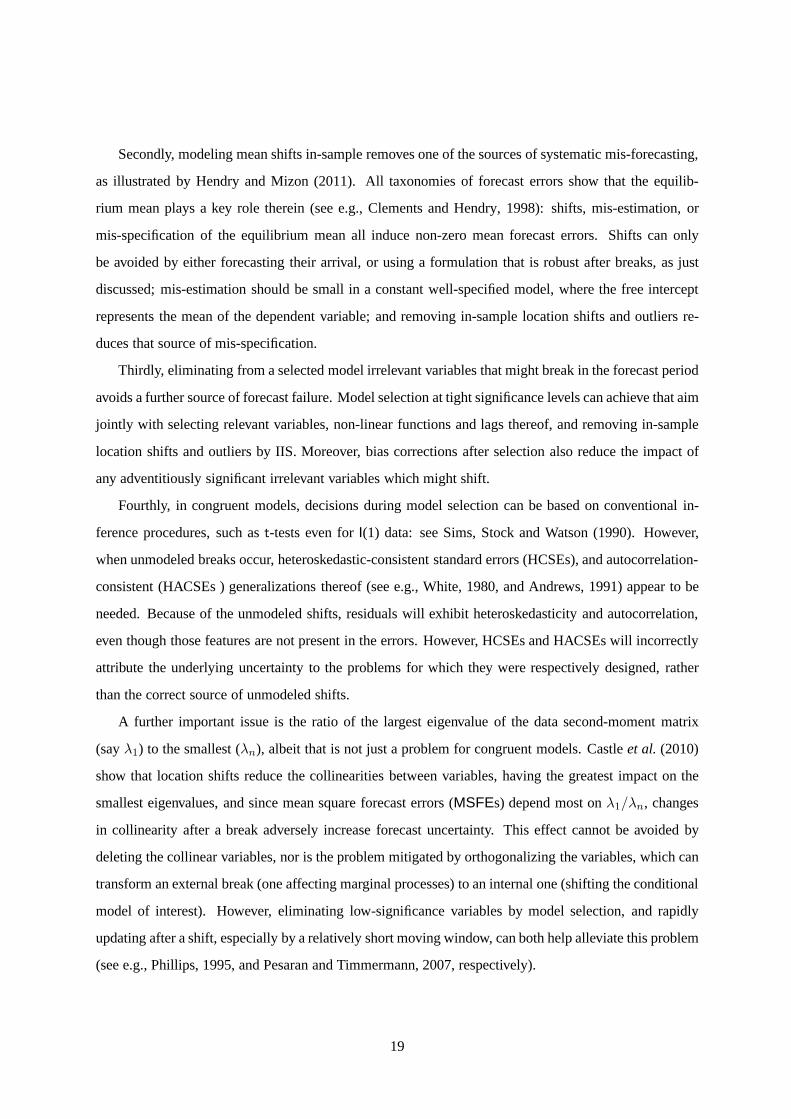
ε2T+h|T+h−1 ~ε2T+h|T+h−1
2009 2010 2011
0.01
0.02
0.03
0.04
0.05
0.06
0.07
0.08
0.09
0.10
~εT+h|T+h−1=yT+h−~yT+h|T+h−1
εT+h|T+h−1=yT+h−yT+h|T+h−1
ε2T+h|T+h−1 ~ε2T+h|T+h−1
Figure 2: Squared forecast-error comparison
Their respective forecasts in Figure 1 show typical patterns. The forecasts from (37) are systematically
discrepant, being above when exports fall, and below when they rise again. The error bars show±2σ
forecast intervals. In contrast, the robust device avoids systematic forecast failure, but overshoots at
turning points plus a small ‘insurance cost’ when no shifts occur (no error bars are shown given the non-
congruence of the device). Overall, their comparativeRMSFEs are0.124 versus0.098, as highlighted
by Figure 2.
Thus, while separate methods are needed to forecast a location shift (Castleet al., 2011, offer some
suggestions), once such a break has occurred, robust devices can maintain forecasts on track because the
DGP, and hence the data, must then incorporate the break. In addition to this example of forecasting
Japanese exports demonstrating that a robust model can forecast better than an autoregression, Hendry
and Mizon (2011) show that the robust version of an economic-theory based econometric model can
forecast well for extensive periods despite the presence ofstructural change, even when the original
model fails.
5 Conclusion
The three distinctions within unpredictability of intrinsic, instance and extrinsic, have different implica-
tions for economic analyses, econometric modeling, and forecasting. The first entails that conditioning
information does not alter uncertainty, so that the unconditional distribution is the best basis for all
three activities, which are therefore on an equal footing of‘uninformativeness’. The second adds the
possibility that even when the distributional form is known, either unconditionally or conditionally (so
21
otherwise there would be some predictability), an outcome can be highly discrepant at an unexpected
time, and thereby impose substantial costs. Such outliers do not persist, but are usually in dfferenced
variables (like rates of return) so can permanently change alevel. The third concerns unanticipated shifts
in distributions, which do persist, as with location shifts.
After they have happened, the effects from the second and third can be modeled (at a minimum
by indicator variables), but if neither can be predicted on the available information, forecasts will be
hazardous. Given the nature of innovation and economic behavior, it seeems highly unlikely that a meta-
distribution of breaks can be formulated once and for all, precluding parametrizing all possible breaks or
relying on intrinsic unpredictability alone: there are toomany future unknown unknowns. Nevertheless,
modeling tools such as impulse-indicator saturation allowthe contaminating effects of location shifts and
outliers to be removed.
Important implications of extrinsic unpredictability arethat conditional expectations cease to be re-
liably unbiased and the law of interated expectations failsto hold intertemporally. Consequently, model
forms that rely on such derivations will be non-structural precisely when unanticipated location shifts
occur. Moreover, economic agents may adopt robust methods to avoid systematic forecast failure fol-
lowing shifts. Although sources of information may exist that could help with predicting outliers or
shifts, it may prove difficult to benefit from these in practice. Consequently, methods which can help
ascertain the likely persistence of breaks after they have occurred seem to offer the best prospect for
mitigating systematic forecast failure for both economists and economic agents.
References
Allen, P. G., and Fildes, R. A. (2001). Econometric forecasting strategies and techniques. In Armstrong,
J. S. (ed.),Principles of Forecasting, pp. 303–362. Boston: Kluwer Academic Publishers.
Allen, R. C. (2009).The British Industrial Revolution in Global Perspective. Cambridge: Cambridge
University Press.
Andrews, D. W. K. (1991). Heteroskedasticity and autocorrelation consistent covariance matrix estima-
tion. Econometrica, 59, 817–858.
Apostolides, A., Broadberry, S., Campbell, B., Overton, M., and van Leeuwen, B. (2008). English
Gross Domestic Product, 1300–1700: Some preliminary estimates. Discussion paper, University
of Warwick, Coventry.
Barndorff-Nielsen, O. E., and Shephard, N. (2004). Power and bipower variation with stochastic volatil-
22
ity and jumps.Journal of financial Econometrics, 2, 1–37.
Barndorff-Nielsen, O. E., and Shephard, N. (2006). Econometrics of testing for jumps in financial eco-
nomics using bipower variation.Journal of financial Econometrics, 4, 1–30.
Barrell, R. (2001). Forecasting the world economy. In Hendry, D. F., and Ericsson, N. R. (eds.),Under-
standing Economic Forecasts, pp. 149–169. Cambridge, Mass.: MIT Press.
Barrell, R., Dury, K., Holland, D., Pain, N., and te Velde, D.(1998). Financial market contagion and the
effects of the crises in East Asia, Russia and Latin America.National Institute Economic Review,
166, 57–73.
Barro, R. J. (2009). Rare disasters, asset prices and welfare costs. American Economic Review, 99,
243–264.
Bontemps, C., and Mizon, G. E. (2003). Congruence and encompassing. In Stigum, B. P. (ed.),Econo-
metrics and the Philosophy of Economics, pp. 354–378. Princeton: Princeton University Press.
Bontemps, C., and Mizon, G. E. (2008). Encompassing: Concepts and implementation.Oxford Bulletin
of Economics and Statistics, 70, 721–750.
Campbell, J. Y., and Shiller, R. J. (1987). Cointegration and Tests of Present Value Models.Journal of
Political Economy, 95(5), 1062–1088.
Cartwright, N. (1989).Nature’s Capacities and their Measurement. Oxford: Clarendon Press.
Castle, J. L., Doornik, J. A., and Hendry, D. F. (2011). Evaluating automatic model selection.Journal of
Time Series Econometrics, 3 (1), DOI: 10.2202/1941–1928.1097.
Castle, J. L., Doornik, J. A., and Hendry, D. F. (2012). Modelselection when there are multiple breaks.
Journal of Econometrics, 169, 239–246.
Castle, J. L., Fawcett, N. W. P., and Hendry, D. F. (2010). Forecasting with equilibrium-correction models
during structural breaks.Journal of Econometrics, 158, 25–36.
Castle, J. L., Fawcett, N. W. P., and Hendry, D. F. (2011). Forecasting Breaks and During Breaks. In
Clements, M. P., and Hendry, D. F. (eds.),Oxford Handbook of Economic Forecasting, pp. 315–
353. Oxford: Oxford University Press.
Castle, J. L., and Shephard, N. (eds.)(2009).The Methodology and Practice of Econometrics. Oxford:
Oxford University Press.
Choi, H., and Varian, H. (2012). Predicting the present withGoogle Trends.Economic Record, 88, 2–9.
Chow, G. C. (1960). Tests of equality between sets of coefficients in two linear regressions.Economet-
23
rica, 28, 591–605.
Clements, M. P., and Hendry, D. F. (1998).Forecasting Economic Time Series. Cambridge: Cambridge
University Press.
Clements, M. P., and Hendry, D. F. (2001). Explaining the results of the M3 forecasting competition.
International Journal of Forecasting, 17, 550–554.
Clements, M. P., and Hendry, D. F. (2005). Information in economic forecasting.Oxford Bulletin of
Economics and Statistics, 67, 713–753.
Doob, J. L. (1953).Stochastic Processes. New York: John Wiley Classics Library. 1990 edition.
Doornik, J. A. (2009). Autometrics. In Castle, and Shephard(2009), pp. 88–121.
Doornik, J. A., and Hendry, D. F. (2009).Empirical Econometric Modelling using PcGive: Volume I.
London: Timberlake Consultants Press.
Granger, C. W. J., and Pesaran, M. H. (2000a). A decision-theoretic approach to forecast evaluation. In
Chon, W. S., Li, W. K., and Tong, H. (eds.),Statistics and Finance: An Interface, pp. 261–278.
London: Imperial College Press.
Granger, C. W. J., and Pesaran, M. H. (2000b). Economic and statistical measures of forecasting accu-
racy. Journal of Forecasting, 19, 537–560.
Hendry, D. F. (1988). The encompassing implications of feedback versus feedforward mechanisms in
econometrics.Oxford Economic Papers, 40, 132–149.
Hendry, D. F. (2001). Modelling UK inflation, 1875–1991.Journal of Applied Econometrics, 16, 255–
275.
Hendry, D. F., and Ericsson, N. R. (1991). Modeling the demand for narrow money in the United
Kingdom and the United States.European Economic Review, 35, 833–886.
Hendry, D. F., Johansen, S., and Santos, C. (2008). Automatic selection of indicators in a fully saturated
regression.Computational Statistics, 33, 317–335. Erratum, 337–339.
Hendry, D. F., and Massmann, M. (2007). Co-breaking: Recentadvances and a synopsis of the literature.
Journal of Business and Economic Statistics, 25, 33–51.
Hendry, D. F., and Mizon, G. E. (2011). Econometric modelling of time series with outlying observations.
Journal of Time Series Econometrics, 3 (1), DOI: 10.2202/1941–1928.1100.
Hendry, D. F., and Santos, C. (2010). An automatic test of super exogeneity. In Watson, M. W., Boller-
slev, T., and Russell, J. (eds.),Volatility and Time Series Econometrics, pp. 164–193. Oxford:
24
Oxford University Press.
Jensen, B. A., and Nielsen, J. A. (1996). Pricing by no arbitrage. In Cox, D. R., Hinkley, D. V., and
Barndorff-Nielsen, O. E. (eds.),Time Series Models: In Econometrics, Finance and other Fields,
pp. 179–225. London: Chapman and Hall.
Johansen, S., and Nielsen, B. (2009). An analysis of the indicator saturation estimator as a robust regres-
sion estimator. In Castle, and Shephard (2009), pp. 1–36.
Leitch, G., and Tanner, J. E. (1991). Economic forecast evaluation: Profits versus the conventional error
measures.American Economic Review, 81, 580–590.
Makridakis, S., and Hibon, M. (2000). The M3-competition: Results, conclusions and implications.
International Journal of Forecasting, 16, 451–476.
Pesaran, M. H., Pettenuzzo, D., and Timmermann, A. (2006). Forecasting time series subject to multiple
structural breaks.Review of Economic Studies, 73, 1057–1084.
Pesaran, M. H., and Timmermann, A. (2007). Selection of estimation window in the presence of breaks.
Journal of Econometrics, 137, 134–161.
Phillips, P. C. B. (1995). Automated forecasts of Asia-Pacific economic activity.Asia-Pacific Economic
Review, 1, 92–102.
Sims, C. A., Stock, J. H., and Watson, M. W. (1990). Inferencein linear time series models with some
unit roots.Econometrica, 58, 113–144.
Soros, G. (2008).The New Paradigm for Financial Markets. London: Perseus Books.
Soros, G. (2010).The Soros Lectures. Philadelphia: Perseus Books.
Taleb, N. N. (2007).The Black Swan. New York: Random House.
Taleb, N. N. (2009). Errors, robustness, and the fourth quadrant. International Journal of Forecasting,
25, 744–759.
White, H. (1980). A heteroskedastic-consistent covariance matrix estimator and a direct test for het-
eroskedasticity.Econometrica, 48, 817–838.
White, H. (2006). Time series estimation of the effects of natural experiments.Journal of Econometrics,
135, 527–566.
White, H., and Kennedy, P. (2009). Retrospective estimation of causal effects through time. In Castle,
and Shephard (2009), pp. 59–87.
25