update on quality metrics
TRANSCRIPT

Quality Metrics
Alicia Mozzachio, RPh, MPHSenior Advisor for International Activities
Office of Policy for Pharmaceutical Quality (OPPQ)Center for Drug Evaluation and Research
U.S. Food and Drug Administration

2
Objectives
• Pharmaceutical Quality for the 21st Century
• Why Quality Metrics (QM)?
• Initial draft of the QM Guidance
• Key Features of the QM Revised Draft Guidance
• Phased-In Approach and Benefits to Participants
• How FDA Intends to Use Metrics Data

3
Vision
“A maximally efficient, agile, flexible pharmaceutical manufacturing sector that reliably produces high quality drugs without extensive regulatory oversight.”
Pharmaceutical Quality for 21st Century Initiative

4
Desired State of Manufacturing
• Manufacturers have extensive knowledge about critical product and process parameters and quality attributes
• Manufacturers strive for continuous improvement
• FDA role: Initial verification, subsequent audit
• Minimal manufacturing supplements neededfor postapproval changes
5
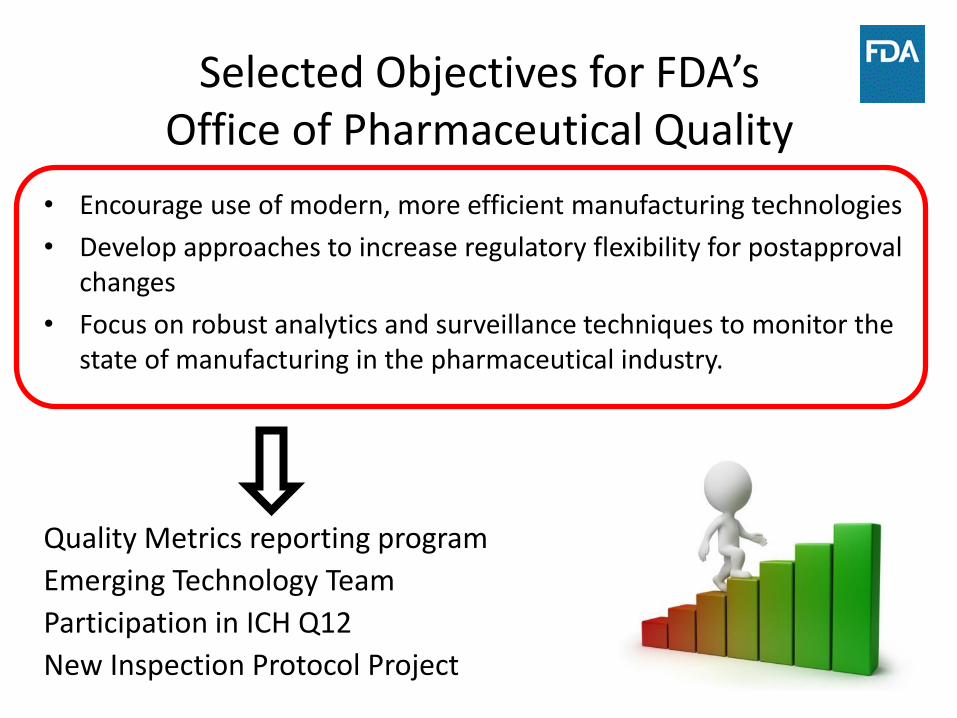
Selected Objectives for FDA’sOffice of Pharmaceutical Quality
• Encourage use of modern, more efficient manufacturing technologies
• Develop approaches to increase regulatory flexibility for postapproval changes
• Focus on robust analytics and surveillance techniques to monitor the state of manufacturing in the pharmaceutical industry.
Quality Metrics reporting program
Emerging Technology Team
Participation in ICH Q12
New Inspection Protocol Project

6
Existing Quality Metrics Programs
• Many manufacturing establishments currently use quality metrics as a part of the process validation lifecycle and pharmaceutical quality system (PQS) assessment
• Current good manufacturing practice (CGMP) for human drugs requires manufacturers to have an ongoing program to maintain and evaluate product and process data that relate to product quality
• Continued process verification includes a Periodic Product Review (PPR):
– conducted at least annually
– data collected includes relevant process trends and quality of incoming materials or components, in-process materials, and finished products
• Programs should be tailored to include those metrics that the manufacturer finds useful in performing these product- and establishment-specific evaluations

7
Lot Acceptance Rate Manufacturing process robustness
Invalidated OOS Rate Laboratory operations
Product Quality Complaint Rate Voice of patient/consumer
Robust Product/Site Measurement Program
Other Metrics Likely to be Useful
• Lot acceptance rate
• Invalidated and validated OOS rate
• Product quality complaint rate
• Deviations without assigned root cause
• Periodic Product Review Completion
• Right-First-Time
• Quality culture
• Process performance and capability
• Senior management commitment to quality
• CAPA effectiveness (retraining, preventive actions)
• Reliability of drug availability
• Unplanned/planned equipment/facility maintenance rate

8
Quality Metrics ProgramsIndicators of Maturity
• Identifying existing problems vs. predictive analytics
• Importance of quality culture
• What are useful product- and site-specific metrics?
• How committed is senior management to overall quality?
• How committed is the entire staff to quality culture?
• Does the program improve over time?

9
Why Quality Metrics?
Industry
• Enables continual improvement of process performance and product quality
• Supports continual improvement of the pharmaceutical quality system
• Important element of oversight and controls over the manufacture of drugs to ensure quality (section 501 FD&C Act)

10
Why Quality Metrics?
FDA• Additional insight into the state of quality for product
and facility
• More quantitative and objective measure of quality at the product, site, and system levels
• Enhance risk-based surveillance inspection scheduling model
• Improve effectiveness of inspections
• Help to identify factors leading to supply disruption
• Gain insights/trends regarding the state of quality across the pharmaceutical industry

11
Why Quality Metrics?
Patients
• More reliable patient access to important therapies
– Commitment to ongoing improvement by industry leads to more robust manufacturing processes
– Fewer recalls
– Fewer quality-related drug shortages

12
FDA’s Quality Metrics Journey: Where Have We Been?

13
Initial Draft
• Request for metrics data
• Product reports
• FDA would use the data to calculate metrics:– Lot Acceptance rate
– Product Quality Complaint rate
– Invalidated Out-of-Specification (OOS) rate
– Annual Product Review (APR) or Product Quality Review (PQR) On Time rate
• Public comment requested on several optional metrics– Senior management engagement
– CAPA effectiveness
– Process capability/performance

14
Initial Draft – Public Docket
• Significant comments received– Technical comments regarding proposed metrics
and definitions
– Concerns regarding burden of data collection/ formatting/submission
– Legal concerns regarding proposed mandatory program
– Suggestions to take a phased-in approach to allow learning by both industry and FDA
www.fda.gov

15
FDA’s Quality Metrics Journey: Where Are We Now?
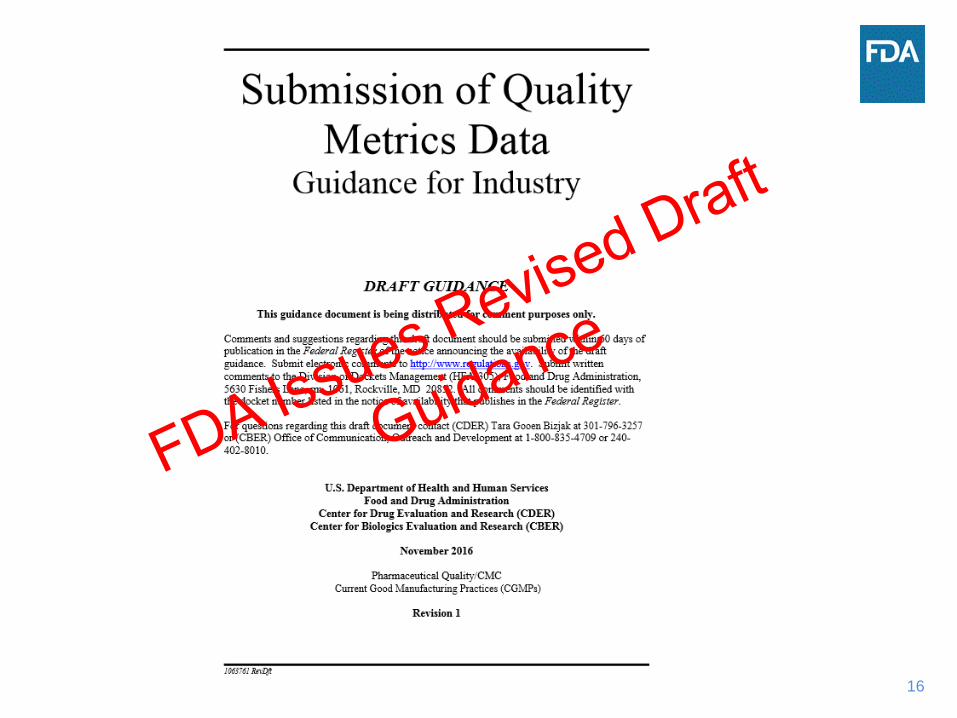
16

17
Product Quality
Complaints
Revised Draft – Key Features
• Mandatory → Initial Voluntary Phase
• Product- OR site-based reporting
• Limited set of 3 metrics related to batch manufacturing, laboratory robustness, and the voice of the patient or customer (quality complaints)
• Technical edits and examples
• Incentives for participation
Lot Acceptance
Rate
Invalidated OOS Rate

18
Submission of Information is Voluntary
• During the voluntary phase of the reporting program, FDA does not intend to require the submission of this information
• FDA does not intend to take enforcement action based on errors in a quality metrics data submission made during this voluntary phase of the reporting program, provided the submission is made in good faith

19
Voluntary vs. Mandatory
• Extent to which FDA can achieve its goals for the QM
program will be largely driven by the extent of
participation
– Large body of data is needed to draw the most meaningful
conclusions about the quality of a site or product
• Developed additional incentives for reporting

20
Benefits of Participation
• Opportunities for participants to provide feedback and additional comments, as well as share knowledge from ongoing, industry-driven quality metrics programs
• FDA working informally with establishments towards early resolution of potential quality problems
• Improved inspection effectiveness (e.g., more focused inspections)
• Enhance premarket and postmarket review program (e.g., consider use of calculated metrics as an element of the post-approval manufacturing change reporting program)
• Reduction in inspection frequency
• Inclusion on the Quality Metrics Reporters List

21
Want to know more?
For more details about the revised draft guidance including examples, please see:
CDER Small Business and Industry Assistance (CDER SBIA) Webinar - Revised Draft Guidance for Industry: Submission of Quality Metrics Data
https://www.fda.gov/Drugs/DevelopmentApprovalProcess/SmallBusinessAssistance/ucm530313.htm
www.fda.gov

22
FDA’s Quality Metrics Journey: Where Are We Going?

23
Vision Remains the Same
• Focus the use of resources on areas of highest risk to public health– Establish a signal detection program as one factor in
identifying establishments and products that may pose significant risk to consumers
– Identify situations in which there may be a risk for drug supply disruption
– Improve the effectiveness of establishment inspections
– Improve FDA’s evaluation of drug manufacturing and control operations

24
• Test and improve the electronic portal submission process• Incentives for establishments going “above and beyond”
– Additional opportunities for feedback from participating establishments
– Quality Metric Reporters List
– Enhance pre-market and post-market review program
– Reduction in inspection frequency based on reporting
• Improve and mature the program based on feedback and analytics– Publish summary of initial reports
• Ensure program supports, not deters, emerging technology
Quality Metrics in the Short Term

25
• Continuing discussions with external groups– Measuring and assessing quality culture
– Ongoing improvement in definitions and examples
– Continuing discussions with a range of industry groups/representatives• Non-application products
• Contract manufacturers
• Active ingredient manufacturers
– Evaluate additional sources of data to study quality metrics
Quality Metrics in the Short Term

26
Quality Metrics in the Long Term
• Predictive analytics– Correlation with FDA data (e.g., inspection outcomes, recalls,
FARs)
– Drug supply disruption
• Continue to recognize participating establishments– Quality Metric Reporters List (?)
– Enhance premarket and postmarket review program (e.g., post-marketing change reporting program)
– Potential reduction in inspection frequency based on data
• Continue to encourage emerging technology
• Other incentives?

27
Quality Metrics in the Long Term
• Voluntary reporting alone may not be sufficient to accomplish FDA’s goals for the program
• Greater net benefit for FDA and industry likely to result from a fully operational program
– Incorporate initial learnings
– Fuller participation
• Continuing to plan for notice and comment rulemaking

28
Summary
• Quality Metrics play an important role in the desired state of pharmaceutical quality and regulation –minimal but effective regulatory oversight that results in quality drugs available for patients
• Development of the FDA program is a journey that has reached an important next step
• In collaboration with participating industry stakeholders, we will incorporate learnings from this initial phase of the program to more fully realize the potential of quality metrics
29
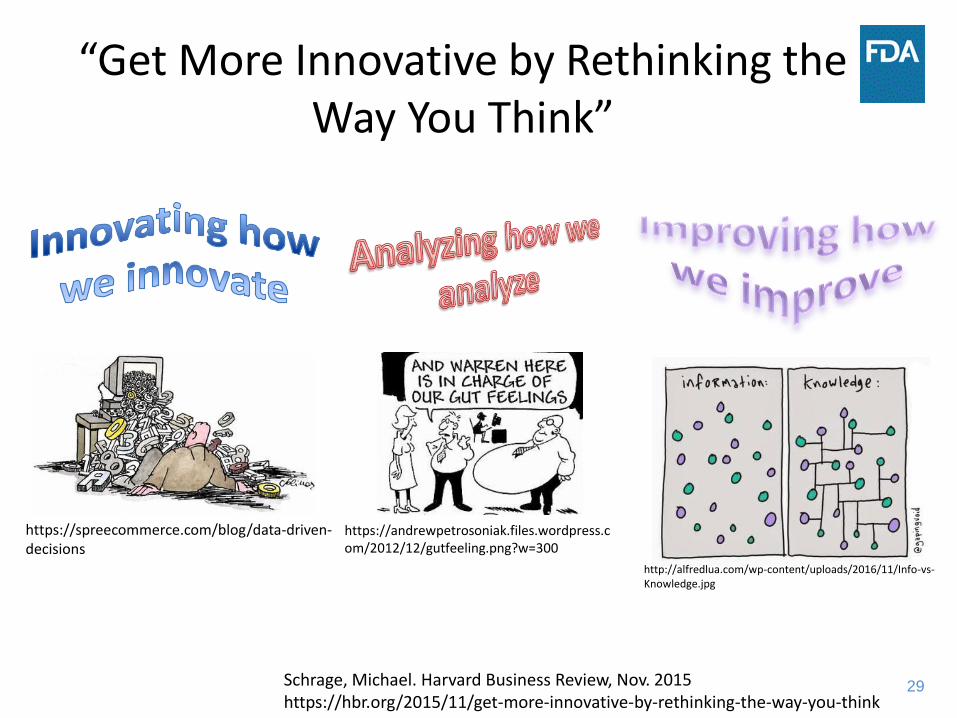
“Get More Innovative by Rethinking the Way You Think”
Schrage, Michael. Harvard Business Review, Nov. 2015https://hbr.org/2015/11/get-more-innovative-by-rethinking-the-way-you-think
https://spreecommerce.com/blog/data-driven-decisions
https://andrewpetrosoniak.files.wordpress.com/2012/12/gutfeeling.png?w=300
http://alfredlua.com/wp-content/uploads/2016/11/Info-vs-Knowledge.jpg

30
For more information or to contact OPQ:
Quality Metrics for Drug Manufacturinghttp://www.fda.gov/Drugs/DevelopmentApprovalProcess/Manufacturing/ucm526869.htm
Acknowledgements: Tara Gooen Bizjak, Ashley Boam, Alex Viehmann, Sarah Pope Miksinski
