update on texas demographic characteristics and trends...note: public includes individuals with...
TRANSCRIPT
Update on Texas
Demographic Characteristics and Trends
Texas Department of Insurance Texas Consumer Health
Assistance Program
January 26, 2012Austin, TX
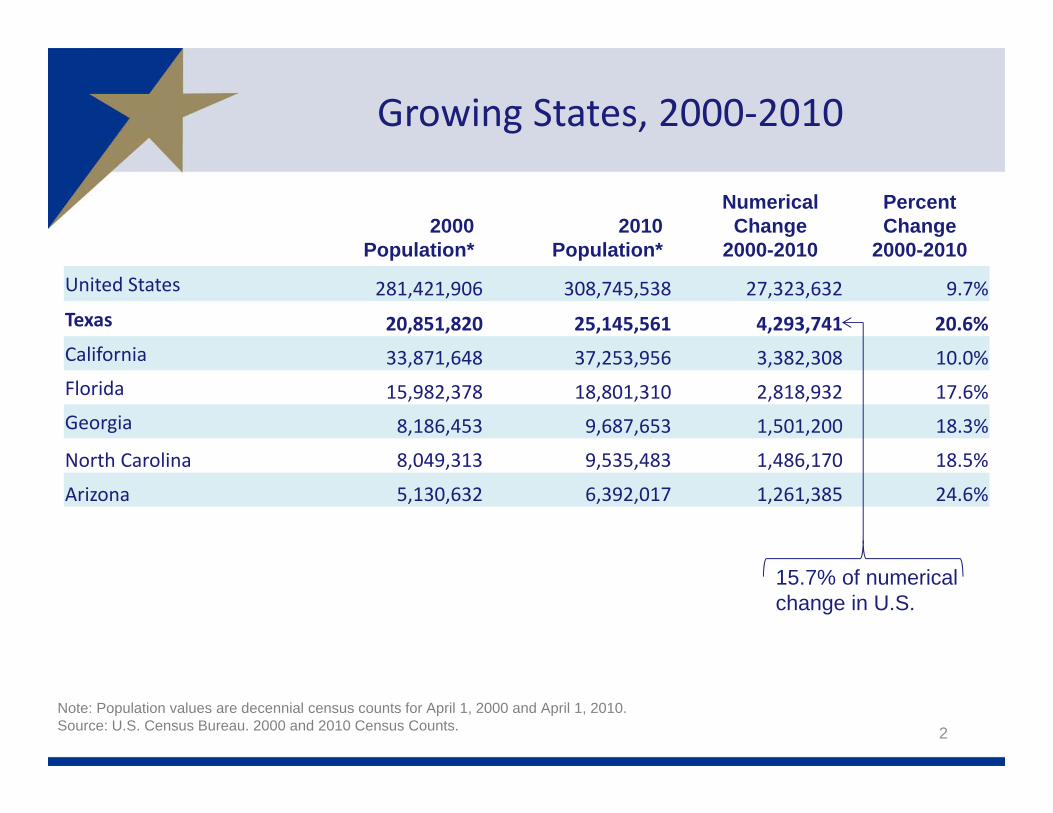
2000Population*
2010Population*
NumericalChange
2000-2010
PercentChange
2000-2010United States 281,421,906 308,745,538 27,323,632 9.7%Texas 20,851,820 25,145,561 4,293,741 20.6%California 33,871,648 37,253,956 3,382,308 10.0%Florida 15,982,378 18,801,310 2,818,932 17.6%Georgia 8,186,453 9,687,653 1,501,200 18.3%
North Carolina 8,049,313 9,535,483 1,486,170 18.5%
Arizona 5,130,632 6,392,017 1,261,385 24.6%
15.7% of numerical change in U.S.
Note: Population values are decennial census counts for April 1, 2000 and April 1, 2010.Source: U.S. Census Bureau. 2000 and 2010 Census Counts.
Growing States, 2000‐2010
2
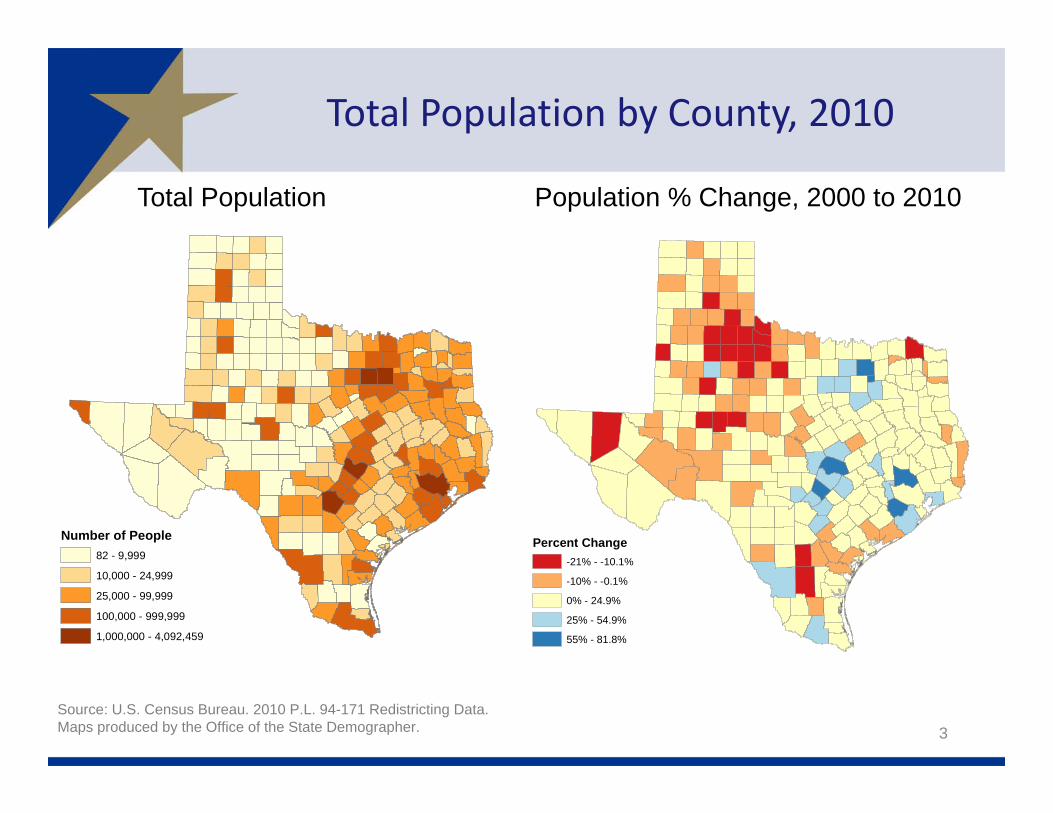
Percent Change-21% - -10.1%
-10% - -0.1%
0% - 24.9%
25% - 54.9%
55% - 81.8%
Number of People82 - 9,999
10,000 - 24,999
25,000 - 99,999
100,000 - 999,999
1,000,000 - 4,092,459
Total Population by County, 2010
3
Total Population Population % Change, 2000 to 2010
Source: U.S. Census Bureau. 2010 P.L. 94-171 Redistricting Data.Maps produced by the Office of the State Demographer.
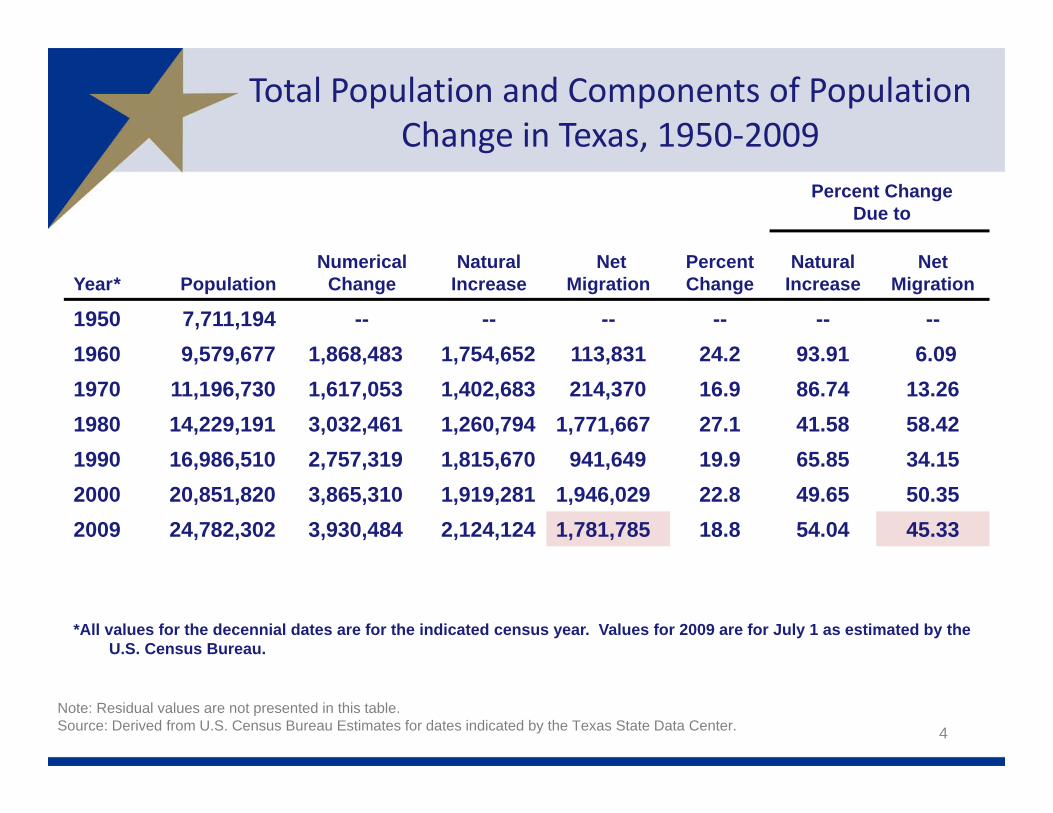
Percent ChangeDue to
Year* PopulationNumerical
ChangeNatural
IncreaseNet
MigrationPercentChange
NaturalIncrease
NetMigration
1950 7,711,194 -- -- -- -- -- --1960 9,579,677 1,868,483 1,754,652 113,831 24.2 93.91 6.091970 11,196,730 1,617,053 1,402,683 214,370 16.9 86.74 13.261980 14,229,191 3,032,461 1,260,794 1,771,667 27.1 41.58 58.421990 16,986,510 2,757,319 1,815,670 941,649 19.9 65.85 34.152000 20,851,820 3,865,310 1,919,281 1,946,029 22.8 49.65 50.352009 24,782,302 3,930,484 2,124,124 1,781,785 18.8 54.04 45.33
*All values for the decennial dates are for the indicated census year. Values for 2009 are for July 1 as estimated by the U.S. Census Bureau.
Note: Residual values are not presented in this table.Source: Derived from U.S. Census Bureau Estimates for dates indicated by the Texas State Data Center.
Total Population and Components of Population Change in Texas, 1950‐2009
4
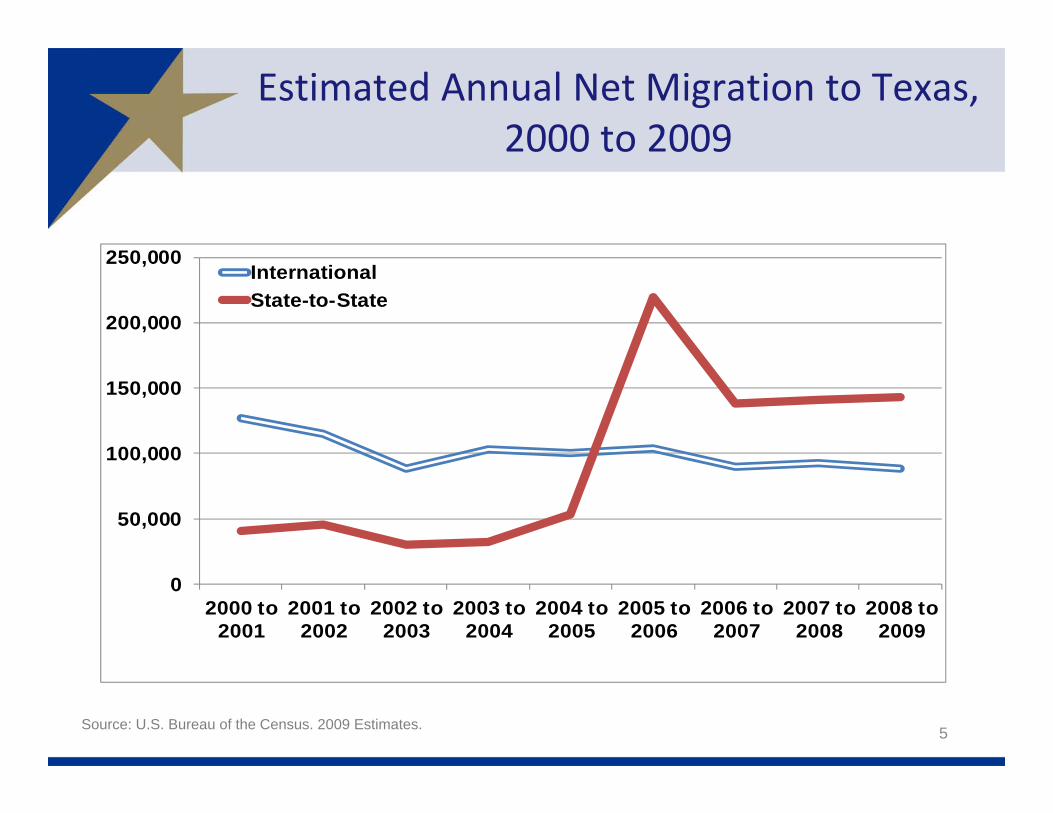
0
50,000
100,000
150,000
200,000
250,000
2000 to2001
2001 to2002
2002 to2003
2003 to2004
2004 to2005
2005 to2006
2006 to2007
2007 to2008
2008 to2009
InternationalState-to-State
Source: U.S. Bureau of the Census. 2009 Estimates.
Estimated Annual Net Migration to Texas, 2000 to 2009
5

Percent of Migrants to Texas by Race and Ethnicity, 2000‐2009
44%24%
33%
28%50% 40%
23%8% 15%
5%18% 12%
0%10%20%30%40%50%60%70%80%90%100%
Net domesticmigration
Internationalmigration
Total
OtherBlackHispanicWhite
67% of all migrants
6Sources: Percentages of domestic and international migrants by race and ethnicity derived from the 2006-2008 American Community Survey. Total numbers of domestic and international migrants between 2000-2009 are from Table 4. Cumulative Estimates of the Components of Resident Population Change for the United States, Regions, States, and Puerto Rico: April 1, 2000 to July 1, 2009, U.S. Census Bureau.
(848,702 migrants ) (933,083 migrants)
52% of all migrants were international
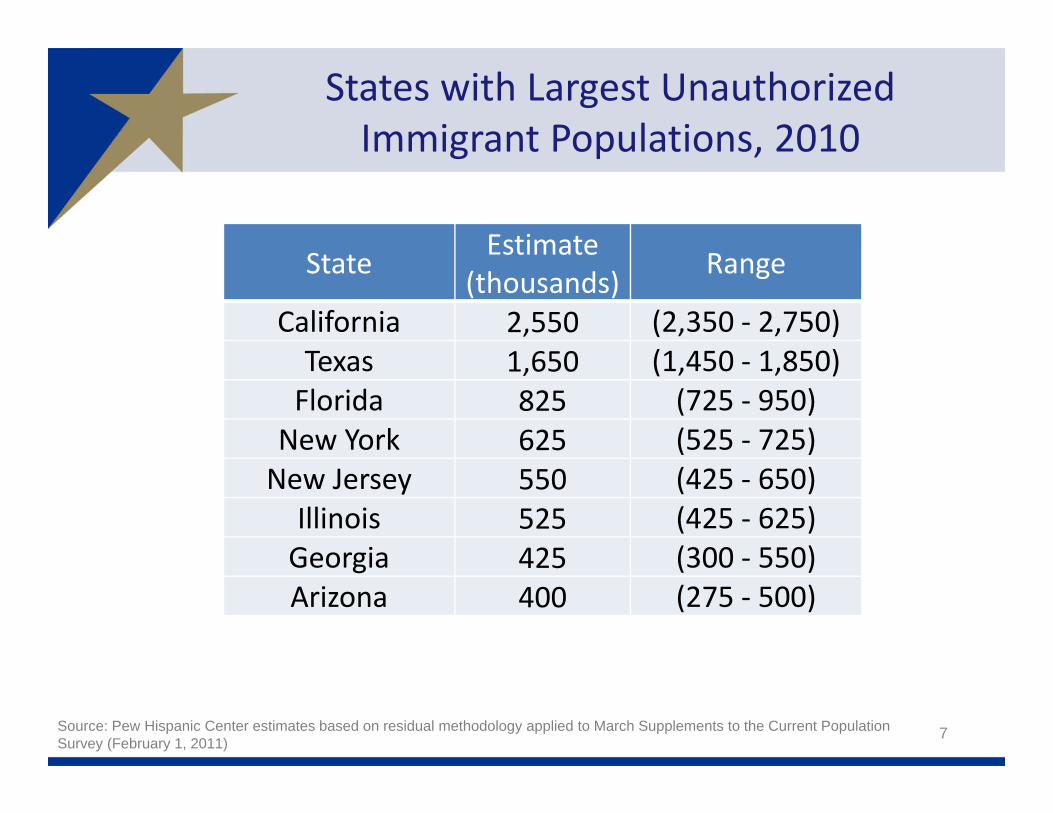
States with Largest Unauthorized Immigrant Populations, 2010
7
State Estimate (thousands) Range
California 2,550 (2,350 ‐ 2,750) Texas 1,650 (1,450 ‐ 1,850) Florida 825 (725 ‐ 950)
New York 625 (525 ‐ 725) New Jersey 550 (425 ‐ 650) Illinois 525 (425 ‐ 625) Georgia 425 (300 ‐ 550) Arizona 400 (275 ‐ 500)
Source: Pew Hispanic Center estimates based on residual methodology applied to March Supplements to the Current Population Survey (February 1, 2011)
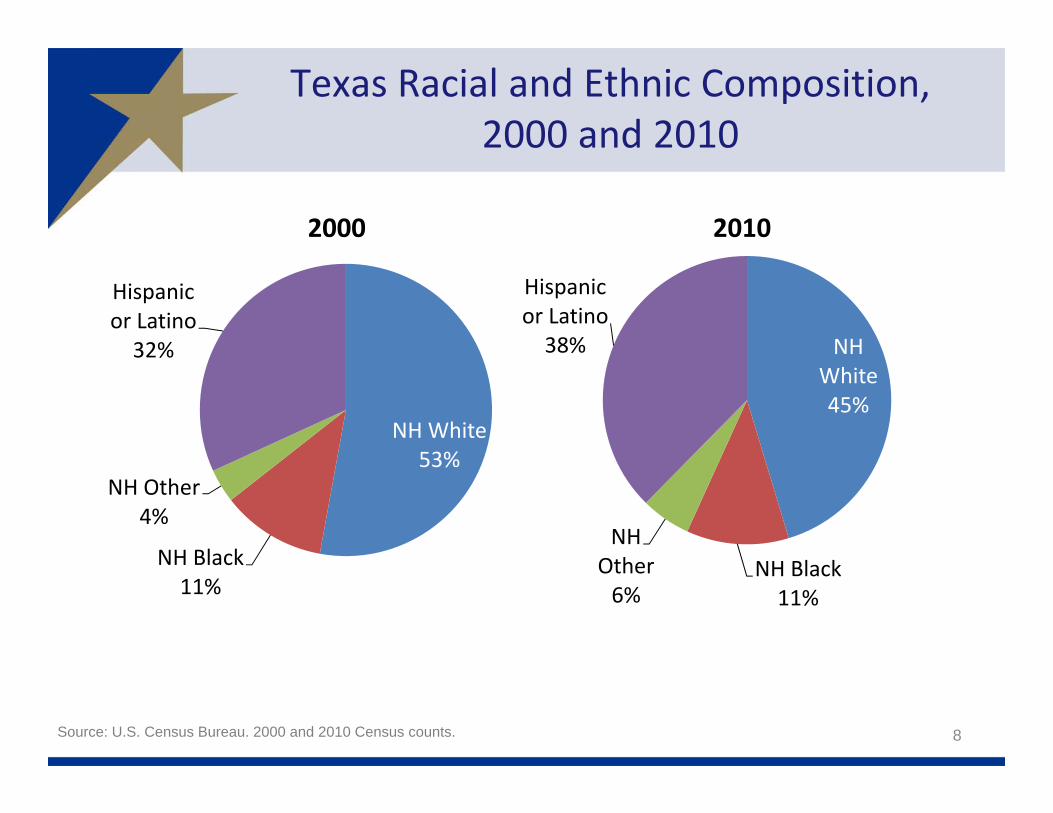
Texas Racial and Ethnic Composition, 2000 and 2010
NH White53%
NH Black11%
NH Other4%
Hispanic or Latino32%
2000
NH White45%
NH Black11%
NH Other6%
Hispanic or Latino38%
2010
Source: U.S. Census Bureau. 2000 and 2010 Census counts. 8
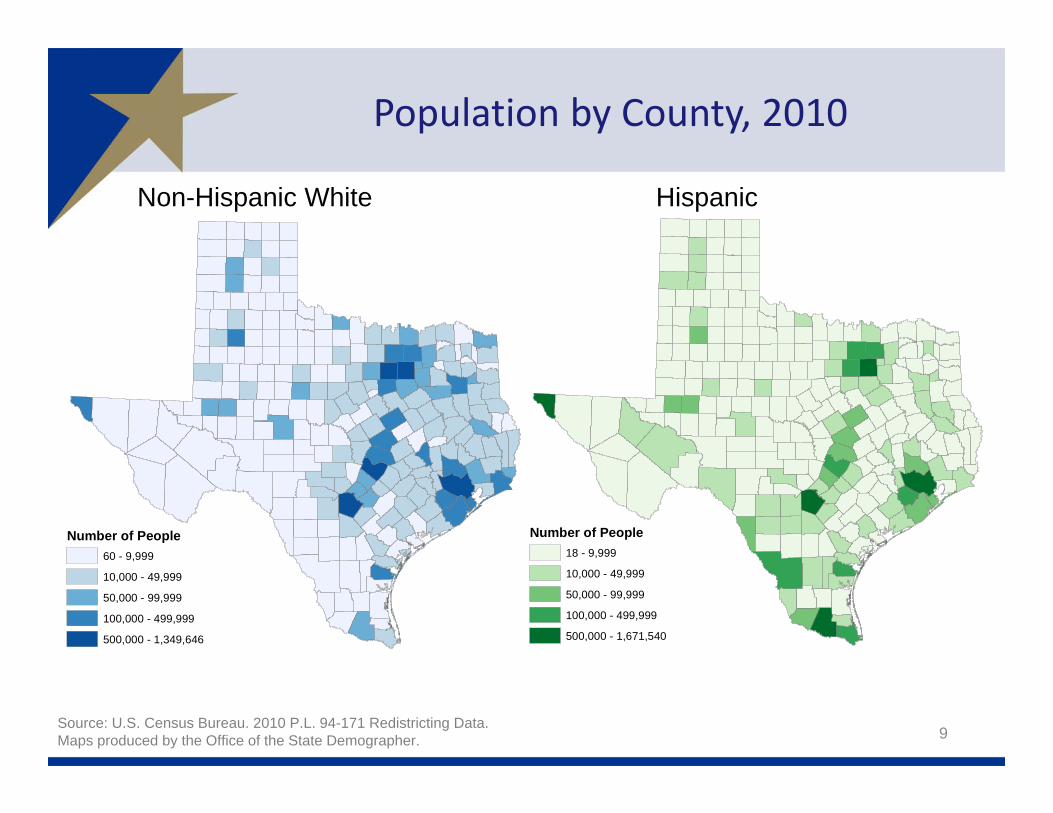
Number of People60 - 9,999
10,000 - 49,999
50,000 - 99,999
100,000 - 499,999
500,000 - 1,349,646
Population by County, 2010
9
Non-Hispanic White Hispanic
Number of People18 - 9,999
10,000 - 49,999
50,000 - 99,999
100,000 - 499,999
500,000 - 1,671,540
Source: U.S. Census Bureau. 2010 P.L. 94-171 Redistricting Data.Maps produced by the Office of the State Demographer.
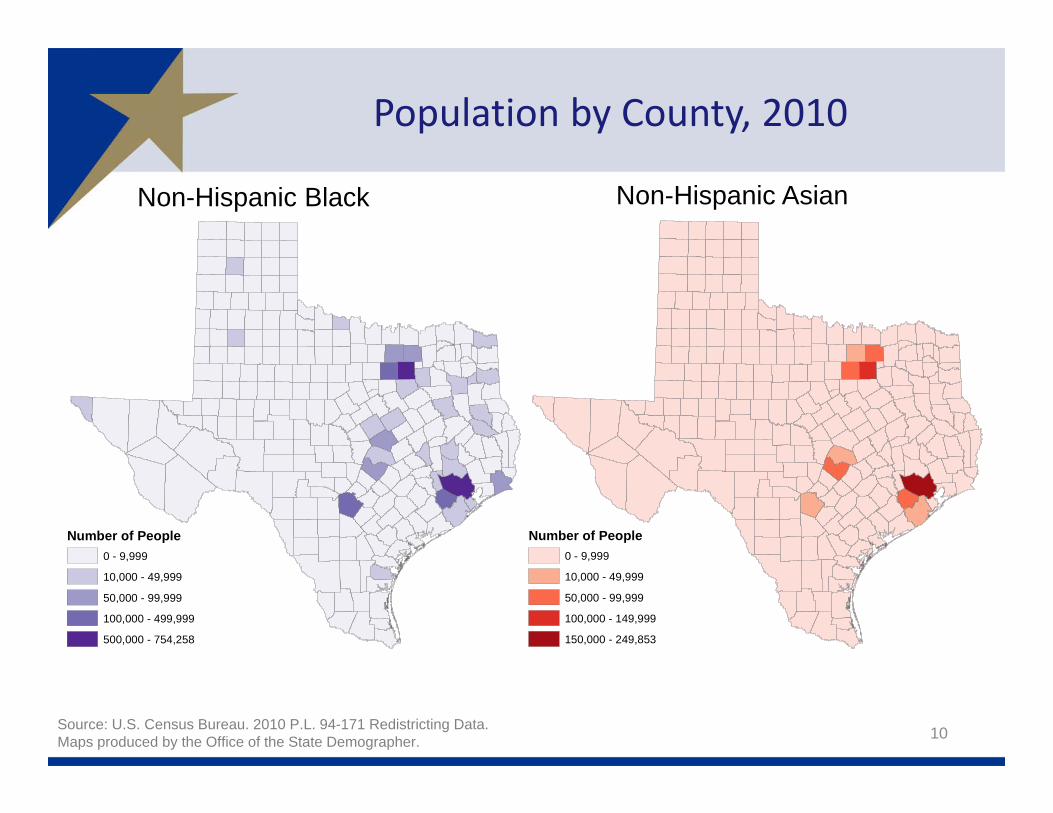
Number of People0 - 9,999
10,000 - 49,999
50,000 - 99,999
100,000 - 499,999
500,000 - 754,258
Population by County, 2010
10
Non-Hispanic Black Non-Hispanic Asian
Number of People0 - 9,999
10,000 - 49,999
50,000 - 99,999
100,000 - 149,999
150,000 - 249,853
Source: U.S. Census Bureau. 2010 P.L. 94-171 Redistricting Data.Maps produced by the Office of the State Demographer.
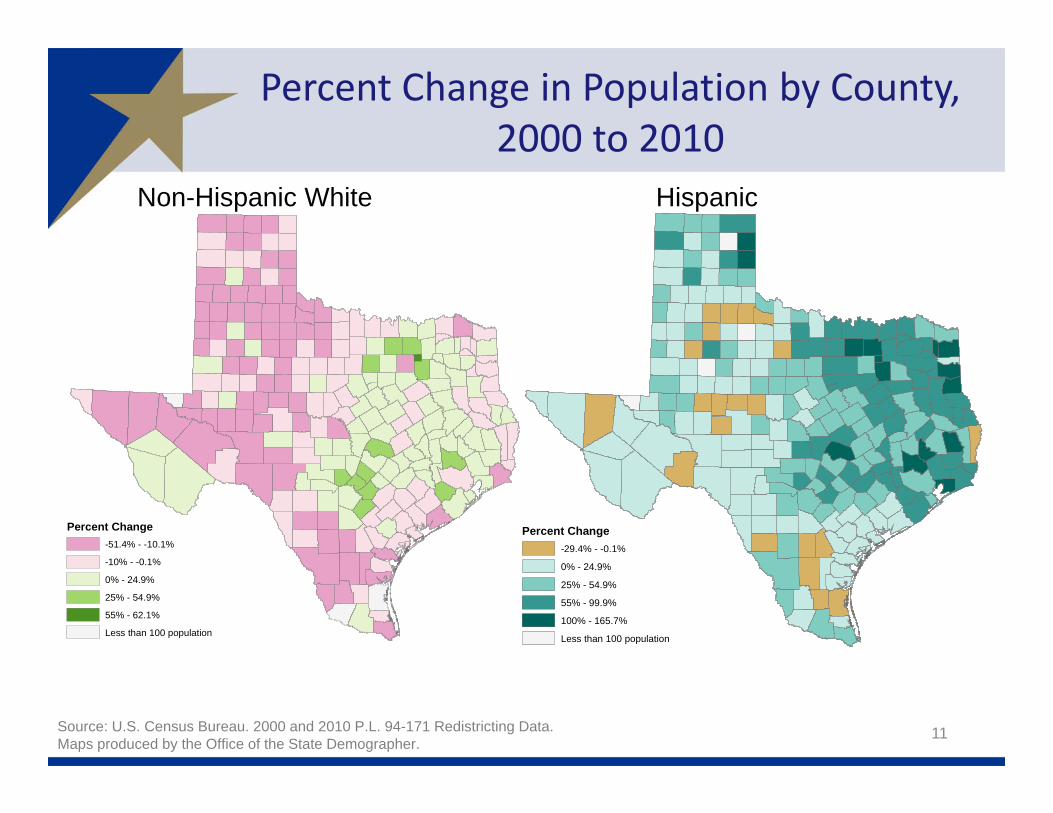
Percent Change-51.4% - -10.1%
-10% - -0.1%
0% - 24.9%
25% - 54.9%
55% - 62.1%
Less than 100 population
Percent Change in Population by County, 2000 to 2010
11
Non-Hispanic White Hispanic
Percent Change-29.4% - -0.1%
0% - 24.9%
25% - 54.9%
55% - 99.9%
100% - 165.7%
Less than 100 population
Source: U.S. Census Bureau. 2000 and 2010 P.L. 94-171 Redistricting Data.Maps produced by the Office of the State Demographer.

Percent Change-49% - -10.1%
-10% - -0.1%
0% - 24.9%
25% - 74.9%
75% - 3000%
Less than 100 population
Percent Change in Population by County, 2000 to 2010
12
Non-Hispanic Black Non-Hispanic Asian
Percent Change-27.9% - -10.1%
-10% - -0.1%
0% - 24.9%
25% - 54.9%
55% - 697%
less than 100 population
Source: U.S. Census Bureau. 2000 and 2010 P.L. 94-171 Redistricting Data.Maps produced by the Office of the State Demographer.
0%
10%
20%
30%
40%
50%
60%
70%
2000
2002
2004
2006
2008
2010
2012
2014
2016
2018
2020
2022
2024
2026
2028
2030
2032
2034
2036
2038
2040
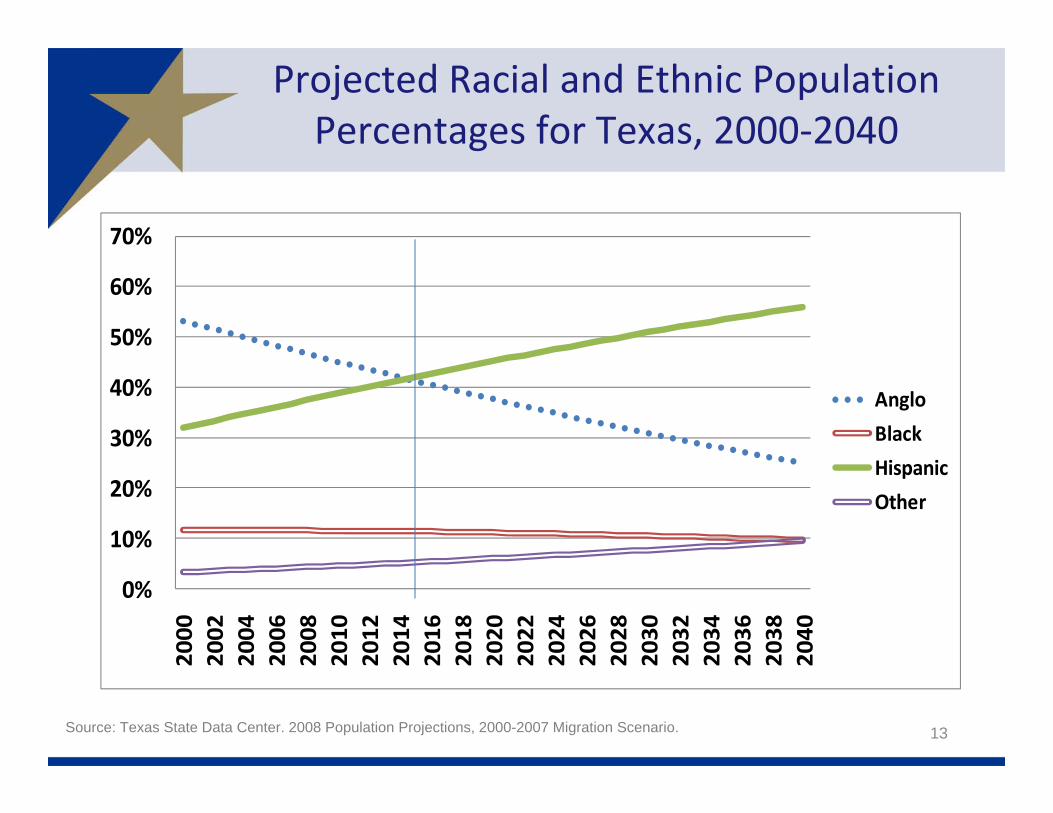
AngloBlackHispanicOther
Source: Texas State Data Center. 2008 Population Projections, 2000-2007 Migration Scenario. 13
Projected Racial and Ethnic Population Percentages for Texas, 2000‐2040
14
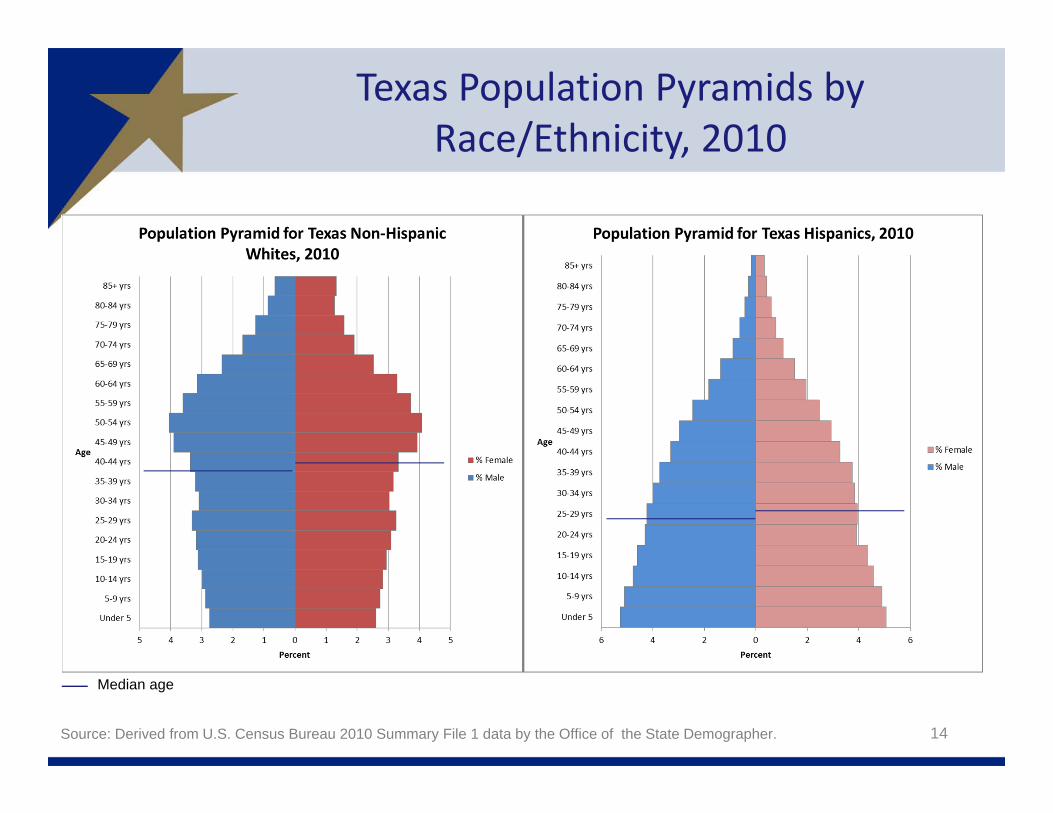
Texas Population Pyramids by Race/Ethnicity, 2010
Median age
Source: Derived from U.S. Census Bureau 2010 Summary File 1 data by the Office of the State Demographer.
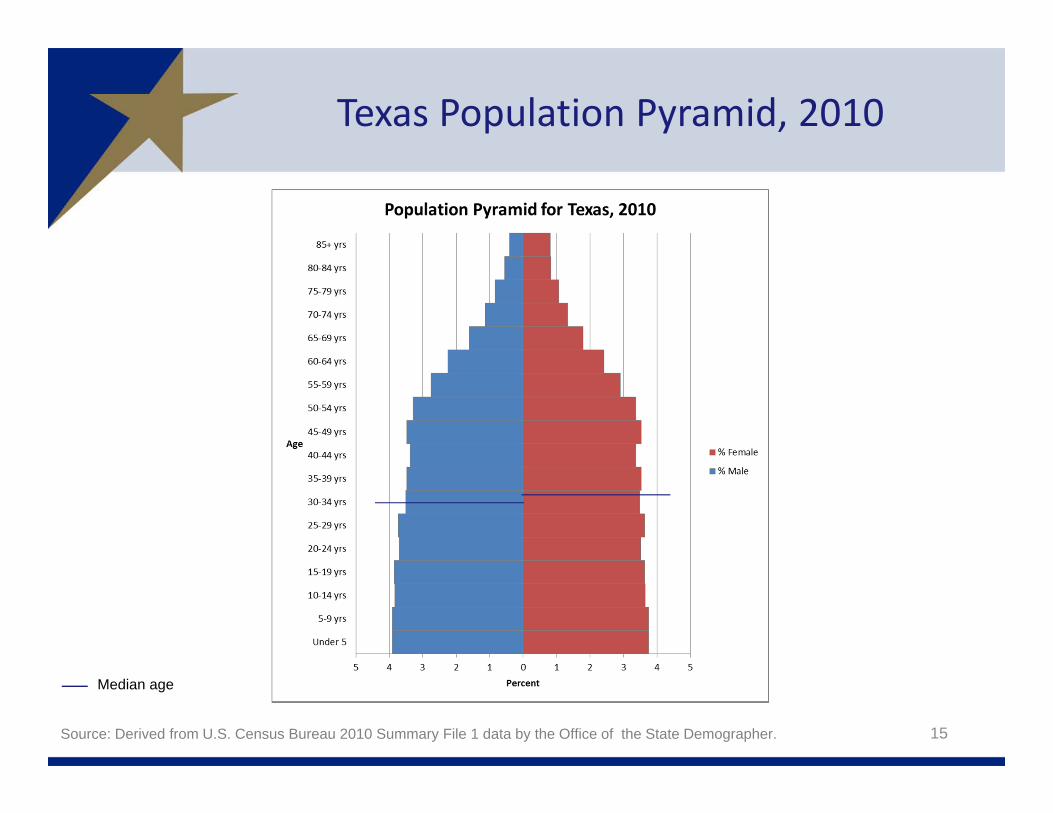
Texas Population Pyramid, 2010
15Source: Derived from U.S. Census Bureau 2010 Summary File 1 data by the Office of the State Demographer.
Median age
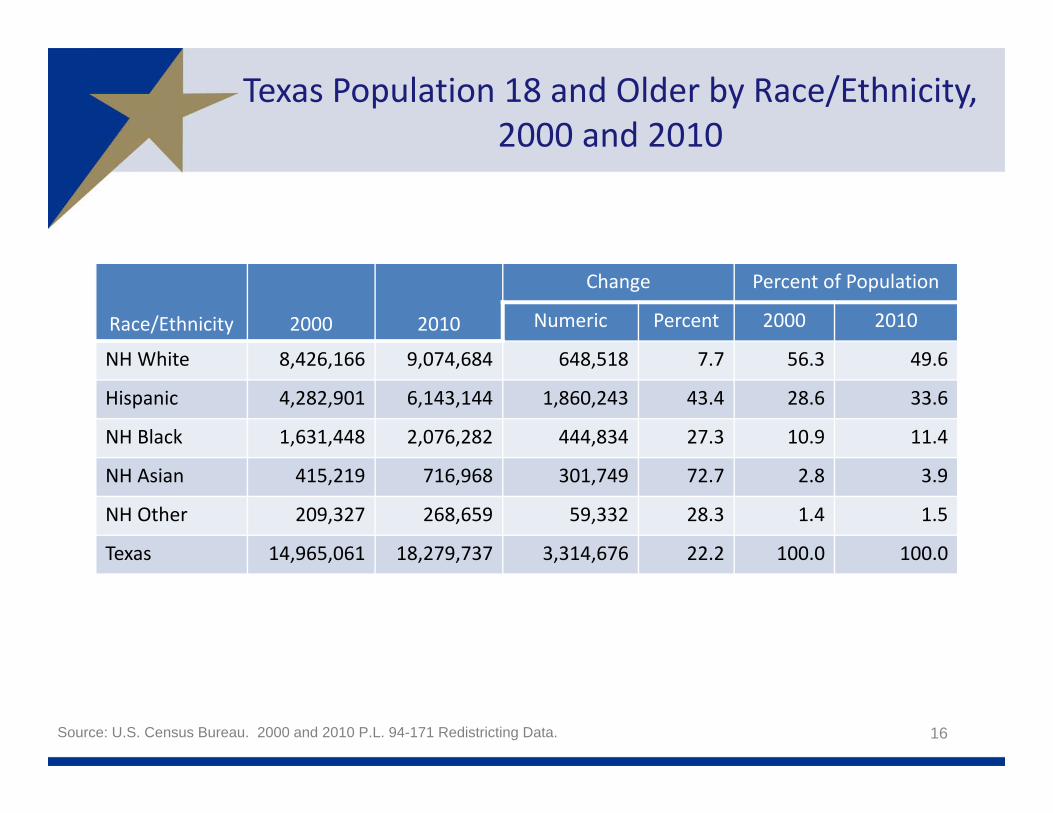
Texas Population 18 and Older by Race/Ethnicity, 2000 and 2010
16
Race/Ethnicity 2000 2010
Change Percent of Population
Numeric Percent 2000 2010
NH White 8,426,166 9,074,684 648,518 7.7 56.3 49.6
Hispanic 4,282,901 6,143,144 1,860,243 43.4 28.6 33.6
NH Black 1,631,448 2,076,282 444,834 27.3 10.9 11.4
NH Asian 415,219 716,968 301,749 72.7 2.8 3.9
NH Other 209,327 268,659 59,332 28.3 1.4 1.5
Texas 14,965,061 18,279,737 3,314,676 22.2 100.0 100.0
Source: U.S. Census Bureau. 2000 and 2010 P.L. 94-171 Redistricting Data.

Texas Population Under 18 by Race/Ethnicity, 2000 and 2010
Race/Ethnicity 2000 2010
Change Percent of Population
Numeric Percent 2000 2010
NH White 2,507,147 2,322,661 ‐184,486 ‐7.4 42.6 33.8
Hispanic 2,386,765 3,317,777 931,012 39.0 40.5 48.3
NH Black 732,807 810,543 77,736 10.6 12.5 11.8
NH Asian 139,226 231,458 92,232 66.3 2.4 3.4
NH Other 120,814 183,385 62,571 51.8 2.0 2.7
Texas 5,886,759 6,865,824 979,065 16.6 100.0 100.0
17Source: U.S. Census Bureau. 2000 and 2010 P.L. 94-171 Redistricting Data.

Percent of Texas Population by Age Group and Race/Ethnicity, 2010
18
0.0%
10.0%
20.0%
30.0%
40.0%
50.0%
60.0%
70.0%
80.0%
NH White Hispanic
Source: U.S. Census Bureau. 2010 Summary File 1 Data.
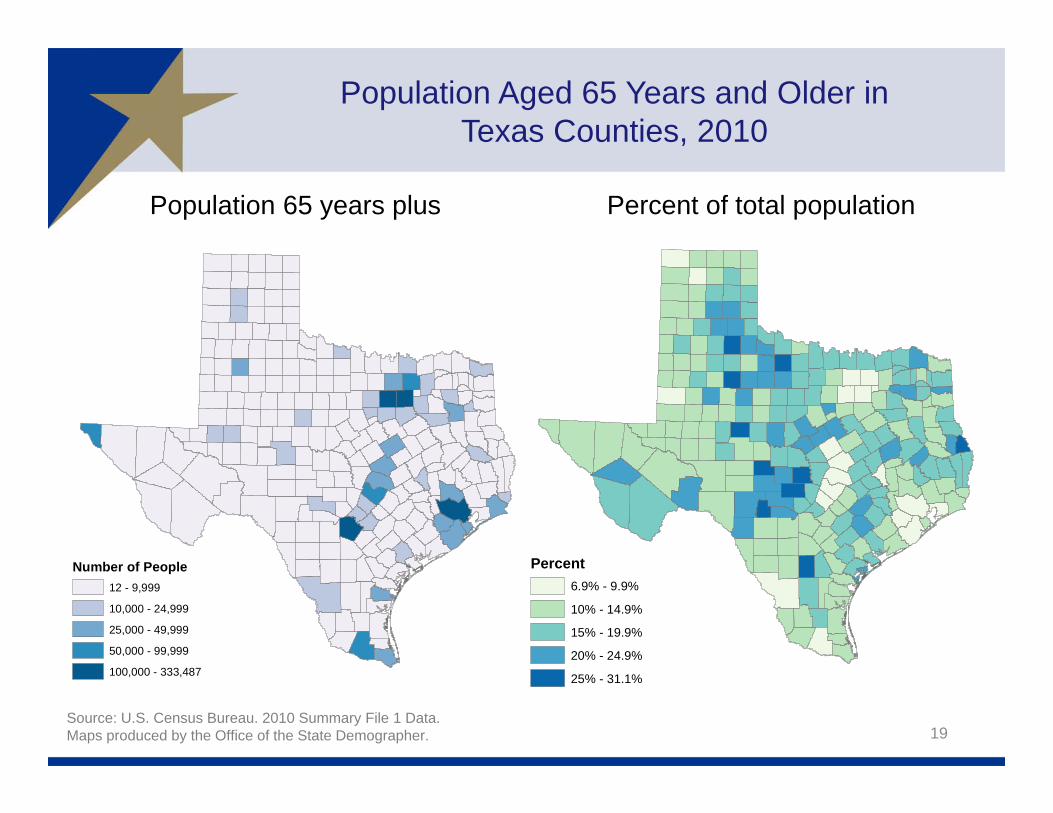
Number of People12 - 9,999
10,000 - 24,999
25,000 - 49,999
50,000 - 99,999
100,000 - 333,487
Percent6.9% - 9.9%
10% - 14.9%
15% - 19.9%
20% - 24.9%
25% - 31.1%
19
Percent of total populationPopulation 65 years plus
Source: U.S. Census Bureau. 2010 Summary File 1 Data.Maps produced by the Office of the State Demographer.
Population Aged 65 Years and Older in Texas Counties, 2010
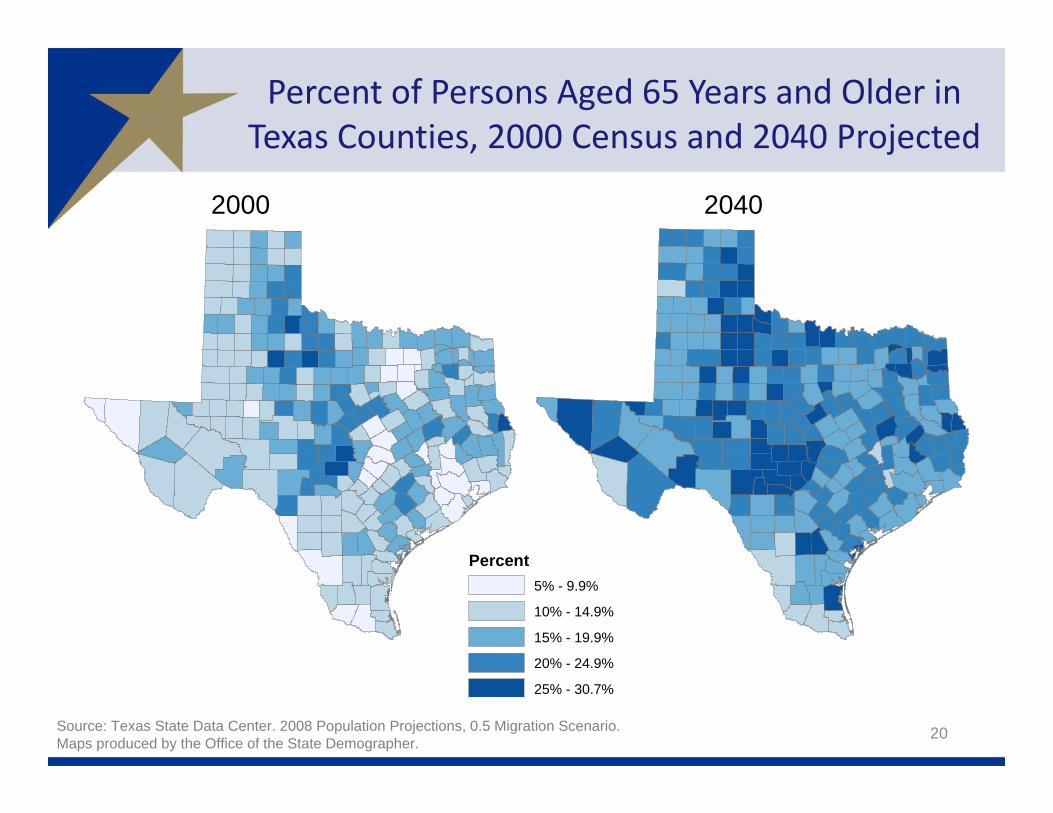
Percent of Persons Aged 65 Years and Older in Texas Counties, 2000 Census and 2040 Projected
2000 2040
20
Percent5% - 9.9%
10% - 14.9%
15% - 19.9%
20% - 24.9%
25% - 30.7%
Source: Texas State Data Center. 2008 Population Projections, 0.5 Migration Scenario.Maps produced by the Office of the State Demographer.
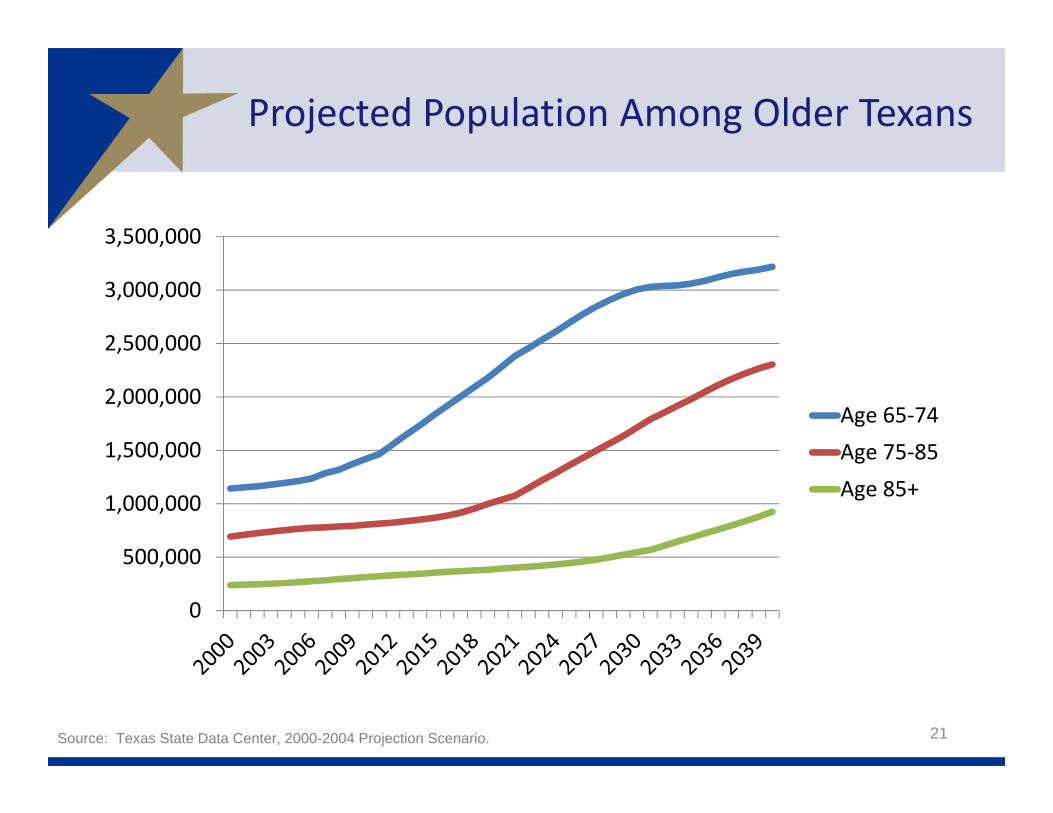
Projected Population Among Older Texans
0
500,000
1,000,000
1,500,000
2,000,000
2,500,000
3,000,000
3,500,000
Age 65‐74Age 75‐85Age 85+
21Source: Texas State Data Center, 2000-2004 Projection Scenario.
0.00
10.00
20.00
30.00
40.00
50.00
60.00
70.00
80.00
2000 2010 2020 2030 2040
Anglo
Hispanic
African American
Other
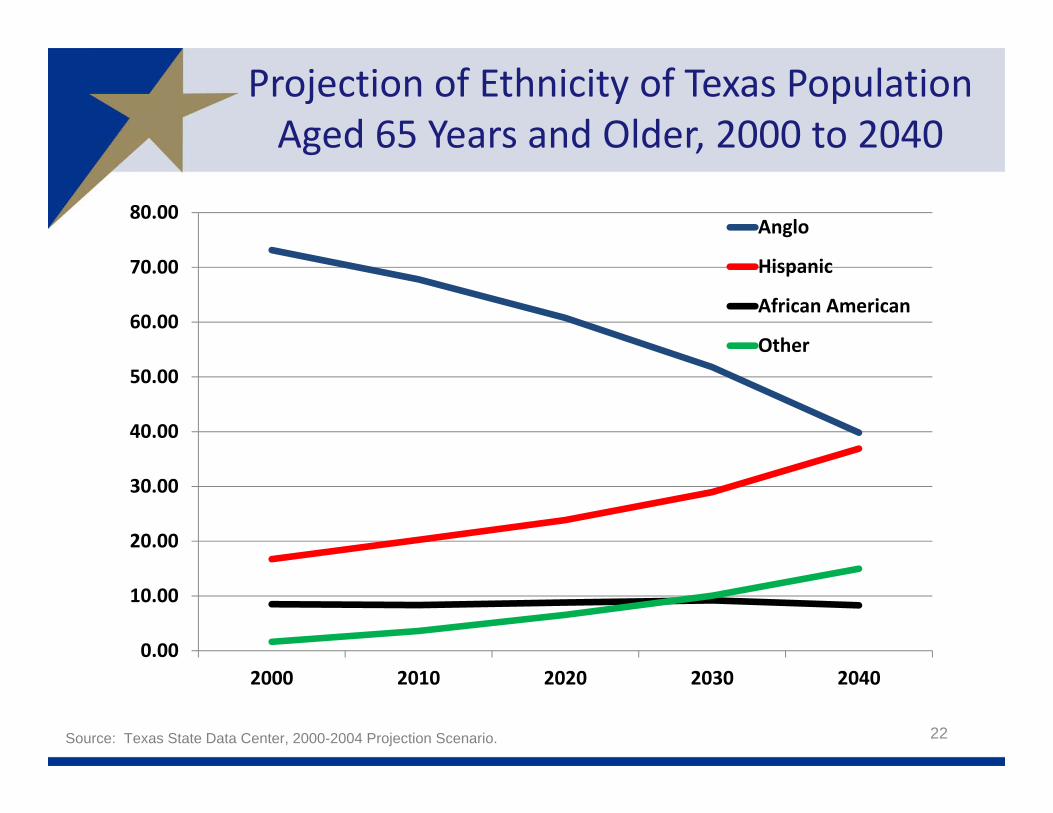
Projection of Ethnicity of Texas PopulationAged 65 Years and Older, 2000 to 2040
Source: Texas State Data Center, 2000-2004 Projection Scenario. 22

Note: Public includes individuals with public only and those with public plus private insurance. Private includes individuals who only have private insurance.Source: American Community Survey, 2010 PUMS data
Percent Health Insurance Coverage by Race/Ethnicityand Type of Insurance, 2010
23
14
23
37
202625
32 29
15
22
61
45
34
66
52
0
10
20
30
40
50
60
70
White Black Hispanic Asian Other
None Public Private

Percent Health Insurance Coverage By Immigrant Status & Type of Insurance, 2010
24
19
29
52
2723
50
62
11
26
0
10
20
30
40
50
60
70
None Public Private
Native Naturalized Non‐CitizenNote: Public includes individuals with public only and those with public plus private insurance. Private includes individuals who only have private insurance.Source: American Community Survey, 2010 PUMS data
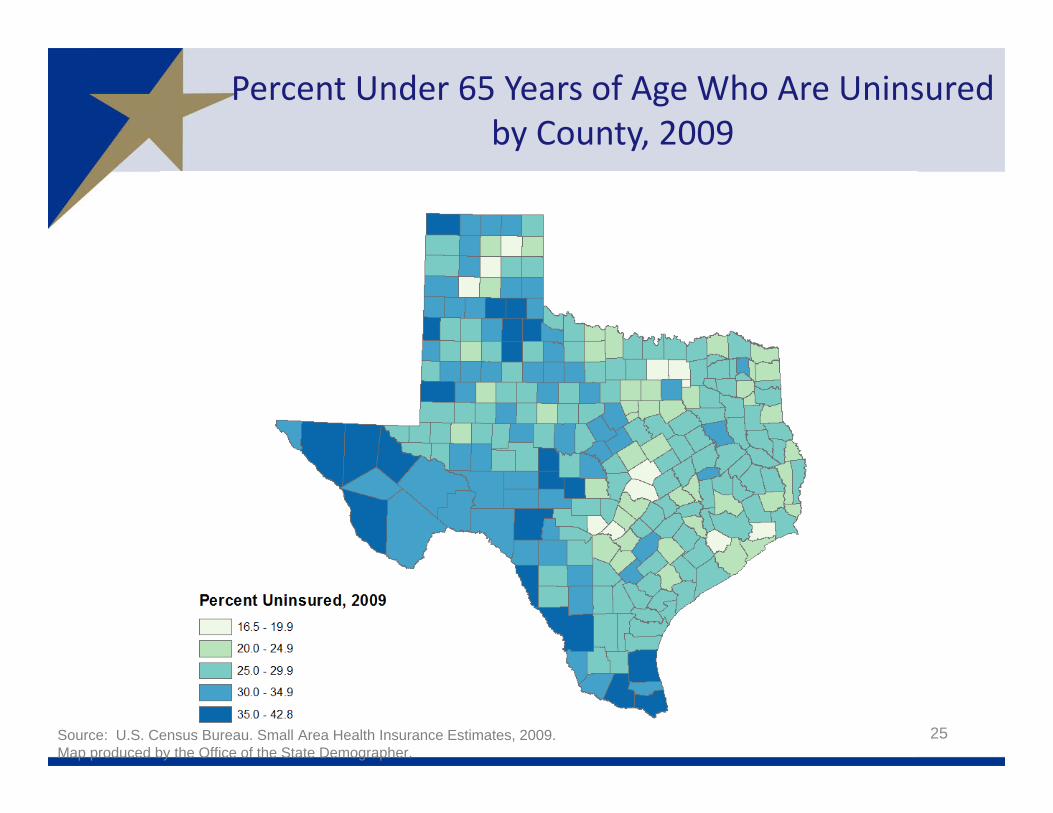
Percent Under 65 Years of Age Who Are Uninsured by County, 2009
25Source: U.S. Census Bureau. Small Area Health Insurance Estimates, 2009.Map produced by the Office of the State Demographer.
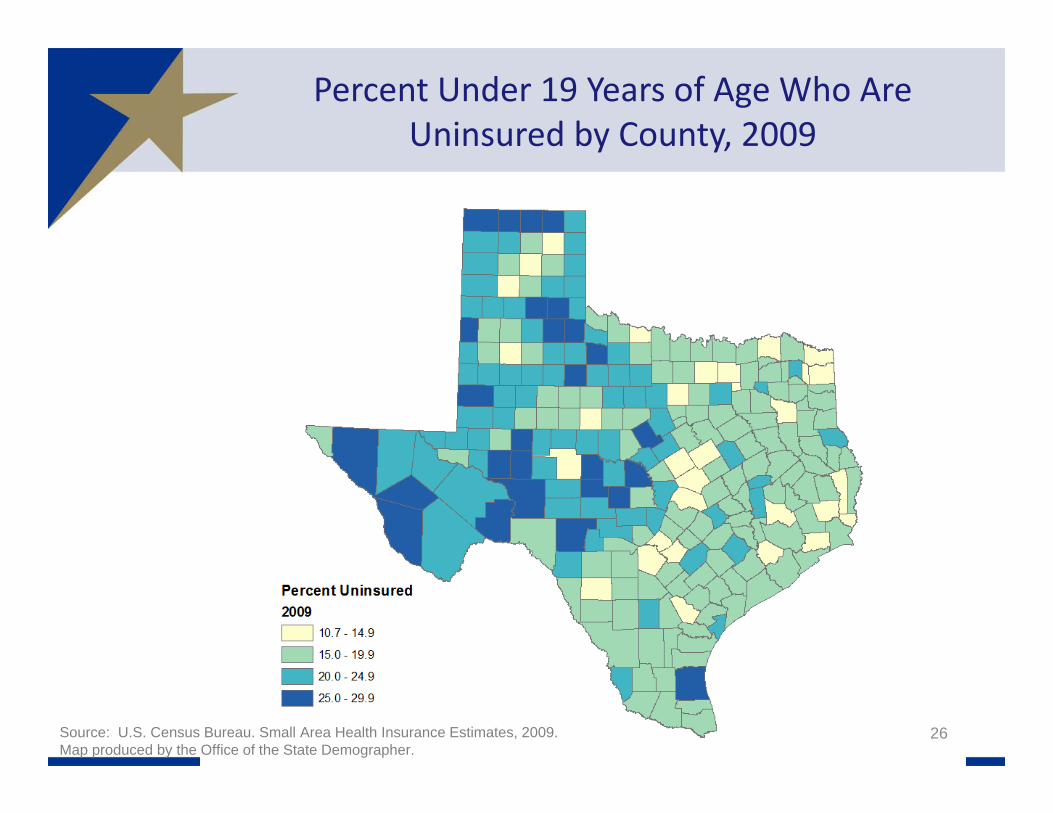
Percent Under 19 Years of Age Who Are Uninsured by County, 2009
26Source: U.S. Census Bureau. Small Area Health Insurance Estimates, 2009.Map produced by the Office of the State Demographer.
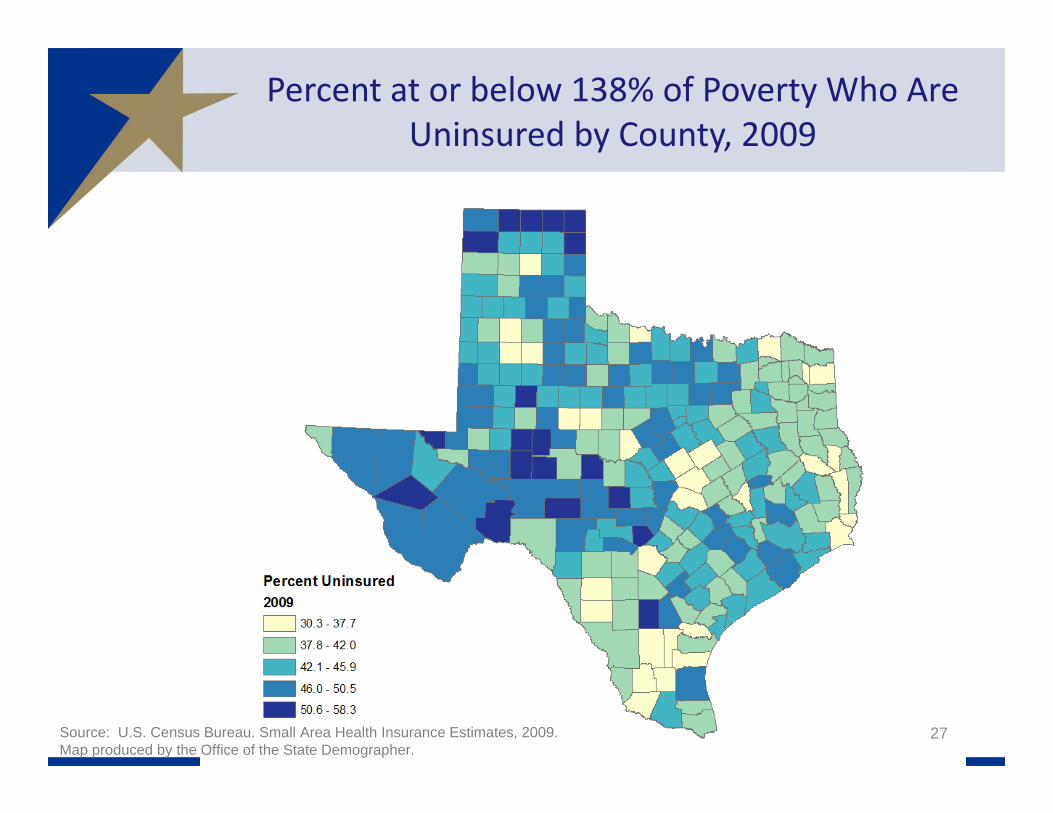
Percent at or below 138% of Poverty Who Are Uninsured by County, 2009
27Source: U.S. Census Bureau. Small Area Health Insurance Estimates, 2009.Map produced by the Office of the State Demographer.
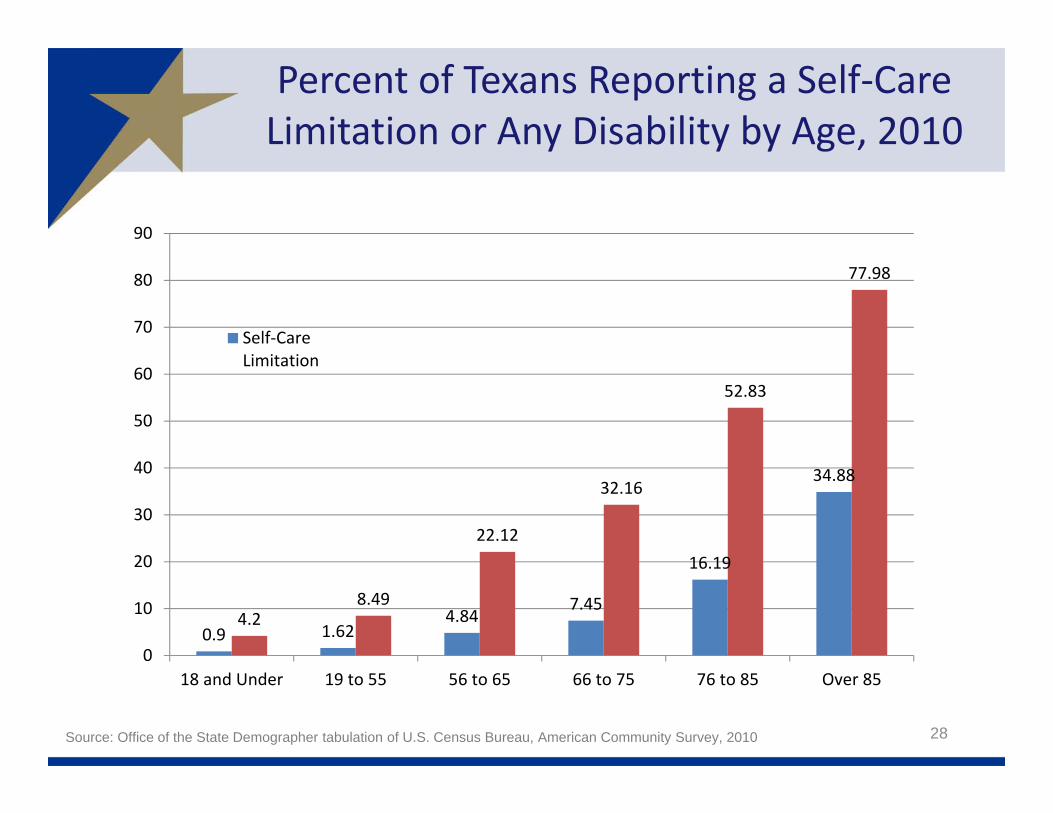
Percent of Texans Reporting a Self‐CareLimitation or Any Disability by Age, 2010
Source: Office of the State Demographer tabulation of U.S. Census Bureau, American Community Survey, 2010 28
0.9 1.624.84
7.45
16.19
34.88
4.28.49
22.12
32.16
52.83
77.98
0
10
20
30
40
50
60
70
80
90
18 and Under 19 to 55 56 to 65 66 to 75 76 to 85 Over 85
Self‐CareLimitation
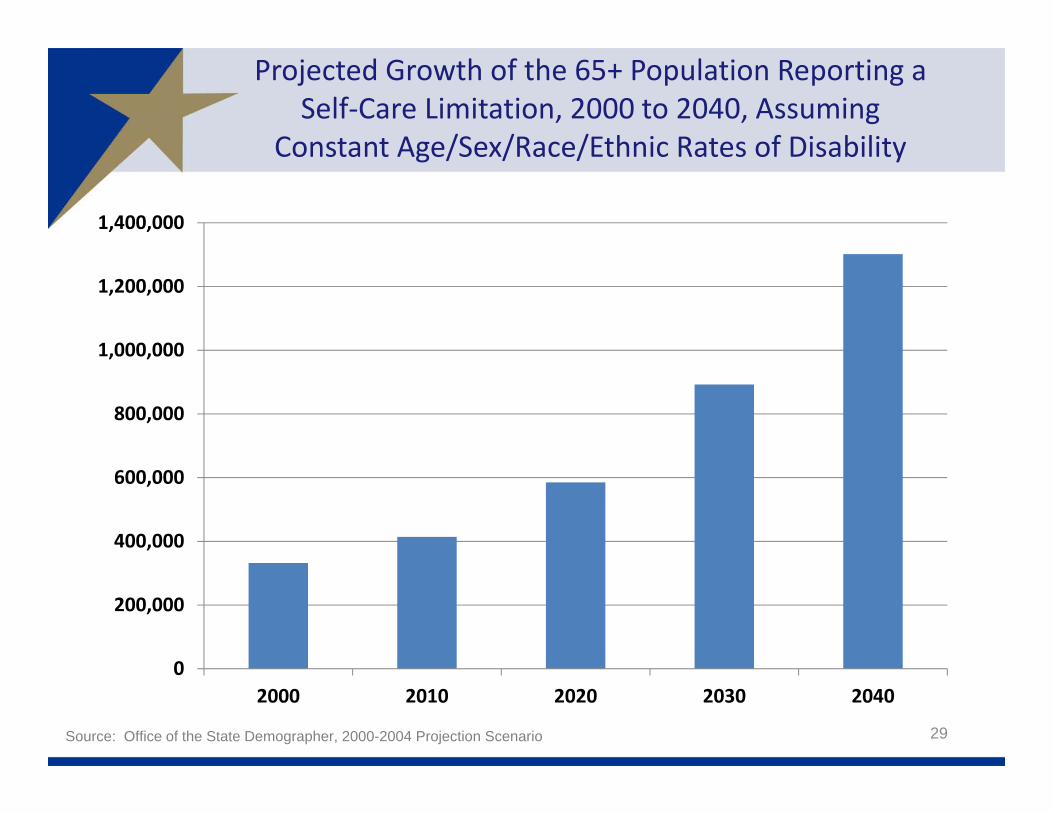
Projected Growth of the 65+ Population Reporting aSelf‐Care Limitation, 2000 to 2040, Assuming
Constant Age/Sex/Race/Ethnic Rates of Disability
29
0
200,000
400,000
600,000
800,000
1,000,000
1,200,000
1,400,000
2000 2010 2020 2030 2040
Source: Office of the State Demographer, 2000-2004 Projection Scenario

Projected Increase in Obesity in Texas by Ethnicity, 2006 to 2040
30Source: Office of the State Demographer using 2006 Texas State Data Center Population Projections, 2000-2004 Migration Scenario
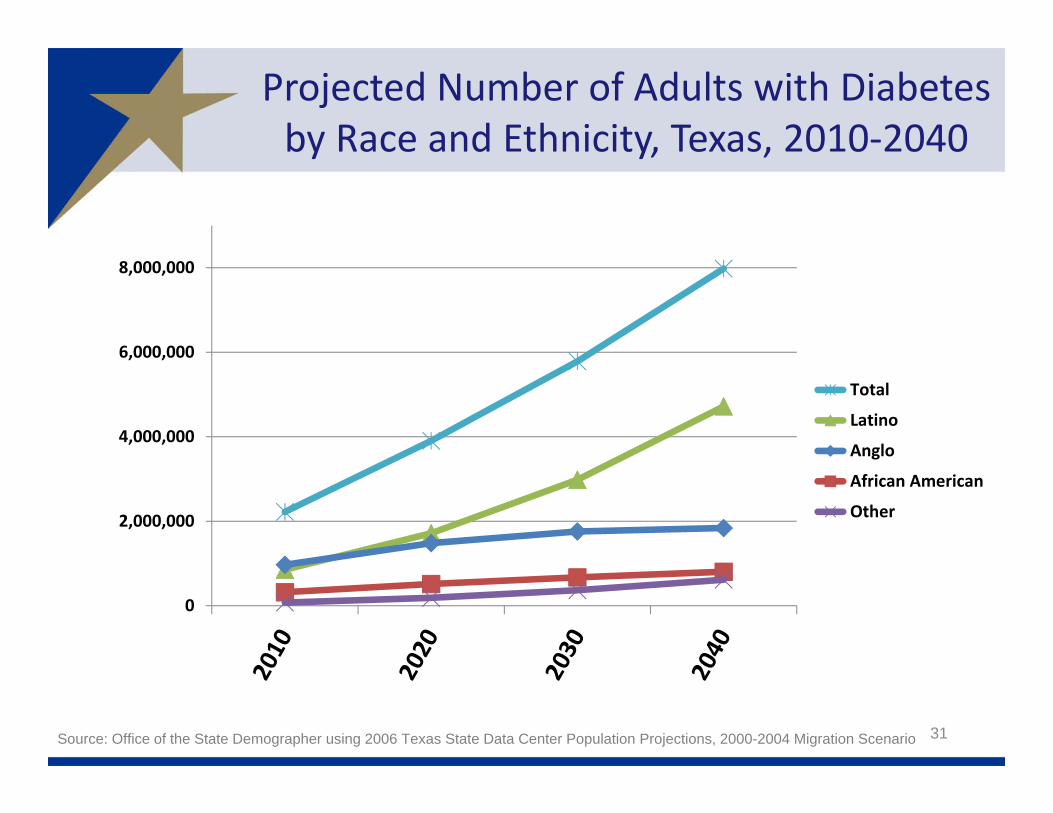
Projected Number of Adults with Diabetes by Race and Ethnicity, Texas, 2010‐2040
31
0
2,000,000
4,000,000
6,000,000
8,000,000
Total
Latino
Anglo
African American
Other
Source: Office of the State Demographer using 2006 Texas State Data Center Population Projections, 2000-2004 Migration Scenario

Projected Percent of the Adult Population with Diabetes by County, 2010 and 2040
32
LE 15%
15-20%
20-25%
25-30%
30-37.5%
2010 2040
Source: Office of the State Demographer using 2006 Texas State Data Center Population Projections, 2000-2004 Migration Scenario
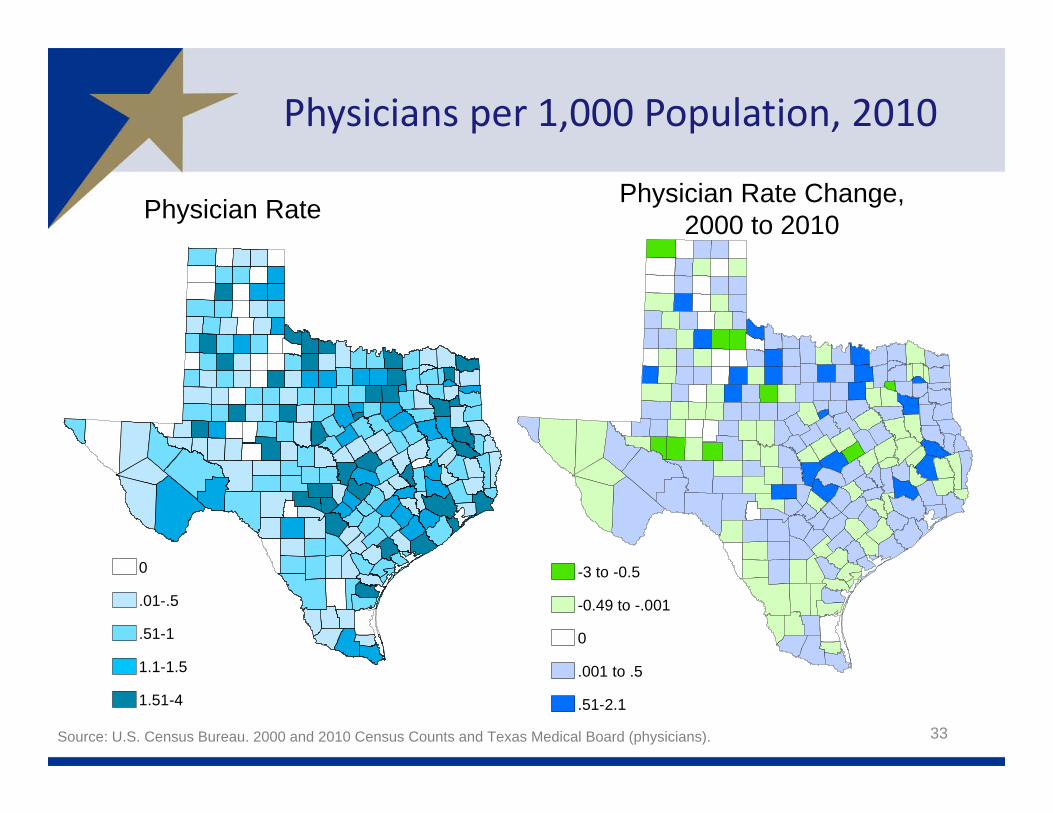
Physicians per 1,000 Population, 2010
33
0
.01-.5
.51-1
1.1-1.5
1.51-4
Source: U.S. Census Bureau. 2000 and 2010 Census Counts and Texas Medical Board (physicians).
-3 to -0.5
-0.49 to -.001
0
.001 to .5
.51-2.1
Physician Rate Physician Rate Change, 2000 to 2010
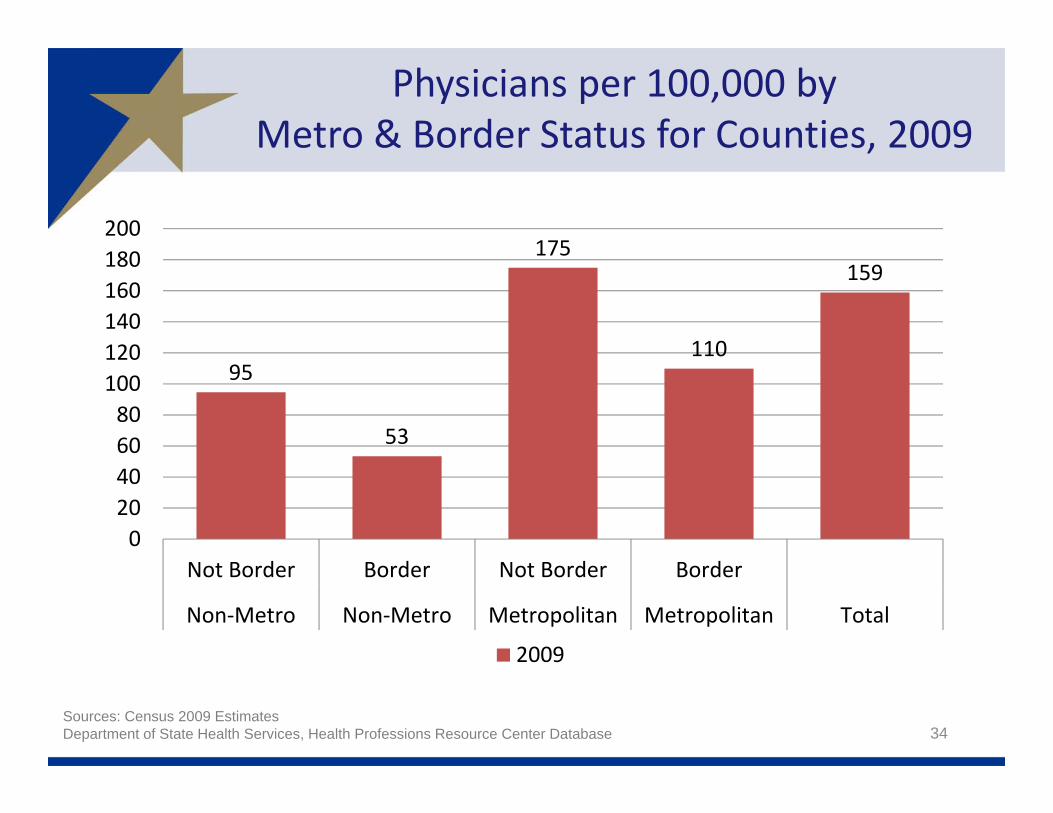
95
53
175
110
159
020406080100120140160180200
Not Border Border Not Border Border
Non‐Metro Non‐Metro Metropolitan Metropolitan Total
2009
Sources: Census 2009 EstimatesDepartment of State Health Services, Health Professions Resource Center Database
Physicians per 100,000 byMetro & Border Status for Counties, 2009
34

Physicians per 1,000 Population Aged 65 Years and Older by County, 2008
35
0
GT 0 - LE 5
GT 5 - LE 10
GT 10 - LE 20
GT 20
Source: U.S. Census Bureau. 2008Population Estimate (population), and Texas Medical Board (physicians).
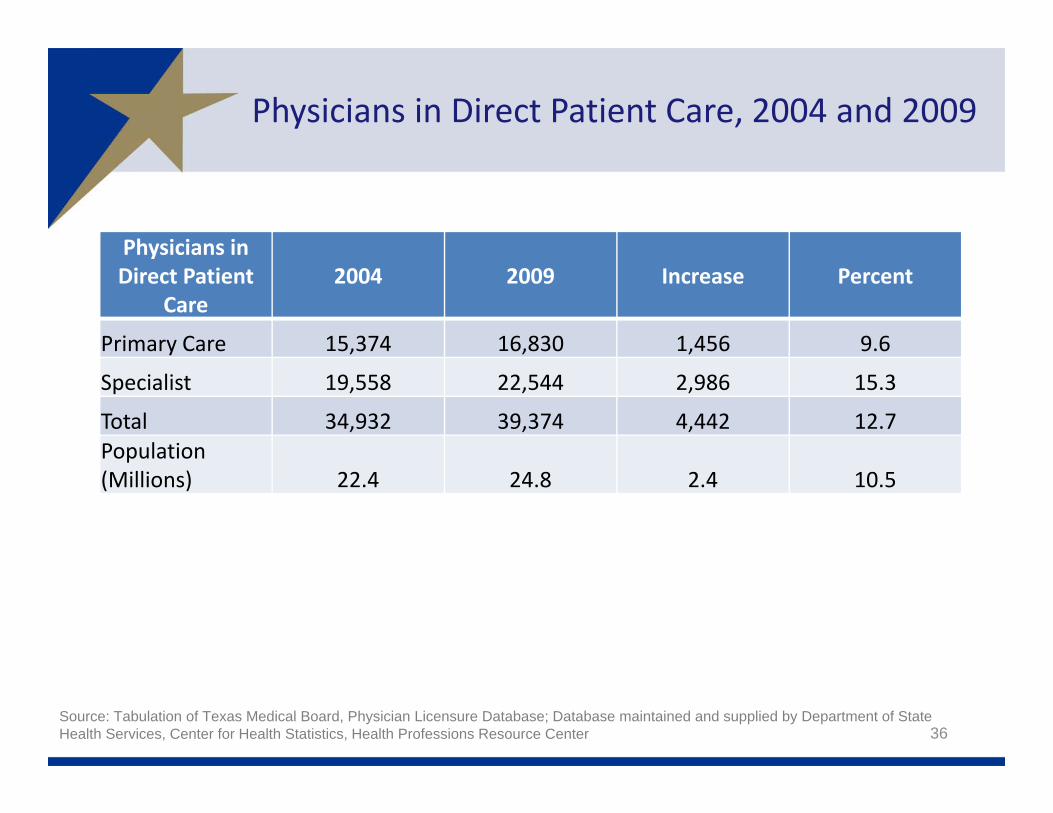
Physicians inDirect Patient
Care2004 2009 Increase Percent
Primary Care 15,374 16,830 1,456 9.6
Specialist 19,558 22,544 2,986 15.3
Total 34,932 39,374 4,442 12.7Population (Millions) 22.4 24.8 2.4 10.5
Source: Tabulation of Texas Medical Board, Physician Licensure Database; Database maintained and supplied by Department of StateHealth Services, Center for Health Statistics, Health Professions Resource Center
Physicians in Direct Patient Care, 2004 and 2009
36

Demographics & Destiny
37
Demographics & Destiny
• Texas is growing.• Texas is becoming more urban.• Texas is becoming more diverse.• Texas is young but aging.• All of these factors along with public policy changes will influence the number of individuals in need of insurance.
38

Contact
Office: (512) 463‐8390 or (210) 458‐6530E‐mail: [email protected]: http://osd.state.tx.us
Office of the State Demographer
39