upgrading pathways in the automotive …€œupgrading pathways in the automotive value chain”,...
TRANSCRIPT

UPGRADING PATHWAYS IN THE AUTOMOTIVE VALUE CHAIN
OECD INITIATIVE FOR POLICY DIALOGUE ON GLOBAL VALUE CHAINS, PRODUCTION TRANSFORMATION AND DEVELOPMENT
SESSION 3: Round Table on the Future of the Automotive Industry BACKGROUND DOCUMENT
7th Plenary Meeting 10-11 November 2016 Mexico City, Mexico
1
UPGRADING PATHWAYS IN THE AUTOMOTIVE VALUE CHAIN
This paper is the revised and extended draft of the document shared for discussion at the first government-
business round table hosted in the framework of the 2nd
Plenary Meeting of the OECD Initiative for Policy
Dialogue on GVCs, Production Transformation and Development. It summarises the results of the
stocktaking exercise on “Policy Experiences in Upgrading in the Automotive Industry” carried out in the
framework of the Initiative under the stream of work of sectoral trends and dynamics. It includes the
preliminary results of business case analysis carried out in the framework of the OECD work on
investment linkages. It includes an overview of stylised facts about the industry and its organisation within
GVCs, an overview of industrial development pathways and policy approaches based on the experiences of
Brazil, Chile, Colombia, Costa Rica, Czech Republic, Dominican Republic, Ethiopia, France, Ireland,
Mexico, Morocco, Peru, Singapore, Turkey and Uruguay. The concluding session will be based on the
outcomes of the Round Table on the Future of Automotive Industry, hosted in the framework of the 7th
Plenary Meeting of the Initiative on November, 10-11, 2016.
Participants are invited to:
Express interest in sharing their country experience in the industry and highlight lessons learned.
Share views/provide information about scenarios for the industry and implications for their
economies during the Government-Business Round Table.
Provide suggestions regarding the next steps of this line of work, including identifying key priority
areas for future work (e.g. scenarios for the industry, impact of new manufacturing techniques on
the sector, typology of risks associated with participation in GVCs and tools for handling them,
compendium of good practices for entry and upgrading in the industry, etc.).
Provide comments to the drafts and volunteer for business and country case studies.
Suggestions and written comments are welcome by November 25th. The release of the report is foreseen by
January 2017.
Contact:
Annalisa Primi, Head, Structural Policies and Innovation Unit, OECD Development Centre,
Iza Lejarraga, Head, Investment Policy and Linkages Unit, OECD Directorate for Entrepreneurial
Affairs, [email protected]
Cite this document as: Lejarraga, I., A. Kouzul-Wright, A. Primi, M. Toselli and M. Wermelinger (2016),
“Upgrading pathways in the automotive value chain”, Background document for the 7th Plenary Meeting of
the OECD Initiative for Policy Dialogue on GVCs, Production Transformation and Upgrading, OECD,
Paris.

2
TABLE OF CONTENTS
UPGRADING PATHWAYS IN THE AUTOMOTIVE VALUE CHAIN ..................................................... 1
OVERVIEW .................................................................................................................................................... 4
INTRODUCTION ........................................................................................................................................... 4
INDUSTRY’S OVERVIEW ........................................................................................................................... 4
China is the top world’s producer ................................................................................................................ 5 Germany leads world’s exports ................................................................................................................... 6 Demand is growing in emerging economies ................................................................................................ 8 Asia and Africa are attracting more FDI ...................................................................................................... 9 Germany, Japan and the United States drive innovation ........................................................................... 13
STRUCTURE AND EVOLUTION OF THE AUTOMOTIVE GVC .......................................................... 15
Insights from the OECD-WTO TiVA database ......................................................................................... 15 Insights from micro-level data: supply chain actors in the value chain ..................................................... 18 Evolution of countries’ participation in the automotive value chain ......................................................... 20
Becoming specialised suppliers by linking to the value chain ............................................................... 24
BUSINESS INSIGHTS ................................................................................................................................. 26
Internationalisation of production: a highly globalised production model ................................................ 26 Drivers of production internationalisation: proximity to final markets is key ........................................... 27 Mode of investment: Significant diversification in equity and non-equity modes of investment ............. 28 Linkages with arm's length suppliers: Substantial sourcing from global suppliers in production markets28 Foresight: Shifting modes of production and potential for Southern Africa.............................................. 29
COUNTRIES STRATEGIES ........................................................................................................................ 30
Overview of countries’ strategies .............................................................................................................. 31 Targeted programmes for the automotive industry .................................................................................... 32 Attracting FDI and creating jobs through horizontal schemes................................................................... 37 Success stories and lessons learned ........................................................................................................... 39
Special Economic Zones are increasingly used to create capabilities in new-comers countries............ 39 Well-managed programmes for client-suppliers linkages help connecting domestic SMEs ................. 40 Learning from FDI is not automatic and targeted initiatives are needed ............................................... 42
SCENARIOS FOR THE FUTURE ............................................................................................................... 42
What countries see ask key challenges for the future ................................................................................ 42 Tapping into new consumers’ preferences and increasing linkage with emerging markets. ................. 43 Upgrading and innovating ...................................................................................................................... 43 Greening the industry ............................................................................................................................. 44
How the future will look like? ................................................................................................................... 44 Changes in demand ................................................................................................................................ 44 Changes in products ............................................................................................................................... 45 Changes in market structure and localisation of activities: who will be doing what and where? .......... 46
CONCLUSIONS ........................................................................................................................................... 47
REFERENCES .............................................................................................................................................. 47

3
Tables
Table 1. Policies for industrial development: the automotive industry in Turkey, 1960-2018 ........... 21 Table 2. Companies linked to the automotive chain, Costa Rica, 2014 .............................................. 25 Table 3. Subsidiaries and suppliers of two global car manufacturers.................................................. 27 Table 4. Comparative overview of policy priorities for the automotive value chain, 2015 ................ 32 Table 5. Main characteristics of targeted programmes to promote the automotive industry, 2014 ..... 34 Table 6. Policy mix of targeted programmes for the automotive industry, 2015 ................................ 35 Table 7. Policy mix of the National Incentive Scheme, Czech Republic, 2014 .................................. 37 Table 8. Non targeted schemes with high impact for the automotive industry, Mexico, 2015 ........... 38 Table 9. Incentives schemes in Turkey, 2015 ...................................................................................... 39 Table 10. Main characteristics of the SEZ regime, Dominican Republic, 2015 ................................... 40 Table 11. Promoting suppliers development and linkages, Brazil, Costa Rica, 2014 ........................... 41
Figures
Figure 1. Top 20 countries in world's veichles production, 2004-14 ...................................................... 5 Figure 2. Top 20 countries in automotive employment, 2012 ................................................................ 6 Figure 3. Top 20 countries in world's veichles exports, 2004-14 ........................................................... 7 Figure 4. Regional automotive exports by regions of destination, 2014 ................................................. 8 Figure 5. Vehicles in use, top 5 producers and selected countries .......................................................... 9 Figure 6. Top 10 World origin and destination countries in automotive FDI, 2013-15 ....................... 10 Figure 7. Top 10 cities for FDI inflows in automotive, 2013-15 .......................................................... 11 Figure 8. Automotive FDI in knowledge-intensive activities, 2013-15 ............................................... 12 Figure 10. Top 20 R&D investing firms in automotive industry ........................................................ 14 Figure 11. Top 10 technology areas in automotive patent activity, 2011 ........................................... 14 Figure 13. Relevance of GVC participation, selected countries, 2011 ............................................... 16 Figure 14. Type GVC participation, selected countries, 1995-11 ....................................................... 17 Figure 15. Origin of Value Added in Final Demand by source and industry, selected countries, 201118 Figure 16. Equity and non-equity Investment in Automotive Value Chains ...................................... 19 Figure 17. Domestic suppliers in automotive global value chain ....................................................... 20 Figure 18. Patterns of participation in the automotive GVC, selected countries, 1995-2011 ............. 23
Boxes
Box 1. The evolution of the automotive industry in Turkey: from assembly to original design ............... 21 Box 2. What has shaped the entry and evolution in the automotive industry? .......................................... 23 Box 3. Supplying the global automotive chain: options through specialisation ........................................ 24 Box 4. Business perspectives on reforms................................................................................................... 29

4
OVERVIEW
[to be added]
INTRODUCTION
1. The automotive industry is highly concentrated, with few countries and companies leading world
production. Its value chain is increasingly complex and characterised by a growing number of players
operating in different sectors and located in different geographical areas.
2. The automotive industry has a high impact on growth and development. It is intensive in capital
equipment, jobs and innovations. This industry is undergoing deep transformations. New players are
emerging and new consumer demands are calling for safer and greener cars. New technologies are
changing how vehicles are produced and used, and they are redefining the same concept of the vehicle.
3. This document builds on the Government-Business Roundtables hosted in the framework of the
OECD Initiative for policy Dialogue on GVCs, Production Transformation and Development on the
automotive industry and on direct interviews with companies. It also builds on the stocktaking on “Policies
for upgrading in the automotive value chain” carried out in the framework of the Initiative. . Fifteen
countries replied to the questionnaire (Brazil, Chile, Colombia, Costa Rica, Czech Republic, Dominican
Republic, Ethiopia, France, Ireland, Mexico, Morocco, Peru, Singapore, Turkey and Uruguay). Among
them there are countries in which automotive has a high weight in the economy (such as, Brazil, France,
and Mexico, for example), countries which are pointing to make the automotive industry a driver of
transformative change (Colombia, Morocco and Turkey, for example) and countries which have
capabilities in related industries and activities (such as Ireland and Singapore).
4. This document is structured in four sections: the first provides an overview of the industry; the
second analyses the evolution of the automotive value chain and the experiences of different countries; the
third presents business insights based on case studies of companies; the fourth section presents an overview
of country’s policy approaches and tools; the fifth discusses scenarios for the future, from the perspective
of government and business. The conclusions identify the lessons learned and the issues at stake for
different countries.
INDUSTRY’S OVERVIEW
5. This section presents an overview of global trends in the automotive industry. It clarifies which
countries and companies are leading in world’s production, export, employment, FDI and innovation.
5
6. The automotive industry is labour and capital intensive and its dynamics have deep impact on
growth, employment and overall development. The industry is also facing deep transformations as new
technologies and demands are pushing towards a radical transformation of vehicles (smaller, safer, greener,
connected, driver-less) and their use (shared-cars and new, disruptive business models for mobility
services), pointing to major changes for the future for automakers and suppliers alike, as well as for
countries which have been relying on foreign direct investment as main industrial development driver.
China is the top world’s producer
7. The world is producing more cars every year. Between 2010 and 2015 the number of produced
vehicles has increased on average 5% per year; in 2015, 89.5 millions of vehicles where produced, of
which 73% were passengers’ cars and the rest commercial vehicles (OICA, 2016). The industry is highly
concentrated and the top 20 countries account for 90% of total world’s production.
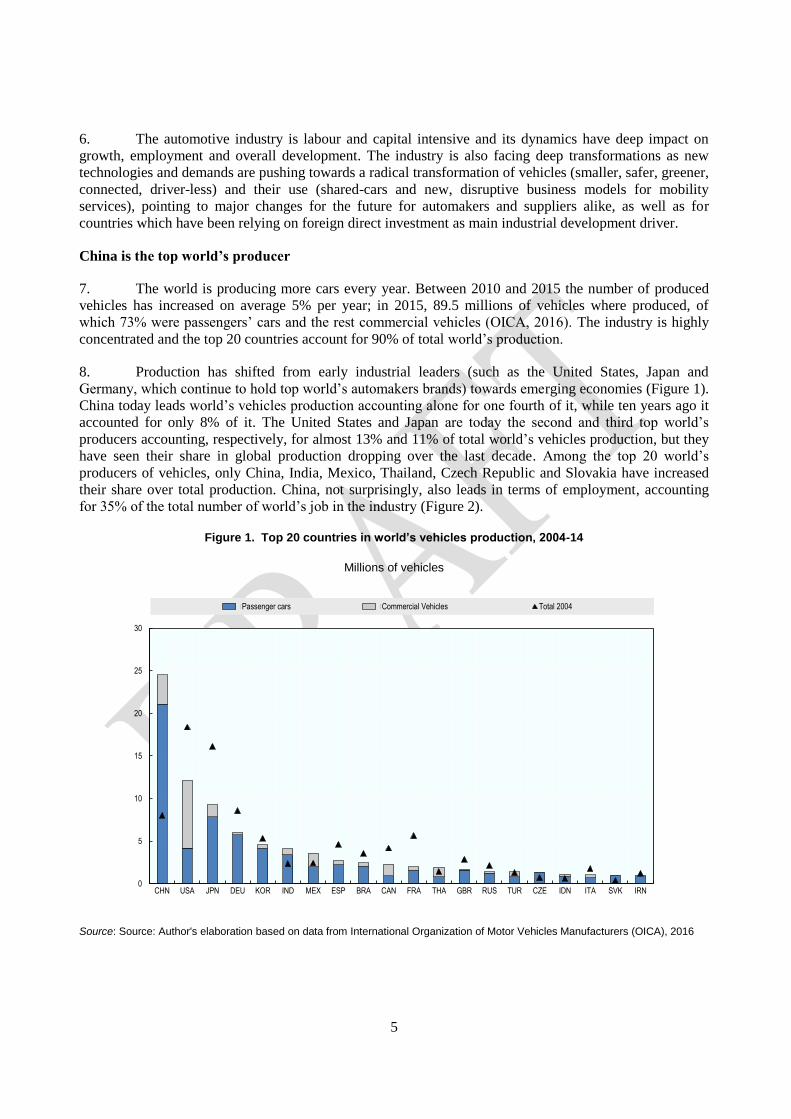
8. Production has shifted from early industrial leaders (such as the United States, Japan and
Germany, which continue to hold top world’s automakers brands) towards emerging economies (Figure 1).
China today leads world’s vehicles production accounting alone for one fourth of it, while ten years ago it
accounted for only 8% of it. The United States and Japan are today the second and third top world’s
producers accounting, respectively, for almost 13% and 11% of total world’s vehicles production, but they
have seen their share in global production dropping over the last decade. Among the top 20 world’s
producers of vehicles, only China, India, Mexico, Thailand, Czech Republic and Slovakia have increased
their share over total production. China, not surprisingly, also leads in terms of employment, accounting
for 35% of the total number of world’s job in the industry (Figure 2).
Figure 1. Top 20 countries in world’s vehicles production, 2004-14
Millions of vehicles
Source: Source: Author's elaboration based on data from International Organization of Motor Vehicles Manufacturers (OICA), 2016
0
5
10
15
20
25
30
CHN USA JPN DEU KOR IND MEX ESP BRA CAN FRA THA GBR RUS TUR CZE IDN ITA SVK IRN
Passenger cars Commercial Vehicles Total 2004

6
Figure 2. Top 20 countries for number of employees in automotive, 2014
Share of number of employees in total world employees
Note: The automotive includes the following activities according to the International Standard Industrial Classification of All Economic Activities (ISIC), rev.3, 2 digit level. 2: 34-Motor vehicles, trailers and semi-trailers and 35, Other transport equipment.
Source: Authors' elaboration on UNIDO Industrial Statistics Database (IndStat 2 2015 edition), 2016.
Germany leads world’s exports
9. Germany is the world top automotive exporter. It accounts for 18% of total world gross exports
in automotive, and it is followed by Japan and the United States. These three countries have been leading
global automotive exports since the 1990; however, emerging economies are gaining grounds as exporters.
Among the top exporters, China is the one which increased the most is role in the global economy. Its
share on total world exports increased from 1% to almost 4% in a decade (from 2004 to 2014). Other
emerging economies, including Mexico, Korea and Thailand, are also increasing their role as global
exporters (Figure 3).
0
5
10
15
20
25
30
35
40
CHN USA IND DEU BRA MEX RUS KOR FRA THA GBR ITA POL VNM TUR IDN UKR ESP ROU
Share in world's number of employees in automotive

7
Figure 3. Top 20 countries in world's exports of vehicles, 2004-14
Share of countries’ exports over total world gross exports of vehicles
Note: The automotive includes the following activities according to the International Standard Industrial Classification of All Economic Activities (ISIC), rev.3, 2 digit level. 2: 34-Motor vehicles, trailers and semi-trailers and 35, other transport equipment.
Source: Authors’ elaboration based on data from UN COMTRADE, 2016
10. The automotive value chain displays a strong regional component. Europe is the first exporting
region for vehicles. It accounts for 54% of total world exports of vehicles and trade within the region
accounts for 73% of total regional exports (Figure 4)
0
5
10
15
20
25
DEU JPN USA MEX KOR CAN CHN GBR ESP FRA BEL ITA CZE THA POL SVK HUN AUT SWE NLD
2014 2004

8
Figure 4. Regional automotive exports by regions of destination, 2014
USD Billions
Note: International Standard Industrial Classification (ISIC) of All Economic Activities, Revision 3, 2 digit level. 2-digit code 34-Manufacture of motor vehicles, trailers and semi-trailers, includes 3-digit codes: 341-Manufacture of motor vehicles, 342-Manufacture of bodies (coachwork) for motor vehicles; manufacture of trailers and semi-trailers, 343-Manufacture of parts and accessories for motor vehicles and their engines. The figure displays exports flows above 1 USD billions. Regions refer to the regional groupings of Millennium Development Indicators (http://mdgs.un.org/unsd/mdg/Host.aspx?Content=Data/RegionalGroupings.htm)
Source: Authors' elaboration on UN COMTRADE, 2016
Demand is growing in emerging economies
11. The United States, Japan and Germany lead in number of vehicles per 1000 habitants (Figure 5).
However, the figures for these economies are stable, while emerging and developing economies have
shown marked increases in vehicles’ demand. For example, China has increased vehicles’ consumption of
almost four times in the last decade, Mexico of 1.5 times and Brazil of almost 50%. In these economies,
the advancement of middle classes has been sustaining vehicles’ consumption (driving up imports or
sustaining local production as in China and India. However, the slowing of growth in emerging economies
is casting doubts about their capacity to drive world vehicle’s consumption at the same pace in the future.

9
Figure 5. Motor-vehicles in use, selected countries, 2004-14
Number of vehicles per 1000 habitants
Note: The figure includes world top 5 producers of automotive (highlighted in white), and selected countries which have been participating to the work stream on sectoral trends and dynamics in the OECD Initiative for Policy Dialogue on Global Value Chains, Production Transformation and Development..
Source: Authors' elaboration on World Development Indicators and OICA data, 2016
Asia and Africa are attracting more FDI
12. Japan, Germany and the United States originate most of global FDI outflows in automotive, as
measured by the number of jobs created by those investments. The three countries account together for
more than 60% of total FDI in the industry as measured by the number of jobs created abroad between
2013 and 2015 (Figure 6). The other top investing countries are China, Korea, France, Italy, India, UK and
Canada; these seven and the top three, all together account for almost 90% of total FDI. While most FDI
outflows in automotive are linked to outsourcing of manufacturing activities, more recently some
companies has started to outsource also knowledge intensive activities, including R&D, design and testing.
At the city level, the source cities for knowledge intensive FDI outflows are the usual suspects, with
Stuttgard, Seoul, Hannover activities abroad
13. Mexico is the country which receives most of the FDIs in automotive. Automotive FDI inflows
are increasingly targeting Asian economies and, more recently, Africa. The top ten countries for
automotive FDI inflows include Mexico, China, the United States, India, Morocco, Russia, Romania, and
the UK. Mexico accounts for 18% of total FDI, as measured by number of jobs created by FDI inflows
between 2013 and 2015. China and the United States follow in attractiveness of automotive FDI inflows.
Each accounts for 15% of total world automotive FDI inflows, in the same period. 96% of FDI inflows in
Mexico are related to manufacturing; while China and the US also attract R&D and retail FDI. In China,
Shanghai alone accounts for almost 40% of total knowledge intensive FDI inflows. While knowledge
intensive FDI target mostly China and India, which host respectively 9 and 2 out of the top 20 recipient
cities of knowledge intensive FDI inflows. Other hotspots are emerging as attractive for knowledge
intensive activities including Casablanca in Morocco and Betim in Brazil which account respectively for
almost 5% and 3% of total knowledge intensive FDI in automotive (Figure 8 and 9).
0
100
200
300
400
500
600
700
800
900
USA JPN DEU FRN GBR CZE IRL MEX URU KOR CHI CRI BRA TUR SGP DOM COL PERU CHN
2014 2004

10
Figure 6. Top 10 World origin and destination countries in automotive FDI, 2013-15
Jobs created as percentage of total jobs created by world automotive FDI
Note: Data includes fDi Market's "Automotive OEM" and "Automotive Components" groupings and display share above 1.5%. Note: Data includes FDI Market's "Automotive OEM" and "Automotive Components" groupings. Based on the North American Industry Classification (NAICS,2012 release), 3 to 7 digit levels, "Automotive Components" includes classes: 336211-Motor Vehicle Body and Trailer Manufacturing, 3363-Motorvehicles parts manufacturing, 441-Motor Vehicle and Parts Dealers; "Automotive OEM" includes classes: 3361-Motor vehicle manufacturing, 336999-All Other Transportation Equipment Manufacturing, 441-Motor Vehicle and Parts Dealers. "Manufacturing" refers to investments that involve the production or processing of any good (manufacturing plants, processing plants, smelter etc.)
Source: Authors' elaboration based on data FDI Markets, a service from the Financial Times Ltd, 2016.

11
Figure 7. Top 10 cities for FDI inflows in automotive, 2013-15
Note: Data includes fDi Market's "Automotive OEM" and "Automotive Components" groupings and display share above 1.5%. Note: Data includes FDI Market's "Automotive OEM" and "Automotive Components" groupings. Based on the North American Industry Classification (NAICS,2012 release), 3 to 7 digit levels, "Automotive Components" includes classes: 336211-Motor Vehicle Body and Trailer Manufacturing, 3363-Motorvehicles parts manufacturing, 441-Motor Vehicle and Parts Dealers; "Automotive OEM" includes classes: 3361-Motor vehicle manufacturing, 336999-All Other Transportation Equipment Manufacturing, 441-Motor Vehicle and Parts Dealers. "Manufacturing" refers to investments that involve the production or processing of any good (manufacturing plants, processing plants, smelter etc.)
Source: Authors' elaboration based on data FDI Markets, a service from the Financial Times Ltd, 2016.

12
Figure 8. Top 20 source cities for automotive knowledge-intensive FDI outflows, 2013-15
Percentage of jobs created by city over total jobs created by FDI outflows in knowledge-intensive activities
Source: Authors' elaboration based on data FDI Markets, a service from the Financial Times Ltd, 2016.
0
2
4
6
8
10
12
14
R&D Design, Development & Testing

13
Figure 9. Top 20 source cities for automotive knowledge-intensive FDI outflows, 2013-15
Percentage of jobs created by city over total jobs created by FDI inflows in knowledge-intensive activities
Source: Authors' elaboration based on data FDI Markets, a service from the Financial Times Ltd, 2016.
Germany, Japan and the United States drive innovation
14. The automotive industry is intensive in R&D and patenting. 7% of the top 2500 R&D investing
companies in the wold are from the automotive industry. These companies account for 20% of the total
expenditure in R&D of these top R&D investing companies (Figure 10). Companies in the automotive
industry are investing in developing the new, green, electric and safer car. Patenting activities in
alternatives to the traditional combustion engines, as well as in safety have increased in the last decade
(Figure 11). At the company level, Toyota is the world leader in total patent filings with 4500 patent
applications in 2014. Toyota has been a pioneer in the development of green cars, with the introduction of
Toyota Prius, in 2000, as the first and top selling hybrid car in the world, with almost 4 million units sold
since its introduction till 2014 (McKinsey, 2015).
0
5
10
15
20
25
30
35
40
R&D Design, Development & Testing

14
Figure 10. Top 20 R&D investing firms in automotive industry
Billions of EUR invested in R&D and share of R&D expenditure over sales
Source: Authors' calculations based on the European Union R&D Investment Scoreboard (2015), 2016
Figure 11. Top 10 technology areas in automotive patent activity, 2011
Share of sub-classes patent over total granted triatic patent in vehicles class B60
Note: 1- Patent classes are reported according with WIPO international Patent Classification (IPC). B60 class on transporting and vehicles takes into account subclasses from B60B up to B60W. For further information, refer to Guidelines for revision and use of the IPC (WIPO, 2015) http://www.wipo.int/classifications/ipc/en/general/.
Source: Authors' elaboration on OECD Patent Statistics and WIPO, 2016.
0.0
2.0
4.0
6.0
8.0
10.0
12.0
0
2
4
6
8
10
12
14
R&D Expenditure R&D intensity
0
5
10
15
20
25
30
2013 2000

15
STRUCTURE AND EVOLUTION OF THE AUTOMOTIVE GVC
15. This section presents an overview of the structure and evolution of the automotive value chain. It
starts with an analysis of interconnectedness as it can be measured by the OECD-WTO TiVA database; it
then presents a preliminary analysis based on firm-level data that maps the types of firms and their
investments in the global automobile supply chain, including equity and non-equity forms of participation.
Insights from the OECD-WTO TiVA database
16. The automotive industry is highly concentrated, with few countries and companies leading world
production. However, its value chain is increasingly complex and characterised by a growing number of
players and interconnected sectors and activities located in different geographical areas. Few countries
(companies) lead world production. Its value chain however, is articulated in several locations across the
globe, hosting not only assembly and production, but also design, testing, R&D and innovation activities in
directly and indirectly linked activities. Many manufacturers from OECD countries already produce a large
proportion of their cars in emerging markets (for example, in 2012, Volkswagen and GM produced around
40% of their cars in non-OECD countries), and they will likely need to further increase capacities in these
countries going forward in order to maintain their market shares (Klein and Koske, 2013).
17. The automotive value chain has evolved over time from vertical integration to a complex and
geographically dispersed production different network where different companies and clusters specialise
and operate as first, second and third tier suppliers producing inputs that are then assembled in the final
vehicle following the design of the original equipment manufacturers (OEM).
Figure 12. Automotive Global Value Chain
Source: adapted from Veloso and Kumar (2002) and Sturgeon et. al (2009).
Raw Material
TIER 2 Suppliers
TIER n Suppliers
TIER 1 Suppliers
UpstreamDownstream
Component specialists OEM/AutomakersComponent
Manufactureres3SPLs-Retailers -
Aftermarkets
TIER 2 Suppliers
R&D- Design-Concepts
16
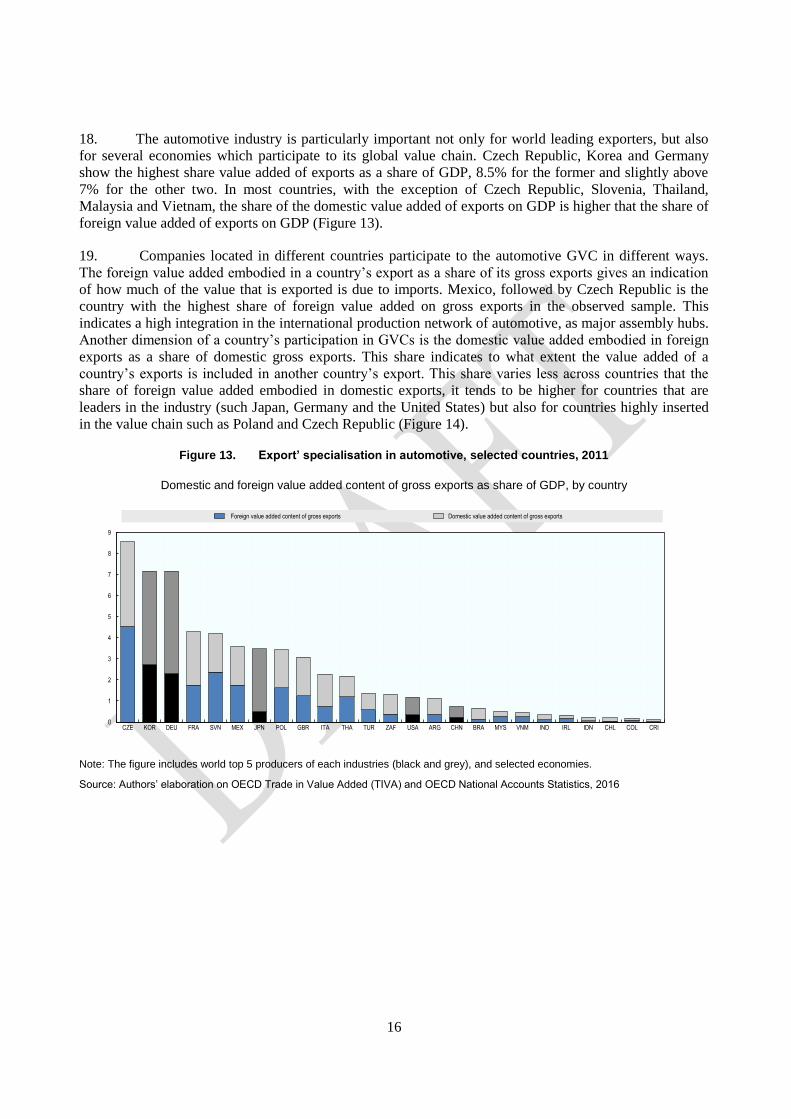
18. The automotive industry is particularly important not only for world leading exporters, but also
for several economies which participate to its global value chain. Czech Republic, Korea and Germany
show the highest share value added of exports as a share of GDP, 8.5% for the former and slightly above
7% for the other two. In most countries, with the exception of Czech Republic, Slovenia, Thailand,
Malaysia and Vietnam, the share of the domestic value added of exports on GDP is higher that the share of
foreign value added of exports on GDP (Figure 13).
19. Companies located in different countries participate to the automotive GVC in different ways.
The foreign value added embodied in a country’s export as a share of its gross exports gives an indication
of how much of the value that is exported is due to imports. Mexico, followed by Czech Republic is the
country with the highest share of foreign value added on gross exports in the observed sample. This
indicates a high integration in the international production network of automotive, as major assembly hubs.
Another dimension of a country’s participation in GVCs is the domestic value added embodied in foreign
exports as a share of domestic gross exports. This share indicates to what extent the value added of a
country’s exports is included in another country’s export. This share varies less across countries that the
share of foreign value added embodied in domestic exports, it tends to be higher for countries that are
leaders in the industry (such Japan, Germany and the United States) but also for countries highly inserted
in the value chain such as Poland and Czech Republic (Figure 14).
Figure 13. Export’ specialisation in automotive, selected countries, 2011
Domestic and foreign value added content of gross exports as share of GDP, by country
Note: The figure includes world top 5 producers of each industries (black and grey), and selected economies.
Source: Authors’ elaboration on OECD Trade in Value Added (TIVA) and OECD National Accounts Statistics, 2016
0
1
2
3
4
5
6
7
8
9
CZE KOR DEU FRA SVN MEX JPN POL GBR ITA THA TUR ZAF USA ARG CHN BRA MYS VNM IND IRL IDN CHL COL CRI
Foreign value added content of gross exports Domestic value added content of gross exports

17
Figure 14. Type of participation in the automotive GVC, selected countries, 1995-11
Foreign value added (VA) embodied in gross exports and domestic VA embodied in foreign exports, as % of gross exports
The figure includes world top 5 producers of each industries (dark bars), countries participating to the OECD Initiative for Policy Dialogue on Global Value Chains, Production Transformation and Development and countries replying to the questionnaire on “Targeted Programmes to Support the Automotive Industry" for which data were available.
Source: Authors’ elaboration on OECD Trade in Value Added (TIVA), 2016
20. Consumption patterns and the origin of the value added of the final demand for vehicles in each
country offers additional insights into the dynamic of the value chain. To what extent the value added of
what is consumed in a given country comes from the domestic economy or foreign sources depends on
several factors, notably the size of the economy, the relevance of the industry in question for the country
and the role played in the automotive value chain, as well as business strategies and consumers’
preferences. Japan, China, Brazil, India and Indonesia stands out for being the countries where the value
added of final demands of vehicles bought in the economy comes from domestic companies. These are
actually counties where the automotive industry has a strong domestic network of suppliers and where, as
in the case of China and India the industry mostly targets the domestic market. In Europe the country with
the highest share of domestic origin of value added of demand of vehicles is Germany, while for all
European countries Europe is a major source of value added embodied in final demand, from 30% in
Ireland to more than 50% in Slovenia, indicating a strong regional supply network in the region.

18
Figure 15. Origin of value added in final demand by regions, selected countries, 2011
Notes: The figure includes countries participating to the OECD/DEV GVCs initiative and top 5 producers, conditional to TiVA data availability
Source: Authors’ elaboration on OECD Trade in Value Added (TIVA), 2016
Insights from micro-level data: supply chain actors in the value chain
21. The section above based on TiVA data has provided a useful overview of the extent and type of
participation of countries and their sectors at the aggregate level, by identifying, for instance, where value
added is created. Going deeper into firm-level dynamics can provide additional insights to policy makers
by capturing critical features arising from firm-level, offering a more detailed picture of the typology of
actors that are participating in the supply network. It also provides for more timely data, given that at the
moment available TiVA data has a time lag (with the latest available data being 2011). Finally, micro-level
analysis allows us to explore the different modes of investment, both involving equity and non-equity
modes of investment which are becoming important building block in GVCs.
22. In this section we present preliminary evidence on firm-level dynamics in the automobile supply
chain, based on a comprehensive and up-to-date dataset of material intercompany relationships. Figure
15 illustrates the geographic distribution of equity (i.e., FDI) and non-equity based (i.e., contractual
relationships) investments in 85% of the world automobile industry. The size of the circles reflects the
number of foreign subsidiaries operating in a given country, while diamonds represent contractual supply
relationships in each country where national suppliers participate in the GVC (blue shaded area). The
figures suggest that there are differences in the investment mode deployed by different lead firms in
various production locations. Automobile companies from the United States appear to primarily deploy
FDI in their production networks based in more developed and proximate markets, while relying on non-
equity investment models in other economies. This pattern is consistent with the investment model of
European lead firms, although there is greater market presence in selected emerging economies, notably
Brazil, Mexico and South Africa. On the contrary, lead firms from Asia (Japan, South Korea, India)
undertake significantly more equity investment in emerging economies. Overall, lead car manufacturers
from Asia have a stronger presence in developing countries, particularly within the region, but to a great
extent also in Latin America and Africa.
0
10
20
30
40
50
60
70
80
90
100
VNM SGP MYS KOR IDN IND CHN JPN IRL SVN GBR ITA CZE FRA DEU CHL CRI COL MEX BRA ZAF TUR USA
ASIA EU LAC OTHER
RoW Asia (no China) Europe North America China

19
Figure 16. Equity and non-equity investment in Automotive Value Chains
Source: Analysis compiled from FactSet, encompassing the 16 largest vehicle producers which account for 85% of world market share in the automobile industry
23. This analysis allows seeing the participation of domestic firms in production activities in the
value chains. Figure 16 captures both domestic suppliers in manufacturing (Panel A), suppliers of services
(Panel B). It reflects that it is mostly developed or larger emerging economies that participate in the

20
manufacturing of automobile parts; however, the picture also shows the opportunities for smaller or less
developed economies to participate in the GVC through the provision of services.
Figure 17. Domestic suppliers in automotive global value chain
Source:
Evolution of countries’ participation in the automotive value chain
24. Participating to global value chains is not an end in itself. It can represent a means to create jobs,
to enter into new industries and or to attract new investments and building new infrastructure. To what
extent developing countries can transform their participation to global production networks into
development outcomes for their citizens, depends on several factors, including the strategy of the multi-
national companies, the domestic development strategy and the effectiveness of policies put in place to
transform participation into a learning opportunity (Box 1).
21
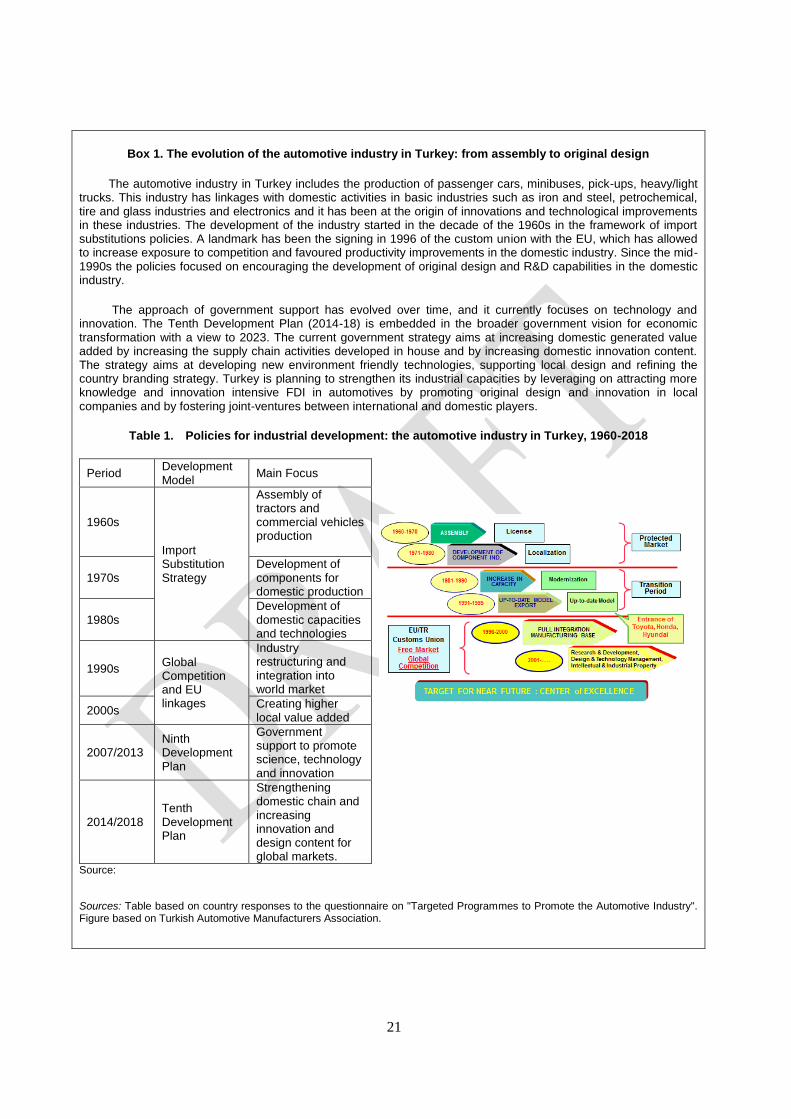
Box 1. The evolution of the automotive industry in Turkey: from assembly to original design
The automotive industry in Turkey includes the production of passenger cars, minibuses, pick-ups, heavy/light trucks. This industry has linkages with domestic activities in basic industries such as iron and steel, petrochemical, tire and glass industries and electronics and it has been at the origin of innovations and technological improvements in these industries. The development of the industry started in the decade of the 1960s in the framework of import substitutions policies. A landmark has been the signing in 1996 of the custom union with the EU, which has allowed to increase exposure to competition and favoured productivity improvements in the domestic industry. Since the mid- 1990s the policies focused on encouraging the development of original design and R&D capabilities in the domestic industry.
The approach of government support has evolved over time, and it currently focuses on technology and innovation. The Tenth Development Plan (2014-18) is embedded in the broader government vision for economic transformation with a view to 2023. The current government strategy aims at increasing domestic generated value added by increasing the supply chain activities developed in house and by increasing domestic innovation content. The strategy aims at developing new environment friendly technologies, supporting local design and refining the country branding strategy. Turkey is planning to strengthen its industrial capacities by leveraging on attracting more knowledge and innovation intensive FDI in automotives by promoting original design and innovation in local companies and by fostering joint-ventures between international and domestic players.
Table 1. Policies for industrial development: the automotive industry in Turkey, 1960-2018
Period Development Model
Main Focus
1960s
Import Substitution Strategy
Assembly of tractors and commercial vehicles production
1970s Development of components for domestic production
1980s Development of domestic capacities and technologies
1990s Global Competition and EU linkages
Industry restructuring and integration into world market
2000s Creating higher local value added
2007/2013 Ninth Development Plan
Government support to promote science, technology and innovation
2014/2018 Tenth Development Plan
Strengthening domestic chain and increasing innovation and design content for global markets.
Source:
Sources: Table based on country responses to the questionnaire on "Targeted Programmes to Promote the Automotive Industry". Figure based on Turkish Automotive Manufacturers Association.

22
25. As a first approximation, the employment dynamics in a given industry and the change in ratio
between foreign content embedded n domestic exports and domestic value added embodied in foreign
exports, contributes to identify four different patterns of participation in the automotive value chain:
Climbing the GVC ladder: countries are defined as “climbing the GVC ladder” in a given
industry when they are increasing the share of employment in that industry whilst also increasing
their domestic value added content in foreign exports relative to the foreign content in their
exports. This is the case of China and Slovenia.
Deepening in assembly: countries are defined as “deepening in assembly” in a given industry
when they are increasing their share of employment in the industry whilst also increasing the
foreign content of their exports relative to their domestic value added embodied in foreign
exports. This is the case of Mexico and Turkey in automotive.
Maturing and specialising: countries are defined as “delocalising and specialising” in a given
industry when they are reducing their relative share of employment whilst increasing their
domestic value added content in foreign exports relative to the foreign content in their exports.
Phasing out from the GVC: countries are defined as “phasing out” or “scaling down” from a
given value chain, if they are reducing the share of employment in the industry while increasing
the foreign value added embodied in their exports relative to their domestic value added
embodied in foreign exports.
26. These patterns are described by the four quadrants of Figure 18. Notice that the reasons why a
country falls into a given quadrant can be affected by several factors including, for example, the fact that
for natural resource intensive countries, an increase in the domestic value added embodied in foreign
exports can results from an increase in the price of raw materials and not from a change in the country’s
positioning in the value chain. A correct interpretation of the data therefore requires also a deep
understanding of the specific situation of each country.

23
Figure 18. Patterns of participation in the automotive GVC, selected countries, 1995-2011
Source: Authors' elaboration on OECD date Trade in Value Added and UNIDO Industrial Statistics Database (IndStat 2), 2016
Box 2. What has shaped the entry and evolution in the automotive industry?
From the policy dialogues and the stocktaking exercise carried out in the framework of the OECD Initiative for Policy Dialogue on GVCs, Production Transformation and Development, four main factors have been identified as key in shaping the evolution of the industry in the countries and the patters of their participation to the automotive value chain:
The quality and density of the production and innovation system
All countries agreed in affirming that for entering and moving up in the automotive chain a major determinant is that a whole ecosystem of capabilities needs to be in place, from technical skills and business capabilities, to technological, production and services’ capabilities. Whether the participation to the automotive chain is done through major automotive producers which carry out production, assembly and research in situ or by developing specific competences in niches, the linkage to the global network is rarely the outcome of the operations of a single firm. The evolution and performance of single firms depends on the quality and density of interaction of different firms, business associations, technology centres and institutions which deal with the multiple aspects that influence the productivity and innovativeness of production agents in the sector.
Effective and integrated government support
Respondents include a varied sets of countries, at different stages of development and with different roles in the automotive value chain, however a common aspect from all the countries’ experiences is the role of governments in favoring the creation of the conditions for effective value chain development. Governments are reported to play a role in offering financial and real services and incentives in a broad range of areas, from access to finance, matchmaking and business support services, to information sharing and training of professionals and local suppliers, as well as in standard settings and regulations. Free trade agreements and access to international markets are also important tools to promote the development of the industry and its increasing global outreach. The capacity to manage
-15
-10
-5
0
5
10
15
20
-4 -3 -2 -1 0 1 2 3
Average annual growth in employment , 1995-2011
Change in ratio of foreing VA content of exports and domestic VA content in other countries exports
Deepening in assembly
Climbing the ladder
Specialising/Maturing Scaling down
MEX
VNM
CHN
FRA
CAN
BRAKORSLO
TUR
GBR

24
rents and government support over time, in alignment with the evolution of domestic industrial capabilities has been highlighted as a major success factor in public policy management.
An environment favorable to learning and experimentation
Many countries have highlighted the importance of having in place conditions and institutions that allow accumulating knowledge and capabilities over time. Entering and being successful in a global value chain, as well as increasing the value added of domestic activities is not done overnight. Companies and production systems learn how to produce and trade over time and the conditions that shape learning patterns influence the evolution of industrial and services capabilities over time. Private and public institutions play a determinant role in fostering learning and allowing building systems that are not only responsive to change, but also capable of anticipating change.
Effective logistics, infrastructure, easiness of connectivity
Whether the participation to the automotive chain is done through major first tier producers localised in the country, through domestic suppliers sourcing MNCs globally or through a mix of the two, the quality and easiness of connectivity are key in shaping the evolution and productivity of the industry in the country. Effective logistics, access to ICTs and infrastructure for transport are key to favour the development of activities linked to the automotive industry. The connectivity needs are strongly correlated with the existing trade agreements, including the regional ones, such as EU and MERCOSUR and the bilateral ones.
In many countries, the origins of the development of technological and production capacities related to the automotive sector go back to the import substitution period (Brazil, Korea, Mexico and Peru are some examples). Peru, for example, which today is a net importer of vehicles with a marginal participation in the automotive value chain, hosted in the early 1960s several automobile assembly plants (General Motors, Chrysler, American Motors, Nissan, Toyota, Ford and Volkswagen, among others). During the 1980s, only three major assembly plants remained active (Nissan, Toyota and Volkswagen). The liberalisation policies of the 1990s led to a dismantling of these capabilities, leading the country to specialise in vehicle imports.
Becoming specialised suppliers by linking to the value chain
27. Even countries in which the automotive sector is pretty small have some horizontal programmes
that benefit the suppliers linked to the automotive chain. In Ireland, for example, the automotive industry is
small, it employees around 4 500 people in niches of subcomponents employed in the automotive and
aviation industries. These companies operate in engineering, tool-making, plastics, and metal fabrication
and they supply mostly EU companies. These companies can benefit from the support offered by
Enterprise Ireland (EI), the government agency responsible for the development of Irish enterprises in
world markets, and by its network of overseas offices, which provide market information, matchmaking
services, support for trade missions and company visits, and in certain locations also incubation services
Box 3. Supplying the global automotive chain: options through specialisation
Many countries have highlighted that they have capabilities in industrial and services activities that provide, or could provide a good base for linkages with the automotive chain. These include traditional supply sectors such as textile (indicated as subject to further expansion by Dominican Republic, Mexico, Peru) and new areas such as electronics (indicated as subject to potential further expansion by Dominican Republic, Ireland, Mexico and Singapore). Singapore hosts world suppliers of electronics and automotive applications. The country has identified potential linkages between its energy and chemical industrial hub and the automotive chain, highlighting the role of the current national strategy of shifting from fast implementers of technologies to a place where innovations and technological developments are actually generated. Ireland has highlighted software and electronics as areas of potential linkages with the automotive and aeronautics chain.
Peru has indicated that their policy is aiming at developing capacities in areas such as tires (rubber products) and textiles to increase linkages with the automotive chain. Peru exports rubber tires for airplanes, motorcycles and bicycles to Mexico, Colombia and Brazil. Chile reported that they have an incipient industry in vehicle parts and that the copper industry provides unexploited opportunities for linkages with the automotive chain, especially in the

25
MERCOSUR area. Other areas that Chile has reported as potential for further development are related to electronics and innovative design solutions for auto-parts. Dominican Republic has highlighted footwear and leather goods clusters, as well as electronic goods components as areas of potential linkages with the automotive chain.
Since the 1970s, Costa Rica hosts some companies which operate as sub-contractors for lead-firms in the automotive sector. From the 1970s to the 1990s the country specialized in tire manufacturing for the automotive sector. Since 2005, Costa Rica has diversified its exports towards more sophisticated components. According to COMEX (Costa Rica Ministry of Foreign Trade), in 2012, the automotive sector accounted for 4.6% of free trade zones exports in Costa Rica and the share of domestic value added was 51.3% (versus 42.3% in 2009). The table below lists the companies which have operation in Costa Rica and the figure shows which parts they manufacture for the global automotive value chain.
Table 2. Companies linked to the automotive chain, Costa Rica, 2014
Company Country of Origin Year of Establishment Bridgestone Japan 1967 CML USA 1995 Daewoo Bus South Korea 1995 Deshler Automotive Products USA 2008 Firestone Industrial Products Japan 2009 Hutchings Automotive Products (HAP) USA 2004 Innovative Components USA 2005 Proquinal Colombia 2004 Zollner Germany 2013 Micro Techologies USA 1999
Source: CINDE (Costa Rican Investment Promotion Agency), 2014
Source: CINDE (Costa Rican Investment Promotion Agency), 2014

26
BUSINESS INSIGHTS
28. [This session provides information based on companies’ and clusters experience in the
automotive value chain. It will include up to 5 “case studies.”]. As a preliminary example of the
information from case studies, the following paragraphs contain a preliminary overview of findings from
two lead automobile industries in the sector, focusing on their production operations in Southern Africa
(Table 3).
29. Investment and trade decisions of multinational enterprises are two aspects of the same
economic activity in any industry, including the automobile industry. These decisions are embedded in
MNEs' strategies to optimise the fragmentation of production and to provide access to key markets across
the world. However, international and national policies on trade and investment are often not determined in
conjunction and without a whole-of-supply lens that would respond to the needs of global lead MNEs and
their local partners in countries and regions of production.
30. The OECD is currently collecting insights from lead firms in the automobile (and other) sectors
to derive policy options for the SADC region supporting their efforts to leverage investment into regional
and global value chains for inclusive and sustainable industrialisation. This box provides a snapshot of first
insights from interviews with two lead automobile companies, henceforth the 'Companies', which are
among the 6 largest automakers globally and both have established production plants in South Africa.
Company 1 is headquartered in the United States with a global market share in revenues of around 8% (and
10% in South Africa). Company 2 is headquartered in Japan with a global revenue share of approximately
5% (and 8% in South Africa). The information reported in this box corresponds to perspectives of OECD's
interview partners in the Companies and does not reflect OECD's or the Companies' opinion.
Internationalisation of production: a highly globalised production model
31. The Companies engage significantly in final assembly of vehicles as well as the manufacturing of
key first-tier components (such as engines, gearboxes and transmissions) in their countries of origin. Both
Companies report net exports of vehicles out of their countries of origin. Company 1 has about half of its
automobile or automobile component plants within the United States (see Figure). This share is lower (at
around 8%) for Company 2, but broadly reflects the smaller market for automobiles in Japan (domicile of
Company 2) as compared to the United States (domicile of Company 1).
32. Besides the countries of origin, the Companies engage heavily in vehicle assembly in Mexico, the
UK, China and the Republic of Korea as well as in emerging markets like Argentina, Brazil, India, and
Thailand. For both companies, the assembly plants in South Africa are very small compared to plants in
larger markets. Company 2, for example, manufactures only about 30-40'000 vehicles in South Africa as
compared to more than 800'000 in Japan, the domicile of the country and most important location of
production. Brand-specific first-tier components are not produced in all countries with established
assembly activities of the Companies. These components are predominantly produced in countries with
large and developed automobile industries (such as the United States, Japan and several countries in
Europe).
33. In smaller production locations like South Africa, only less complex components or no
components at all are produced locally: Company 1 is not producing any components in South Africa and
applies the so-called 'complete-knocked-down' (CKD) model of assembly. CKD assembly means that all or
almost all components are imported from the Company's production plants in other countries. This model
is often applied in countries trying to develop an automobile industry and applying higher import tariffs for
already assembled vehicles as compared to tariffs for automobile components. Company 2 is producing

27
some brand-specific but less complex components in South Africa, including for example the chassis and
car bodies. Both companies complement their range of vehicles with imports from other plants abroad to
supply the Southern Africa market.
Table 3. Subsidiaries and suppliers of two global car manufacturers, 2016
Company 1 (United States) Company 2 (Japan)
Subsidiaries Suppliers (direct)
Subsidiaries Suppliers (direct)
Total (#) 471 357 254 274
Domicile in Company's home country
(% of total) 80% 29% 12% 23%
Operating in automobile or automobile component production (% of total)
5% 33% 15% 38%
Domicile in Company's home country (% of total operating in automobile or automobile component production)
50% 19% 8% 41%
Source: Authors' calculations based on FactSet (2016)
Drivers of production internationalisation: proximity to final markets is key
34. The Companies reported that their decision to invest into production plants domestically and
abroad is largely driven by the size of the market for selling. The transportation of vehicles is expensive
and the Companies therefore try to minimise shipping of vehicles over long distances and across certain
borders: on the one hand, shipping takes more space and involves more security concerns when cars are
already assembled; on the other hand, most countries that have an automobile industry, particularly in
emerging markets, still apply higher import duties for finished automobiles as compared to automobile
components.
35. Additionally, the local presence of global suppliers of important components (such as seats and
axels) is essential for the decision to establish in a country. These global suppliers have often the
intellectual property of the components' design and cannot be easily replaced by other suppliers. As the
market for selling in a country is growing, it becomes typically financially more feasible for global
component suppliers to establish in a country (also see section below). Finally, and importantly, the
decision to set up a production plant is determined by the extent to which public policies are supporting the
automobile sector. Related to that the clarity and reliability of policies are often more important than the
policies or incentives themselves. Capital investment is a long-term decision and therefore it is of utmost
importance to ensure that the investment is safe from expropriation.
36. In South Africa, despite relatively low overall volumes and distance from large markets,
conditions for production are relatively good, particularly due to existing capabilities and skills, a
supportive, stable and very clear long-term policy framework (now in its 3rd generation), good
infrastructure, access to a global shipping route to major export markets (i.e. weekly shipping), a strong
private sector (transport, telecom, finance and business services) and existing over-capacities allow for
expected expansions. Nonetheless, the Companies are exposed to important challenges in the South
African market of production. For example, the BBBEE policy is constraining the Companies as there is
limited qualified labour available and labour costs are relatively high including due to labour uncertainty
related to strikes, for example.

28
Mode of investment: Significant diversification in equity and non-equity modes of investment
37. The Companies typically fully own assembly plants as well as plants producing certain key
components that are specific to the brand. Besides equity investments, the Companies also apply non-
equity modes of investment. For example, Company 2 is often investing into specific tools/components, for
which it keeps the intellectual property. These components are however produced by contracted suppliers
that may also produce components for other automobile manufacturers. This model is applied if the
suppliers have more expertise to manufacture a specific component, but owning the design and technology
is critical for the Company's comparative advantage. Company 1 engages in similar technical agreements,
i.e. non-equity modes of investment (see next section for a description of weaker and more arm's length
linkages between the Companies and their suppliers).
38. While the Companies are sometimes contracting external suppliers to produce brand-specific
components and -- more often -- generic components directly related to the manufacturing of vehicles, they
engage heavily in equity investment in firms less directly related to the automobile industry. These
investments include to some extent strategic investment to acquire new technologies that may become
relevant for the Companies' core business model in the future or relate simply to the diversification model
of the company. Out of the almost 500 subsidiaries of Company 1, only 5% of these subsidiaries are
directly related to the automobile industry. This share is slightly higher at 15% (38 out of approximately
250) for Company 2.
Linkages with arm's length suppliers: Substantial sourcing from global suppliers in production
markets
39. In each production plant, the Companies typically make the so-called make-or-buy assessment
for its components. That is, they will decide whether or not a component is produced within the plant,
imported from another plant of the Company, outsourced to a locally established supplier (MNE or purely
local supplier), or imported from an international supplier not established locally. This implies that the way
the supply chains of the Companies are organised varies significantly across plants and time. Company 1
has approximately 350 arm's length suppliers of which 33% are directly involved in automobile
manufacturing (assembly or components); Company 2 has around 270 suppliers of which 38% are closely
related to the production of automobiles (see Figure).
40. As highlighted above, proximity to first-tier suppliers is essential for both Companies. The
majority of first-tier components are sourced from international component suppliers (MNEs) that
themselves have production plants close to the Companies' assembly plants. In South Africa, the
Companies are sourcing around 50% of their components domestically, predominantly from large
international component suppliers (first-tier suppliers). As mentioned in the previous section, the
Companies engage in non-equity modes of investments with suppliers in South Africa to guarantee
exclusive buying rights of a specific component or to uphold intellectual property over a specific
technology. In many cases, however, the Companies are sourcing from global first-tier supplier at a purely
arm's length basis.
41. While it is an objective for the Companies to increase domestic sourcing of parts and components
(including from locally-owned SMEs) in each production plant, the company faces the challenge to ensure
that local producers, particular in emerging countries, have the technical capabilities and meet global
quality standards. Even if they may have the technical capability, it is often too costly and a somewhat
burdensome process to support local firms, particularly SMEs, in getting the needed quality certificates.
Despite these challenges, the Companies see a significant potential to increase sourcing from local SMEs
in South Africa, not least due to the incentives provided by the South African automobile policy. While
Company 1 is very sceptical about future sourcing from other SADC countries, Company 2 is much more

29
positive about this idea and is soon sourcing its wiring components from an international supplier moving
production to Botswana. More generally, the potential for local sourcing in emerging markets is
predominately embedded further up the value chain (second-tier and third-tier) due to lower requirements
for technical knowhow of the workers.
Foresight: Shifting modes of production and potential for Southern Africa
42. The Companies continue working towards a business model based on more customised vehicles
and shorter lead times. The latter implies to produce/assemble yet closer to the markets and ensure that key
global component manufacturers are also close to these markets (see sections above).
43. Both Companies also increase the focus on environmental concerns in the area of production of
vehicles as well as carbon emissions of vehicles themselves. Company 2 sees investment in this area
increasingly as an opportunity, which can also help to reduce costs (e.g. less consumption of energy in
production will result in lower costs). Besides the commercial reason for environmental improvements, the
Companies aspire to have and improve their image of environmental-friendly car producers.
44. With respect to technology, R&D and innovation, the Companies have been spending increasing
shares on R&D and innovation over recent years. These efforts are targeted to improve production and
supply chain processes (automation, robotics) as well as to enhance technologies integrated in the
Companies' vehicles. This is resulting in new partnerships with technology companies like Apple, Google,
Microsoft and alike. Just like for other components, the Companies are not investing in developing
capabilities in the area of new, digital technologies but through partnerships with leading digital
firms/platforms, the Companies are integrating new technologies in their production processes and
vehicles.
45. As to prospects for production in South Africa, both Companies see potential for expansion due
to the expected increase in demand in Africa and the low potential for other, smaller economies in Africa
to start producing automobiles. At the same time, as mentioned above, at least Company 2 sees a lot of
potential for smaller SADC countries to become important and relevant component suppliers, particularly
at the second- and third-tier level. However, for this to happen, SADC trade and investment integration
needs to become stronger (see next section). Company 1 is rather concerned about the more near term
growth potential in Africa: low availability of foreign currencies of buyers in their African markets for
selling as well as high exchange rate volatility has made business operations and production out of South
Africa difficult.
Box 4. Business perspectives on reforms
The Companies highlighted that without industry support in the form of a very predictable, clear and supportive
South African automobile policy the sector would not have emerged and would no longer exist in South Africa. Specific policies include, for example, reduced import duties on components as well as savings on import duties per unit of export of locally assembled vehicles.
The Companies provided policy perspectives that would support expansion of their own and of other automobile
companies' operations in South Africa and enable increased linkages with local suppliers in South Africa as well as with suppliers in other SADC countries:
Banning used vehicle imports in all SADC countries: The Companies suggested that there should be a very high import duty on used vehicles or a complete ban. The local automobile industry only grows with higher volumes/sales in the region. Used vehicle imports lower the volumes for new vehicles. The new automobile policy in South Africa stopped imports of used vehicles, which resulted in increased investment of car manufacturers in the country. Expanding this policy to the SADC level and possibly beyond would be welcomed by the Companies.

30
Tax breaks and duty reduction: The Companies proposed to make use of more tax breaks and import duties of new cars should be significantly reduced. Car producers spend too much on import duties for cars produced elsewhere. Avoiding these costs would all for more investments in the region.
Clear and possibly regional automobile policy: Long-term investments require clear, predictable and supportive policies. The South African automobile policy could be used for inspiration for a SADC-wide automobile policy.
More support for fixed capital investment: It was argued that more support for investment would help attracting more global suppliers to invest in the region. Currently, the automobile policy includes a 30% rebate for fixed capital investment (tax free cash grant), which is very useful but should be extended. The Companies also suggested that support could come in the form of rebates to buy land or of low-cost provision of firm-specific infrastructure needs (e.g. factory space, water supply, energy, etc.).
Engaging in large plurilateral trade deals: The Companies highlighted the important role of international trade and
investment agreements. The recent trade deal with the EU (SADC-EU EPA) involving duty free access to the European market allows boosting and retaining growth of vehicle sales out of South Africa. Similarly the AGOA agreement with the US has helped to boost exports. The Companies would welcome similar deals with countries in Asia. It is important to note that it is still duty preference what Companies are seeking mostly in international agreements. The Companies are less aware of other provisions and liberalization (including on investment and services) that may be covered in newer generation trade and investment deals.
The Companies also suggested policy action that would ensure that they retain their investments in the country. In this context, a particular emphasis was given to the need to lower logistics costs. Policy suggestions included:
Avoid inefficiencies in the use of rail: Among others, the reason for high rail costs in South Africa is not a lack of
investments but an inefficient use of assets. In particular, it is unfortunate that certain hours of the day are blocked off for passenger rail even if the rail is not used during those hours. Hence, the Companies argued that there should be a policy better regulating user slots for passenger and cargo transport, avoiding these inefficiencies. It was also argued that the fact that the rail costs are shared among those using it, less frequent use due to inefficiency unnecessarily increases costs.
Increase competition particularly in rail cargo: It is important not to carve out the private sector in the transport industry. For example, in many cases it is cheaper to move cargo on roads rather than rail. Low costs on roads are due to a very competitive private sector in the trucking industry. The Companies argued that it would be good to increase
competition in the rail industry to lower costs.
Support the development of the steel industry: The Companies argued that policies to support the development of a steel industry in South Africa would be highly welcomed. Currently, the South African car industry imports most steel products from outside Africa/SADC while South Africa itself (and SADC more broadly) has a lot of potential to develop a steel product industry. This would help to lower costs for steel products.
Notes: *The business insights have been collected through primary semi-structured interviews to lead firms in the sector. The two lead vehicle manufacturers from which the data is taken have a market share at above 5% globally and at above 10% in South Africa. The firm names cannot be disclosed for the purpose of this paper. The reported findings are preliminary.
COUNTRIES STRATEGIES
46. This section provides information about countries’ strategy to promote participation and
upgrading in the automotive value chain. It provides an overview of countries’ strategies; a summary of

31
main characteristics of targeted programmes in selected countries, an overview of incentives schemes for
FDI attraction. It concludes highlighting some success stories and lessons learned.
Overview of countries’ strategies
47. Many countries are taking steps to strengthen their positioning in the automotive value chain. The
“Questionnaire on Programmes to Support the Automotive Industry” aimed at identifying what type of
initiatives countries are implementing to promote the development of the automotive industry and the
participation and upgrading in global and regional value chains with a view to promoting peer-learning and
identifying principles to improve the effectiveness of policies in different contexts. Fifteen countries
replied to the questionnaire. Five are implementing targeted programmes (Brazil, Colombia, France,
Morocco and Uruguay). Four follow a horizontal approach (Costa Rica, Czech Republic, Mexico and
Turkey). The rest declared having a fairly small automotive industry, but have identified opportunities of
linkages through other activities (Chile, Dominican Republic, Ethiopia, Ireland, Peru and Singapore).
Korea has provided information about the evolution and current challenges for the automotive industry.
48. France and Korea have strong domestic industries with world leading large domestic companies.
Brazil hosts most world leading automotive producers and has a network of suppliers which mostly operate
for the MERCOSUR market. Mexico and Turkey have developed strong assembly capacities and are
moving up the chain to add value and local content to the domestic production. Morocco is taking
advantage of FDI from OECD countries to set up a domestic automotive industry linked to global markets,
while Colombia is looking at developing domestic technological capabilities to strengthen the domestic
production. Costa Rica and Czech Republic mostly operate as platforms for exports thanks to settlements
of specific production processes related to the industry. Uruguay’s participation to the industry is mostly
determined by its cooperation with Brazil and the linkage with MERCOSUR. Ireland is looking to become
a technology hub providing high tech manufacturing and knowledge intensive services to the global
industry, including in automotive and aerospace. Singapore is linked to the automotive chain through its
electronics and components specialised producers. Dominican Republic and Ethiopia have identified the
sector as a potential area of future industrial development based on some accumulated capacities, while
Chile and Peru, which are net importers of vehicles, have identified opportunities to linking with the
automotive value chain through developing suppliers’ capacities in related production and technological
area, including copper, design and textiles.
49. Countries are following different approaches in promoting the automotive industry and the
participation in its value chain (Table 4):
i) Five countries are implementing targeted programmes (Brazil, Colombia, France, Morocco
and Uruguay). These programmes prioritise the strengthening of the domestic supply chain.
Three of them include incentives for innovation (Brazil, Colombia and France) and two (Brazil
and France) green targets. Of the five countries, Morocco is the one that prioritises FDI attraction
as a lever for transformative change, the others point to the strengthening of the domestic base
and its export orientation. Targeted programmes are implemented through multi-institution
settings and a broad policy mix. Countries use different combinations of tools, including fiscal
incentives, programmes for skills development, business services, demand-side support and
standards setting. In addition to the Ministries of Trade, Industry and Economy, development
banks and institutions in charge of science, technology and innovation are involved as
responsible institutions.
ii) Four countries (Costa Rica, Czech Republic, Mexico and Turkey) affirmed that they rely
on horizontal programmes to promote industrial development. Despite the differences, most of

32
these programmes include a broad policy mix, including incentives for FDI attraction, but also
for innovation, job creation, training and strengthening of the local supply chain.
iii) Some countries use Special Economic Zones (SEZs) as main tools for setting up capabilities
linked to the automotive value chain. Colombia, Costa Rica, Dominican Republic and Morocco
rely on these schemes as main drivers of support for industrial development. Despite the
differences in approach, all respondents highlighted the importance of setting up schemes for
local-supply and human capital development.
iv) Some countries implement programmes to promote linkages between domestic companies
and the global automotive value chain. Strengthening domestic suppliers’ capabilities and
reducing information gaps are the main objectives of programmes to support the creation of
linkages between clients and suppliers.
Table 4. Comparative overview of policy priorities for the automotive value chain, 2015
High specialisation Medium specialisation Low specialisation
Policy Priorities MEX FRA CZE TUR BRA MAR URU COL CRI IRL DOM
Strengthening the domestic supply chain
-
*t
-
* *t *
t *
t *
t
- - -
Creating/maintaining jobs
* * * *
-
*t
*t
- -
*
Attracting FDI
*
-
*
- -
*t *
t
* *
-
Promoting exports
- - - -
*t
- -
*t
- -
*
Fostering innovation
* *t *
-
*t
- -
*t
-
*
-
Greening the industry
-
*t
- -
*t
- - - - - --
Notes: This visualisation is not meant to be exhaustive, it summarises the policy priorities (*) as reported by the countries.
t indicates that the country has a targeted program for the automotive industry in relation to the priority. High specialisation means a share of automotive manufacturing value added over total MVA of ≥15%, Medium specialization between 5% and 15% and low specialization < 5%.
Source: Authors’ elaboration based on the stocktaking of “Policies for Upgrading in the Automotive Industry” carried out in the framework of the OECD Initiative for Policy Dialogue on GVCs, Production Transformation and Development.
Targeted programmes for the automotive industry
50. Five countries are implementing targeted programmes for the automotive industry (Brazil,
Colombia, France, Morocco and Uruguay). They all prioritise the strengthening of the domestic supply
chain. Three include incentives for innovation (Brazil, Colombia and France) and two (Brazil and France)

33
green targets. Of the five countries, Morocco is the one that prioritises FDI attraction as a lever for
transformative change, the others point to the strengthening of the domestic base and its export orientation.
51. Targeted programmes to promote the automotive industry, as reported by responding
countries, differ in most aspects, but also present some similarities. Table 5 summarises the main
characteristics of the different targeted programmes. Three major country approaches seem to appear:
i) strengthening domestic industrial capacities, as, for example Inovarauto in Brazil, the production
transformation programme in Colombia and the Automotive Plan in France;
ii) leveraging on FDI as a driver of transformative change, as in the case of Morocco which points to
increase the attraction of FDI in 2nd
and 3rd
tier types of operations in targeted industrial
platforms;
iii) strengthening export capacities, as in the case of Uruguay where the opportunities of participation
and upgrading in the chain are mostly determined by the MERCOSUR agreement.
52. Country approaches also differ in time horizon and objectives. The Colombian programme is
embedded in a long-term strategy of production transformation with targets to be achieved by 2032. Brazil
and Morocco follow a multi-year planning, while the French Automotive Plan does not have a pre-
determined end date. In Uruguay, the incentive regime expired in 2015 due to WTO requirements.

34
Table 5. Main characteristics of targeted programmes to promote the automotive industry, 2014
Brazil Colombia France Morocco Uruguay
Name
INOVARAUTO Production Transformation Programme
Plan Automobile Pact for Industrial Resurgence- Automotive
Automotive Industry Export Promotion Regime
Responsible Institution
Ministry of Development, Industry and Foreign Trade
Ministry of Trade, Industry and Tourism
Ministry of Economic Regeneration and E-economy
Ministry of Industry, Trade, Investment and E-economy
Ministry of Industry, Energy and Mining
Time frame
2013/2017 2009/2032 2012/ no termination date
2009/2015 1992 (Expiration foreseen in 2015 following up WTO rules)
Objectives
a. Strengthening National Supply Chain
Strengthen national supply chain (reaching a minimum investment of 1% of gross revenues from sales of goods and services net of taxes, of qualified companies)
Revenues (including exports) of at least 3.4 USD billion Exports of 1.1 USD billion Jobs: at least 33 000 (by 2032)
Strengthening linkages among local suppliers
Increase in GDP of 12 billion Dirhams and 70 000 new jobs by 2015 Setting up of 2
nd
and 3rd
tiers factories
Promotion of exports in certain industrial segments, mostly focused on MERCOSUR
b. Green Targets
Increasing energy efficiency of vehicles (efficiency goal of 1.82 MJ/km of all cars sold in the country by 2017)
To develop affordable green vehicles
c. Innovation
Increasing R&D and engineering capacities (0.5% of gross revenues from sales of goods and services matching with grants from FNDCT)
Promote innovation through the Centre for Technological Development of Automotive Industry (CDTIA/TECNNA)
Increase innovation content
Territorial Dimension
National Initiative National Initiative, in coordination with Regional Competitiveness Commissions
National initiative in coordination with local authorities
National, with territorial dimension (Tanger, Keintra and Casablanca)
National Initiative
Budget N. A. N. A. 1.4 billion Euros N. A. N. A.
Monitoring and Evaluation
ABDI is in charge of developing a monitoring system for the programme
National Planning Department is in charge of M&E
No evaluation foreseen
A Monitoring Committee with private and public stakeholders has been established
No evaluation carried out, or foreseen
Links Here Here Here Here

35
Source: Note: FNDCT (National Fund for Scientific and Technological Development); ABDI (Brazilian Agency for Industrial Development), Brazil.
Source: Based on country responses to the questionnaire on "Targeted Programmes to Promote the Automotive Industry".
53. All respondents have identified the strengthening of the domestic supply chain as a key
objective of the targeted programmes. In some cases, countries have set job targets (Colombia and
Morocco), in other export targets (Brazil, Colombia), in others investment targets (Brazil), or generic
indications (Uruguay). Brazil and France also have specific targets linked to green cars and sustainable
development, while Brazil and Colombia have identified as main objectives of government support the
promotion of technological development and innovation. Colombia has instituted a new Centre for
Technological Development of the Automotive Industry to support R&D and technological development in
the sector.
54. According to the results of the questionnaire, Colombia, France and Morocco are the
countries in which the targeted programmes for the automotive industry have the highest territorial
component. In Morocco, the Plan for Industrial Development is articulated through territorial industrial
platforms in which MNC companies engage in operations with domestic suppliers.
55. Brazil, Colombia and Morocco have set up mechanisms for monitoring implementation;
while in France and Uruguay no targeted evaluations have been carried out or are foreseen. Morocco has
set up a Monitoring Committee composed by representatives from the Ministry of Interior, Ministry of
Economy and Finance, Ministry of Industry and Trade, Ministry of Employment, and representatives from
private sector including the General Industrial Confederation of Morocco and from professional
associations. Morocco has also indicated that the system in place has benefited from inspiration of other
countries’ experiences including Brazil, Turkey and China.
56. Targeted programmes are implemented through multi-institution settings and a broad policy mix.
Countries use different combinations of tools, including fiscal incentives, programmes for skills
development, business services, demand side support and standards setting. In addition to the Ministries of
Trade, Industry and Economy, development banks and institutions in charge of science, technology and
innovation are involved as responsible institutions.
57. Countries promote the automotive industry through a multi-institution and broad-policy mix.
From the responses of the five countries that declared to have in place targeted programmes to support the
automotive industry, it appears that government’s promotion is done through a multi-institution and broad
policy mix which includes financial support, programmes for skills development, business services,
demand-side incentives and systems for standard-setting.
58. Table 6 summarises the replies about the composition of the policy mix. It highlights the
domain of intervention (finance, skills, business services, demand-side support and standards) and it
presents an overview of the conditionalities and the innovation content of main programmes.
Table 6. Policy mix of targeted programmes for the automotive industry, 2015
TYPE OF INCENTIVE
COUNTRY/ RESPONSIBLE INSTITUTION
DESCRIPTION/ BENEFICIARIES
CONDITIONALITIES
INNOVATION CONTENT

36
FIN
AN
CE
Fis
ca
l In
ce
ntives
Brazil
(Ministry of Industry and Foreign Trade)
MNCs and domestic companies
Minimum requirements of R&D and investments in engineering and BIT
Domestic tech. dev; adoption of foreign frontier technology.
Colombia (Bancoldex) Domestic companies NO NO
France (Ministry of
Research) All companies carrying out R&D
NO All innovation activities
Morocco (Ministry of
Economy and Finance)
Total exemption for 5 years for all companies located in SEZs
Beneficiaries need to be located in SEZ
NO
Uruguay (tax credit linked to export performance
Local content requirement (20% of national value added)
NO
Ma
tch
ing
Fu
nds/G
ran
ts
Colombia (Innpulsa
Colciencias)
Domestic companies, specific line for SMEs
Cooperation among local suppliers
Adaptation to domestic market
France (Ministry of
Economy)
All companies carrying out R&D on future cars
NO
Future-oriented research and affordable green vehicles
Morocco State contribution of up to 10% of total investment
Beneficiaries need to be located in SEZ
NO
SKILLS
Brazil (Ministry of
Industry and Education) Technical (Pronatec) & Higher Education
Cooperation between private sector, local universities and training institutes
Colombia (National Learning Service and Centre for Technological Development of Automotive
Industry)
Morocco
Creation of Training Institute for Skills for Automotive sector; grants for training
Partnerships with private sector
BUSINESS SERVICES
Brazil (Brazilian
Agency for Export Promotion)
Domestic and MNCs Companies
The company should operate in Brazil (or willing to)
Colombia (Bancoldex) Domestic companies
Morocco (Industrial
Platforms offer a one-stop-shop for business services)
DE
MA
ND
SID
E S
UP
PO
RT
Pu
blic
Pro
cu
rem
ent
Brazil (Ministry of
Planning and Agrarian Development)
MNCs and domestic companies
Companies capable of giving after-sale assistance over all national territory
Special incentives for adaptation to local markets
Colombia (Agency for
Efficient Purchase) Domestic companies
None
France 25% of purchased cars are hybrid or electric
Green cars
Oth
er France (Ministry of
Environment)
Taxes on high emission vehicles and fiscal incentives to buy green cars
Green Cars
STANDARDS Brazil (Inmetro- National Institute for Metrology, Quality and Technology) Source: Based on country responses to the questionnaire on "Targeted Programmes to Promote the Automotive Industry".

37
Attracting FDI and creating jobs through horizontal schemes
59. Four countries (Costa Rica, Czech Republic, Mexico and Turkey) have affirmed that they rely on
horizontal programmes to promote industrial development. Despite the differences, most of these
programmes include a broad policy mix, including incentives for FDI attraction, but also for innovation,
job creation, training and strengthening of the local supply chain.
60. In Czech Republic, the National Incentive Scheme defines the conditions for the attraction of
FDI. The scheme includes tax incentives, grants for job creation and training, preferential rates for land and
infrastructure use and grants for capital investment. Beneficiaries not only include manufacturing
companies setting up a green field project or expanding an existing business, but also technology centres
and business support services centres. Beneficiaries need to comply with certain conditionalities, including
job creation targets. Conditions differ for type of investment and region in which the investment is made.
Preferential conditions are applied for “strategic” investments, as identified by the government. Table 7
summarises the main characteristics of the policy mix of the National Incentive Scheme.
Table 7. Policy mix of the National Incentive Scheme, Czech Republic, 2014
POLICY MIX
CORPORATE INCOME TAX RELIEF
PARTIAL CORPORATE INCOME TAX RELIEF
JOB CREATION GRANTS
TRAINING AND RETRAINING GRANTS
SITE SUPPORT
CASH GRANT ON CAPITAL INVESTMENT
BENEFICIARIES Manufacturing fırms Technology Centres Business support services centres
CONDITIONALITIES
REGULAR Min. investment within 3 years CZK 100 million (approx. USD 5 million). This limit is reduced in regions with high unemployment. Investors’ own equity half of the investment min. Min. investment in new machinery CZK 50 million (approx. USD 2.5 million).
STRATEGIC Min. investment within 3 years CZK 500 million (approx. USD 25 million) Min. investment in new machinery CZK 250 million (approx. USD 12.5 million) The investor must create at least 500 new jobs.
REGULAR Min. investment within 3 years CZK 10 million (approx. USD 0.5 million) Investors’ own equity half of the investment min. Min. investment in new machinery CZK 5 million (approx. USD 0.25 million) The investor must create at least 40 new jobs.
STRATEGIC Min. investment within 3 years CZK 200 million (approx. USD 10 million) Min. investment in new machinery CZK 100 million (approx. USD 5 million) The investor must create at least 120 new jobs.
REGULAR Creation of at least 40 new jobs at software development centres. Creation of at least 100 new jobs at other business support services centres (shared service centres and high-tech repair centres).
ELIGIBLE COSTS Long-term assets, when the value of machinery comprises at least half of the value of acquired assets.
Long-term assets, when the value of machinery comprises at least half of the value of acquired assets.

38
MAXIMUM STATE AID
40 % of total eligible costs (30 % in Southwest Regions and for investment in low-tech sectors).
40 % of total eligible costs.
Source: Based on country responses to the questionnaire on "Targeted Programmes to Promote the Automotive Industry".
61. In Mexico, there are several horizontal programmes that can benefit the automotive sector. These
include PRODIAT, the Technological Development Programme for Industry, PROSOFT, the incentive to
promote the productive use of ICTs for business, the CONACYT’s incentives for innovation, NAFIN’s
programme to strengthen local suppliers and the ProMexico fund to attract FDI and promote regional
development (Table 8).
Table 8. Non targeted schemes with high impact for the automotive industry, Mexico, 2015
Technological development Programme (PRODIAT)
PROSOFT
Programmes to promote innovation
Suppliers Financing Programme
ProMexico Fund
Objectives/ Brief description
Business services, training, certifications and fiscal incentives to allow SMEs to become suppliers of large companies.
Promoting use of ICT to increase productivity.
Fund for technological development and innovation
Financing for working capital and fixed assets acquisition to suppliers of any industry to promote growth and increase local content.
Financial incentives to attract FDI and promote national and regional development.
Year of introduction
2009 2008 2009 N/A. N/A.
Time of frame
3 year programme, but with annual budget approval)
N/A Budget is approved annually by congress
Upon exhaustion of current budget
N/A.
Main Responsible Institution
Ministry of Economy
Ministry of Economy
National Council for Science and Technology (CONACYT)
NAFIN (SMEs Development Bank)
Ministry of Economy
Territorial Dimensions
Federal Federal Federal Federal Federal with matching resources from States
Budget 200 mıllıon pesos approved in 2014 (USD 15.4 million).
700 mıllıons pesos approved in 2014 (USD 5.4 million).
4 000 million pesos in 2014 (USD 30.8 million). .
500 million pesos (USD 38.5 million).
N/A.
Source: Based on country responses to the questionnaire on "Targeted Programmes to Promote the Automotive Industry".
62. Turkey has introduced in 2012 an Investment Incentives System with the objectives of
promoting production transformation and specialisation in higher value added activities, increasing jobs
and reducing territorial disparities. The system targets both domestic and foreign companies and it includes
four categories of incentives by type of investment: general, regional, large scale and strategic. Each
includes a different mix of incentives (Table 9). The different schemes are applied taking into account the
characteristics of the region in which the investment is made. In order to apply the scheme, the Ministry of

39
Development has set up six economic and functional regions, grouping Turkish provinces on the basis of
socio-economic indicators. The most favourable conditions are applied to lagging regions. The monitoring
results of the Ministry of Economy indicate that the sector plans further new investment projects.
Table 9. Incentives schemes in Turkey, 2015
Incentives General Investment Incentives
Regional Investment Incentives
Large-Scale Investment Incentives
Strategic Investment Incentives
VAT Exemption
Customs Duty Exemption
Tax Reduction
Social Security Premium Support (Employer’s Share)
Income Tax Withholding Allowance *
Social Security Premium Support(Employee’s Share) *
Interest Rate Support **
Land Allocation
VAT Refund***
Source: Based on country responses to the questionnaire on "Targeted Programmes to Promote the Automotive Industry".
Success stories and lessons learned
63. [to be completed]
Special Economic Zones are increasingly used to create capabilities in new-comers countries
64. Some countries use SEZs as main tools for setting up capabilities linked to the automotive value
chain. Colombia, Costa Rica, Dominican Republic and Morocco rely on these schemes as main drivers of
support for industrial development. Despite the differences in approach, all respondents highlighted the
importance of setting up schemes for local-supply and human capital development. Colombia, Costa Rica,
Dominican Republic and Morocco have reported that they have SEZs that can be instrumental to linking
domestic industry to the global automotive value chain. Even though no SEZ is targeted to any specific
sector, on average companies operating in similar sectors and activities tend to locate in the same SEZ.
65. In Morocco the implementation of the action plan for the automotive industry is linked to the
operationalisation of Integrated Industrial Platforms, two of which are targeted to the automotive industry,
the Tanger Automotive City which started its operations in 2013 and the Kenitra Automotive City. The
SEZs of Tanger and Casablanca host automotive assembly MNCs. The novelty of the integrated industrial
platforms is the willingness to develop localised clusters of competencies, including the training of
specialised workers and the objective of developing a more integrated value chain in the country. The
majority of the automotive industry is clustered in the northern regions, which account for more than 43 %
of the total number of companies operating in the automotive sector at the national level.The Casablanca
region and the city of Kenitra account for the residual 39% and 7% respectively. The Grand Project
Renault (with an estimated production capacity of 340 000 vehicles per year) has represented a major step
in supporting the development of the industry in the country and put Morocco on the spot of global
investors.
66. Since the 1990s, manufacturers of auto parts, components and accessories for the automotive
industry have established manufacturing operations in the SEZs in Dominican Republic. In addition to

40
fiscal incentives, the availability of skilled human resources in disciplines related to the automotive
industry, such as electrical and electronics manufacturing played an important role in attracting foreign
companies. Moreover, the industrial parks located near Santo Domingo have top quality infrastructure and
provide business services to hosted companies. The processing of leather used for seats and interiors
manufacturing is clustered in the northern region, where there is a cluster of footwear and leather goods
products.
67. In Dominican Republic, the Free Trade regime was introduced at the same time as in Costa
Rica. It is managed by the National Free Zones Council (CNZFE) and it aims at attracting domestic and
foreign companies engaged in the manufacturing of goods and/or provision of services, primarily for the
export market, through the provision of fiscal incentives. The fiscal incentive scheme (Table 10) includes
technology transfer as a provision, but not as a mandatory requirement. The CNZFE has created a Division
of Productive Chains with the aim of establishing business linkages between companies operating in the
SEZs and domestic ones. As in Costa Rica, the government has invested in promoting training of human
capital in disciplines related to the main industries operating in the SEZs, in partnership with the National
Institute for Vocational Training (INFOTEP).
68. Dominican Republic is now in the process of shifting towards a more selective approach to
FDI attraction by prioritizing technology intensive sectors and higher value added activities. The CNZFE is
developing an investment attraction programme to foster strategic partnerships with countries that have a
high share of trade in the automotive industry. Incentives are offered to set up trade missions to scout out
potential investors, benefiting from the preferential access to the US and EU markets through existing
trade agreements.
Table 10. Main characteristics of the SEZ regime, Dominican Republic, 2015
Main characteristics
Legal reference Act Promoting Free Zones (Ley 8-90 de Fomento a las Zonas Francas)
Governance National Free Export Zones Council (CNZFE)
Year of introduction 1990
Objectives
Job creation FDI attraction Export promotion Technology transfer
Origin Modification on the basis of the 1969 Act 299 for Industrial Incentive and Protection.
Main Focus It targets domestic and foreign companies engaged in the manufacture of goods and/or provision of services, primarily for the export market.
Budget Estimated tributary expenditure: US$ million 541, according to 2014’s Budget Act. Monitoring and Evaluation
Free Zone Sector Statistic Report 2013 http://www.cnzfe.gob.do/documentos/informesestadisticos/InfEst2012Esp.pdf (Spanish)
Additional information
The programme has not been designed to promote any industry in particular. However, now the country is interested in promoting investments which could generate a cluster of suppliers for the automotive industry in the country.
Source: Based on country responses to the questionnaire on "Targeted Programmes to Promote the Automotive Industry".
Well-managed programmes for client-suppliers linkages help connecting domestic SMEs
69. Strengthening domestic suppliers’ capabilities and reducing information gaps are the main
objectives of programmes to support the creation of linkages between clients and suppliers.
70. Linkages between domestic suppliers and lead companies in the automotive industry do not
happen spontaneously. Most countries highlighted the need to increase the business and technological
capabilities of domestic companies in order to allow them to match the standards and requirements of lead
companies, in terms of capabilities, quality and scale of operation. Countries also reported the need to

41
reduce asymmetry of information and facilitating matchmaking between local suppliers and lead firms,
considering that in many emerging and developing economies, local firms still need to develop a
trustworthy and reliable reputation.
71. Supplier’s development programs are both targeted and horizontal. For example, Brazil
reported about a targeted program to promote supply chain development in the automotive industry, while
Costa Rica informed about a national suppliers’ development scheme (Costa Rica Provee) which does not
have a sectoral focus. Table 11 presents an overview of these two programs.
Table 11. Promoting suppliers development and linkages, Brazil, Costa Rica, 2014
Country Brazil Costa Rica
Name Productive Linkage Automotive Sector Brazil
Costa Rica Provee
Targeted to the automotive
YES NO
Responsible Agency
Brazilian Service to Support Micro and Small Enterprise - SEBRAE
PROCOMER (Costa Rica Foreign Trade Promotion Agency)
Year 2014/2017 1999 (no termination date)
Objective
Measurable targets: Participation of 9 automakers and training of at least 9 groups of 25 small and medium companies.
Matchmaking and build capacities to engage with MNCs
Origin The programme has been designed based on other country experiences in a partnership with UNCTAD.
Support of IADB
Main focus Service providers and SME auto parts producers
Based on demand from MNCs, focusing on domestic producers and service providers
Territorial Dimension
National actors responsible for the design and coordination of the programme Regional actors responsible for the implementation.
National Initiative
Public-private partnership
Automakers companies provide training to their suppliers.
On-going design of new line of action, in partnership with WB to involve MNCs in training of local suppliers.
Policy mix Services to increase the quality of the process and the product innovation human capital training.
Matchmaking, feasibility studies, online marketplace for connecting MNCs and local suppliers.
Budget N/A. Small annual budget. The Agency is managed by 1 director with 6 trade specialists.
Evaluation N/A.
The Presidential Council for Competitiveness and Innovation carried out, jointly with the IADB, an evaluation of the programme. Results suggest that there are significant positive, albeit small, impacts, and that these are significantly magnified when matchmaking efforts are combined with innovation oriented grants that support in the development of domestic innovation capacities.
Source: Based on country responses to the questionnaire on "Targeted Programmes to Promote the Automotive Industry".
72. The programme Productive Linkage Automotive Sector in Brazil was introduced in 2014 with
the main objective of providing services to SMEs; the programme includes targeted training carried out by
automakers to their suppliers in order to enhance their production and innovation capacities. PRODIAT is

42
a program managed by the Ministry of Economy and introduced in 2009 to support technological
development. It focuses on reducing the information gap between large companies and potential domestic
suppliers; the programme also offers financial support for SMs certifications to allow them to operate as
sub-contractors. The Costa Rica Proove was introduced in 1999 and was not directly designed for
automotive. The objective of the program is matchmaking and building capacities to engage with MNCs.
Although it has a small annual budget there is an evaluation program. The Presidential Council for
Competitiveness and Innovation carried out, jointly with the IADB, an evaluation of the programme.
73. In Colombia, PROEXPORT COLOMBIA is responsible for promoting exports and investment
and to develop business opportunities between local suppliers and foreign companies. Other countries that
have horizontal programs for enhancing linkages between domestic suppliers and foreign MNCs that are
not specifically targeted to the automotive sector include Dominican Republic and Ireland.
Learning from FDI is not automatic and targeted initiatives are needed
74. [to be completed]
SCENARIOS FOR THE FUTURE
75. [to be developed]
76. New technology and vehicles concepts as well as new transportation services are contributing to
redefine the industry. Open questions remain about the impact of these changes within the firms, between
firms and across the globe. This section summarises what countries have reported has priorities for their
strategies, as well as indications for future business scenarios based on consultations with the private
sector.
What countries see ask key challenges for the future
77. Growing demand from middle classes, shift in consumer preferences, growing electronic
knowledge content of cars and search for greener solutions are among the major issues that are redefining
the competitive landscape of the automotive industry. Most countries and companies are devising new
strategies to cope with them.
78. Countries face different challenges about how to strengthen their position in the automotive value
chain, depending on the level of development of the industry, their market structure and their historical
patterns. All countries face the major challenge of getting prepared for more energy efficient and green
solutions to address sustainable development goals, especially in emerging economies where new middle
classes are boosting new consumer markets.
79. Countries that have consolidated assembly capacities, such as Brazil, Mexico and Turkey face the
challenge of increasing the domestic content and locally generated value added of domestic production.
The challenges include not only improving market conditions, distribution chains, domestic technological
capabilities and increasing market access in emerging markets. They also include addressing the need of
strengthening reputation and “made in” concepts which can support the domestic scaling up. Korea is
facing the challenge of increasing the flexibility and experimentation capacity of the industry which so far

43
has been mostly dominated by large domestic conglomerates reducing the possibilities for SMEs to enter
into the value chain. The countries which are pointing to develop over the medium run a domestic
automotive industry, such as Morocco, face the major challenge of getting the number and quality of
trained personnel and of increasing regional trade with the growing African market. Smaller countries,
such as Costa Rica, face the challenge of overcoming size barriers to promote further expansion of the
operations hosted in the country.
Tapping into new consumers’ preferences and increasing linkage with emerging markets.
80. Countries with a well-established automotive industry, such as Korea, Mexico and Turkey are
looking forward to tap into the growing demand from the emerging middle classes in emerging and
developing economies and they are looking forward to strengthening their capabilities to benefit from the
shift in consumers’ preferences towards light vehicles. Korea has highlighted that its domestic industry, led
by large domestic original equipment manufacturers (OEMs) has started to benefit from new market
opportunities in emerging economies, including China and India. Mexico, which is host to main
international OEMs, already produced light vehicle models for the US market, the associated accumulated
learning in know-how has been indicated as an asset to be able to quickly respond to the new demands
coming from priority emerging markets, which for Mexico are China, Brazil and India. Uruguay, whose
linkages with the automotive supply chain are mostly determined by MERCOSUR, has focused on
strengthening the capacities of its supply base to respond to the evolution of the industry in the regional
market. A major step in this direction has been the trade agreement with Brazil, signed in 2008, which
favours the installation of new suppliers in Uruguay, allowing an increase in export and the diversification
of destination markets.
81. Peru recognises the potential in strengthening its domestic production and exports of vehicle
and auto parts and accessories, but declares that there is no targeted policy to promote this activity.
Ethiopia has declared to identify a potential opportunity in attracting MNCs for assembling activities in
automobiles and tractors in order to benefit from the growing demand coming from the new middle class in
the regional market and due to the growing demand for tractors from agricultural cooperatives, but has
highlighted that there is no targeted policy in place yet and that a major challenge to increase participation
in the value chain is the fact that country is land-locked. Ireland, on the other hand, sees an opportunity in
the growing internationalisation of its niche of subcomponent manufacturers specialised in precision
engineering, tool making, plastics and metal fabrication supplying both the automotive and aviation
industries, and has developed a targeted Global Sourcing Strategy to this purpose.
Upgrading and innovating
82. Turkey has declared that the accumulated capabilities in the automotive industry, which
started to develop in the 1960s in the country, offered a good learning base to be able to tap into the
preference shift towards light vehicles, having as a destination market especially the EU. The Turkish
industry has strong linkages with traditional car manufactures, and has developed over time domestic
industrial and design capabilities that allowed the industry to introduce into the EU markets originally
designed cars, such as Fiat-Doblo. Turkey is pointing to increase the innovation and knowledge content of
the industry in the country and to intensify the domestic production chain.
83. In Ireland the industries of software and electronics offer increasing opportunities for
linkages with the automotive and aeronautics value chain. The technology sector in Ireland directly
employs over 105 000 people, with 75% employed in multinational companies and the remainder in the
domestic digital technology sector. The sector is responsible for 40% Ireland’s national exports and is
44
home to the top ten global technology companies1. The Irish Centre for Composites Research (IComp) was
established in 2010 under the EI/IDA Technology Centre initiative. It is hosted by the University of
Limerick (UL) which is the leading composites research establishment in Ireland, working in partnership
with University College Dublin (UCD). IComp bridges industry and academia to focus on the critical
requirements of priority industrial sectors, including aerospace, renewable energy and construction. IComp
currently has 14 industrial members from across Ireland.2
Greening the industry
84. Brazil, France and Korea have identified as future opportunity the development of greener
and more energy efficient cars based on the development of new technologies. France has launched two
plans on universal cars consuming less than 2 litres per 100 km and driverless vehicles and has two
industrial plans on electric charging stations and on battery life and power. Colombia is also working on
several initiatives in support of vehicle and auto parts industry including the generation of the regulatory
framework for the development of electric vehicles.
How the future will look like?
Changes in demand
New preferences: safer and greener cars
New markets: rising demand in emerging markets
85. While demand for cars will most likely remain steady in developed regions in the future, demand
will be growing faster in developing countries such as China or India, particularly in light vehicles (PWC
2016). Indeed, over the past 20 years growth in the automobile industry has come from emerging
markets—much of it in China, which over the past decade has seen auto sales almost triple, (from slightly
less than 8.5 million cars and trucks sold in 2004 to, estimates suggest, about 25 million in 2014). IHS
Automotive predicts that more than 30 million vehicles a year will be sold in China by 2020, up from
nearly 22 million in 2010.
86. In the decades ahead, China’s emergence as a dominant market and production centre should
have major implications for how cars are designed. Chinese tastes and standards, particularly at the luxury
end, where automakers are notably raising the bar, will have a global influence (McKinsey, 2014). In
addition, with strong local demand as a base, a number of Chinese automakers will probably consolidate,
become better able to serve their domestic market, and then seek to achieve an international impact,
perhaps through joint ventures, partnerships, or other combinations with global companies (McKinsey,
2014).
87. To some extent, the market size will determine how a country can benefit from the shift in car
demand to emerging markets. Smaller developing countries (e.g. Botswana) will only be able to attract FDI
of lead firms and first-tier suppliers if they have a cost advantage or are located close to reasonably large
and rich countries, such as South Africa. A few mid-sized middle-income countries, such as South Africa,
Turkey or Thailand can support hub activities in assembly under the condition that they can supply to the
wider region as well (Van Biesebrock & Sturgeon, 2009, Feizabadi, 2014).
1 http://www.ictireland.ie/Sectors/ICT/ICT.nsf/vPages/Papers_and_Sector_Data~sector-profile?OpenDocument
2 http://www.icomp.ie/index.php/about-icomp

45
88. The close collaboration of lead firms and global first-tier suppliers may work to the advantage of
emerging markets. Currently, the design activities are still very much concentrated close to headquarters of
lead firms. However, as emerging markets will grow larger in future, lead firms and first-tier suppliers will
inevitably set up local design centres in major emerging markets such as China, India or Brazil. Local
suppliers will benefit - particularly tier 2 and tier 3- from the spill overs that these local design activities
generate if they are able to satisfy the quality standards set by lead firms and first-tier suppliers (Van
Biesebrock & Sturgeon, 2009).
Changes in products
89. The intelligent car is fast moving from the drawing board to the streets. As an obvious precursor to
the autonomous vehicle, the intelligent car can give drivers a first taste of the experience of relinquishing
control of a vehicle, with such functions as self-braking, self-parking, automatic cruise control based on
road conditions, automatic accident-avoidance features, computer-operated power steering, and electric
parking brakes, as well as electronic throttles and engine control.
The green car and the driver-less car
90. Demand for smaller and lighter cars is predicted to increase substantially in the next decade
(PWC, 2016 and Feizabadi, 2014). Moreover, consumer preferences are forecast to shift from privately
owned “all-purpose” vehicles towards shared “fit-for-purpose” vehicles (McKinsey, 2016). The trend for
shared vehicles will be driven by the ongoing trend towards urbanization. There will also be an increasing
importance of connectivity services in future car generations that will provide opportunities for entry for a
variety of new players from the IT and software industry (McKinsey 2015, 2016). In addition, car-sharing
services, which allow people to make a reservation at the tap of a personal mobile device, are expected to grow
significantly in the next two years, with dramatic increases in the number of users and in revenues
91. The car of the future will be connected—able not only to monitor, in real time, its own working
parts and the safety of conditions around it but also to communicate with other vehicles and with an
increasingly intelligent roadway infrastructure. These features will be must-haves for all cars, which will
become less like metal boxes and more like integrators of multiple technologies, productive data centres—
and, ultimately, components of a larger mobility network. As every vehicle becomes a source for receiving
and transmitting bits of information over millions of iterations, safety and efficiency should improve and
automakers should be in a position to capture valuable data. In addition, embedded data sensors should
enable more precise monitoring of the performance of vehicles and components, suggesting new
opportunities for lean-manufacturing techniques to eliminate anything customers don’t value and
dovetailing with the digitization of operations to boost productivity, including the productivity of suppliers,
in unexpected ways. For instance, V2V, or vehicle-to-vehicle communication, will allow cars to
communicate with each other over a dedicated Wi-Fi band and share information about vehicle speed,
direction of travel, traffic flow, and road and weather conditions.
92. Cars and trucks produce air pollution throughout their life, including pollution emitted during
vehicle operation, refueling and disposal. Additional emissions are also associated with the refining and
distribution of vehicle fuel. In the short term, air pollution will continue to affect car and truck use;
however, it is clear that the automobile industry is embarking on an era of significant change. Rapid
innovation is delivering a variety of different ways of powering vehicles.
93. The Ultra-Light Electric Vehicle (ULEV), for instance, emits extremely low levels of carbon
dioxide (CO2) compared to conventional vehicles fuelled by petrol/diesel. As well as consumers buying
lower CO2 emitting vehicles, the reduction in emissions is attributable to a range of technological

46
innovations including improvements to the efficiency of the internal combustion engine, stop-start
technology and vehicle light weighting. Indeed, the increasing uptake of these technologies will play a
large role in driving down air pollution in the medium to long term. But, having started from a low base,
EV’s still only represent a small fraction of the global car market, so there is still a long way to go. More
consumers need convincing that electric vehicles have the range and performance to suit their needs, and
‘charging’ infrastructure across the globe - especially in urban centers - needs considerably more
investment.
94. Currently, human error contributes to about 90 percent of all accidents, but autonomous vehicles
programmed not to crash are on the horizon. To be sure, some technological issues remain, emissions
issues will linger, and regulators are sure to have a say. The most difficult issue is likely to be the transition
period, while both kinds of cars learn to share the road before self-driving ones predominate. The possible
benefits, by contrast, read like fantasy. If we imagine cars programmed to avoid a crash—indeed,
programmed never to crash— this would be a sea change. Passengers, responsible only for choosing the
destination, would have the freedom to do what they please in a vehicle. Disabled, elderly, and visually
impaired people would enjoy much greater mobility. Throughput on roads and highways would be
continually optimized, easing congestion and shortening commuting times (McKinsey, 2014).
95. Crash-free vehicles mean no traffic police, no ticketing and no alcohol-impaired driving. Freed
from safety considerations such as crumple zones, bumpers, and air bags, OEMs could significantly
simplify the production of cars, which would become considerably lighter and therefore less expensive to
buy and run. Related industries, such as automobile insurance, could be affected as well. While car
insurance would of course still be necessary for incidents such as catastrophe, theft, and vandalism,
insurance claims related to highway accidents (admittedly a small portion of the total) might nearly
disappear. Automobiles could also last longer as collisions stop happening (McKinsey, 2014).
Towards connected and shared vehicles
96. [to be competed]
Changes in market structure and localisation of activities: who will be doing what and where?
97. Supply chain consolidation with larger first-tier suppliers at the expense of lower tier suppliers.
While in the past, carmakers worked with a large number of direct component suppliers they nowadays
deal with fewer, larger first-tier suppliers. There are two reasons for this restructuring of the automotive
supply chain: first, design functions have been transferred to suppliers as a result of greater customisation
of components tailored to the needs of individual carmakers; second, Just-In-Time (JIT) production and
quality-at-source models require larger suppliers with a deep expertise on components quality to oversee
and control the sourcing process.
98. A new type of very large first-tier supplier (known as global mega-suppliers) has emerged. These
firms are the preferred suppliers of global carmakers because they have the appropriate design, skill,
production and financial capacity that allow them to expand their global coverage. This process of
consolidation in the automotive supply chain tends to shift the allocation of a larger share of profits among
carmakers and global mega-suppliers at the expense of lower tier suppliers that face squeezed profits and
compete mainly on price (Humphrey et. al., 2003). Moreover, it will become more difficult for smaller,
less established local suppliers from developing markets to become first-tier suppliers. They will need an
enhanced design, innovation, scale, technical, financial and management capacity with an adequately
skilled workforce to become first-tier suppliers. These required capabilities are likely to increase in the
future as supply chain consolidation continues.

47
CONCLUSIONS
[To be developed]
REFERENCES
AEA (2013). Assessing the R&D and economic performance of key industries: the automotive sector.
AEA Technology, London
Beltramello,A. (2012), "Market Development for Green Cars", OECD Green Growth Papers, No. 2012/03,
OECD Publishing, Paris. DOI: http://dx.doi.org/10.1787/5k95xtcmxltc-en
Berger, R. (2011). Automotive Landscape 2025, Local News, Roland Berger.
Brandt, L. and Van Biesebroeck, J. (2008) ‘Capability building in China’s auto supply chains’, Working
paper prepared for Industry Canada.
De Backer,K. and S. Miroudot (2013), "Mapping Global Value Chains", OECD Trade Policy Papers, No.
159, OECD Publishing, Paris. DOI: http://dx.doi.org/10.1787/5k3v1trgnbr4-en
Dicken, P. 2007.”Global Shift: Mapping the Changing Contours of the World Economy”, 5th Edition,
(London, UK, The Guilford Press).
Economist (2013). Gloom and Bloom. Special report on cars by the Economist.
Elms, D. K., & Low, P. (Eds.). (2013). Global value chains in a changing world. Geneva: World Trade
Organization.
European Union (EU) (2015). The 2015 EU Industrial R&D Investment Scoreboard 6.8%, while Institute
for Prospective and Technological Studies, Joint Research Centre. Bruxelles
Feizabadi, J. (2014). Automotive global value chain and upgrading policies for developing countries. A
presentation at the Asian Development Bank conference, Kuala Lumpur, 2014
Frost & Sullivan. World’s top global mega trends to 2025 and its implications to business, society, and
cultures
Heneric, O., Licht, G., & Sofka, W. (Eds.). (2006). Europe's automotive industry on the move:
competitiveness in a changing world (Vol. 32). Springer Science & Business Media.
Humphrey, J., & Memedovic, O. (2003). The global automotive industry value chain: What prospects for
upgrading by developing countries. UNIDO Sectorial Studies Series Working Paper.

48
Gao, P., Hensley, R., & Zielke, A. McKinsey Quarterly (2014). A road map to the Future For the
Auto Industry. http://www.mckinsey.com/industries/automotive-and-assembly/our-insights/a-
road-map-to-the-future-for-the-auto-industry
Imbs, J., & Wacziarg, R. (2003). Stages of diversification. American Economic Review, 63-86.
Kallstrom H. (2015) Investing in the automotive industry – what you need to know, Market Realist, New
York, United State
Kaulich, F. (2012). Diversification vs. specialization as alternative strategies for economic development:
Can we settle a debate by looking at the empirical evidence? United Nations Industrial Development
Organization.
Klein, C. and I. Koske (2013), “Capacity Needs in the Automobile Industry in the Short- to Medium Run”,
OECD Economics Department Working Papers, No. 1097, OECD Publishing.
http://dx.doi.org/10.1787/5k3w7256ltf4-en
Krugman, P. and Obstfeld, M. (2006): “International Economics: Theory and Policy”, 7. ed., Boston,
Massachusetts: Pearson, Addison-Wesley.
MCKinsey (2016). Automotive revolution – perspective towards 2030 –How the convergence of disruptive
technology-driven trends could transform the auto industry. Advanced Industries January 2016
MCKinsey (2015) Competing for the connected customer – perspectives on the opportunities created by
car connectivity and automation. Advanced Industries September 2015.McKinsey (2015). The road
to 2020 and beyond. What's driving the global automotive industry? Advanced Industries January
2015
OECD. (2013), Interconnected Economies: Benefiting from Global Value Chains, OECD Publishing,
Paris. DOI: http://dx.doi.org/10.1787/9789264189560-en
OECD and ITF. (2015), ITF Transport Outlook 2015, OECD Publishing, Paris/ITF, Paris Cedex 17. DOI:
http://dx.doi.org/10.1787/9789282107782-en
Pwc(2016). M&A in the global automotive industry. PricewaterhouseCoopers LLP
Pwc (2014) 2014 Global Automotive Tax Guide. PricewaterhouseCoopers LLP
Osakwe, P. N. (2007). Foreign aid, resources, and export diversification in Africa: A new test of existing
theories (Vol. 61). African Trade Policy Centre.
Sturgeon, T., Van Biesebroeck, J., & Gereffi, G. (2008). Value chains, networks and clusters: reframing
the global automotive industry. Journal of economic geography, lbn007.
Sturgeon, T. (2011) ‘Global value chains in the automotive industry: an enhanced role for developing
countries?’, International Journal Technological Learning, Innovation and Development, Vol. 4,
pp. 181-205
Sturgeon, T. and Florida, R. (2004) ‘Globalization, deverticalization, and employment in the motor vehicle
industry’, in Kenny, M. and Florida, R. (Eds.): Locating Global Advantage; Industry Dynamics in a
Globalizing Economy, Stanford University Press, Palo Alto, CA.

49
Timmer, M. P., Dietzenbacher, E., Los, B., Stehrer, R. and de Vries, G. J. (2015), An Illustrated User
Guide to the World Input–Output Database: the Case of Global Automotive Production. Review of
International Economics, 23: 575–605. doi:10.1111/roie.12178
Timmer, M. P., A. A. Erumban, B. Los, R. Stehrer, and G. J. de Vries, (2014) “Slicing Up Global Value
Chains,” Journal of Economic Perspectives 28 99–118
Thomson Innovation (2015) The State of Innovation in the Automotive Industry: 2015State of Innovation
in the Automotive Industry: 2015
UNIDO (2016) Industrial development report 2016. The Role of Technology and Innovation in Inclusive
and Sustainable Industrial Development, United Nations Industrial Development Organization
Veloso, F.; Kumar, R. 2002. The Automotive Supply Chain: Global Trends and Asian Perspectives, ERD
Working Paper No. 3, January, Manila, Philippines, Asian Development Bank.
Van Biesebroeck, J., & Sturgeon, T. J. (2010). Effects of the 2008-09 crisis on the automotive industry in
developing countries: a global value chain perspective. Global Value Chains in a Postcrisis World,
Washington, DC: The World Bank, 209-244.

Contact: [email protected]