upper dir district
TRANSCRIPT

H
Situation Analysis & Baseline Surveys For Poverty
Reduction through Rural Development in KPK,
FATA & Balochistan
DEVELOPMENT PROFILE OF
UPPER DIR DISTRICT
January 3 , 2014
Empowerment Performance Result
Submitted by:
In Association with:

District Profile Upper Dir
Table of Contents
LIST OF EXHIBITS ............................................................................................................................... 1
ACRONYMS ........................................................................................................................................ 2
FOREWORD ........................................................................................................................................ 3
DISTRICT UPPER DIR – AT A GLANCE ................................................................................................. 4
1.0 DISTRICT GEOGRAPHY ............................................................................................................... 6 1.1 LOCATION AND BOUNDARY ................................................................................................. 6 1.2 TOPOGRAPHY .................................................................................................................... 7 1.3 TRIBES ETHNIC GROUPS AND LANGUAGES .......................................................................... 7 1.4 CLIMATE ............................................................................................................................ 7
2.0 SOCIO-ECONOMIC PROFILE OF THE DISTRICT .............................................................................. 8 2.1 EDUCATION AND LITERACY ................................................................................................. 8 2.2 HEALTH ........................................................................................................................... 11 2.3 HOUSING QUALITY AND HOUSING SERVICES ..................................................................... 12 2.4 TRANSPORT AND COMMUNICATION ................................................................................... 14 2.5 POPULATION AND EMPLOYED LABOR FORCE ..................................................................... 14 2.6 LIVELIHOOD SOURCES ..................................................................................................... 16
3.0 LAW AND ORDER ..................................................................................................................... 19 3.1 BACKGROUND.................................................................................................................. 19 3.2 LAW ENFORCEMENT AGENCIES ........................................................................................ 19 3.3 JUDICIAL INFRASTRUCTURE IN UPPER DIR ......................................................................... 20 3.4 MAIN CRIMES .................................................................................................................. 21 3.5 LAW AND ORDER REFORMS.............................................................................................. 21 3.6 PRISONS ......................................................................................................................... 21
4.0 CONFLICT MANAGEMENT ......................................................................................................... 22 4.1 TRIBAL CONFLICT AND LOCAL ECONOMY .......................................................................... 22 4.2 LOCAL DISPUTE RESOLUTION MECHANISM ........................................................................ 22 4.3 ISSUES OF IDP AND THEIR IMPACT ON THE HOST ECONOMY .............................................. 22 4.4 CONFLICT BACKGROUND .................................................................................................. 22 4.5 OTHER CONFLICTS .......................................................................................................... 22 4.6 MAJOR TRIBES ................................................................................................................ 23 4.7 DISPLACEMENT ................................................................................................................ 23
5.0 THE ROLE OF WOMEN .............................................................................................................. 24 5.1. STATUS OF WOMEN ......................................................................................................... 24 5.2. POPULATION RATIO ......................................................................................................... 24 5.3. EDUCATION ..................................................................................................................... 24 5.4. MARRIAGES ..................................................................................................................... 25 5.5. VULNERABILITY OF WOMEN AND CHILDREN ....................................................................... 25 5.6. SOURCE OF INCOME ........................................................................................................ 25 5.7. AGRICULTURE.................................................................................................................. 25 5.8. WOMEN IN POLITICS ........................................................................................................ 25
6.0 ENVIRONMENTAL ANALYSIS ..................................................................................................... 26 6.1 CLIMATE, LAND AND WATER ............................................................................................. 26 6.2 FORESTS AND AGRICULTURE ............................................................................................ 27 6.3 ENVIRONMENTAL HAZARDS .............................................................................................. 27
7.0 SOCIAL MOBILIZATION ............................................................................................................. 28 7.1 ROLE OF PPAF ............................................................................................................... 28 7.2 LOCAL NGOS .................................................................................................................. 28 7.3 FOCUS OF DONOR COMMUNITY ........................................................................................ 29
8.0 IMPORTANT INSTITUTIONS......................................................................................................... 31 8.1 INSTITUTIONS AND STAKE HOLDERS ................................................................................. 31 8.2 FINANCIAL INSTITUTIONS IN THE DISTRICT ......................................................................... 31

District Profile Upper Dir
1
List of Exhibits
Exhibit 2.1.1 - Educational Status of Children of the 5-9 Years Age Group [Percentage Distribution, 2012-13]
8
Exhibit 2.1.2 - Educational Status of Children of 10-14 Years Age Group [Percentage Distribution, 2012-13]
8
Exhibit 2.1.3 - Gender Parity Index in Primary and Secondary Enrollment [2012-13] 9
Exhibit 2.1.4 - Teaching Institutions and Staff – Numbers [2011] 9
Exhibit 2.1.5 - School Facilities and Physical Characteristic – 2011 [Percentage of Schools 10
Exhibit 2.1.6 - Adult Literacy Rate (%) - [2012-13] 10
Exhibit 2.2.1 - Status of Child Health – Percentages [2012-13] 11
Exhibit 2.2.2 - Status of Maternal Health – Percentage of Pertinent Women [2012-13] 11
Exhibit 2.2.3 - Health Institutions – Numbers [2012-13] 12
Exhibit 2.2.4 - Health Staff – Numbers [2012-13] 12
Exhibit 2.3.1 - Material Used in Roof - Percentage of Household [2012-13] 12
Exhibit 2.3.2 - Wall Structure – Percentage of Households [2012-13] 13
Exhibit 2.3.3 - Type of Toilet – Percentage of Households [2012-13] 13
Exhibit 2.3.4 - Source of Lighting – Percentage of Households [2012-13] 13
Exhibit 2.3.5 - Cooking Fuel – Percentage of Households [2012-13] 13
Exhibit 2.3.6 - Source of Drinking Water – Percentage of Households [2012-13] 14
Exhibit 2.4.1 - Indicators of Communication [2012-13] 14
Exhibit 2.5.1 - Estimated Population 15
Exhibit 2.5.2 - Percentage of Employed Labor Force by Major Sectors [2012-13] 15
Exhibit 2.5.3 - Percentage of Employed Labor Force by Major Occupational Group [2012-13] 15
Exhibit 2.5.4 - Employment Status Percentage of Employed Persons – [2012-13] 16
Exhibit 2.6.1 - Land Utilization Statistics [2012-13] 16
Exhibit 2.6.2 - Area and Production of Major Crops [2012-13] 17
Exhibit 2.6.3 - Agriculture Machinery [2012-13] 17
Exhibit 2.6.4 - Population of Livestock [2006] 17
Exhibit 2.6.5 - Mineral Production [2012-13] 18
Exhibit 2.6.6 - Area Under the Control of Forest Department [2012-13] 18
Exhibit 3.2.1 - Strength of the Law Enforcement Agencies (LEAs) 20
Exhibit 3.3.1 - Justice System 20
Exhibit 3.3.2 - Alternate Dispute Resolution (ADR) Mechanism 20
Exhibit 3.4.1 - Crimes Rate 21
Exhibit 4.6.1 - Population and Tribes 23
Exhibit 6.3.1 - Donor Projects 29

District Profile Upper Dir
2
Acronyms
ASF Agribusiness Support Fund
CPI Community Physical Infrastructure
DGDC Directorate General for Development Cooperation
DIG Deputy Inspector General
DPO District Police Officer
DRC Dispute Resolution Council
DSP Deputy Superintendents of Police
DTCE Devolution Trust for Community Empowerment
EPS Environmental Protection Society
FATA Federally Administered Tribal Areas
FHA Frontier Highways Authority
GBV Gender Based Violence
GIZ GmbH. Gesellschaft für Internationale Zusammenarbeit
GoI Government of Italy
GPI Gender Parity Indices
GRHO Gender Reproductive Health Organization
GTTTC Government Technical Teachers Training Centre
IDA International Development Association
IRM Institute of Rural Management
JICA Japan International Cooperation Agency
KP Khyber Pakhtunkhwa
LEP Livelihood Enhancement and Protection
MDTF Multi-Donor Trust Fund
MICS Multiple Indicators Cluster Survey
NDMA National Disaster Management Authority
NRSP National Rural Support Program
ORS Oral Rehydration Salts
PATA Provincially Administered Tribal Areas
PBS Pakistan Bureau of Statistics
PHC Peshawar High Court
PPAF Pakistan Poverty Alleviation Fund
PSLM Pakistan Social and Living Standard Measurement
SDC Swiss Development Cooperation
SRSP Sarhad Rural Support Program
SWWS Support With Working Solutions
TAF The Asia Foundation
TDEA Trust for Democratic Education and Accountability
TNSM Tehreek-i-Nifaz-e-Shariate-i-Mohammadi
TTP Tehreek-e-Taliban Pakistan
UNDP United Nations Development Program
UNICEF United Nations International Children's Emergency Fund
USAID United States Agency for International Development

District Profile Upper Dir
3
Foreword Pakistan Poverty Alleviation Fund (PPAF) has received financing from the International Development Association (IDA) for undertaking the consulting services titled as “Situation Analysis and Baseline Surveys for Poverty Reduction through Rural Development in KP, FATA and Balochistan” in 14 targeted districts. The study is awarded to the consortium of AASA Consulting and Gender Reproductive Health Organization (GRHO). The findings of this research would be utilized for the three year investment program in Balochistan, KP and FATA which would be financed by the Government of Italy (GoI) through the Directorate General for Development Cooperation (DGCS).
The project is divided in two phases. A macro picture of target districts will be portrayed in Phase-I by developing, “District Situation Analysis” reports, while household poverty and assessment of Community Organization (COs) will be assessed through detailed quantitative and qualitative surveys in the selected Union Councils (UCs) of the target areas in Phase-II of the project. This report furnishes the Situation Analysis of the district of Upper Dir with respect to the socio-economic status. It employs mainly secondary data collected by Pakistan Bureau of Statistics (PBS), the provincial bureaus and the work of various donor organizations. Three main data sources are used to compile the district profiles; the latest available Provincial Development and Social Statistics, District Census and Population Reports (1998), and the latest available household survey (Pakistan Social and Living Standard Measurement, (PSLM) 2012-13. PSLM is mainly used to compile education, health, demographic and housing profiles. Other secondary sources such as line departments of the district, provincial reports and major research studies carried out at the district level are also used to expand on the situational analysis of the district.
The report starts with district geography, followed by the socio economic profile of the district including education and literacy, health, housing quality and housing services, transport and communication, employed labor force and livelihood. The other areas covered in the report include Law and Order, Conflict Management, The Role of Women, Environmental Analysis, Social Mobilization. A brief on financial institutions operating in the district is also shared. Some information, which is significant for profiling districts with respect to development characteristics, such as the strength of social organizations and institutions, conflict resolution practices, disaster management etc. are limited at the level of district, but wherever possible the information is shared and analyzed. The report provides a quick reference with respect to the current socio-economic status of district Upper Dir and information readily available for planning and development initiatives at a local level. Wherever possible, the information is presented in visual form (tables and graph) with a very brief commentary to make these profiles a handy and practical booklet.

District Profile Upper Dir
4
District Upper Dir – At a Glance
District Headquarter: Upper Dir
Tehsils and Union Councils
Barawal Barawal Bandi
Chapar Chapper
Dir Bibiour, Chukiatan, Darora, Ganshal, Palam, Qulandi, Sharingal, Swanai, Tarpatar,
Kalkot Kalkot, Patrak, Qatrak,
Khal Khal, Toormang
Wari Akhagram, Deslor, Kotkai, Nehag, Pashta, Sundal, Wari
Area 3699 Square Kilometers
Climate
The summer season is moderate and warm, while temperature rapidly falls from November onwards. During the months of December to February, the temperature normally falls below freezing point.
Major Ethnic Groups Yousafzai, Mishwani, Swati Pashtuns
Demography
Projected Population – 2014 890,000
Population Density (Persons per Square Kilometer) 240
Percentage of Rural Population 96%
Percentage of Female Population 49%
Sex Ratio (Males per 100 Females) 103
Percentage of Children (0-5 years) 17%
Percentage of Active Population (15-64 years) 48%
Dependency Ratio (Percentage) 109%
Household Size 8
Livelihood Sources
Total Cropped Area 40,690 Hectares
Total Irrigated Area 22,415 Hectares
Major Crops Wheat, Maize, Rice, Rape seed and Mustard
Livestock Head Per thousand Rural Population 1,292
Major Minerals Granite
Head of Household Work Status Percentage
Wage Employed 40
Self Employed 18
Employer 1
Agriculture 39
Livestock 2

District Profile Upper Dir
5
Education
Percentage
Percentage of Population that Ever Attended School 46
Primary Enrollment Rate (Gross) 87
Middle Enrollment Rate (Gross) 45
Matric Enrollment Rate (Gross) 40
Percentage of Literate Persons (10 years and above) 50
Percentage of Literate Persons (15 years and above) 42
Health
Health Institutions Number
Hospitals 5
Dispensary 11
Rural Health Centre 2
Basic Health Centre 34
Health Staff per One Hundred Thousand Population
Doctors 8
Nurses 12
Paramedics 41
Housing
Percentage
Inadequate Roof Structure (Wood, Bamboo) 84
Un-electrified Households 4
Households with No-Toilet 2
Inadequate Fuel for Cooking 98
Inadequate Source of Drinking Water 85
Sources
Development Statistics of Khyber Pakhtunkhwa, 2014, Bureau of Statistics, Government of KP
Important District-Wise Socio-Economic Indicators of Khyber Pakhtunkhwa, 2014
PSLM Survey, 2012-13, Government of Pakistan
District Census Report, 1998

District Profile Upper Dir
6
1.0 District Geography1 1.1 Location and Boundary
Upper Dir is the upper part of old District Dir. At the time of independence, Dir was a state ruled by Nawab Shah Jehan Khan. It was merged with Pakistan in 1969 and later on declared a district in 1970. In 1996, it was bifurcated into Upper and Lower Dir districts. This district is situated in the northern part of Pakistan. It is bounded on the North and north-west by the Chitral district and Afghanistan, on the East by Swat district, and on the South by Lower Dir district. For the purposes of administration, the district is divided into Dir and Wari subdivisions and 5 tehsils, which include Dir, Barawal, Kalkot, Wari, and Khal. There are 28 UCs all of which are rural. The elected representatives formulate district and tehsil assemblies. Political constituencies of the district include 1 national seat and 3 provincial seats of legislative assemblies.
Map of Upper Dir District
Sources: ACTED Pakistan, Rapid Need Assessment Project
1 This section is largely benefited from “District Health Profile- Upper Dir” , Pakistan Initiative for Mothers and
Newborns (PAIMAN), 2005

District Profile Upper Dir
7
1.2 Topography The topography of the district is dominated by high mountains. The most important mountain range is the Hindu Raj. It runs from north-east to south-west along the northern borders with Chitral district. In winter, whole area remains snow-covered. The mountains in the western part of the district are covered with forests, while the eastern mountain range, Dir Kohistan, is barren. Dir Kohistan is the origin of the main river of Chitral i.e. Panjkora River. District head quarter Upper Dir is connected with metal led or shingled roads to all Tehsil Headquarters. The district is totally mountainous so there is no railway and airport.
1.3 Tribes Ethnic Groups and Languages
Pashto is the main language. A few people speak Hindko (a variant of Punjabi, Gujari and Khowar Chitrali). The majority of the population in this area is Yousafzai, Mishwani and Swati Pashtuns while the ruling class was Khosro.
1.4 Climate The summer season is moderate and warm, where June and July are hottest months. On average, the maximum and minimum temperature in June is about 33 and 16 degrees centigrade respectively. Winter season is severely cold and harsh. Temperature rapidly falls from November onwards. During the months of December, January, and February, temperature normally falls below freezing point. The mean maximum and minimum temperature in January is 11 and -2 degrees centigrade respectively.

District Profile Upper Dir
8
2.0 Socio-Economic Profile of the District
2.1 Education and Literacy This section highlights the major characteristics of schooling in the district by providing a situation analysis in terms of access, equality and quality of primary and secondary education. Moreover, besides providing the level of adult literacy, school facilities and physical characteristics are collated to provide an idea of the quality of education in the district. Access to education is generally gauged with reference to the gross and net enrolment rates, based on the relevant age group. Traditionally in Pakistan, enrolment rates are calculated on the basis of the age group 5-9 years, and 10-14 years for primary and secondary levels of education respectively. Therefore, following this precedent, these age groups are preferred for documentation of the educational status of children in terms of out-of-schooling and enrolments in public, private or religious institutions. Access and equality indicators are derived from Pakistan Social and Living Standard Measurement (PSLM) surveys, while the available physical facilities in primary and secondary schools are ascertained from the Development Statistics of the province. Exhibit 2.1.1 displays the educational status of children for the 5-9 years age group. Overall, about 54 percent of children of the primary age group were out of school in the year 2013. The private schools aren‟t of much significance in the district. Overall, about 2 percent of children (3 percent boys and 1 percent girls) were enrolled in private institutions according to the estimates from the household survey (PSLM, 2013). No evidence of enrollment in religious schools or schools run by NGO was observed. High levels of gender discrimination were found in school enrollments in both private and public setups. Gender discrimination will be discussed further under exhibit 2.1.3 and exhibit 2.1.4
Exhibit 2.1.1 Educational Status of Children of the 5-9 Years Age Group
[Percentage Distribution, 2012-13]
Overall% Boys% Girls%
Out of School 54.16 46.00 62.81
Enrolled in Public Schools 43.75 50.54 36.55
Enrolled in Private Schools 2.09 3.46 0.64
Enrolled in Religious Schools (Madrasa) 0.00 0.00 0.00
Enrolled in Schools Run by NGOs 0.00 0.00 0.00
Source: Estimated from Household Level Data of PSLM, 2012-13
Exhibit 2.1.2 documents the educational status of children in the 10-14 years age group. Overall, about 26 percent of children of the 10-14 years age cohort were not attending school during 2013. The majority (about 69 percent out of the 74 percent) of students were enrolled in government schools. Moreover, an estimated 2 percent of boys were enrolled in religious schools as per the PSLM 2012-13 data.
Exhibit 2.1.2 Educational Status of Children of 10-14 Years Age Group
[Percentage Distribution, 2012-13]
Overall% Boys% Girls%
Out of School 26.20 11.67 44.29
Enrolled in Public Schools 68.59 81.99 51.89
Enrolled in Private Schools 4.04 4.60 3.34
Enrolled in Religious Schools (Madrasa) 0.96 1.74 No Data
Enrolled in Schools Run by NGOs 0.22 No Data 0.48
Source: Estimated from Household Level Data of PSLM, 2012-13
District Profile Upper Dir
9
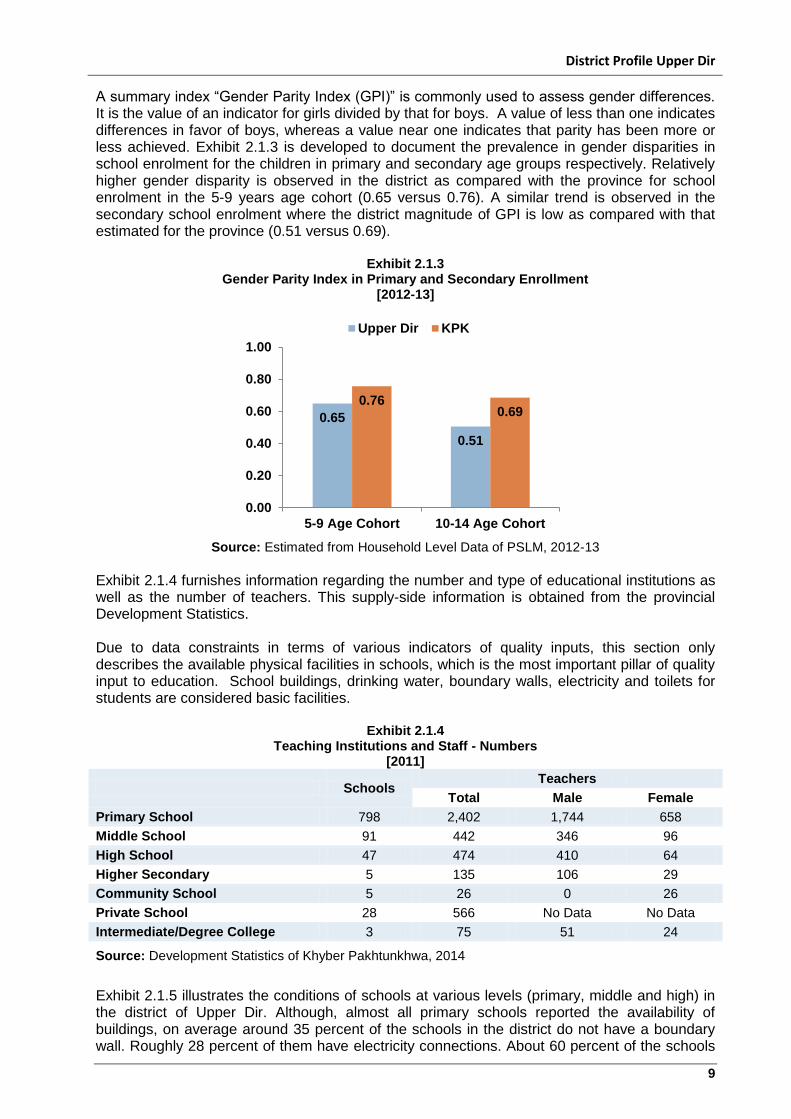
A summary index “Gender Parity Index (GPI)” is commonly used to assess gender differences. It is the value of an indicator for girls divided by that for boys. A value of less than one indicates differences in favor of boys, whereas a value near one indicates that parity has been more or less achieved. Exhibit 2.1.3 is developed to document the prevalence in gender disparities in school enrolment for the children in primary and secondary age groups respectively. Relatively higher gender disparity is observed in the district as compared with the province for school enrolment in the 5-9 years age cohort (0.65 versus 0.76). A similar trend is observed in the secondary school enrolment where the district magnitude of GPI is low as compared with that estimated for the province (0.51 versus 0.69).
Exhibit 2.1.3 Gender Parity Index in Primary and Secondary Enrollment
[2012-13]
Source: Estimated from Household Level Data of PSLM, 2012-13
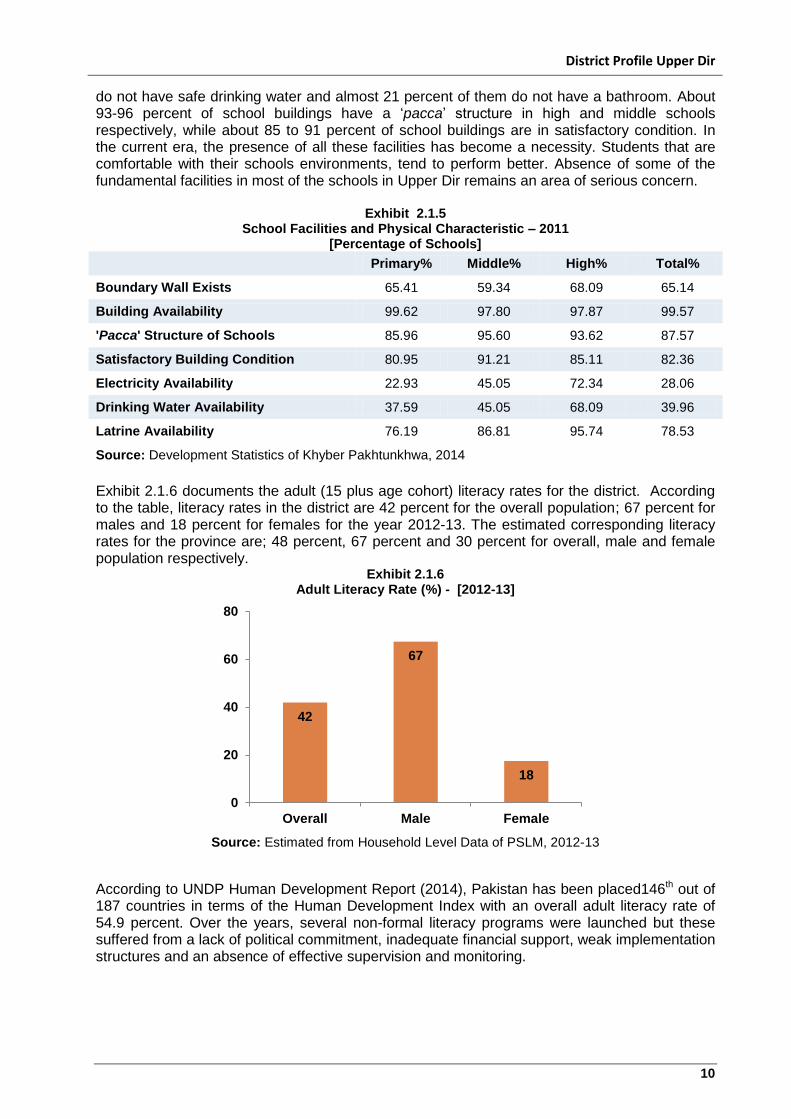
Exhibit 2.1.4 furnishes information regarding the number and type of educational institutions as well as the number of teachers. This supply-side information is obtained from the provincial Development Statistics. Due to data constraints in terms of various indicators of quality inputs, this section only describes the available physical facilities in schools, which is the most important pillar of quality input to education. School buildings, drinking water, boundary walls, electricity and toilets for students are considered basic facilities.
Exhibit 2.1.4 Teaching Institutions and Staff - Numbers
[2011]
Schools Teachers
Total Male Female
Primary School 798 2,402 1,744 658
Middle School 91 442 346 96
High School 47 474 410 64
Higher Secondary 5 135 106 29
Community School 5 26 0 26
Private School 28 566 No Data No Data
Intermediate/Degree College 3 75 51 24
Source: Development Statistics of Khyber Pakhtunkhwa, 2014
Exhibit 2.1.5 illustrates the conditions of schools at various levels (primary, middle and high) in the district of Upper Dir. Although, almost all primary schools reported the availability of buildings, on average around 35 percent of the schools in the district do not have a boundary wall. Roughly 28 percent of them have electricity connections. About 60 percent of the schools
0.65
0.51
0.76 0.69
0.00
0.20
0.40
0.60
0.80
1.00
5-9 Age Cohort 10-14 Age Cohort
Upper Dir KPK
District Profile Upper Dir
10
do not have safe drinking water and almost 21 percent of them do not have a bathroom. About 93-96 percent of school buildings have a „pacca‟ structure in high and middle schools respectively, while about 85 to 91 percent of school buildings are in satisfactory condition. In the current era, the presence of all these facilities has become a necessity. Students that are comfortable with their schools environments, tend to perform better. Absence of some of the fundamental facilities in most of the schools in Upper Dir remains an area of serious concern.
Exhibit 2.1.5 School Facilities and Physical Characteristic – 2011
[Percentage of Schools]
Primary% Middle% High% Total%
Boundary Wall Exists 65.41 59.34 68.09 65.14
Building Availability 99.62 97.80 97.87 99.57
'Pacca' Structure of Schools 85.96 95.60 93.62 87.57
Satisfactory Building Condition 80.95 91.21 85.11 82.36
Electricity Availability 22.93 45.05 72.34 28.06
Drinking Water Availability 37.59 45.05 68.09 39.96
Latrine Availability 76.19 86.81 95.74 78.53
Source: Development Statistics of Khyber Pakhtunkhwa, 2014
Exhibit 2.1.6 documents the adult (15 plus age cohort) literacy rates for the district. According to the table, literacy rates in the district are 42 percent for the overall population; 67 percent for males and 18 percent for females for the year 2012-13. The estimated corresponding literacy rates for the province are; 48 percent, 67 percent and 30 percent for overall, male and female population respectively.
Exhibit 2.1.6 Adult Literacy Rate (%) - [2012-13]
Source: Estimated from Household Level Data of PSLM, 2012-13
According to UNDP Human Development Report (2014), Pakistan has been placed146th out of 187 countries in terms of the Human Development Index with an overall adult literacy rate of 54.9 percent. Over the years, several non-formal literacy programs were launched but these suffered from a lack of political commitment, inadequate financial support, weak implementation structures and an absence of effective supervision and monitoring.
42
67
18
0
20
40
60
80
Overall Male Female

District Profile Upper Dir
11
2.2 Health
Health is the most important factor which plays a key role in determining human capital. Better health improves the efficiency and the productivity of the labor force and thus ultimately contributes to economic growth and leads to human welfare. On the other hand, there is a strong relationship between poverty and poor health. The health status of a region may be evaluated in terms of either input indicators (doctors, institutions etc.) or output indicators (Infant Mortality, Maternal Mortality, Life Expectancy etc.). Unfortunately, district-wise data on output indicators is not available in Pakistan from either published or unpublished materials. The latest Multiple Indicators Cluster Survey (MICS) which was conducted in 2008 in the province, reports various district-wise indicators, but the data on district-wise morality rates and life expectancy is not provided. Therefore, to gauge an idea about the health status in the target districts, data on the maximum possible input indicators are collated in the following tables. A rough sketch on child health is furnished in Exhibit 2.2.1. Only about 73 percent of children in the 12-23 months age cohort were reported fully immunized according to the recall and record method, while the corresponding percentage is quite low (54 percent) in households which provided records of immunization. It is encouraging that the majority (over 90 percent) of households reported the use of ORS and also consultation with a physician for the treatment of diarrhea. No significant gender discrimination is evident from the exhibit.
Exhibit 2.2.1 Status of Child Health – Percentages
[2012-13] Overall% Boys% Girls%
Children (12-23 Months) – Fully Immunized
Record Only 54 46 62
Recall and Record 73 74 72
Diarrhea in Children Under 5
Physician Consulted 97 93 100
Treatment of Diarrhea – ORS 96 92 100
Source: PSLM, 2012-13
Some indicators of maternal health care were compiled in Exhibit 2.2.2. The information in the table reveals that about 73 percent of the pertinent urban women reported having Tetanus Toxoid Injections while this percentage is even lower (55 percent) for the rural population. Quite low percentages of requisite women confirmed pre-natal and post-natal consultation; 22 percent and 36 percent respectively. The situation in terms of child delivery is also miserable. Child delivery at home is reported by about 72 percent of households in rural areas. The corresponding percentage for the urban population is about 65 percent.
Exhibit 2.2.2
Status of Maternal Health – Percentage of Pertinent Women [2012-13]
Overall% Urban% Rural%
Have Received Tetanus Toxoid Injection 56 73 55
Pre-Natal Consultations 36 50 35
Child Delivery at Home 72 65 72
Post-Natal Consultations 22 19 22
Source: PSLM, 2012-13

District Profile Upper Dir
12
The numbers of health institutions in the district during the year 2012-13 are collated in Exhibit 2.2.3, while the strength of health staff in the district is depicted in Exhibit 2.2.4. A gloomy picture is evident in terms of the strength of the district in providing health facilities. Only 8 doctors and 12 nurses are available for every one hundred thousand („lakh‟) population, according to the statistics provided by the provincial official publications.
Exhibit 2.2.3 Health Institutions – Numbers [2012-13]
Hospital 5
Dispensary 11
Rural Health Centre 2
Basic Health Units 34
Maternal and Child Health Centre 2
TB Clinic 1
S.H.C. 2
Leprosy Clinic 3
Source: Development Statistics of Khyber Pakhtunkhwa, 2014
Exhibit 2.2.4
Health Staff – Numbers [2012-13]
Numbers
Per One Hundred Thousand population
Doctors 71 8
Nurses 111 12
Paramedics 361 41
Source: Estimated from the Development Statistics of Khyber Pakhtunkhwa, 2014
2.3 Housing Quality and Housing Services
It is imperative to assess the means and standards of living directly provided by the government and that which is acquired by the household. Shelter is one of the basic needs, and housing conditions are one of the key determinants of the quality of life.
To observe the access to housing facilities, three indicators are used Vis a Vis, proportion of households using electricity, cooking gas and tap water, while the quality of housing stock is evaluated in terms of the material used in the wall and roof, and the type of toilet in the house. All this information is obtained at the household level from the household survey (PSLM) and thus truly reflects the living standards in the district. Information regarding the type of material used in the roof is displayed in Exhibit 2.3.1. The table below reveals that about 84 percent of households (67 percent urban and 85 percent rural) reported inadequate (wood) roof material. Iron and cement are used in about 5 percent of rural households, while 26 percent of urban households reported RCC/RBC roofing.
Exhibit 2.3.1 Material Used in Roof - Percentage of Household [2012-13]
Overall% Urban% Rural%
RCC, RBC 10.44 26.45 9.72
Iron, Cement 4.83 5.28 4.81
Garder, T-Iron 0.3 0.88 0.27
Wood etc. 84.44 67.39 85.2
Source: PSLM, 2012-13
In terms of material used in wall, the majority (84 percent) of households reported the use of wood or other materials (Exhibit 2.3.2). The corresponding percentage for the rural areas of the district is 63 percent. Burnt bricks or blocks are used in about 13 percent and 34 percent of rural and urban households of the district respectively.

District Profile Upper Dir
13
Exhibit 2.3.2 Wall Structure – Percentage of Households [2012-13]
Overall% Urban% Rural%
Burnt Brick- Blocks 13.54 34.19 12.61
Mud Bricks/ MUD 3.11 3.25 3.11
Wood (Other Material) 83.35 62.57 84.28
Source: PSLM, 2012-13
Information regarding the type of toilet used by household is furnished in Exhibit 2.3.3. About 2 percent of rural households reported unavailability of toilet facilities in the house. The table below also reveals that the bulk of households reported the use of flush toilets. About 55 percent and 79 percent of households reported the use of flush toilets in the rural and urban areas of the district respectively.
Exhibit 2.3.3 Type of Toilet – Percentage of Households [2012-13]
Overall% Urban% Rural%
Flush 56 79 55
Non-Flush 42 21 43
No Toilet 2 No Data 2
Source: PSLM, 2012-13
Almost all households are connected with the grid and use electricity for lighting purposes as evident from Exhibit 2.3.4. The percentages of households who reported the use of electricity are 100 percent and 96 percent in urban and rural areas respectively. The use of alternate energy resources such as oil, candle and others are found to be negligible in the district as a very small percentage of households use them for lighting purposes in the district.
Exhibit 2.3.4 Source of Lighting – Percentage of Households [2012-13]
Overall% Urban% Rural%
Electricity 95.76 100 95.57
Oil 0.31 No Data 0.32
Candle 0.27 No Data 0.28
Other 3.66 No Data 3.83
Source: PSLM, 2012-13
Exhibit 2.3.5 furnishes information regarding the sources of cooking fuel. Wood and charcoal are the main sources of cooking fuel according to the table below. About 85 percent and 98 percent of urban and rural households use either wood or charcoal, while about 15 percent of urban households reported oil (stove) for cooking purposes.
Exhibit 2.3.5 Cooking Fuel – Percentage of Households [2012-13]
Overall% Urban% Rural%
Gas/Oil 1.83 15.32 1.22
Wood/Charcoal 97.84 84.68 98.43
Other 0.33 0.00 0.34
Source: PSLM, 2012-13
The provision of safe drinking water is an important part of planning for a healthy population. Exhibit 2.3.6 displays the sources of drinking water in the district with an urban-rural division. About 88 percent of rural households fetch water from unsafe sources (uncovered water reservoirs and dug wells). The corresponding percentage for urban areas is about 21 percent. The source of tap water is reported by 11 percent of households; 52 percent and 9 percent in urban and rural areas respectively.

District Profile Upper Dir
14
Exhibit 2.3.6 Source of Drinking Water – Percentage of Households [2012-13]
Overall% Urban% Rural%
Tap Water 11 52 9
Hand Pump No Data No Data 1
Motor Pump 3 27 2
Dug Well No Data No Data 1
Other (Uncovered) 85 21 88
Source: PSLM, 2012-13
2.4 Transport and Communication
Roads, transportation and telecommunication networks have a significant impact on socialization and modernization. Three indicators have been considered to portray the level of development of the transport and communication sector in a district; road mileage per 100 square kilometers of geographical area, availability of public and private transport and vehicles, and the number of telephone and internet connections per one hundred thousand persons. These indicators, depicted in the Exhibit 2.4.1, are estimated from the latest published data of the provincial Development Statistics.
Exhibit 2.4.1 portrays the overall picture of communication in the district. The table reveals that about 860 out of one lakh (one hundred thousand) population were connected with PTCL landlines during the year 2012-13. The data on broadband connections in the district is not available.
The table below also illustrates that about 53 and 257 kilometers mettle road of “High Type” and “Low Type” respectively is available per one thousand kilometers of geographical area in the district.
Exhibit 2.4.1 Indicators of Communication
[2012-13]
Numbers Per one Hundred
Thousand Population
Number of Connections
Landline 7,659 860
Broadband Data Not Available
Road Kilometers Kilometers Per ’000’
Square Kilometers
High Type 196 53
Low Type 951 257
Total 1,147 310
Motor Vehicles Registered
Public Service Vehicles 2
Private Vehicles 167
Government Goods Vehicles -
Private Goods Vehicles 66
Others 141
Total Vehicles 376
Source: Development Statistics of Khyber Pakhtunkhwa, 2014
2.5 Population and Employed Labor Force
The characteristics of the employed force are important to understand the economic structure and potential of any region. This section provides information with respect to the distribution of the labor force into sectors, occupational groups and working status.

District Profile Upper Dir
15
According to the Exhibit 2.5.1, the estimated current population of the district is about 9 lakhs (0.890 million) with an average growth rate of 2.72 percent per annum. This population projection is taken from “Development Statistics of Khyber Pakhtunkhwa, 2014”.
Exhibit 2.5.1 Estimated Population
Overall Urban Rural
1998 – Census 576,000 23,000 553,000
2010 – Projected 799,000 32,000 767,000
2014 – Projected 890,000 35,000 855,000
Growth Rate [1998-2014] 2.72% 2.62% 2.72%
Sources: Development Statistics of Khyber Pakhtunkhwa, 2014 District Census Report, 1998
About 0.33 million persons are estimated as the active labor force by applying the crude activity rate of KP. However, the distribution of the employed labor force by major economic sectors in the district is furnished in Exhibit 2.5.2. The table reveals that the agriculture sector absorbs the majority of the labor force in the Upper Dir district. About 46 percent employment is recorded in this sector during 2012-13 (PSLM survey), whereas about 19 percent of the urban employed labor force also reported work in the agriculture sector. The construction sector is the next largest employment provider; which absorbs about 22 percent (13 in urban and 22 in rural) of the employed labor force. About 8 percent of the urban employed labor force is absorbed in the manufacturing sector, while the service sector provides employment to about 19 percent (38 and 18 in urban and rural areas respectively).
Exhibit 2.5.2 Percentage of Employed Labor Force by Major Sectors [2012-13]
Overall% Urban% Rural%
Agriculture 45.93 18.86 46.98
Mining 0.00 0.00 0.00
Manufacturing 2.67 7.79 2.47
Construction 22.04 13.09 22.39
Trade 10.31 22.39 9.85
Other Service Sectors 19.04 37.88 18.31
Source: Estimated from household level data of PSLM, 2012-13
Exhibit 2.5.3 reports the distribution of the labor force into the major occupational groups. About 44 percent of the rural labor force is working in the occupational group „Skilled Agriculture and Fisheries Workers‟, while about 17 percent of the urban labor force is also reported in the same occupational group. About 6 percent of laborers are employed as craft and related trade workers.
Exhibit 2.5.3 Percentage of Employed Labor Force by Major Occupational Group [2012-13]
Overall% Urban% Rural%
Elementary (Non- Skilled Workers) 12.80 34.92 11.95
Clerks/Sales Workers 6.71 11.84 6.51
Skilled Agriculture and Fisheries Workers 43.50 16.73 44.54
Craft and Related Trade Workers 6.02 13.11 5.75
Other 30.96 23.41 31.25
Source: Estimated from household level data of PSLM, 2012-13

District Profile Upper Dir
16
Wage employees constitute the largest group with respect to the work status of the employed labor force. In the urban areas, according to Exhibit 2.5.4, around 43 percent of people are “Wage Employees” whereas almost 40 percent of people are “Self Employed”. About 38 percent are categorized as “Owner Cultivators” in rural areas as evident in the table below, while the percentage of labor force working as sharecroppers is about 2 percent. The table also reveals that only 2 percent of the employed labor force is linked with the livestock profession. The percentages of the self-employed (own-account workers) group are 40 percent and 16 percent in urban and rural areas respectively.
Exhibit 2.5.4 Employment Status
Percentage of Employed Persons – [2012-13]
Overall% Urban% Rural%
Employer 0.83 0.00 0.86
Self Employed 16.60 40.34 15.68
Wage Employee 39.65 42.94 39.52
Un-Paid Family Worker 0.00 0.00 0.00
Owner Cultivator 37.56 16.73 38.37
Sharecropper 1.67 No Data 1.74
Contract Cultivator 1.99 No Data 2.06
Livestock 1.70 No Data 1.76
Source: Estimated from household level data of PSLM, 2012-13
2.6 Livelihood Sources
Sources of livelihood represent the economic base of the district. Various features of agriculture, livestock, mining and forestry are compiled in this section, while district-wise manufacturing and fisheries data is not available. The land utilization statistics in terms of cultivated, cropped and irrigated areas is furnished in Exhibit 2.6.1. Accordingly, the district shares are about 2 percent, 3 percent and 3 percent in the province respectively, while the share of geographical area is about 2 percent. As evident in the exhibit, canal is the major source of irrigation with about a 95 percent share in total irrigated areas.
Exhibit 2.6.1 Land Utilization Statistics [2012-13]
(Hectares)
As percent of the Province
Geographical Area 126,499 2.3
Cultivated Area 40,690 2.5
Cropped Area 44,265 2.6
Irrigated Area 22,415 2.9
Sources of Irrigation
Canal 20,888 3.4
Wells 96 0.2
Tube Wells 102 0.1
Tanks 232 9.0
Left Pump 91 0.3
Others 1,006 3.6
Sources: Development Statistics of Khyber Pakhtunkhwa, 2014, Important district-wise socio-economic indicators of Khyber Pakhtunkhwa, 2014
Major crops in the district are shown in the Exhibit 2.6.2. With the largest share in the cropped area, wheat is sown on 21240 hectares. This is followed by maize (5490 hectares). Rice,

District Profile Upper Dir
17
Rapeseed, Mustard. Onion and Barley also have significant shares in the cropped areas and are sown on more than 1000 hectares.
Exhibit 2.6.2 Area and Production of Major Crops – [2012-13]
Area
[Hectares] Production
[Tons]
Crops
Wheat 21,240 40,470
Maize 5,490 8,460
Rice 4,160 8,220
Rape Seed and Mustard 2,840 900
Onion 1,500 16,530
Barley 1,250 1,050
Fruits 880 8,600
Vegetables 590 8,010
Source: Development Statistics of Khyber Pakhtunkhwa, 2014
The number and share of agricultural machinery reflects the extent of modernization of agriculture. This information is collated in Exhibit 2.6.3. Extremely low shares of agriculture machinery with respect to cropped areas portray a gloomy picture. Only 5 tractors are available per one thousand cropped area, while the share of other machinery are also quite low.
Exhibit 2.6.3 Agriculture Machinery – [2012-13]
Numbers As percent of ‘000’
cropped area
Tractors 204 5
Threshers 184 4
Husking Machine 70 2
Source: Development Statistics of Khyber Pakhtunkhwa, 2014
Livestock is also an important source of livelihood in rural areas. Exhibit 2.6.4 displays the availability of various livestock per one thousand rural households. The table reveals that Goats, Sheep and Cattle are the major type of livestock in the district.
Exhibit 2.6.4 Population of Livestock [2006]
Numbers Per thousand Rural
Households
Cattle 232,013 2168.3
Buffalo 4,964 46.4
Sheep 91,229 852.6
Goat 352,488 3294.3
Camel 237 2.2
Horse 640 6.0
Mule 4,311 40.3
Asses 2,919 27.3
Poultry (Non-Commercial) 713,500 6668.2
Source: Development Statistics of Khyber Pakhtunkhwa, 2014

District Profile Upper Dir
18
In minerals, only the production of granite for the district is reported in the KP Development Statistics. According to Exhibit 2.6.5, 1170 Tons were produced during 2013.
Exhibit 2.6.5 Mineral Production - [2012-13]
(Tons)
As percent of the Province
Granite 1170 4.32
Source: Development Statistics of Khyber Pakhtunkhwa, 2014
Exhibit 2.6.6 reports the area under the control of the provincial Forestry Department. The exhibit reveals that the district has about 0.7 million acres of forest area which is about 15 percent of the provincial forest area.
Exhibit 2.6.6 Area Under the Control of Forest Department – [2012-13]
(Acres)
As percent of the Province
Protected Forest 277,311 23.84
Communal 107,714 87.61
Miscellaneous Forest Area 220,930 71.95
Private Plantation 88,378 5.00
Total 694,333 14.93
Source: Development Statistics of Khyber Pakhtunkhwa, 2014

District Profile Upper Dir
19
3.0 Law and Order
3.1 Background
In 2010, there were 13 terrorist attacks in the district of Dir in which 74 people were killed and 267 were injured. The district still remains vulnerable to the number of attacks, given the residing militants and military operations. The number of militants stands at 456, out which 401 were killed and 1081 injured2. “Tehreek-e-Taliban” Pakistan, the strongest militant group prevailing in the district, carried out most of these attacks followed by the Baloch and Sindhi nationalist insurgents. The nature of these attacks at times differs but most of them are target killings followed by suicide attacks. The infestation of TTP militants in Upper Dir is plausible given the fact that it has the longest border with Afghanistan. Upper Dir was first attacked in mid-2009 in a cross border attack in which 31 police and local levies were killed. This caused the military to deploy some 100,000 troops to take control of this area. Nevertheless the attacks occur to this day. The intensity is of a grave nature in these districts. In 2012, the militants beheaded a group of 17 soldiers. Many people are seeking refuge in these areas due to the vulnerable situation, despite the fact that the military is deployed. Despite heavy deployment of military personal, the movement along the borders of Afghanistan and Pakistan remains un-monitored. One argument is that the people travelling can move across the borders without a visa. According to the ground personal, most of the afghan army personnel travel to Chitral for medical purposes. There is an abundance of anecdotal evidence of abuse, destruction of houses, revenge killings, raids and abduction in the district. In 2012, the peace committee in Upper Dir, forced a kidnapped women in to marriage and released her later after government action and public protest. Such crimes are common in the district. Most of the civilians are forced to join the laskhars (self-formation of civilian army) to fight alongside the military operation. This includes local unarmed and untrained civilians who do not even know how to hold a gun. These lashkars are told to fight against trained and motivated militants of the Afghan tribes. This situation will continue to prevail due to the outsourcing of the enforcement activities to the untrained and poorly armed civilians.
3.2 Law Enforcement Agencies The Deputy Commissioner (DC) Upper Dir is the overall lead of the executive branch of the government in the district. He directly supervises the levies force and conducts the business of district management through a multi-departmental structure including the Police and armed forces of Frontier Corps and 01 Brigade of Army. The district Police Officer (DPO) is in-charge of the Police department responsible for the overarching security of the district. He established security in the district through 10 Police Stations built across main towns. He works closely with the district judicial system led by the district and session judge Upper Dir3. Upper Dir has three main types of law enforcement agencies,
1) Police including both regular and special police force under the direct command of DPO.
2) Levies, it is a tribal force and under the direct command of DC and
3) Armed Forces i.e. Dir Scouts and Pak Army, both of these forces have a great role in the war against militancy.
2 Pakistan Security Report 2012
3 http://www.malakandpolice.gov.pk/diruppolice.php

District Profile Upper Dir
20
Exhibit 3.2.1 Strength of the Law Enforcement Agencies (LEAs)
# Agency/
Department
Number of Personnel Deployed Details
Male Female
1 Police (Regular) 1528 6 10 Police Stations
2 Special Police Force
635 - -
3 Levies 955 - Levies Head
Quarters
4 Frontier Corps (Dir Scouts)
3000+
1 Wing at Chukiatan (Dir Upper)
1 wing at Benshahi (Dir Lower)
1 Wing at Head Quarter Timergara
-
5 Pak Army 1 Brigade deployed in both Upper and Lower Dir Districts with a strength of
some 3500 personnel
Source: Interviews with a police inspector, a journalist and an official at levies HQ.
3.3 Judicial Infrastructure in Upper Dir There are both formal and informal justice systems operational in Upper Dir. The formal justice system is led by the district and session court based at Upper Dir, while having sub-courts at Shrengal and Warai. In informal justice system there are Jirgas, Dispute Resolution Committee and Police Station level Musalihati Committees. Details of these are given in the table.
Exhibit 3.3.1
Justice System
# Court Judges Regulation
1 District and Session Court
1 District and Session Judge
1 Additional District and Session Judge
1 Senior Civil Judge
2 Civil Judges
Regular Pakistan Justice Regulations/ Laws
Article 247 of the constitution of Pakistan gives special status to PATA 2 Tehsil Courts
1 Civil Judge (Shrengal)
1 Civil Judge (Warai)
Source: Interview with an Advocate of the District Bar
Exhibit 3.3.2 Alternate Dispute Resolution (ADR) Mechanism
# ADR Tool Level of Working Achievement
1
Dispute Resolution Committee (DRC)
1 DRC at the District Level with a membership of 18-20 persons
Look after major conflicts in the districts and works in close coordination with the office of DC to resolve immediate issues at the district level including fighting against militants of TTP
2 Musalihati Committee
1 Committee each at Police Station level. A total of 10 in the district. Works closely with Police departments to reconcile the cases outside Police Stations
This committee is responsible for hearing opposing parties before lodging FIRs, making operations easy for police, and reducing the burden of cases on the district judiciary.
3 Jirga Local level at communities
and some tribes.
It is the main source of conflict resolution across all Pukhtoon society in the area. Elders of the area carefully listen to both parties and create reconciliation through dialogue and peaceful means.
Source: Interview with an Advocate of the District Bar

District Profile Upper Dir
21
3.4 Main Crimes There are an alarming level of murder and attempted murder cases registered in the current year. Other crimes are of a minor nature and there has been an improvement observed in the overall law and order situation ever since the downfall of the TTP in the aftermath of the military operation in the district.
Exhibit 3.4.1 Crimes Rate
# Crime
(Description) Main Reasons
Incidents/ Losses in 2014
Police/ Government Response
1 Murder
Land Disputes (Due to no land settlement)
Family disputes, enmities Women issues
72
Proclaimed Offenders Arrested: 842
To be Arrested: 1911
2 Attempt Murders 61
3 Injuries 193
4 Militancy (Terrorism)
1
Total 327
Source: Interview with a Police Official
3.5 Law and Order Reforms Some of the law and order related reforms in the district are mentioned below,
Online FIRs are in operation but not very effective due to the low level of literacy.
DIG Darbar takes place once a year, providing a good platform for the local people for resolving their issues on the spot.
Musalihati Committee at the Police Station level is very much effective in decreasing the burden of the Police.
Dispute Resolution Committees at the district level, is a positive step forward
Lashkars (Tribal Militia) established in the wake of militant attacks for securing area.
3.6 Prisons Upper Dir district has no prisons. There are only judicial lock ups that are under the use of police departments. Central Jail Timergara at Lower Dir is used as a prison for the lawbreakers of the Upper Dir district.
District Profile Upper Dir
22
4.0 Conflict Management
4.1 Tribal Conflict and Local Economy
Like other districts in the region, there are number of tribes operating in the district. These include, Sultan Khel, PaindaKhel, Miyagaan, Kaatni etc. The most powerful among them is PaindaKhel followed by Sultan Khel and Yousufzai. Most of the conflicts among these tribes are because of inheritance, land, politics, water and miscellaneous reasons. These conflicts are solved through the same Jirga or court system. In some cases the powerful tribe exploits their powers when some issue arises pertinent to land ownership etc. The people of these tribes get together and often neglect the tribes which have a lower population.
4.2 Local Dispute Resolution Mechanism
When it comes to human rights, and specifically woman‟s rights, they are often neglected and women are not allowed to visit any court or police station if they want to pursue their case. They are mostly pressured by cultural constraints and lack of awareness, considering the fact that it is a male dominant society. Some of the local disputes arise because of issues of inheritance and business. Small amounts of them are related to political and religious matters. All of them are solved in the local judiciary system, Jirga.
4.3 Issues of IDP and their Impact on the Host Economy
Given the security tension prevailing in the district, many people are forced to leave their homes due to instability or lack of resources necessary for a livelihood. These Internally displaced persons have no choice but to spread around in the nearby areas for the sole purpose of survival. The indigenous residents of Upper Dir however find these people helpful in terms of employment. They get to work with new people and most of them, coming from Afghan areas, bring their culture which adds diversity which they believe enriches their culture.
4.4 Conflict Background
Decades long deprivation and economic disparity has given way to desperation among backward elements of the society. This desperation became a key element in breeding extremist views among common people, which first resulted in the armed movement of Tehreek-e-Nifaz-e-Shariat-e-Muhammadi (TNSM) .This situated then created Mullah Fazlullah of TTP in Swat, followed by Sufi Muhammad in both Lower and Upper Dir areas4.
Both the militant organizations threatened the writ of the government and tried to accomplish a state within a state. This phenomenon met the iron hand of the armed forces of Pakistan and a military operation was launched in specific areas of Upper Dir as well. The tribal oriented Lashkar (militia) was formed in upper Dir comprising of Kathanian Malizai tribe and some Kohistani tribal people. These tribal Lashkars defeated the militants with the help of armed forces and they had to run away.
Currently those militants under the leadership of Mullah Fazlullah reside in bordering areas of Afghanistan from where they frequently launch attacks against border security posts resulting in losses. Recently, in 2013, Major General Sanaullah of the Pakistan Army lost his life due to a militant attack in Upper Dir5.
4.5 Other Conflicts
Three basic disputes commonly arise over land based on:
a) Questions of ownership and the right to sell.
b) Water rights.
c) Encroachments by neighbors on personal and community property.
4 Interview with a Jjournalist.
5 http://www.thenews.com.pk/article-118334-Major-General,-Lt-Colonel-martyred-in-Upper-Dir-blast

District Profile Upper Dir
23
Land records are generally not maintained in the Pukhtoon areas because there has never been an effective presence of the government. Secondly, there is little culture of maintaining and trusting the written system6. Upper Dir‟s land which is without proper record and clear demarcation leaves people vulnerable to disputes. There are disputes on jungle, hilly areas, land pieces leading to rainy canals etc. locally called Shamilaat. There are quite a few cases on trial that are related to the issue of women‟s inheritance in courts. Another major land dispute is the claim of the tenants on lands of landlords. This is the most critical issue for the district, which is causing a continuous rise in conflicts7.
4.6 Major Tribes Exhibit 4.6.1
Population and Tribes
District Population
Tribes % of Total Population
1981 1998 2013
Projected
Upper Dir 362,565 575,852 793,458
Wardak Malizai 20%
Kattanian Malaizai 12%
Roghanian Malizai 8%
Akhunkhel Malizai 7%
Paindakhel/ Sultankhail Tarkani 35%
Syed Sadaat 15%
Kohistanian Gujjar 3%
Source: Research Work on Tribal Orientation of Dir Upper by FATA Research Center (www.frc.com )
4.7 Displacement During the military operation in some areas of Upper Dir back in 2009-10, a small number of families were displaced but they are now back and there is no current displacement. People are generally poor but it is mainly due to economic disparity. But as time is progressing income inequality is gradually decreasing. The major factor contributing in doing so is the role of remittances
6 Hassan M. Yousufzai & Ali Gohar: Towards Understanding Pukhtoon Jiirga: P, 41
7 7 Interview with Development Professional Dir (Lower)

District Profile Upper Dir
24
5.0 The Role of Women
The district of Upper Dir has been characterized as having a low standard of living which indicates that the population is uneducated and wages for labor are low. The literacy rate for Upper Dir was only 6 percent where only 3 percent of women have attended school up to the secondary level. However, despite the low literacy rate, 34 percent of women were working for wages; the study showed that women had higher economic survivability. The women‟s work was limited to crop sowing and harvesting but they were still responsible for managing the upkeep of their households and were expected to take care of the children.8 Even though, women were being paid for their labor, their mobility in society was still restricted. It was reported that a very small percentage could leave their household without any permission, while the vast majority (ninety five percent) could not even go to the market. Women‟s role in crop and livestock management is often ignored and overlooked. A report concluded that women were more efficient and productive than their male counterparts in many activities such as weeding and nursery raising9. This shows the inherent discrimination against women in the labor market as well as within their communities and homes.
5.1. Status of Women Societal norms in Upper Dir are very traditional and conservative, holding strong to the popular value system deriving its basic principles from religion. The concepts of shame, honor, hospitality, gender segregation and Purdah are predominant within local communities. Traditional division of labor is obvious; women generally manage domestic life whereas the male members of the family are responsible for earning a living and representing the family at the communal level. Only a few women have permission to go to any place without permission. Few women are able to go to health centers / friends, while the large majority (95%) cannot go to the market centers.
5.2. Population Ratio The number of male individuals compared to females within a population remained skewed towards males in Upper Dir District and most of its adjoining districts from 1981 to 1998, with the exception of Lower Dir in 1998.10However, the gender ratio was 110 males per 100 females in 1981, which decreased to 106 men per 100 women in 1998. The only exceptions to this decreasing trend were seen in Malakand and Upper Dir, where the ratio of males to females actually increased and remained the same in the latter.
5.3. Education According to the District Education Department official of Upper Dir; there are 25 middle schools for girls, where only 36 female teachers are available to teach. There are nine high schools where 64 female teachers are employed11. The number of middle schools for girls is far fewer than those available for boys. The numbers of female teachers employed at girl‟s middle schools are less too. The condition of many schools, for both boys and girls, is also a point of contention for those who wish to educate their children12. However, the majority of institutes for girls at all levels suffer from a lack of basic amenities such as clean water, bathrooms, boundary walls and
8 Muhammad Jamil Arshad & Irfan Masood: Baseline Household Survey, Upper Dir District, May 2010
9 Shah et al: Women Empowerment and Livelihood Improvement in NWFP: A Civil Society and Public Sector
Initiative 10
District Swat: Socioeconomic Baseline and Displacement Impact, 2010, Center for Public Policy research 11
Gender discrimination: Education facilities on unequal ground in Upper Dir, Express Tribune, 12
ibid

District Profile Upper Dir
25
electricity, thus reinforcing major inequalities in educational opportunities between boys and girls in Upper Dir.
5.4. Marriages Marriages are the occasions when relatives, friends and neighbors are invited for food with traditional pomp and show13. For the departure of the girl to the husband's house, a large procession called "Janj" carrying Doli (palanquin), visits the bride‟s house from the bridegroom's family on the fixed date. The youngsters from the groom's side fire gun shots in the air to celebrate. The Nikah ceremony is performed in the mosque in the presence of the Maulvi and other relatives.
5.5. Vulnerability of Women and Children The most vulnerable segment of the society in the conflict context are women and children, as they are the easiest targets14. Militants in Swat and Upper Dir were initially fortunate enough to have the support of the local people in general and women in particular. Fazlullah used his FM radio broadcast intelligently to grab the support of women in Upper Dir, particularly those above the age of 55. Initially, women forced males to support Fazlullah and even donated their jewelry and other valuables for his cause.
5.6. Source of Income Farming, trade and working overseas are the main sources of income for the people. A very small proportion of the population is employed in government departments15. The women outside proper Dir share the work with the men in the agriculture sector in addition to their household duties.
5.7. Agriculture Most of the Upper Dir district is mountainous terrain. Agricultural land is available only on the hilly slopes and in the valleys. Farming is usually carried out with crude implements such as ploughs drawn by bullocks, which is the traditional method of ploughing done by men, where women assist them. The irrigation system is also not ideal; agriculture mostly depends upon rain fall. Wheat, maize and rice are the major crops of the district.
5.8. Women in Politics Elders of the Upper Dir district, under the head of Malik Jehanzeb and Malik Faiz Muhammad, and leaders of political parties in the region, reached an agreement that women will not be allowed to cast their votes16.
13
Government of Khyber Pakhtunkhwa official website 14
Socio-Economic Conditions of Post Conflict in Swat, by Dr. Salman Bangash 15
District Health Profile, Upper Dir, by USAID 16
Tribal tradition: Upper Dir elders, parties bar female voters, Express Tribune,

District Profile Upper Dir
26
6.0 Environmental Analysis
The district Dir Upper is the upper part of the old Dir district. At the time of independence Dir was a state ruled by Nawab Shah Jehan Khan. It was merged with Pakistan in 1969 and was declared as a district in 1970. In 1996, it was bifurcated into Upper and Lower Dir districts and consists of Dir and Wari, two sub divisions. Upper Dir district is 3,699 square kilometers in area and formed part of the former Malakand Division, lying along the Afghanistan border between Chitral, Bajaur Agency and Lower Dir. Almost the entire district lies in the valley of the Panjkora River which joins the Swat River near Chakdara in Malakand District. Upper Dir is rugged and mountainous with peaks rising to 16,000 feet (4,900 m) in the north-east and to 10,000 feet (3,000 m), along the watersheds with Swat to the East, Bajaur Agency to the south-west, Chitral to the North, Lower Dir to the South and Afghanistan to the West. It is connected with the Kohistan District via the Badawi Pass17.
6.1 Climate, Land and Water
Climatically the area is divided into sub-humid sub-tropical, temperate zones, Alpine zones and ice cap zones. Summer season of the District Dir Upper is moderate and warm. June and July are the hot months. The mean maximum and minimum temperature during the month of June is about 33 and 16 degree centigrade respectively. During spring season, the wind storms from Lowari Top locally known as Badama, occur in the afternoon, which are quite chilly and intolerable. The winter season is very cold and severe. Temperature rapidly falls from November onwards. December, January and February are very cold months. During this period, the temperature generally falls below freezing point. The mean maximum and minimum temperatures during the month of January are 11 and -2 degree centigrade respectively. Rainfall is received throughout the year18.
The area is dominated by mountains and hills that are part of the ranges of the eastern Hindu Kush. The lowest point of the area is 1100 meters at Darora while the highest peak of the area is 4000 meters at Saidgai Lack. Erosion and landslides are common due to steep slopes and heavy degradations of vegetation. The total area of the valley is 113,373 acres. Out of the same, Forest land is 95,095 acres, agricultural land is 6,175 acres, commercial land is 3,705 acres and vacant land is 8,398 acres19.
Status before the floods: 203 water supply schemes located in 44 village clusters were identified by community leaders. All water supply schemes are communal. Only 65% of them are providing drinkable water.
Floods damages: Almost 74% of water supply schemes have been damaged by the floods leaving only 53 schemes functional. 56% of the village clusters with prior water supply schemes have been affected. The largest damages are found in village clusters having more than 10 water supply schemes. Only 2 hand pumps were reported in Upper Dir, both in Pashta village cluster (Pahsta UC), out of which 1 has been damaged by floods.
Status of springs before floods: 647 springs were identified in 58 village clusters. Information was not available for others village clusters. 94% of these springs are communal property. More than 68 % of these springs were damaged by the floods. Only 58% of the assessed springs are providing drinkable water after the floods20.
17
Welcome to Dir State, Land of Peace and Hospitality, Upper Dir District, Syed Ziafat Ali, http://dirbeauty.webs.com/dirupper.htm 18
Chapter 1, Introduction, http://prr.hec.gov.pk/Chapters/972S-1.pdf 19
Chapter 1, Introduction, http://prr.hec.gov.pk/Chapters/972S-1.pdf 20
Rapid Needs Assessment Upper Dir District – KP Province, Agency for Technical Cooperation and Development (ACTED), Islamabad, Pakistan, August 2010, http://floods2010.pakresponse.info/assessments/ACTED-RNA-Upper%20Dir%20District-KP_12August2010.pdf

District Profile Upper Dir
27
6.2 Forests and Agriculture
The hills top are mostly covered with natural forests. There are numerous private nurseries of all kinds developed with the cooperation of Forest Department. The Forest Development Corporation is playing a very important role in the development of Forests in the district. Pine trees, poplar, eucalyptus, oak, wild olive etc. are the most common forms of forestry in the district. Forestation by the Forest Department is on 277,311 acres The district Dir (Upper) is mostly mountainous terrain. Agricultural land is available only on the hill slopes and in the valleys as such mechanized agriculture is hardly done except in those areas which are easily accessible for transportation of agricultural machinery. Farming is usually carried out with crude implements, such as ploughs drawn by bullocks, which is the traditional method of ploughing. The irrigation system is also not ideal since most agriculture depends upon rainfall. Wheat, maize and rice are the major crops of the district. Fruits and vegetables of various kinds are also grown in the district. The important fruits grown in the district are; walnut, apple, peas, plum, fig, loquat, mulberry and persimmon.21 The main crops grown here are maize and potato22.
6.3 Environmental Hazards
The following are some of the major environmental hazards in the Upper Dir district,
Floods: Rapid changes in the weather pattern have increased vulnerability to natural disasters particularly monsoon floods, both flash and riverine, to Khyber Pakhtunkhwa23. As observed in 2010, the monsoon season brought with it massive destruction on a scale not previously recorded in the region. The magnitude of the calamity can be gauged from data compiled by the Federal Flood Commission, which states that the flow of rivers, Swat and Kabul combined, touched a new historical height of 400,000 cusecs.
Displacements: 1,417 families were displaced during the floods, i.e. 1.6 % of the total number of families. However, displacement in Upper Dir affected more than 50% of the assessed village clusters, and the villages‟ clusters are particularly concerned with more than 10 % of the population being displaced.
Earthquakes: An earthquake with magnitude of 5.3 jolted several areas of Punjab and Khyber Pakhtunkhwa provinces as well as Azad Kashmir and Gilgit-Baltistan in July 201324. The tremor was felt in Peshawar‚ Swat‚ Nowshera‚ Malakand‚ Upper Dir, Abbottabad, Manshera, Haripur, Chitral, Khyber Agency‚ Rawalpindi/Islamabad Lahore and Azad Kashmir. According to the United States Geological Survey (USGS), the epicenter of the earthquake was located in Hindu Kush region.
Rainfall: Isolated rain and thunderstorms with light snowfall over the hills are normal during the winter in Upper Dir, Malakand, Hazara, and Peshawar divisions.
21
Chapter 1, Introduction, op. cit. 22
UNICEF Funded, “WASH Flood Emergency Response” District Upper Dir, Khyber Pakhtunkhwa (KP) Installation / Maintenances / Repair & Hygiene Promotion), Monthly Progress Report, Period Reported: 30th September to 31st October 2010, reported by Sadaf Jawed, Rural Development Initiative (RID) 23
Monsoon Contingency Plan 2014, Government of Khyber Pakhtunkhwa 24
Earthquake 5.3 earthquake jolts different parts of Pakistan, The Nation,

District Profile Upper Dir
28
7.0 Social Mobilization
Numerous government and non-government programs and approaches have been used to promote rural development and poverty alleviation. Among these have been initiatives designed to build rural infrastructure, mobilize communities, enhance access to rural finance, and provide a social safety net.
7.1 Role of PPAF
Social mobilization is the primary step of community development for recovery from conflicts and disasters. It allows people to think and understand their situation and to organize and initiate action for their recovery with their own initiative and creativity. PPAF utilizes social mobilization as the primary means of supporting rural men and women in their efforts to alleviate poverty and has therefore facilitated the growth of 1,421 community based institutions (COs) in the district with the help of their partner organizations Sarhad Rural Support Program (SRSP) under implementation of PPAF-III.
With the help of SRSP, PPAF has implemented a total of 42 Community Physical Infra-structure (CPI) projects that resulted in 54,830 beneficiaries in the district. PPAF provides support in the form of loans or grants to partner organizations for approved physical infrastructure interventions. Identification of the projects is demand driven, and is determined by the communities through an internal participatory process. For purposes of ownership, it is mandatory for the communities to share in the costs of the project, and also to maintain the infrastructure provided.
PPAF also facilitated its partner organization Khwendo Kor (KK) to support 10 schools in the district by providing provision to repair and renovate school buildings, furniture, libraries, science laboratories, sport equipment, and to impart teacher training programs. These schools are catering for more than 2,863 students.
PPAF has facilitated Poverty Eradication Initiatives (PEI) in completing a project in the health sector that is providing health care services to 33,819 community members. Mainly, PPAF has been providing support for two models namely: (a) Establishing community managed health centers, and (b) Strengthening government health centers, operating them for a period of up to 3 years and handing them back to the government. The objective of PPAF health program has been to provide access to quality basic health services with special focus on maternal and child health to the poor and marginalized rural communities by focusing on all aspects required in this regard. These aspects include the hiring of qualified and trained health care staff and paramedics, availability of proper buildings, standardized equipment, furniture and medicine, and following WHO guidelines in terms of infection prevention practices.
Through carefully planned interventions, PPAF successfully provided 4,578 trainings and transferred 1,793 assets aimed at the ultra-poor and vulnerable in the district with the help of SRSP and Support with Working Solution (SWWS). The core objective for these activities is to enhance local capacities for long term restoration of livelihoods through interventions such as cash for work, grants for work, enterprise training, training of common interest groups, skills training etc.
7.2 Local NGOs
There are various NGOs operating in the area of Upper Dir which include the following:
Association for Behavior and Knowledge Transformation - ABKT
Devolution Trust for Community Empowerment (DTCE)
Korangi Welfare Organization – KWO
Deputy Agency Development Officer – DADO
Sustainable Education and Environmental Development (SEED)

District Profile Upper Dir
29
Some of the development projects ongoing in the area are: SRSP‟s MHP funded by EU, A political awareness campaign by ABKT, Public safety and justice program by DTCE funded by the Govt. of Netherland.
7.3 Focus of Donor Community
In order to gain a better understanding of the programmatic focus of the various donor agencies operating in the area, the following table summarizes various projects operating in different sectors distinguished by donor and executing agencies in the district.
Exhibit 7.3.1 Donor Projects
Project Name Sector Donor Executing Agency
Agribusiness Project Agriculture USAID Agribusiness Support
Fund (ASF)
Small Grants Ambassador's Fund Program
Wildlife Conservation,
Women Issues, Cultural
Preservation, Entrepreneurship, Water Sanitation
and Hygiene
USAID NRSP
Strengthening Citizen Voice and Public Accountability Program
Democracy and Governance
USAID
Trust for Democratic Education and
Accountability (TDEA) and The Asia
Foundation (TAF) NGO Dir Area Development
Organization
Economic Revitalization of KP
Multi-Donor Trust Fund (MDTF)
GOP KP
Governance Support Project
Governance Multi-Donor Trust
Fund (MDTF) GOP KP
Government Officials Survey on Administrative, Tax and Gender Reforms in Khyber Pakhtunkhwa
Deutsche Gesellschaft für Internationale
Zusammenarbeit (GIZ) GmbH
Dev Swap V: Health Infrastructure
Health - Infrastructure
German Development Cooperation
Govt of KP
Edu Swap II: School-Infrastructure KP
Education - Infratsrcture
German Development Cooperation
Govt of KP
Dev Swap III: Housing Reconstruction KP
Infrastructure German
Development Cooperation
Govt of KP
Dev Swap IV: Rehabilitation of Schools KP
Education German
Development Cooperation
Govt of KP

District Profile Upper Dir
30
Exhibit 7.3.1 Donor Projects
Project Name Sector Donor Executing Agency
Education sector development program in Khyber Pakhtunkhwa and in the Federally Administered Tribal Areas (FATA)
Education
German Federal Ministry for Economic
Cooperation and Development (BMZ
Elementary and Secondary Education
Department KP; Directorate of
Education FATA
Livelihoods Program Hindukush Pakistan
Livelihood Swiss Development Cooperation (SDC)
Inter corporation, Govt of KP
Community-Based Disaster Risk Reduction Project
Disaster / Emergency
Swiss Development Cooperation (SDC)
USAID, Govt of kp, PDMA

District Profile Upper Dir
31
8.0 Important Institutions
8.1 Institutions and Stake Holders The district is administratively subdivided into six tehsils which contain a total of 28 UCs. The district is represented in the National Assembly and Provincial Assembly by one elected MNA and three elected MPAs respectively.25 For the purposes of administration, the district is divided into Dir and Wari subdivisions and 6 tehsils, which include Dir, Barawal, Kalkot, Wari, Chaper and Khal. There are a total of 28 UCs; 13 UCs in tehsil Dir, 8 UCs in tehsil Wari, 3 UCs in both tehsils Barawal, Chaper, and Kalkot and 1 UC in TesilKhall, all rural ones whose elected representatives formulate district and tehsil assemblies.26
8.2 Financial Institutions in the District The financial activities in the Upper Dir district are mainly driven by agriculture, horticulture and remittances that come from a large number of men working in other cities of the country, coal mines of Balochistan and in the Gulf States. Commercial banks that are operating in the districts are United Bank Ltd (UBL), Habib Bank Ltd (HBL), Muslim Commercial Bank (MCB), Allied Bank Ltd (ABL) and National Bank of Pakistan. These banks focus on providing micro finance facilities to the natives. Moreover, Zarai Taraqiati Bank Limited (ZTBL) takes care of the local farmers by providing them soft loans in order to promote agricultural activities. Sarhad rural Support Program (SRSP) is another vital welfare organization that operates in the district and has its roots in almost every Tehsil of it.
25
The Khyber Pakhtunkhwa Tribune, http://KPtribune.com/index.php/en/upper-dir 26
UNICEF Funded, “WASH Flood Emergency Response” op. cit.