uranium partitioning during water treatment processes dr. ashraf e. khater king saud university,...
TRANSCRIPT

Uranium partitioning during water treatment processes
Dr. Ashraf E. KhaterKing Saud University, Saudi Arabia
Atomic Energy authority, Egypt

Outlines
Aim of Work
Drinking Water Purification
Experimental work
conclusions
Introduction
Results and discussion

• Generally, the occurrence of radionuclides in the underground water is
meanly due to the leaching of the salts from the bed-rocks.
• Uranium is mobilized from rock by the weathering of uraninte (UO2).
• The action of surface water and groundwater causes oxidative
dissolution of uraninite to soluble uranyl ion (UO22+).
• Worldwide from 27 000 to 32 000 t uranium are released from
igneous, shale, sandstone rocks annually by weathering and natural
erosion (Eriksson 1960; Bowen 1966; environment Canada 1983; CCME
2007).
Introduction
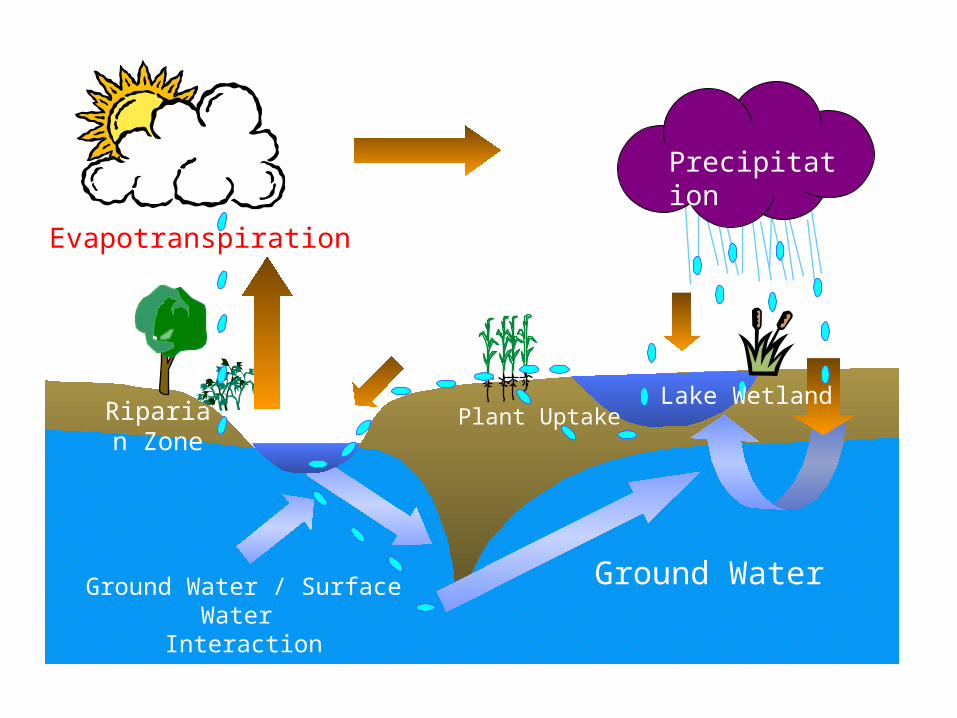
Evapotranspiration
Recharge
Ground WaterGround Water / Surface Water Interaction
Stream
Lake
Precipitation
Plant UptakeLake
Surface Runoff
Riparian Zone
Wetland

Ground Water
UNSATURATEDZONE
Ground Water
UNSATURATEDZONE
WATER TABLE
ZONE OFSATURATION

Why is Groundwater Important?
• Groundwater supplies:
– 75% of drinking water in Europe
– 51% in the US
– 32% in Asia
– 29% in Latin America

Groundwater Pollution• Groundwater pollution comes from:
– Storage lagoons– Septic tanks– Landfills– Hazardous waste dumps– Deep injection wells– Stored gasoline, oil, solvents, and hazardous wastes underground – can
corrode and leak• Pollutants in drinking water = high risk health problems
– Contamination with petrochemicals (gasoline and oil)– Organic solvents (TCE)– Pesticides– Arsenic– Lead– Fluoride
• Groundwater cannot clean itself of degradable wastes as flowing surface water can because it flows so slowly, has much smaller amounts of decomposing bacteria, and has cold temperatures that slow down the chemical reactions that decompose waste

••••
Sources of Contamination
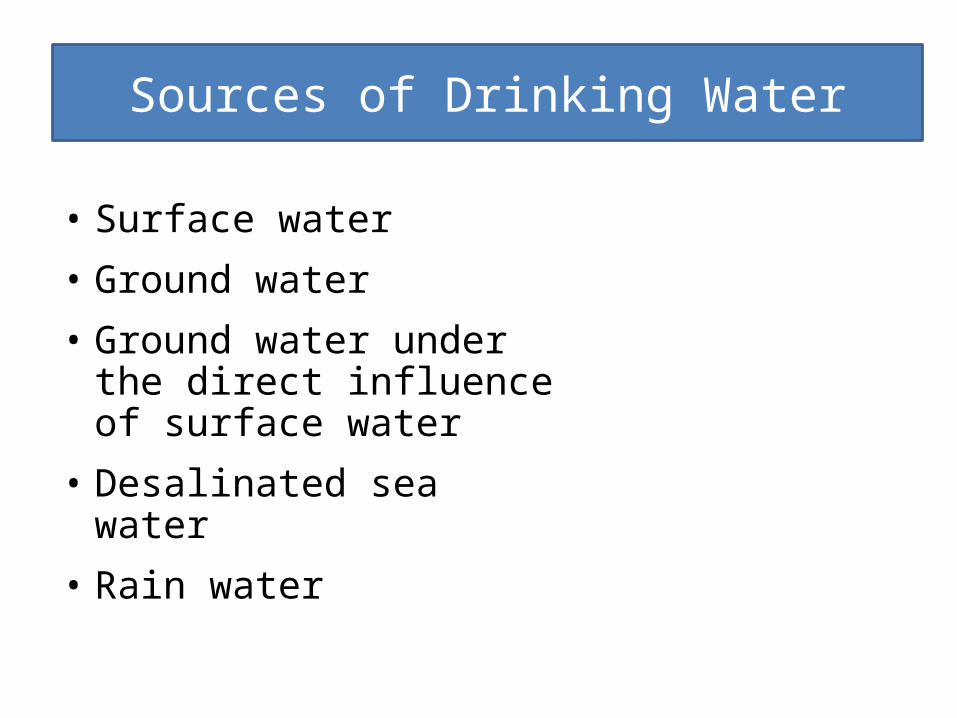
Sources of Drinking Water
• Surface water
• Ground water
• Ground water under the direct influence of surface water
• Desalinated sea water
• Rain water

The Drinking Water Cycle
Water System
Distribution System
Sewer Lines
Wastewater Plant
Discharge
Homes or Businesses
Septic System
Infiltration
Source(aquifer, lake,
etc.)
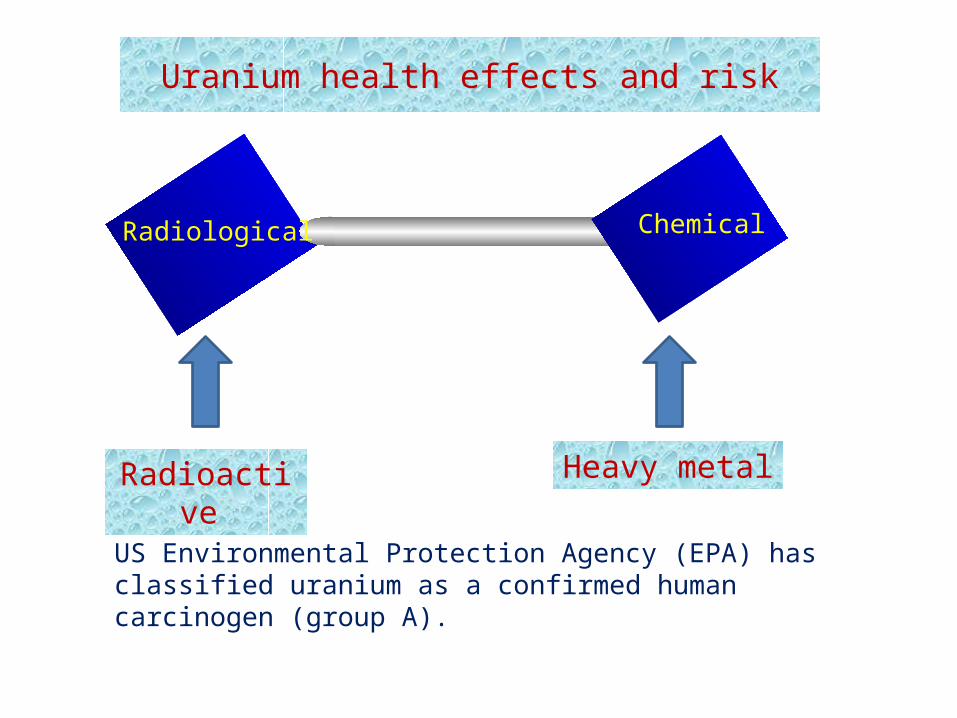
Uranium health effects and risk
RadiologicalTEXT
Radioactive Heavy metal
Chemical
US Environmental Protection Agency (EPA) has classified uranium as a confirmed human carcinogen (group A).

Maximum acceptable level of U in drinking water
• EPA has suggested that only zero tolerance is a safe acceptable limit for the carcinogenic risk from uranium and finalized a realistic regulation levels as maximum contaminant level (MCL) of 30 µg.L-1,
• Canada proposed interim maximum acceptable level (IMAC) of 20 µg.L-1, and
• World Health Organization (WHO) strictly recommended a reference level of 2 µg.L-1(Kim et al. 2004).
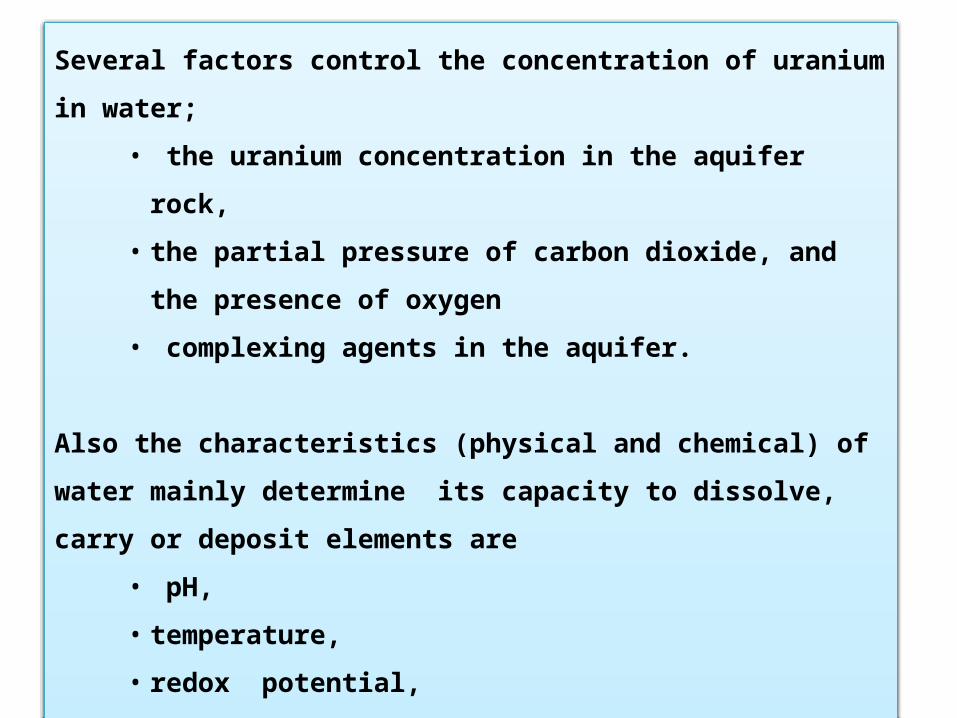
Several factors control the concentration of uranium in water;
• the uranium concentration in the aquifer rock,
• the partial pressure of carbon dioxide, and the presence of oxygen
• complexing agents in the aquifer.
Also the characteristics (physical and chemical) of water mainly determine
its capacity to dissolve, carry or deposit elements are
• pH,
• temperature,
• redox potential,
• concentration and properties of dissolved salts,
• flow rate and residence time (Pontius 2000; Shabana and Al-Hobiab 1999).
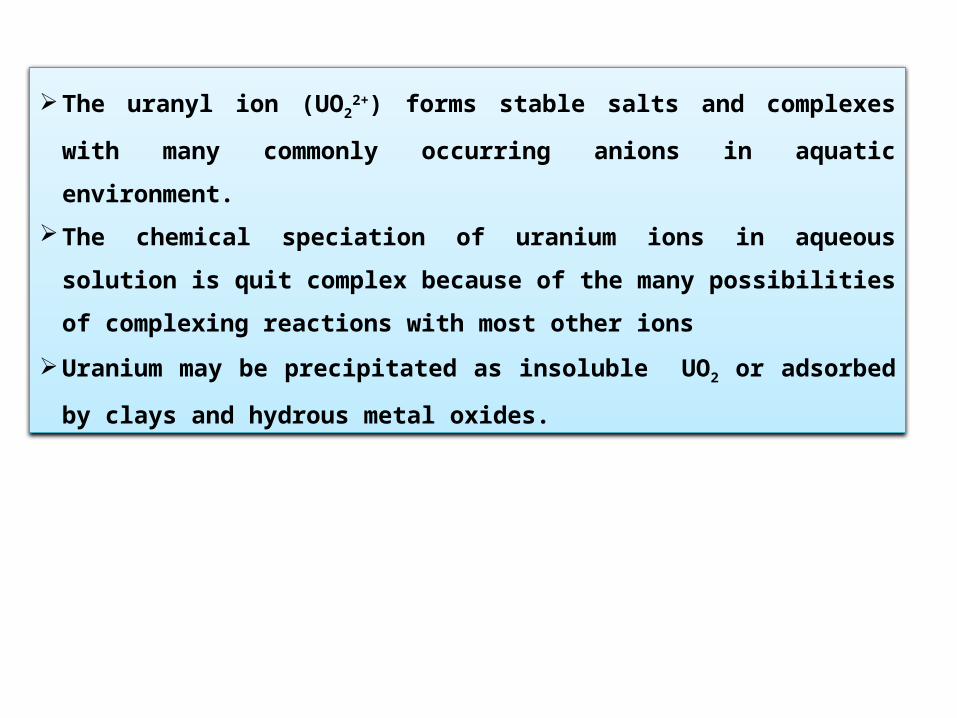
The uranyl ion (UO22+) forms stable salts and complexes with many commonly
occurring anions in aquatic environment.
The chemical speciation of uranium ions in aqueous solution is quit complex
because of the many possibilities of complexing reactions with most other ions
Uranium may be precipitated as insoluble UO2 or adsorbed by clays and hydrous
metal oxides.
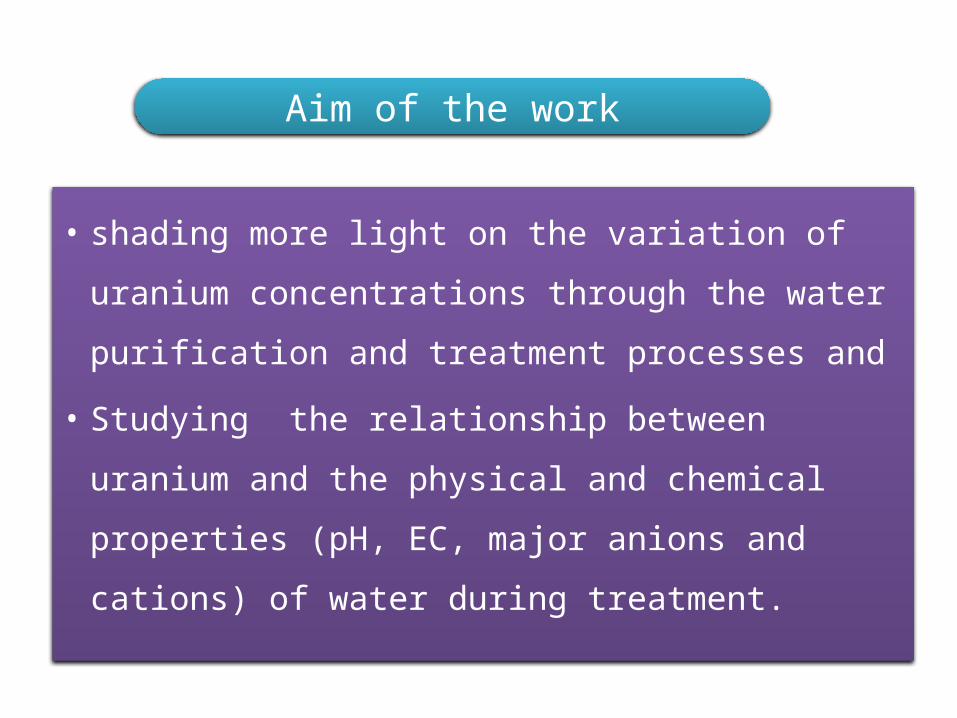
• shading more light on the variation of uranium
concentrations through the water purification and
treatment processes and
• Studying the relationship between uranium and the
physical and chemical properties (pH, EC, major
anions and cations) of water during treatment.
Aim of the work
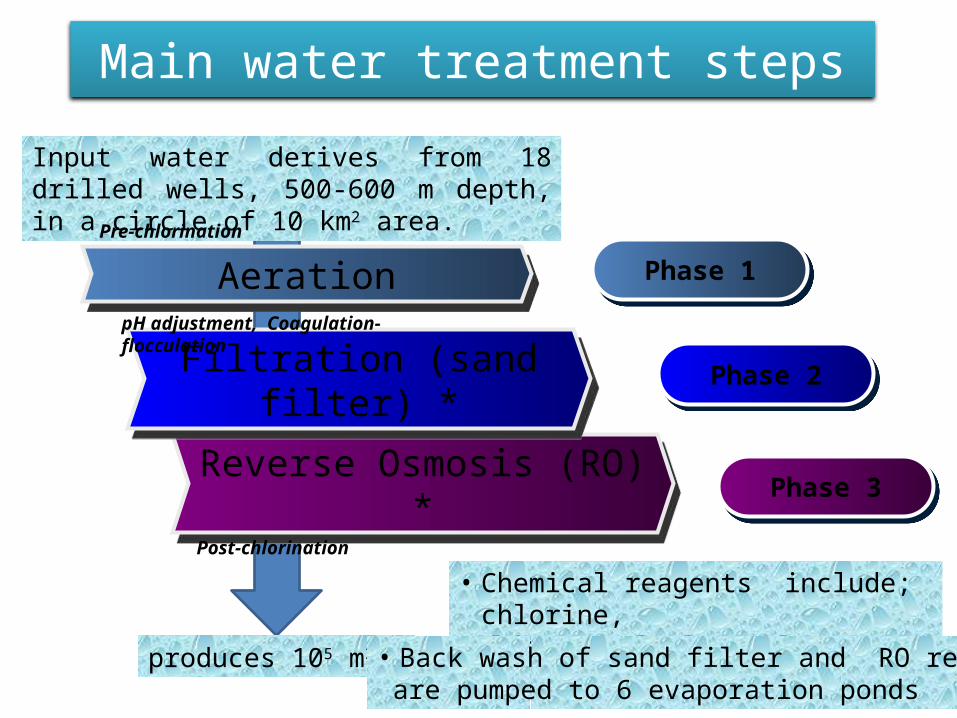
Main water treatment steps
Reverse Osmosis (RO) *Reverse Osmosis (RO) *
Filtration (sand filter) *Filtration (sand filter) *
Phase 1Phase 1
Phase 2Phase 2
Phase 3Phase 3
AerationAeration
Input water derives from 18 drilled wells, 500-600 m depth, in a circle of 10 km2 area.
produces 105 m3/d
• Chemical reagents include; chlorine,Sulfate, polyelectrolyte, lime.
• Back wash of sand filter and RO reject are pumped to 6 evaporation ponds
pH adjustment, Coagulation-flocculation
Pre-chlorination
Post-chlorination

Experimental work
• Sampling: Water samples; input- after aeration, after filtration (sand
filter), sludge tank, reverse osmosis permit, reverse osmosis reject, output
water and two samples from the evaporation ponds. Water samples were
collected in 5 L capacity polyethylene containers, and transferred and kept
in darkness for preservation,
• Uranium concentrations, µg.L-1, were measured using PerkinElmer model
ELAN-9000 ICP-MS,
• Water physical and chemical properties such as pH, EC (electric
conductivity, dS.cm-1), major cations (Ca, Mg and K) and major anions (CO3,
HCO3, Cl and SO4) were determine using standard methods (Al-Omran
1987)

The variation percentage of uranium concentration in water samples
relative to input water were calculated using the following equation:
Δ = (C –C’) x 100/C
Where: C; uranium concentration in input water
C’; uranium concentration in the sample
Positive and negative percentages mean uranium decontamination and
increment of uranium concentration, respectively (Jimenez 2002)
Cont.: Experimental work

Results and discussion

Samples Uranium▲
μg/ L mBq/L
Input 4.0 49 0
After Filtration 4.1 51 -2
Sludge tank 4.2 52 -5
R.O. Permit 0.06 0.74 99
R.O. Reject 15.7 195 -293
Output 0.17 2 96
Evaporation P-1 8.3 103 -108
Evaporation P-2 35.1 435 -778
Uranium concentrations (µg.L-1) and activity concentrations (mBq.L-1) in
water samples and variation ratio.

Uranium concentration was not changed before the reverse osmosis
process, only variation percentage of -2 % after filtration.
Uranium removal percentage by reverse osmosis process was 99 %
while the increment of uranium in reverse osmosis reject water was very
close to 300 %.
Reverse osmosis is one of the few water treatment methods which can
be applied for simultaneous removal of U, Ra, Pb, Po and water salinity,
i.e. water is almost completely demineralized (Huikuri et al 1998).
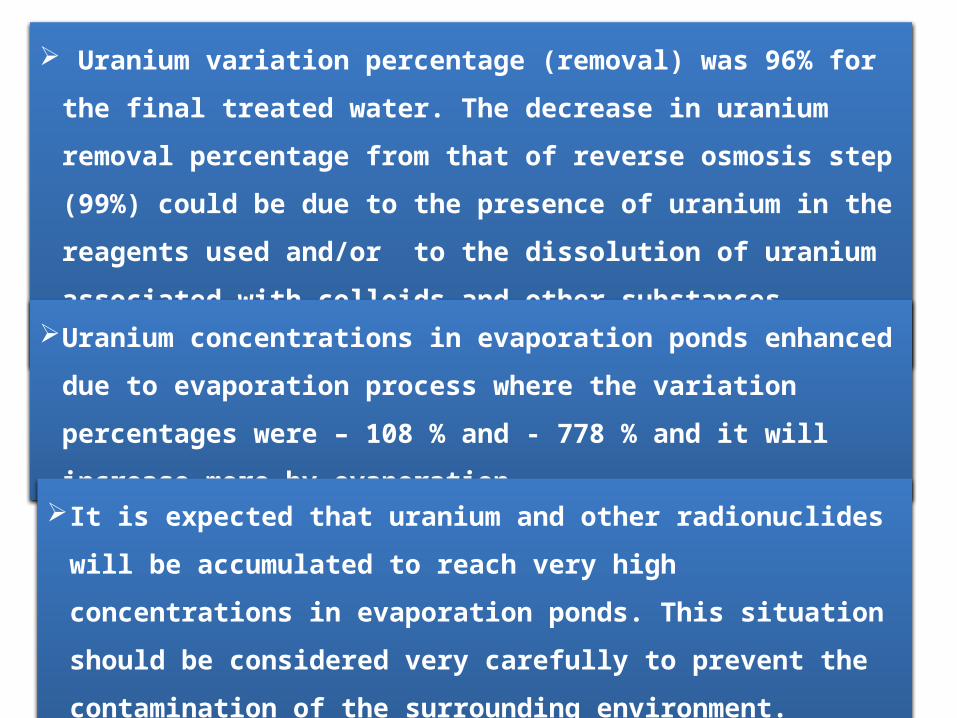
Uranium variation percentage (removal) was 96% for the final treated
water. The decrease in uranium removal percentage from that of reverse
osmosis step (99%) could be due to the presence of uranium in the reagents
used and/or to the dissolution of uranium associated with colloids and
other substances, during water treatment processes (Jimenez 2002).
Uranium concentrations in evaporation ponds enhanced due to evaporation
process where the variation percentages were – 108 % and - 778 % and it
will increase more by evaporation.
It is expected that uranium and other radionuclides will be accumulated to
reach very high concentrations in evaporation ponds. This situation should
be considered very carefully to prevent the contamination of the
surrounding environment.

Physical and chemical properties of water samples
Ser. pH EC
No. (dS/cm) Ca Mg Na K CO3 HCO3 Cl SO4
1 Input (after airation) 8.3 1.2 6 4 4 0.15 1.3 1.5 7 3
2 After sand filter 8.3 1.1 5 3 4 0.15 1.3 1.0 8 4
3 From sludge tank 8.2 1.1 6 4 4 0.15 1.3 2 7 4
4 Revers Osmosis permit 8.4 0.22 1 0.59 0.84 0.1 6 0.5 2
5 Revers Osmosis reject 8.5 1.7 10 6 13 0.27 1.3 3 18 8
6 Output 7.9 0.32 1.5 0.89 1.9 0.13 3 1.2 4 2
7 Evaporation bond-1 8.3 5 26 16 26 0.63 1.3 3 36 18
8 Evaporation bond-2 7.6 17 66 39 106 1.9 1.3 1.5 138 40
Major Anions (meq/L)Major cations (meq/L)Samples

pH values ranged from 7.6 to 8.5 where U and most heavy elements are
increasingly adsorbed on oxides, clays and other silicates. The adsorbed
fraction may be very close to 100 % above pH 7.
It was reported that uranium concentrations enhanced in all water that has
been purified within the acidic pH (<7) (Jimeneze 2002).
It obvious that the reverse osmosis process remove not only U but also
other anions and cations with variation concentration percentages more
than 400% for Ca, Mg and Na, about 200 % for HCO3-, and about 50 %
for K+.

Correlations between uranium concentration and physical and chemical properties of water samples
U Δ pH EC Ca Mg Na K CO3 HCO3 Cl SO4U 1Δ -1 1
pH -0.56 0.55 1EC 0.93 -0.92 -0.72 1Ca 0.93 -0.93 -0.68 1.0 1Mg 0.93 -0.93 -0.68 1.0 1 1Na 0.94 -0.94 -0.73 1.0 0.99 1 1 K 0.93 -0.93 -0.73 1.0 0.99 1 1.0 1
CO3 -0.39 0.43 0.14 -0.3 -0.33 -0.3 -0.27 -0.27 1HCO3 0.32 -0.31 0.25 0.1 0.18 0.2 0.09 0.11 -0.63 1
Cl 0.94 -0.94 -0.71 1.0 0.99 1 1.0 1.00 -0.25 -0.03 1SO4 0.92 -0.92 -0.66 1.0 1.0 1 0.98 0.99 -0.31 0.20 0.98 1

There are strong correlation (correlation coefficient) between uranium
concentrations and EC (0.93), Ca (0.93), Mg (0.93), Na (0.94), Cl (0.94)
and SO4 (0.92).
The correlation is good (-0.56) with pH values and weak with CO3
(-0.39) and HCO3 (0.32).
The strong correlation could be explained due to the demineralization
of water during treatment processes especially during reverse osmosis
process or due to the chemical behavior of uranium. For example,
uranium can form soluble complexes in most underground waters
with chloride, sulfate and under oxidizing conditions with carbonate
which keep uranium in solution (Shabana and Al-Hobiab 1999).

Conclusions
• Drinking water treatment is very essential to remove many contaminants such as radionuclides.
• Reverse osmosis is very effective in removing radionuclides, heavy metals and other element but it de-minerlizes water.
• Drinking water purification residuals should be carefully considered for their possible environmental risks.

Thank you