urban drainage and climate change - impact...
TRANSCRIPT
LICENTIATE T H E S I S
Luleå University of TechnologyDepartment of Civil, Mining and Environmental Engineering
Division of Architecture and Infrastructure
2007:40|: 402-757|: -c -- 07⁄40 --
2007:40
Urban Drainage and Climate Change- Impact Assessment
Karolina Berggren
Urban Drainage and Climate Change - Impact Assessment
Karolina Berggren
Licentiate thesis
Division of Architecture and Infrastructure Department of Civil, Mining and Environmental Engineering
Luleå University of Technology SE-971 87 Luleå
Sweden

Urban Drainage and Climate Change - Impact Assessment Karolina Berggren Division of Architecture and Infrastructure Luleå University of Technology
Nr: 2007:40 ISSN: 1402-1757 ISRN: LTU-LIC--07/40--SE
I
Acknowledgement
This research was carried out at the Division of Architecture and Infrastructure, at Luleå University of Technology (LTU). The research work has been supported by the Swedish Research Council for Environment, Agricultural Science and Spatial Planning (FORMAS), which is gratefully acknowledged. I would also like to thank Åke och Greta Lissheds Stiftelse, Stiftelsen Lars Hiertas Minne, and Wallenbergsstiftelsen for their support.
Since I started working at LTU, I have had the opportunity to join the research school for women (forskarskola för kvinnor), which I have enjoyed. Thank you all who have been involved in that process!
My deepest gratitude goes to my supervisor Prof. Maria Viklander, who encouraged me to start as a PhD-student, and guided me well through the journey. I would also like to thank my co-supervisor, Prof. Gilbert Svensson at DHI Water and Environment (Gothenburg) for his patience and good advice. Maria and Gilbert, you have made this possible for me! You also encouraged me to continue to ask questions, even though there might be no simple answers to find. Thank you so much!
Thank you all friends and colleagues at the Urban Water research group, I enjoy working with you! I would also like to give special thanks to Mats Olofsson, who has shared much of the work in this project, Thank you Mats!
For good discussions and collaboration, I would like to thank Dr. Jonas Olsson at the Swedish Meteorology and Hydrology Institute (SMHI) in Norrköping. Many thanks to Kalmar Vatten AB, for permission to use their urban drainage model, and to Dr. Claes Hernebring at DHI, for help and support. For good advice, I would like to thank Mats Bergmark at MittSverige Vatten AB (Sundsvall).
I would also like to thank Mr Dave Pearson, for proof-reading my English language.
To my family and my friends: Thank you for reminding me of those things in life that are most important!
Most of all, I would like to thank my husband and most beloved friend Robert, and our cat Linnea, which always brings me to laugh . Robert – I love you!
Thank you all!
Luleå, August 2007
Karolina Berggren

II

III
Abstract
According to the Intergovernmental Panel on Climate Change (IPCC, 2007), the global mean temperature has increased by 0,7 °C during the last 100 years and, as a consequence, the hydrological cycle has intensified with, for example, more intense rainfall events. As urban drainage systems have been developed over a long period of time and design criteria are based upon climatic characteristics, these changes will affect the systems and the city accordingly.
The overall objective of this thesis is to increase the knowledge about urban drainage in a changing climate. In more detail, the objective is to investigate how climate change may affect urban drainage systems, and also to suggest methods for these investigations.
The thesis consists of four papers. The first paper concentrates on the Delta change method for adaptation of rainfall data from climate models for urban hydrology use. The second paper is an impact assessment with urban drainage model simulation of a study area in the south of Sweden. The third paper is also an impact study, from a cause and effect approach, where the whole urban water is included. Finally, the fourth paper contains a strategy and suggestions about tools to use for assessing impacts on urban drainage systems due to climate change. The suggested tools are urban drainage model simulations, Geographical Information Systems (GIS), and risk analysis methods.
The Delta change approach is feasible for handling the differences in spatial and temporal resolution between climate model data and the needs for urban drainage model simulations, as the method is relatively simple and the temporal resolution of observed rainfall series is preserved.
In the study area with separated storm water system, the model simulations show that the number of surface floods as well as the geographical distribution of the floods increases in the future time periods (2011-2040, 2041-2070, and 2071-2100). Future precipitation will also increase both the flooding frequency and the duration of floods; therefore, the need to handle future situations in urban drainage systems and to have a well-planned strategy to cope with future conditions is evident.
The overall impacts on urban drainage systems due to increased precipitation may, for example, be an increased number of basement floods, surface floods, problems with property and road drainage, and also increased amount of infiltration into pipes and combined sewer overflows (CSOs).
The knowledge gained from this thesis, and the strategy suggested, can be used as a starting point for impact studies on urban drainage systems. Since most impacts concern several different disciplines and a multifunctional understanding, the studies should also be performed in cooperation with parties concerned.

IV

V
Sammanfattning
Den globala medeltemperaturen har ökat med 0,7°C under de senaste 100 åren, och kommer troligen att fortsätta öka under nästa århundrade, enligt FN´s klimatpanel (IPCC, 2007). Detta påverkar också den hydrologiska cykeln, vilken intensifieras med fler intensiva regnfall, och fler extrema väder som resultat. Detta i sin tur, innebär att samhällen och städer kan påverkas, bland annat i anslutning till en stads dräneringssystem. Dagens urbana dräneringssystem har utvecklats och byggts ut under en lång tid, samt att dimensionering av systemen är starkt kopplat till klimatets karaktär för varje område.
Det övergripande syftet med detta arbete är att öka kunskapen om urban dränering i ett föränderligt klimat. Mer i detalj är syftet att undersöka hur urbana dräneringssystem påverkas av ett förändrat klimat samt att föreslå metoder för att genomföra detta.
Fyra artiklar ingår i studien, den första beskriver en metod (Delta change) för anpassning av regndata från klimatmodeller för användning inom urban hydrologi. Den andra artikeln är en studie av hur effekter kan beskrivas med modellsimulering, med hjälp av ett område i södra Sverige (med separerat dagvattensystem). Tredje artikeln utgår från ett orsak-verkan perspektiv, där också hela det urbana vattensystemet är inkluderat. Slutligen, artikel fyra, innehåller en strategi och förslag på verktyg för att underlätta bedömning av effekter i urbana dräneringssystem. De föreslagna verktygen är; modellsimuleringar, Geografiska Informationssystem (GIS) och riskanalysmetoder.
Delta change som metod är fördelaktig vid anpassning av klimatdata för användning till simuleringar av urban hydrologi, eftersom metoden är relativt enkel och för att en hög tidsupplösning i regndata kan bevaras.
Modellsimuleringarna i försöksområdet visade att antalet ytöversvämningar samt den geografiska spridningen av översvämningar ökade framtida tidsperioder (2011-2040, 2041-2070 och 2071-2100). Framtida nederbörd kan också öka både frekvensen av översvämningar och varaktigheten av dessa. Det är därför viktigt att ha en väl planerad strategi för att möta och hantera framtida situationer.
De generella effekterna på urbana dräneringssystem på grund av ökad nederbörd kan till exempel visa sig som ökad mängd källaröversvämningar och ytöversvämningar, fler bräddningstillfällen, problem vid fastighets- och vägdränering, men också ökad infiltration till ledningssystemet.
Resultaten från denna avhandling kan användas som startpunkt för studier av påverkan på urbana dräneringssystem. I dessa fall är det också viktigt att ha dialog och samarbete med personer som berörs av dessa frågor (t ex ingenjörer och forskare inom urban dränering och klimatfrågor, politiker, etc), eftersom de flesta av dessa problem berör flera olika ansvarsområden i en stad.

VI

VII
Table of Contents
1 INTRODUCTION…………………………………………………………………………….....12 BACKGROUND ........................................................................................................ 5
2.1 URBAN DRAINAGE ................................................................................................. 5 2.2 CLIMATE, WEATHER, AND IPCC ........................................................................... 8 2.3 URBAN DRAINAGE AND CLIMATE CHANGE .......................................................... 11
2.3.1 The approach to climate model data for urban hydrology use .................... 122.3.2 Impact studies: Combined system ................................................................ 132.3.3 Impact studies: Separate storm water system .............................................. 142.3.4 Consequences for receiving waters .............................................................. 15
3 METHODS ............................................................................................................... 173.1 HISTORIC AND FUTURE PRECIPITATION ............................................................... 17 3.2 URBAN DRAINAGE SIMULATIONS......................................................................... 17 3.3 CAUSE-EFFECT RELATIONS .................................................................................. 18 3.4 STRATEGY............................................................................................................ 19
4 SUMMARY OF THE SCIENTIFIC PAPERS ..................................................... 21PAPER I ...................................................................................................................... 21 PAPER II ..................................................................................................................... 23 PAPER III.................................................................................................................... 27 PAPER IV ................................................................................................................... 30
5 DISCUSSION ........................................................................................................... 335.1 STRATEGY............................................................................................................ 33 5.2 RAINFALL AND CLIMATE DATA............................................................................ 33 5.3 URBAN DRAINAGE: MODEL SIMULATIONS ........................................................... 34 5.4 URBAN DRAINAGE: CAUSE-EFFECT STUDIES ....................................................... 35 5.5 IMPACTS............................................................................................................... 36 5.6 ADAPTATION........................................................................................................ 36
6 CONCLUSIONS AND FUTURE STUDIES......................................................... 39FUTURE STUDIES........................................................................................................ 40
REFERENCES............................................................................................................ 41

VIII
IX
Papers in the thesis
(I) Olsson J., Berggren K., Olofsson M., Viklander M. Applying Climate Model Precipitation scenarios for urban hydrological assessment: A case study in Kalmar City, Sweden, submitted to ‘Atmospheric research’, April 2007.
(II) Olofsson M., Berggren K., Viklander M., Svensson G. Hydraulic impact on urban drainage systems due to climate change, submitted to ‘Journal of Hydrology’, April 2007.
(III) Berggren K., Viklander M., Svensson G. Impacts on Urban Water Systems due to Climate Change, submitted to ‘Climatic Change’, August 2007.
(IV) Berggren K., Olofsson M., Viklander M., Svensson G. (2007). Tools for Measuring Climate Change Impacts on Urban Drainage Systems. In: Proceedings of the 6th NOVATECH International conference: Sustainable Techniques and Strategies in Urban Water Management, Lyon, France, 24-28 June, 2007.
Other publications (not included in the thesis)
Conference papers Berggren K. and Viklander M. (2006). Will the existing urban drainage systems cope with future climate? – A Swedish case study. In: Proceedings of the conference: Innovations in coping with water and climate related risks, 25-27September, Amsterdam, the Netherlands, 2006.
Olsson J., Olofsson M., Berggren K., Viklander M. (2006). Adaptation of RCA3 climate model data for the specific needs of urban hydrology simulations. In:Proceedings of the 7th International workshop on precipitation in urban areas: Extreme Precipitation, Multisource Data Measurement and Uncertainty,St. Moritz, Schweiz 7-10 December, 2006.
Popular science [in Swedish] Berggren K. och Viklander M. (2005). VA-systemen i förändrat klimat – Se över redan nu! Formas tidning Miljöforskning, nr 5-6, december 2005 (sid 36-37),
Berggren K., Bergmark M., Viklander M. (2006). Mer nederbörd och fler kraftiga stormar – VA-systemen i ett häftigare klimat, tidskriften VVS teknik och installation, Tema: VA-teknik, April 2006, (sid 4-6)

Urban Drainage and Climate Change – Impact Assessment
1
1 Introduction
The global mean temperature has increased by 0,7°C (±0,2°) during the last 100 years, according to the Intergovernmental Panel on Climate Change (IPCC, 2007); consequently, the hydrological cycle has also changed with, for example, more intense rainfall events.
Internationally and nationally, there is an increasing need to assess the impacts of climate change and the ability of societies to adapt. The Stern Report (2006) reviews the economic impact of climate change, and several countries have done or are in the process of doing investigations regarding their societies’ vulnerability due to climate change. The technical infrastructure of a city, e.g. urban drainage systems, can be affected by a changing climate. Technologies and infrastructures for urban drainage systems have been developed over a long period of time, though design criteria have been relatively constant throughout the major urbanisation era. As a consequence, changes in climatic conditions, such as increasing rain intensities, changing snowmelt patterns, and increasingly more extreme weather events, such as thunderstorms, will most likely create problems in cities.
There are some specific problems connected to this area, and the main issues are:
The existing urban drainage system is designed to cope with the weather conditions for a specific area. The age of the system can vary and, in some parts, it can be very old, e.g. in many old city centers. This means that the existing urban drainage systems have been designed for the past climate conditions, but maybe not for the situation occurring today or for the future.
Urbanization is also a major issue as the urban drainage system might have been constructed for a city whose impervious surface areas were fewer and smaller than those in today's cities or will be in tomorrow's cities. This will affect urban runoff.
Several global climate models are available, and there are also different scenarios that affect the model results; together, these contribute to the many choices when choosing the input data for a research project. There are also large uncertainties involved in this field.
Due to the spatial and temporal resolution of global climate model data, there is a problem connected with the use of rainfall for simulations or calculations of urban hydrology (urban runoff). Therefore, some dissaggregation or adaptation techniques of data are needed.
Urban Drainage and Climate Change – Impact Assessment
2
The overall objective of the thesis is to increase the knowledge about urban drainage in a changing climate. In more detail, the objective is to investigate how urban drainage systems may respond to climate change, and also to suggest methods for these investigations.
The hypothesis of the thesis is:Climate change will affect urban drainage systems. The spatial and temporal resolution of climate model rainfall data is not enough for the need in urban drainage model simulations. The future urban drainage systems have to be adapted, or designed, in a different way, compared to today’s systems.
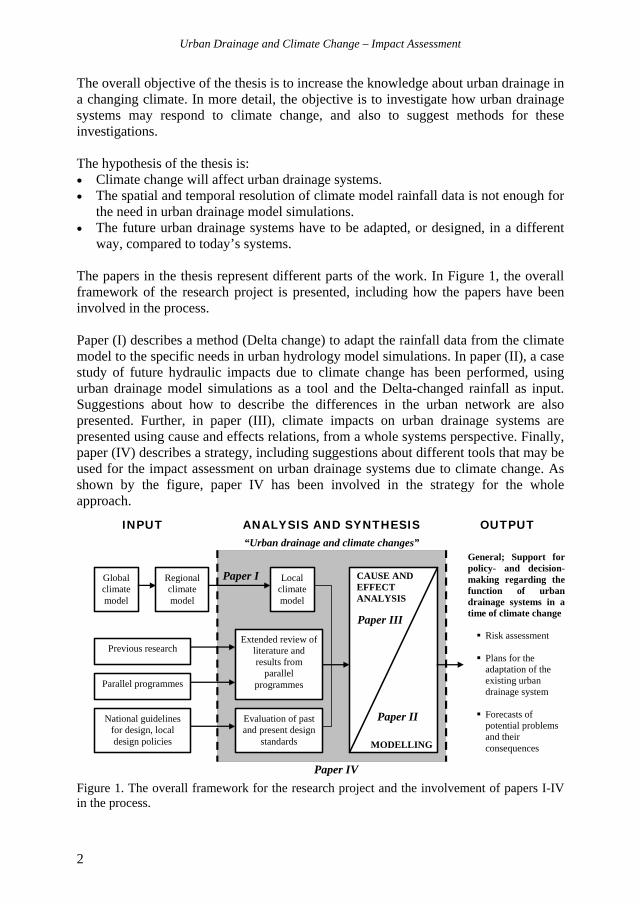
The papers in the thesis represent different parts of the work. In Figure 1, the overall framework of the research project is presented, including how the papers have been involved in the process.
Paper (I) describes a method (Delta change) to adapt the rainfall data from the climate model to the specific needs in urban hydrology model simulations. In paper (II), a case study of future hydraulic impacts due to climate change has been performed, using urban drainage model simulations as a tool and the Delta-changed rainfall as input. Suggestions about how to describe the differences in the urban network are also presented. Further, in paper (III), climate impacts on urban drainage systems are presented using cause and effects relations, from a whole systems perspective. Finally, paper (IV) describes a strategy, including suggestions about different tools that may be used for the impact assessment on urban drainage systems due to climate change. As shown by the figure, paper IV has been involved in the strategy for the whole approach.
Global climate model
Regional climate model
Local climate model
Previous research Extended review of
literature and results from
parallel programmes
CAUSE AND EFFECT ANALYSIS
MODELLING
INPUT
Paper I
ANALYSIS AND SYNTHESIS OUTPUT
General; Support for policy- and decision-making regarding the function of urban drainage systems in a time of climate change
Risk assessment
Plans for the adaptation of the existing urban drainage system
Forecasts of potential problems and their consequences
“Urban drainage and climate changes”
Parallel programmes
National guidelines for design, local design policies
Evaluation of past and present design
standards
Paper III
Paper II
Paper IV Figure 1. The overall framework for the research project and the involvement of papers I-IV in the process.

Urban Drainage and Climate Change – Impact Assessment
3
DelimitationsThe main focus concerning urban drainage in the thesis is storm water; however, the combined system of both storm water and wastewater will also be taken into account.
For the model simulation, the focus has primarily been to gain knowledge of how precipitation might affect existing urban drainage systems. Other future changes in the system, and in the city, and other climate factors such as temperature, have not been taken into account.
The focus has also been on urban areas; therefore, the influence of water from the areas surrounding a city, the larger catchments, has not been considered in the thesis.
As the focus of the thesis has been urban drainage systems and not climate modeling, the collaboration with the Swedish Meterological and Hydrological Institute (SMHI) has been important as it has contributed to the meteorological, hydrological, and climate model knowledge in the research project.

Urban Drainage and Climate Change – Impact Assessment
4
Urban Drainage and Climate Change – Impact Assessment
5
2 Background
2.1 Urban drainage Technologies for handling urban drainage have been developed over a long period of time, though design criteria have been relatively constant throughout the major urbanization era. Since the fifties, urban drainage recommendations have been to separate storm water (rain and snow melting) from wastewater (from households etc.) in the sewer systems (Bäckman, 1985). As several cities are older than this, many urban sewer systems are often partly combined, especially in city centres where it is also more expensive to rebuild and replace pipes. In Sweden, approximately 15% of the sewer network is combined (based on pipe length), the rest separated (Mikkelsen etal., 2001). For many European countries, the major part of the system is combined, for example in the UK, Germany and France (Butler and Davies, 2004).
In this thesis, urban drainage focuses on storm water, thus both the separated storm water system and the combined system with storm water and wastewater are included. The other parts of the urban water system are included briefly, as the different parts of the system are connected to each other. The urban drainage system is closely connected to the environment, but also the public, for example concerning wastewater from households, and the behaviour of people regarding car washing on streets etc. Rainfall may affect the public during flood situations, both for surface and basement flooding.
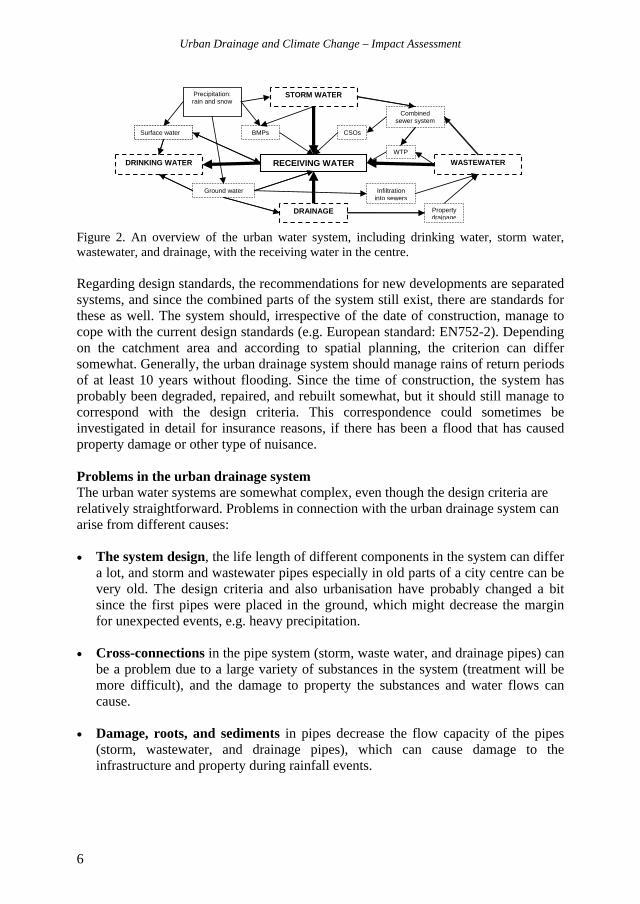
The urban drainage system has been illustrated in different publications, e.g. by Butler and Davies (2004). A similar way to present these relations is showed in Figure 2, where the system is described in relation to the whole urban water system and the receiving waters as well. The connection between the drinking water supply and the receiving waters is also shown, as this is the case for many cities (e.g. Stockholm). In some cases, this type of connection is not visible for the same municipality, because municipalities upstream are involved.
Figure 2 describes the system as an overview, with the receiving waters in the centre. For storm water, in a separated system, the water goes straight to the receiving water or (optimally) passes through some treatment facilities, often called best management practices (BMPs), e.g. ponds, swales, biological filters, or infiltration. For combined systems, the water passes through a wastewater treatment plant (WTP).
Drainage from properties, roofs, and roads, for example, is often directed to the nearest watercourse (receiving water) or it will be connected to the same system as wastewater and/or storm water. Infiltration of ground water or soil water into sewers (wastewater, storm water and drainage) might be a problem in some systems, due to the capacity decrease. If the combined system becomes overloaded, there will be some overflow from the system (CSO). Then, untreated water will be transported directly to the receiving water.
Urban Drainage and Climate Change – Impact Assessment
6
Figure 2. An overview of the urban water system, including drinking water, storm water, wastewater, and drainage, with the receiving water in the centre.
Regarding design standards, the recommendations for new developments are separated systems, and since the combined parts of the system still exist, there are standards for these as well. The system should, irrespective of the date of construction, manage to cope with the current design standards (e.g. European standard: EN752-2). Depending on the catchment area and according to spatial planning, the criterion can differ somewhat. Generally, the urban drainage system should manage rains of return periods of at least 10 years without flooding. Since the time of construction, the system has probably been degraded, repaired, and rebuilt somewhat, but it should still manage to correspond with the design criteria. This correspondence could sometimes be investigated in detail for insurance reasons, if there has been a flood that has caused property damage or other type of nuisance.
Problems in the urban drainage system The urban water systems are somewhat complex, even though the design criteria are relatively straightforward. Problems in connection with the urban drainage system can arise from different causes:
The system design, the life length of different components in the system can differ a lot, and storm and wastewater pipes especially in old parts of a city centre can be very old. The design criteria and also urbanisation have probably changed a bit since the first pipes were placed in the ground, which might decrease the margin for unexpected events, e.g. heavy precipitation.
Cross-connections in the pipe system (storm, waste water, and drainage pipes) can be a problem due to a large variety of substances in the system (treatment will be more difficult), and the damage to property the substances and water flows can cause.
Damage, roots, and sediments in pipes decrease the flow capacity of the pipes (storm, wastewater, and drainage pipes), which can cause damage to the infrastructure and property during rainfall events.
DRINKING WATER
DRAINAGE
STORM WATER
WASTEWATER
Surface water
Ground water
Combined sewer system
CSOs
WTP
Property drainage
RECEIVING WATER
BMPs
Precipitation: rain and snow
Infiltration into sewers
Urban Drainage and Climate Change – Impact Assessment
7
Infiltration into sewers via cracks and interstices, for example, decreases the flow capacity of the system, both combined and separated, as the base flow increases. Infiltration can also affect the treatment processes.
Exfiltration of water leaking out from the pipes into the surrounding soil, which can be caused from high pressures in the pipe system, due to e.g. heavy rainfall events and flooding. This may cause erosion of soil materials, and undermining of roads.
Pollutants and nutrients, whose origin can be urban activities, industries, and farming, can cause problems in treatment processes and in the receiving waters, which also might affect the drinking water sources.
These problems can be summarised as technical and environmental, and can also be intensified due to climate change, e.g. with more intense rainfall events.

Urban Drainage and Climate Change – Impact Assessment
8
2.2 Climate, Weather, and IPCC Weather and climate have always been in our interest for various reasons, and at some level we are all dependent on the weather for our well-being. Farmers, for example, are always concerned that the weather should be somewhat similar to what it has been previous years and that it does not vary that much, so that they can cultivate the earth and grow crops.
When discussing climate change, keeping in mind the difference between climate and weather is important. The weather is a description of temperature and other properties of the atmosphere, at a given point in time and place, and can vary by the hour or even by the minute, while climate can be seen as a summary of the usual weather for a particular area (from Bernes, 2003). So, for the urban drainage system, the direct impacts are often due to the weather, not to long-term changes in the climate. But, since the weather is related to the climate, and the thesis aims to determine the impacts of a changed climate, ‘climate’ will be used instead of ‘weather,’ for the most part.
Over the past few years, the climate issue has been more and more in focus. Debates, campaigns, political meetings/negotiations, newspaper articles, and research papers and findings have all intended to bring focus to the issue. Our society, particularly the cities of the world, is often very sensitive to changes in the climate due to the entire technical infrastructure, e.g. roads, electricity distribution, drinking water supplies, and urban drainage systems.
Since 1988, the UN’s Intergovernmental Panel on Climate Change (IPCC) has worked to assess changes in the climate and gather the latest findings of researchers from all over the world in order to put together assessments of observed and expected changes in the climate. The first assessment report was published in 1990, and the latest during this year (2007), which is also the fourth of the assessment reports (IPCC, 2007). Although there are some disagreements among researchers, the conclusion of the panel is that there is strong evidence about the human influence on global warming.
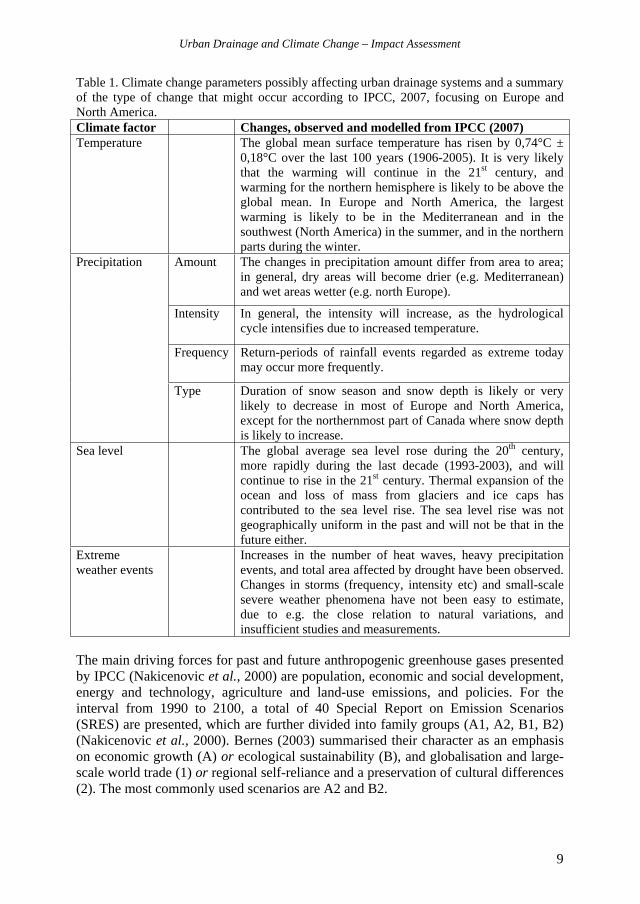
However, the last twelve years (1992-2005) contained eleven of the warmest years since 1850, and the global mean temperature actually increased by 0,7 °C (±0,2°) during that time (IPCC, 2007). The temperature increase has also had an impact on the hydrological cycle, as it intensifies with, for example, more intense rainfall events occurring. And the IPCC (2007) considers it very likely that the warming will continue in the 21st century, which will have an impact on, for example, precipitation patterns, snow cover, sea levels, and extreme weather events. A summary of the findings from IPCC regarding these parameters is listed in Table 1, both for observed changes and the expected changes for the future, with a focus on the northern hemisphere.
Urban Drainage and Climate Change – Impact Assessment
9
Table 1. Climate change parameters possibly affecting urban drainage systems and a summary of the type of change that might occur according to IPCC, 2007, focusing on Europe and North America. Climate factor Changes, observed and modelled from IPCC (2007) Temperature The global mean surface temperature has risen by 0,74°C ±
0,18°C over the last 100 years (1906-2005). It is very likely that the warming will continue in the 21st century, and warming for the northern hemisphere is likely to be above the global mean. In Europe and North America, the largest warming is likely to be in the Mediterranean and in the southwest (North America) in the summer, and in the northern parts during the winter.
Amount The changes in precipitation amount differ from area to area; in general, dry areas will become drier (e.g. Mediterranean) and wet areas wetter (e.g. north Europe).
Intensity In general, the intensity will increase, as the hydrological cycle intensifies due to increased temperature.
Frequency Return-periods of rainfall events regarded as extreme today may occur more frequently.
Precipitation
Type Duration of snow season and snow depth is likely or very likely to decrease in most of Europe and North America, except for the northernmost part of Canada where snow depth is likely to increase.
Sea level The global average sea level rose during the 20th century, more rapidly during the last decade (1993-2003), and will continue to rise in the 21st century. Thermal expansion of the ocean and loss of mass from glaciers and ice caps has contributed to the sea level rise. The sea level rise was not geographically uniform in the past and will not be that in the future either.
Extreme weather events
Increases in the number of heat waves, heavy precipitation events, and total area affected by drought have been observed. Changes in storms (frequency, intensity etc) and small-scale severe weather phenomena have not been easy to estimate, due to e.g. the close relation to natural variations, and insufficient studies and measurements.
The main driving forces for past and future anthropogenic greenhouse gases presented by IPCC (Nakicenovic et al., 2000) are population, economic and social development, energy and technology, agriculture and land-use emissions, and policies. For the interval from 1990 to 2100, a total of 40 Special Report on Emission Scenarios (SRES) are presented, which are further divided into family groups (A1, A2, B1, B2) (Nakicenovic et al., 2000). Bernes (2003) summarised their character as an emphasis on economic growth (A) or ecological sustainability (B), and globalisation and large-scale world trade (1) or regional self-reliance and a preservation of cultural differences (2). The most commonly used scenarios are A2 and B2.
Urban Drainage and Climate Change – Impact Assessment
10
Climate models have been developed and used both to gain physical insight into major features of the behaviour of the climate system, and to produce climate projections for a range of assumptions about emissions of carbon dioxide and other greenhouse gases. The global climate models can consist of three dimensions: atmosphere, land surface, and ocean, and the general circulation model (GCM) describes the function within the systems. Local climate change is influenced greatly by local features such as mountains, which are not well represented in global models because of their coarse resolution. To overcome this, regional climate models (RCM), with a higher resolution (typically 50 km) are constructed for limited areas and sometimes run for shorter periods (Hadley Centre, 2006).
One example of a regional climate model for Europe is RCA3 (Rossby Centre Atmospheric Model Version 3), by Rossby Centre at Swedish Meteorological, a Hydrological Institute (Kjellström et al., 2006). RCA3 is run for the time period 1961-2100, and the GCM input is ECHAM4/OPYC3 model of the Max-Planck-Institute for Meteorology (Roeckner et al., 1999), in combination with two emission scenarios, SRES A2 and B2 (Nakicenovic et al., 2000). The spatial resolution of RCA3 data is 50 50 km grid cells, and the temporal resolution is a 30-minute time step.
Urban Drainage and Climate Change – Impact Assessment
11
2.3 Urban drainage and climate change The issue of climate change and urban drainage has been emphasised in studies from different countries, and with a bit different approach.
For Sweden, the first located paper about climate change impacts on urban drainage was written by Niemczynowicz (1989) for the city of Lund, and shortly after this came a report on climate change and consequences for the cities of Göteborg, Halmstad and Kungsbacka by Johansson et al. (1991); this study was later, in a way, updated for Göteborg by Ahnoff and Kant (2002). Semadeni-Davies (2003; 2004) presented response surfaces as a tool to describe uncertainties and sensitivities of an urban drainage system, modelling inflow to WTP in the city of Lycksele. Semadeni-Davies et al. (2006) also describe the impacts on urban drainage systems because of climate and urbanisation changes for the city of Helsingborg, using the Delta change approach on climate model data for urban drainage simulations. Another, somewhat similar Delta change approach was suggested by Olsson et al. (2007/Paper I), and Olofsson etal. (2007/Paper II) continued that by describing hydraulic impacts on urban drainage systems with different parameters. Berggren et al. (2007/Paper III) describe impacts on urban drainage systems with cause and effect relations from a whole-systems perspective. Also, the Swedish government initiated an investigation about the vulnerability of society due to climate change (SOU, 2006), results to be presented later this year (2007).
In the UK, several projects and national studies have been performed concerning climate impacts and flooding: Foresight - Future Flooding, (Evans et al., 2003 a,b), and more directly for urban drainage, e.g. the project Audacious (e.g. Blanksby et al.,2004). Other climate and urban drainage risk studies (e.g. Ashley et al., 2005; Blanksby et al., 2005), and a Flood Risk Tool (Balmforth and Dibben, 2005) were developed in the UK. In the Netherlands van Luijtelaar et al. (2005) wrote about strategies for handling climate effects within the urban area, such as drainage and river flooding.
For Denmark, changes in extreme rainfall events coupled with consequences for a city and the urban drainage system were described by Arnbjerg-Nielsen (2005; 2006) and strategies regarding the handling of climate model precipitation were made by Grum etal. (2005). In Austria Rauch and De Toffol (2006) studied the trends of historical rainfall series. The results concerning heavy rainfall events differed from area to area, but no clear trend was found.
In Canada, a report by Watt et al. (2003) and a paper by Waters et al. (2003) describe climate change impacts on the infrastructure for urban storm water. Possible adaptation measures were also suggested and studied. Later, Denault et al. (2006) also assessed impacts due to climate change on urban storm water and also on the receiving waters.
Urban Drainage and Climate Change – Impact Assessment
12
2.3.1 The approach to climate model data for urban hydrology use In order to understand how the urban drainage system will be affected in the future by climate, water and wastewater engineers and researchers in the field have interpreted and handled the climate model results in different ways. Climate model data in its original form often provides spatial and temporal resolution too coarse for proper use in simulations of urban drainage systems, e.g. when the runoff pattern will be rapid because of impervious areas within cities. The climate models usually reproduce temperatures well, but they have greater difficulties reproducing extreme precipitation, especially intensities and patterns of heavy rainfall, according to the IPCC (2007).
The different ways to perform these operations, found in the literature, are described in this thesis as static, semi static and dynamic.
Static: e.g. topographical studies due to changed (increased) sea water level (Johansson et al., 1991; Ahnoff and Kant, 2002; SMHI, 2006: Göteborg study) and/or rainfall studies and model simulations due to changed (increased) design rainfall intensities, with a fixed percent (Niemczynowicz, 1989: 10, 20 and 30 % increase; Johansson et al., 1991: 5 and 20 % increase; Waters et al., 2003: 15% increase).
Semi static: e.g. studies and model simulations due to changed observed temperature and precipitation in a range and not for one fixed value only, e.g. by Semadeni-Davies (2004; 2003: precipitation varied between -10 to +40%, and temperature varied between -5 to +15%), which also used response surfaces as a tool to present the results. Another example is the Delta change method used by Semadeni-Davies et al.(2006) where present and future climate simulations from a climate model are compared in order to determine monthly changes, which are then applied to observed rainfall data. The Delta change method was further developed for this approach by Olsson et al. (2006; 2007/Paper I) with the focus on intensity. Another approach is performed by Denault et al. (2006), where historical rain series are analysed with linear regression and the detected trends used in order to build potential future rain scenarios in the form of IDF-curves from design rainfall were developed.
Dynamic: studies and simulations are performed with dissagregated climate model data. Onof (2002) compared two different products for disaggregation, StormPac and Cascade, which are developed by UKWIR, and found that the Cascade method was a better method for assessing impacts on urban drainage systems. The Cascade method, for example, is used by Ashley et al. (2005). Research in this field is also performed by SMHI for RCA3 model data, described by Olsson (2007).
The division of different techniques, or approaches, into static, semi-static, and dynamic can be compared to the division described by Kundzewicz and Somlyódy (1997) for hydrological studies: (comments from the author of this thesis, in italics)
(i) Study of a long-time series of hydrological observations (instrumental) and proxy records; search for patterns in these data. Not directly applicable for urban
Urban Drainage and Climate Change – Impact Assessment
13
hydrology, but could be applicable for studies of rainfall trends e.g. by Rauch and De Toffol (2006) and Hernebring (2006).
(ii) Sensitivity studies of hydrological models (what-if philosophy), i.e. assuming changes to climate variables and studying impacts of these changes on hydrological variables. Possible way for urban hydrology as well. (e.g. Niemczynowicz, 1989; Johansson et al., 1991; Ahnoff and Kant, 2002; Waters et al., 2003; Semadeni-Davies, 2003; 2004)
(iii)Treating an output from a GCM as an input to a hydrological model, decomposition of GCM results (few widely spaced nodal points) into individual catchments. Some sort of disaggregation possible for urban hydrology (e.g. Ashley et al., 2005; Grum et al., 2005; Semadeni-Davies et al., 2006; Olsson et al., 2006)
(iv) Examination of existing hydrological data; search for records similar to a scenario. Could be possible for urban hydrology, perhaps somewhat similar to the approach performed by Denault et al. (2006).
As shown by the literature, there are some problems in connection with the use of climatic data in order to get accurate and usable results for the urban drainage area. Often, computer simulations for the runoff and network are used, and these types of tools are often calibrated for a specific area and the calculations can be very detailed, thus high-resolution input data is also needed in order to gain good results.
2.3.2 Impact studies: Combined system Niemczynowicz (1989) is the earliest literature found concerning urban drainage impacts due to climate change. The case study is from Lund (in the south of Sweden), which has a total catchment area of 1769 ha, and about 30% of the area is impervious. Rainfall input for the simulation, from both IDF-relations and the Chicago design storm (CDS), increased by 10, 20, and 30%. The results showed an increase of combined sewer overflow (CSO), an increase of total inflow to the sewerage system, and also significant flooding problems for the sewerage network when rainfall intensity increases by 20 and 30%.
Semadeni-Davies et al. (2006) also showed similar results from their study of the old city centre in Helsingborg (also in the south of Sweden). The permeable areas contributing to sewer infiltration were 2914 ha, and impervious areas contributing to direct storm water inflow were 164 ha. The results showed an increase of WTP inflow, both from storm water runoff and sewer infiltration, increased volume of combined sewer and pumping station overflows, and also increased CSO volumes for the future. The rainfall input for the modelling was an observed rainfall series that was transformed according to the changes presented by RCA0 (Rossby Centre Atmosphere Model, SMHI) via the Delta change method (using storms and drizzle as dividing sectors). In the study, urban development was also included in the scenarios; a total of 4 storylines were used, of which one describes the current situation (Semadeni-Davies et al., 2006).

Urban Drainage and Climate Change – Impact Assessment
14
Ashley et al. (2005) suggested that potential effects of climate change on urban property flooding are likely to be significant in the future, according to a study performed in the UK. Four catchments, representing three different types of catchments, were studied regarding their potential impact due to climate change: flooding within the urban area (two catchment areas), coincident flooding involving local river systems (one area), and coincident flooding involving tidal effects (also one area). The sizes of the catchment areas ranged from 3934 ha (34 % impervious) to 727 ha (15% impervious). The damages were presented as the number of properties affected, and the estimated economical damage was also presented. Scenarios of future development were also used (the corresponding emission scenario in brackets): National enterprise (B2), World market (B1), Global sustainability (A2), and Local stewardship (A1F1) (Ashley et al., 2005).
2.3.3 Impact studies: Separate storm water system The study of Helsingborg also contained a part where storm water was separated, the Lussebäcken catchment. The catchment area was 2474 ha, of which 534 ha is urbanised (about 29 % impervious). The results showed that, in the future, the total flow volume would increase based on future climate and the three scenarios for urban development (one was the current situation) (Semadeni-Davies et al., 2006).
Denault et al. (2006) showed that climate change would not have a dramatic impact on the current drainage infrastructure in the Mission/Wagg Creek watershed (Canada). Still, according to the authors, the existing system of 440 ha (45 % impervious areas) was not entirely adequate to convey the 10-year event, which often is the design standard. The rainfall input was calculated from measured rainfall data (5min, 2h, 24h) using regression analysis to describe the trend of future rainfall (design storms). However, the impacts on the natural ecosystems of the creeks in the catchment (watershed) were suggested to be far more damaging than the impacts on the infrastructure (Denault et al., 2006).
Waters et al. (2003) suggested that the existing urban storm water infrastructure for the Malvern subdivision of Burlington (Canada) may not be capable of conveying the flows resulting from increased rainfall due to climate change, without some inconveniences or damages. The Malvern catchment is 15,4 ha with about 34 % of the area being impervious. An increase of the design storm intensity of 15% was used as rainfall input, which resulted in an increase in runoff volume and in peak discharge, and caused 24% of the pipes to surcharge. Waters et al. (2003) also discussed potential solutions to the increased volume of storm water runoff and larger peak flows, resulting from both an increase in the impervious surface areas in the city, and potential climate change impacts. The solutions discussed were the disconnection of full/half roof areas, an increase in surface storage per impervious hectare, and the reduction in the rate of storm water inputs to the sewer system. These solutions decreased peak discharge by between 13 - 39% (highest rate for the disconnection of the full roof areas).
Urban Drainage and Climate Change – Impact Assessment
15
2.3.4 Consequences for receiving waters Niemczynowicz (1989) showed potential environmental impacts due to an increased amount of pollutant released to receiving waters. The studied substances were suspended solids (SS), biological oxygen demand (BOD7), phosphorus, copper, zinc, and lead. The assumption was a 30% increase in rainfall would increase these substances in amounts from 32-71% (the highest increase for phosphorus) (Niemczynowicz, 1989). Semadeni-Davies et al. (2006) showed that the total load of nitrogen released to receiving waters via overflow would increase in the future. Denault et al. (2006) found that the environmental impacts of climate change and urbanisation (increase of the impervious areas in the city) indicate a great vulnerability for the natural ecosystems of the receiving waters.

Urban Drainage and Climate Change – Impact Assessment
16
Urban Drainage and Climate Change – Impact Assessment
17
3 Methods
The thesis has been carried out as a literature study together with impact assessment techniques, urban drainage model simulations (Mike Urban/MOUSE by DHI), and cause-effect relations, as well as discussions with representatives from different disciplines, e.g. water and wastewater engineers, and climate, meteorology, and hydrology experts. These have been performed in order to assess impacts on urban drainage systems due to climate change and to develop a useful strategy for doing so. Figure 1 (in the introduction) presents the overall research framework and also a description of how the four papers cover the issues.
The methods used are divided in four sections: (1) historic and future precipitation, (2) urban drainage model simulations, (3) cause-effect relations, and (4) strategy. For each paper included in the thesis, the main methods used are presented more in detail in the papers and the division of methods according to each paper are Paper I: (1), Paper II: (1, 2), Paper III: (3, 4) and Paper IV: (4)
3.1 Historic and future precipitation The rainfall measurement from the study area was tipping bucket data with 0.2 mm resolution, from 1991-2004, summarized in Hernebring (2006). SMHI (Swedish Meteorological and Hydrological Institute) provided precipitation data from the regional atmospheric climate model (RCA3, developed at the Rossby Centre, SMHI (Kjellström et al., 2005)), originating from the global circulation model ECHAM4 and future scenarios SRES A2 and B2 (defined by IPCC in Nakicenovic et al. (2000)).
Four different rainfall series represent the time periods: today’s climate (TC: 1971-2000), near future climate (FC1: 2011-2040), intermediate future climate (FC2: 2041-2070), and distant future climate (FC3: 2071-2100).
Due to the limited temporal and spatial resolution of climate model data (30 minutes and 50x50 km) and according to the urban hydrology needs, the Delta change method was used. Then, the measured rainfall intensity was changed in amplitude according to future changes in climate, and also according to season of the year. (Olsson et al.,2007/ Paper I).
3.2 Urban drainage simulations The study area was a small city in the south of Sweden, Lindsdal in Kalmar, which has a population of 3000 and a contributing catchment area of 54 ha, of which 20 ha is impervious. The urban drainage system has 410 nodes and is separated, thus it contains only storm water. The system is designed according to the current design standards (Svenskt Vatten, 2004), thus the system should manage rains of at least a 10-year return period without surface flooding.
The simulation model of the network was run with Mike Urban (DHI, 2005), and in order to decrease the data volume for the simulation time, 120 nodes were selected as representative for the system for result output.
Urban Drainage and Climate Change – Impact Assessment
18
The following parameters are chosen in order to describe the impacts. Maximum levels in nodes, used to describe differences between the time periods. Exceeded levels, used as a threshold level representing both the ground surface and a critical level, which is set at 0.5 m from the ground level. From this, the number of nodes affected and the frequency and duration of water exceeding the levels are presented.Pipe flow ratio, the ratio of flow rate (Q) and flow rate full (Qf) may be used as an indicator of the system’s capacity.
Statistical analysis of the results has been performed as a comparison within matched pairs of experimental material (nodes), where the maximum levels in the time periods (TC, FC1, FC2, and FC3) are compared in the same node, so as to define if there is a difference between time periods. The software used was MiniTab. Also comparisons of changes have been made according to time periods, e.g. number of flood events, duration of floods, as well as geographical distribution of effects in the system.
3.3 Cause-effect relations The impact assessment consists of three parts. First, climate factors that may affect the urban water system were identified; second, the relationship of the urban waters was illustrated (Figure 2). Then, the cause and effect relations resulting in impacts on and consequences for the system were presented. These three parts all contribute to the holistic approach of the problem.
The identification of climate parameters/factors (currently observed parameters by the IPCC, 2007) has been performed based on whether they have a direct or secondary impact on urban water systems, using questions leading to a selection of the parameters.
The relationship of different parts of the urban water system (Figure 2) is produced from a basic knowledge of the system, design standards of systems, and literature (e.g. Butler and Davies, 2004). The urban water system is presented, having the receiving water in the centre of the diagram, thus the diagram will show how the different parts of the urban water system are related.
Establishing the cause of the impacts - i.e. climate parameters and the impacts/consequences - followed the principle of cause-effect relationships (e.g. described by Christensen et al., 2003), except for the probability estimation for the events. Impacts on the urban water systems may lead to a consequence in the system or in the city and are closely related to the exceeding of threshold levels. The impact assessment has been performed as the climate parameters are added as a sort of input to the urban water system diagram, and the “point of contact” to urban water has been identified. According to whether the impact may be direct or secondary, smaller groups or study lines are presented. The urban drainage impacts are described as isolated events, or as a problem chain of events that may occur in the system and in the surrounding areas.

Urban Drainage and Climate Change – Impact Assessment
19
3.4 StrategyThe overall framework for the research project (Figure 1) has been further developed into a strategy (presented in figure 8, and in paper IV), so as to identify the relations, the necessary steps, the tools that may be used, and the results that can be obtained from the research approach. The approach is from a global, to a regional, to a local scale, and points out the need for transformation methods in order to be able to use the information as input to the suggested tools for assessment. The strategy is a result of literature studies and discussions with different parties concerned, such as climate, meteorology and hydrology experts and wastewater and water engineers.

Urban Drainage and Climate Change – Impact Assessment
20
Urban Drainage and Climate Change – Impact Assessment
21
4 Summary of the scientific papers
The results from the literature studies, the impact assessment, and the urban drainage model simulations are presented as three submitted papers for international scientific journals and one paper peer-reviewed for, and also presented at, an international scientific conference. The motivation and main results from each paper are summarized in this section, to place the papers both in relation to each other, and to the overall objectives of the thesis.
Paper I Applying climate model precipitation scenarios for urban hydrology assessment: a case study in Kalmar City, Sweden This paper describes how the Delta change method was used for the adaptation of climate model data (rainfall) for specific urban hydrology needs. The climate model data from the regional atmospheric climate model RCA3 (developed at the Rossby Centre, SMHI) were analysed especially for changes in intensity and according to season. These changes were then applied on the historical measured rainfall series for the study area (a tipping-bucket measurement), via multiplicative factors. The main motivation of this paper was to describe the method that was chosen to transfer the climate model output for use in an urban hydrology model.
Impact assessment on urban hydrological processes can be based on the precipitation output from climate models. To date, the model resolution in both time and space has been too low for proper assessment, but at least in time the resolution of available model output is approaching urban scales. In this paper, 30- min precipitation from a model grid box covering Kalmar City, Sweden, is compared with high-resolution (tipping-bucket) observations from a gauge in Kalmar. The RCA3 model is found to overestimate the frequency of low rainfall intensities and, therefore, the total volume, but reproduces the highest intensities reasonably well. Adapting climate model data to urban drainage applications can be done in several ways, but a popular way is using the Delta change method. In this method, relative changes in rainfall characteristics estimated from climate model output are transferred to an observed rainfall time series, generally by multiplicative factors. In this paper, a version of the method is proposed in which these Delta change factors are related to the rainfall intensity level, and divided into seasons of the year.
Applying this method in Kalmar indicated that, in summer and autumn, high intensities will increase by 20-60% until year 2100, whereas low intensities remain stable or decrease (Figure 3). In winter and spring, generally all intensity levels increase similarly. The results were transferred to the observed time series by varying the volume of the tipping bucket to reflect the estimated intensity changes on a 30-min time scale.
Four time periods have been used (for both paper I and paper II): today’s climate (TC), near future climate (FC1: 2011-2040), intermediate future climate (FC2: 2041-2070), and distant future climate (FC3: 2071-2100).

Urban Drainage and Climate Change – Impact Assessment
22
Figure 3. Percentiles of the summer precipitation distribution in the RCA3 output for climate perspectives TC (today’s climate) and FC3 (distant future climate), representing the summer season (JJA) and emission scenario A2.
The Delta change method is advantageous because it is relatively simple and because the time resolution for the measured rainfall is preserved. There is one drawback with the method: extremely high observed rainfall intensities may be increased to levels of questionable realism. One way to take this into account is, for example, by taking away the most extreme rainfalls. Examples of different rainfall events and their responses to the Delta change are presented in Table 2: low-intensity rainfall event (920821), short duration medium-to-high intensity (940818), and extreme rainfall events (970727 and 030729). The intensity changes are pronounced for high intense rainfall events.
Table 2. Properties of selected rainfall events as observed (OBS) and after DC-transformation, for the different climate perspectives (FC1, FC2, FC3), and emission scenario A2. Variables: duration (Dur: hours), maximum 5-min intensity (Max: mm/5 min) and total volume (Vol: mm). Max Vol Date Dur OBS FC1 FC2 FC3 OBS FC1 FC2 FC3 920821 23.3 0.6 0.57 0.59 0.46 25.2 21.9 21.6 16.8 940818 14.6 3.0 3.3 3.4 3.6 54.8 54.9 56.8 50.8 970727 2.3 8.8 9.6 10.1 10.5 15.4 16.8 17.5 18.1 030729 7.0 12.0 13.1 13.7 14.3 93.0 99.4 104 104
The hydraulic impacts in the system were observed, as the urban drainage simulations with the original rainfall series (TC) and the Delta-changed rainfall series (FC3 - for the year 2100) were run. The model used was a Mike Urban/Mouse model set up for a residential area in Kalmar (54 ha, of which 37% was impervious, separated storm water system, 410 nodes).
The results showed that the maximum water levels in nodes, using paired comparison between nodes at 95% confidence interval, were higher for FC3 compared to TC for all rainfall events, except for the low intense rainfall event at 920821. For the rainfall event at 940818, the maximum water levels in nodes were 2- 3 cm higher at FC3. These two first events will probably not cause flooding, if the rainfall events are the only thing affecting the system. The more intense rainfall events (970727 and 030729) gave a more pronounced response; the maximum water levels in nodes for FC3 were 14-18 cm and 16-20 cm, respectively. This may cause problems in the system.
Urban Drainage and Climate Change – Impact Assessment
23
Paper II Hydraulic impact on urban drainage systems due to climate change In this paper, the hydraulic impact due to climate change was further investigated, using the Delta change method that was previously described (Paper I). Urban drainage model simulations with Mike Urban/Mouse were used, and suggestions about different parameters in order to investigate the climate response on the urban drainage system were also made. The motivation for this paper was to learn more about hydraulic responses on urban drainage systems due to climate change. The parameters used gave both a fast response and indications about the system’s capacity in a simple manner.
Hydrological changes, particularly heavier precipitation due to an increasing global mean temperature, will very likely occur in the 21st century. These changes will have a great impact on urban drainage systems whose capacities are closely related to rainfall events. The objective of this paper is to investigate the hydraulic impacts on an urban drainage network due to climate change. The paper is divided into two steps: (1) investigating model simulations’ output from different rainfall series by comparing temporal and spatial resolutions and (2) comparing urban drainage impacts from today and in the future. The focus was on separate storm water systems, with a city in the south of Sweden being used as a reference study. The urban drainage model was a catchment of 54 ha (37 % impervious) and 410 nodes, of which 120 were chosen to represent the system.
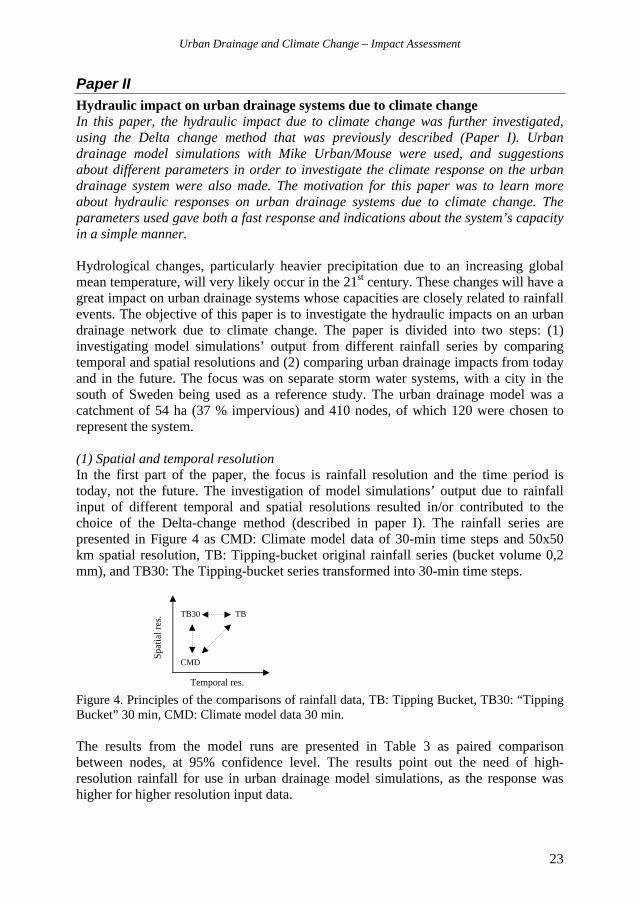
(1) Spatial and temporal resolution In the first part of the paper, the focus is rainfall resolution and the time period is today, not the future. The investigation of model simulations’ output due to rainfall input of different temporal and spatial resolutions resulted in/or contributed to the choice of the Delta-change method (described in paper I). The rainfall series are presented in Figure 4 as CMD: Climate model data of 30-min time steps and 50x50 km spatial resolution, TB: Tipping-bucket original rainfall series (bucket volume 0,2 mm), and TB30: The Tipping-bucket series transformed into 30-min time steps.
Figure 4. Principles of the comparisons of rainfall data, TB: Tipping Bucket, TB30: “Tipping Bucket” 30 min, CMD: Climate model data 30 min.
The results from the model runs are presented in Table 3 as paired comparison between nodes, at 95% confidence level. The results point out the need of high-resolution rainfall for use in urban drainage model simulations, as the response was higher for higher resolution input data.
Temporal res.
Spat
ial r
es.
CMD
TB30 TB

Urban Drainage and Climate Change – Impact Assessment
24
Table 3. The results of comparisons of maximum water levels in nodes, from urban drainage modelling with the rainfall series described in Figure X as input. The results are presented as a paired comparison between nodes, at a confidence level of 95%.Comparison: Temporal Spatial Both Series TB-TB30 TB30-CMD TB-CMD Max level in Nodes: 25-42 cm 17-35 cm 35-44 cm
(2) Hydraulic impacts on urban drainage system In the second part of the paper, where future climate impacts are studied, four time periods have been used: today’s climate (TC), near future climate (FC1: 2011-2040), intermediate future climate (FC2: 2041-2070), and distant future climate (FC3: 2071-2100).
The following parameters are chosen to describe the impacts: Maximum levels in nodes, to describe differences between the time periods. Exceeded levels, as a threshold level representing both the ground surface and a critical level, which is set at 0.5 m from the ground level. From these levels,
o the Number of nodes affected, o the Frequency, and o the Duration of water exceeding the levels can be presented.
Pipe flow ratio, the ratio of flow rate (Q), and flow rate full (Qf) may be used as indicators of the system’s capacity.
The maximum water levels in the nodes were significantly higher for future time periods compared to today’s, for both climate scenarios A2 and B2. The number of flooded nodes (water exceeding ground level) in today’s climate increases a bit for future time periods (FC1, FC2, FC3), and for both scenarios A2 and B2. The number of nodes where water is exceeding the critical level in the system (0.5 m below ground level) is naturally higher at all time periods and increases also from today’s climate to future time periods. Table 4 shows the number of nodes at each level and scenario.
Table 4. Number of nodes exceeding ground/critical level in the system, comparing the differences between time periods TC, FC1, FC2, FC3. TC FC1 FC2 FC3 A2 Ground level exceedings 7 9 11 16 Critical level exceedings 58 65 69 81 B2 Ground level exceedings 7 11 12 16 Critical level exceedings 58 66 70 83
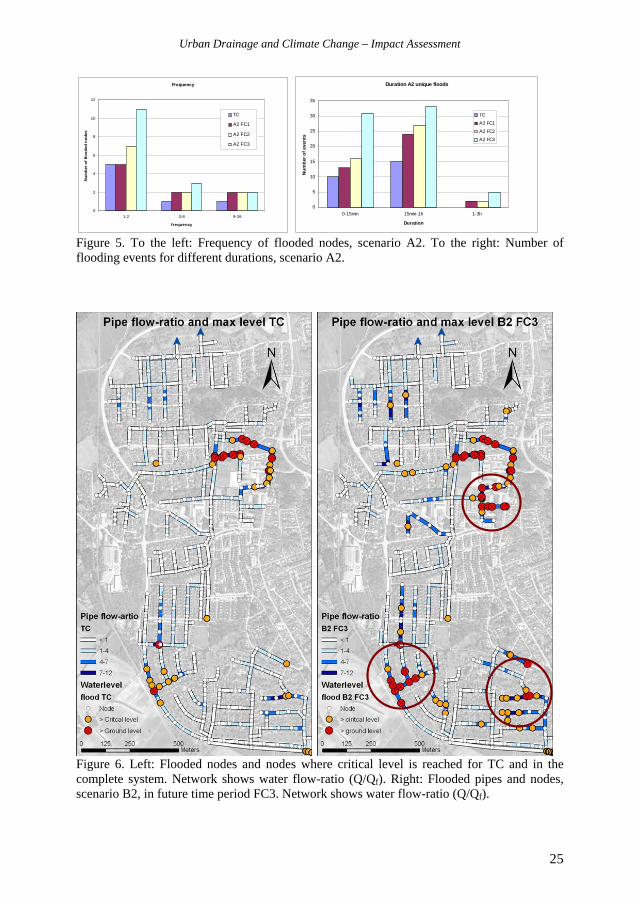
The future rainfall events will increase both the frequency of floods and also the duration of the floods (Figure 5). These results indicate that there might be more damage in the city due to floods in the future. The geographical distribution of floods in the system changes also (Figure 6), and the flooded areas are more spread out in the future (FC3). Maximum storm water flow ratio (Q/Qf) in the network has also increased considerably between the two time periods compared in the Figure 6. Values for A2 FC3 are similar.
Urban Drainage and Climate Change – Impact Assessment
25
Frequency
0
2
4
6
8
10
12
1-2 3-8 9-26
frequency
Num
ber o
f flo
oded
nod
es
TC
A2 FC1
A2 FC2
A2 FC3
Duration A2 unique floods
0
5
10
15
20
25
30
35
0-15min 15min-1h 1-3h
Duration
Num
ber o
f eve
nts
TC
A2 FC1
A2 FC2
A2 FC3
Figure 5. To the left: Frequency of flooded nodes, scenario A2. To the right: Number of flooding events for different durations, scenario A2.
Figure 6. Left: Flooded nodes and nodes where critical level is reached for TC and in the complete system. Network shows water flow-ratio (Q/Qf). Right: Flooded pipes and nodes, scenario B2, in future time period FC3. Network shows water flow-ratio (Q/Qf).

Urban Drainage and Climate Change – Impact Assessment
26
There is an evident need to handle future situations in urban drainage systems and have a well- planned strategy in order to cope with future conditions. For future considerations, including renewal plans, dividing the system into security levels/classes, where the critical level below ground will give earlier indications of capacity failure, might be preferable.
The rate of renewing may, however, serve as a buffer, lessening the consequences if future demands are gradually adapted as well Still, there is a need to investigate the future demands, which may include future urbanization, in order to make the right decisions.
The parameters describing flooding are a good indicator of urban drainage problems due to climate change, as they can point out areas where the capacity of the system is exceeded, both in pipes and in nodes (e.g. ground level or a predefined critical level below ground). Apart from describing the dynamics of a sewer system, the hydraulic parameters might also serve as input for economical calculations that describe potential losses for both network owners and property owners in a more detailed way. If the critical level (below ground level) is used as a parameter, the security level of the system can be estimated.
Urban Drainage and Climate Change – Impact Assessment
27
Paper III Impacts on Urban Water Systems due to Climate Change From a more holistic point of view, this paper suggests an approach of impact assessment on urban drainage systems taking the whole system into account. The main focus is urban drainage, but the whole urban water system has been included to give the impact assessment a wider view/approach. The factors considered are technical and environmental, but can also be extended for other factors. The main motive for this paper has been to bring focus to cause-and-effect relations, in the urban drainage system due to climate change. From this view, a method of doing so has been suggested.
The paper describes a framework and a whole systems approach in order to grasp the climate impacts on urban drainage systems. The overall objective of this paper is to increase the knowledge about how urban water systems may respond to future climate change. The study is divided in three parts, each one contributing to the impact assessment: (1) climate parameters, (2) urban water system relationships, and (3) a description of impacts and consequences for the system. The results may be used as a knowledge base for further investigations and risk assessments for local applications.
Part 1: Climate parameters Parameters of climate that most likely have an impact on urban water systems have been identified based on whether they have a direct or secondary impact on urban water systems. Climate parameters affecting urban water systems directly are: Temperature, Precipitation and Sea level changes, and secondary: Temperature, Evapotranspiration and Soil moisture.
Part 2: Urban water system The urban water system is presented as a relationship diagram, having the receiving water in the centre of the diagram, thus the diagram will show how the different parts of the urban water system are related. This illustration (Figure 1, chapter 2.1) will allow a more holistic view of the urban water system, facilitating the impact assessment.
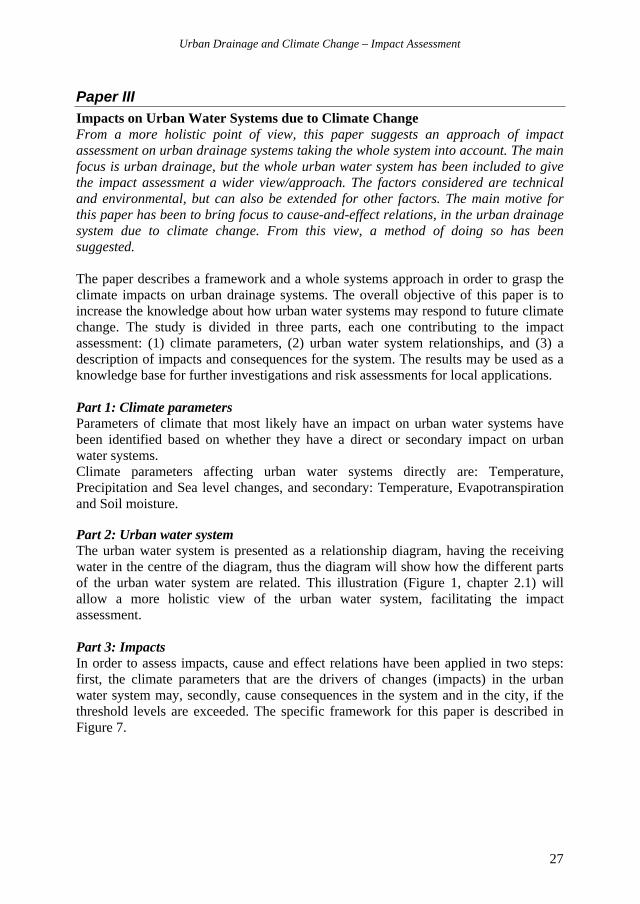
Part 3: Impacts In order to assess impacts, cause and effect relations have been applied in two steps: first, the climate parameters that are the drivers of changes (impacts) in the urban water system may, secondly, cause consequences in the system and in the city, if the threshold levels are exceeded. The specific framework for this paper is described in Figure 7.
Urban Drainage and Climate Change – Impact Assessment
28
Figure 7. The framework used to investigate climate change impacts on urban water systems and to determine whether these will cause consequences or not.
If the threshold value/level is exceeded, (yes) a consequence is inevitable; if not, (no)the consequence is not occurring (Figure 7). The general threshold levels set up for this paper are:
Water levels in the system (e.g. ground level, basement) Flow capacity of the system Infiltration capacity Treatment, particularly the demand of chemicals and energy for the processes Quality standards for storm water and wastewater let out to receiving waters, quality standards for drinking water to consumers, and also quality of the receiving water.Quantity, related to the demand for drinking water by a city compared to the available resources.Recommended distance in from a watercourse, both area and height.
The technical and environmental consequences can be: Technical: Damage to pipes, facilities, pump stations, infrastructure, land (erosion and landslides), and property, for example, that affects the system, the city, and its inhabitants. Environmental: Spread of pollutants, nutrients, and hazardous substances in the water, soil, and/or air that affect the ecosystems and species.
In order to assess impacts due to the climate parameters (precipitation, sea level and temperature), the ‘points of contact’ to the urban water system are identified. For the precipitation, the contact is easily described, as it is the driver/or source for the urban water system. The sea level’s points of contact with the urban water system are mainly outlets from storm water, wastewater, and drainage as well as drainage related to ground water, storm water infiltration, and wastewater infiltration. And for the temperature, there is no clear point of contact, but it can be related to the quality of drinking water and receiving water and to the treatment processes (WTP and BMP).
PrecipitationThe precipitation will have an impact on urban water systems, directly on storm water (separated and combined system) and drinking water, and secondarily on wastewater and drainage. Increased intensity and amount of precipitation may, for example, cause
Climate factor
Urban water impact
Exceededthreshold level?
Consequenceyes
no
Urban Drainage and Climate Change – Impact Assessment
29
increased flow volumes in the system and will also likely introduce hazardous substances into the receiving waters, which might have an impact on the drinking water resources. On the other hand, decreased amounts of precipitation may, for example, cause high pollutant loads in storm water during rainfall, due to urban build up and also cause severe problems connected to drinking water. The type of precipitation is also important, especially if there is an increase in the amount of rain-on-snow events, which often have high pollutant loads.
Sea level The rise of the sea level will cause problems such as the increasing need for facilities to protect the city (e.g. dikes), and saltwater intrusions affecting the quality of drinking water and thus the amount of available sources of drinking water. There might also be problems at the outlets of the system (storm water and waste water) if the sea level rises above these.
Temperature Impacts due to increased temperature, for example, are an increase in the biological activities, which might be advantageous for storm water and wastewater treatment, but could be disadvantageous for the drinking water. An increased temperature might also decrease the amount of available drinking water resources, affect the quality of the available water, and cause faster degradation of water quality in the distribution network.
It is possible to consider the impacts on urban water systems, due to climate change, with the whole system in mind, especially if the system alternates between the whole and parts of the system, for example, by identifying direct impact study lines from precipitation to the receiving water. The knowledge gained from this study can be used as a base document before starting a risk- assessment investigation on a specific site/city. In those kinds of studies, it is possible to take into account site-specific parameters and the existing urban water system.
Urban Drainage and Climate Change – Impact Assessment
30
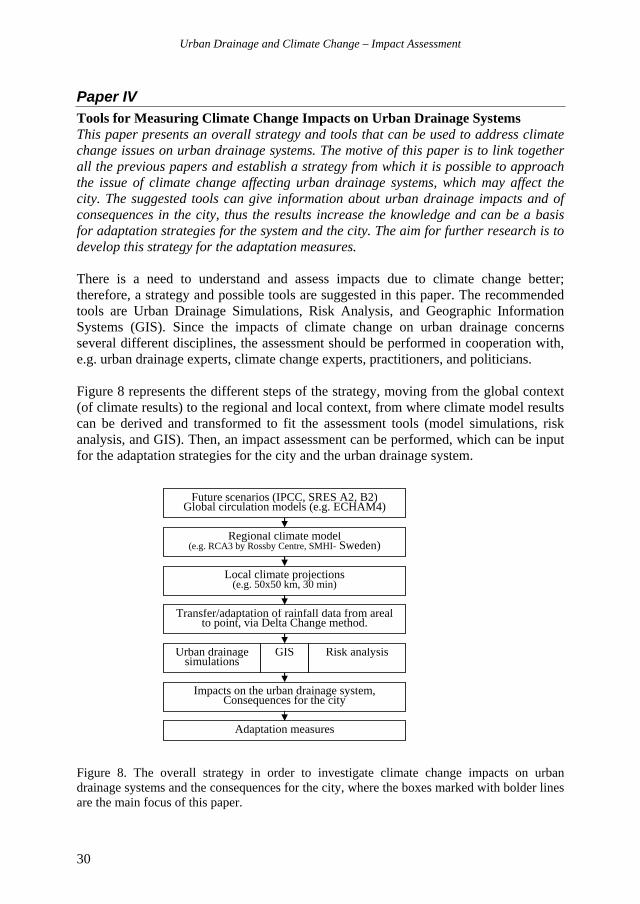
Paper IV Tools for Measuring Climate Change Impacts on Urban Drainage Systems This paper presents an overall strategy and tools that can be used to address climate change issues on urban drainage systems. The motive of this paper is to link together all the previous papers and establish a strategy from which it is possible to approach the issue of climate change affecting urban drainage systems, which may affect the city. The suggested tools can give information about urban drainage impacts and of consequences in the city, thus the results increase the knowledge and can be a basis for adaptation strategies for the system and the city. The aim for further research is to develop this strategy for the adaptation measures.
There is a need to understand and assess impacts due to climate change better; therefore, a strategy and possible tools are suggested in this paper. The recommended tools are Urban Drainage Simulations, Risk Analysis, and Geographic Information Systems (GIS). Since the impacts of climate change on urban drainage concerns several different disciplines, the assessment should be performed in cooperation with, e.g. urban drainage experts, climate change experts, practitioners, and politicians.
Figure 8 represents the different steps of the strategy, moving from the global context (of climate results) to the regional and local context, from where climate model results can be derived and transformed to fit the assessment tools (model simulations, risk analysis, and GIS). Then, an impact assessment can be performed, which can be input for the adaptation strategies for the city and the urban drainage system.
Figure 8. The overall strategy in order to investigate climate change impacts on urban drainage systems and the consequences for the city, where the boxes marked with bolder lines are the main focus of this paper.
Future scenarios (IPCC, SRES A2, B2)Global circulation models (e.g. ECHAM4)
Regional climate model(e.g. RCA3 by Rossby Centre, SMHI- Sweden)
Local climate projections(e.g. 50x50 km, 30 min)
Transfer/adaptation of rainfall data from arealto point, via Delta Change method.
Urban drainagesimulations
Impacts on the urban drainage system,Consequences for the city
GIS Risk analysis
Adaptation measures

Urban Drainage and Climate Change – Impact Assessment
31
The urban drainage model simulations are presented more in detail in paper II (and also few GIS analyses), and parts of the risk analysis are presented in paper III and here as an example of impacts in the urban drainage system due to high intensity rainfall events (Table 5). More details about the strategy are presented in the paper IV, by Berggren et al. (2007)
The impacts due to climate change will undoubtedly have consequences for the city as a whole. When a municipality gains knowledge of weak and sensitive areas in the system and the city this way, it may be easier to choose and prioritize between adaptation strategies.
Table 5. Examples of impacts in urban drainage systems during high intensity rainfall events. Combinedsystem
If the sewer system has too low a capacity, the water level in the system can cause basements to be flooded Increased amount of combined sewer overflow (CSO) can cause environmental problems concerning the receiving waters and also jeopardize the drinking water sources If the ground water level rises because of a higher amount of precipitation, more ground water will infiltrate into the pipes, and thus decrease the capacity of the system
WTP(combined system)
At a wastewater treatment plant, during times of high flows, dosagesof chemicals for the processes can become unnecessarily high Increased amount of urban polluted runoff can reach the treatment plant, which will cause more pollutants, e.g. heavy metals, in the sludge.
Pump stations Pump stations can easily become flooded as they often are located in low-lying areas. There is then a risk of getting pipe surcharge in the system if water is damming up backwards in the system Increased amount of pump station sewer overflow can cause environmental problems concerning the receiving waters and also jeopardize the drinking water sources
Separate system(only storm water)
If the system has too low a capacity, the water level in the system can cause surfaces in a city to be flooded If the ground water level rises because of a higher amount of precipitation, more ground water will infiltrate into the pipes, and thus decrease the capacity of the system Heavy precipitation over urban areas can cause a rapid runoff and wash of urban surfaces and thus higher concentrations of pollutants, e.g. heavy metals, will go to BMPs or receiving waters
Infiltration basin The infiltration capacity may decrease if the ground water level rises, and cause, for example, surface flooding
Storm water pond
At storm water ponds, the amount of sediment losses during heavy rain may increase if the pond is insufficiently dimensioned, and there are no by-pass facilities. Thus polluted sediments may reach the receiving waters.

Urban Drainage and Climate Change – Impact Assessment
32

Urban Drainage and Climate Change – Impact Assessment
33
5 Discussion
The discussion is divided into: strategy, rainfall and climate data, impact assessment of urban drainage systems (model simulations and cause and effect studies), impacts and adaptation.
5.1 StrategyThe strategy of the climate change approach for urban drainage impact assessment has been presented previously (Figure 8). In Figure 9 the strategy has been somewhat modified to point out that it also could be used for other changes, besides the climate.
For the climate approach, the papers involved (I-IV) are shown in the figure (9). The strategy could be improved by, for example, examining historical records of climate impacts and the way engineers and stakeholders have handled climate effects previously and by utilizing experience with adaptation measures.
Figure 9. The overall strategy for impact assessment on urban drainage systems and how the papers with climate approach have been involved in the process.
5.2 Rainfall and climate data The choice of Delta change as a method is somewhat similar to the approach chosen by Semadeni-Davies et al. (2006) in the Helsingborg study. The reason for this choice was mostly the relatively simple approach to the rainfall data in the climate model and the preserving of time resolution when applying changes in a tipping-bucket series.
Paper I
Global context, Future scenarios
Regional context, country specific
Local context, municipality level
Adaptation methods of information and data,for the use in assessment tools
Modelsimulations
Impacts on the urban drainage system,Consequences for the city
GIS Risk analysis
Adaptation strategies and measures
Paper II Paper III
Paper IV
Urban Drainage and Climate Change – Impact Assessment
34
Another approach could have been the use of design rainfalls or dissaggregation techniques. However, in this project the long time series were of interest, as this series made it possible to compare current (and past) situations in the system to the future possible influences of rainfall. Observed rainfall series with high temporal resolution were also available for the study area (Hernebring, 2006). Dissagregated rainfalls for the study area might be possible to use for future investigations, as they are studied in another project at SMHI (Olsson, 2007).
As mentioned before, the Delta change method is advantageous because it is relatively simple and because the time resolution for the measured rainfall is preserved. The drawback is that extremely high observed rainfall intensities may be increased too much, but this can be taken into account, for example, by removing the most extreme rainfall events. The risk of some overestimation of the impacts may, however, be desirable in order to have some safety margin when discussing adaptation measures.
The climate model used was the regional climate model/projection RCA3 developed by Rossby Centre at SMHI (Kjellström et al., 2006). The two most commonly used emission scenarios were also used, A2 and B2. The scenarios give a range between which the results can vary and thus provide indications about the uncertainty levels, which is a common approach when considering future trends where uncertainty and probability are difficult to estimate. Uncertainty of the variability and the outcome of the project (e.g. urban drainage impact studies) may also be reduced if dialogue with the parties concerned and common sense are used.
5.3 Urban drainage: model simulations The Mike Urban model was calibrated for the study area and will, therefore, serve well for present and near future climate runs. The hydraulic parameters chosen (maximum water levels in nodes, flooded pipes and nodes, exceeded critical levels in nodes, pipe fill, frequency, and duration) have been used to describe impacts due to climate change in urban drainage systems.
In the literature found concerning climate impact studies, the parameters that can be comparable are peak discharge/flows (Waters et al., 2003) and number of properties flooded (Ashley et al., 2005). Other parameters found in literature but not included in this paper are e.g. runoff volume (Waters et al., 2003), time to peak discharge (Waters et al., 2003), inflow to WTP (Semadeni-Davies, 2004) and combined sewer overflow (Niemczynowicz, 1989; Semadeni-Davies et al., 2006).
There are some difficulties in comparing the results to previous research, as the parameters are not the same. On the other hand, there are other differences as well, which makes it difficult to compare results from different studies, e.g. the geographical and climatic characters, the size and type of catchment area, and also type of system (separated or combined).
However, the choices of parameters are made with the intention of continuing the research with security classes in the city, and the parameters presented here are chosen

Urban Drainage and Climate Change – Impact Assessment
35
in accordance with this approach. In the continuation of the research, there is also a need for more GIS-based modelling, and surface runoff adapted to changes in the future city as well as the climate.
There is no estimation made of the potential change of other parameters except for the rainfall. For example, the runoff pattern as well as the rainfall input might change, and thus affect the urban drainage system. And there are also the aspects of urbanisation, and rehabilitation and renewing of the urban drainage system over a hundred- year time span. These potentials are something to look into for future studies.
5.4 Urban drainage: Cause-effect studies The relations model for urban drainage has some similarities to the models or relationship figures presented by Butler and Davies (2004); however, some details are more pronounced in their model compared to the model presented here. The advantages with the figure used are the comprehensive approach that also contributes to the thoughts of sustainability. The figure clearly shows that the receiving waters may be affected by the water “used” in the city, and that this water might be the source of drinking water, society’s most important provision; therefore, the whole system should be our concern.
The cause and effect relations are general in principle, and for the approach chosen in the thesis they are discussed in two steps. The first step discusses how climate factors affect urban drainage systems, and the second discusses how the urban drainage system affects its surroundings, for example in its contact with the public (e.g. basement flooding and surface flooding), and with the environment (e.g. CSO, treated water from WTP and BMPs, flooding and pollutants).
Aspects considered in the thesis are mostly technical and environmental, but consideration could also be given to economical, socio-cultural, and health aspects, preferably in collaboration with other research disciplines. The urban drainage interactions with people is an aspect that needs to be taken more into account for further studies, especially when discussing adaptation measures.
The climate parameters used have been chosen according to their direct or secondary impact on water systems. Other parameters, or combinations of parameters, could have been included, but these six parameters (three direct, and three secondary) are the most evident ones. As a continuation, more parameters that are combined in nature could be studied and, for example, be taken into account with a model or matrix system.
The results found in the thesis can be used as a base document for investigations of an urban drainage system. Then, the detail level would increase and there would also be more things to take into account, for example the probability of the events to occur.

Urban Drainage and Climate Change – Impact Assessment
36
5.5 Impacts The approach to impact assessment can be divided in different ways: in this thesis, there are the methods and tools used: urban drainage simulations, risk analysis, and cause and effect relations. But there are also aspects of how to present the results, from the climate parameters approach (as in paper III, and to some extent for paper II and I) or from the urban drainage system approach (Table 5, also in paper IV). These can be of use for different purposes.
The results can be somewhat similar, but the first approach (climate parameters approach) might be more often used by, for example, researchers, whereas the second (urban drainage system approach) more often by e.g. water and wastewater engineers, if there is a need to have more practical results for a specific system.
As for the urban drainage model simulations, connecting the information gained to other information about the study area is important, e.g. which places in the city are more sensitive to flooding than others, what buildings may be affected, what social services may be involved. Risk analysis and cause-effect studies performed could be completed with probability estimations, for an existing system.
For future studies, a city could be divided into different sections, e.g. roads, housing areas, city centre, of which the urban drainage impacts/risks due to climate change (and other changes as well) could be studied. For urban drainage simulations, in combination with GIS, the city could be divided into different types of areas, such as areas of public services, like hospitals, and different surfaces, such as green areas, impermeable areas and soil type, and topography. The urban drainage system could also be divided into security classes, depending on the capacity in combination with the vulnerability of the areas served.
5.6 Adaptation In Sweden, several urban flooding situations have occurred due to heavy rainfall events, e.g. in combination with thunderstorms, over the past few years. In the case of basement flooding, the question is always whether the system was actually capable of handling the rainfall events it was supposed to handle (according to design standards). And, there is also the question of how to pay for the damages. Apart from urban drainage, the drinking water sources can also be affected during extreme weather events. In order to support Swedish municipalities’ desire to preserve and protect drinking water sources and supplies during a crisis (for example flooding), a national group of experts in drinking water supply and leadership during crisis started in 2005 in Sweden (VAKA, 2005).
According to a investigation made by Swedish Meteorological and Hydrological Institute (SMHI), very few Swedish sectors (industry, companies, municipalities, governmentally owned companies, etc) had strategies for adaptation to climate change in 2004/2005, and among measures already taken, the majority were adaptations to existing climate conditions and not to future climatic conditions (Rummukainen et al.,
Urban Drainage and Climate Change – Impact Assessment
37
2005). Later this year (2007), the Swedish government will present results from an investigation concerning the climate impacts on different societal services, thus the vulnerability of society will be revealed (SOU, 2006). There are a lot of things to do concerning adaptation measures, and the impact studies are one step along the way.

Urban Drainage and Climate Change – Impact Assessment
38
Urban Drainage and Climate Change – Impact Assessment
39
6 Conclusions and future studies
The knowledge gained through this thesis can be used as a base document before starting an investigation of an existing urban drainage system. The strategy suggested, in combination with tools such as urban drainage model simulations, GIS and risk analysis (e.g. cause and effect studies) provide information and knowledge about possible impacts. Dialogue and cooperation with different parties concerned (e.g. urban drainage experts, climate change experts, stakeholders) are also important since most urban drainage impacts concern several disciplines and a need of multifunctional understanding.
In order to handle the differences in spatial and temporal resolution between climate model data and the need for urban hydrology simulations, the Delta change approach is a good choice, as the method is relatively simple and the temporal resolution of observed rainfall series can be preserved.
In the study area, the urban drainage simulations showed that the number of flooded nodes as well as the geographical distribution of the floods increases during the future time periods (2011-2040, 2041-2070, and 2071-2100) for both scenarios A2 and B2. The tendency is that future precipitation will increase both the flooding frequency and the duration of floods; therefore, the need to handle future situations in urban drainage systems and to have a well- planned strategy to cope with future conditions is evident. For future considerations and for renewal plans, dividing the system into security levels/classes, where the critical level below ground will give earlier indications of capacity failure, might be preferable.
The cause and effect studies, with the whole urban water system taken into account, are one way to assess impacts on urban drainage systems due to climate change from a sustainability approach. During such a study, the possible interactions between different parts of the urban water system can be identified, and the impacts described as problem chains can show secondary problems in the system, or in the city.
Urban Drainage and Climate Change – Impact Assessment
40
Future studies Considering the future research approach, several parts can be further investigated. As a continuation of this thesis, the following are suggested:
Comparing urban drainage impacts in more parts of Sweden to determine if there are differences in latitude (north-south), and between the coast and inland through urban drainage model simulations and also risk analysis. This comparison would also be a chance to investigate cold climate-related impacts more.
Developing adaptation strategies and measures as a continuation of the impact studies. Suggesting possible technical solutions and discussing the adaptation strategies from a sustainability approach as well. There are also issues of the implementation of adaptation measures, such as what the hindrances and possibilities are.
Further developing the urban drainage simulations techniques and taking into account other future changes as well as climate, such as urbanization, planning and maintenance of the system, city strategies and spatial planning, etc.
Handling uncertainties of the future, by determining how these could be taken into account, if they can be measured, or in other ways handled in a practical way, e.g. robustness of solutions.

Urban Drainage and Climate Change – Impact Assessment
41
References
Ahnoff L., and Kant H. (2002). Nederbörd och havsnivå – trender och påverkan på VA-systemet i Göteborg, Rapport från Göteborgs VA-verk [in Swedish]
Arnbjerg-Nielsen K. (2005). Significant climate change of extreme rainfall in Denmark, Water Science and Technology, 54 (6-7), pp 1-8, IWA Publishing
Arnbjerg-Nielsen (2006). Klimaeffekters betydning for ekstremregn og dermed funktionen af afløbssystemer – litteraturstudie, Miljøstyrelsen Nr. 9, 2006 [in Danish]
Ashley R.M., Balmforth D.J., Saul A.J. and Blanksby J.D. (2005). Flooding in the future – predicting climate change, risks and responses in urban areas, Water Science and Technology, 55(5), pp 265-273, IWA publishing
Balmforth D.J. and Dibben P. (2005). A modelling tool for assessing flood risk, In: Proceedings of the 10th International Conference on Urban Drainage,Copenhagen, Denmark, 21-26 August 2005.
Blanksby J., Ashley R., Saul A., Cashman A., Packman J., Maksimovic C., Jack L., Wright G. and Kay D. (2004). Adaptable Urban Drainage (Audacious), In:Proceedings of the 5th NOVATECH International conference: Sustainable Techniques and Strategies in Urban Water Management, Lyon, France, June, 2004
Blanksby J., Saul A., Ashley R., Cashman A., Poole T. and Melling D. (2005). Framework for Water and Flood Risk Management in the City of Bradford, In: Proceedings of the 10th International Conference on Urban Drainage,Copenhagen, Denmark, 21-26 August, 2005.
Berggren K., Viklander M., Svensson G. Impacts on Urban Water Systems due to Climate Change, submitted to ‘Climatic Change’, August 2007.
Berggren K., Olofsson M., Viklander M., Svensson G. (2007). Tools for Measuring Climate Change Impacts on Urban Drainage Systems, In: Proceedings of the 6th
NOVATECH International conference: Sustainable Techniques and Strategies in Urban Water Management, Lyon, France, June, 2007.
Bernes C. (2003). A Warmer World, Swedish Environmental Protection Agency and SMHI (SWECLIM), Ödeshög, ISBN: 91-620-1229-0,
Butler D., and Davies J. W. (2004). Urban Drainage, (2. rev. ed.), London and New York, ISBN 0-415-30607-8
Bäckman H. (1985). Infiltration/Inflow in Separate Sewer Systems, Chalmers University of Technology, Doctoral thesis no 6., Göteborg 1985
Christensen F.M., Andersen O., Duijm N.J., Harremoës P. (2003). Risk terminology – a platform for common understanding and better communication, Journal of Hazardous Materials, A103, 181-203
DHI (2005). DHI Software 2005, DHI Water & Environment ABEU (1997). BS EN 752-2: Drain and sewer systems outside buildings. Performance
requirementsEvans E., Ashley R., Hall J., Penning-Rowsell E., Saul A., Sayers P., Thorne C., and
Watkinson A. (2004a). Foresight. Future Flooding. Scientific Summary: Volume 1 – Future risks and their drivers. Office of Science and Technology, London
Urban Drainage and Climate Change – Impact Assessment
42
Evans E., Ashley R., Hall J., Penning-Rowsell E., Sayers P., Thorne C., and Watkinson A. (2004b). Foresight. Future Flooding. Scientific Summary: Volume 2 – Managing future risks. Office of Science and Technology, London
Grum M., Jørgensen A.T., Johansen R.M. and Linde J.J. (2005). The effect of climate change on urban drainage: An evaluation based on regional climate model simulations, In: Proceedings of the 10th International Conference on Urban Drainage, Copenhagen, Denmark, 21-26 August 2005
Hadley Centre (2006), July 2006,http://www.metoffice.com/research/hadleycentre/models/modeltypes.html,
Hernebring C., (2006). 10-års regnets återkomst förr och nu [Design storms in Sweden then and now], VA-forsk publ. 2006-04. [In Swedish]
IPCC (2007). Climate Change 2007: The Physical Science Basis, Summary for Policymakers, Contribution of Working Group I to the Fourth Assessment Report of the IPCC
Johansson T., Hanson H., Hellgren L.-G., Lindahl S., Ljunggren O., Strandner H., Widerström G. (1991). Översvämningsrisker i Västsverige på grund av Växthuseffekten, VBB Viak (SWECO Viak) Mark teknikutveckling rapport 1/91 [in Swedish]
Kjellström, E., Bärring, L., Gollvik, S., Hansson, U., Jones, C., Samuelsson, P., Rummukainen, M., Ullerstig, A., Willén U. and Wyser, K., (2005). A 140-year simulation of European climate with the new version of the Rossby Centre regional atmospheric climate model (RCA3). Reports Meteorology and Climatology 108,SMHI, SE-60176 Norrköping, Sweden, 54 pp.
Kundzewicz, Z.W. and Somlyódy, L. (1997). Climatic Change Impact on Water Resources in a Systems Perspective, Water Resources Management, 11., pp. 407-435
Mikkelsen P.S., Viklander M., Linde J.J. and Malmqvist P.-A. (2001). BMPs in Urban Stormwater Management in Denmark and Sweden, Contribution to Engineering Foundation Conference: Linking Stormwater BMP Designs and Performance to Receiving Water Impacts Mitigation, Snowmass, Colorado, August 19-24, 2001
Nakicenovic N. et al., (2000). IPCC Special Report on Emissions Scenarios, IPCC, Cambridge University Press, Cambridge.
Niemczynowicz, J. (1989). Impact of the greenhouse effect on sewerage systems – Lund case study, Hydrological Sciences – Journal – des Sciences Hydrologiques,34(6), pp. 651-666
Olsson J., Olofsson M., Berggren K., Viklander M. (2006). Adaptation of RCA3 climate model data for the specific needs of urban hydrology simulations. In:Proceedings of the 7th International workshop on precipitation in urban areas: Extreme Precipitation, Multisource Data Measurement and Uncertainty, St. Moritz, Schweiz 7-10 December, 2006.
Olofsson M., Berggren K., Viklander M., Svensson G. Hydraulic impact on urban drainage systems due to climate change, submitted to ‘Journal of Hydrology’, April 2007.
Olsson J., Berggren K., Olofsson M., Viklander M. Applying Climate Model Precipitation scenarios for urban hydrological assessment: A case study in Kalmar city, Sweden, submitted to ‘Atmospheric research’, April 2007.

Urban Drainage and Climate Change – Impact Assessment
43
Olsson J. Assessment of RCA precipitation components for downscaling to point, working report SMHI, 2007.
Onof C. (2004). Climate Change and the Hydraulic Design of Sewerage Systems Volume 2B – Time Series Rainfall: Disaggregation, UKWIR Report Ref No 03/CL/10/5, London
Rauch W. and De Toffol S. (2006). On the issue of trend and noise in the estimation of extreme rainfall properties, Water Science and Technology, 54(6-7), pp 17-24, IWA Publishing
Rummukainen, M., Bergström, S., Persson, G. och Ressner, E. (2005). Anpassning till klimatförädringar. Kartläggning av arbete med sårbarhetsanalyser, anpassningsbehov och anpassningsåtgärder i Sverige till framtida klimatförändring. SMHI Reports Meteorology and Climatology No. 106, SMHI, SE-601 76 Norrköping, Sweden. 44 pp. [in Swedish]
Schreider S.YU., Smith D.I. and Jakeman A.J. (2000). Climate Change Impacts on Urban Flooding, Climatic Change, 47, pp 91-115
Semadeni-Davies A. (2003). Response surfaces for climate change impact assessments in urban areas, Water Science and Technology, 48(9), pp 165-175, IWA publishing
Semadeni-Davies A. (2004). Urban water management vs. climate change: impacts on cold region waste water inflows, Climatic Change, 64, pp. 103-126
Semadeni-Davies, A., Hernebring, C., Svensson, G and Gustafsson, L.-G., (2006). The impacts of climate change and urbanisation on urban drainage in Helsingborg. Final Report, Dept. Water Res. Eng., Lund University, Sweden.
SOU (2006). Översvämningshot - risker och åtgärder för Mälaren, Hjälmaren och Vänern, SOU 2006:94. [In Swedish]
Stern N. (2007). The Economics of Climate Change - The Stern Review, Cambridge: Cambridge University Press, 2007
Svenskt Vatten (2004). Dimensionering av allmänna avloppsledningar P90,ISSN:1651-4947 [In Swedish]
VAKA (2005). Nationell vattenkatastrofgrupp, Livsmedelsverket [in Swedish] http://www.slv.se/upload/18354/VAKA-broschyr%20med%20bilder%20webb.pdf
van Luijtelaar H., Stapel W., Moens M. and Dirzwager A.(2005). Climatic change and urban drainage: Strategies, In: Proceedings of the 10th International Conference on Urban Drainage, Copenhagen, Denmark, 21-26 August, 2005.
Waters D., Watt W.E, Marsalek J. and Anderson B.C. (2003). Adaptation of a Storm Drainage System to Accommodate Increased Rainfall Resulting from Climate Change, Journal of Environmental Planning and Management, 46(5), pp.755-770
Watt W.E., Waters D. and McLean R. (2003). Climate Change and Urban Stormwater Infrastructure in Canada: context and Case Studies, Toronto-Niagara Region Study Report and Working Paper Series, Report 2003-1. Meteorological Service of Canada, Waterloo, Ontario.

Paper I
Applying Climate Model Precipitation scenarios for urban hydrological assessment: A case study in Kalmar city, Sweden
Olsson J., Berggren K., Olofsson M., Viklander M. (2007)
Submitted to ‘Atmospheric research’

1
APPLYING CLIMATE MODEL PRECIPITATION SCENARIOS
FOR URBAN HYDROLOGICAL ASSESSMENT: A CASE
STUDY IN KALMAR CITY, SWEDEN
by
J. Olsson*, K. Berggren**, M. Olofsson**, M. Viklander**
* SMHI, FoUh, Norrköping, Sweden, fax.nr. +46-(0)11-495 8001, e-mail
[email protected] (corresponding author)
** Luleå University of Technology, Dep. of Civil and Environmental Engineering, Luleå,
Sweden, fax nr. +46-(0)920-49 28 18, e-mail [email protected],
2
AbstractThere is growing interest in the impact of climate change on urban hydrological processes. Such
assessment may be based on the precipitation output from climate models. To date, the model
resolution in both time and space has been too low for proper assessment, but at least in time the
resolution of available model output is approaching urban scales. In this paper, 30- min
precipitation from a model grid box covering Kalmar City, Sweden, is compared with high-
resolution (tipping-bucket) observations from a gauge in Kalmar. The model is found to
overestimate the frequency of low rainfall intensities, and therefore the total volume, but
reasonably well reproduce the highest intensities. Adapting climate model data to urban drainage
applications can be done in several ways but a popular way is the so-called Delta Change (DC)
method. In this method, relative changes in rainfall characteristics estimated from climate model
output are transferred to an observed rainfall time series, generally by multiplicative factors. In
this paper, a version of the method is proposed in which these DC factors (DCFs) are related to
the rainfall intensity level. This is achieved by calculating changes in the probability distribution
of rainfall intensities and modelling the DCFs as a function of percentile. Applying this method
in Kalmar indicated that in summer and autumn, high intensities will increase by 20-60% until
year 2100, whereas low intensities remain stable or decrease. In winter and spring, generally all
intensity levels increase similarly. The results were transferred to the observed time series by
varying the volume of the tipping bucket to reflect the estimated intensity changes on a 30-min
time scale. Finally, urban drainage simulations with a MOUSE model set up for a residential area
in Kalmar was performed to identify the hydraulic effects in the system due to the changed
precipitation. The impact of time resolution was briefly assessed, showing that the number of
flooded nodes was about 30% less with a 30-min time resolution compared to 5-min. When the
urban drainage model was run with DC-transformed tipping-bucket summer rainfall data, the
water levels in nodes for different short and intense rainfall events were 15-20 cm higher for a
distant-future climate perspective (2071-2100) than for today’s climate, indicating an increased
flood risk. The simulations also showed that number of flooded nodes increased by 45%,
compared to the situation today.
Keywords: urban drainage, precipitation, regional climate model, climate change, urban
hydrology

3
1 Introduction Hydrological changes and increased numbers of heavy precipitation events are very likely to
occur in the 21st century, as a result of higher global mean temperature (IPCC, 2007). This will
have great impact on urban environment and infrastructure. Especially high-intensity rain will
cause problems such as flooding because of limitations in the existing urban drainage systems. In
many cities in Sweden, the rate of renewal of pipe systems is very low today, but it is likely that
renovation activities will increase. The planning, design and operation of the future urban
drainage system must take the climate change into account. According to the results from
SWECLIM (Swedish Regional Climate Modelling Programme), it is possible that the summer
precipitation will decrease in the southern and mid parts of Sweden, but the northern part can
expect an increase in precipitation even during the summer (Bernes, 2003).
In order to assess impacts in urban drainage systems with model simulations, precipitation input
data of a high temporal resolution is needed. The future changes of high intensities are of key
importance as these rainfalls will have great impact on the urban drainage systems. To assess the
future rainfall properties relevant for urban hydrological processes, two main strategies may be
identified. One strategy is to use historical data to estimate trends of key rainfall properties. This
was done e.g. by Pagliara et al. (1998), who found that short-duration annual maxima in Tuscany,
Italy, has increased since the mid-20th century, whereas the increase was less pronounced for
long-duration extremes. Arnbjerg-Nielsen (2006) found that the maximum 10-min intensity has a
statistically significant increasing trend in eastern Denmark. This kind of trends may then be
projected or extrapolated into the future, as done by e.g. Denault et al. (2006) for an urban
catchment in British Columbia, Canada. Using the Storm Water Management Model (SWMM)
with future rainfall intensities estimated from the extrapolated trends resulted in an increase in
peak design discharges by more than 100% until year 2050. The second main strategy is to use
output from climate models, applied to simulate the response to various greenhouse gas
scenarios. Because of the large difference in spatial resolution between climate model data
(spatial averages over typically ~2000 km²) and urban catchments (down to ~1 km² or even
smaller), the model output in itself is not well suited for direct application in urban modelling.
Therefore different more indirect ways to use climate model output have been proposed, e.g. to
use it as a basis to modify parameters of stochastic weather generators and point rainfall models

4
(e.g. Schreiber et al., 2000; Onof et al., 2002). Most commonly, however, the output is used to
quantify the percentage change in rainfall intensity between today and some future time, known
as delta change (DC; e.g. Hay et al., 2000; Schreider et al., 2000; Andreasson et al., 2004).
Typically, a multiplicative delta change factor (DCF) is estimated by comparing climate model
output representing today’s and future climate, respectively. Then the factor is applied to rescale
an observed rainfall time series for subsequent use in some type of hydrological modelling.
In an urban hydrological context, Niemcynowicz (1989) in a pioneering study applied delta
change to Intensity-Duration-Frequency (IDF) curves in Lund, Sweden, and used the resulting
intensities as input in SWMM modelling. The DCFs were varied between +10% and +30%, in
line with general estimates from GCM output available at the time, and it was found that the
percentage change in runoff volumes became even higher. More recently, a similar study with
overall similar results was performed in Ontario, Canada (Waters et al., 2003). Schreider et al.
(2000), based on output from different GCMs, found a 20% maximum increase in summer
rainfall in Australia until year 2070. Results from hydrological modelling indicated only a minor
effect on urban flood damage. Semadeni-Davies et al. (2005), in a joint study of the effects on
urban drainage related to both climate change and increased urbanisation in Helsingborg,
Sweden, used a version of the DC method with different factors for low and high rainfall
intensities (drizzle and storm), respectively. The monthly DCFs were found to vary widely
between a 50% decrease and a 500% increase for the period 2071-2100, implying that both
season and intensity level need to be taken into account. Grum et al. (2006) made an effort to
include the difference in spatial resolution between the climate model output and the observations
by complementing delta change with an observed relationship between point value extremes and
spatially averaged extremes, respectively. Generally the results indicated that in the period 2071-
2100, extreme events will occur at least twice as frequently as in the recent past, i.e. a certain
intensity will have an approximately halved return period. It may be remarked that this kind of
point-areal analysis requires a dense network of gauges with a high temporal resolution,
something that is seldom available in practice.
The primary objective of this study is to refine the DC procedure, i.e. to apply future changes in
precipitation on a historical rainfall time series, using DCFs reflecting both the variation between

5
seasons and the changes of different intensity levels. The latter is achieved by employing a
version of the DC method which is based on comparison between different percentiles in the
frequency distribution of precipitation intensities, representing today’s climate and future
climates, respectively. Thus, instead of single DCFs, a distribution of factors covering the entire
range from low to high intensity levels is derived. This provides a more complete description of
the anticipated future change in rainfall intensities than in previous applications of the delta
change method, and further makes it possible to modify observations in a more detailed way. A
method to transfer the results to an observed tippingbucket rainfall time series is proposed, in
which the bucket volume is considered variable.
The secondary objective is to assess how the urban drainage in the city of Kalmar, in southeastern
Sweden, will be affected by the estimated future changes in the precipitation. For this purpose,
climate projections derived from the regional climate model RCA3 are used. Model precipitation
in the period 1961-2100 with a 30-min time resolution from three grid boxes in the Kalmar
region are extracted and analysed. DCF distributions for three different future time periods are
estimated and the future changes transferred to an observed high-resolution time series. The
resulting series are then used as input to the urban drainage model MOUSE, set up for a
residential area in Kalmar, Sweden, to investigate the urban hydrological response to the
estimated changes.

6
2 Precipitation data and analysis for today’s climate The precipitation data sets used in the study are (1) high-resolution observations for the period
1991-2004 from a gauge in Kalmar, Sweden, and (2) output from the RCA3 climate model for
the period 1961-2100 from the grid box covering Kalmar (and two adjacent boxes). In a
comparative evaluation, the realism of the modelled precipitation is assessed.
2.1 Study area and data bases The study area is the city of Kalmar in south-eastern Sweden, which was selected mainly because
an urban drainage and sewer model (MOUSE) was set-up for a residential area in the city and
directly available for simulations. This area has a population of 3000 and a contributing
catchment area of 54 ha, of which 20 ha is impervious. The urban drainage system has 410 nodes
(representing gully pots/manholes) and is separated, thus it contains only storm water.
Observed rainfall data consist of a quality controlled 13-year time series (1991-2004) of tipping
bucket rainfall observations from a gauge in Kalmar. This data set is described in
Hernebring (2006), where it is also compared with daily observations from a nearby gauge.
The volume resolution is 0.2 mm.
Climate model data consist of output from the regional atmospheric climate model RCA3,
developed at the Rossby Centre, SMHI (Kjellström et al., 2005). The RCA3 model was recently
applied for a 140-year transient climate simulation from 1961 to 2100. In this experiment, the
RCA3 model downscales the output from the global climate model ECHAM4 (Roeckner et al.,
1996) to a 50 50 km spatial resolution over northern Europe. Two different so-called SRES
emission scenarios were run, A2 and B2. The scenarios differ with respect to the expected future
global development in economical, social and technological terms. Very generally, A2 assumes a
high future anthropogenic impact on climate whereas in B2 the impact is assumed to be more
moderate (Nakicenovic et al., 2000). A detailed description and evaluation of the experiment is
given in Kjellström et al. (2005). For this study, a 140-year time series of 30-min precipitation
was extracted from the RCA3 output, for the grid box covering Kalmar. One issue, however,
when using climate model output concerns the variability between model grid boxes. As a grid
box covers 2500 km², its output mainly represents the dominant geographical characteristics of
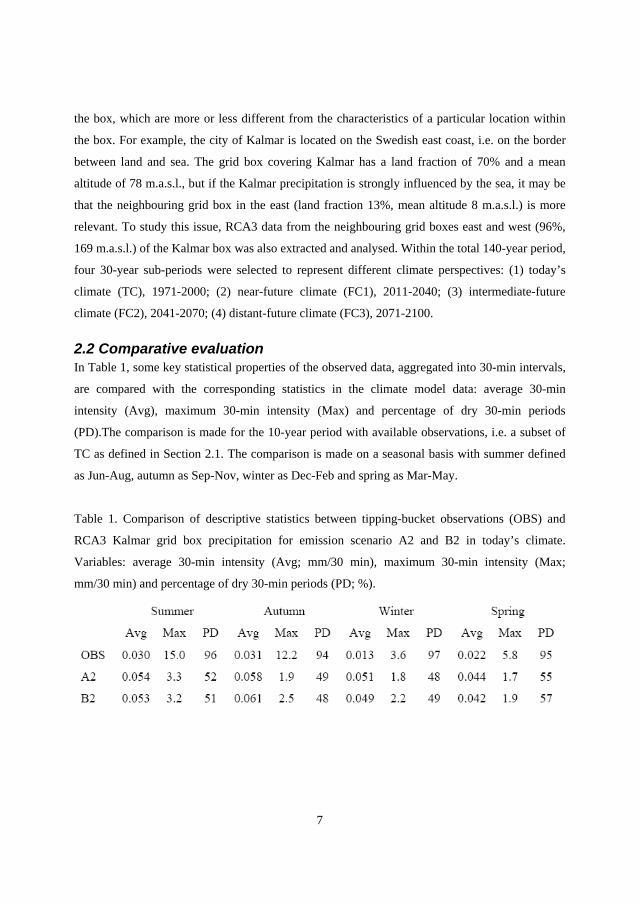
7
the box, which are more or less different from the characteristics of a particular location within
the box. For example, the city of Kalmar is located on the Swedish east coast, i.e. on the border
between land and sea. The grid box covering Kalmar has a land fraction of 70% and a mean
altitude of 78 m.a.s.l., but if the Kalmar precipitation is strongly influenced by the sea, it may be
that the neighbouring grid box in the east (land fraction 13%, mean altitude 8 m.a.s.l.) is more
relevant. To study this issue, RCA3 data from the neighbouring grid boxes east and west (96%,
169 m.a.s.l.) of the Kalmar box was also extracted and analysed. Within the total 140-year period,
four 30-year sub-periods were selected to represent different climate perspectives: (1) today’s
climate (TC), 1971-2000; (2) near-future climate (FC1), 2011-2040; (3) intermediate-future
climate (FC2), 2041-2070; (4) distant-future climate (FC3), 2071-2100.
2.2 Comparative evaluation In Table 1, some key statistical properties of the observed data, aggregated into 30-min intervals,
are compared with the corresponding statistics in the climate model data: average 30-min
intensity (Avg), maximum 30-min intensity (Max) and percentage of dry 30-min periods
(PD).The comparison is made for the 10-year period with available observations, i.e. a subset of
TC as defined in Section 2.1. The comparison is made on a seasonal basis with summer defined
as Jun-Aug, autumn as Sep-Nov, winter as Dec-Feb and spring as Mar-May.
Table 1. Comparison of descriptive statistics between tipping-bucket observations (OBS) and
RCA3 Kalmar grid box precipitation for emission scenario A2 and B2 in today’s climate.
Variables: average 30-min intensity (Avg; mm/30 min), maximum 30-min intensity (Max;
mm/30 min) and percentage of dry 30-min periods (PD; %).
8
If first looking at the difference between scenarios A2 and B2, the average value is higher in
A2 for three of the seasons and the maximum value is higher in B2 for three of the seasons.
However, the differences between A2 and B2 are overall small and may well be attributed to
statistical scatter rather than reflecting some actual systematic differences.
The differences between the gauge data and the climate model data are more clear. Concerning
average precipitation, this is substantially overestimated in the model. It should however be noted
that tipping-bucket gauges generally underestimate the long-term volume, and indeed Hernebring
(2006) found that the daily gauge in Kalmar recorded ~25% more precipitation than did the
tipping-bucket gauge. This indicates that the actually observed volume is higher, but still RCA3
overestimates this amount. If increasing the gauge value by 25%, the RCA3 overestimation in
summer, autumn and spring becomes ~50%. In winter the overestimation reaches ~200%, which
may at least partly be related to inaccurate gauge recordings during periods with snowfall. The
observed pattern with higher average values in summer and autumn than in winter and spring is
qualitatively reproduced in the model. The PD is ~95% in the observations but only ~50% in the
model output. A lower percentage is expected in the model data as they represent a spatial
average. However, also in comparisons with spatial observations the RCA3 model has been
found to overestimate the frequency of low intensities (e.g. Carlsson et al., 2006). Thus model
inaccuracy is most probably also contributing to the underestimated frequency of dry periods. In
the model data PD is somewhat higher in summer and spring than in autumn and winter. This
may reflect the more frequent frontal passages during the latter seasons, but this tendency is not
clear in the observations.
Concerning maximum intensity, in summer it is ~3 mm in the RCA3 data whereas in the
observations it is 15 mm. Point and areal precipitation values are often related by so-called areal
reduction factors (ARFs), which specify how much a point value is reduced when considering an
area surrounding the point location. In NERC (1975), the recommended ARF for a duration of 30
min and an area of 3000 km² is 0.41. A point value of 15 mm would thus reduce to ~6 mm for an
area of the size of the RCA3 grid, which is still more than the RCA3 maximum. However, the
observed value 15 mm is indeed extreme. The second to fourth highest maxima are all ~10 mm,
corresponding to an areal value of ~4 mm which is reasonably close to 3 mm. Another reason for
9
the underestimated extremes is most probably limitations in the physical description of rainfall
generation in the RCA3 model. Also in autumn the observed maximum (12.2 mm) is clearly
extreme. The second to fourth highest maxima are ~7 mm, with ARF=0.41 corresponding to an
areal value of ~3 mm which is reasonably close to the modelled maxima. In spring the observed
maximum is not as extreme and the relationship between observed and modelled maxima is well
in line with the ARF. In winter, the observed maximum is 3.6 mm and modelled maximum ~2
mm, which implies an ARF 0.6. This is qualitatively reasonable as maxima in this season are
generally produced by frontal passages, which are characterized by a smaller difference between
the point value maximum and the spatially averaged maximum, respectively (e.g. Allen and
DeGaetano, 2005).Concerning the issue of grid box variability, the results from the surrounding
grid boxes in the east and in the west were somewhat ambiguous. In terms of average intensity
and percentage of dry periods, model data from the eastern grid box are systematically slightly
closer to the observations than data from the grid box centred over Kalmar. Thus, in this respect,
the overall maritime character of the rainfall regime in Kalmar appears better represented by the
sea-dominated neighbouring grid box. Maximum values are, however, generally better
represented in the land-dominated grid box in the west, implying that high intensities in Kalmar
are associated with generating mechanisms of a more inland character. Thus, the grid box centred
over Kalmar conceivably represents a mixture of the maritime and inland rainfall regimes, and
therefore we focus on data from this box in the following.
Overall the RCA3 model results appear to reasonably well reproduce the features of the observed
precipitation. It is clear that the model generates too much rainfall, most probably due to an
overestimated frequency of low intensities. It may be remarked that this inaccuracy is likely to
have little significance in the context of urban flooding. More significant are the maximum 30-
min intensities, and these appear overall realistic in the model generated data.
10
3 Precipitation changes in the future climate The RCA3 precipitation is analysed to assess the character of the future changes, as represented
in the 140-year transient climate simulation. A refined version of the delta change method is
described, after which results are presented, in detail for the summer season and more briefly for
the other seasons. Only the results for the grid box centred over Kalmar City are presented, but it
may be mentioned that the results from the neighbouring grid boxes are overall similar.
3.1 Methodology: delta change (DC) As briefly reviewed in the Introduction, for urban hydrological purposes the delta change (DC)
method has been applied in different ways. Most investigations have focused on the highest
intensities, e.g. as expressed in IDF-curves, and their expected future increase. In this study,
however, the final objective is storm water modelling using as input not design storms but
continuous rainfall time series. Thus we need to consider not only the highest intensities but all
intensity levels, i.e. the entire probability distribution of rainfall intensities, and estimate the
corresponding distribution of delta change factors (DCFs). For each of the four climate
perspectives (TC, FC1, FC2, FC3; Section 2.1), percentiles of the intensity probability
distributions were calculated. For each perspective, percentiles were calculated separately for
each of the three 10-year periods within the total 30-year period (first, middle, last). This was
done in order to obtain different realizations of the distribution. The percentiles were calculated
with a resolution of 0.1, i.e. representing probabilities of nonexceedance in the range 0, 0.1,
0.2…99.8, 99.9, 100. To obtain a smooth and stable estimate of the DCF distributions for a
certain future climate perspective, an averaging procedure was used. In this procedure, the
percentiles of each 10-year period in this future climate were divided by the corresponding
percentile of each 10-year period in today’s climate. This produces a total of nine DCF
distributions, which were averaged to obtain the final DCF distribution for each climate
perspective and season.
In the calculation of percentiles and DCF distributions, the very lowest intensities were omitted.
As indicated in Table 1, the RCA3 precipitation is characterized by an overestimated frequency
of very low intensities, leading to an overestimation of the average 30-min intensity and an
underestimation of the percentage of dry 30-min periods. Different strategies can be used to omit
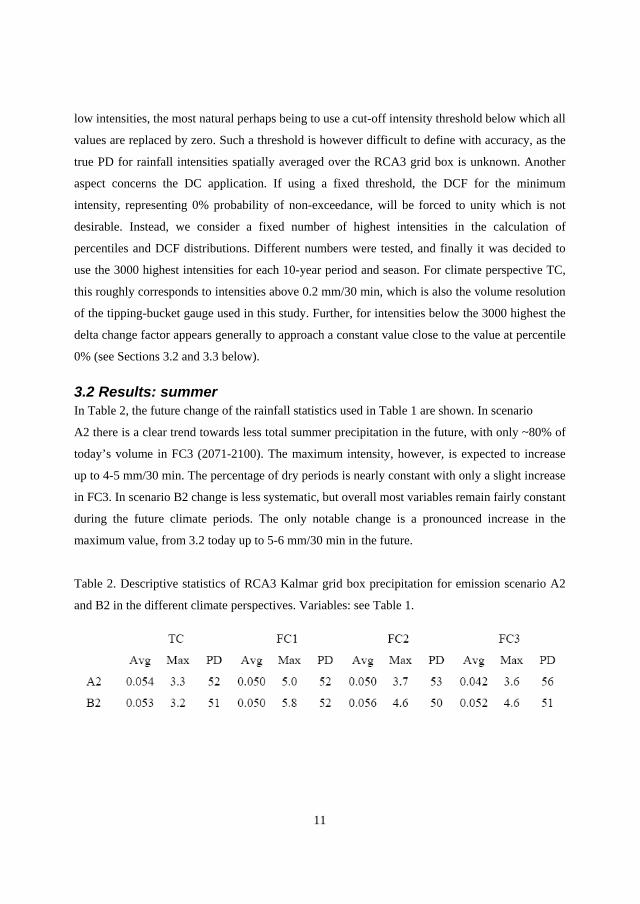
11
low intensities, the most natural perhaps being to use a cut-off intensity threshold below which all
values are replaced by zero. Such a threshold is however difficult to define with accuracy, as the
true PD for rainfall intensities spatially averaged over the RCA3 grid box is unknown. Another
aspect concerns the DC application. If using a fixed threshold, the DCF for the minimum
intensity, representing 0% probability of non-exceedance, will be forced to unity which is not
desirable. Instead, we consider a fixed number of highest intensities in the calculation of
percentiles and DCF distributions. Different numbers were tested, and finally it was decided to
use the 3000 highest intensities for each 10-year period and season. For climate perspective TC,
this roughly corresponds to intensities above 0.2 mm/30 min, which is also the volume resolution
of the tipping-bucket gauge used in this study. Further, for intensities below the 3000 highest the
delta change factor appears generally to approach a constant value close to the value at percentile
0% (see Sections 3.2 and 3.3 below).
3.2 Results: summer In Table 2, the future change of the rainfall statistics used in Table 1 are shown. In scenario
A2 there is a clear trend towards less total summer precipitation in the future, with only ~80% of
today’s volume in FC3 (2071-2100). The maximum intensity, however, is expected to increase
up to 4-5 mm/30 min. The percentage of dry periods is nearly constant with only a slight increase
in FC3. In scenario B2 change is less systematic, but overall most variables remain fairly constant
during the future climate periods. The only notable change is a pronounced increase in the
maximum value, from 3.2 today up to 5-6 mm/30 min in the future.
Table 2. Descriptive statistics of RCA3 Kalmar grid box precipitation for emission scenario A2
and B2 in the different climate perspectives. Variables: see Table 1.

12
Figure 1 shows the percentiles for summer season, climate perspectives TC (1971-2000) and FC3
(2071-2100), emission scenario A2. The percentiles have been averaged over the three 10-year
periods in each of the two perspectives. Below the 90th percentile, the TC curve is located above
the FC3 curve, implying that intensities up to 90% probability of nonexceedance will decrease
between TC and FC3. For the lowest intensities considered, the decrease is ~35%. At the 90th
percentile the curves cross, and for higher percentiles TC is below FC3, i.e. the highest intensities
will increase. For the very highest intensities, in the range 99-100%, the increase is 15-25%. The
pattern in Figure 1 reflects a change towards lower total summer precipitation due to a decreased
intensity during periods of light rainfall (drizzle). On the other hand, the intensity during periods
of heavy and very heavy rainfall will increase, possibly owing to an intensified convective
activity.
Figure 1. Percentiles of the summer precipitation distribution in the RCA3 output for climate
perspectives TC and FC3, respectively, emission scenario A2.
Figure 2a shows the summer DCF distributions for all three future climate perspectives, emission
scenario A2. Concerning FC3, in line with the results in Figure 3.2_1, the DCF is <1 below the
90th percentile and >1 above it, ranging from ~0.65 to ~1.25. Concerning FC1 and FC2, the
change is principally similar to FC3 but less pronounced. The DCFs are in the range ~0.8-1.15
and the transition from DCFs <1 to >1 takes place at the 70th-80th percentile.
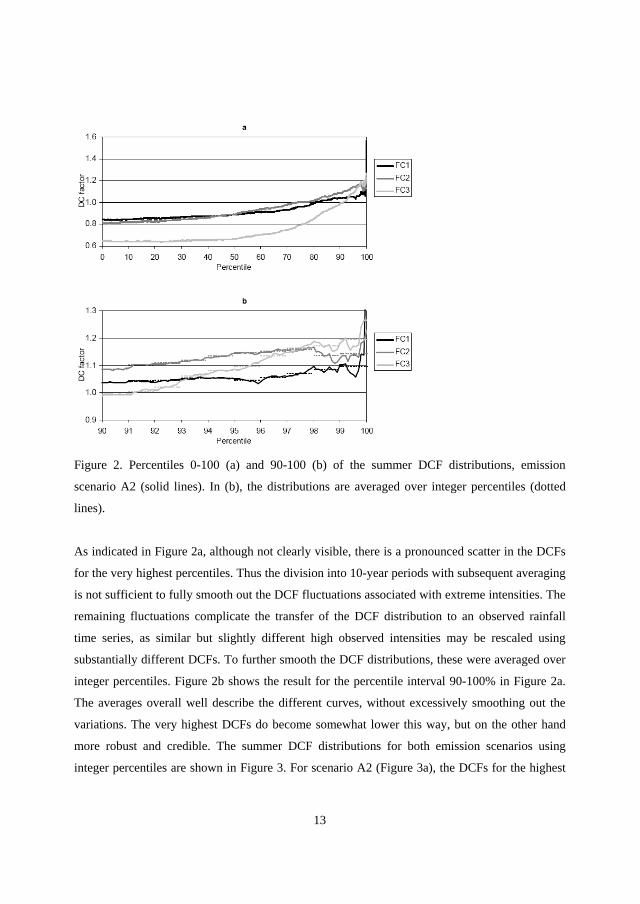
13
Figure 2. Percentiles 0-100 (a) and 90-100 (b) of the summer DCF distributions, emission
scenario A2 (solid lines). In (b), the distributions are averaged over integer percentiles (dotted
lines).
As indicated in Figure 2a, although not clearly visible, there is a pronounced scatter in the DCFs
for the very highest percentiles. Thus the division into 10-year periods with subsequent averaging
is not sufficient to fully smooth out the DCF fluctuations associated with extreme intensities. The
remaining fluctuations complicate the transfer of the DCF distribution to an observed rainfall
time series, as similar but slightly different high observed intensities may be rescaled using
substantially different DCFs. To further smooth the DCF distributions, these were averaged over
integer percentiles. Figure 2b shows the result for the percentile interval 90-100% in Figure 2a.
The averages overall well describe the different curves, without excessively smoothing out the
variations. The very highest DCFs do become somewhat lower this way, but on the other hand
more robust and credible. The summer DCF distributions for both emission scenarios using
integer percentiles are shown in Figure 3. For scenario A2 (Figure 3a), the DCFs for the highest

14
percent of intensities, DCF99, are 1.10 for FC1, 1.14 for FC2 and 1.19 for FC3. Concerning
scenario B2, the overall pattern of the DCF curves is similar to A2, but the decrease of low
intensities is less pronounced and the increase of high intensities is more pronounced. The values
of DCF99 are 1.19, 1.23 and 1.29, respectively. In total, the results suggest a future increase in
extreme summer rainfall intensities by 20-30% in the Kalmar region, accompanied by a decrease
of low intensities.
Figure 3. Percentiles of the summer DCF distributions for emission scenario A2 (a) and B2
(b).
3.3 Results: autumn, winter and spring DCF-distributions for seasons other than summer are shown in Figure 4 (emission scenario A2
only). Autumn (Figure 4a) is particularly characterized by a pronounced increase of the extreme
intensities. The value of DCF99 ranges from 1.28 for FC1 to 1.63 for FC3. As mentioned in
Section 2.2, a typical autumn extreme intensity in today’s climate is ~7 mm/30 min. A DCF of
1.6 implies an increase of this typical autumn extreme to ~11 mm/30 min by the end of this
century. This may be compared with the situation in summer. Today’s typical extreme is ~10
mm/30 min and the corresponding DCF99 for FC3 is ~1.2, which gives a future typical summer
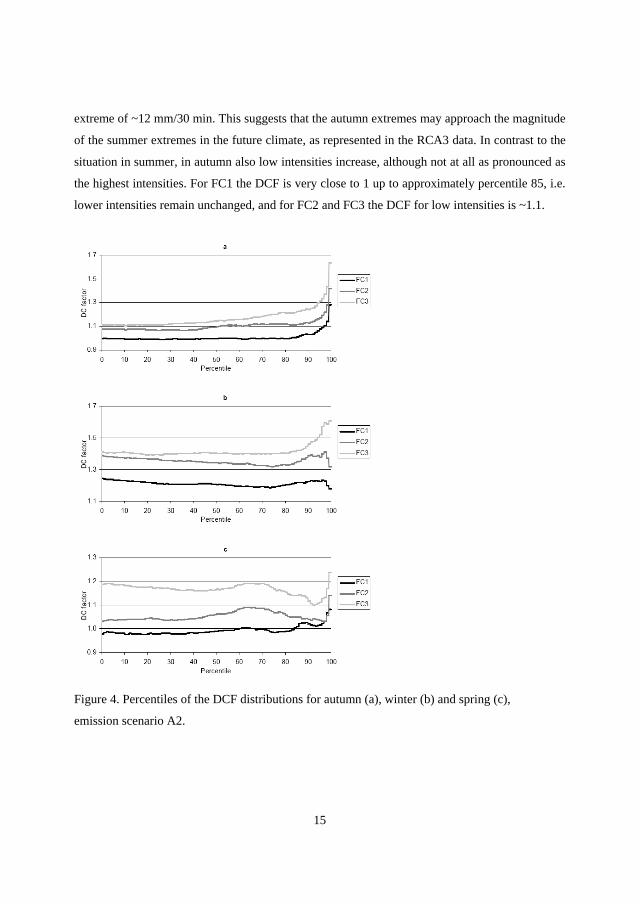
15
extreme of ~12 mm/30 min. This suggests that the autumn extremes may approach the magnitude
of the summer extremes in the future climate, as represented in the RCA3 data. In contrast to the
situation in summer, in autumn also low intensities increase, although not at all as pronounced as
the highest intensities. For FC1 the DCF is very close to 1 up to approximately percentile 85, i.e.
lower intensities remain unchanged, and for FC2 and FC3 the DCF for low intensities is ~1.1.
Figure 4. Percentiles of the DCF distributions for autumn (a), winter (b) and spring (c),
emission scenario A2.
16
For scenario B2 (not shown) the pattern is qualitatively similar to A2, but the increase of both
low and high intensities is not as pronounced as in A2. DCF99 is ~1.2 for both FC1 and FC2, and
1.45 for FC3. The winter DCF distributions (Figure 4b) indicate a similar change of all intensity
levels for both FC1 and FC2, and the pattern is similar for emission scenario B2. The average
DCF over all percentiles, DCF , for FC1 is ~1.2 in both A2 and B2. For FC2, the value of DCF is
1.35 in A2 and 1.28 in B2. For FC3, the highest intensities increase more than the lower ones,
with DCF99 being 1.61 in A2 and 1.51 in B2. The DCFs for lower intensities are 1.3-1.4. The
situation in spring is qualitatively similar to that in winter, with a similar increase over the entire
percentile range. In A2 (Figure 4c), DCF ranges from 1.00 for FC1 to 1.17 for FC3. In B2, DCF
for FC1 and FC3 is ~1.1, whereas for FC2 the value is 1.15. The DCFs for the highest intensities
are fluctuating but still DCF99 exhibits a systematic future increase, from 1.08 to 1.24 in A2 and
from 1.12 to 1.20 in B2.
4 Modification of observed rainfall time series Climate model data are in the form of continuous time series with a fixed time step but high
resolution observations are specified by “tipping times”. Therefore the DC results can not be
directly transferred to the observations. A method to transfer the DC results was developed,
which is described and evaluated for summer precipitation in the following.
4.1 DCF application to observations The DCF distributions for FC1, FC2, FC3 were applied to the observed time series after first
having (1) extracted the summer season data from the entire time series and (2) aggregated the
tipping-bucket recordings into 30-min intensities. From the observed 30-min values, percentiles
of the distribution were calculated. Then, for each 30-min value, its corresponding percentile was
identified and the value multiplied by the corresponding DCF obtained from the distributions
shown in Figure 3.
One issue in the DCF application is the treatment of the lowest intensities, as intensities below
~0.2 mm/30 min were omitted in the DCF calculation (Section 3.1). In the application,
observations below a certain threshold intensity were given the DCF corresponding to percentile
0. This threshold was tuned to obtain a correct change in the total summer rainfall (or,
equivalently, average intensity), in line with the RCA3 results (Table 2). A higher threshold gives
17
a lower summer rainfall total, and vice versa. Generally a threshold value of 0.6 mm/30 min was
suitable, which appears reasonable also because of its relation to the ~0.2 mm/30 min threshold
used for the spatial RCA3 averages, which is approximately consistent with an ARF of ~0.4
(Section 2.2). Even if ARFs are intended for high and extreme intensities, we here assume it is
applicable also in a more general sense to compare point values and spatial averages. It may be
remarked that the exact choice of threshold is not critical, but different values produce almost
equally accurate results.
Finally, the modified 30-min observations were converted back to tipping-bucket data. For each
30-min period, the modification was implemented by changing the volume of the tipping bucket
in accordance with the DCF of the 30-min periods. For example, during a 30-min period with a
DCF of 1.2, the bucket volume was changed to 0.2*1.2=0.24 mm. The final modified tipping-
bucket series thus has the same “tipping times” as the original series, but a variable bucket
volume that reflects the estimated changes of different rainfall intensity levels.
The result is illustrated in Figure 5, for a 1-hour period in the evening of 980607, transformed on
the basis of the results for FC3, emission scenario A2. In the beginning of the period the observed
rainfall is rather intensive, with 6 mm occurring in the period 22:00-22:30. This corresponds to a
DC-factor of 1.16 and a conversion of the tipping-bucket volume to 0.2*1.16=0.232. In the
period 22:30-23:00 the observed rainfall is less intensive, 2.8 mm, which corresponds to a DC-
factor of 0.92 and a bucket volume of 0.184 mm. In the period
23:00-23:30 the observed rainfall, DC-factor and bucket volume are further decreased.

18
Figure 5. A 1-hour period in the tipping-bucket rainfall time series as observed (TC) and after
DC transformation according to the results for FC3, emission scenario A2 (FC3).
4.2 Evaluation To evaluate the effect of the DC method on a very high time resolution, the original and the DC-
transformed tipping-bucket time series were converted into a 5-min resolution. Figure 6a shows
the change of the highest 5-min intensities (32 values, corresponding to intensities equal to or
higher than 3 mm/5 min or equivalently 15 tippings/5 min) for FC3, emission scenario A2. The
highest value, 12 mm/5 min for TC, is transformed to 14.3 mm/5 min, in line with DCF99=1.19
for FC3 (Section 3.2). For lower intensities, the difference decreases. Figure 6b shows the change
of intermediate 5-min intensities, between 2.8 mm/5 min (14 tippings) and 0.6 mm/5 min (3
tippings) for TC. In this figure, the discrete character of the tipping-bucket data is more clear than
in Figure 6a. The transformed data do not exhibit this discrete behaviour. In the application of
DC-factors on a 30-min resolution, a certain observed intensity (expressed as a multiple of 0.2)
was always modified by the same DC-factor. Thus at a 30-min resolution the discrete character
remains. At a higher resolution it however disappears as a certain number of tippings will no
longer correspond to a fixed intensity, but the intensity varies depending on the bucket volume
during the period in question. In Figure 6b it may be seen that the breakpoint between intensities
that are increased and decreased, respectively, in this particular DC application is 1.2 mm/5 min
for TC.
19
Figure 6. Comparison between the highest 5-min intensities (a) and intermediate 5-min
intensities (b) as observed (TC) and after DC transformation according to the results for FC3,
emission scenario A2 (FC3).
In Table 3, the resulting changes of some observed rainfall events are shown (scenario A2), to
illustrate the function of the DCF distribution approach. The event on 920821 lasted for nearly 1
day with a low maximum intensity of only 0.6 mm/5 min and a total volume of 25.2 mm. In the
modified data, the maximum value remains nearly constant for FC1 and FC2, and decreases to
0.46 mm/30 min for FC3. The total volume decreases substantially, by nearly 10 mm for FC3.
The event on 940818 was shorter but more intensive with a maximum intensity of 3 mm/30 min.
In this case the maximum intensity increases systematically, but the total volume remains fairly
constant. The event on 970727 was very short and very intensive. As this event is strongly
dominated by the maximum 5-min intensity (8.8 mm/5 min), the systematic increase of this value
makes also the total volume increase similarly. Finally in Table 3 is shown the properties of the
most intensive rainfall event in the time series, totalling 93 mm in 7 hours on 030729, of which
nearly half of the volume occurred within 30 min. This 30-min intensity is nearly three times

20
higher than the second highest in the data set. The maximum 5-min intensity is 12 mm/5 min,
which gradually increases up to 14.3 mm/5 min for FC3 (corresponding to rank 1 in Figure 6a).
The total volume increases by more than 10 mm from TC to FC3.
Table 3. Properties of selected rainfall events as observed (OBS) and after DC-transformation
according to the results for the different climate perspectives (FC1, FC2, FC3), emission
scenario A2. Variables: duration (Dur; hours), maximum 5-min intensity (Max; mm/5 min)
and total volume (Vol; mm).
5 Urban drainage: an example In this paper the urban drainage simulations will mainly be presented as an overview example of
the type of assessment which can be performed. In general terms, different impacts on the urban
environment can be envisioned due to climate-induced changes in e.g. precipitation, all of which
are not easily measured. Some examples are given in the following.
Low-intensity rainfall events (e.g. 920821) will cause no direct harm in the urban drainage
system, although it is possible that this type of rainfall events may worsen the effect of
following rainfalls. The permeable areas may become saturated, which causes a rapid runoff
as the water will not be able to infiltrate on site.
Short duration and medium-to-high intensity rainfall events (e.g. 940818) may cause
basement floods, surface floods, combined sewer overflow and difficulties in the treatment
facilities (wastewater treatment plant and storm water treatment, e.g. dams).
21
Extreme rainfall events (e.g. 030729) are likely to cause basement floods, surface floods,
combined sewer overflow and difficulties in the treatment facilities. If the rainfall is
combined with thunderstorms and storms which may cause other problems such as electrical
failure, the consequences will be even worse as the pumping facilities in the system and
treatment plants may come to a stop, and thus cause more flooding.
Other impacts, e.g. rising sea level or groundwater level, may cause problems concerning
property drainage and in urban drainage systems as outlets may be below water level. Also
treatment facilities such as infiltration areas may be affected.
The impacts will further be closely related to the specific characteristics of the system and an
urban drainage model is therefore a suitable tool to assess differences in hydraulic response for
different time periods. For this study, Mike Urban/MOUSE has been used. There are several
possible parameters which may reflect the climate impacts in the urban drainage system.
Semadeni-Davies et al. (2005) used e.g. inflow to wastewater treatment plant, inflow of storm
water into combined sewer system, infiltration into sewers and volume of combined sewer
overflow. Olofsson et al. (2007) considered pipe flow ratio and number of floods occurring, as
well as their duration and frequency. There are also parameters which can be used as an indicator
of changes in the system, even though they do not describe real impacts, one such example is the
maximum water levels in different nodes. The parameters that are most suitable to use depend
much on the purpose of the study.
As discussed earlier, the influence of temporal resolution on the assessment studies is of interest
for urban environments. The DC method is here applied on a 30-min time scale. This time step is
however generally considered too large in urban drainage modelling, although it may be
sufficient for estimating changes in long-term volumes, inflows and infiltration rates in different
components of the urban drainage system. To evaluate the accuracy of urban flooding assessment
on this time scale, the Kalmar urban drainage model was run with different rain events from the
observations, converted into 5-min and 30-min time steps, respectively. Results show that the
number of nodes where flooding occurred is about 30% lower with 30-min data for very high

22
intensity rains, e.g. the extreme rain event that occurred 030729. For lower intensity rains the
differences in water levels are smaller. This is of course different for different systems, but the
need for 5-min data depends on how accurate the model and the precipitation data are.
In order to assess changes between the different simulations representing TC and FC3, an urban
drainage simulation was made with original and DC-transformed tipping-bucket data.
The maximum water levels in nodes, Wmax, is used as parameter in the evaluation, which has
been performed as a statistical comparison within matched pairs of experimental material
(nodes). For all nodes, Wmax for TC is compared with Wmax for FC3, to estimate the difference
between the time periods. This procedure is necessary due to the lack of homogeneity between
nodes, which will contribute to the variability of the Wmax measurements and will tend to inflate
the experimental error, thus making a true difference between time periods harder to detect
(Montgomery, 2001). The software used is MiniTab. The results will be presented as confidence
intervals of the differences of maximum level in pairs of nodes, at 95% confidence level. This
procedure allows the differences in the hydraulic response from the input rainfall to become
visible.
For the 920821 event the values for Wmax are marginally higher for TC than FC3 while the
940818 event shows slightly higher values for FC3 (the difference in Wmax is 2-3 cm at a 95%
confidence level). This type of rainfall events will not cause flooding in the city. For the higher
intensity rainfall events (970727 and 030729) the differences in Wmax are more pronounced,
showing substantially higher values for FC3 compared to TC, the difference in Wmax being 14-18
cm and 16-20 cm, respectively. Concerning the impacts on the city, these rainfalls have higher
potential to cause damage in the city due to flooding. There is however a need to look more
closely into detail of which areas in the city that will be affected, and what will be the expected
damage on infrastructure and property. As compared with TC, the number of nodes flooded in the
system (of the 410 nodes in total) during the simulation representing emission scenario A2
increased by 20% for FC1, 33% for FC2 and 45% for FC3. The amount of flooded nodes should
preferably not be used as the only parameter, as it only reflects the number of nodes affected and
not the number of floods in the system. This comparison however still provides relevant
information on the situation in the system for future time periods.

23
The impacts on a specific city are very much depending on the local conditions and must
therefore be investigated with many aspects taken into account, in order to give a basis for a well
performed risk assessment. Future climate impacts will affect the urban drainage systems, and
especially high intensity rainfall events which may cause flooding.
6 Summary and conclusions Five contributions and conclusions from this study are worth highlighting. (1) The RCA3 climate
model 30-min precipitation from the grid box considered overestimates the rainfall volume as
compared with local tipping-bucket observations, mainly owing to an overestimated frequency of
low intensities. Maximum intensities appear reasonably well reproduced, if taking into account
the difference in spatial resolution. (2) A percentile-based version of the Delta Change (DC)
method makes it possible to describe changes of different rainfall intensity levels, and transfer
these to observations. (3) In summer, the highest intensities are expected to increase with 20-30%
until 2100, whereas as low intensities as well as the total volume remain decrease. The pattern is
similar in autumn with an even more pronounced increase of the highest intensities, 50-60%,
whereas in winter and spring all intensity levels increase with approximately the same amount.
(4) The DC results may be transferred to an observed tipping-bucket rainfall time series by
considering the bucket volume as a variable that is changed depending on the 30-min rainfall
intensity. This facilitates the application in urban drainage modelling. (5) The model simulations
for summer in the study area indicated that the maximum water levels in nodes will be about 15-
20 cm higher and the number of nodes flooded 45% more for FC3 than for TC, under emission
scenario A2.
The proposed version of the DC method is envisioned to transfer future intensity changes to
observations in a more realistic way than simpler DC approaches. Even if the “tipping times”
remain unchanged, the internal structure of rainfall events may be modified, e.g. by an increase of
interior maximum intensities and a decrease of the surrounding lower intensities. Further, the
highest and most important intensities are modified by a “tailor-made” DC factor. The 30-min
time step used in the climate model output is a step towards urban scales compared with previous
urban applications of climate model data, but still insufficient for many aspects of urban
24
modelling. One possible solution is to apply some statistical disaggregation method to increase
the temporal resolution.
Another issue concerns the mismatch in spatial scale between the high-resolution observations
(point value) and the low-resolution climate model output (2500 km²). An applications such as
the present one is based on the assumption that future lower-resolution changes in rainfall are
equal or at least similar to the future higher-resolution changes. especially in terms of maxima,
the validity of this assumption depends on the future changes in rainfall generating mechanisms.
Lower-resolution (long-term, large area) maxima are often produced by large frontal-type rainfall
systems, whereas higher-resolution maxima (short-term, point value) are produced by local
convective systems. A key to bridging the scale gap is therefore to analyse separately changes in
the two different precipitation components described in the climate model: large-scale and
convective. These components may be used to build downscaling models, relating grid-box
averages to point observations, and such work is ongoing. The MOUSE modelling demonstrated
the impact of the DC-transformed rainfall on an urban drainage system. As expected in light of
the DC results, the highest impact was found for the highest observed rainfall event. Being a truly
extreme rainfall, the statistical representativity of this event is not well known, which adds
uncertainty to the results. This is one general drawback of the DC approach; that extremely high
observed rainfall intensities may be increased to levels of questionable realism. This risk must
however be weighed against the fact that some overestimation of the effects may be desirable to
have some safety margin of adaptation measures.
Acknowledgements This work was financially supported by FORMAS (Swedish Research Council for Environment,
Agricultural Sciences and Spatial Planning), which is gratefully acknowledged. Many thanks to
Erik Kjellström for providing the RCA3 model data and to Kalmar Vatten AB for permission to
use the urban drainage model.
25
ReferencesAllen, R.J. and DeGaetano, A.T., 2005. Areal reduction factors for two eastern United States
regions with high rain-gauge density. J. Hydrol. Eng., 10:327-335
Andréasson, J., Bergström, S., Carlsson, B., Graham, P. and Lindström, G., 2004.
Hydrological change – climate change impact simulations for Sweden. Ambio, 23:228-234.
Arnbjerg-Nielsen, K., 2006. Significant climate change of extreme rainfall in Denmark. Water
Sci. Technol. 54:1-8.
Bernes C., 2003. A Warmer World. Swedish Environmental Protection Agency and
SWECLIM, Ödeshög, ISBN: 91-620-1229-0, ISSN: 1100-231X.
Carlsson, B., Bergström, S., Andréasson, J. and Hellström, S.-S., 2005. Framtidens
översvämningsrisker (Future flood risks). Reports Hydrology 19, SMHI, Sweden, 69 pp (in
Swedish, with English Abstr.).
Denault, C., Millar, R.G. and Lence, B.J., 2002. Assessment of possible impacts of climate
change in an urban catchment. J. Am. Water Resour. Assoc., 42:685-697.
Grum, M., Jørgensen, A., Johansen, R., and Linde, J., 2006. The effects of climate change on
urban drainage: An evaluation based on regional climate model simulations. Water Sci.
Technol. 54:9-15.
Hay, L.E., Wilby, R.L. and Leavesley, G.H., 2000. A comparison of delta change and
downscaled GCM scenarios for three mountainous basins in the United States. J. Am. Water
Resour. Assoc., 36:397-397.
Hernebring C., 2006. 10-års regnets återkomst förr och nu (Design storms in Sweden then and
now), VA-forsk publ. 2006-04, Svenskt Vatten, Stockholm (in Swedish).
IPCC, 2007. Climate Change 2007: The Physical Science Basis, Summary for Policymakers.
Contribution of Working Group I to the Fourth Assessment Report of the IPCC
Kjellström, E., Bärring, L., Gollvik, S., Hansson, U., Jones, C., Samuelsson, P.,
Rummukainen, M., Ullerstig, A., Willén U. and Wyser, K., 2005. A 140-year simulation of
European climate with the new version of the Rossby Centre regional atmospheric climate
model (RCA3). Reports Meteorology and Climatology 108, SMHI, Sweden, 54 pp.
Montgomery, D.C., 2001. Design and Analysis of Experiments. 5th ed., John Wiley & Sons,
Inc., New York, ISBN 0-471-31649-0.
Nakicenovic, N., Alcamo, J., Davis, G., de Vries, B., Fenhann, J., Gaffin, S., Gregory, K.,
26
Grübler, A., 2000. Special Report on Emissions Scenarios, Working Group III,
Intergovernmental Panel on Climate Change (IPCC). Cambridge University Press,
Cambridge, 595 pp.
NERC, 1975. Flood Studies Report, Volumes I-V. National Environmental Research Council,
London, UK.
Niemcynowicz, J., 1989. Impact of the greenhouse effect on sewerage systems - Lund case
study. Hydrol. Sci. J., 34:651-666.
Olofsson M., Berggren K., Viklander M., and Svensson G., 2007 Hydraulic impacts on urban
draiange systems due to climate change, submitted to Journal of Hydrology
Onof, C., Townend, J., Bogner K., and Kellagher, R.B.B., 2002. Time series and design event
update with climate change. UKWIR Project CL/10, Report SR 607, HR Wallingford, UK.
Pagliara, S., Viti, C., Gozzini, B., Meneguzzo, F. and Crisci, A., 1998. Uncertainties and
trends in extreme rainfall series in Tuscany, Italy: Effects on urban drainage networks design.
Water Sci. Technol. 37:195-202.
Roeckner, E., Arpe, K., Bengtsson, L., Christoph, M., Claussen, M., Dümenil, L., Esch, M.,
Giorgetta, M., Schlese, U. and Schulzweida, U., 1996. The atmospheric general circulation
model ECHAM4: model description and simulation of present-day climate. Report No. 218,
Max-Planck-Institut für Meteorologie, Hamburg.
Schreider, S.Yu., Smith, D.I. and Jakeman, A.J., 2000. Climate change impacts on urban
flooding. Climatic Change, 47:91-115.
Semadeni-Davies, A., Hernebring, C., Svensson, G and Gustafsson, L.-G., 2005. The impacts
of climate change and urbanisation on urban drainage in Helsingborg. Final Report, Dept.
Water Res. Eng., Lund University, Sweden, 45pp.
Waters, D., Watt, W.E., Marsalek, J. and Andreson, B.C., 2003. Adaptation of a storm
drainage system to accommodate increased rainfall resulting from climate chane, J. Env. Plan.
Manag., 46:755-770.

Paper II
Hydraulic impact on urban drainage systems due to climate change
Olofsson M., Berggren K., Viklander M., Svensson G. (2007)
Submitted to ‘Journal of Hydrology’

1
Hydraulic impact on urban drainage systems due to climate change
Mats Olofsson, Karolina Berggren*, Maria Viklander, Gilbert Svensson
Division of Architecture and Infrastructure,
Luleå University of Technology, S-971 87 Luleå, Sweden
Telephone: +46 920 4910 00
Fax: +46 920 49 28 18
*Corresponding author, e-mail: [email protected]
AbstractHydrological changes, particularly heavier precipitation due to an increasing global mean
temperature, will very likely occur in the 21st century. These changes will have a great impact on
urban environments and infrastructures, especially urban drainage systems whose capacities are
closely related to rainfall events. The objective of this paper is to investigate the hydraulic impacts
on an urban drainage network due to climate change. The paper is divided into two steps: (1)
investigating model simulations’ output from different rainfall series by comparing temporal and
spatial resolutions and (2) comparing urban drainage impacts from today and in the future. The
focus is on separate storm water systems, with a city in the south of Sweden being used as a
reference study. Results from urban drainage simulations identify hydraulic impacts in the system,
with help from parameters such as maximum water levels in nodes, pipe flow ratio, duration of
floods, number of floods, and the frequency of floods in the system. In addition, both the ground
level and a critical level below ground (-0,5 m) have been used to indicate the system’s capacity.
The urban drainage model simulations with input rainfall data from three sources (representing
point rainfall with high time resolution, point rainfall with 30 min time step, and climate model data
with high time and spatial resolution) showed that the specific needs for urban hydrology require
high temporal and spatial resolution. This led to the climate model adaptation using a Delta change
method in order to transform the tipping bucket rainfall series to represent future climate situations.
Four time periods have been used in the investigation: today’s climate (TC), near future climate
(FC1: 2011-2040), intermediate future climate (FC2: 2041-2070), and distant future climate (FC3:
2071-2100). The maximum water levels in the nodes were significantly higher for future time
periods compared to today’s, for both climate scenarios A2 and B2. The number of flooded nodes in
today’s climate increases for future time periods (FC1, FC2, FC3) for both scenarios A2 and B2, as

2
does the geographical distribution of floods in the system. The tendency is that future precipitation
will increase both the frequency and the duration of floods. There is an evident need to handle
future situations in urban drainage systems and have a well planned strategy in order to cope with
future conditions. For future considerations, including renewal plans, dividing the system into
security levels/classes, where the critical level below ground will give earlier indications of capacity
failure, might be preferable.
Keywords: urban drainage; climate change; flooding; hydraulic performance

3
1 Introduction The increasing global mean temperature has been a concern for several years, and even more
recently as the last twelve years (1995-2006) featured eleven of the warmest years since 1850
(IPCC, 2007). Hydrological changes, particularly increased numbers of heavy precipitation events,
will very likely occur in the 21st century as a result of higher global mean temperature (IPCC,
2007). This will have great impact on urban environments and infrastructures. The issue of climate
change and urban drainage has previously been emphasized in studies concerning integrated urban
drainage planning (e.g. Ashley et al., 2005; Semadeni-Davies, 2004; Waters et al., 2003;
Niemczynowicz, 1989) concerning flooding and risks (e.g. Evans et al., 2004a,b). One study has
shown that the potential effects of climate change on urban property flooding are likely to be
significant (Ashley et al., 2005). Internationally, there is a growing need to assess the impacts of
climate change and the ability of societies to adapt. The Stern Report (2006), for example, reviews
the economic impact of climate change. In Sweden, a committee initiated by the Swedish
government will present a report this year regarding society’s vulnerability due to climate change
(SOU, 2006).
Technologies for handling urban drainage have been developed over a long period of time, though
design criteria have been relatively constant throughout the major urbanization era. Since the fifties,
urban drainage recommendations have been to separate storm water (rain and snow melting) from
wastewater (from households etc) in the sewer systems (Bäckman, 1985). But, as several cities are
older than this, many urban sewer systems are often partly combined, especially in city centres (e.g.
Butler & Davies, 2004) where it is also more expensive to rebuild and replace pipes. Increased
rainfall intensities will most likely create problems in both types of systems: generally, basement
flooding and sewer overflow (CSO) will occur in the combined system and surface flooding will
occur in the separate storm water system.
There are several approaches to assessing impacts in urban drainage systems due to climate change,
but a common way is to perform model simulations of urban drainage systems (e.g. Semadeni-
Davies et al, 2006; Ashley et al, 2005; Waters et al, 2003), using different models (e.g. Mike
Urban/MOUSE, InfoWorks, SWMM). A problem connected to this approach is the input of rainfall
data, because the translation of climate model rainfall for urban applications/usage can be
problematic as the climate change rainfall data apply to rainfall of low spatial resolution (e.g. 50*50
km), whereas the urban rainfall data apply to point rainfall. Another problem is the climate model’s
description of intensity and extreme weather events, which are not very well reproduced, especially
for the intensities and patterns of heavy rainfall and extreme events (IPCC, 2001). There might also
4
be problems when describing and analysing the results of the urban drainage simulations in terms of
which parameters to use to describe the impacts on the system.
1.1 Objective and scope The objective of this paper is to investigate the hydraulic impacts on an urban drainage network due
to climate change. The paper is divided into two steps: (1) investigating model simulations’ output
from different rainfall series by comparing temporal and spatial resolutions and (2) comparing
urban drainage impacts for four different time periods – today, near future, intermediate future, and
distant future (2100). This investigation will be performed as a case study of a city in the south of
Sweden. The focus of this paper is on separate storm water systems, a system that is also the
common design standard for new systems in Sweden. The principles may still be of use for
combined systems, in a slightly modified manner.
2 Method The method is to describe the technical impacts on urban drainage systems due to climate change
with model simulations of urban drainage systems using climate model data and existing tipping
bucket data.
2.1 Precipitation data Two kinds of precipitation data have been used: existing tipping bucket data and climate model
data.
2.1.1 Measured rainfall data The rainfall measurement from the study area was tipping bucket data with 0.2 mm resolution
summarized in Hernebring (2006). From the total series of data (1991-2004), the time period 1993-
2002 was selected due to an extreme weather event that occurred in 2003. This extreme event
included, for example, a rainfall event corresponding to a return period of 46 years.
2.1.2 Climate model data SMHI (Swedish Meteorological and Hydrological Institute) has provided precipitation data from
the regional atmospheric climate model (RCA3, developed at the Rossby Centre, SMHI (Kjellström
et al., 2005)), originating from the global circulation model ECHAM4 and future scenarios SRES
A2 and B2 (defined by UN IPCC in Nakicenovic et al. (2000)). The scenarios are intermediate (not
extremely high or low) but still give a range of the future changes. Time resolution is 30 minutes,
and spatial resolution is 50x50 km. Climate data from the 50*50 km covering the study area show
that summer precipitation will decrease in the summer but that the intensity will increase.
5
2.1.3 Modified precipitation data Since climate model data has limited temporal and spatial resolution, the Delta change method is
used to transfer climate model data to a rainfall series (similar to a measured rainfall series) for use
in urban drainage models. The tipping bucket rainfall data preserves the time and spatial resolution.
The intensity changes in amplitude according to future changes in climate. The original tipping
bucket rainfall series (Hernebring, 2006) for the study area has been transformed by the Delta
change method described in Olsson et al (2006). Four different rainfall series represent the time
periods: today’s climate (TC: 1971-2000), near future climate (FC1: 2011-2040), intermediate
future climate (FC2: 2041-2070), and distant future climate (FC3: 2071-2100). The change
compared to today’s climate (TC) in each future time period has been transferred via Delta change
to the tipping bucket rainfall data series (Olsson et al., 2006), as exemplified by Figure 1. The
factors of change have been applied directly, which gave a better representation of the highest
intensities than did the fitted polynomials. But, in order to decrease the risk for overestimation, the
high intensity rain in 2003 was removed after the factors had been applied.
Figure 1. 30 min rainfall data, observed series in black and modified by Delta change in grey for
FC3, A2. (Olsson et al., 2006)
2.2 Study area The area of study is a small city in the south of Sweden, which has a population of 3000 and a
contributing catchment area of 54 ha, of which 20 ha is impervious. The urban drainage system has
410 nodes and is separated, thus it contains only storm water. The system is designed according to
the current design standards (Svenskt Vatten, 2004), thus the system should manage rains of at least
a 10 year return period without surface flooding. Since the time of construction, the system has been
degraded and probably repaired and rebuilt as it generally is, but should still manage the design
criteria.

6
2.3 Data model The simulation model of the network is somewhat modified in Mike Urban (DHI, 2005) compared
to the existing system and is used as an example, representing a common storm water system in a
small town. Also, as this paper focuses on comparing the impacts from different time periods, the
starting condition of the system is not highly important. To decrease the data volume for the
simulation time, 120 nodes were selected as representative for the system for result output. The
selection of nodes was based on the following criteria: (1) nodes representing swales were removed
from the result file, (2) nodes with depths less than 1.0 m were removed from the result file, (3) if
there were several nodes close to each other, only a few of them were kept to serve as
representatives for that particular sub area. The system has three outlets, two shown in Figure 4 in
the upper part and one in the lower east part.
2.4 Parameters The following parameters are chosen in order to describe the impacts.
2.4.1 Maximum levels in nodes Maximum water level in nodes is a measure used to describe differences between the time periods.
The measure should be used as an indicator of the system’s capacity, although the measure is
somewhat simplified, as it does not consider whether or not water is exceeding ground levels.
2.4.2 Exceeded levels Levels in the nodes are described as both the ground surface and a critical level which is set at 0.5
m from the ground level. The purpose of two levels of concern is to get a broader view of the water
levels in the system in order to assess the security level in the system. The measure is used to
describe differences between time periods and to describe tendencies. This measure may also be
used in further calculations concerning consequences for the city, e.g. economical losses.
Number of nodes affected – describes in which nodes (and parts of the city) water is exceeding the
ground or critical levels, thus indicating the capacity of the system.
Frequency – describes how often the levels in the nodes are exceeded, and describes which nodes
(and parts of the city) are more often affected by water exceeding ground (or critical) levels.
Duration – describes how long water is exceeding the ground level, indicating the possibility of
damage due to flooding. Time is measured both as the difference in duration within unique flood
events and as a maximum duration for each time period.

7
2.4.3 Pipe flow ratio Pipe flow ratio is the ratio of flow rate (Q) and flow rate full (Qf). It measures the maximum flow
ratio for all time periods and indicates how much the maximum water flow in the pipe system will
increase. This measure may be used as an indicator of the system’s capacity; therefore, it will
identify areas where the possibility of floods and subsequent damage is higher due to high pressure
and water leaking from the pipes.
2.5 Statistical comparisons Statistical analysis of the results has been performed as a comparison within matched pairs of
experimental material (nodes), where the maximum levels in the time periods (TC, FC1, FC2, and
FC3) are compared in the same node to figure out if a difference exists between time periods. This
type of comparison is necessary due to the lack of homogeneity between nodes, which will
contribute to the variability of the maximum level measurements and will tend to inflate the
experimental error, thus making a true difference between time periods (TC, FC1, FC2, and FC3)
harder to detect (Montgomery, 2001). The software used is MiniTab. The results will be presented
as confidence intervals of the differences of maximum level in pairs, at a 95 % confidence level.
There will also be a t-test analysis performed showing if the null hypothesis (there is no difference)
will be rejected in favour of the hypothesis that there is a significant difference between the pairs at
a 95 % confidence level.
3 Results
3.1 Spatial and temporal resolution in precipitation data The main focus for this part is to address differences in urban drainage output results given from
different types of input rainfall data. As the problem is concerned with climate model data and
urban drainage applications, the comparison has been made from the two approaches: temporal and
spatial. The input rainfall data compared is (1) tipping bucket rainfall data (TB), from the local area
presented in Hernebring (2006) collected over 10 years (1993-2002), as a point source rainfall data
series, (2) climate model data (CMD), which is a projection of RCA3 on the local area of study,
described in chapter 2.1, and (3) tipping bucket rainfall data from the original series, which were
aggregated into 30 min time steps (TB30). This concept is also presented in Figure 2. The test
parameter is maximum water levels in nodes, and the analysis has been made as a statistical
comparison within matched pairs of experimental material (nodes) as described in the method.
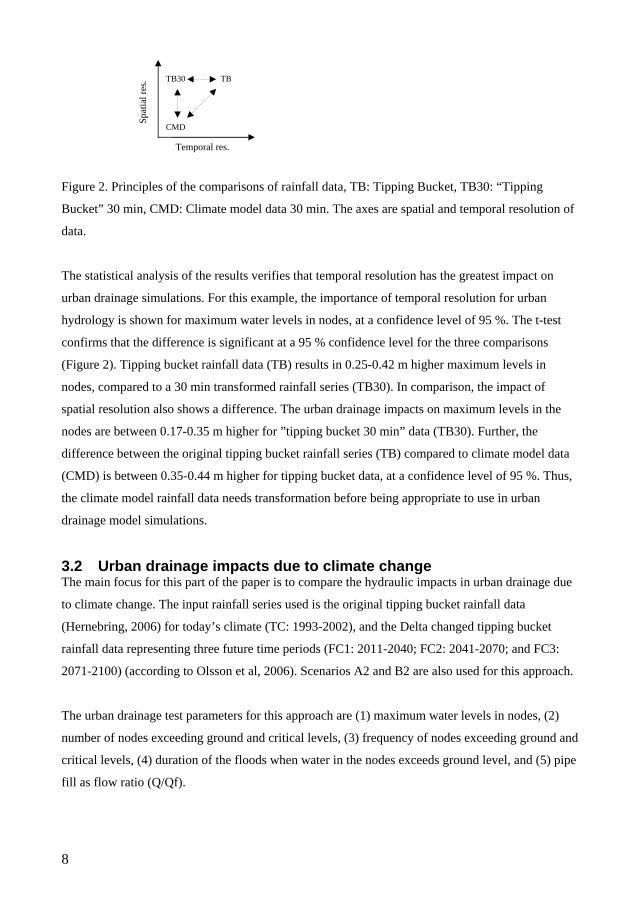
8
Figure 2. Principles of the comparisons of rainfall data, TB: Tipping Bucket, TB30: “Tipping
Bucket” 30 min, CMD: Climate model data 30 min. The axes are spatial and temporal resolution of
data.
The statistical analysis of the results verifies that temporal resolution has the greatest impact on
urban drainage simulations. For this example, the importance of temporal resolution for urban
hydrology is shown for maximum water levels in nodes, at a confidence level of 95 %. The t-test
confirms that the difference is significant at a 95 % confidence level for the three comparisons
(Figure 2). Tipping bucket rainfall data (TB) results in 0.25-0.42 m higher maximum levels in
nodes, compared to a 30 min transformed rainfall series (TB30). In comparison, the impact of
spatial resolution also shows a difference. The urban drainage impacts on maximum levels in the
nodes are between 0.17-0.35 m higher for ”tipping bucket 30 min” data (TB30). Further, the
difference between the original tipping bucket rainfall series (TB) compared to climate model data
(CMD) is between 0.35-0.44 m higher for tipping bucket data, at a confidence level of 95 %. Thus,
the climate model rainfall data needs transformation before being appropriate to use in urban
drainage model simulations.
3.2 Urban drainage impacts due to climate change The main focus for this part of the paper is to compare the hydraulic impacts in urban drainage due
to climate change. The input rainfall series used is the original tipping bucket rainfall data
(Hernebring, 2006) for today’s climate (TC: 1993-2002), and the Delta changed tipping bucket
rainfall data representing three future time periods (FC1: 2011-2040; FC2: 2041-2070; and FC3:
2071-2100) (according to Olsson et al, 2006). Scenarios A2 and B2 are also used for this approach.
The urban drainage test parameters for this approach are (1) maximum water levels in nodes, (2)
number of nodes exceeding ground and critical levels, (3) frequency of nodes exceeding ground and
critical levels, (4) duration of the floods when water in the nodes exceeds ground level, and (5) pipe
fill as flow ratio (Q/Qf).
Temporal res. Sp
atia
l res
. CMD
TB30 TB

9
3.2.1 Maximum water levels in nodes For the comparisons of maximum water levels in nodes, the results show that maximum water
levels in nodes are higher for all the future scenarios (FC1, FC2, and FC3) compared to today’s
(TC) levels, for both scenarios A2 and B2, at a confidence level of 95 %. The t-test also confirms
that there is a statistically significant difference for all the comparisons between time periods, at a
95 % confidence level. The maximum water levels in nodes for the near future time period FC1
compared to today’s climate are between 0,10-0,16 m (A2) or 0,12-0,18 m (B2) higher. Confidence
intervals for the differences are presented in Figure 3. The width of the confidence intervals for both
A2 and B2 is about 0,05m for near future time periods (FC1-TC), increasing up to about 0,12 m for
distant future time periods (FC3-TC).
00,05
0,10,15
0,20,25
0,30,35
0,40,45
0,5
A2 B2 A2 B2 A2 B2
FC1 FC2 FC3Scenarios and time periods
Diff
eren
ce, [
m]
Figure 3. Difference in maximum water levels in nodes, 95% confidence interval for mean
difference between today’s climate (TC) and future time periods (FC1, FC2, FC3).
The t-test also shows that a comparison between scenarios A2 and B2, within the same time period,
is not unambiguous. There is a significant statistical difference between A2 and B2, for the time
period FC3 for maximum water levels in nodes, at a 95 % confidence level. This difference is
hardly visible for time period FC1, and not at all visible for time period FC2.
3.2.2 Pipes and nodes affected by flow and exceeding water levels Flooded nodes and pipe pressure are shown in Figure 4. For TC, floods are occurring mainly in two
places, while, in FC3, floods have spread over a wider area and to other locations as well. The three
circles show where problems will occur in the future time period FC3. Maximum storm water flow
ratio (Q/Qf) in the network has increased considerably between the two time periods. Values for A2
FC3 are similar.
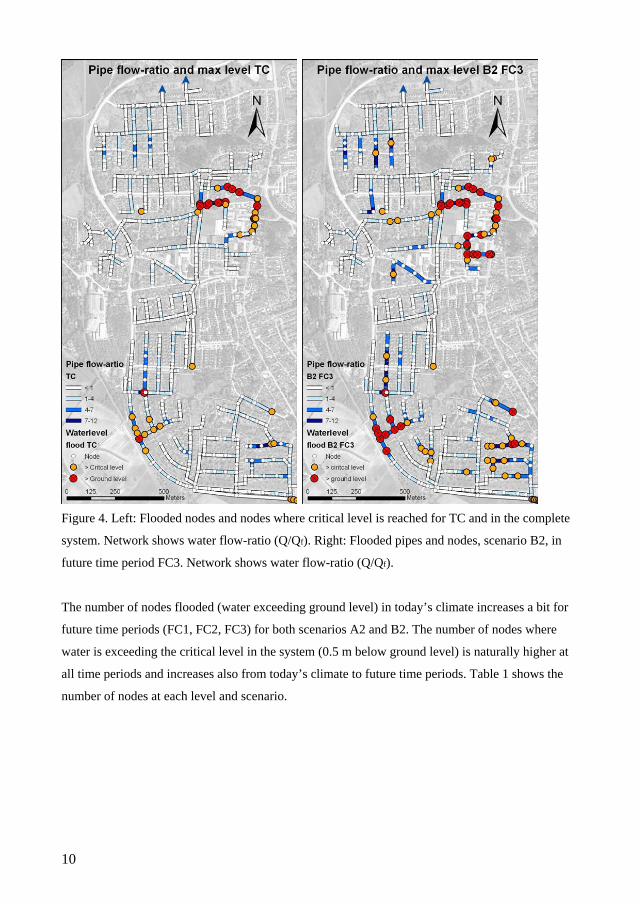
10
Figure 4. Left: Flooded nodes and nodes where critical level is reached for TC and in the complete
system. Network shows water flow-ratio (Q/Qf). Right: Flooded pipes and nodes, scenario B2, in
future time period FC3. Network shows water flow-ratio (Q/Qf).
The number of nodes flooded (water exceeding ground level) in today’s climate increases a bit for
future time periods (FC1, FC2, FC3) for both scenarios A2 and B2. The number of nodes where
water is exceeding the critical level in the system (0.5 m below ground level) is naturally higher at
all time periods and increases also from today’s climate to future time periods. Table 1 shows the
number of nodes at each level and scenario.

11
Table 1. Number of nodes exceeding ground/critical level in the system, comparing
differences between time periods TC, FC1, FC2, FC3.
3.2.3 Frequency Figure 5 shows an increase in affected nodes in all intervals and especially in nodes where one to
two floods occur. The left diagram shows actual flood events, and the diagram to the right describes
the potential flooding events (critical-level exceeding), provided that there are even higher intensity
rainfalls. Since the number of events is limited, only three intervals are given. The overall tendency
is that future precipitation will increase the number of nodes flooded and also the flooding
frequency. There are a few nodes involved in the flooding events for frequencies higher than nine,
both today and for future time periods. Differences in scenario A2 and B2 are negligible, thus only
A2 is presented here.
Figure 5. Frequency of “flooded” nodes, scenario A2. To the left: ground level exceeding, to the
right: critical level exceeding (-0,5 m).
3.2.4 Duration Figure 6 shows an increase in flood duration from today and in the future time periods. This
measure is described from unique flood events, thus no consideration is given to the fact that the
same node may be flooded several times. As for frequency, the left diagram shows duration of real
flood events, while the right diagram presents an indication of the system’s capacity (critical level).
Even though the number of events differs greatly between the diagrams, the tendency of increased
duration is similar. The differences between the two scenarios are negligible, thus only A2 scenario
is presented in the figure.

12
Figure 6. Number of flooding events for different durations, scenario A2. To the left: ground level
exceeding, to the right: critical level exceeding (-0,5 m).
3.2.5 Maximum duration The duration when water is exceeding ground level in the system is also measured as maximum
duration. The node with the highest maximum duration in today’s climate (43 min) will show a
doubled duration for the time period representing distant future climate (FC3: 86 min for A2 and 83
min for B2). For the other time periods (FC1, FC2), the maximum durations are 63 min and 71 min
respectively (for both scenarios A2 and B2). The greatest increase of duration from TC to FC3, for
all the studied nodes, was from 15 min to 108 min/101 min (A2/B2). The analysis consists of 16
nodes, as they are the ones where flooding occurs in FC3. When the maximum duration of the two
scenarios A2 and B2 is compared within the same time period (FC1:A2-FC1:B2, etc), there are no,
or very few (FC3), significant statistical differences between the scenarios, at a confidence level of
95 %, using a t-test analysis.
4 Discussion This paper shows that more urban flooding events are to be expected in the future, a conclusion that
is also in line with the results from IPCC (2007), which point out that more heavy precipitation
events will very likely occur in the 21st century. If this is the case, then there will be a great need to
consider future plans to adapt the system, in order to cope with future conditions. But, is it possible
to meet this development in an appropriate way? The rate of renewing may, however, serve as a
buffer, lessening the consequences if future demands are gradually adapted as well Still, there is a
need to investigate the future demands in order to make the right decisions. The characteristics of a
whole system are indeed very complex, as every part of it is unique. When a new system is being
designed, the rain return period must be considered. However, differences will still occur as the
pipes themselves have certain fixed diameters. Thus, the capacity will be higher at the beginning of
the pipe than at the end (downstream).

13
The number of flooding events in the urban drainage system will increase between today (TC) and
the future time periods (FC1, FC2, FC3), for both scenario A2 and B2. As shown by the results,
there are differences between the time periods and, as expected, the conditions regarding floods (the
number of events, frequency and duration of floods) will also be worse in the distant future
compared to the near future. According to Figure 4, flow ratio in the system is increasing from TC
to FC3, which will cause problems, even if the water does not exceed ground level. Pipes may leak
and fill material may erode, which may undermine and cause damage to streets and houses. This
will lead to economical consequences for both real estate and network owners.
The hydraulic parameters (maximum water levels in nodes, flooded pipes and nodes, exceeded
critical levels in nodes, pipe fill, frequency, and duration) have been chosen in order to describe
impacts due to climate change in urban drainage systems. The advantages of these parameters are
their fast hydraulic response and their presenting of the system’s capacity in a simple manner. This
approach addresses hydraulic impacts directly and the parameters found in the literature that can be
compared are peak discharge /flows (Waters et al., 2003) and the number of properties flooded
(Ashley et al., 2005). Other parameters found in literature but not included in this paper are runoff
volume (Waters et al, 2003), time to peak discharge (Waters et al, 2003), inflow to WWTP
(Semadeni-Davies, 2004) and combined sewer overflow (Niemczynowicz, 1989; Semadeni-Davies
et al, 2006).
The parameters describing flooding are a good indicator of urban drainage problems due to climate
change, as they can point out areas where the capacity of the system is exceeded, both in pipes and
in nodes (e.g. ground level or a predefined critical level below ground). Apart from describing the
dynamics of a sewer system, the hydraulic parameters might also serve as input for economical
calculations that describe potential losses for both network owners and property owners in a more
detailed way. If the critical level (below ground level) is used as a parameter, the security level of
the system will be estimated.
A scenario of the future involves a lot of uncertainties, and these should also be considered, if
possible, when presenting data that have consequences for the future. However, uncertainties are
not easily described or calculated, but may, on the other hand, be included as the basic data are
produced from two future scenarios (A2, B2), which are both intermediate. The two scenarios make
it possible to present the results as an interval. Still, future results may differ from these
calculations, especially as the climate model data in general do not describe extreme events very
14
well. These extreme events (e.g. rainfall during thunderstorms) may, in the future, cause the most
damage.
Further research within this project contains analysis of the kinds of consequences that higher
water levels, changed snowmelt patterns, increased maximum flow, and higher seasonal variations
will have not only on the urban drainage system but also for other infrastructures.
5 Conclusions The number of flooded nodes as well as the geographical distribution of the floods increases during
the future time periods (FC1, FC2, FC3) for both scenarios A2 and B2. The tendency is that future
precipitation will increase both the flooding frequency and the duration of floods; therefore, the
need to handle future situations in urban drainage systems and to have a well planned strategy to
cope with future conditions is evident.
In this study, three areas within the system will mainly be affected in the future: where resources
should be allocated, if one takes into account secondary effects that the system might show
downstream. For future considerations and for renewal plans, dividing the system into security
levels/classes, where the critical level below ground will give earlier indications of capacity failure,
might be preferable.
Finally, the results from this paper also indicate the need of climate model rainfall data
dissagregation or transformation in both temporal and spatial resolution, in order to be appropriate
for use in urban drainage model simulations.
6 Acknowledgement This work was financially supported by FORMAS (Swedish Research Council for Environment,
Agricultural Sciences and Spatial Planning), which is gratefully acknowledged.
15
7 References Ashley, R.M., Balmforth, D.J., Saul, A.J. and Blanksby, J.D., 2005. Flooding in the future –
predicting climate change, risks and responses in urban areas, Water. Sci. Technol. 55 5, pp. 265-
273, IWA publishing 2005
Butler, D., and Davies, J. W., 2004. Urban Drainage, 2nd ed, London and New York, 543pp.
Bäckman, H., 1985. Infiltration/Inflow in Separate Sewer Systems, Chalmers University of
Technology, Doctoral thesis no 6., Göteborg 1985
DHI, 2005. DHI Software 2005, DHI Water & Environment AB
Evans, E., Ashley R., Hall, J., Penning-Rowsell, E., Saul, A., Sayers, P., Thorne, C., and
Watkinson, A., 2004a,b. Foresight. Future Flooding. Scientific Summary: Volume 1 – Future risks
and their drivers. Volume 2 – Managing future risks. Office of Science and Technology, London
Hernebring, C., 2006. 10-års regnets återkomst förr och nu [Design storms in Sweden then and
now], VA-forsk publ. 2006-04. [In Swedish]
IPCC, 2001. Climate Change 2001: The Scientific Basis. Contribution of Working Group I to the
Third Assessment Report of the IPCC
IPCC, 2007. Climate Change 2007: The Physical Science Basis, Summary for Policymakers,
Contribution of Working Group I to the Fourth Assessment Report of the IPCC
Kjellström, E., Bärring, L., Gollvik, S., Hansson, U., Jones, C., Samuelsson, P., Rummukainen, M.,
Ullerstig, A., Willén U. and Wyser, K., 2005. A 140-year simulation of European climate with the
new version of the Rossby Centre regional atmospheric climate model (RCA3). Reports
Meteorology and Climatology 108, SMHI, SE-60176 Norrköping, Sweden, pp. 54.
Montgomery, D. C., 2001. Design and Analysis of Experiments, 5th ed, ISBN 0-471-31649-0
Nakicenovic, N. et al., 2000. IPCC Special Report on Emissions Scenarios, IPCC, Cambridge
University Press, Cambridge.
Niemczynowicz, J., 1989. Impact of the greenhouse effect on sewerage systems: Lund case study,
Hydrolog. Sci J. 34 6, pp. 651-666
Olsson, J., Olofsson M., Berggren K., Viklander M., 2006. Adaptation of RCA3 climate model data
for the specific needs of urban hydrology simulations, In conference proceedings: Extreme
Precipitation, Multisource Data Measurement and Uncertainty : at the 7th International workshop
on precipitation in urban areas, StMoritz, Schweiz, pp. 144-148
Semadeni-Davies, A., 2004. Urban water management vs. climate change: impacts on cold region
waste water inflows, Climatic Change 64, pp. 103-126
Semadeni-Davies, A., Hernebring, C., Svensson, G and Gustafsson, L.-G., 2006. The impacts of
climate change and urbanisation on urban drainage in Helsingborg. Final Report, Dept. Water Res.
Eng., Lund University, Sweden.

16
SOU 2006. Översvämningshot - Risker och åtgärder för Mälaren, Hjälmaren och Vänern, SOU
2006:94. [In Swedish]
Stern, N., 2007. The Economics of Climate Change - The Stern Review, Cambridge : Cambridge
University Press, pp. 692
Svenskt Vatten, 2004. Dimensionering av allmänna avloppsledningar P90, ISSN: 1651-4947 [In
Swedish]
Waters, D., Watt, W.E, Marsalek, J. and Anderson, B.C., 2003. Adaptation of a Storm Drainage
System to Accommodate Increased Rainfall Resulting from Climate Change, J. Environ. Planning
Manage., Vol. 46, No 5, pp.755-770

Paper III
Impacts on urban water systems due to climate change
Berggren K., Viklander M., Svensson G. (2007)
Submitted to ‘Climatic Change’

1
Impacts on Urban Water Systems due to Climate Change
Karolina Berggren*, Maria Viklander, Gilbert Svensson
Division of Architecture and Infrastructure, Luleå University of Technology, S-971 87 Luleå, Sweden
Telephone: +46 920 49 10 00 Fax: +46 920 49 28 18
*Corresponding author, e-mail: [email protected]
Abstract
As the global mean temperature has increased during the last 100 years, the hydrological cycle has also changed (Intergovernmental Panel on Climate Change, IPCC, 2007) as, for example, more intense rainfall events have occurred. These changes will have an impact not only on urban drainage but also on the whole urban water system, creating problems in the cities. This paper aims to describe the impacts from a holistic approach, holding the different parts of the urban water system in mind, as the system as a whole will also be considered. The overall objective of this paper is to increase the knowledge about how urban water systems may respond to future climate change. The study is divided in three parts, each one contributing to the impact assessment: (1) climate parameters, (2) urban water system relationships, and (3) a description of impacts and consequences for the system. The results may be used as a knowledge base for further investigations and risk assessments for local applications.

2
1 Introduction
The global mean temperature has increased by 0,7 °C (±0,2°) during the last 100 years according to the Intergovernmental Panel on Climate Change (IPCC, 2007); consequently, the hydrological cycle has also changed with, for example, more intense rainfall events occurring. Technologies and infrastructures for urban drainage systems have been developed over a long period of time, though design criteria have been relatively constant throughout the major urbanisation era. As a consequence, changes in climatic conditions, such as increasing rain intensities, changing snowmelt patterns, and increasingly more extreme weather events, such as thunderstorms, will most likely create problems in cities. And when considering the whole urban water system, one has even more aspects to consider, e.g. if the impacts in the city (such as flooding) might affect receiving waters and, thus, also might affect the sources of drinking water.
Internationally, there has been a growing need to assess the impacts of climate change and the ability of societies to adapt. The Stern Report (2006), for example, reviews the economic impact of climate change, and several countries have done or are in process of doing investigations regarding their societies’ vulnerability due to climate change. The water-related research in this field has been focused on climate-change impacts on water resources and water use (Boland, 1997; Bou-Zeid & El-Fadel, 2002), impacts related to large-scale catchment areas/basins, areas often containing several cities (Andreasson et al, 2004; Dettinger et al, 2004; Stewart et al, 2004), and on flooding (Schreider et al, 2000, Evans et al, 2003a; 2003b). During the last years, more focus has been put on urban drainage, e.g. integrated urban drainage planning (Niemczynowicz, 1989; Waters et al, 2003; Semadeni-Davies, 2003; 2004; Semadeni-Davies et al, 2006, Blanksby et al, 2005), problems concerning the use of precipitation from climate models (Grum et al, 2005; Olsson et al, 2007), strategic issues about adaptation (Blanksby et al, 2003; Van Luijtelaar et al, 2005), and risk assessment for urban drainage systems (Ashley et al, 2005; Blanksby et al, 2005). In addition to the different aspects of potential consequences, there is also a need to address the issue from a whole systems approach, i.e. holistic, because different parts of the urban water system might also affect each other and these results might cause other consequences further down in the system.
This paper presents the climate impacts from the point of view of keeping the whole urban water system in mind and suggests a method of doing so. Although the approach in this paper lies on a general level, addressing the impacts on a smaller scale in the same manner may be possible.

3
2 Aim
The overall objective of this paper is to increase the knowledge about how urban water systems may respond to a future climate change. The study is divided in three parts, each one contributing to the impact assessment. First, climate factors that may affect the urban water system will be identified; second, the relationship between the different parts in the urban water system will be illustrated. Then, the impacts on and consequences for the system will be presented. These three parts will contribute to the holistic approach to the problem.
Delimitations The focus will be on problems arising within cities and urban areas, and impacts in the large-scale catchments around a city are only briefly considered. However, some of the results and conclusions may be applied to larger catchments as well.
The ‘holistic approach’ will involve technical and environmental aspects, and the urban water system will be considered as a whole where the different parts will affect each other as well as be affected by climate factors. The main focus will be on urban drainage, although the other parts will also be included in the assessment.
The geographical area studied in order to delimit the differences in climate changes is limited to the northern hemisphere, more specifically Europe and North America.
3 Method
3.1 Climate parameters An identification of the parameters that most likely have an impact on urban water systems has been performed from the climate parameters currently observed by the IPCC (2007). The identification has been performed based on whether the climate parameters have a direct or secondary impact on urban water systems, using questions leading to a selection based upon characteristics of the parameters. The questions are:
Is the parameter related to water? (yes/no) If no: Does the parameter affect water? (yes/no) If yes on any of the questions: Is there a clear connection to urban environments? (yes/no) If yes on any of the previous questions: What is the type of impact this parameter will have on urban water systems? (direct/secondary)
Some of the parameters have also been put aside if their characteristics are more of an impact than of a parameter, if the parameter is not directly valid for the urban focus, and/or if the parameter is not directly valid for the geographical area of study.
3.2 Urban water systemThe diagram or picture produced to describe relationships within the urban water system is somewhat similar to the relationship diagrams often used for quality improvement of industrial processes and the principles of the diagrams are presented, for example, in Mizuno (1988) and Bergman and Klefsjö (1995). The relationship of water in the urban environment is reproduced from a basic knowledge of the system, design standards of systems, and literature (e.g. Butler and Davies, 2004). The urban water system is presented, having the receiving water in the centre of the diagram, thus the diagram will show how the different

4
parts of the urban water system are related. This illustration (Figure 1) will allow a more holistic view of the urban water system, simplifying the impact assessment.
3.3. Impacts vs Consequences In order to investigate where, and what type of, problems due to climate change may occur in the urban water system, the climate parameters (identified earlier) will be added as a sort of input to the urban water system diagram. For each of the climate parameters, the “point of contact” to urban water has been identified. Then, smaller groups of study lines will be identified for the urban water system, according to whether the impact may be direct or secondary. The groups will be used to simplify the organisation of the impacts.
The majority of the direct impacts will become easily visible, and some of the secondary impacts will be visible as well via the relationship diagram. In some cases, there is literature supporting the impacts; in other cases, the impacts are very common but are not described in detail in the literature found by the authors.
Establishing the cause of the impacts - i.e. climate parameters and the impacts/consequences - follows the principle of cause-effect relationships (e.g. described by Christensen et al., 2003). However, there will be no description or estimation of the probability for the events, as both a more detailed level of study and a study area are needed for that purpose. The principle for this approach will also be described in Figure 2. Impacts in/on the urban water systems may lead to a consequence in the system or in the city and are closely related to the exceeding of threshold levels.
The impacts in the urban water system will be presented as isolated events or as a problem chain of events that may occur. These impacts will then be summarised and described in relation to the consequences that may occur. Examples of threshold levels in the system will also be presented.
4 Result and discussion
4.1 Climate parameters affecting urban water systems Climate research from various parts of the world is summarized by the Intergovernmental Panel of Climate Change (IPCC), a summary that includes observations, historical data, and modelled results. The global climate models are based on scenarios of the future development in the world and can consist of three dimensions: atmosphere, land surface, and ocean, and the general circulation models (GCM) describe the function within the systems (Hadley Centre, 2006). Problems due to the fact that local climate often is greatly influenced by local features such as mountains can be handled via regional climate models/projections with a higher resolution and constructed for limited areas. For example, in the north of Europe, regional projections are done by the Rossby Centre at the Swedish Meteorological and Hydrological Institute (Kjellström et al, 2005). Temperature is often well reproduced by climate models; however, precipitation is more difficult to reproduce, especially for the intensities and patterns of heavy rainfall that are heavily affected by the local scale (IPCC, 2007).
When discussing climate change, keeping in mind the difference between climate and weather is also important. The weather is a description of temperature and other properties of the atmosphere, at a given point in time and place, while climate can be seen as a summary of the weather for a particular area (Bernes, 2003). In the continuation of the paper, the word

5
‘climate’ will be used, although the impacts in the urban water system will be caused by the weather, not the climate.
A summary of climate parameters observed by the IPCC (2007):Temperature (mean, min/max, land/ocean, stratosphere/troposphere) Precipitation (amount, intensity, frequency, and type of precipitation) EvapotranspirationSoil moisture DroughtRunoff and river discharge Atmosphere: water vapour, clouds, radiation Atmospheric circulation: surface or sea level pressure, geopotential height, winds and the jet stream, storm tracks, winds, waves, and surface fluxes The monsoons Extreme events Snow: snow cover, duration, and quantity River and lake ice: freeze-up and break-up dates Sea ice: extent and concentration, thickness, ice motion Glaciers and ice caps Frozen ground: permafrost, seasonally frozen ground Oceans: heat content, salinity, ocean circulation, biogeochemical changes Sea level changes
From this list, a few climate parameters have been chosen to represent the possible influence of climate on urban water in the form of weather. Table 1 lists the parameters, of which the direct impacts are chosen for the impact assessment.
Table 1. Climate parameters affecting urban water systems, directly or secondary. Direct Secondary Temperature Temperature Precipitation Evapotranspiration Sea level changes Soil moisture
The temperature is the driving force for changes in the climate, but for urban water, the driving force is precipitation parameters, thus more focus will be laid on these. The climate parameters that are especially likely to have an impact on urban water are changes related to the precipitation and the sea level. Other climate parameters could also affect the urban water systems, but these two are more likely to give direct impacts. Extreme weather events can be included in all parameters, depending on their frequency and magnitude and will most definitely affect urban water systems, but they have not been considered in this paper because they are not easily foreseen and defined in frequency and magnitude and because they are often related to several of the parameters at the same time, e.g. storms and precipitation.
The parameters that have not been chosen either are somewhat included in Table 1 as snow, radiation, and drought, for example, or fall outside the focus area of urban environment (river discharge, ice and oceans parameters) or geographical area (monsoons).

6
Table 2 presents a summary of the IPCC (2007) findings concerning the chosen climate parameters, both observed changes and modelled results, for temperature, precipitation, sea level, and also extreme weather events.
Table 2. Summary of the changes that are observed and those that might occur in the future, according to IPCC (2007), focusing on Europe and North America. Climate factor Changes, observed and modelled from IPCC (2007) Temperature The global mean surface temperature has risen by 0,74°C ± 0,18°C
over the last 100 years (1906-2005). It is very likely that the warming will continue in the 21st century, and warming for the northern hemisphere is likely to be above the global mean. In Europe and North America, the largest warming is likely to be in the Mediterranean and in the southwest (North America) in the summer, and in the northern parts during the winter.
Amount The changes in precipitation amount differ from area to area; in general, dry areas will become drier (e.g. Mediterranean) and wet areas wetter (e.g. north Europe).
Intensity In general, the intensity will increase, as the hydrological cycle intensifies due to increased temperature.
Frequency Return-periods of rainfall events regarded as extreme today may occur more frequently.
Precipitation
Type Duration of snow season and snow depth is likely or very likely to decrease in most of Europe and North America, except for the northernmost part of Canada where snow depth is likely to increase.
Sea level The global average sea level rose during the 20th century, more rapidly during the last decade (1993-2003), and will continue to rise in the 21st century. Thermal expansion of the ocean and loss of mass from glaciers and ice caps has contributed to the sea level rise. The sea level rise was not geographically uniform in the past and will not be that in the future either.
Extreme weather events
Increases in the number of heat waves, heavy precipitation events, and total area affected by drought have been observed. Changes in storms (frequency, intensity etc) and small-scale severe weather phenomena have not been easy to estimate, due to e.g. the close relation to natural variations and insufficient studies and measurements.
4.2 Urban water systemThe urban water systems are somewhat complex, even though the design criteria are relatively straightforward. Problems in connection with the urban water system can arise from different causes (not including weather phenomenon), and can include the following:
The system design, the life length of different components in the system can differ a lot, and storm and wastewater pipes especially in old parts of a city centre can be very old. The design criteria and also urbanisation have probably changed a bit since the first pipes were placed in the ground, which might decrease the margin for unexpected events, e.g. heavy precipitation. These factors should also be kept in mind when addressing future situations.

7
Cross-connections in the pipe system (storm, waste water, and drainage pipes) can be a problem due to a large variety of substances in the system (treatment will be more difficult), and the damage to property these substances and water flows can cause.
Damage, roots, and sediments in pipes decrease the flow capacity of the pipes (storm, wastewater, and drainage pipes), which can cause damage to the infrastructure and property due to flooding. For drinking water systems, for example, damage and sediments can deteriorate the drinking water quality and cause health problems for consumers in the city.
Infiltration into sewers via cracks and interstices, for example, decreases the flow capacity of the system, both combined and separated, as the base flow increases. Infiltration can also affect the treatment processes.
Exfiltration of water from the pipes into the surrounding soil, which can be caused from high pressures in the pipe system, due to e.g. heavy rainfall events and flooding. This may cause erosion of soil materials, and undermining of roads.
Pollutants and nutrients, whose origin can be urban activities, industries, and farming, can cause problems in treatment processes and in the receiving waters, which also might affect drinking water sources.
These problems can be summarised as technical and environmental and they can also be intensified due to climate change, and more intense rainfall events.
The urban water system consists of drinking water, storm water, wastewater, and drainage water. The origin of drinking water is surface and/or ground water, which often are the receiving waters for storm water, wastewater, and drainage water (not necessarily from the same city or municipality, but from upstream sometimes). Thus, the receiving water has been placed in the middle of the Figure 1. As water is passing through the system, it passes through several steps. For storm water, if it travels through a separated system, the water goes straight to the receiving water or (optimally) passes through some treatment facilities, often called best management practices (BMPs), e.g. ponds, swales, biological filters, or infiltration. If storm water and wastewater are transported in the same system, combined, the water often passes through a wastewater treatment plant (WTP). Wastewater in a separated system (not containing storm water) is only briefly considered in this paper, and it will not be so obvious in Figure 1 either. Drainage from properties, roofs, and roads, for example, is often directed to the nearest watercourse (receiving water) or it will be connected to the same system as wastewater and/or storm water. Infiltration of ground water or soil water into sewers might also be a problem in some systems, due to the capacity decrease. If the system (wastewater, and storm water) becomes overloaded, there will be some overflow from the system (often referred to combined sewer overflow or CSO). Then, untreated water will be transported directly to the receiving water.

8
Figure 1. An overview of the urban water system, including drinking water, storm water, wastewater, and drainage, with the receiving water in the centre.
4.3 Impacts vs Consequences
4.3.1 Framework Christensen et al (2003) describes a cause-effect relationship as the bridge between the cause complex and the consequence/effect complex. In this paper, this relationship is applied in two steps: first, the climate parameters that are the drivers of changes (impacts) in the urban water system may, secondly, cause consequences in the system and in the city, if the threshold levels are exceeded. The specific framework for this paper is described in Figure 2.
Figure 2. The framework used to investigate climate change impacts on urban water systems and to determine whether these will cause consequences or not.
Threshold levels The threshold levels are not so easy to set up and describe, especially if they relates to the environment and if the measurement possibilities are limited. Different aspects can be involved in the procedure of defining threshold levels, and Jones (2001) has summarised examples of thresholds that are closely connected to climate change impact assessments (not only water related), focusing on socio-economic aspects. For this paper, the focus will be on technical and environmental aspects related to urban water systems. If the threshold value is exceeded, (yes) a consequence is inevitable; if not, (no) the consequence is not occurring (Figure 2). The principal threshold levels used for this paper are presented as examples:
Water levels in the system (e.g. ground level, basement) Flow capacity of the system Infiltration capacity Treatment, particularly the demand of chemicals and energy for the processes Quality standards for storm water and wastewater let out to receiving waters, quality standards for drinking water to consumers, and also quality of the receiving water. Quantity, related to the demand for drinking water by a city compared to the available resources.Recommended distance in from a watercourse, both area and height.
Climate factor
Urban water impact
Exceededthreshold level?
Consequenceyes
no
DRINKING WATER
DRAINAGE
STORM WATER
WASTEWATER
Surface water
Ground water
Combined sewer system
CSOs
WTP
Property drainage
RECEIVING WATER
BMPs
Precipitation: rain and snow
Infiltration into sewers

9
There is a need for more specific threshold levels when addressing a local situation, as these are of a more general nature.
ConsequencesA consequences can be described as something that follows as an effect or result from something preceding (Oxford, 2005). Consequences can also be divided into subgroups according to the type: technical, economical, socio-cultural, environmental, and health and also according to the persons and organisations affected. In this paper, the focus will be on technical and environmental aspects and there is no distinction made of who might be affected. Examples of consequences are presented here:
Technical: Damage to pipes, facilities, pump stations, infrastructure, land (erosion and landslides), and property, for example, that affects the system, the city, and its inhabitants. Environmental: Spread of pollutants, nutrients, and hazardous substances in the water, soil, and/or air that affect the ecosystems and species. Economical: cost of damage, cost of treatment of a polluted environment, and secondary costs, e.g. if people are hindered from doing their job due to infrastructure failure (roads, railways, internet, etc).Socio-cultural: In the city/municipality/country, some areas might be more affected by damage and pollution than others, and if these are areas where poor people settle, then a class or social distinction will exist in that society. Health: people become sick or are injured or killed by the damage and the polluted environment.
4.3.2 Impact assessment The impact assessment starts with the chosen parameters: precipitation, sea level, and temperature. As precipitation (rain and snow) is included in Figure 1 and is also the main driving force for the system, then this parameter should clearly have an impact on the system, especially if there is a change in the future precipitation.
4.3.2.1 Precipitation From the relationship diagram (Figure 1), impact lines (further referred to as groups) have been identified and also divided into their type of impact - direct or secondary - in Figure 3. Direct impacts are supposed to occur in the groups directly connected to the precipitation event/box, and secondary impacts as a second step in the line (the main names: storm water, wastewater, drainage, and drinking water are overlooked). All the lines/groups end in the receiving water, except for drinking water. The groups of direct impact are marked in grey and dark blue colour, and the groups of secondary impacts in light blue and brown colour. Some of the groups interact, and then the secondary impact marking has been the one shown in the diagram. Infiltration into sewers and receiving water is part of all the groups and is, therefore, left out from the marking, as is precipitation.

10
Figure 3. The groups marked as Group I: grey, Group II: dark blue, Group III: brown, Group IV: light blue. If the groups interact, the secondary impact marking has been shown in the diagram (brown and light blue). Infiltration into sewers and receiving water is part of all the groups and has been left out from the marking, as is precipitation.
Direct impacts: Group I (grey): Storm water, BMPs, combined sewer system, CSOs, WTPs, (infiltration into sewers)Group II (dark blue): Drinking water, surface water, ground water
Secondary impacts:Group III (brown): Wastewater, infiltration into sewers, WTPs Group IV (light blue): Drainage
Example: Increased intensity Storm water For the storm water system (group I), increased intensity of rainfall will affect the system and can cause hydraulic overload because of capacity shortages. It is likely that the design standards for heavy rainfall events might not be enough, and observed results presented by IPCC (2007) show that the number of heavy precipitation events has indeed increased (concerning the daily precipitation). Hydraulic overload may result in flooding, and Ashley et al (2005), for example, showed calculations of increased property flooding in the UK. Niemczynowicz (1989) also earlier pointed out the flooding problem for the sewerage network, whereas Olofsson et al (2007) showed the possibility of increased flooding frequency and duration. During heavy rainfall events, there will be a wash of urban areas, which will cause high pollutant loads in the first flush of storm water. During floods, pollutants might also spread from industrial areas, ending up in the receiving waters.
Due to an increase in rainfall intensity, there will be an increased volume of storm water runoff and larger peak flows in the storm water system (Waters et al, 2003). Heavy rainfall events may also cause an increased inflow to the sewer system, both directly and through infiltration into pipes, an increased amount of overflow from the system (e.g. CSO), and an inflow to the WTP (Niemczynowicz, 1989; Semadeni-Davies et al, 2006). Higher inflows to the WTP may affect the treatment processes, for example, by a higher chemical demand and energy demand (due to pumping demands). An increase in the amount of transported nutrients, particles, and metals to the receiving waters might increase during heavy rainfall events as runoff from urban areas increases (Niemczynowicz, 1989; Semadeni-Davies et al, 2006).
DRINKING WATER
DRAINAGE
STORM WATER
WASTEWATER
Surface water
Ground water
Combined sewer system
CSOs
WTP
Property drainage
RECEIVING WATER
BMPs
Precipitation: rain and snow
Infiltration into sewers

11
During heavy rainfall events, problems might also occur in the storm water treatment (BMPs), especially ponds where there might be sediment losses due to increased and rapid inflow to the pond. This problem may be hindered if there are appropriate bypass facilities, but there might still be an increased pollutant load to the receiving waters.
Drinking water The surface water and groundwater are the source for drinking water (group II). Compared to ground water, surface water is more directly affected by, for example, runoff from farming, forests, and urban areas; pollutants spreading during the flooding of industrial and polluted areas; and also the increased temperature. Still, the ground water will also be affected by a changing climate. And once groundwater is polluted, restoring its quality will be more difficult and take more effort.
The amount of pollutants entering the drinking water may increase, especially if industrial areas are affected by flooding. Another aspect is the drinking water protection area, which needs to be appropriately designed for future possible events, e.g. large-scale flooding in the catchment or landslides. An increase in colour and organic acid concentration in surface water has been shown by Hongve et al (2004), as a result of increased precipitation.
Wastewater The wastewater group (III) might be affected by increased intensity rainfall events; for example, an increased amount of water infiltrating into sewers (Niemczynowicz, 1989; Semadeni-Davies et al, 2006) will affect the treatment processes at the WTP, causing, for example, a higher demand of chemicals and energy (e.g. for pumping).
DrainageDrainage systems (group IV) might also be affected by an increase of rainfall intensity. The impact might be direct or secondary, depending on how and where the precipitation is entering the system. If roof drainages are connected to the combined sewers (or the separated waste water system), there might be property flooding during heavy rainfall events as the capacity to drain away all water instantly might not be enough. Therefore, it is recommended to have roof drainage systems connected to the storm water system or not connected to a pipe system at all, unless there is no backflow protection, e.g. pumping facilities. The drainage system might also not be directly connected to the precipitation event, i.e. water will enter the system as a secondary event from infiltration. Then, the impacts of flow in the pipes will be more evened out.
Example: Increased amount Storm water If the amount of precipitation increases, the flow volumes in the system will also increase. The pollutant load will be more diluted both into the BMPs for storm water and the WTP, but this might also affect the treatment processes and demand of energy (for pumping etc). Permeable areas in the city may easily become soaked, thus causing increased and/or rapid runoff at these events. Rapid runoff may cause hydraulic overload in the system. An increased precipitation amount can also lead to higher ground water levels, thus decreasing the capacity of the BMPs and WTP (when infiltration is a part of the process) and increasing the amount of water infiltrating into the sewers. More water infiltrating into the pipes decreases the capacity, thus hydraulic overload and flooding may occur.
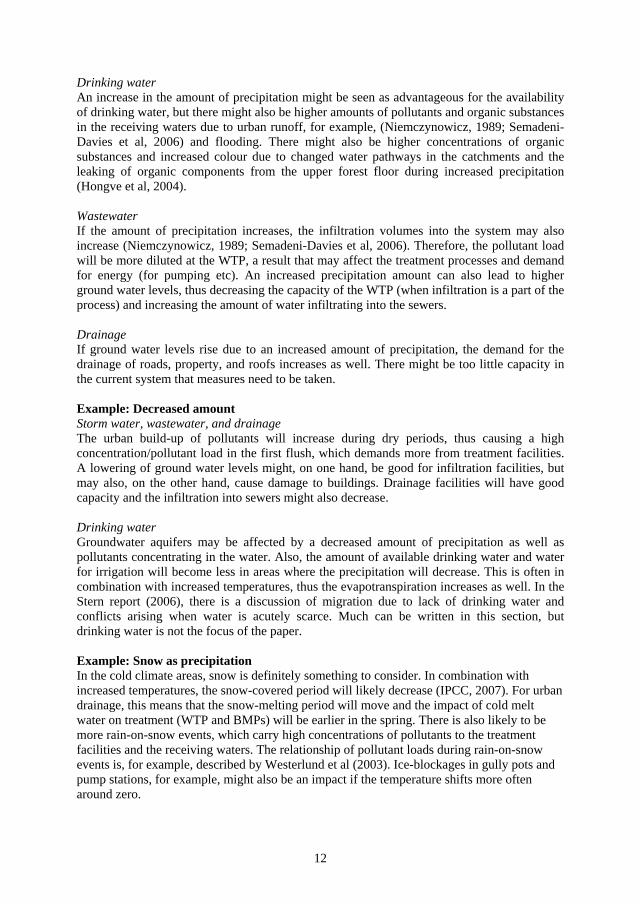
12
Drinking water An increase in the amount of precipitation might be seen as advantageous for the availability of drinking water, but there might also be higher amounts of pollutants and organic substances in the receiving waters due to urban runoff, for example, (Niemczynowicz, 1989; Semadeni-Davies et al, 2006) and flooding. There might also be higher concentrations of organic substances and increased colour due to changed water pathways in the catchments and the leaking of organic components from the upper forest floor during increased precipitation (Hongve et al, 2004).
Wastewater If the amount of precipitation increases, the infiltration volumes into the system may also increase (Niemczynowicz, 1989; Semadeni-Davies et al, 2006). Therefore, the pollutant load will be more diluted at the WTP, a result that may affect the treatment processes and demand for energy (for pumping etc). An increased precipitation amount can also lead to higher ground water levels, thus decreasing the capacity of the WTP (when infiltration is a part of the process) and increasing the amount of water infiltrating into the sewers.
DrainageIf ground water levels rise due to an increased amount of precipitation, the demand for the drainage of roads, property, and roofs increases as well. There might be too little capacity in the current system that measures need to be taken.
Example: Decreased amount Storm water, wastewater, and drainage The urban build-up of pollutants will increase during dry periods, thus causing a high concentration/pollutant load in the first flush, which demands more from treatment facilities. A lowering of ground water levels might, on one hand, be good for infiltration facilities, but may also, on the other hand, cause damage to buildings. Drainage facilities will have good capacity and the infiltration into sewers might also decrease.
Drinking water Groundwater aquifers may be affected by a decreased amount of precipitation as well as pollutants concentrating in the water. Also, the amount of available drinking water and water for irrigation will become less in areas where the precipitation will decrease. This is often in combination with increased temperatures, thus the evapotranspiration increases as well. In the Stern report (2006), there is a discussion of migration due to lack of drinking water and conflicts arising when water is acutely scarce. Much can be written in this section, but drinking water is not the focus of the paper.
Example: Snow as precipitation In the cold climate areas, snow is definitely something to consider. In combination with increased temperatures, the snow-covered period will likely decrease (IPCC, 2007). For urban drainage, this means that the snow-melting period will move and the impact of cold melt water on treatment (WTP and BMPs) will be earlier in the spring. There is also likely to be more rain-on-snow events, which carry high concentrations of pollutants to the treatment facilities and the receiving waters. The relationship of pollutant loads during rain-on-snow events is, for example, described by Westerlund et al (2003). Ice-blockages in gully pots and pump stations, for example, might also be an impact if the temperature shifts more often around zero.
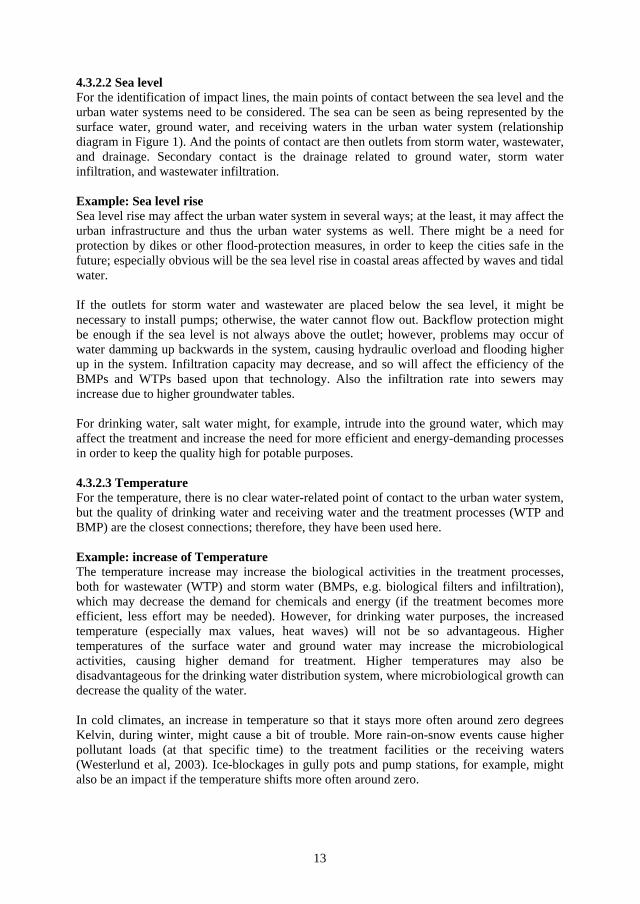
13
4.3.2.2 Sea level For the identification of impact lines, the main points of contact between the sea level and the urban water systems need to be considered. The sea can be seen as being represented by the surface water, ground water, and receiving waters in the urban water system (relationship diagram in Figure 1). And the points of contact are then outlets from storm water, wastewater, and drainage. Secondary contact is the drainage related to ground water, storm water infiltration, and wastewater infiltration.
Example: Sea level rise Sea level rise may affect the urban water system in several ways; at the least, it may affect the urban infrastructure and thus the urban water systems as well. There might be a need for protection by dikes or other flood-protection measures, in order to keep the cities safe in the future; especially obvious will be the sea level rise in coastal areas affected by waves and tidal water.
If the outlets for storm water and wastewater are placed below the sea level, it might be necessary to install pumps; otherwise, the water cannot flow out. Backflow protection might be enough if the sea level is not always above the outlet; however, problems may occur of water damming up backwards in the system, causing hydraulic overload and flooding higher up in the system. Infiltration capacity may decrease, and so will affect the efficiency of the BMPs and WTPs based upon that technology. Also the infiltration rate into sewers may increase due to higher groundwater tables.
For drinking water, salt water might, for example, intrude into the ground water, which may affect the treatment and increase the need for more efficient and energy-demanding processes in order to keep the quality high for potable purposes.
4.3.2.3 Temperature For the temperature, there is no clear water-related point of contact to the urban water system, but the quality of drinking water and receiving water and the treatment processes (WTP and BMP) are the closest connections; therefore, they have been used here.
Example: increase of Temperature The temperature increase may increase the biological activities in the treatment processes, both for wastewater (WTP) and storm water (BMPs, e.g. biological filters and infiltration), which may decrease the demand for chemicals and energy (if the treatment becomes more efficient, less effort may be needed). However, for drinking water purposes, the increased temperature (especially max values, heat waves) will not be so advantageous. Higher temperatures of the surface water and ground water may increase the microbiological activities, causing higher demand for treatment. Higher temperatures may also be disadvantageous for the drinking water distribution system, where microbiological growth can decrease the quality of the water.
In cold climates, an increase in temperature so that it stays more often around zero degrees Kelvin, during winter, might cause a bit of trouble. More rain-on-snow events cause higher pollutant loads (at that specific time) to the treatment facilities or the receiving waters (Westerlund et al, 2003). Ice-blockages in gully pots and pump stations, for example, might also be an impact if the temperature shifts more often around zero.
14
5 Conclusions
The climate factors that have an impact on urban water systems are direct impacts - temperature, precipitation and sea level, and secondary impacts - temperature (once again), evapotranspiration, and soil moisture.
The relationship diagram has been used to illustrate the water relationships for the urban area. Precipitation is set as the driver of the system and the receiving waters as the centre point.
The precipitation will have an impact on urban water systems, directly on storm water (separated and combined system) and drinking water, and secondarily on wastewater and drainage. Increased intensity and amount of precipitation may, for example, cause increased flow volumes in the system and will also likely introduce hazardous substances into the receiving waters, which might have an impact on the drinking water resources. In other areas, decreased amounts of precipitation may, for example, cause high pollutant loads in storm water during rainfall, due to urban build up and also cause severe problems connected to drinking water. The type of precipitation is also important, especially if there is an increase in the amount of rain-on-snow events, which have high pollutant loads.
The sea level’s points of contact with the urban water system are mainly outlets from storm water, wastewater, and drainage as well as drainage related to ground water, storm water infiltration, and wastewater infiltration. The rise of the sea level will cause problems such as the increasing need for facilities to protect the city (e.g. dikes), and the fact that salt water intrusions may affect the quality of drinking water.
For temperature, there is no clear point of contact to the urban water system, but it can be related to the quality of drinking water and receiving water and to the treatment processes (WTP and BMP). Impacts due to increased temperature, for example, are an increase in the biological activities, which might be advantageous for storm water and wastewater treatment, but could be disadvantageous for the drinking water quality, both for treatment and for the distribution of water to consumers.
It is possible to consider the impacts on urban water systems, due to climate change, with the whole system in mind, especially if the system alternates between the whole and parts of the system, for example, by identifying direct impact study lines from precipitation to the receiving water. The knowledge gained from this study can be used as a base document before starting a risk- assessment investigation on a specific site/city. In those kinds of studies, it is possible to take into account site-specific parameters and the existing urban water system.
AcknowledgementsThis work was financially supported by FORMAS (Swedish Research Council for Environment, Agricultural Sciences and Spatial Planning), which is gratefully acknowledged.
15
References
Andreasson J., Bergström S., Carlsson B., Graham L.P., Lindstrom G. (2004). Hydrological change – Climate change impact simulations for Sweden, Ambio 33(4-5): pp 228-234
Ashley R.M., Balmforth D.J., Saul A.J. and Blanksby J.D. (2005). Flooding in the future – predicting climate change, risks and responses in urban areas, Water Science and Technology, Vol 55(5) pp 265-273, IWA publishing 2005
Bernes C., (2003). A Warmer World, Swedish Environmental Protection Agency and SMHI (SWECLIM), Ödeshög, ISBN: 91-620-1229-0, ISSN: 1100-231X
Blanksby J., Saul A., Ashley R., Cashman A., Poole T. and Melling D. (2005). Framework for Water and Flood Risk Management in the City of Bradford, In: Proceedings of the 10th
International Conference on Urban Drainage, Copenhagen, Denmark, 21-26 August, 2005.
Boland J.J. (1997). Assessing urban water use and the role of water conservation measures under climate uncertainty, Climatic Change 37(1), pp 157-176
Bou-Zeid E., and El-Fadel M. (2002). Climate Change and Water Resources in Lebanon and the Middle East, Journal of Water Resources Planning and Management. 128 (5), pp. 343-355
Butler D., and Davies J. W., (2004). Urban Drainage, 2nd ed, London and New York, ISBN 0-415-30607-8
Dettinger M.D., Cayan D.R., Meyer M., Jeton A.E. (2004). Simulated hydrologic responses to climate variations and change in the Merced, Carson, and American River basins, Sierra Nevada, California, 1900-2099, Climatic Change 62(1-3), pp 283-317
EU (1997) BS EN 752-2: Drain and sewer systems outside buildings. Performance requirements,
Evans E., Ashley R., Hall J., Penning-Rowsell E., Saul A., Sayers P., Thorne C., and Watkinson A. (2004a). Foresight. Future Flooding. Scientific Summary: Volume 1 – Future risks and their drivers. Office of Science and Technology, London
Evans E., Ashley R., Hall J., Penning-Rowsell E., Sayers P., Thorne C., and Watkinson A. (2004b). Foresight. Future Flooding. Scientific Summary: Volume 2 – Managing future risks. Office of Science and Technology, London
Grum M., Jørgensen A.T., Johansen R.M. and Linde J.J. (2005). The effect of climate change on urban drainage: An evaluation based on regional climate model simulations, 10th
International Conference on Urban Drainage, Copenhagen/Denmark, 21-26 August 2005 IPCC (2007). Climate Change 2007: The Physical Science Basis. Edited by: Solomon S., Qin
D., Manning M., Marquis M., Averyt K., Tignor M., Leroy Miller H., Chen Z. Contribution of Working Group I to the Fourth Assessment Report of the Intergovernmental Panel on Climate Change (IPCC),
Kjellström, E., Bärring, L., Gollvik, S., Hansson, U., Jones, C., Samuelsson, P., Rummukainen, M., Ullerstig, A., Willén U. and Wyser, K., (2005). A 140-year simulation of European climate with the new version of the Rossby Centre regional atmospheric climate model (RCA3). Reports Meteorology and Climatology 108, SMHI, SE-60176 Norrköping, Sweden, 54 pp.
Mizuno, S., ed. (1988). Management for Quality Improvement: The 7 New QC Tools,Productivity Press, Inc., Cambridge MA.
Niemczynowicz, J., (1989). Impact of the greenhouse effect on sewerage systems – Lund case study, Hydrological Sciences – Journal – des Sciences Hydrologiques, Vol. 34, Nr . 6, pp. 651-666
Olsson, J., Olofsson M., Berggren K., Viklander M. (2006). Adaptation of RCA3 climate model data for the specific needs of urban hydrology simulations, In conference
16
proceedings: Extreme Precipitation, Multisource Data Measurement and Uncertainty : at the 7th International workshop on precipitation in urban areas, 7-10 December, StMoritz, Schweiz
Oxford (2005) English Dictionary Schreider S.YU., Smith D.I. and Jakeman A.J. (2000). Climate Change Impacts on Urban
Flooding, Climatic Change, 47, pp 91-115 Semadeni-Davies A. (2003). Response surfaces for climate change impact assessments in
urban areas, Water Science and Technology, 48(9), pp 165-175, IWA publishingSemadeni-Davies A. (2004). Urban water management vs. climate change: impacts on cold
region waste water inflows, Climatic Change, Vol. 64, pp. 103-126 Semadeni-Davies, A., Hernebring, C., Svensson, G and Gustafsson, L.-G., (2006). The
impacts of climate change and urbanisation on urban drainage in Helsingborg. Final Report, Dept. Water Res. Eng., Lund University, Sweden.
Stern N. (2007). The Economics of Climate Change - The Stern Review, Cambridge: Cambridge University Press, 2007
Stewart I.T., Cayan D.R., Dettinger M.D. (2004). Changes in snowmelt runoff timing in western North America under a ‘business as usual’ climate change scenario, Climatic Change 62 (1-3), pp 217-232
Waters D., Watt W.E, Marsalek J. and Anderson B.C. (2003). Adaptation of a Storm Drainage System to Accommodate Increased Rainfall Resulting from Climate Change, Journal of Environmental Planning and Management, Vol. 46, No 5, pp.755-770
Hadley Centre, (2006). http://www.metoffice.com/research/hadleycentre/models/modeltypes.html, (June 2006)
Westerlund C., Viklander M., Bäckström M. (2003). Seasonal variations in road runoff quality in Luleå, Sweden, Water Science and Technology, vol 48, No. 9, pp 93-101
Paper IV
Tools for Measuring Climate Change Impacts on Urban Drainage Systems
Berggren K., Olofsson M., Viklander M., Svensson G. (2007)
In: proceedings of the 6th NOVATECH International conference: ‘Sustainable Techniques and Strategies in Urban Water Management’, Lyon, France, 24-28 June, 2007


NOVATECH'2007 1
Tools for Measuring Climate Change Impacts on Urban Drainage Systems Les outils de mesure des effets du changement climatique sur les systèmes d'assainissement pluvial urbain
Berggren K.1, Olofsson M. 1, Viklander M. 1, Svensson G. 1
Luleå University of Technology, SE-971 87 Luleå, [email protected]; [email protected]; [email protected]; [email protected]
RESUMELe changement climatique, par exemple des événements pluvieux plus intenses, aura un effet sur les systèmes d’assainissement pluvial urbain et causera des problèmes dans les grands centres municipaux. Il y a un besoin de mieux comprendre et évaluer les effets et les conséquences; donc une stratégie et les outils possibles sont suggérés dans cet article. Les outils recommandés sont les Simulations d’assainissement Pluvial Urbain, un Rapport de Sûreté, et un Système d’Information Géographique (SIG). Puisque les effets des changements climatiques sur les systèmes d’assainissement pluvial urbain concernent plusieurs domaines, l’évaluation devra être effectuée en coopération avec, par exemple des experts en assainissement pluvial urbain, en changement climatique, des praticiens, des politiciens, etc.
ABSTRACT Climate change, e.g. more intense rainfall events, will affect urban drainage systems, and cause problems in cities. There is a need to understand and assess these impacts and consequences better; therefore, a strategy and possible tools are suggested in this paper. The recommended tools are Urban Drainage Simulations, Risk Analysis, and Geographic Information Systems (GIS). Since the impacts of climate change on urban drainage concerns several different disciplines, the assessment should be performed in cooperation with, e.g. urban drainage experts, climate change experts, practitioners, politicians, etc.
KEYWORDS Climate Change; GIS ; Risk analysis ; Urban Drainage; Vulnerability;;;

2 NOVATECH'2007
1 INTRODUCTION The global mean temperature has increased during the last hundred years according to IPCC (2001), consequently changing the hydrological cycle. In recent years we have seen weather considered by many as “extreme weather events”, but what will be the consequences if these events occur more often in the future? Technologies for urban drainage have been developed over a long period of time, though design criteria have been relatively constant throughout the major urbanisation era. As a consequence, changes in climatic conditions, such as increasing rain intensities and changing snowmelt patterns, and more extreme weather events, such as thunderstorms, will most likely create problems in cities. The issue of climate change and urban drainage has previously been emphasised in studies concerning integrated urban drainage planning (e.g. Semadeni-Davies et al., 2006; 2004; Ashley et al., 2005; Waters et al., 2003) and on climate change and urban water considering flooding and risks (e.g. Evans et al., 2004). A study from the UK has shown, for example, that the potential effects of climate change on urban property flooding are likely to be significant (Ashley et al., 2005). According to an investigation by the Swedish Meteorological and Hydrological Institute (SMHI) in 2004/2005, very few Swedish sectors had strategies for adaptation to climate change, and among those measures already taken, the majority were adaptations to the existing climate and not the future (Rummukainen et al., 2005). Some things have happened since then, e.g. the establishment of a national group of experts in drinking water supply and leadership during crisis (VAKA, started in 2005) and a vulnerability investigation was set up by the Swedish government, which recently presented part time results regarding the vulnerability of society due to climate change (SOU, 2006). Still, there is a need for more knowledge to successfully adapt society. For the area of urban drainage, there is also a need for better and updated tools and strategies to assess the impacts and to feasibly adapt the system. For this reason, the aim of the study is to investigate the possible impacts concerning urban drainage systems and future climate change, and in more detail, to find and recommend a strategy and tools that can be used for this purpose.
2 METHOD This work has been carried out as a literature study together with simulations using an urban drainage model (Mike Urban/MOUSE by DHI), as well as discussions with representatives from different disciplines, e.g. Water and Wastewater engineers, in order to develop a useful strategy for climate change impact studies in urban areas.
3 RESULTS The strategy to investigate the climate change impact on urban drainage has for this research project been designed as shown in Figure 1, where the boxes marked with bolder lines are the main focus for this particular study and the other boxes represent the overall approach. SMHI has provided precipitation data from the regional atmospheric climate model (RCA3, developed at the Rossby Centre, SMHI (Kjellström et al., 2005)), originating from the global circulation model ECHAM4 and future scenarios SRES A2 and B2 (defined by UN IPCC in Nakicenovic et al. (2000)), which are intermediate (not extremely high or low). These results have been used for local climate projections for the municipality of Kalmar, southern Sweden, and further transferred from areal to point rainfall via the Delta Change method, previously used in the urban environment by, e.g., Semadeni-Davies et al. (2006), and later improved and adjusted for this particular study by Olsson et al. (2006). The point rainfall data
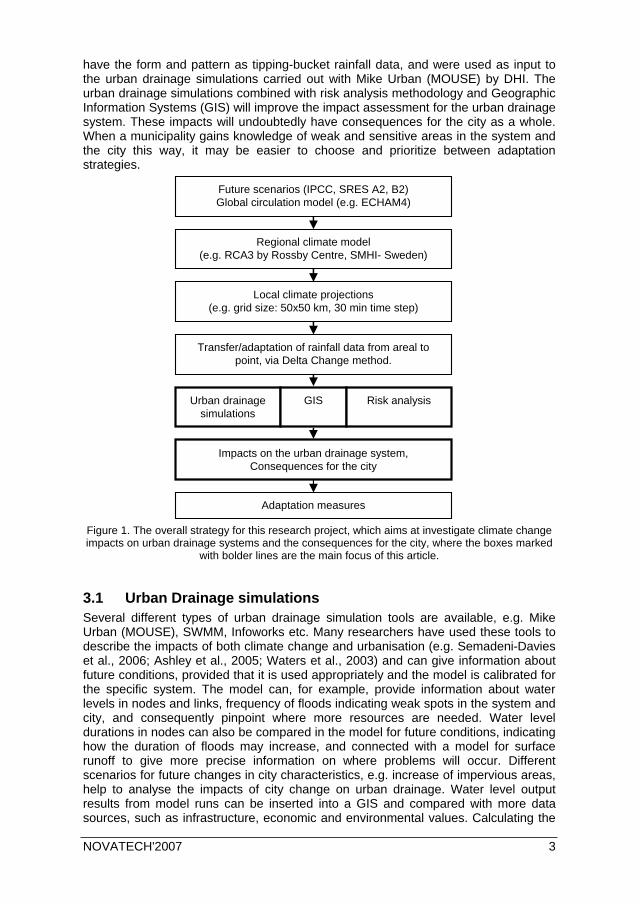
NOVATECH'2007 3
have the form and pattern as tipping-bucket rainfall data, and were used as input to the urban drainage simulations carried out with Mike Urban (MOUSE) by DHI. The urban drainage simulations combined with risk analysis methodology and Geographic Information Systems (GIS) will improve the impact assessment for the urban drainage system. These impacts will undoubtedly have consequences for the city as a whole. When a municipality gains knowledge of weak and sensitive areas in the system and the city this way, it may be easier to choose and prioritize between adaptation strategies.
Figure 1. The overall strategy for this research project, which aims at investigate climate change impacts on urban drainage systems and the consequences for the city, where the boxes marked
with bolder lines are the main focus of this article.
3.1 Urban Drainage simulations Several different types of urban drainage simulation tools are available, e.g. Mike Urban (MOUSE), SWMM, Infoworks etc. Many researchers have used these tools to describe the impacts of both climate change and urbanisation (e.g. Semadeni-Davies et al., 2006; Ashley et al., 2005; Waters et al., 2003) and can give information about future conditions, provided that it is used appropriately and the model is calibrated for the specific system. The model can, for example, provide information about water levels in nodes and links, frequency of floods indicating weak spots in the system and city, and consequently pinpoint where more resources are needed. Water level durations in nodes can also be compared in the model for future conditions, indicating how the duration of floods may increase, and connected with a model for surface runoff to give more precise information on where problems will occur. Different scenarios for future changes in city characteristics, e.g. increase of impervious areas, help to analyse the impacts of city change on urban drainage. Water level output results from model runs can be inserted into a GIS and compared with more data sources, such as infrastructure, economic and environmental values. Calculating the
Future scenarios (IPCC, SRES A2, B2) Global circulation model (e.g. ECHAM4)
Regional climate model (e.g. RCA3 by Rossby Centre, SMHI- Sweden)
Local climate projections (e.g. grid size: 50x50 km, 30 min time step)
Transfer/adaptation of rainfall data from areal to point, via Delta Change method.
Urban drainage simulations
Impacts on the urban drainage system, Consequences for the city
GIS Risk analysis
Adaptation measures
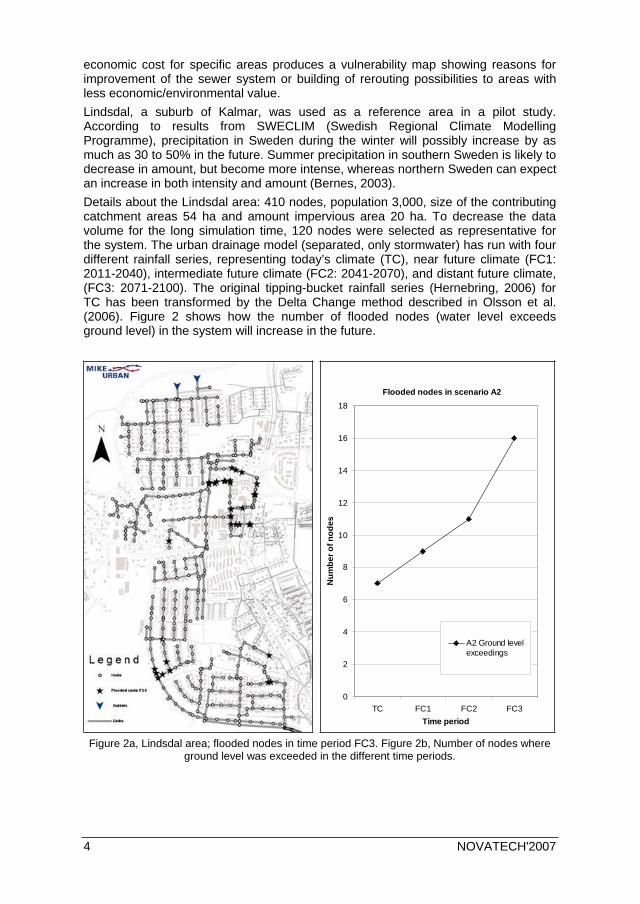
4 NOVATECH'2007
economic cost for specific areas produces a vulnerability map showing reasons for improvement of the sewer system or building of rerouting possibilities to areas with less economic/environmental value. Lindsdal, a suburb of Kalmar, was used as a reference area in a pilot study. According to results from SWECLIM (Swedish Regional Climate Modelling Programme), precipitation in Sweden during the winter will possibly increase by as much as 30 to 50% in the future. Summer precipitation in southern Sweden is likely to decrease in amount, but become more intense, whereas northern Sweden can expect an increase in both intensity and amount (Bernes, 2003). Details about the Lindsdal area: 410 nodes, population 3,000, size of the contributing catchment areas 54 ha and amount impervious area 20 ha. To decrease the data volume for the long simulation time, 120 nodes were selected as representative for the system. The urban drainage model (separated, only stormwater) has run with four different rainfall series, representing today’s climate (TC), near future climate (FC1: 2011-2040), intermediate future climate (FC2: 2041-2070), and distant future climate, (FC3: 2071-2100). The original tipping-bucket rainfall series (Hernebring, 2006) for TC has been transformed by the Delta Change method described in Olsson et al. (2006). Figure 2 shows how the number of flooded nodes (water level exceeds ground level) in the system will increase in the future.
Flooded nodes in scenario A2
0
2
4
6
8
10
12
14
16
18
TC FC1 FC2 FC3Time period
Num
ber o
f nod
es
A2 Ground levelexceedings
Figure 2a, Lindsdal area; flooded nodes in time period FC3. Figure 2b, Number of nodes where ground level was exceeded in the different time periods.
NOVATECH'2007 5
3.2 Risk Analysis A definition is needed whenever speaking about risks, as the word has been used in the literature to mean either probability of danger or the hazard itself (SCOPE, 1980). Christensen et al. (2003) summarised the most important risk definitions (including material from, e.g. EU, UN/OECD, US-EPA and ISO guidelines) and the actions taken to assess risk. Risks can easily be presented by answering three questions: 1) What can happen? 2) How likely is it to happen? 3) If it happens, what are the consequences? (e.g. Ljungquist, 2005), which may also be presented as a cause-effect relationship (Christensen et al., 2003). Hauger et al. (2003) suggest that the concept of vulnerability should be used with the concept of hazard in an urban drainage risk assessment approach. Hazard assessment can be, e.g. frequency of extreme weather events; vulnerability assessment is more site specific and can be, e.g. the amount of damage to a specific house due to flooding. There are several methods for risk analysis, and what to use depending on, e.g. the detail requirements, the objectives of the study, and the available resources. At the beginning of a project, it is recommended to start with a rough methodology to gain an overview. Both qualitative and quantitative methods are included in most risk analysis. A weakness in using deterministic or probabilistic methods, where the deterministic approach is based on consequences (worst-case scenario etc) and can be easy to conduct and communicate, is that problems can arise if there is no probability check, such as too many resources can be laid on events that are very unlikely to occur, etc. The probabilistic approach is based on risk, and uses both probability and consequences, but its drawback is the resource demand and the uncertainty connected to probability estimation (Davidsson, 2003). Future precipitation in Sweden will increase in intensity and in amount (especially in the north) (Bernes, 2003), which inevitably will impact urban drainage systems and cities. Table 1 summarises examples of possible impacts in different parts of an urban drainage system due to high intensity rain events (as a cause-effect relation, where the risk source is the intense rainfall). However, this is not a complete summary and should only indicate the possible impacts in different parts of the system. There is also of course a need to make this table more detailed for the specific place of study, since the local conditions are very important and should preferably be performed in cooperation with both climate and urban drainage experts and those working more practically with the system, e.g. in a municipality. Local conditions can be highlighted for a large amount of people, which could be a good way to start working with any type of question requiring development and improvements of the organisation, infrastructure, etc. These types of studies may also gain a better understanding if used as a complement to other tools in a GIS.
Combined system If the sewer system has too low a capacity, the water level in the system can cause basements to be flooded Increased amount of combined sewer overflow (CSO), which can cause environmental problems concerning the receiving waters and also jeopardize the drinking water sources If the ground water level rises because of a higher amount of precipitation, more ground water will infiltrate into the pipes, and thus decrease the capacity of the system
WWTP(combined system)
At a wastewater treatment plant, during times of high flows, dosages of chemicals for the processes can become unnecessarily high Increased amount of urban polluted runoff can reach to the treatment plant, which will cause more pollutants, e.g. heavy metals, in the sludge.
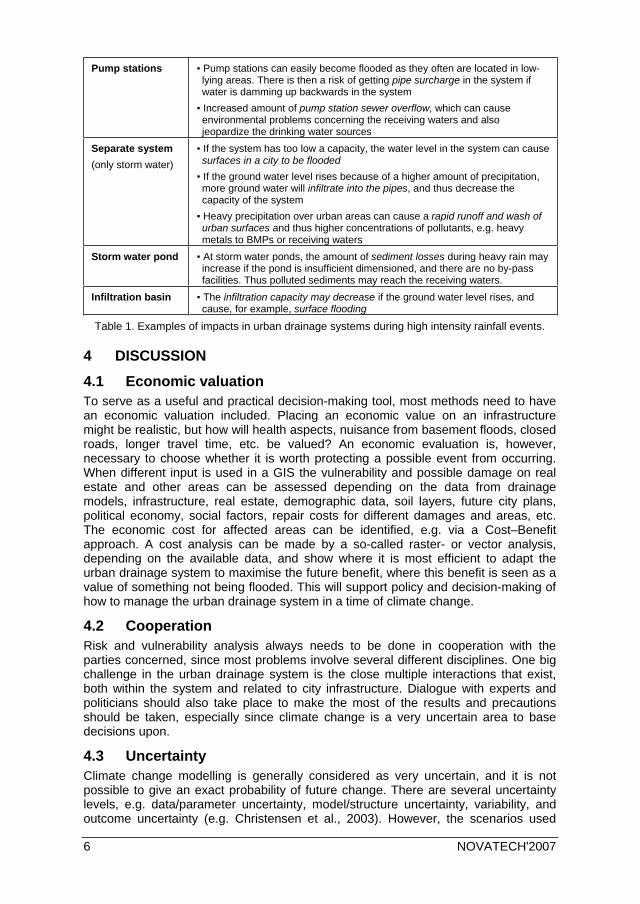
6 NOVATECH'2007
Pump stations Pump stations can easily become flooded as they often are located in low-lying areas. There is then a risk of getting pipe surcharge in the system if water is damming up backwards in the system Increased amount of pump station sewer overflow, which can cause environmental problems concerning the receiving waters and also jeopardize the drinking water sources
Separate system (only storm water)
If the system has too low a capacity, the water level in the system can cause surfaces in a city to be flooded If the ground water level rises because of a higher amount of precipitation, more ground water will infiltrate into the pipes, and thus decrease the capacity of the system Heavy precipitation over urban areas can cause a rapid runoff and wash of urban surfaces and thus higher concentrations of pollutants, e.g. heavy metals to BMPs or receiving waters
Storm water pond At storm water ponds, the amount of sediment losses during heavy rain may increase if the pond is insufficient dimensioned, and there are no by-pass facilities. Thus polluted sediments may reach the receiving waters.
Infiltration basin The infiltration capacity may decrease if the ground water level rises, and cause, for example, surface flooding
Table 1. Examples of impacts in urban drainage systems during high intensity rainfall events.
4 DISCUSSION
4.1 Economic valuation To serve as a useful and practical decision-making tool, most methods need to have an economic valuation included. Placing an economic value on an infrastructure might be realistic, but how will health aspects, nuisance from basement floods, closed roads, longer travel time, etc. be valued? An economic evaluation is, however, necessary to choose whether it is worth protecting a possible event from occurring. When different input is used in a GIS the vulnerability and possible damage on real estate and other areas can be assessed depending on the data from drainage models, infrastructure, real estate, demographic data, soil layers, future city plans, political economy, social factors, repair costs for different damages and areas, etc. The economic cost for affected areas can be identified, e.g. via a Cost–Benefit approach. A cost analysis can be made by a so-called raster- or vector analysis, depending on the available data, and show where it is most efficient to adapt the urban drainage system to maximise the future benefit, where this benefit is seen as a value of something not being flooded. This will support policy and decision-making of how to manage the urban drainage system in a time of climate change.
4.2 Cooperation Risk and vulnerability analysis always needs to be done in cooperation with the parties concerned, since most problems involve several different disciplines. One big challenge in the urban drainage system is the close multiple interactions that exist, both within the system and related to city infrastructure. Dialogue with experts and politicians should also take place to make the most of the results and precautions should be taken, especially since climate change is a very uncertain area to base decisions upon.
4.3 Uncertainty Climate change modelling is generally considered as very uncertain, and it is not possible to give an exact probability of future change. There are several uncertainty levels, e.g. data/parameter uncertainty, model/structure uncertainty, variability, and outcome uncertainty (e.g. Christensen et al., 2003). However, the scenarios used

NOVATECH'2007 7
give a range in which the results can vary. It is common to use this as a measure to consider future trends. How useful it is can only be shown by the future itself. Urban drainage simulations represent one type of model uncertainty in this study and the results should always be interpreted with some caution. This model is, however, previously calibrated for this specific area, and may serve well especially for present and near future climate runs if assuming that no urban development activities will occur in that time. Uncertainty of the variability and the outcome of the project may be reduced if a dialogue and common sense are used.
4.4 Other aspects As always, there are many other factors affecting the performance of the urban drainage system, e.g. impacts from the surrounding areas, water courses, sea level, etc., and the amount of impervious areas, which may increase with increasing population and new developments (e.g. Semadeni-Davies, 2006). There is also an aspect concerning the life expectancy of pipes and facilities (e.g. BMPs, WWTP etc), where pipes may be one hundred years or older and still be in operation (previously discussed by, e.g. Waters et al., 2003). In addition, the system will be more sensitive to extreme weather events and climate change factors if the capacity is decreased, e.g. if the pipe system is perforated and filled by roots, extra sand and sediment in the pipe system (e.g. originated from anti-skid measures), pipes are damaged and deteriorates, and other more temporary events, e.g. ice-blockages at the inlets. Through GIS analysis the results from combining factors are shown and each aspect can be valued, considered and analysed, thus increasing the knowledge and making it easier to suggest adaptation strategies for the urban drainage system to minimise the vulnerability of affected areas. When adapting to the future climate, it is also wise to keep updated in the field and adapt the urban drainage system step by step to gain knowledge with time and to invest available resources in the right places. Plans for future research within this project are to compare different municipalities (different climate characteristics, and climate change) in Sweden, to consider the influence of sea, watercourses and ground water on urban areas, and to use risk analysis methodology and GIS to get a more holistic approach to climate change impacts assessment.
5 CONCLUSIONS The strategy used to increase the understanding should be used in combination with different tools available (urban drainage simulations, risk analysis, GIS, etc.) and in cooperation with parties concerned, (urban drainage experts, climate change experts, practitioners, politicians, etc.), since most problems concern several different disciplines and a multifunctional understanding.
6 ACKNOWLEDGEMENT This work was financially supported by FORMAS (Swedish Research Council for Environment, Agricultural Sciences and Spatial Planning) which is gratefully acknowledged.
REFERENCES Ashley R.M., Balmforth D.J., Saul A.J., Blanksby J.D. (2005). Flooding in the future – predicting
climate change, risks and responses in urban areas, Wat. Sci. & Tech., 55(5), 265-273 Bernes C. (2003). A Warmer World, Swedish Environmental Protection Agency and SMHI
(SWECLIM), Ödeshög Christensen F.M., Andersen O., Duijm N.J., Harremoës P. (2003) Risk terminology – a platform
for common understanding and better communication, J. of Haz. Mat., A103, 181-203 Davidsson G. (2003) Handbok för riskanalys, Räddningsverket, [In Swedish]

8 NOVATECH'2007
Evans E., Ashley R., Hall J., Penning-Rowsell E., Saul A., Sayers P., Thorne C., and Watkinson A. (2004a,b). Foresight. Future Flooding. Scientific Summary: Volume 1 – Future risks and their drivers. Volume 2 – Managing future risks. Office of Science and Technology, London
Hauger M.B., de Roo C., Geldof G.D. and Mikkelsen P.S. (2003). Whitepaper on Risk Perception, Risk Assessment and Risk Management in the DayWater Context, Final draft, http://daywater.enpc.fr/www.daywater.org/, p19-20, visited 2006-06-19
Hernebring C., (2006) 10-års regnets återkomst förr och nu [Design storms in Sweden then and now], VA-forsk publ. 2006-04. [In Swedish]
IPCC, (2001) Climate Change 2001: Synthesis Report. A Contribution of Working Groups I, II, and III to the Third Assessment Report of the Integovernmental Panel on Climate Change [Watson, R.T. and the Core Writing Team (eds.)]. Cambridge University Press, Cambridge, United Kingdom, and New York, NY, USA, 398 pp.
Kjellström, E., Bärring, L., Gollvik, S., Hansson, U., Jones, C., Samuelsson, P., Rummukainen, M., Ullerstig, A., Willén U. and Wyser, K., (2005) A 140-year simulation of European climate with the new version of the Rossby Centre regional atmospheric climate model (RCA3). Reports Meteorology and Climatology 108, SMHI, SE-60176 Norrköping, Sweden, 54 pp.
Ljungquist K. (2005) A probabilistic approach to risk analysis, a comparison between undesirable indoor events and human sensitivity, Doctoral thesis 2005:45/ Luleå Univ. of Techn.
Nakicenovic N. et al., (2000) IPCC Special Report on Emissions Scenarios, IPCC, Cambridge University Press, Cambridge.
Olsson J, Olofsson M, Berggren K, Viklander M, 2006, Adaptation of RCA3 Climate Model data for the specific needs of urban hydrology simulations, Proceedings of the 7th International Workshop on Precipitation in Urban Areas, St. Moritz, Switzerland
Rummukainen, M., Bergström, S., Persson, G. och Ressner, E. (2005). Anpassning till klimatförädringar. Kartläggning av arbete med sårbarhetsanalyser, anpassningsbehov och anpassningsåtgärder i Sverige till framtida klimatförändring. SMHI Reports Meteorology and Climatology No. 106, SMHI, SE-601 76 Norrköping, Sweden. 44 pp. [in Swedish]
SCOPE (1980) Environmental risk assessment / ed. by Anne V. Whyte and Ian Burton, SCOPE reports
Semadeni-Davies A. (2004). Urban water management vs. climate change: impacts on cold region waste water inflows, Climatic Change 64, 103-126
Semadeni-Davies A., Hernebring C., Svensson G., Gustafsson L-G. (2006, in print) Changes – The impacts of climate change and urbanisation on urban drainage in Helsingborg, report
SOU (2006) Översvämningshot - risker och åtgärder för Mälaren, Hjälmaren och Vänern, SOU 2006:94. [In Swedish]
VAKA: http://www.slv.se/upload/18354/VAKA-broschyr%20med%20bilder%20webb.pdf Waters D., Watt W.E, Marsalek J., Anderson B.C. (2003). Adaptation of a Storm Drainage
System to Accommodate Increased Rainfall Resulting from Climate Change, Journal of Environmental Planning and Management, 46(5), 755-770

