urban expansion and its impact on urban agriculture ... · pdf fileurban expansion and its...
TRANSCRIPT

EARSeL eProceedings 10, 1/2011 46
URBAN EXPANSION AND ITS IMPACT ON URBAN AGRICULTURE – REMOTE SENSING BASED CHANGE ANALYSIS OF KIZINGA AND
MZINGA VALLEY – DAR ES SALAAM, TANZANIA
Sandra Eckert
University of Bern, Centre for Development and Environment, Bern, Switzerland; sandra.eckert(at)cde.unibe.ch
ABSTRACT Urban agriculture is a phenomenon that can be observed world-wide, particularly in cities of devel-oping countries. It is contributing significantly to food security and food safety and has sustained livelihood of the urban and peri-urban low income dwellers in developing countries for many years. Population increase due to rural-urban migration and natural - formal as well as informal - urbani-sation are competing with urban farming for available space and scarce water resources. A mul-titemporal and multisensoral urban change analysis over the period of 25 years (1982-2007) was performed in order to measure and visualise the urban expansion along the Kizinga and Mzinga valley in the south of Dar Es Salaam. Airphotos and VHR satellite data were analysed by using a combination of a composition of anisotropic textural measures and spectral information.
The study revealed that unplanned built-up area is expanding continuously, and vegetation covers and agricultural lands decline at a fast rate. The validation showed that the overall classification accuracy varied depending on the database. The extracted built-up areas were used for visual in-terpretation mapping purposes and served as information source for another research project. The maps visualise an urban congestion and expansion of nearly 18% of the total analysed area that had taken place in the Kizinga valley between 1982 and 2007. The same development can be ob-served in the less developed and more remote Mzinga valley between 1981 and 2002. Both areas underwent fast changes where land prices still tend to go up and an influx of people both from rural and urban areas continuously increase the density with the consequence of increasing multiple land use interests.
INTRODUCTION Urbanisation is one of the major problems of mankind in the near future. In 2008, for the first time in history, more than half the world’s population lived in urban areas. The world’s urban population is expected to double from 3.3 billion in 2007 to 6.4 billion by 2050, and it is predicted that by 2030, over 56% of the world’s population will live in cities (1). This urban population growth will be most significant in low income countries, notably in Africa and Asia (2). Sub-Saharan African countries have the world’s highest rates of urban growth and the highest levels of urban poverty. The slum population in these countries doubled in the period 1990 to 2005, when it reached 200 million (3).
As cities expand, so do the food needs of urban families. The capacity of local municipalities to manage this urban growth is threatened in many developing countries, or already on the decline. The identification of ways to provide food, shelter and basic services to the city residents and cre-ate “sustainable cities” are challenges for many city authorities around the world. The phenomenon that a growing number of urban dwellers are engaging in agricultural activities, especially in the less developed countries has been witnessed all over the world. It is estimated that 800 million people are engaged in urban (intra-urban and peri-urban) agriculture world-wide and play an im-portant role in feeding the world’s cities (4,5).
The urbanisation process in many developing countries goes hand in hand with increasing urban poverty, growing food insecurity and malnutrition, especially of the urban poor. Food production in the city is in many cases a response of urban poor to inadequate, unreliable and irregular access to food and inadequate access to formal employment opportunities (6). Therefore, the contribution

EARSeL eProceedings 10, 1/2011 47
of urban agriculture to enhancing urban food security, healthy nutrition, poverty alleviation, and social integration, especially of the poorer sections of the urban population, is of high importance.
Despite substantial growth, urban agriculture received very limited recognition from the authorities in the past. The uncertain legal status of urban agriculture is such that official projects or pro-grammes aimed at improving urban agriculture have been rare. Typically urban agriculture is not taken into account in the urban planning process. In the case of Dar Es Salaam the city govern-ment has recognised the need to develop strategies that can enhance urban agriculture in order to ensure sustainable human development. In 1992, the city has integrated urban agriculture in urban planning through a bottom-up approach, under the Environmental Planning and Management (EPM) Process and the Strategic Urban Development Plan (SUDP) has officially set apart several areas to be used for large and medium scale urban agriculture (7).
However, rapid urbanisation means that city boundaries as defined by administrative jurisdictions may be overtaken by new expansion almost as soon as they have been redrawn to account for previous spread (8). Locations that are rural at one moment become peri-urban the next, and ur-ban soon after. For this reason the fringes of most African cities are unstable with respect to set-tlement patterns, population density and land use (9). Of late, professionals and politicians have realised that if urban agriculture is taken seriously and properly organised, it can be effective land management (7).
Remote sensing is an important tool to provide information about land use and its development over time. It has been used to investigate urban environments, urban land cover changes and city growth in particular. Many publications illustrate the automatic or semi-automatic spectral analysis of medium to high spatial resolution data, e.g., Landsat TM, SPOT HRV. Spectrally derived land cover classifications are further enhanced by visual interpretation of either airphoto, or more re-cently, of very fine spatial resolution (VHR) optical satellite imagery, e.g., IKONOS or Quickbird (10,11,12,13,14,15).
am.
Aerial photographs as well as VHR data provide very fine spatial but coarse spectral resolution data, by comparison with medium and fine spatial and spectral resolution satellite data. So far, these kinds of data have been analysed mainly by analogue, visual interpretation, which is very time consuming, which has led to the new challenge of finding ways to successfully extract and classify urban areas in a more automated way. Single buildings, roads, gardens and lawns that make up the complex heterogeneous urban fabric (16) are visible in detail and VHR imagery pro-vides an opportunity for their classification and delineation. Carleer and Wolff (17) combined spec-tral information on VHR imagery together with spectral, textural and morphological features for the improvement of urban land cover classification. The features were calculated after previously seg-menting the image into meaningful objects. Herold et al. (18) conducted a similar segmentation or object based classification of an urban area in California based on IKONOS data.
Another approach is the use of image textural information to discriminate built-up structures. Zhang et al. (19) successfully merges spectral and textural information for improving urban recognition by analysing SPOT panchromatic data. Another methodology was developed by Pesaresi (20) and is based on a fuzzy rule-based composition of anisotropic textural measures, based on the grey-level co-occurrence matrix (GLCM). This method was successfully applied with medium resolution data of different source and quality dealing with built-up area discrimination in urban and suburban ar-eas (21,22,23,24), therefore it was tested in this study to successfully derive built-up areas on b&w aerial photographs and VHR satellite data, in order to map the remaining agricultural areas suitable for urban agriculture. The maps will then be used as important information source for a project on the suitability of wastewater irrigated agriculture in the Kizinga and Mzinga valleys in the South of Dar Es Sala
METHODS Aerial photographs of 1981, 1982, 2003 and VHR satellite data of 2007 was used to monitor urban development in two valleys of high importance for urban agriculture of Dar Es Salaam (Table 1, Figure 1).

EARSeL eProceedings 10, 1/2011 48
Figure 1: Overview of Dar Es Salaam and the two analysed areas: Kizinga (a) and Mzinga (b) val-leys (Quickbird quicklook, copyright 2007 DigitalGlobe).
Two sample data subsets are shown in Figure 2. Vector features of building footprints of a 1km x 1km area were available for validation purposes. All remote sensing data was mosaicked and geo-referenced. The aerial photograph acquired in 1981 had a higher resolution of approximately 0.7m. It was resampled to 2.0m. A resolution of approx. 2m was considered suitable but also necessary for a detailed visual discrimination of the many small buildings present in the greater Dar Es Sa-laam area. Most buildings have a size of 5-20m, densely built close to each other.

EARSeL eProceedings 10, 1/2011 49
Table 1: Remote sensing data.
Acquisition date/Year
Sensor Original Resolution (m)
Resampled Resolution (m)
Area Coverage
1981 B&W analogue camera 2.0 2.0 Mzinga 1982 B&W analogue camera ~0.7 2.0 Kizinga 2002 RGB colour analogue camera 1.8 1.8 Mzinga 2007 RGB, NIR Quickbird 2.4 2.4 Kizinga
Figure 2: Sample subset area (1 km × 1 km) of Quickbird data acquired in 2007 (left; copyright 2007 DigitalGlobe) and b&w aerial photograph of 1982. The urban congestion and expansion to-wards Kizinga river in the South are clearly visible.
The anisotropic rotation-invariant built-up presence index (22) was applied to delineate urban and non-urban regions. The main component of the workflow computes the contrast textural statistic based on the grey-level co-occurrence matrix (GLCM) as introduced by Haralick et al. (25). The method is based on image texture and therefore is advantageous for multisensor and multitempo-ral image analysis. The efficiency of this method to delineate built-up areas has been shown to work for optical panchromatic images (22) as well as SAR images (26). Generally it can be said that the input imagery must have a spatial resolution that is equal to or better than the dimensions of the discernable built-up objects in order to determine good contrast statistics between building roofs, shadows and background. All processed datasets fulfilled this requirement. For the calcula-tion of the contrast textural measure a window size of nine pixel was selected. This value is gener-ally defined by empirical estimation of the relation between window size and detection accuracy for a specific settlement structure. In this case the majority of the buildings in the area have a size of 5-20m, divided by the pixel size it results in a window size of nine pixels.
Pesaresi (21,23) has shown that the GLCM contrast statistic is the most efficient at discriminating between built-up and non-built-up areas. Different displacement vectors are used to compute the contrast statistic to take advantage of the anisotropic nature of the urban texture. The directional components of the contrast statistic are then used to produce a single texture layer using the inter-section and union operators (22).
The result provides structural information on the urban regions, including buildings and tarmac areas, such as roads, squares or other open spaces. The final binary built-up mask is produced by interactively choosing a threshold value that delineates the image into built-up and non built-up
EARSeL eProceedings 10, 1/2011 50
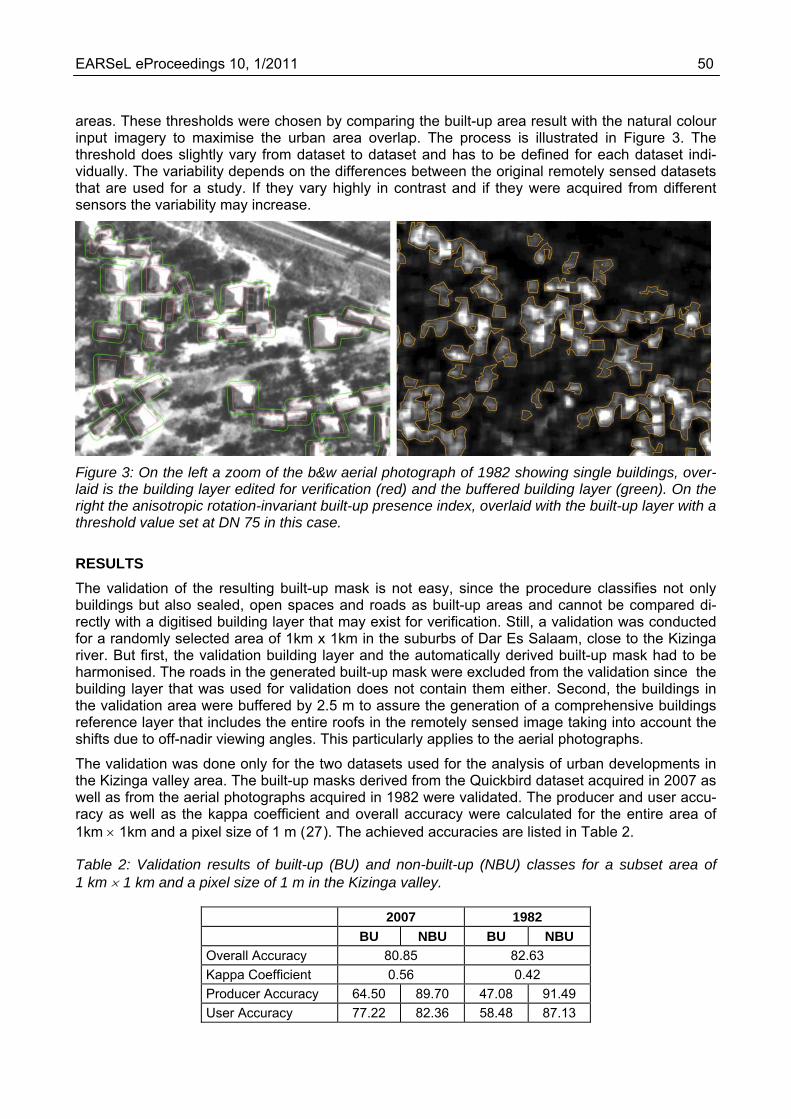
areas. These thresholds were chosen by comparing the built-up area result with the natural colour input imagery to maximise the urban area overlap. The process is illustrated in Figure 3. The threshold does slightly vary from dataset to dataset and has to be defined for each dataset indi-vidually. The variability depends on the differences between the original remotely sensed datasets that are used for a study. If they vary highly in contrast and if they were acquired from different sensors the variability may increase.
Figure 3: On the left a zoom of the b&w aerial photograph of 1982 showing single buildings, over-laid is the building layer edited for verification (red) and the buffered building layer (green). On the right the anisotropic rotation-invariant built-up presence index, overlaid with the built-up layer with a threshold value set at DN 75 in this case.
RESULTS The validation of the resulting built-up mask is not easy, since the procedure classifies not only buildings but also sealed, open spaces and roads as built-up areas and cannot be compared di-rectly with a digitised building layer that may exist for verification. Still, a validation was conducted for a randomly selected area of 1km x 1km in the suburbs of Dar Es Salaam, close to the Kizinga river. But first, the validation building layer and the automatically derived built-up mask had to be harmonised. The roads in the generated built-up mask were excluded from the validation since the building layer that was used for validation does not contain them either. Second, the buildings in the validation area were buffered by 2.5 m to assure the generation of a comprehensive buildings reference layer that includes the entire roofs in the remotely sensed image taking into account the shifts due to off-nadir viewing angles. This particularly applies to the aerial photographs.
The validation was done only for the two datasets used for the analysis of urban developments in the Kizinga valley area. The built-up masks derived from the Quickbird dataset acquired in 2007 as well as from the aerial photographs acquired in 1982 were validated. The producer and user accu-racy as well as the kappa coefficient and overall accuracy were calculated for the entire area of 1km × 1km and a pixel size of 1 m (27). The achieved accuracies are listed in Table 2.
Table 2: Validation results of built-up (BU) and non-built-up (NBU) classes for a subset area of 1 km × 1 km and a pixel size of 1 m in the Kizinga valley.
2007 1982 BU NBU BU NBU Overall Accuracy 80.85 82.63 Kappa Coefficient 0.56 0.42 Producer Accuracy 64.50 89.70 47.08 91.49 User Accuracy 77.22 82.36 58.48 87.13

EARSeL eProceedings 10, 1/2011 51
The classification accuracy varied depending on the database, with the Quickbird data of 2007 achieving a better result for the built-up class than the b&w aerial photograph of 1982. Figure 4 clearly shows that a lot of buildings in the aerial photograph were not recognised as such leading to a high omission error. Additionally, areas of high contrast such as trees and bare soil in the background, along roads, and areas around buildings identified as buildings lead to a high com-mission error. Another reason contributing to the omission error is the fact that the reference con-tains only buildings whereas the presented methodology classifies also bare soil areas, parking lots, construction sites, side roads or dumps as built-up areas (Figure 4).
Figure 4: Validation area in the Kizinga valley for the built-up mask derived from Quickbird data (left) and b&w aerial photographs (right). Correctly classified built-up (BU) (dark green) and non-built-up (NBU) (light green). Errors of omission are presented in (orange) and errors of commission in (red).
The same reasons lead to classification errors when applying the methodology to the Quickbird dataset but due to a better radiometric resolution and a generally better quality of the data the user and producer accuracy for built-up is generally higher than that of the b&w aerial photograph data-set. Actually, most buildings are detected as such only that the areas of detection are smaller than the actual built-up area. This is clearly visible in the south of the subset area where a lot of new buildings had been constructed in recent years. The performance of the methodology, basing on textural contrast, depends not only on the materials used for the roof but also on the surroundings of buildings. If roofs are made of red adobe, rusty corrugated iron sheets or are surrounded or par-tially covered by large trees leading to little contrast between the buildings and the soil background the detection of buildings may fail.
However, the results show that the methodology works with b&w aerial photographs of reduced quality as well as high-resolution VHR satellite data. Built-up masks may be extracted in a fast and uncomplicated way and built-up maps may be generated that, on a smaller scale, e.g. on regional or city level, offer the possibility to recognise and address the challenges of uncontrolled urban sprawl and its consequences for peri-urban and urban farming.
CONCLUSIONS The anisotropic rotation-invariant built-up presence index (22) was applied to delineate urban and non-urban regions. So far the method had been applied mainly on medium resolution data of 5 -10 m geometric resolution. In this study VHR data as well as b&w and rgb aerial photographs with higher geometric resolution but some of them of lower quality, served as input data. The validation

EARSeL eProceedings 10, 1/2011 52
showed that some of the generated built-up/non-built-up masks contain rather large errors, the reasons of which have been discussed in the results section. However, the extracted areas can still be used for a visual interpretation of change analysis and mapping purposes (Figure 5).
Figure 5a: Generated maps representing urban development in the Kizinga valley, where pink rep-resents built-up areas in 1982/1981 and orange in 2007/2002 respectively. The delineation of the analysed areas was determined by the geographic overlap of the remotely sensed data.
Additional manual editing could further improve the results in a way that statistical data may be derived. It could also be tried to geometrically further resample the data in order to derive more generalised built-up/non-built-up classifications suitable for urban change analysis on a larger scale. However, Figure 5 visualises well the urban congestion and expansion that had taken place in the Kizinga valley between 1982 and 2007. The same can be observed in the Mzinga valley be-tween 1981 and 2002. Both areas undergo rapid changes where land prices tend to go up and an influx of people both from rural and urban areas increase the density with the consequence of mul-tiple land use interests. Both valleys, for example, are also prone to flooding and serve as water reservoirs. They also have the potential of becoming important recreational areas and function as “green lungs”. All these multiple interests call for a coordinated urban land use management offi-cially integrating urban agriculture and strengthening its role as a sustainable source of income, employment and food.
ACKNOWLEDGEMENT The author would like to thank Prof. Dr. Richard Sliuzas of ITC, University of Twente, for providing all aerial photographs of Dar Es Salaam. The author would also like to thank Dr. Shombe Hassan who provided valuable information on the research area. This study was financed by the Eastern and Southern Africa Partnership Programme (ESAPP) as part of the project Wastewater irrigated agriculture as a mean to alleviate poverty: The case of Dar Es Salaam City.

EARSeL eProceedings 10, 1/2011 53
Figure 5b: Generated maps representing urban development in the Mzinga valley, where pink rep-resents built-up areas in 1982/1981 and orange in 2007/2002 respectively. The delineation of the analysed areas was determined by the geographic overlap of the remotely sensed data.
REFERENCES 1 UN Population Fund, 2007. State of the World Population 2007 – Unleashing the Potential of
Urban Growth. United Nations Population Fund, 108 pp. http://www.unfpa.org/swp/swpmain.htm (last date accessed: 16.05.2011)
2 UNCHS, 2001. State of the World’s Cities Report, 125 pp. http://ww2.unhabitat.org/istanbul+5/statereport.htm (last date accessed: 16.05.2011)

EARSeL eProceedings 10, 1/2011 54
3 UNCHS, 2006/07. State of the World’s Cities Report, 204 pp.
http://www.unhabitat.org/pmss/listItemDetails.aspx?publicationID=2101 (last date accessed: 16.05.2011)
4 Smit J, A Ratta & J Nasr, 1996. Urban Agriculture: Food, Jobs and Sustainable Cities. United Nations Development Programme, Publication Series for Habitat II. Volume 1, UNDP, New York
5 FAO, 1999, Issues in urban agriculture – studies suggest that up to two-thrids of city and peri-urban households are involved in farming. FAO Spotlight Magazine. http://www.fao.org/ag/magazine/9901sp2.htm (last date accessed: 16.05.2011)
6 Drescher A W, P Jacobi & J Amend, 2000. Urban agriculture, a response to crisis? UA-Magazine, 1. http://www.ruaf.org/node/106 (last date accessed: 16.05.2011)
7 Kitilla M D & A Mlambo, 2001. Integration of agriculture in city development in Dar Es Salaam. UA-Magazine, 4. http://www.ruaf.org/node/178 (last date accessed: 16.05.2011)
8 Hill R D, 1986. Land use on the urban fringe. Nature and Resources, 22: 24-33
9 Ellis F & J Sumberg, 1998. Food production, urban areas and policy responses. World Devel-opment, 26, 213-225
10 Kwarteng A Y & P S Chavez, 1998. Change detection study of Kuwait City and environs using multi-temporal Landsat Thematic Mapper data. International Journal of Remote Sensing, 19: 1651-1662
11 Yagoub M M, 2004. Monitoring of urban growth of a desert city through remote sensing: Al-Ain, UAE, between 1976 and 2000. International Journal of Remote Sensing, 25: 1063-1076
12 Angel S, S C Sheppard & D Civco, 2005. The Dynamics of Global Urban Expansion. The World Bank Transportation and Urban Development Department (Washington, DC, USA) 205 pp.
13 Schneider A K C Seto & D R Webster, 2005. Urban growth in Chengdu, Western China: appli-cation of remote sensing to assess planning and policy outcomes. Environment and Planning B: Planning and Design, 32: 323-345
14 Yin Z-Y, D J Stewart, S M Bullard & J T MacLachlan, 2005. Changes in urban built-up surface and population distribution patterns during 1986–1999: A case study of Cairo, Egypt. Comput-ers, Environment and Urban Systems, 29: 595-616
15 Saleh B & S Al Rawashdeh, 2007. Study of Urban Expansion in Jordanian Cities Using GIS and Remoth Sensing. International Journal of Applied Science and Engineering, 5: 41-52
16 Jensen J R & D C Cowen, 1999. Remote sensing of urban/ suburban infrastructure and socio-economic attributes. Photogrammetric Engineering & Remote Sensing, 65: 611-622
17 Carleer A P & E Wolff, 2006. Urban land cover multi-level region-based classification of VHR data by selecting relevant features. International Journal of Remote Sensing, 27: 1035-1051
18 Herold M, J Scepan, A Mueller & S Guenther, 2002. Object-oriented mapping and analysis of urban land use/ cover using IKONOS data. In: Geoinformation for European-wide Integration, Proceedings of the 22nd EARSEL Symposium, edited by T Benes (Millpress, Rotterdam, The Netherlands) 531-538 http://www.earsel.org/symposia/2002-symposium-Prague/pdf/074.pdf
19 Zhang Q, J Wang, P Gong & P Shi, 2003. Study of urban spatial patterns from SPOT panchro-matic imagery using textural analysis. International Journal of Remote Sensing, 24: 4137-4160
20 Pesaresi M, 2000. Textural Classification of Very High-resolution Satellite Imagery. Empirical Estimation of the Interaction between Window Size and Detection Accuracy in Urban Environ-ment. In: Proceedings of the International Conference on Image Processing ICIP99, 1:114-118

EARSeL eProceedings 10, 1/2011 55
21 Pesaresi M, 2000. Texture analysis for urban pattern recognition using fine-resolution pan-
chromatic satellite imagery. Geographical & Environmental Modelling, 4: 47-67
22 Pesaresi M, A Gerhardinger & F Kayitakire, 2008. A robust built-up area presence index by anisotropic rotation-invariant textural measure. IEEE JSTARS, 1: 180-192
23 Pesaresi, M, 1995. An optimized procedure to built space automatic recognition via Spot HRV panchromatic satellite data processing. In: Proceedings of ISTAT-EUROSTAT Seminar ―The Impact of Remote Sensing on the European Statistical Information System
24 Zeug G & S Eckert, 2010. Population growth and its expression in spatial built-up pattern: the Sana’a Yemen case study. Remote Sensing, 2, 1014-1034
25 Haralick R M, K Shanmugan & I Dinstein, 1973. Texture features for image classification. IEEE Transactions on Systems, Man and Cybernetics, 3, 610-621
26 Gamba P, M Pesaresi, K Molch, A Gerhardinger & G Lisini, 2008. Anisotropic rotation in-variant built-up present index: applications to SAR data. In: Proceedings of the IEEE In-ternational Geoscience & Remote Sensing Symposium, 5: 338-341
27 Congalton R G & K Green, 1999. Assessing the Accuracy of Remotely Sensed Data. Principles and Practices (Lewis Publishers) 137pp.