urban growth in italy: economic determinants and socio ...227430/fulltext01.pdf · in the inner...
TRANSCRIPT

CERUMReport 10: 2001Gratis internet utgåvaTryckt utgåva kan köpas från CERUM
Detta dokument får kopieras, men inte säljas.Innehållet får inte ändras på något sätt.
u
E
CERUMCentrum för regionalvetenskap901 87 Umeå[email protected] 090-786 51 21Telefon 090-786 60 79
Urban Growth in Italy:Economic Determinants andSocio-Environmental Consequences
Roberta CapelloDepartment of Economics, University of MoliseDepartment of Economics, Politecnico di Milano

Umeå UniversityCerum
Centre for Regional Sci-ence
Urban Growth in Italy:Economic Determinants and Socio-Environmental Consequences
Roberta CapelloDepartment of Economics, University of MoliseDepartment of Economics, Politecnico di Milano
Paper presented at the International Symposium in Urban Design on“Urban Systems and Public Place”, organised by CERUM, and held inUmeå, Sweden, June 7–8, 2001
Cerum Report Nr 10:2001isbn 91-7305-164-0issn 0282-0277Address: Cerum, Umeå University, se-901 87 Umeå, Sweden. Telephone: +46 90 786 60 79, Fax: +46 90 786 51 21. www.umu.se/[email protected]

Table of Contents
Table of Contents 4
Preface 5
1. Introduction 6
2. Urban Dynamics in Italy 9
3. The Determinants of Urban Dynamics 113.1. Towards an Optimal City Size?, 113.2. Urban Renewal since the Mid Eighties: Local or National Determinants?, 173.3. Determinants of urban advantages and urban costs, 19
4. Socio-Environmental Consequencesof the Urbanisation Process 25
5. Policy Actions for an Urban Sustainability Growth 29
6. Conclusions 34
Bibliographical References 35
Cerum Report 38
4 Urban Growth in Italy: Economic Determinants and Socio-Environmental Consequences

Preface
CERUM is organizing seminars in urban development and urbandesign. The focus on the urban dimension reflects the need to obtainnew knowledge on the design of cities and the smaller municipalitiesin the urban regions as well as their development and functions - seenseparetely or in a network.
The aim of the seminars is to create a network of contacts betweenactors working on the urban arena, e.g. local and regional planners, res-idential enterprises, building companies and architectural firms. Theseminars reflect the research carried out at other universities and uni-versity colleges in Sweden with focus on the urban dimension. Theseminars are part of an ambition to establish a Centre of Urban Designat the University of Umeå.
Some of the researchers have submitted written documention oftheir contributions to the seminars. These contributions are publishedin CERUM’s publication series. The present paper is written by Rob-erta Capello, Dep. of Economics, University of Molise and Dep. ofEconomics, Politecnico di Milano.
Umeå in November 2001Nils HäggströmCERUM
Preface 5

1. Introduction
In the real world, the number of people living in cities is growing in allcountries and continents. The urbanisation process is a phenomenonwhich, in the last decade, has been increasingly intense in the develop-ing countries. The share of urban population in the more developedcontinents, such as Europe and North America, is extremely high, andis nearly 50% at the world scale. This share, according to the forecastsof the World Resources Institute (World Resources, 1994), is expectedto rise yet further in future decades. As a consequence of increasingpopulation, cities physically expand through processes which havebeen defined as “ville éclatée”, “ville éparpillée”, “ubiquitous city”. Thepopulation of large cities continues to grow, though sometimes moreslowly than previously (Camagni, 1996).
The constantly increasing size of cities encountered in the real worldis in contrast with the famous “optimal city size” theory, which envis-ages a size above which an increase in physical dimension decreases theadvantages of agglomeration. The declining rate of urban populationgrowth recorded in the last decade in most developing countries ap-pears to be common to all cities, independently of physical size, andrepresents a general slowing down, rather than a specific crisis in thelarger cities. Indeed, during the seventies, there were negative popula-tion growth rates in the urban system of the Po Valley in Northern Italynot only in the major cities, but also a number of secondary centres of75,000 to 150,000 inhabitants (8 out of 19) and even some smallertowns of 20,000 to 75,000 inhabitants (27 out of 113) (Camagni et al,1985; Camagni et al. 1986). According to the theory, however, me-dium-sized towns are expected to increase their size, since the advan-tages associated with the physical dimension are still higher than loca-tion costs.
This seemingly mistaken interpretation of the real world by the “op-timal city size theory” has already been pointed out by various authors.Richardson (1972) was the first to present a “sceptic’s view”, by under-lining that an apparent paradox existed between the theoretical accep-tance of an “optimal city size” and the contradictory development pat-terns of urban systems in the real world. According to Richardson, thisparadox could be explained by the existence of other determinants in-fluencing urban agglomeration economies, not merely physical size.Since Richardson’s paper, other interpretations have been given to thisapparent paradox, through the “urban life cycle” theory1, and throughthe integration of dynamic elements, such as innovation, continuous
1. On this theory see, among others, van den Berg et al., 1983; Camagni et al.,1985.
6 Urban Growth in Italy: Economic Determinants and Socio-Environmental Consequences

information and knowledge acquisition, into the static framework of“optimal city size theory”.
After the sixities, with the neoclassical approach to urban size, otherstudies have been carried out with the aim to understand urban dynam-ics. One theory is the so-called ‘urban life cycle theory’ which waslaunched by the Vienna group within the CURB (costs of urbangrowth) project2. The main elements of this theory, as well as its limits,are already well known. It provides an elegant way of describing urbantrends and dynamics by interpreting them as the result of a natural pro-cess of physical diffusion of urban population from core areas to the pe-riphery. The opposite movement, from periphery to core, is explainedon the other hand by the existence of scale diseconomies. However,some aspects remain unresolved: for example, is there a city size thres-hold at which the process of decentralisation starts? At what city size doscale economies become scale diseconomies? At what point in time doesthis happen? Should we expect cities like Milan and Rome to grow tothe size of London and Paris before they start to decline?3
Many empirical analyses have proved the existence of an optimalcity size through the measurement of economies or diseconomies ofscale, generally applied either to the costs of urban services or to eleganteconometric estimates of urban and sectoral production functions. But,unfortunately these studies have never produced a common result, andhave often been subject to criticism for their restrictive hypotheses4.
The aims of the present paper are manyfold. The first aim is to de-scribe urban dynamics in Italy, through a descriptive analysis of thepopulation changes in core and ring areas in the 95 capitals, and somedata on land use presented in order to describe the urbanisation pro-cess. The second aim of the paper is to understand the economic deter-minants of urban growth; especially it is important to understandwhether the urbanisation process is caused by local or national factors.The third aim of the paper is the attempt to reply to the questionwhether an optimal urban size exists. Last but not least, the fourth aimof the paper is to present some data on the socio-economic conse-quences of urban growth. Most of the data refers to the Italian reality, aswe will explain throughout the paper.
The paper is structured as follows. Firstly, in Section 2, the historicalpattern of urban dynamics in Italy is presented through an analysis ofdemographic changes in all 95 provincial capitals. As we shall see, fromthis descriptive analysis some contradictory results emerge in relation tothe existence (or not) of an optimal city size. Nevertheless, a clear mes-sage emerges, which may have far reaching consequences from the en-vironmental point of view: cities continue to grow, despite their size,
2. On this theory see, among others, Klassen, Molle and Paelink, 1981; Van denBerg et al, 1982; Van den Berg, 1987.
3. These are the well-known criticisms of the urban life cycle theory and the theoryof optimal city size. See, among others, Camagni, 1992 and capello, 1998a.
4. See, among others, Henderson, 1974, 1985, 1996; Kamashima, 1975; Shefer,1973; Sveikauskas, 1975; Sveikauskas et al, 1988; Segal, 1976; Marelli, 1981;Ladd, 1992; Catin, 1991; Rousseaux and Proud’homme, 1992; Rousseaux,1995; Capello, 1998a, Capello and Camagni, 2000.
1. Introduction 7

and a process of periurbanisation characterises large cities. Section 3contains an interpretative model of the determinants of urban dynam-ics and provides prima facie evidence of the existence of an optimal citysize towards which cities move in the long run. The model is able toprovide evidence concerning the determinants of the urban revitalisa-tion process occurring in Italy since the mid eighties. In this respect, themodel is able to demonstrate: a) that it is the good performance of thenational economy, rather than the local economy, which generates anurban revitalisation process, and b) that good national economic per-formance influences primarily large cities. Moreover, in Section 3 thedeterminants of urban advantages and disadvantages are presented. Sec-tion 4 presents some indicators of social and environmental costs of ur-ban growth. Policy implications for a sustainable urban growth are pre-sented in Section 5. Some concluding remarks are presented in Section6.
8 Urban Growth in Italy: Economic Determinants and Socio-Environmental Consequences

2. Urban Dynamics in Italy
This section provides a description of urban dynamics in Italy over thelast thirty years through an empirical analysis of demographic changesin the inner core and suburban ring areas of the 95 provincial capitals5.For the core, data refer to the municipality, and for the ring to the dif-ference between the province and the municipality.
Chart 1 shows the tendency of core areas to lose population. It canbe seen that this trend affects cities in the North and Centre as well asthe South of Italy (Charts 2–4). This trend first appeared in the North,where by the early seventies most towns were already registering a neg-ative population growth rate (Chart 2b). In the South of Italy the phe-nomenon was less evident during the seventies, when most Southerncities still had a positive population growth rate, probably due not somuch to the attractiveness of the core areas, but to the inefficiency ofperipheral areas, which pushed population towards the centre.
An interesting result which emerges from the analysis is that the neg-ative population growth rate characterises all cities, despite their size,but seems to be more typical of large cities. On average, the most effi-cient urban size seems to be small in the case of all geographical loca-tions (North, Centre and South).
Charts 1–4 show that the larger urban areas have a lower rate ofgrowth than smaller ones. For this reason we should expect that, as timepasses and cities expand, the rate of growth will slow down. This wouldimply that the curve showing the best fit of the data in different timeperiods would have a downward trend at a certain point. Charts 1b – 1fshow that this was in fact the case until the end of the eighties. Duringthe nineties, however, the situation appeared to change in favour oflarge urban areas, where a slowing of the population loss in the core wasregistered, suggesting an increase in their attractiveness. This positivetrend in population growth of the cores of large cities has characterisedthe North since the mid eighties. A plausible assumption for this rever-sal is that these cities were no longer primarily dependent on manufac-turing activities, but that a new economic cycle had begun, based onmanagerial and tertiary economic functions, which find their naturallocation in large cities.
The demographic trend of core population presented in Charts 1–4suggests two alternative interpretations of urban size:
5. The source of population data is the National Statistics Yearbook published byISTAT.
2. Urban Dynamics in Italy 9
+ the efficient urban size is the one towards which all urban systemsmove over time. As our analysis shows, while the population growthrate in small cities is generally positive, in large ones it tends to benegative. This leads to the conclusion that the most efficient citysize, defined as the size at which net location advantages are maxim-ised, is represented by that at which there is no stimulus to any fur-ther change, i.e. where the population growth rate is zero (point E1in Chart 1);
+ urban size is a factor of development: the most efficient cities arethe most competitive ones, which tend to develop at growing rate,generate employment and thus attract more population. Accordingto this logic, the most efficient urban size, defined as the size atwhich cities register the highest growth rate, is represented by E2and E1 then becomes the maximum size that a city may achievewithout registering too many negative scale externalities.
These two opposite interpretations of urban size are discussed furtherin Section 3.2, where our interpretative model attempts to detect whichis the most appropriate for describing the situation in Italy.
Charts 5–7 show population growth rates in the outer ‘ring’ aroundthe city. It is clearly evident that the demographic decline of the citycore has always been accompanied by an increase in the population ofring areas. During the seventies, there were positive growth rates inthese peripheral areas, indicating that processes of peri-urbanisationwere occurring in the large cities, and processes of residential develop-ment of the rural areas around small towns. Demographic increases inring areas are in fact typical of all cities, whatever their size. This sug-gests that, if an optimal city size does exist, it must inevitably be differ-ent for different cities.
Lastly, Charts 5–7 show that the strong peri-urbanisation processwhich previously characterised the North of Italy has declined instrength over the last ten years. In the nineties, lower rates of increase inring areas have been associated with lower loss of population in the coreareas.
This analysis has therefore produced two main findings: 1) there isclear evidence of a widespread process of peri-urbanisation during theearly eighties; 2) at least in the North, there appears to have been an in-crease in the attractiveness of large cities. However, some other aspectsof the urban dynamics remain unexplained, namely: do cities tend to-wards an optimal size or do they register constantly increasing returnsto scale? Moreover, if this optimal city size is an attractor for urban dy-namics, does an optimal city size exist for all cities? In Section 3, a replyto these questions is provided through the application of a model of ur-ban dynamics.
10 Urban Growth in Italy: Economic Determinants and Socio-Environmental Consequences

3. The Determinants of Urban Dynamics
3.1. Towards an Optimal City Size?
In this section we attempt to provide an empirical answer to the ques-tion of whether an optimal city size exists and whether this is the samefor all cities. The logic behind the model is that an equilibrium levelfor urban rent exists, which internalises the maximum net advantagesgenerated by an optimal city size. The empirical analysis on the exist-ence of an optimal city size is thus based on house prices in centralareas of the 20 regional capital cities in Italy, available in time seriesbetween 1963 and 1997 for all regional capitals6. Our idea is thaturban rent7 can be a good indicator of adavntages and disadvantages ofan urban location. In fact the differences in house prices between largeand small cities measure their relative attractiveness (and thus their netlocalisation advantage), since they are the result of an evaluation madeby the market of the ‘value’ of these locations. For the same reason, thedynamics of urban house prices captures the changes in attractivenessof each location, and thus the dynamics of urban net advantage8.
The aims of the investigation were threefold:+ to demonstrate whether or not an optimal urban size exists. If it
does, then urban size is an attractor towards which cities move overtime. However, it may also well be that a higher rate of growthreflects greater efficiency and competitiveness. If demographicchanges respond to efficiency mechanisms, higher rates of urbangrowth guarantee employment growth and thus larger urban size, ina continuous process fed by positive feedback effects à la Arthurand by increasing returns à la Krugman, with no limits to physicalgrowth. In this case, urban growth can be expected to continue overtime, with an exponential trend;
6. The source for this database is the property directory ’Annuario Immobiliare’published by Sole 24 Ore.
7. Urban rent is usually interpreted as the rent paid to the house owner. However,house prices represent the capitalised rent over time, and for this reason may bechosen as a proxy for urban rent.
8. In dynamic terms, the reasoning requires another important hypothesis. Sincethe analysis is developed in relative and not absolute terms, between different cit-ies or between core and ring areas, it is assumed that for each relative dimension(large vs. small cities, ring vs. core), the supply curve of houses has the sameslope. If this were not the case, a shift upwards of the demand curve, generatedby a higher appreciation of location advantages, would give rise to a different in-crease in prices. This hypothesis does not limit too much the comparison be-tween large and small cities, but could give a heavy bias in a comparison betweencore and ring areas because of the different potential for the expansion of resi-dential supply in the two areas. See also Camagni and Pompili, 1991.
3. The Determinants of Urban Dynamics 11

+ to identify the determinants of urban dynamics, and to understandin particular whether they result from structural changes in the localeconomy are more dependent on national economic trends, regard-less the local economic performance and characteristics;
+ to understand whether in periods of strong economic recovery, as inthe mid eighties, all cities benefit and increase their attractiveness,or whether this is true only for the larger cities, where the mostadvanced activities are located.
The methodology used to test these hypotheses is a panel model, al-ready applied in the literature to analyse the trends in the housing mar-ket9. In our model, the percentage change in the deflated house pricesin city i during time t (∆Rit) is explained by a specific component of eachsingle city (αi) and a random fluctuation (εit):
(1)
The fluctuation reflects changes in house prices on the national mar-ket (βt) and error persistence in the local component (qi):
(2)
where uit is the stochastic disturbance10. Substituting (2) into equa-tion (1) we obtain:
(3)
To include time effects in our model, we inserted a series of dummyvariables (Tt where t denotes the period of time) in equation (3), andobtained:
(4)
The vector of coefficients (αt) measures local fixed (city-specific) ef-fects in the changes of net advantages for different urban sizes. The vec-tor of coefficients (βt) is representative of the national effects that influ-ence the size advantages. The persistence of local effects over time isrepresented by the vector of coefficients (qi).
The estimate of equation (4) allows us to test the following hypoth-eses:
9. See Grenadier, 1995; Gyorko and Voith, 1992; Jones and Orr, 1999.10. In estimating the model, we hypothesise that the disturbance is characterised by
heteroschedacity, as would logically be expected in cross-section analyses. Forthis reason we estimate the model through the generalised least square method.
itiitR εα +=∆
itititit uq ++= −1εβε
itititiiit uRqqR +∆++−=∆ −1)1( βα
ititit
ttiiit uRqTqR +∆++−=∆ −=∑ 1
4
1)1( βα
12 Urban Growth in Italy: Economic Determinants and Socio-Environmental Consequences

a) βt = 0 for all t. A finding of joint insignificance as it indicates thatthere are no time-varying common components to urban dynamics.It would imply that the dynamic equilibrium relies only on localfactors different across cities, and remains stable over time;b) αi = 0 for all i. This result indicates that there are no local effectsinfluencing net advantages of the different urban sizes;c) αi= αj for all Joint equality indicates that there are no sig-nificant differences in net advantages changes across cities. City-specific differences in persistence of net advantages variation trendsexist. It would imply that, if an optimal city size exists, it is com-mon to all cities;d)qi = 0 for all i. Joint insignificance indicates that there is no per-sistence in the shocks which cause deviations from the optimal citysize. Shock effects take place only in one period, and thus do nothave any effect beyond the current period;e)qi = qj for all . Joint equality in net advantages across citiesindicates that the adjustment process towards the equilibrium (i.e.towards the optimal city size) is the same in all cities.
In addition to the above tests, we shall also test for any structural breakin the parameter values (αi and qi) over time. More specifically, we in-tend to investigate whether the increase in urban attractiveness sincethe mid eighties is the result of a structural change in the national econ-omy, or to a rejuvenation of structural components of local economies.
The time-series cross-section data used to estimate equation (4) arederived from data on existing average home sales prices in core urbanareas obtained from the financial newspaper Sole 24 Ore. Annual houseprice variation series were constructed for the five periods 1969–73,1973–77, 1977–81, 1981–85 and 1985–89. The year 1969 was chosenas the starting point as it is the first available year compatible with thedemographic data used in the descriptive analysis11. The five periodswere chosen in a somewhat arbitrary way, but are each of the samelength: four years. All house price data have been deflated by the rele-vant national consumer price index value (Source ISTAT). The cross-section data is composed of observations on the 20 regional capitals.Table 2 contains a full list of the cities analysed.
The estimates produce some interesting and satisfactory results12.The first element to emerge is that the model has an oscillatory timepattern, shown by the negative values of the parameter q. Moreover, pa-rameter q has a value below unity, which guarantees a convergent timetrend. Convergence implies that there is an equilibrium rent level atwhich the market registers all net advantages associated with an optimalurban size, while the possibility of constant urban growth is excluded.
The oscillatory patterns around an optimal city size may be ex-plained by the nature of these processes: demographic movements orrelocation of economic activities are characterised by strong inertia ef-
11. Data on house prices are in fact available since 1963.12. The model is estimated with a R-square=0.77, a Durbin-Watson test=1.96 and
a F-test=0.000.
ji ≠
ji ≠
3. The Determinants of Urban Dynamics 13
fects, which end well after the equilibrium level. An interesting ques-tion at this stage is to understand whether the cyclical effects are com-mon to all cities, and therefore influenced by national economic cycles,or whether they depend more on the characteristics and evolution ofthe local economy.
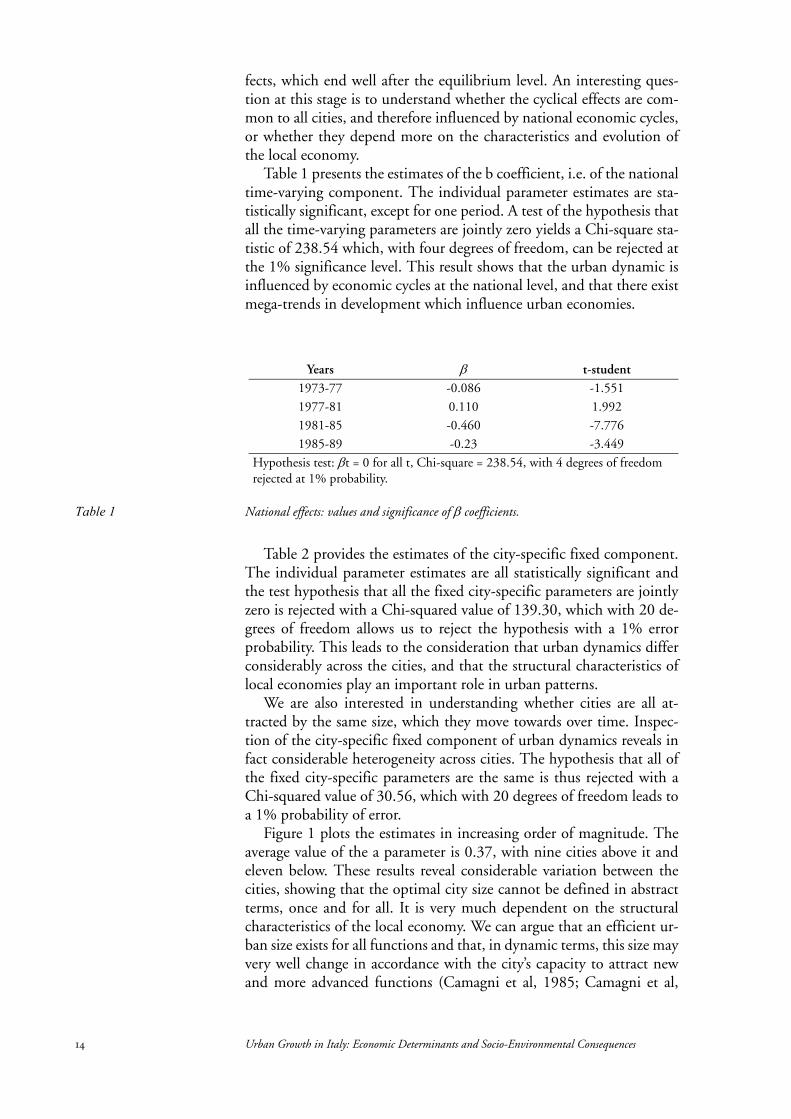
Table 1 presents the estimates of the b coefficient, i.e. of the nationaltime-varying component. The individual parameter estimates are sta-tistically significant, except for one period. A test of the hypothesis thatall the time-varying parameters are jointly zero yields a Chi-square sta-tistic of 238.54 which, with four degrees of freedom, can be rejected atthe 1% significance level. This result shows that the urban dynamic isinfluenced by economic cycles at the national level, and that there existmega-trends in development which influence urban economies.
Table 2 provides the estimates of the city-specific fixed component.The individual parameter estimates are all statistically significant andthe test hypothesis that all the fixed city-specific parameters are jointlyzero is rejected with a Chi-squared value of 139.30, which with 20 de-grees of freedom allows us to reject the hypothesis with a 1% errorprobability. This leads to the consideration that urban dynamics differconsiderably across the cities, and that the structural characteristics oflocal economies play an important role in urban patterns.
We are also interested in understanding whether cities are all at-tracted by the same size, which they move towards over time. Inspec-tion of the city-specific fixed component of urban dynamics reveals infact considerable heterogeneity across cities. The hypothesis that all ofthe fixed city-specific parameters are the same is thus rejected with aChi-squared value of 30.56, which with 20 degrees of freedom leads toa 1% probability of error.
Figure 1 plots the estimates in increasing order of magnitude. Theaverage value of the a parameter is 0.37, with nine cities above it andeleven below. These results reveal considerable variation between thecities, showing that the optimal city size cannot be defined in abstractterms, once and for all. It is very much dependent on the structuralcharacteristics of the local economy. We can argue that an efficient ur-ban size exists for all functions and that, in dynamic terms, this size mayvery well change in accordance with the city’s capacity to attract newand more advanced functions (Camagni et al, 1985; Camagni et al,
Years β t-student1973-77 -0.086 -1.551
1977-81 0.110 1.992
1981-85 -0.460 -7.776
1985-89 -0.23 -3.449
Hypothesis test: βt = 0 for all t, Chi-square = 238.54, with 4 degrees of freedom rejected at 1% probability.
Table 1 National effects: values and significance of β coefficients.
14 Urban Growth in Italy: Economic Determinants and Socio-Environmental Consequences

1986; Pompili, 1986; Diappi and Pompili, 1989; Capello and Ca-magni, 2000).
The last hypotheses to be analysed regards the persistence over timeof the shocks driving cities away from the dynamic equilibrium level,expressed by parameter q. Table 3 presents the estimates of the q pa-rameter for all cities. In only three cities are the individual parameter es-timates statistically significant. However, after running tests on the hy-potheses, we were able to resoundingly reject the hypothesis that all qiare zero, with a Chi-squared value of 53.3 and 20 degrees of freedom.Just as intuition might suggest, given the nature of the processes in-volved, the convergence towards an optimal city size is not instanta-neous. The high financial sunk costs and the personal and social costsof relocation choices prevent demographic changes occurring rapidly:quick adjustments of urban size to unforeseen shocks are simply notfeasible.
Figure 2 plots the persistence estimates of the 20 cities in order ofmagnitude. There is considerable deviation around the average persis-tence level, and the dispersion is greater than in the case of city-specificfixed effects. The high deviation in single estimates is underlined by thefact that the hypothesis of equal persistence across all markets yields aChi-squared value of 37.9, which with 20 degrees of freedom can be re-jected at a 5% error probability. Once again, the structural characteris-tics of local economies influence not only the optimal urban size, butalso the speed of convergence towards this equilibrium. The capacity of
Cities α t-studentAncona 0.343 3.597
Aosta 0.248 4.999
Bari 0.284 3.178
Bologna 0.393 6.085
Cagliari 0.276 3.550
Campobasso 0.535 3.280
Firenze 0.509 8.057
Genova 0.370 6.482
L’Aquila 0.344 5.262
Milano 0.464 4.138
Napoli 0.287 2.301
Palermo 0.450 4.482
Perugia 0.360 4.255
Potenza 0.267 6.442
Reggio Calabria 0.270 2.462
Roma 0.417 4.040
Torino 0.399 6.544
Trento 0.426 5.999
Trieste 0.339 5.489
Venezia 0.413 3.686
Hypotehsis tests: αi= 0 for all i, Chi-squared = 139.30, with 20 degrees of freedom
rejected with 1% error probability; αi = αj for all , Chi-squared = 30.59, with 20 degrees of freedom rejected with 1% error probability.
Table 2 City-Specific Fixed Effects: values and significance of α coefficients.
ji ≠
3. The Determinants of Urban Dynamics 15

the local economy to adjust to unforeseen shocks and to attract higherlevel activities is very different across cities.
Figure 1 City Specific Fixed Effects.
0
0,1
0,2
0,3
0,4
0,5
0,6
Aos
ta
Pote
nza
Cag
liari
Reg
gio
Bar
i
Nap
oli
Trie
ste
Anc
ona
L'A
quila
Peru
gia
Gen
ova
Bol
ogna
Torin
o
Rom
a
Ven
ezia
Tren
to
Pale
rmo
Mila
no
Fire
nze
Cam
poba
sso
Cities
α
-1,7
-1,2
-0,7
-0,2
0,3
Cam
poba
sso
Fire
nze
Torin
o
L'A
quila
Mila
no
Peru
gia
Pale
rmo
Rom
a
Gen
ova
Aos
ta
Tren
to
Anc
ona
Cag
liari
Reg
gio
Cal
abria
Trie
ste
Bol
ogna
Ven
ezia
Pote
nza
Bar
i
Nap
oli
Cities
q
Figure 2 Persistence of shocks.
16 Urban Growth in Italy: Economic Determinants and Socio-Environmental Consequences

3.2. Urban Renewal since the Mid Eighties: Local or National Determinants?
An important empirical question is whether the urban revitalisationprocess which took place after the mid eighties is the result of a struc-tural shift in the parameters of urban dynamics, linked to changes inthe local economy, or the result of the recovery of the national econ-omy as a whole.
To test whether there is a structural break in the model, the samplewas divided into two periods, 1973–85 and 1985–93. The choice of1985 was somewhat arbitrary, chosen on the basis of the historicaltrends of house prices. Using dummy variables to allow for a potentialstructural break, equation (4) was re-estimated.
Table 4 presents estimates of the change in the city-specific compo-nent of urban dynamics from the first period to the second period. Aninspection of the estimates reveals that no cities show a statistically sig-nificant change, indicating that structural changes in the local economy
Cities q t-studentAncona -0.18 -0.37
Aosta -0.24 -0.85
Bari 0.41 1.07
Bologna -0.11 -0.46
Cagliari -0.16 -0.55
Campobasso -1.58 -1.75
Firenze -0.76 -3.69
Genova -0.35 -1.21
L’Aquila -0.62 -2.01
Milano -0.59 -1.55
Napoli 0.56 0.95
Palermo -0.52 -1.19
Perugia -0.56 -1.32
Potenza 0.04 0.15
Reggio Calabria -0.15 -0.27
Roma -0.42 -0.94
Torino -0.67 -2.59
Trento -0.20 -0.86
Trieste -0.13 -0.55
Venezia 0.005 0.01
Hypotheses tests: qi = 0 for all i, Chi-squared=53.3, with 20 degrees of freedom is
rejected at 1% probability; qi = qj for all , Chi-squared=37.9, with 20 degrees of freedom is rejected at 5% probability.
Table 3 Persistence of shocks.
ji ≠
3. The Determinants of Urban Dynamics 17

had no influence on the revitalisation of urban areas. It is logical to ex-pect, therefore, that the positive effects on urban dynamics stem fromthe positive national economic cycle of those years.
It is legitimate at this stage to ask an empirical question: do the pos-itive effects of a growing national economy affect all cities or, as intu-ition and the descriptive analysis would suggest, mainly the large cities.Inspection of changes in the persistence of shocks over time reveals thatthe speed of adjustment towards equilibrium is significant for two largecities, Milan and Rome. These cities show a quicker response to unfore-seen shocks, demonstrated by the low value of the parameter q. Naples,on the other hand, seems to have a low speed of convergence towardsequilibrium, probably due to the general inefficiency of large cities inthe South (Table 5).
Cities ∆α P-valueAncona 0.01 0.96
Aosta -0.1 0.27
Bari 0 0.98
Bologna -0.08 0.66
Cagliari -0.11 0.57
Campobasso 0.12 0.47
Firenze -0.08 0.69
Genova -0.06 0.56
L’Aquila -0.03 0.84
Milano -0.21 0.19
Napoli -0.14 0.31
Palermo -0.01 0.98
Perugia -0.01 0.93
Potenza -0.03 0.83
Reggio Calabria 0.04 0.84
Roma -0.24 0.06
Torino -0.08 0.61
Trento -0.10 0.67
Trieste -0.09 0.66
Venezia 0.02 0.92
Table 4 Absolute changes in the city-specific components of urban dynamics (1973-85 to 1985-93).
18 Urban Growth in Italy: Economic Determinants and Socio-Environmental Consequences

This analysis verifies two important phenomena, as it provides evi-dence that: a) the increase in urban attractiveness after 1985 was the re-sult of the good performance of the national economy, b) the economicrelaunch did not have positive effects on all cities, but in particular It-aly’s two main metropolitan cities, Milan and Rome, where the speed ofadjustment to unforeseen shocks increased in that period. This resultconfirms that the revitalisation process of the metropolitan areas sincethe middle eighties has been based on the integration and reinforce-ment processes developed by large firms in anticipation of the imple-mentation of the Common Market (Camagni, 1990).
3.3. Determinants of urban advantages and urban costs
In Section 3.1 we speculate on some results, arguing that an efficienturban size exists for each city according to its functional characteristicsand accroding to the city’s capacity to attract new and more advancedfunctions. In this Section we analyse whether this is true in the case ofItalian cities.
The analysis we present is based on two indicators: the “city effect”indicator, which contans all positive externalities associated with an ur-
Cities ∆q P-valueAncona 1.34 0.66
Aosta -0.64 0.25
Bari 1.62 0.16
Bologna 0 0.20
Cagliari -0.33 0.29
Campobasso 1.33 0.12
Firenze -0.41 0.57
Genova -0.55 0.42
L’Aquila 0.13 0.87
Milano -1.48* 0.007
Napoli 0.38* 0.006
Palermo 1.44 0.26
Perugia 0.48 0.39
Potenza 0.49 0.27
Reggio Calabria 0.47 0.78
Roma -1.35* 0.001
Torino -0.77 0.33
Trento -0.23 0.50
Trieste -0.24 0.43
Venezia 0.21 0.84
* Significant at 1% level
Table 5 Absolute change in the persistence of shocks (1973-85 to 1985-93).
3. The Determinants of Urban Dynamics 19

ban location, and the “urban overload indicator”, measuring on its turnthe disadvantages associated with an urban location. Table 6 presentsthe data used to built the two indicators13. The database on which theseindicators have been built regards 58 Italian cities and refers to the year1991. The geographical area analysed is the urban agglomeration area.
Figure 3 (graphs a and b) shows the estimated city effect and urbanoverload functions for different levels of urban size. In economic terms,the calculated parameters reflect the elasticity of the city effect with re-spect to size, i.e. how the city effect and urban overload change with anincrease in size of 1%, for different urban sizes. The results obtained arein line with the abstract interpretation of the optimal urban size theory.In fact, the curves are “well-behaved”, showing a city-effect which in-creases with urban size up to a certain point (approximately 361,000inhabitants) and then decreases. As far as the city effect is concerned,the results in fact show the possibility for a city to exploit:+ economies of scale. Our analysis shows that economies of scale exist
for public services (like schools, public transport and banks), butalso environmental resources, like water, petrol and energy use;
+ indivisibities of public services in general, since the larger the city,the greater the possibility of exploiting a critical mass of users.
13. Each data has been divided by its maximum value, in order to standardise thedifferent values and thus sum the different indices. The general "city-effect" in-dicator is in fact calculated as the unweighted sum of the different indices ob-tained; the indices refer to cross-effects between the different environments, andtherefore the choice of a weighted sum would imply an arbitrary choice ofweighs. The first group of indices, relating to the interaction between the eco-nomic and the natural environment enter the sum with their "complement toone" value, reflecting their negative correlation with city size.
Interaction between eco-nomic and physical envi-
ronment
Interaction between eco-nomic and social environ-
ment
Interaction between social and physical environment
City effect Indicator (ALB)
Per capita energy usePer capita petrol usePer capita water use
Number of graduates/popula-tion
Number of schools/popula-tion
Number of banks/population
Supply of public services/pop-ulation
Urban rent per sq. m.
Square meters of green areas in city per capita
Urban overload Indicator (ALC)
Per-capita NOx emissions
Per capita kg of urban waste
Number of vehicles per sq. m.
Unemployment/population Number of murders/popu-lation
Table 6 Statistical Definition of City Effect and Urban Overload Indicators.
20 Urban Growth in Italy: Economic Determinants and Socio-Environmental Consequences

The city effect, however, is exploited up to a certain urban size, afterwhich its slope becomes negative. The expected congestion effects anddiseconomies of scale prevail in large cities (Figure 3a).
As far as the urban overload effect is concerned, our results show adecreasing trend up to a certain urban size (approximately 55,500 in-habitants) and an increasing trend afterwards, once again in line withthe traditional expectations. Two elements seem to generate this trend:
Urban size
Network integration level Network integration level
Presence of high level functions Presence of high level functions
Urbanoverload
Urbanoverload
Urbanoverload
Urban size
a) b)
c) d)
e) f)
361.000 55.500
49%
Critical mass of users
City effect
City effect
City effect
Figure 3 Estimated City Effect and Urban Overload.
3. The Determinants of Urban Dynamics 21

+ in small cities, an economic and territorial effect. For very small cities,the results show that an increase in the physical dimension decreasesurban overload, in terms of unemployment rates and all the socialdiseases associated with a peripheral local economy, dependentupon larger surrounding centres;
+ in large cities, a negative environmental effect. For larger urban areasthe results are the opposite: the increase in urban size increases thelevel of overload. The explanation is related to the natural environ-ment indices contained in the general overload indicator. Large cit-ies pollute more and generate more environmental damage thanmedium ones; higher levels of production, linked to increasingphysical urban size, is likely to mean a higher pollution density.
The picture changes when the analysis is made on the basis of the dif-ferent types of economic functions which can characterise a city. Theresults are quite interesting. As far as the city effect is concerned, theseresults show that higher order functions guarantee a greater city effect,due to the positive returns generated (Figures 3c and 3d). Only if thecity achieves a substantial share of tertiary activities (49% of its total ac-tivities), can it exploit the advantages of urban size.
The urban overload effects increase at a decreasing rate when there isa strong presence of high level functions14. This means that the increasein tertiary activities tends to entail congestion and location costs, butthat this negative aspect does not occur in a disruptive and uncontrol-lable way, as in the case of increasing urban size (Figure 3d). The urbanoverload effect increases at a decreasing rate, which indicates thathigher order functions produce economic development and also localcongestion costs, but with a decreasing marginal productivity, and thusin a more controlled way. The decreasing order of magnitude withwhich overload is generated in the presence of higher order functionsmay be explained by the following reasons:+ from the point of view of environmental indices involved in the
overload indicator: a) tertiary activities are by definition less pollut-ing activities than industrial ones, b) higher income level communi-ties (stemming from economies based on higher order functionsand higher profit levels) treat the environment as a luxury good,due to the emergence of new social values with respect to the envi-ronment (Camagni, 1996). These results are in line with the appar-ent paradox described by Baldwin (1995) in his provocative andvery important statement: “sustainability requires growth”;
+ from the point of view of the economic and social costs involved inthe overload indicator, tertiary activities have in the last decade beencharacterised by high employment rates, and thus a higher percent-age of these activities in a city guarantees a lower level of social dis-ease resulting from the lack of jobs;
14. High order economic functions developed in the city are estimated as the shareof private tertiary value-added produced by the city is used.
22 Urban Growth in Italy: Economic Determinants and Socio-Environmental Consequences
+ from the economic point of view, the increasing overload is the con-sequence of the broad economic development that higher orderfunctions generate. Higher order functions stimulate strong eco-nomic development because of their capacity to generate greatermultiplicative effects than more traditional functions. This is amechanism which has been widely overestimated in the empiricalanalysis.
The results of the size elasticity of the city effect and urban overload fordifferent levels of network integration15 produce an interesting picture(Figure 3e and f).
As far as the city effect is concerned, the city effect decreases up to acertain level of network integration, when it starts to increase. These re-sults are stimulating, since they suggest that:+ for low levels of network integration, advantages of autarchy and
independence take place, although these results seem to be statisti-cally weak;
+ when the network integration process starts, cities are vulnerableand are weak partners, risking in general being exploited by the net-work, rather than exploiting the advantages of a network. Thisresult is in line with the general idea that being part of a networkdoes not necessary mean obtaining advantages from it (Camagni,1994; Capello, 1994). As expected, this is true up to a certain levelof network integration;
+ after a certain threshold level, the city is able to exploit the advan-tages associated with the interconnected economy and networkexternality advantages are in full operation16. Through the network,the city is able to exploit more dispersed information collection, theacquisition of more know-how and more qualified input factors, aswell as a wider market for final goods.
For the urban overload effect, the picture which emerges is similar tothat for different levels of high order functions (Figure 3f). When thelevel of network integration increases, urban overload increases, too.This is what would be expected: higher levels of network integrationstimulate more economic activities and generate higher city effects, butwith the negative counterpart of an increasing overload.
What is rather interesting is that urban overload has decreasinggrowth rates. Again, this result is different from the exploding situationwhich occurs when the city size is taken into consideration. As the level
15. The level of network integration of the city with the rest of the world is calculat-ed, because of the lack of statistical information on the flows of interaction be-tween our sample cities (duration of phone calls or number of phone calls) forthese groups of cities, as the stock of per capita telephone subscribers. However,the share of flows of international phone calls (both duration and number ofphone calls) and the per capita telephone subscribers available for a differentgroup of cities (municipalities) in the metropolitan areas of Milan have shown acorrelation equal to 0.80.
16. See the vast literature existing on network externalities (among others, Hayashi,1992 and Rohlfs, 1974).
3. The Determinants of Urban Dynamics 23

of network integration increases, positive mechanisms come into effect,decreasing the size elasticity of the overload:+ from the economic point of view, as the city increases its ability to
exploit network externality advantages, unemployment and socialdiseases related to a stagnating economy decrease;
+ from an environmental point of view, the city economy increases viathe network, by keeping under control the local pressure in terms ofenvironmental costs. The networked city can reorganise its produc-tion system by decentralising the most polluting and less attractivefunctions, while specialising in higher order functions, like controland decision-making processes. In this way, it benefits from theadvantages of an expanding economy, while keeping environmentalcosts and local pressures under control.The results are quite interesting. Through the investigation of a
number of hypotheses, it is revealed that an optimal city size does exist,but that it differs from one city to another, depending on the structuralcharacteristics. Functional structure and the spatial organisation of ac-tivities appear to be the main reasons for the differences.
24 Urban Growth in Italy: Economic Determinants and Socio-Environmental Consequences

4. Socio-Environmental Consequences of the Urbanisation Process
The wide urbanisation process underway in the Italian cities is unfor-tunately accompained by high environmental and social costs. Thesecosts are often the result of the high speed with which the urbanisationprocess takes place, and which does not allow the necessary structuraltransformations cities have to go through in order to avoid the pressureon the environmental and social sphere. Cities should in fact modify a)their functions towards more advanced functions, characterised byincreasing productivity, b) their infrastructures and their supply ofpublic transport, which should be more in line with the new life styles,c) the planning, taking into consideration more green areas in citiesotherwise too much densely populated, d) their capacity of crontrol-ling the quality of peripheral settlements in order to avoid too high lev-els of social segregation. All these changes need time, planning, and arhythm of change which is much slower than the urbanisation processunderway in Italian cities.
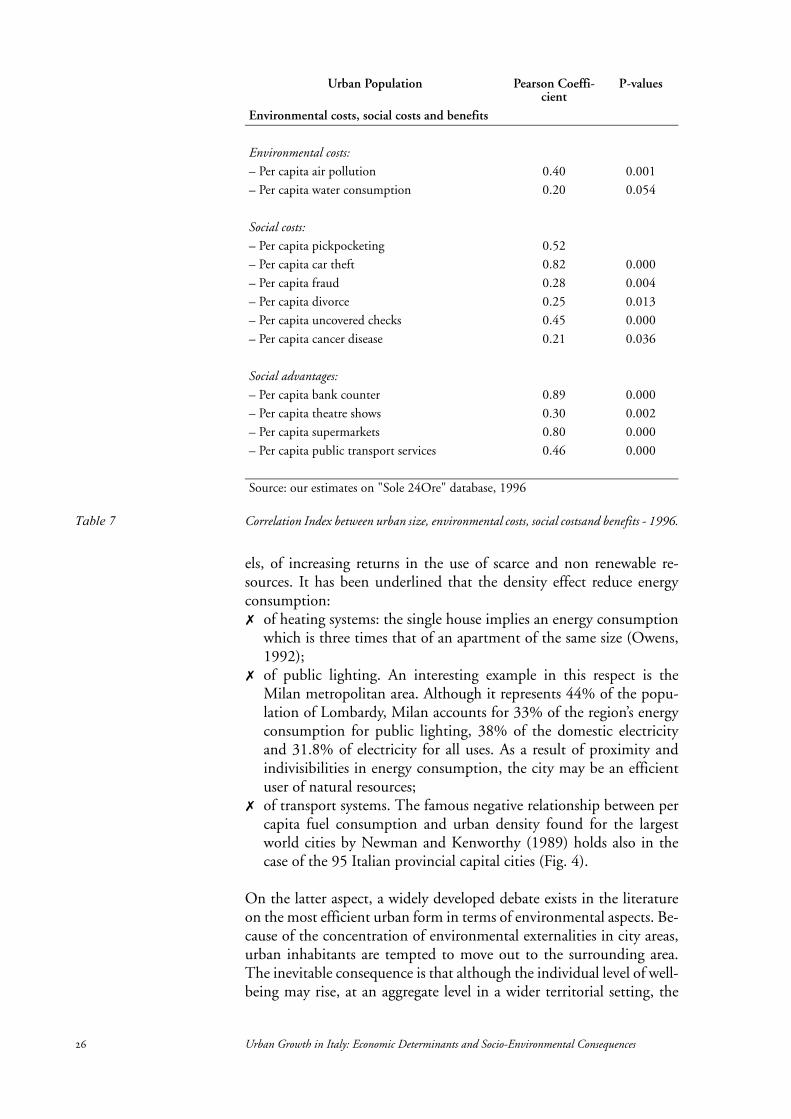
The social and environmental costs of urban expansion have in re-cent years come to the fore. Public opinion is more and more sensible toenvironmental problems. Each year a classification of cities is pub-lished, raking cities in terms of their quality of life; despite the method-ological ciriticisms one can easily move to these classifications, espe-cially on the way a synthetic indicator is built, single indicators on so-cial and environmental costs are interesting. A correlation analysis be-tween the size of cities and environmental and social costs, from oneside, and social advantages, from the other, clearly shows that (Table 7):+ the higher environmental costs are present in larger cities; water
consumption and air pollution increase for increasing urban sizes;+ by the same token, social costs are greater for larger urban size;+ however, larger cities seem to offer the highest social advantages; per
capita banks, theatres events, supermarkets, urban public transportare all positively associated with urban size.
It is thus undeniable that social and environmental costs are exhacer-bated in large cities, due to congestion effects. On the other hand, wehave to recognise that many of these negative effects are also highly vis-ible as a consequence of the mass and high density effect. If the sameamount of economic activity were to take place in a more diffused ter-ritorial pattern, the spatial concentration of emissions would be re-duced, but the absolute consumption of natural resources (e.g. energyand land) would be much greater. In other words, the concentration ofactivities and proximity are not only a precondition for social interac-tion and economic efficiency, but also are the source, up to certain lev-
4. Socio-Environmental Consequences of the Urbanisation Process 25
els, of increasing returns in the use of scarce and non renewable re-sources. It has been underlined that the density effect reduce energyconsumption:+ of heating systems: the single house implies an energy consumption
which is three times that of an apartment of the same size (Owens,1992);
+ of public lighting. An interesting example in this respect is theMilan metropolitan area. Although it represents 44% of the popu-lation of Lombardy, Milan accounts for 33% of the region’s energyconsumption for public lighting, 38% of the domestic electricityand 31.8% of electricity for all uses. As a result of proximity andindivisibilities in energy consumption, the city may be an efficientuser of natural resources;
+ of transport systems. The famous negative relationship between percapita fuel consumption and urban density found for the largestworld cities by Newman and Kenworthy (1989) holds also in thecase of the 95 Italian provincial capital cities (Fig. 4).
On the latter aspect, a widely developed debate exists in the literatureon the most efficient urban form in terms of environmental aspects. Be-cause of the concentration of environmental externalities in city areas,urban inhabitants are tempted to move out to the surrounding area.The inevitable consequence is that although the individual level of well-being may rise, at an aggregate level in a wider territorial setting, the
Urban Population Pearson Coeffi-cient
P-values
Environmental costs, social costs and benefits
Environmental costs:– Per capita air pollution 0.40 0.001
– Per capita water consumption 0.20 0.054
Social costs:– Per capita pickpocketing 0.52
– Per capita car theft 0.82 0.000
– Per capita fraud 0.28 0.004
– Per capita divorce 0.25 0.013
– Per capita uncovered checks 0.45 0.000
– Per capita cancer disease 0.21 0.036
Social advantages:– Per capita bank counter 0.89 0.000
– Per capita theatre shows 0.30 0.002
– Per capita supermarkets 0.80 0.000
– Per capita public transport services 0.46 0.000
Source: our estimates on "Sole 24Ore" database, 1996
Table 7 Correlation Index between urban size, environmental costs, social costsand benefits - 1996.
26 Urban Growth in Italy: Economic Determinants and Socio-Environmental Consequences

volume of environmental pollution will rise due to reduced advantagesof scale and increased transportation needs. This is a well recognisedmodern social dilemma.
A diffused pattern of urban development, almost by definition, can-not be adequately served by the public transport infrastructure since thedemand density is low, the scattering of the demand over the territory ishigh and the dispersion of destinations is also growing because of thesuburbanisation of jobs (Camagni et al., 2001). The compact city hasthe great advantage of keeping the home-job commuting under con-trol, with a positive effect on urban mobility, on air and noice pollu-tion. With regard to the Italian case, the relationship between urbandensity and air pollution in the 95 provincial capital has turned out toshow a high correlation, equal to 0.6.
The double role of the city of being a saving system of natural re-sources and a producer of negative environmental externalities at thesame time is also witnessed by an econometric estimate of the elasticity
Figure 4 Relationship between per capita fuel consumption and urban density.
PC SP IM BL
SV RA
GO
Cuneo
BZ VR
Asti Cremona Pavia
Bologna Modena
SO
Udine Vicenza
Reggio Em. Treviso
Venezia Padova
Bergamo
Torino
Milano
Trieste
VareseGenova
Trento
Novara
Como
Aosta
Vercelli Forlì
Ferrara
PR AL BS MN
PN RO
22,00
24,00
26,00
28,00
30,00
32,00
34,00
36,00
38,00
40,00
42,00
44,00
46,00
48,00
50,00
52,00
54,00
56,00
58,00
60,00
62,00
64,00
66,00
68,00
0 200 400 600 800 1000 1200 1400 1600 1800 2000
Urban Density
Per capita fuel consumption
Source: Capello and Hoffman, 1998
4. Socio-Environmental Consequences of the Urbanisation Process 27

of urban income to environmental resources, from one side, and nega-tive externalities from the other. The results of the elasticities are shownin Fig. 5 and Fig. 6 (Capello, 1998b), and may be summarised as fol-lows:+ strong economies of scale exist in the use of environmental
resources (Fig. 5). The largest city has the highest elasticity of urbanincome to environmental resources;
+ on the other side, the elasticity of urban income to negative envi-ronmental externalities are negative the higher the city size (Fig. 6),witnessing a lower level of agglomeration economies in larger citiesdue to negative environmental externalities.
Given the double nature of urban areas for what concerns environmen-tal aspects, it is reasonably to suggest some policies in order to keep en-vironmental costs under control, without losing the advantages associ-ated with a dense and large urban settlement.
28 Urban Growth in Italy: Economic Determinants and Socio-Environmental Consequences

5. Policy Actions for an Urban Sustainability Growth
Given the fact that “urban way of living” is the dominant form of “res-idential style”, some policy actions have to be suggested for a “sustain-able urban growth”.
The time horizon of urban action-oriented sustainability policies istwofold; a short term and a long term horizon. The short term horizoninterpretes policy goals as the selection of production factor combina-tions, transport modes and behavioural patterns oriented towards amore careful control on urban environment; it allows a substitution forless environmentally sustainable activities, behaviours and productiontechniques with more environment-friendly ones. The second time ho-rizon which can be envisaged is a long term horizon; in this case, sus-tainable city policies are oriented towards a structural change in activi-ties, behaviours and technologies. While in the first case, the short termperspective, the idea is the substitution and selection of more sustain-ability-oriented urban actions, in the second case, the long term per-spective, the logic driving policy goals is a logic of radical change andstructural revision of choices related to urban activities, urban formsand technology (Camagni et al., 1998).
Two main fields of intervention policies may be envisaged for a cityto drive it towards urban sustainability; technology and territory (see Ta-ble 8). The first and more common area of intervention is technology;a reduction in the use of less polluting technologies is one way of keep-ing environmental constraints under control, through less pollutingtransport means, less polluting heating systems, and in general througha more efficient energy use. Input substitution becomes in this way theshort run aim of urban sustainability policy; through the substitutionof more polluting and high energy consumption technology with moreefficient ones, a certain level of production is guaranteed, with advan-tages in terms of better quality of the urban environment. On the otherhand, many studies have developed the notion of “zero-emission city”and of “electrified urban areas”, to underline the strategic role whichtechnology may play in solving urban environmental problems. Thesenotions are related to a long run technological policy, which may envis-age a natural resources-benign technological change as a long term goal.In this perspective, a theoretical urban production function would notonly present a different mix between less polluting factors and morepolluting ones, but would guarantee higher production level with thesame exploitation of energy and polluting inputs (see Table 8). Inter-vention policies in this field are rather important. A “good market”which would internalise in its price mechanisms negative externalitiesassociated with urban economic activity and realised through both in-
5. Policy Actions for an Urban Sustainability Growth 29

stitutional and market-based measures, finds its a more profound ratio-nale not just in the short term disincentive to polluting inputs and ac-tivities, but in the long-term orientation of technological efforts to-wards sustainability.
Technology may in fact be the way in which the interaction betweenthe economic and physical environments in a city is controlled. Tech-nological upgrading in terms of energy use in urban areas offers manyopportunities to the economic sphere, guaranteeing the same (or evenmore efficient) production system; at the same time it allows the eco-nomic system to control the negative external effects that its activitiesgenerate on the natural environment. This field of action strengthens
Figure 5 Economies of scale in the use of environmental resources.
Source: Capello, 1998b
Urban size
Urb
an in
com
e el
asti
city
to
envi
ronm
enta
l res
ourc
es
Figure 6 Urban income elasticity to negative environmental externalities.
Source: Capello, 1998b
Urb
an in
com
e el
asti
city
to
nega
tive
env
iron
men
tal e
xter
nalit
ies
Urban size
30 Urban Growth in Italy: Economic Determinants and Socio-Environmental Consequences

the positive external effects associated with the interaction of the twoenvironments – such as efficient energy use, efficient use of non-renew-able natural resources – and keeps the negative external effects undercontrol. Water pollution, air pollution, traffic congestion and depletionof natural resources may be improved with the introduction of techno-logical-benign production systems.
To achieve these goals at an urban level, a series of market-basedtools exist which may drive urban actors towards the use of less pollut-ing technologies; incentives, taxes and discriminatory prices on energyare all examples of market mechanisms driving the urban system to-wards the exploitation of less polluting technological systems. Institu-tional regulations, through discriminatory pricing in regulated servicesand limits in the use of specific polluting technologies, help in this di-rection.
Technology does not represent the only field where urban sustain-ability policies should act. In the past few years, several attempts havebeen undertaken in different countries to identify optimal structures ofurban form that would minimise energy consumption and environ-mental pollution. The territorial form of an urban system, in fact, andthe organisation of its activities in space, is a second field of interven-tion which may lead towards urban sustainability. An example of this isthe compact city idea, which contains the idea to minimise travel mo-bility patterns and thus energy use. A systematic identification andanalysis of alternative urban configurations from the viewpoint of sus-tainable development and a critical judgement of such options seemnecessary, as an uncritical implementation of common wisdom (likethe compact city movement) does not necessarily lead to more environ-mental-friendly outcomes (Breheny, 1992).
Parallel to what happens with regard to the technological field, alsoin the field of territorial organisation we can separate short-term andlong-term “visions” and strategies. In the short run the aim of urbansustainability policies is addressed towards a change in mobility pat-terns and modal choice. The shift from private cars to less pollutingtransport means may be achieved via institutional tools such as regula-tions in congested areas (i.e. traffic restrictions in core areas of thetown) so as to influence travel behaviour. This is made possible throughincentives and prices on scarce resources and through strict infrastruc-ture regulations (Table 8).
In the long run, a change in urban form may become the goal of ur-ban sustainability policy; this implies not only a change in mobility pat-terns of urban residents, but also a change in urban locations and land-use patterns. It is recognised that environmental interests are usuallynot incorporated in regional and urban development planning, espe-cially in Third World cities, and normative guidelines – based, for ex-ample, on carrying capacity and regenerative capacity – are often absentfrom the planning process (Nijkamp, 1996). An effort in this directionis for sure a good strategy towards urban sustainability: it is a strategywhich guarantees the same urban performance – in terms of activitylevels – by reducing pressure on the carrying capacity of the urban en-vironment. As is the case for technological change, also territory could
5. Policy Actions for an Urban Sustainability Growth 31

be exploited in a way that the spatial allocation of urban activities min-imises energy consumption and pollution emissions without limitingeconomic activities.
Territory is a field of action where urban sustainability policies mayact on the interaction between the physical and the social environ-ments. A different urban form, favouring urban sustainability, strength-ens the positive external effects associated with the interaction of thephysical and social environments, granting green areas for social amen-ities, better residential facilities, and higher accessibility to urban envi-ronmental amenities.
Finally, a third and less clearly identified field of possible policy in-terventions is personal “life-styles”; also in this area urban sustainabilitypolicies may play a role, although one can immediately foresee a muchmore limited space for these kinds of policies, since they impact directlyon the private sphere and on behavioural choices of individuals.
In advanced countries the present life-style is the result of increasingper-capita income, and energy prices that do not include the full socialcosts of energy use. The number of private car ownerships is high andincreasing, as well as the density of electrical appliances per family.High mobility in leisure time is also something which belongs to com-mon social behaviour in modern societies. All these habits may be in-fluenced by urban sustainability policies, such as differenciated price ofelectric energy by hours of the day, so as to influence energy use for pri-vate needs in peak hours. If these are short term policies, long term onesshould try to orient structural changes in social behaviour embeddingmore environmentally-oriented attitudes.
Fields Technology TerritoryTools and goals
Short run Long run Short run Long run
Market-based tools
Incentives to use less polluting transport meansTax on energy resourcesDiscriminatory prices and taxes on energyMarketable emission rights
Incentives to R&D for environmental-benign technologies
Incentives to reuse dere-lict areasPricing on scarce resources (parking, road pricing)Incentives to provide and use technologies against congestions (traffic control systems)
Incentives to supply environmental values in peri-urban areasIncentives for long dis-tance transport meansLong distance trans-port means provision
Institu-tional tools
Discriminatory pricing in regulated services
Limits in the use of spe-cific polluting technolo-gies
Regulation for con-gested areas
Regulation for unused landPublic transport provi-sionRegulation for the use of certain materials
Goals Input substitution Natural resources-benign technological change
Change in mobility pat-terns and modal choice
Change in urban form
Source: Camagni et al., 1998
Table 8 Aims and Tools of Urban Environmental Policies.
32 Urban Growth in Italy: Economic Determinants and Socio-Environmental Consequences

In these three fields, and especially in the technology and territoryfield, there is ample space for urban sustainability policies. Althoughthe fields of possible normative action are clear and evident, other prob-lems related to urban sustainability policy remain open. In particulardistributive and equity effects of the costs associated to specific urbansustainable policies remain an open question.
5. Policy Actions for an Urban Sustainability Growth 33

6. Conclusions
The aim of the present paper was to study urban dynamics in Italy andto identify the determinant factors, in order to establish whether anefficient city size exists in terms of both social and environmentaladvantages associated with urban size. This was achieved by adoptingsome methodological approaches which were innovative with respectto the traditional econometric analyses used to estimate urban econo-mies or diseconomies of scale. The advantages and costs of urban sizewere measured through urban rent, and in particular the level of houseprices, since these represent a concise indicator of location choices andreact rapidly to change. This indicator has been analysed from both adescriptive and interpretative point of view, the latter through the esti-mate of a time-series cross-section econometric model.
In the descriptive part of the study, it emerged that, since the mideighties, there has been an increase in the attractiveness of urban areasin Italy. The main determinant of this revitalisation process would seemto be the relaunch of the national economy, rather than the good per-formance of local economies. Moreover, evidence is provided that goodnational economic performance has not influenced all urban econo-mies equally, but has tended to generate positive effects primarily on It-aly’s main metropolitan cities: Milan and Rome. In fact, these two citieshave shown an increase in the speed of convergence towards equilib-rium, revealing an increase in the capacity to adjust to unforeseenshocks. On the basis of these results, we can conclude that the urban re-vitalisation of the mid eighties may be interpreted as a positive effect ofthe implementation of the Common Market, whose economic model isbased on activities and economic functions largely located in metropol-itan areas.
Moreover, the paper presents empirical evidence of the social andenvironmental costs associated with large urban sizes. However, al-though clear evidence exists on the role of “polluters” played by largecities, the paper also presents data on the positive effects that large citysize can play on environmental aspects, like energy consumption,thanks to the density effect. For this reason, and for the positive socialagglomeration effects that stem from a large city size, urban growthcannot be forcely stped. On the contrary, urban policies have to be de-veloped, able to keep environmental costs under control, and at thesame time to support urban growth.
34 Urban Growth in Italy: Economic Determinants and Socio-Environmental Consequences

Bibliographical References
[1] Baldwin R. (1995), “Does sustainability require growth?”, in Goldin I. and WintersA. L. (eds.), The economics of sustainable development, Cambridge University Press,pp. 51–82
[2] Breheny M. (1992), “Sustainable Devlopment and Urban Form: an Introduction”,in Breheny M. (a cura di), Sustainable Development and Urban Form, Pion, Londra
[3] Camagni R. (1990), “Le aree metropolitane e gli effetti del 1992”, Territorio, 5, pp.109–120
[4] Camagni R. (1990), “Le Aree Metropolitane e gli Effetti del 1992”, Territorio, n. 5,pp. 109–120
[5] Camagni R. (1994), “From City Hierarchy to City Networks: Reflections about thean Emerging Paradigm”, in Lakshmanan T.R. and Nijkamp P. (a cura di), Structureand Change in the Space Economy: Festschrift in honor of Martin Beckmann, SpringerVerlag, Berlin, pp. 66–87
[6] Camagni R. (1996), “Città in Europa: Globalizzazione, Coesione e Sviluppo Sos-tenibile”, in Aa.Vv., Sviluppo del Territorio Europeo, Presidenza del Consiglio deiMinistri, Dipartimento Politiche Comunitarie, Polografico dello Stato, Roma
[7] Camagni R. and Pompili T. (1990), “Competence, Power and Waves of UrbanDevelopment: the Italian Experience”, in Nijkamp P. (ed.), Sustainability of UrbanSystems: a Cross-national Evolutionary Analysis of Urban Innovation, Avebury-Alder-shot, pp. 37–86
[8] Camagni R. and Pompili T. (1991), “La rendita fondiaria come indicatore delladinamica urbana: un’indagine empirica sul caso italiano”, in Boscaii F. and Gorla G.(eds.), Economie locali in ambiente competitivo, Franco Angeli, Milan, pp. 41–66
[9] Camagni R., Capello R. e Nijkamp P. (1998), “Towards Sustainable City Policy: anEconomy, Environmental, Technology Nexus”, Ecological Economics, vol. 24, no. 1,january, pp. 103–118
[10] Camagni R., Curti F. and Gibelli M.C. (1985), “La città tra sviluppo e declino”, inBianchi G. and Magnani I. (eds.), Sviluppo multiregionale: teorie, metodi, problemi,Franco Angeli, Milan, pp. 197–234
[11] Camagni R., Diappi L. and Leonardi G. (1986), “Urban Growth and Decline in aHierarchical System: a Supply-oriented Dynamic Approach”, Regional Science andUrban Economics, Vol. 16, pp 145–160
[12] Camagni R., Gibelli M.C. e Rigamonti P. (2001), “Urban Mobility and UrbanForm: the Collective Costs of Alternative Urban Expansion Typologies”, EcologicalEconomics, forthcoming
[13] Capello R. (1994), Spatial Economic Analysis of Telecommunications Network Exter-nalities, Avebury, Aldershot
[14] Capello R. (1998a), “Economies d’échelle et taille urbaine: théorie et étudesempiriques révisités”, Revue d’Economie Régionale et Urbaine, 1, pp. 43–62
[15] Capello R. (1998b), “Urban Return to Scale and Environmental Resources: an Esti-mate of Environmental Externalities in an Urban Production Function”, Interna-tional Journal of Environment and Pollution, vol. 10, n. 1, pp. 28–46
Bibliographical References 35

[16] Capello R. and Camagni R. (2000), “Beyond Optimal City Size: an Evaluation ofAlternative Urban Growth Patterns”, Urban Studies, Vol. 37, n. 9, pp. 1479–96.
[17] Capello R. e Hoffmann A. (1998), “Globalizzazione e sostenibilità: le sfide a livellourbano e rurale”, in Capello R. e Hoffamnn A. (a cura di) (1998), Sviluppo Urbano eSviluppo Rurale tra Globalizzazione e Sostenibilità, Franco Angeli, Milan, pp. 13–41
[18] Catin M. (1991), “Economies d’agglomeration et gains de productivité”, Révued’Economie Régionale et Urbaine, 5, pp. 565–598
[19] Diappi L. and Pompili T. (1989), “Sistemi di città come reti di interazione: unapproccio dinamico di tipo Löschiano”, in Martellato D. and Sforzi F. (eds.), Studisui sistemi urbani, Franco Angeli, Milan, pp. 265–291
[20] Grenadier S. (1995), “Local and National Determinants of Office Vacancies”, Jour-nal of Urban Economics, Vol. 37, pp. 57–61
[21] Gyourko J. E. and Voith R. (1992), “Local Market and National Components inHouse Price Appreciation”, Journal of Urban Economics, Vol. 32, pp. 52–69
[22] Hayashi K. (1992), “From Network Externalities to Interconnection: the ChangingNature of Networks and Economy”, in Antonelli C. (ed.), The Economcs of Informa-tion Networks, North-Holland, Amsterdam, pp. 195–216
[23] Henderson J. (1985), “Economic Theory and the Cities, Academic Press, Orlando
[24] Henderson J. (1996), “Ways to Think About Urban Concentration: NeoclassicalUrban Systems vs. the New Economic Geography”, International Regional ScienceReview, Vol. 19, Nos. 1 & 2, pp.31–36
[25] Hernderson J. (1974), “The Sizes and Types of Cities”, The American EconomicReview, Vol. 64, pp. 640–656
[26] Jones C. and Orr A. (1999), “Local Commercial and Industrial Rental Trends andProperty Market Constraints”, Urban Studies, Vol. 36, no. 2, pp. 223–237
[27] Kamashima T. (1975), “Urban Agglomeration Economies in Manufacturing Indus-tries”, Papers of the Regional Science Association, Vol. 34.
[28] Klaassen L., Molle W. and Paelink J. (eds.) (1981), Dynamics of Urban Development,Gower, Aldershot
[29] Ladd H. (1992), “Population Growth, Density and the Costs of Providing PublicServices”, Urban Studies, Vol. 29, no. 2, pp. 237–295
[30] Marelli E. (1981), “Optimal City Size, the Productivity of Cities and Urban Produc-tion Functions”, Sistemi Urbani, Vol. 1–2, pp. 149–163
[31] Newman P. W. e Kenworthy J. R. (1989), “Gasoline Consumption and Cities: aComparison of U.S. Cities with a Global Survey”, Journal of the American PlanningAssociation, n. 1, pp. 24–37
[32] Nijkamp, P. (1996), Improving Urban Environmental Quality: Socioeconomics Pos-sibilities and Limits, Urban Poverty in Asia, a Survey of Critical Issues (E.M. Pernia,ed.), Oxford University Press, Hong Kong, 241–292.
[33] Owens S. (1992), “Energy, Environmental Sustainability and Land-use Planning”, inBreheny M. (a cura di) Sustainable Development and Urban Form, Pion, Londra
[34] Pompili T. (1986), “”Funzioni economiche, sviluppo urbano e tirannia della città”,in Camagni R. and Malfi L. (eds.), Innovazione e Sviluppo nelle Regioni Mature,Franco Angeli, Milan, pp. 163–187
[35] Richardson H. W. (1972), “Optimality in city size, systems of cities and urban pol-icy: a sceptic’s view”, Urban studies, pp. 29–47
[36] Rohlfs J. (1974), “A Theory of Interdependent Demand for a Communication Ser-vice”, The Bell Journal of Economics and Management Science, n. 5, pp. 16–37
36 Urban Growth in Italy: Economic Determinants and Socio-Environmental Consequences

[37] Rousseaux M.P. and Proud’homme R. (1992), Les Bénéfices de la ConcentrationParisienne, l’OEIL-IAURIF, Paris
[38] Rousseaux M.P. (1995), “Y a-t-il une surproductivité de l’Ile-de-France?”, in Savy M.and Veltz P. (eds.), Economie Locale et Réinvention du Local, DATAR-Editions del’Aube, Paris, pp. 157–167
[39] Segal D. (1976), “Are There Returns to Scale in City Size?”, Review of Economics andStatistics, Vol. 58, pp. 250–339
[40] Shefer D. (1973), “Localisation Economies: in SMSA’s: a Production Function Anal-ysis”, Journal of Regional Studies, Vol. 13, pp. 55–64
[41] Sveikauskas L. (1975), “The Productivity of City Size”, Quarterly Journal of Econom-ics, Vol. 89, pp. 393–413
[42] Sveikauskas L., Gowdy J. and Funk M. (1988), “Urban Productivity: City Size orIndustry Size”, Journal of Regional Science, Vol. 28, no. 2, pp. 185–202
[43] Van Den Berg L. (1987) Urban Systems in a Dynamic Society, Gower, Aldershot
[44] Van Den Berg L., Drwett R., Klaassen L.H., Rossi A. and Vijverbert C.H.. (1982)Urban Europe: A Study of Growth and Decline, Pergamon Press, Oxford
[45] Von Thünen J.H. (1826), Der Isolierte Staat in Beziehung auf Landwirtschaft undNationalekonomie, Puthes, Hamburg
[46] World Bank (1994), World Development Report-1994, Washington D.C.
Bibliographical References 37

Cerum Report
1 Lars-Olof Persson och Erik Sondell, Från Lantbruksföretag till lan-thushåll, 1990.
2 Folke Carlsson, Mats Johansson, Lars-Olof Persson och Björn Tegsjö,Creating Labourmarket Areas and Employment Zones. New RegionalDivisions in Sweden Based on Commuting Statistics, 1993.
3 Ulf Wiberg (ed), Marginal Areas in Developed Countries, 1994.
4 Erik Bergkvist och Lars Westin, Värderas godstransporter rätt vid järn-vägsinvesteringar? En granskning av Banverkets investeringsmodell, 1994.
5 Lars Westin, En modell för integrerad analys av regional struktur ochtransportflöden, 1995.
6 Erik Bergkvist och Lars Westin, Estimation of gravity models by OLSestimation, NLS estimation, Poisson, and Neural Network specifications,1997.
7 Svenerik Sahlin och Aurora Pelli, Euroreg, Förstudie, 2000.
8 Peter Hall, Urban Development and Research Needs in Europe, 2001.
9 Steffen Ahl, Schwedenhäppchen, 2001.
10 Roberta Capello, Urban Growth in Italy: Economic Determinants andSocio-Environmental Consequences, 2001.
38 Urban Growth in Italy: Economic Determinants and Socio-Environmental Consequences