urban indicators programme p resentation at sa cities network launch 8 october 2002
TRANSCRIPT

Urban Indicators Programme
Presentation at SA Cities Network Launch 8 October 2002

Why urban indicators?
Monitor conflicting policy challenges resulting from:
Globalisation Urbanisation
Improve efficiency of government through performance management
Required by national legislation

Programme Goals Co-ordinated and integrated management of
cities through the use of indicators as urban policy and management tools
Information-driven decision making through the use of indicators as tools in strategic planning
Greater transparency and accountability in urban government through the use of indicators as communication and reporting tools

Promote shared learning and co-operation between member cities with respect to the development and use of indicators
Build capacity within member cities in the collation and analysis of information and to promote the use of information analysis as a tool in policy and strategy formulation
Ensure the development of indicators that will allow for the comparison of the performance of various cities and monitor urban development from a national perspective
Lobby and liaise with national government and other agencies to ensure that the cities needs are taken into account with regard to data collection, indicators etc.
Programme Objectives

IDP
Performance Management
Basic ServiceCommunity ServicesRegulatory Services
PlanningEnvironment
Economy
Quality of LifeUrban Management
•Policy/Strategy –Focused
•Intersectoral•Intergovernment
al
•Traditional Core Business of LA’s
•Sectoral•Operational
Strategic Focus

Gini-Coefficient
Urban Centre Gini--Coefficient
Johannesburg 0.601
Cape Town 0.569
Port Elizabeth O,54
Bloemfontein 0,501
Kimberley 0.48
Source: DPLG Poverty Research Project

City Development Index Developed in 1997 by Urban Indicators
programme of UN-Habitat
Measures average well-being and access to facilities by urban residents
Based on 5 sub-indices:InfrastructureWasteHealthEducation City Product

City Development IndexAll Cities Standard of Living Index CDI
35.13
56.00
75.89
56.30
61.92
56.30
0.00
20.00
40.00
60.00
80.00
100.00CDI =
Infrastructure =
Waste =
Health =
Education =
Product =
Source: DPLG Poverty Research Project
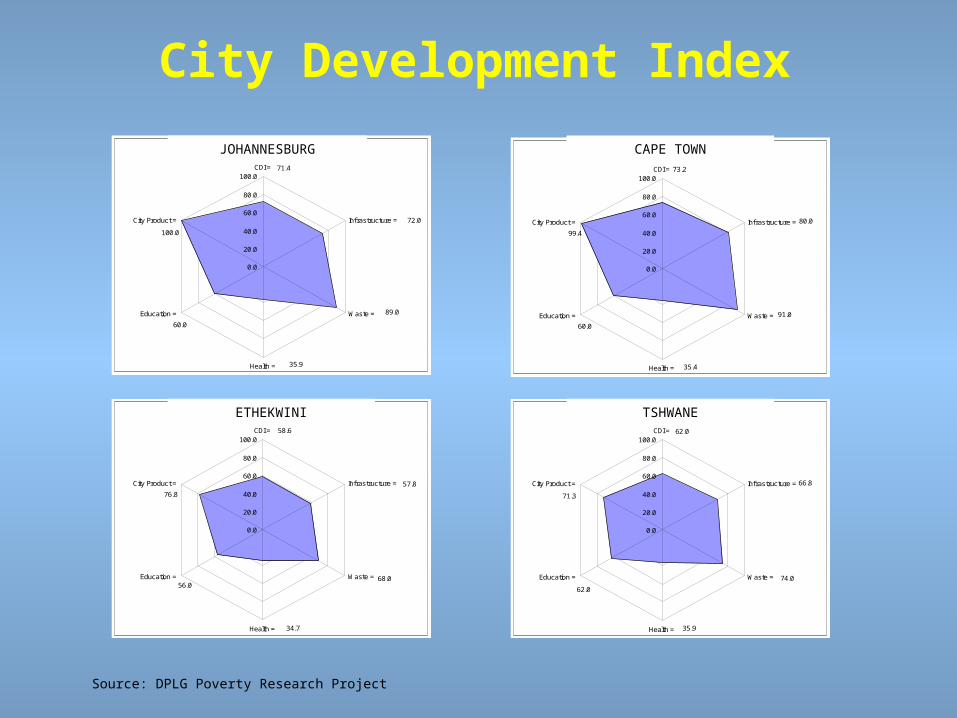
City Development Index
Joburg Standard of Living Index CDI
89.0
72.0
71.4
100.0
60.0
35.9
0.0
20.0
40.0
60.0
80.0
100.0CDI =
Infrastructure =
Waste =
Health =
Education =
City Product =
Cape Town Standard of Living Index CDI
99.4
60.0
35.4
91.0
80.0
73.2
0.0
20.0
40.0
60.0
80.0
100.0CDI =
Infrastructure =
Waste =
Health =
Education =
City Product =
Ethekwini Standard of Living Index CDI
58.6
76.8
56.0
34.7
68.0
57.8
0.0
20.0
40.0
60.0
80.0
100.0CDI =
Infrastructure =
Waste =
Health =
Education =
City Product =
JOHANNESBURG CAPE TOWN
ETHEKWINI Tshwane Standard of Living Index CDI
71.3
62.0
35.9
74.0
66.8
62.0
0.0
20.0
40.0
60.0
80.0
100.0CDI =
Infrastructure =
Waste =
Health =
Education =
City Product =
TSHWANE
Source: DPLG Poverty Research Project
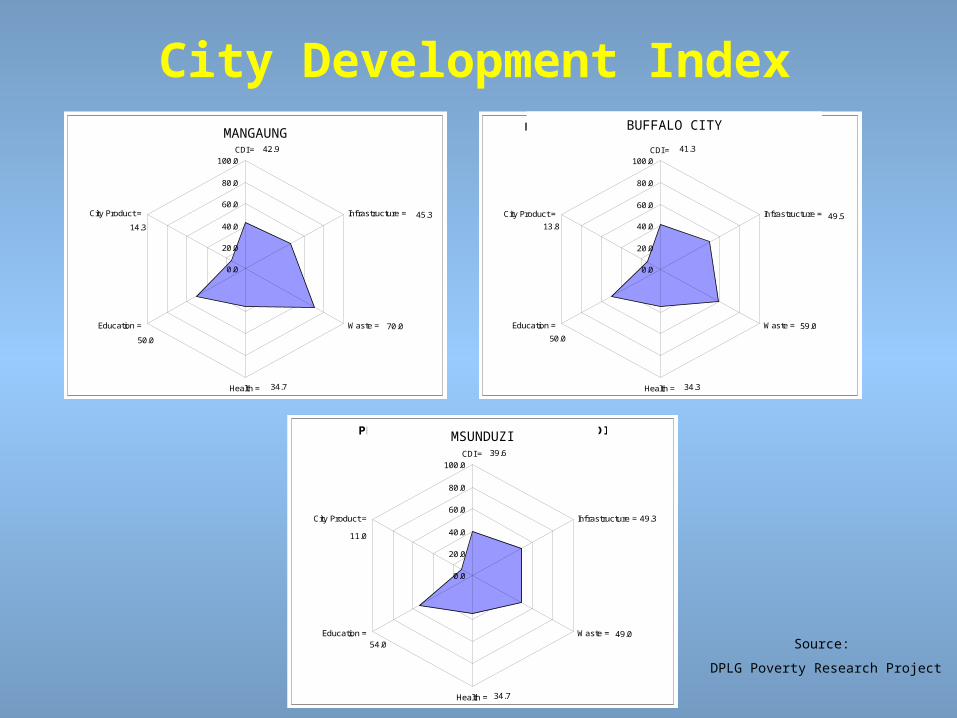
PMB/Msunduzi Standard of Living Index CDI
39.6
11.0
54.0
34.7
49.0
49.3
0.0
20.0
40.0
60.0
80.0
100.0CDI =
Infrastructure =
Waste =
Health =
Education =
City Product =
Buffalo City Municipality Standard of Living Index CDI
13.849.5
41.3
59.0
50.0
34.3
0.0
20.0
40.0
60.0
80.0
100.0CDI =
Infrastructure =
Waste =
Health =
Education =
City Product =
Mangaung Standard of Living Index CDI
42.9
14.3
50.0
34.7
70.0
45.3
0.0
20.0
40.0
60.0
80.0
100.0CDI =
Infrastructure =
Waste =
Health =
Education =
City Product =
City Development IndexMANGAUNG
BUFFALO CITY
MSUNDUZI
Source:
DPLG Poverty Research Project
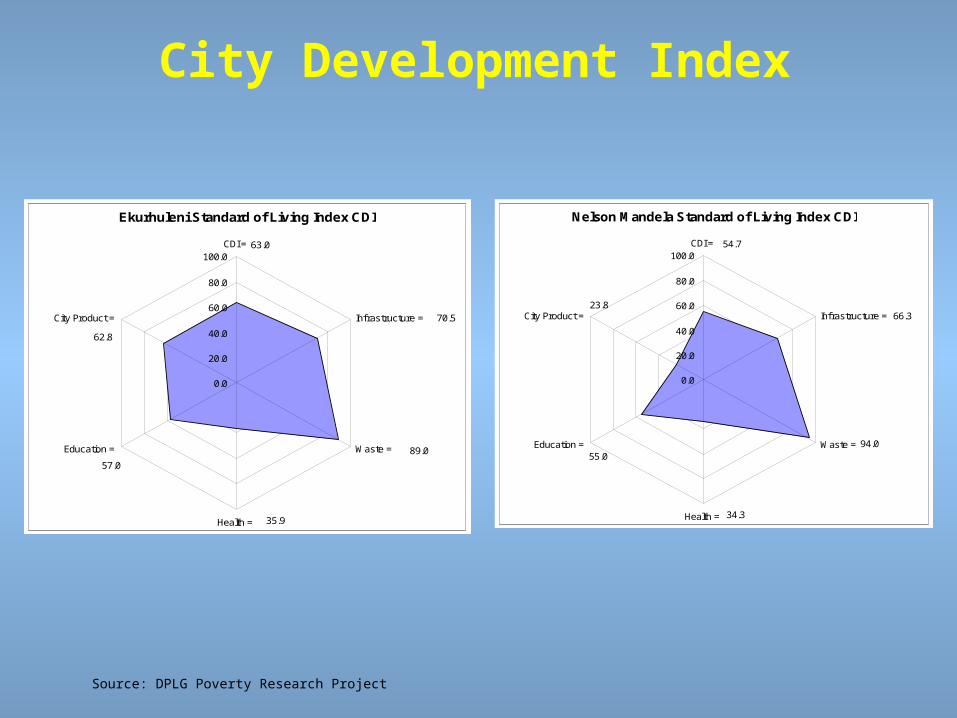
City Development Index
Ekurhuleni Standard of Living Index CDI
63.0
62.8
57.0
35.9
89.0
70.5
0.0
20.0
40.0
60.0
80.0
100.0CDI =
Infrastructure =
Waste =
Health =
Education =
City Product =
Nelson Mandela Standard of Living Index CDI
23.8
55.0
34.3
94.0
66.3
54.7
0.0
20.0
40.0
60.0
80.0
100.0CDI =
Infrastructure =
Waste =
Health =
Education =
City Product =
Source: DPLG Poverty Research Project

Key Activities DPLG Poverty Research Project
Further Develop CDIs and Core Set of Urban Indicators
Liaise with national agencies
Link to other SACN themes and programmes
Web-enabled Database
Programme of Shared Learning

Knowledge-sharing
Programme of workshops and seminarsIncrease use of informationShowcase projects of member cities
Placement programmes
Membership of UN-Habitat GUO
Audit and Peer Review