ursd report template with sequential page numbers
TRANSCRIPT

VOLUNTARY
INVESTIGATION AND
REMEDIATON PLAN
TARA SHOPPING CENTER
8564 TARA BOULEVARD
JONESBORO, GEORGIA
HSI# 10798
Prepared For:
Dublin, Ohio
Prepared By:
EHS Support, Inc.
January 2012

Table of Contents
i
TABLE OF CONTENTS
1.0 Introduction ............................................................................................................. 1-1 1.1 Purpose ........................................................................................................... 1-1
1.2 Property Eligibility......................................................................................... 1-1 1.3 Participant Eligibility ..................................................................................... 1-1 1.4 Document Organization ................................................................................. 1-2
2.0 Site Background and History .................................................................................. 2-1 2.1 Site Development and Dry Cleaner Operational History .............................. 2-1
2.2 Regulatory History ......................................................................................... 2-1 2.3 Sources of Release ......................................................................................... 2-2 2.4 History of Environmental Assessments ......................................................... 2-2
3.0 Preliminary Conceptual Site Model ........................................................................ 3-8 3.1 Topography .................................................................................................... 3-8 3.2 Regional Geology .......................................................................................... 3-8 3.3 Site Hydrogeology ......................................................................................... 3-9
3.4 Aquifer Systems ............................................................................................. 3-9 3.5 Groundwater Flow Domain ......................................................................... 3-10
3.6 Local Groundwater Flow Setting ................................................................. 3-11 3.7 Contaminants of Concern ............................................................................ 3-13 3.8 Media Delineation Standards ....................................................................... 3-14
3.8.1 Soil and Groundwater Delineation Standards ................................ 3-14 3.8.2 Surface Water Delineation Standards ............................................. 3-15
3.9 Extent of COCs in Soil ................................................................................ 3-17
3.10 Extent of COCs in Groundwater .................................................................. 3-17
3.11 Extent of COCs in Surface Water ................................................................ 3-17 3.12 Fate and Transport ....................................................................................... 3-18
3.12.1 Potential Routes of PCE Migration ................................................ 3-18 3.12.2 Potential Exposure Pathways and Receptors .................................. 3-19
4.0 Corrective Action Investigation ............................................................................ 4-20
4.1 Groundwater Delineation Workplan ........................................................... 4-20 4.2 Potable Well Search ..................................................................................... 4-21
5.0 Proposed Cleanup Standards................................................................................... 5-1
6.0 Evaluation of Remedial Technologies .................................................................... 6-2
6.1 Electrical Resistive Heating ........................................................................... 6-2
6.2 Excavation and Off-Site Disposal .................................................................. 6-3 6.3 In-situ Treatment with a Large Diameter Auger ............................................ 6-3 6.4 Remedial Alternative Selection ..................................................................... 6-5
7.0 Projected Milestone Schedule ................................................................................. 7-6
8.0 References ............................................................................................................... 8-1

Table of Contents
ii
TABLES
Table 2-1 Chronology of Investigation Activities
Table 2-2 Summary of Historical Soil Analytical Results
Table 2-3 Summary of Monitoring Well Construction Details
Table 2-4 Summary of Historical Groundwater Analytical Results, 2006 through
2011
Table 2-5 Summary of Historical Groundwater Geochemical Results, October 2008
through May 2011
Table 2-6 Summary of Surface Water Analytical Results
FIGURES
Figure 1-1 Site Location Map
Figure 1-2 Aerial Site Plan
Figure 2-1 Site Layout and Property Ownership Map
Figure 2-2 Soil Boring Location Map
Figure 4-1 Potentiometric Surface Contours of the Lower Residuum – August 19,
2009 and Off-site Regions Requiring Hydraulic Controls and Water Quality
Reconnaissance
Figure 4-2 Proposed Off-site Monitoring Well Nest/Well
APPENDICES
Appendix A Voluntary Investigation and Remediation Plan Application Form and
Checklist
Appendix B Tax Map and Warranty Deed
Appendix C Remediation Agreement
Appendix D Conceptual Site Model Figures
Appendix E Projected Milestone Schedule

Acronyms
iii
ACRONYMS
Ashland Ashland Inc.
bgs below ground surface
cis-1,2-DCE cis-1,2-dichloroethene
CAP Corrective Action Plan
COC Constituent of Concern
CSM Conceptual Site Model
CSR Compliance Status Report
ECOSAR Ecological Structure Activity Relationships
EDR Environmental Data Resources
EHS Support EHS Support, Inc.
EPD Georgia Environmental Protection Division
ERH electric resistive heating
ESA Environmental Site Assessment
ET-DSPTM
Electro Thermal Dynamic Stripping Process
ft feet
GAC granular activated carbon
HSI Hazard Site Inventory
ISCO in-situ chemical oxidation
KMnO4 potassium permanganate
lbs pounds
LDA large diameter auger
MCL maximum contaminant level
mg/kg milligram per kilogram
mg/L milligram per liter
MNA monitored natural attenuation
MPE multi-phase extraction
MSL mean sea level
NOM natural occurring matter
NPL National Priorities List
ORP oxygen reduction potential
PCE tetrachloroethene
PRE Preliminary Risk Evaluation
PRZ Permeable Reactive Zone
RCRA Resource Conservation Recovery Act
RRS risk reduction standard
Site Tara Shopping Center
Acronyms
iv
S/S solidification/stabilization
Tara Retail Tara Retail Holdings, LLC
TCE trichloroethene
µg/L micrograms per liter
USDA Unites States Department of Agriculture
USEPA United States Environmental Protection Agency
VOC volatile organic compound
Statement of Limitations
v
STATEMENT OF LIMITATIONS
This document is intended for the sole use of Ashland Inc. (Ashland). The scope of services
performed during this investigation may not be appropriate to satisfy the needs of other users,
and any use or re-use of this document or of the findings, conclusions, or recommendations
presented herein is at the sole risk of said user.
Background information, design bases, and other data have been furnished to EHS Support, Inc.
(EHS Support) by Ashland and/or third parties, which are used in preparing this document. EHS
Support has relied on this information as furnished, and where applicable has made an attempt to
confirm the accuracy of laboratory data based on available raw data reports.
Opinions presented herein apply to the existing and reasonably foreseeable site conditions at the
time of our assessment. They cannot apply to site changes of which EHS Support is unaware
and has not had the opportunity to review. Changes in the condition of this property may occur
with time due to natural processes or works of man at the site or on adjacent properties. Changes
in applicable standards may also occur as a result of legislation or the broadening of knowledge.
Accordingly, the findings of this report may be invalidated, wholly or in part, by changes beyond
our control.
Introduction
1-1
1.0 INTRODUCTION
This Voluntary Investigation and Remediation Plan (VRP application) is being submitted on
behalf of Ashland for the former dry cleaner facility at the Tara Shopping Center in Jonesboro,
Clayton County, Georgia (Site). The location of the Site is shown on Figure 1-1. An aerial
photograph of the Site is provided as Figure 1-2. The VRP Application Form and Checklist is
provided in Appendix A. The application fee is provided as a separate attachment. The tax
parcel number for the Site is 13242D B001, 4th
District. The Tax map and warranty deed
information for the Site are included in Appendix B.
The structure of this document is designed to comply with Georgia Environmental Protection
Division (EPD) VRP application requirements. Due to limitations on the number of figures that
should be included within this application, figures supporting the preliminary Conceptual Site
Model (CSM) including surface and subsurface setting, the known or suspected source(s) of
contamination, contaminant migration, and potential human health and ecological receptors have
been included in Appendix D of this document. A discussion of the preliminary CSM, including
the complete or incomplete exposure pathways that may exist at the Site is discussed in Section
3.0.
1.1 Purpose
The purpose of this VRP application is to provide the information required in Item #5 of the
VRP application form and provides all reasonably available information for the Site including
historical analytical data, a preliminary CSM with three-dimensional aids, and a preliminary
remediation plan for source area remediation and groundwater delineation.
1.2 Property Eligibility
The Site meets the eligibility criteria set forth in the attached VRP application form. A release of
a regulated substance(s) on the Site was confirmed in 2005. The Site is not listed on the National
Priorities List (NPL), is not currently undergoing response activities required by an order of the
Regional Administrator of the United States Environmental Protection Agency (USEPA), and is
not required to have a permit under Code Section 12-8-66. Qualifying the Site under the VRP
would not violate the terms and conditions under which the division operates and administers
remedial programs by delegation or be similar authorization from the USEPA. To the best of
Ashland’s knowledge, there are no, and never have been, any outstanding liens filed against the
Site pursuant to Code Sections 12-8-96 and 13-13-12.
1.3 Participant Eligibility
Ashland is not the owner of the Site but is the VRP applicant overseeing remediation activities at
the Site. Ashland has entered into a Remediation Agreement with the Site owner, Tara Retail
Holdings, LLC (Tara Retail), which authorizes Ashland to investigate and remediate the Site on
behalf of Tara Retail. A copy of the Remediation Agreement is provided as Appendix C. To
the best of Ashland’s knowledge, neither Tara Retail nor Ashland is in violation of any order,
judgment, statute, rule, or regulation subject to the enforcement authority of the Director of the
Georgia EPD.

Introduction
1-2
1.4 Document Organization
This document is organized into eight sections as follows:
Section 1: Introduction
Section 2: Site Background and History
Section 3: Preliminary Conceptual Site Model
Section 4: Groundwater Corrective Action Investigation
Section 5: Proposed Cleanup Standards
Section 6: Evaluation of Remedial Technologies
Section 7: Projected Milestone Schedule
Section 8: References

Site Background and History
2-1
2.0 SITE BACKGROUND AND HISTORY
The Site as presently configured is approximately a 6.9-acre shopping center known as Tara
Shopping Center located between 8554-8600 Tara Boulevard, Jonesboro, Clayton County,
Georgia. The shopping center is comprised of two multi-tenant commercial buildings and
surrounding parking areas to the west. Dry cleaning operations were conducted between 1970
and 2005 (35 years) by a tenant in the southernmost unit of the west facing multi-tenant building
(8564 Tara Boulevard). Historic ownership and operator information were previously provided
in historical environmental reports. The Tara Shopping Center is surrounded to the north, west
and south by commercial and retail properties, many of which are currently vacant; and, to the
east by Fayetteville Road (State Highway 54) and residential properties. The Tara Shopping
Center and the location of dry cleaner facility are depicted on Figure 2-1.
2.1 Site Development and Dry Cleaner Operational History
The Tara Shopping Center was constructed in the late 1960s. Prior to that time, the property was
undeveloped. Historical city directories indicate dry cleaning operations had been present at the
property since 1970. The addresses for dry cleaning operations have been identified as 8564
Tara Boulevard and 8564 South Expressway. The dry cleaning facility utilized tetrachloroethene
(PCE) in machinery. Reclamation and disposal procedures and processes for spent solvents over
the 35 year operational history are unknown. In 2006, residual product drums and dry cleaning
equipment were removed and the space was temporarily used as a drop off location for dry
cleaning with no on-site processing. To the best of Ashland’s knowledge, the dry cleaning
facility has been vacant since 2007.
2.2 Regulatory History
A Phase I Environmental Site Assessment (ESA) of the Dunkin Donuts property (8560 Tara
Boulevard) immediately south of the Tara Shopping Center was completed in August
2004(Qore, 2004). The Dunkin Donuts property is identified as Site #15 on Figure 1-2. The
Phase I report identified the Tara Shopping Center dry cleaning facility as a recognized
environmental condition and a limited site investigation of the Dunkin Donuts property was
completed in September 2004. PCE and trichloroethene (TCE) were identified in groundwater
above Georgia EPD Maximum Contaminant Levels (MCLs) for drinking water. The owner of
the Dunkin Donuts property submitted a Release Notification/Reporting Form to the Georgia
EPD Hazardous Sites Response Program in November 2004 and the Dunkin Donuts property
was subsequently listed on the Georgia EPD Hazardous Site Index (HSI # 10798).
In late 2004, Georgia EPD speculated that releases from Tara Shopping Center dry cleaning
facility were the probable source of impacts to the Dunkin Donuts property and concluded that
releases of regulated substances had occurred at dry cleaning facility. The Tara Shopping Center
was subsequently co-listed on HSI #10798 (Georgia EPD letter dated April 26, 2005).
As a result, Alterman Enterprises, Ltd (former property owner of Tara Shopping Center and
referred to as Alterman) identified Mr. Kenneth Babb, the owner of the dry cleaning facility, as a
responsible person under the Hazardous Site Response Act (HSRA) to Georgia EPD. In turn,
Mr. Babb identified Ashland as a supplier of PCE as a dry cleaning solvent, and alleged that, on

Site Background and History
2-2
one or more occasions, a spill of PCE had occurred in connection with Ashland’s delivery of
PCE to the dry cleaning facility. However, only one documented release from the delivery of the
PCE to the dry cleaners has been verified to date (<2 gallons). As a result of this contention,
Ashland was also identified by Georgia EPD as a responsible party under HSRA.
2.3 Sources of Release
Results of subsurface investigations indicate that releases of regulated substances to soil and
groundwater, specifically PCE, have occurred at the dry cleaning facility at levels above the
Georgia EPD Risk Reductions Standards (RRSs) for Type 1 (Residential) and Type 3 (Non-
Residential) scenarios under HSRA Environmental Rule 391-3-19-.07. Releases of PCE were
reported to have occurred at the back (east) door of the dry cleaning facility in 1994 and two
releases to the sewer drain in 1996 and another date unknown. Such releases were discussed in
the Site’s initial Compliance Status Report, dated October 18, 2006 (URS Corporation [URS],
2006a).
2.4 History of Environmental Assessments
Environmental assessments have been completed by Ashland and by the property owners of the
Tara Shopping Center (Alterman and now Tara Retail) to delineate the horizontal and vertical
extent of PCE impacts to soil and groundwater, including PCE degradation products
trichloroethene (TCE), cis-1,2-dichloroethene (cis-1,2-DCE) and to a lesser extent vinyl chloride.
A summary of environmental investigation reports currently available for the Site are listed
below:
Alterman Investigation
Limited Phase II Environmental Site Assessment, Tara Plaza Shopping Center, Dry
Cleaner Location, 8564 Tara Boulevard, Jonesboro, Georgia 30236. July 11, 2005.
(Environmental Planning Specialists, Inc. [EPS], 2005)
Ashland Investigation
Compliance Status Report, Tara Shopping Center, 8564 Tara Boulevard, Jonesboro,
Georgia, October 18, 2006 (URS, 2006a.
Revised Compliance Status Report, Tara Shopping Center, 8564 Tara Boulevard,
Jonesboro, Georgia, November 30, 2006 (URS, 2006b).
Groundwater Corrective Action Plan, Tara Shopping Center, Jonesboro, Georgia, March
20, 2009 (URS, 2009a).
In-Situ Remediation Pilot Test Workplan, Jonesboro, Georgia, August 10, 2009 (URS,
2009b).
Groundwater Corrective Action Plan Addendum for Tara Shopping Center, Jonesboro,
Georgia, September 28, 2009 (URS, 2009c).
PRZ Pilot Test Progress Report, Tara Shopping Center, January 18, 2010 (URS, 2010a).
PRZ Pilot Test Progress Report, Tara Shopping Center, April 21, 2010 (URS, 2010b).
3rd
PRZ Pilot Test Progress Report, Tara Shopping Center, August 6, 2010 (URS, 2010c).

Site Background and History
2-3
Surface Water Quality letter report, Tara Shopping Center, September 17, 2010 (URS
Corporation).
Proposed Surface Water Monitoring Plan, Tara Shopping Center, 8564 Tara Boulevard,
Jonesboro, Georgia, February 3, 2011 (EHS Support Inc. [EHS, 2011a).
Surface Water Monitoring Report, Tara Shopping Center, 8564 Tara Boulevard,
Jonesboro, Georgia, May 23, 2011 (EHS, 2011b.).
Pilot Test Effectiveness Report and Groundwater Corrective Action Investigation
Workplan, Tara Shopping Center, 8564 Tara Boulevard, Jonesboro, Georgia, July 8,
2011 (EHS, 2011c).
Surface Water Monitoring Report, Tara Shopping Center, 8564 Tara Boulevard,
Jonesboro, Georgia, December 21, 2011 (EHS, 2011d).
Tara Retail Investigation
Phase Soil Treatment Design for Areas 2 and 3, Tara Shopping Center, Jonesboro,
Clayton County, Georgia, December 2010 (Peachtree Environmental, Inc.).
Remedial Design Report, In-Situ Thermal Treatment of the Tara Shopping Center,
Jonesboro, Georgia, Final Version, December 7, 2010 (Peachtree Environmental, Inc.).
Analytical data from investigations completed as part of investigation of dry cleaning operations
are provided in this VRP application. This data was used to develop the preliminary CSM
presented in Section 3.0, proposed groundwater investigation activities in Section 4.0 and Source
Area remediation presented in Section 5.0. The following table (Table 2-1) presents a
chronological summary of the investigations conducted at the Site to date along with the
historical documents associated with each investigation.

Site Background and History
2-4
Table 2-1: Chronology of Investigation Activities
Date/Party Task Report
2005
Alterman
Enterprises,
Ltd.
Alterman Enterprises, Ltd completed a Limited Phase
II ESA at the Tara Shopping Center in June 2005. Two
sub-slab soil samples were collected beneath dry
cleaning facility (SB-1 and SB-2) and a surface soil
sample and a grab groundwater sample were collected
immediately south of the dry cleaning facility from
temporary monitoring well TMW-1.
PCE was detected in soil beneath the dry cleaning
facility at a concentration of 15 milligrams per
kilogram (mg/kg).
PCE was detected in subsurface soil south of the
dry cleaning facility at a concentration of 1,200
mg/kg.
PCE was detected in groundwater at a
concentration of 48,000 microgram per liter (µg/L)
between 28 and 32 feet below ground surface (ft
bgs) from a temporary monitoring well (TMW-1).
Soil boring locations are identified on Figure 2-2. A
summary of the analytical results is provided in Table 2-
2.
Limited Phase II
Environmental Site
Assessment dated
July 11, 2005
(EPS, 2005)
2006
Ashland
Ashland initiated soil investigation activities in March
2006. Seventy-two soil samples were collected from 22
soil borings (SB-1 through SB-22).
Four borings were completed inside the dry
cleaning facility in the vicinity of the dry
cleaning machine (SB-19 through SB-22).
Six borings were completed outside the dry
cleaner facility, along the south and east exterior
walls (SB-1 through SB-6).
Twelve borings were completed cross-gradient,
and downgradient of the dry cleaning facility at
the Tara Shopping Center, the Lumsden
Property (Prax Air), and at the intersection of
Tara Boulevard and Fayetteville Road (SB-7
through SB-18).
PCE, TCE, and cis-1, 2-DCE were detected in 13 of the
22 soil borings installed during the investigation. Soil
boring locations are identified on Figure 2-2. A
summary of the analytical results is provided in Table
2-2.
Compliance Status
Report, Tara
Shopping Center,
October 18, 2006
(URS, 2006a)
Revised
Compliance Status
Report, November
30, 2006 (URS,
2006b)

Site Background and History
2-5
Ashland installed 16 monitoring wells (MW-1A
through MW-9A and MW-1B through MW-9B) to
further delineate the horizontal and vertical extent of
the groundwater impacts. Three vertical zones were
designated as Upper Residuum (A-Zone), Lower
Residuum (B-Zone), and Upper Bedrock (C-Zone).
The highest concentration of VOCs was detected
immediately adjacent to the dry cleaning facility in upper
residuum monitoring well MW-2A. The PCE
concentration in this well was 51,000 µg/L (total VOCs
56,300 µg/L).
Monitoring well locations are identified on Figure 2-2.
Table 2-3 presents the monitoring well construction
details. A summary of the groundwater analytical results
is provided in Table 2-4.
2007-2008
Tara Retail
In 2007, Alterman Enterprises, Ltd sold the Tara
Shopping Center to Tara Retail. Tara Retail submitted
a Prospective Purchaser Corrective Action Plan
(PPCAP) to Georgia EPD to address impacted soils at
the Site. Between 2007 and 2008, Tara Retail conducted
soil sampling for VOC analyses and synthetic
precipitation leaching potential (SPLP) testing (P-1
through P-60). Soil sampling was focused on
delineating the soil impacts associated with the dry
cleaning facility. The SPLP results were submitted to
Georgia EPD and a RRS of 2 mg/kg for PCE was
approved.
Soil boring locations and analytical results are identified
on Figure D-17 (Appendix D).
Not Available.
2008
Ashland
In 2008, Ashland completed Phase III Investigation
activities to further evaluate the horizontal and vertical
extent of groundwater impacts. Investigation activities
were conducted in three separate events between March
2008 and December 2008.
Twenty-two wells were installed and included:
Six bedrock monitoring wells (MW-1C, MW-2C,
MW-5C, MW-7C, MW-8C, MW-9C);
Three on-site well clusters to the southwest
(MW-10A,B,C and MW-11A,B,C) and south of
the building (MW-12A);
Three off-site downgradient well clusters
MW-13A,B,C, MW-15A/B and MW-16A/B/C;
Groundwater
Corrective Action
Plan, March 20,
2009 (URS, 2009a)
Groundwater
Corrective Action
Plan Addendum,
September 28, 2009
(URS, 2009c)

Site Background and History
2-6
and
One on-site upgradient well MW-14A.
Monitoring well locations are identified on Figure 2-2.
Table 2-3 presents the monitoring well construction
details. A summary of the groundwater analytical results
is provided in Table 2-4.
Ten soil borings (SB-23 through SB-32) were installed
west of the former dry cleaners along the west side of
Tara Boulevard. Groundwater was not encountered in
soil borings SB-23 through SB-25 due to shallow
bedrock; however, groundwater was encountered in
SB-26 through SB-32. Therefore, groundwater
samples were collected from these borings and
analyzed for VOCs. Straddle packer groundwater
sampling and geophysical logging were completed on
bedrock well MW-16C and a full round of groundwater
samples was collected from the monitoring well network.
In December 2008, six additional soil borings (SB-33
through SB-38) were drilled and sampled below the
water table to characterize groundwater in the Source
Area. Soil samples were collected on 10-foot centers
using a direct push macro-core sampler starting at the
water table. Four groundwater samples were collected
from each location from a depth of 28 to 57 ft bgs. The
soil samples and groundwater sample were analyzed for
VOCs.
Soil boring locations are identified on Figure 2-2. A
summary of the analytical results is provided in Table
2-2.
2009-2011
Ashland
A pilot test for in-situ chemical oxidation (ISCO) was
proposed at the downgradient boundary approximately
150 ft downgradient of the Source Area. A permeable
reactive zone (PRZ) was proposed to intercept the
migrating groundwater plume while actively treating
groundwater migrating off-site. The objective of the
ISCO Pilot Test was to determine the effectiveness of
potassium permanganate (KMnO4) in reducing
concentrations of Site VOCs in groundwater to below their
respective RRSs and to determine the effectiveness of
utilizing soil fracturing in the upper and lower residuum to
enhance the permeability of the low permeability soils at
the Site and allowing the KMnO4 slurry to more fully
disperse aerially and thus increasing mass destruction.
In-Situ Remediation
Pilot Test
Workplan, August
10, 2009 (URS,
2009b)
PRZ Pilot Test
Progress Report,
January 18, 2010
(URS, 2010a)
PRZ Pilot Test
Progress Report,
April 21, 2010
(URS, 2010b)
3rd
PRZ Pilot Test

Site Background and History
2-7
Routine groundwater sampling was completed to monitor
concentrations of VOCs and water quality parameters
from designated well clusters MW-2A/B/C,
MW-8A/B/C, MW-10A/B/C, and MW-11A/B/C, as
well as from newly installed monitoring well MW-17A.
The results of routine sampling were provided in three
PRZ Pilot Test Progress Reports and the final Pilot Test
Effectiveness Report.
Monitoring well locations are identified on Figure 2-2.
A summary of the groundwater analytical results is
provided in Table 2-4. A summary of geochemical
parameters for these wells is provided in Table 2-5.
Progress Report,
August 6, 2010
(URS, 2010c)
Pilot Test
Effectiveness
Report and
Groundwater
Corrective Action
Investigation
Workplan, July 8,
2011 (EHS, 2011c)
A total of 12 surface water samples have been collected
and analyzed for VOCs from the unnamed creek
downgradient of the Tara Shopping Center between
October 2009 and November 2011.
Surface water sample locations are depicted on Figure
D-26 (Appendix D). A comprehensive summary of
surface water analytical results is provided as Table 2-6.
Surface Water
Quality letter
report, September
17, 2010 (URS,
2010d)
Proposed Surface
Water Monitoring
Plan, February 3,
2011 (EHS, 2011a)
Surface Water
Monitoring Report,
May 23, 2011
(EHS, 2011b)
Surface Water
Monitoring Report,
December 21, 2011
(EHS, 2011d)

Preliminary Conceptual Site Model
3-8
3.0 PRELIMINARY CONCEPTUAL SITE MODEL
The preliminary CSM is intended to establish a common knowledge base about the Site and its
environmental condition, to facilitate the development of basic remedial action objectives
appropriate for the Site, and to allow informed decisions regarding possible corrective action
measures for the Site. Figures presenting the preliminary CSM are included in Appendix D and
have been referenced as Figure D-1 through D-26).
3.1 Topography
Based on a review of the United States Department of Agriculture (USDA), Soil Conservation
Service (SCS), Soil Survey of Clayton County, Georgia (issued 1979); the soils beneath the Site
are classified as Urban Land. The landscape in which this soil unit is found primarily consists of
ridges and hillsides associated with drainage ways and flood plains. The soil unit consists
mainly of areas of soils that have been altered by cutting, filling, and shaping during preparation
for construction and paving. Urban land mainly includes business districts, shopping centers,
parking lots, motels, industries, and housing developments.
Review of the topographic map for the Site indicated that the shopping center property is located
at or near a topographic high point. The shopping center property is approximately 900 ft above
mean seal level (Figure 1-1). The northern half of the shopping center property appears to slope
generally to the north-northwest. The southern half of the shopping center property (including
the area of the dry cleaning facility) appears to slope generally to the south-southeast and south-
southwest. Drainage for the area is directed to the Flint River and its tributaries west of the Site.
The Flint River is located approximately one mile west of the Site (Figure D-1).
Surface water runoff from, and in the immediate vicinity of, the shopping center property is
complex. Because the property is located at a topographic high, radial surface sheet flow is
suspected, with the majority of runoff directed towards Tara Boulevard. At the front entrance of
the property (west), surface runoff is to the west and southwest toward Tara Boulevard. At the
rear entrance of the shopping center (east) in the area of the subject dry cleaner, sheet flow is
directed south and southeast toward Fayetteville Road. Stormwater is captured at Fayetteville
Road and Tara Boulevard by open drainage ditches and directed to catchment basins and storm
sewers (Figure D-2).
3.2 Regional Geology
The Site is located in the Piedmont Physiographic Province. The portion of the Piedmont located
within Clayton County is characterized by broad convex ridge tops dissected by many drainage
ways. Slopes are gentle to strong, except near major streams where slopes may be short and
steep. The surrounding area exhibits a moderate relief with gently rolling hills (Figures D-3 and
D-4).
The Piedmont Province is underlain by a complex sequence of igneous and metamorphic rocks.
The metamorphic rocks consist mainly of regionally metamorphosed older sedimentary
sequences and igneous rocks, which have been subsequently folded and intruded by younger
materials. The metamorphic sequences are the predominant rock type in the Piedmont. Most of
Clayton County is underlain by non-porphyritic granite that has been subject to geologic erosion

Preliminary Conceptual Site Model
3-9
and generally is deeply weathered. The weathering has resulted in a relatively thick layer of
saprolite (unconsolidated, weathered rock) and soil beneath the ground surface. Based on review
of the Geologic Map of Georgia (Georgia Department of Natural Resources, 1976), the area
around the Site is underlain by non-porphyritic granite.
3.3 Site Hydrogeology
The geology of the Site consists of fill ranging from 4 to 8 ft which is characterized by varying
proportions of sand, silt, and clay with gravel. Below the fill is a residuum of primarily red
brown sandy silt and clay. The residuum grades downward with a coarsening sequence of less
fines. Saprolitic (highly weathered granitic bedrock) conditions exist within about 10 to 15 ft of
the top of bedrock. Saprolite typically has a higher transmissivity for groundwater flow,
however in some instances the upper residuum with a localized more permeable layer may have
a greater permeability compared to the saprolite. Bedrock was encountered (auger refusal)
between 40 and 50 ft bgs at the Site. However, depth to bedrock varied across the investigation
area from approximately 25 to 60 ft bgs.
The cross section location map (Figure D-5) provides the location of three cross sections
that illustrate the hydrogeology of the Site. Cross sectional information is provided on Figure
D-6. Cross section A-A’ illustrates a cross-section from north to south from Fayetteville Road
at the midpoint of the shopping center, south along Tara Boulevard at the Citgo gas station. Cross
section A-A’ shows that the bedrock drops in elevation from MW-1C to MW-6B, which is similar
to the decrease in ground surface elevation. Cross section B-B’, is oriented form northeast
to southwest across the Site and illustrates that the depth to bedrock decreases from east to
west. Cross-section C-C’ trends east-west across the Prax Air property (formerly Pye Barker)
located south of the Site and illustrates a decrease in depth to bedrock from east to west. A
block diagram of the Site hydrogeology is shown in Figure D-7.
Groundwater occurs in the residuum above the bedrock under unconfined conditions and is
hydraulically connected to the upper bedrock through fractures. Groundwater flow across the
Site is generally toward the southwest. In May 2011 (latest comprehensive monitoring event),
groundwater was encountered at 26.32 ft bgs at MW-10A to 20.46 ft bgs at MW-9A
approximately 120 ft downgradient of the former dry cleaners. Groundwater contour maps for
the Upper and Lower Residuum and Bedrock Aquifer based on the May 2011 gauging data is
provided as Figures D-8 through D-10, respectively.
Provided below is a summary on regional groundwater flow regimes and hypothetical local
groundwater flow settings used to establish the preliminary CSM for groundwater at the Site.
3.4 Aquifer Systems
There are eight major aquifer systems in the state of Georgia (Figure D-3). The Site, located
just south of greater Atlanta, is underlain by a surficial aquifer mostly composed of clay-rich
saprolitic sediments which is in-place weathered residuum of the crystalline bedrock. The
crystalline bedrock is part of the regional Piedmont aquifer system (Piedmont and Blue Ridge
Provinces). The bedrock underneath the Site area is granite and amphibolite with fracture
development closer to the bedrock surface (URS, 2009a). The idealized hydrology of the
Piedmont aquifer system as conceptualized by Miller (1990) and Legrand (2004) from an

Preliminary Conceptual Site Model
3-10
original framework published by Toth (1963) and is illustrated in Figure D-4. In the Piedmont
aquifer system, the groundwater flow domain is localized to watershed scales. The
characteristics of a groundwater setting within a small drainage basin are as follows:
The watershed boundary at the ridgeline generally coincides with groundwater flow
divides.
Groundwater within the watershed naturally flows to surface drainage.
Groundwater in the residuum (soil, alluvium, and saprolite) is locally recharged from
precipitation, exhibits inter-granular flow and discharges to nearby perennial streams.
Groundwater in the bedrock is recharged through leakage from the overlying residuum
and discharges to nearby perennial streams. In this regard, groundwater in the bedrock
and the residuum share common hydrologic boundaries. Groundwater flows through
interconnected fractures and may be more circuitous than those in the residuum.
The potentiometric surfaces of both the residuum and the bedrock generally mimic a
subdued expression of land surface topography (in the absence of major groundwater
withdrawals).
3.5 Groundwater Flow Domain
Based on the hydrologic characteristics of the Piedmont aquifer system, the groundwater flow
domain surrounding the Site area can be conceptualized by watershed boundaries (Figure D-1).
The Site is situated within the watershed to the headwaters of the Flint River. The watershed
boundaries which follow topographic ridgelines coincide with a natural groundwater divide that
defines the flow regime. Therefore, groundwater is contained within each watershed and
discharges to perennially flowing surface drainage that intercept the water table. Additionally,
groundwater cannot cross watershed boundaries.
On this basis, the hydraulic upgradient regions at the Site are to the east and the south-southeast
where the watershed boundary generally delineates the groundwater divides between the current
watershed and the Upper Little Cotton Indian Creek watershed (east) and the Murphy Creek-
Flint River watershed (south-southeast).
In the Site area, all possible and potential downgradient discharge boundaries for groundwater
are the surface drainage features including the previously identified intermittent stream (i.e.,
unnamed creek) located immediately west of Tara Boulevard that discharges to the unnamed
tributary northwest of the Site and ultimately discharges to the Flint River west of the Site
(Figure D-2). Of these, the unnamed creek is considered to be a discharge boundary to off-site
groundwater mostly because of its proximity – it is closest to the Site.
The extent and magnitude of the unnamed creek as a receptor to groundwater flow in the
residuum and the bedrock are currently not well understood. There are, however, some
incomplete lines of evidences that support groundwater contribution to the unnamed creek. The
following section summarizes some of these characteristics based on flow characteristics, surface
topography, bedrock structure and surface water quality.

Preliminary Conceptual Site Model
3-11
3.6 Local Groundwater Flow Setting
Site specific field data (i.e., groundwater elevations, gradients, etc.) between 2008 through 2011
were used to assist in estimating the local groundwater flow setting discussed below. Figure D-2
displays surface water drainage and land topography in the Site area.
Groundwater Flow Directions and Plume(s) Migration Pathways
The primary migration pathways of the groundwater plume exiting the Site is oriented towards
the unnamed creek west of Tara Boulevard inferring possible groundwater discharge to this
surface drainage. This is displayed by the potentiometric surfaces of the upper and lower
residuum and bedrock aquifer units (Figures D-8 through D-10). The unnamed creek is a 3rd
order (Strahler classification) drainage feature that connects to an unnamed tributary to its north
flowing west into the Flint River (Figure D-2).
Creek Topography
The unnamed creek is approximately 2,300 ft long. The estimated elevations from the creek’s
headwater to its downriver confluence with the unnamed tributary are approximately 880 ft,
Mean Sea Level (ft, MSL) to less than 820 ft, MSL (Figure D-2). This relatively large elevation
range indicates that the unnamed creek could intercept nearby groundwater. For instance, based
on twelve measurements between 2008 and 2010, the average groundwater elevation at well
MW-15B, approximately 200 ft east of the creek headwater is 868.04 ft, MSL. Applying an
average groundwater gradient of 0.0067 ft/ft (between MW-2B and MW-15B), the estimated
groundwater elevation is 5 ft higher than the creek where its streambed is approximately 860 ft,
MSL. The relationship suggests the creek does intercept the water table relatively close to its
headwater.
Vertical Flow Relationships near a Discharge Boundary
Figure D-11 illustrates an idealized groundwater flow in the vicinity of surface water drainage.
Both conceptualizations portray the vertical flow domain longitudinal (parallel) to the surface
water flow direction. In the first conceptualization, the streambed is incised into the residuum
Figure D-11 (left). The head equipotentials and groundwater streamlines illustrate conditions
for vertical flow. Where the water table is high, there is a vertical separation of groundwater
heads and the head gradient is positive with depth – groundwater heads decrease with increasing
depth. Therefore, the net groundwater flow direction is primarily downward.
A reversed condition is shown approaching the stream headwater. There is a vertical separation
of groundwater heads and the head gradient is negative with depth – groundwater heads increase
with decreasing depth. Therefore, the net groundwater flow direction is primarily upward and
groundwater in the residuum and bedrock discharges to the stream when heads exceed the
surface water elevation at the stream bank.
A variation to this conceptualization is displayed in Figure D-11 (right). The negative hydraulic
gradient approaching the stream headwater does not extend into the bedrock and hence,
groundwater discharge occurs in the residuum only. In this event, bedrock groundwater flows
further downstream and is discharged when its head is greater than the surface water elevation
and typically where the streambed is incised into bedrock or very close to the bedrock surface.
Preliminary Conceptual Site Model
3-12
In order to evaluate for similar characteristics, the vertical relationships of groundwater heads
were evaluated for each well nest in the monitoring network. Figure D-12 presents average
groundwater head differences (in ft) between monitoring wells screened in the upper residuum
and the lower residuum.
A negative value indicates the groundwater head in the lower residuum is greater than the upper
residuum indicating an upward flow. A positive value indicates the reverse condition and
vertical flow is downward.
As shown, the vertical head differences within the Site are positive indicating downward flow.
In the off-site region monitored by monitoring wells MW-15 A/B and MW-16 A/B, the head
differences are reversed inferring an upward flow direction. Additionally, there is a recognizable
trend in the magnitude of the head differences as shown in the dashed regions. These
characteristics suggest that groundwater flow in the residuum (upper and lower) likely will
discharge into the unnamed creek.
Figure D-13 presents average groundwater head differences (in ft) between monitoring wells
screened in the bedrock and the lower residuum. Unlike groundwater in the residuum, the
vertical head differences are all positive, initially suggesting an area-wide downward flow.
Additionally, the magnitude of the head differences varies widely– some monitoring wells
showing unusually large vertical head separations.
It is concluded the water level data set for the bedrock wells may exhibit artifacts that bias their
interpretation. Figure D-14 displays some of these artifacts. In the figure, the groundwater
hydrographs to four monitor well nests are presented. Idealistically, the groundwater trends in
all water bearing depths (upper/ lower residuum and bedrock) should track together –
representing a highly connected groundwater system. This characteristic is displayed by the
hydrographs to monitoring wells MW-11 A/B/C showing a relatively consistent head separation
between the bedrock and the lower residuum (average 0.59 ft).
However, the hydrographs to monitoring wells MW-8C and MW-2C exhibit water level trends
characteristic of induced drawdown with very slow bore-hole recovery. Since the bedrock
aquifer is not pumped in the region, it is believed the drawdown at these wells were likely
induced from heat pulse flow testing for aquifer characterization (October 2008) and contributed
further by subsequent groundwater sampling that were relatively frequent between October 2009
and August 2010. In either case, at well MW-8C, it is shown that the resulting lowered water
level did not fully recover since after the August 19, 2009 water level survey. The water level is
about half-way to static conditions after 3 months between sampling events.
The water level trends at some of the bedrock wells show that aquifer transmissivity in the
fractured media is significantly variable and in some areas, extremely small. Additionally, the
induced water level trends represent a localized condition in the immediate region of the well
and may not be representative of the formation head. The phenomenon is similar to well loss
effects during pump tests (water loss primarily in the bore-hole but not in the immediate
formation) followed by very slow seepage of formation water back into the bore-hole.

Preliminary Conceptual Site Model
3-13
This phenomenon may also apply to water level trends at monitoring well MW-16C (Figure
D-15). The first two water level measurements at MW-16C on October 2008 resulted in bedrock
heads that were greater than groundwater heads at wells MW-16A and MW-16B (average head
separation 0.2 ft). The next two measurements (August 2009; October 2009) exhibited
significantly lowered water levels in the bedrock well that did not follow trends observed at
MW-16A and MW-16B. If the water level trends at well MW-16C is an induced artifact (such
as well purging during groundwater sampling or heat pulse flow tests), its groundwater
elevations may be misleading – especially in the evaluation of vertical head separation to
demonstrate groundwater discharge.
Conceptualized Groundwater Flow Paths
Based on the limited evaluation of lateral groundwater flow, vertical head separation and surface
topography of the unnamed creek, some generalizations are made for possible discharge
scenarios. In Figure D-15, it is conceptualized that groundwater in the residuum (upper and
lower) could discharge to the unnamed creek. Based on average groundwater heads at wells
MW15A/B and MW-16A/B and hydraulic gradients, it is anticipated that groundwater seepage
could occur relatively nearby the headwater area of the creek where the streambed elevation is
less than approximately 865 ft, MSL (Figure D-15, path “A”).
The anticipated discharge scenario for the bedrock is relatively complex due to the bedrock
structure. The bedrock surface exhibits signs of structural deformation in the area – likely due to
faulting. This rationale is based on bedrock surface elevations (at least within the area shown in
Figure D-15).
From south to north, the bedrock surface elevations at monitoring wells MW-16C, MW-15C and
MW-8C are very similar (837 ft, MSL to 839 ft, MSL). At well MW-7C, the bedrock surface is
at least 25 ft higher (864 ft, MSL). Additionally, five soil borings drilled north of well MW-15B
(dashed in the figure) were dry and shallow bedrock was encountered. This area is also
coincident with near right-angle land topographic contours exhibited by the 880 ft, MSL and the
890 ft, MSL contours. These characteristics cumulatively suggest faulted bedrock within the
area. The structural setting and groundwater flow can be visualized in the illustration presented
in Figure 2 – showing a water body on top of a fault with the up-thrown block (“U”) forming one
river bank and the down-thrown block (“D”) on the opposite river bank.
In this conceptualized setting, bedrock groundwater in the southern bank of the unnamed creek
(Figure D-15, path “B”) flows parallel to the unnamed creek until bedrock surface is
encountered further downgradient – estimated where the streambed is less than 840 ft, MSL. In
the northern bank of the unnamed creek (Figure D-15, path “C”), the bedrock groundwater
discharge is relatively inconclusive- either discharging near outcrop areas that may occur closer
to the headwater of the creek or further downgradient. Additionally, it is noted that groundwater
north of wells MW-15 A/B may primarily occur in the bedrock since the residuum was
unsaturated due to the bedrock structure.
3.7 Contaminants of Concern
The primary contaminants of concern (COCs) are PCE and its degradation products, TCE, and
cis-1,2-dichoroethene (cis-1, 2-DCE) and to limited extent vinyl chloride. The highest

Preliminary Conceptual Site Model
3-14
concentrations of PCE have been detected in soil and groundwater beneath and in the immediate
vicinity of the former dry cleaners. This area of principal contamination is hereinafter referred to
as the Source Area and consists of 5 subareas: Area 1, Area 1a, Area 1b, Area 2, and Area 3
which were developed for the purposes of calculating mass in place and developing source area
remedial options (Figure D-16).
This VRP application outlines the options to remediate PCE (and its degradation products) in the
Source Area at the Site, discusses previous successes and challenges with prior remedy selection,
and discusses additional investigation which needs to be performed in order to evaluate a remedy
for the downgradient groundwater plume. The extent of known impacts and the proposed media
delineation standards are discussed below.
3.8 Media Delineation Standards
The following sections identify the standards that have been used historically and will continue
to be used for the investigation and delineation of impacts in soil, groundwater, and surface
water both on and off-site.
3.8.1 Soil and Groundwater Delineation Standards
Under HSRA, Ashland and Tara Retail are required to demonstrate compliance with corrective
action requirements set forth in Georgia EPD Risk Reduction Standards (391-3-19-.07). Ashland
and Tara Retail have submitted individual corrective action plans proposing RRSs for the Site.
The Georgia EPD approved Site specific RRS for soil and groundwater in their technical
response documents dated March 11, 2008, September 28, 2008, and June 26, 2009. In
December 2009, Georgia EPD adopted amendments to HSRA and established Type 1/Type III
RRSs for cis-1,2-DCE. Provided below are current RRSs for the primary COCs at the Site.
Soil Risk Reduction Standards mg/kg RRS1
PCE 2 Type 1/Type 3 Alternate
(Unsaturated2/Saturated Soil
3)
TCE 0.5 Type 1/Type 34
cis-1,2-DCE 7.0 Type 1/Type 35
Vinyl Chloride 0.2 Type 1/Type 35
Note: mg/kg = milligram per kilogram
1 Type 1 Residential RRS(s) equals Type 3 Non-residential RRS(s).
2 EPD letter, September 28, 2008
3 EPD letter, June 26, 2009
4 EPD letter, March 11, 2008.
5 Based on Hazardous Site Response Rules adopted in December 2009.

Preliminary Conceptual Site Model
3-15
Groundwater Risk Reduction
Standards L RRS
1
PCE 5.0 Type 1/Type 34
TCE 5.0 Type 1/Type 34
cis-1,2-DCE 1,022 Type 4 3
Vinyl Chloride 2.0 Type 1/Type 35
Note: g/L = milligram per liter
The soil RRS for cis-1,2-DCE is based on the RRS adopted in December 2009. In addition,
Ashland has included the RRS for vinyl chloride. Although vinyl chloride is not prevalent in soil
and groundwater, it is a degradation byproduct of PCE. Therefore, there is the potential for vinyl
chloride to be produced through natural attenuation and reductive dechlorination processes at the
Site.
3.8.2 Surface Water Delineation Standards
The USEPA Region IV Freshwater Surface Water Screening Values were identified by Georgia
EPD as the screening values for surface water within the unnamed creek downgradient of the
Site. However, there are no published USEPA Region IV Freshwater Surface Water Screening
Values for TCE, cis-1,2-DCE, and vinyl chloride. To facilitate screening assessment of the data,
the concentrations of TCE and vinyl chloride were compared against the USEPA Region V
RCRA Ecological Screening Levels (2003).
As there is no USEPA Region V RCRA Ecological Screening Level (2003) for cis-1,2-DCE,
the USEPA Region IV Freshwater Surface Water Screening Value for trans-1,2-DCE (1,350
µg/L) was used as an alternative.
To determine if the value for trans-1,2- DCE could be applied to cis-1,2-DCE, a structural
activity relationship (SAR) was conducted using the Ecological Structure Activity
Relationships (ECOSAR) Class Program (version 1.0), available through EPI Suite 4.0, and
developed for the USEPA. ECOSAR was used to model cis-1,2-DCE and trans-1,2-DCE,
and to estimate the chemical aquatic toxicity based on the structure of the chemical by
comparing the chemical to similar chemicals with similar toxicological reactive structures and for
which aquatic toxicological data is available. Both cis-1,2-DCE and trans-1,2-DCE has similar
structures and fall within the vinyl/allyl halides ECOSAR classification. The predicted aquatic
toxicity for this classification is similar or greater than the USEPA Region IV screening level for
trans-1,2-DCE of 1,350 µg/L. Based on the structural similarity of these to constituents, the
application of the trans-1,2-DCE screening level to the cis-1,2- DCE data is appropriate. A
summary of screening values are summarized below.

Preliminary Conceptual Site Model
3-16
Surface Water
Delineation
Standards
Surface Water
Delineation Standard
Screening Value
PCE 84 USEPA Region IV Freshwater Surface
Water Chronic Screening Values
TCE 47 USEPA Region V RCRA Ecological
Screening Levels (2003)
cis-1,2-DCE 1,350 USEPA Region IV Freshwater Surface
Water Screening Value for trans-1,2-DCE
Vinyl Chloride 930 USEPA Region V RCRA Ecological
Screening Levels (2003)

Preliminary Conceptual Site Model
3-17
3.9 Extent of COCs in Soil
The soils beneath the Site area are typical of the Piedmont with primarily low permeability silts
and clays. The release of PCE at the dry cleaners entered the unsaturated soil and moved
downward to the water table. The unsaturated soils (above the water table) were investigated by
both Ashland and Tara Retail with direct push borings. Soil boring locations and soil analytical
results collected by Tara Retail are shown on Figure D-17. A summary of the Ashland direct
push soil analytical data is presented in Table 2-2 and the boring locations are shown on Figure
D-18.
On-site concentrations of PCE are above RRS of 2 mg/kg to a depth of approximately 30 ft bgs
in soils directly beneath the dry cleaning building and immediately to the south and east of the
building. Soils beneath the building and outside the rear entrance (to the east) have been
delineated vertically to top of bedrock as borings were sampled to refusal. Tara Retail soil
borings have delineated the soils laterally away from the building to below the RRSs (Figures
D-19 through D-22).
3.10 Extent of COCs in Groundwater
Between 2006 and 2011, Ashland collected more than 14 analytical data sets for volatile
organic compounds (VOCs) to evaluate the vertical and horizontal distribution of VOCs in
groundwater beneath and west and south of the Site. The results of field screening and
analytical testing provide information about aquifer conditions and groundwater quality
beneath and adjacent to the Site. Analytical results for VOCs are tabulated on Table 2-4. A
summary of additional water quality parameters (i.e., pH, conductivity, temperature, turbidity,
etc.) for those wells monitored during the pilot study (MW-2, MW-8, MW-10, and MW-11
clusters) are tabulated on Table 2-5. Total VOC isoconcentration contours from the May 2011
groundwater sampling event for the Upper Residuum, Lower Residuum, and the Bedrock
Aquifer are provided on Figures D-23, D-24, and D-25, respectively.
As identified in Section 3.8, the Type 3 Non-Residential RRSs for PCE and TCE is 5 µg/L.
Delineation of both COCs in the groundwater close or below the RRSs has been completed both
east (upgradient), and north and south (side gradient) of the Site. At the downgradient property
line for the Site (Tara Boulevard), MW-8A and MW-8B currently exceed the RRSs as well as
wells on the west side of Tara Boulevard (MW15A/B and MW16A/B). Bedrock well MW-8C is
below the RRSs for PCE and TCE.
3.11 Extent of COCs in Surface Water
As described in the hydrogeologic model above, groundwater in both the overburden and
bedrock units discharge to surface water. Surface water sampling has detected the presence of
PCE and TCE in surface water collected near the upper reaches of the unnamed creek (SS-1 and
SS-2) in four events between October 2009 and November 2011 above the Surface Water
Delineation Standard. The downgradient sites were sampled in March 2011 for the purposes of
delineation (T-1 through T-4) and were non-detect at T-2 through T-4. Figure D-26 presents the
approximate locations of the surface water sampling. The surface water analytical results are
summarized in Table 2-6.

Preliminary Conceptual Site Model
3-18
Based on the March 2011 sampling results, the PCE concentrations progressively decreased from
the headwater of the unnamed creek to its confluence with the unnamed tributary. This suggests
localized entry of impacted water near the headwater of the unnamed creek and dilution effects
downstream. Whether the dilution effects are solely due to baseflow conditions (groundwater) or
contributed by surface run-off/stormwater discharge is inconclusive. There is some evidence
showing stormwater contribution to dilution effects.
3.12 Fate and Transport
The analysis of the fate and transport of Site COCs is critical to the evaluation of risk and the
development of potential remedial alternatives. PCE is the most widespread COC detected at the
Site, occurring in soil, groundwater, and off-site surface water. This section has been prepared to
focus on the factors affecting the migration and fate of PCE, the potential routes of migration, the
likelihood for natural attenuation of the contamination, and an evaluation of potential routes of
exposure and potential receptors.
3.12.1 Potential Routes of PCE Migration
Understanding how PCE may have migrated in the subsurface is instrumental to understanding
how PCE is currently affecting potential receptors and/or how it may potentially affect such
receptors in the future. As discussed in Section 2.3, PCE was released from the dry cleaning
facility during active operations primarily as a result of leaks at the dry cleaning machine and
potential additional contributions from a documented release during delivery to the dry cleaner.
These incidental releases of PCE over time resulted in PCE entering unsaturated soils and
subsequently migrating downward towards the water table as a dense non-aqueous phase liquid
(DNAPL). While PCE potentially migrated as DNAPL to the water table and both soil and
groundwater concentrations under the dry cleaners are indicative of DNAPL, there have been no
observations of DNAPL accumulations in wells. Further both soil and groundwater
concentrations indicate that the majority of mass is still at or above the water table with
concentrations rapidly declining with depth below the water table.
On the basis of field data, the DNAPL at the Site appears to be trapped and immobilized within
the soil pore spaces in the unsaturated soils above the water table and potentially in a localized
area just below the groundwater surface immediately adjacent to the building. The water table is
currently present at a depth of over 27 ft bgs. Elevated VOC concentrations in the groundwater
are typically observed in the upper 10 ft of the residuum aquifer, except at MW-2 Cluster near
the Source Area.
The presence of residual DNAPL impacts in the unsaturated zone in and around the dry cleaners
reflects the low permeability of soils and the limited infiltration that is occurring within the area.
All areas with soil impacts are covered with either buildings and/or pavement.
Dissolution of PCE into the residuum aquifer has created a groundwater plume that extends
approximately 700 ft southwest from the Source Area(s) in the direction of groundwater flow
with the highest concentrations detected in the upper part of the residuum aquifer.
Concentrations decrease significantly (by orders of magnitude) with depth and are lowest within
the competent bedrock which is tight and exhibits a low degree of fracturing.

Preliminary Conceptual Site Model
3-19
Groundwater flow directions from the Site are generally oriented toward the unnamed creek
located west of the Site and Tara Boulevard. The extent and magnitude of the unnamed creek as
a receptor to groundwater flow in the residuum and the bedrock is currently not well understood
but initial surface water monitoring results have determined that impacted groundwater is
discharging to surface water.
Moderate dissolved oxygen concentrations, less than neutral pH, and low total organic carbon in
the residuum limits the biodegradation of PCE in groundwater. This limited biodegradation is
reflected in the low concentrations of breakdown (daughter) products relative to the
concentrations of PCE observed in groundwater. However attenuation of chlorinated compounds
may be occurring within the distal portions of the plume (immediately adjacent to the streams)
where alluvial modified sediments and detritus are providing organic rich soils and low REDOX
conditions conducive to biodegradation.
Based on the existing and historical analytical data over the past three years, the plume in the
Source Area appears to be stable.
3.12.2 Potential Exposure Pathways and Receptors
A full evaluation of potential exposure pathways and receptors will be performed as part of the
forthcoming Site-wide Corrective Action Plan which will propose final remedies for all impacted
media at the Site.
Currently potential exposure to soil, groundwater and vapor impacts at the Site are limited. All
areas of soil impact are covered within either buildings or pavement and groundwater is not be
utilized in the immediate vicinity of the site. In addition, the former dry cleaning building and a
number of adjacent buildings and structures are vacant and as a result, potential exposures to
subsurface vapors are also limited.
Pursuant to a request by Georgia EPD, in their letter dated November 3, 2010, Ashland
performed a PRE for aquatic impacts. Surface water quality results were compared with the
USEPA Region IV Freshwater Surface Water Screening Values and alternate screening values
as described in Section 3.8.2 above. In general surface water conditions indicated PCE was not
detected above the USEPA Region IV Freshwater Surface Water Screening Values in any of
the surface water samples collected during the March 2011 sampling event. TCE, cis1,2-DCE,
and vinyl chloride were not detected above the alternate screening values in any of the surface
water samples collected during the March 2011 sampling event. Based on the surface water
quality results, aquatic impacts are not anticipated.

Corrective Action Investigation
4-20
4.0 CORRECTIVE ACTION INVESTIGATION
This section of the VRP application discusses the proposed scope of work to further delineate
groundwater impacts migrating from the Tara Shopping Center (former dry cleaner site) and
assess long term remedial options.
Ashland has completed pilot testing of In-situ Chemical Oxidation as a remedial technology for
the dilute groundwater plume (groundwater impacts down-gradient of the source area). However
this technology has not proved successful at reducing the mass of contaminants in the
groundwater. The low permeability of the site soils (despite the use of hydraulic fracturing in the
pilot tests) has been identified as a key constraint on remedial success at this site. On this basis,
alternative remedial options are being assessed for groundwater with the supplemental
investigation program discussed below integral to this evaluation process.
4.1 Groundwater Delineation Workplan
Based on the result of the preliminary CSM for groundwater, Ashland has determined there is
insufficient data to select a preferred remedial alternative for downgradient groundwater at this
time. The technology evaluations completed to date indicate that under current conditions (prior
to application of the source remedy):
In situ chemical oxidation is ineffective at treating the dissolved phase groundwater
downgradient of the Source Area.
Reductive dechlorination processes are not occurring in the Source Area due to redox
conditions within the aquifer and the absence of electron donors. This is reflected in the
site geochemistry and the absence of daughter products in groundwater.
Insufficient data is currently available to assess natural attenuation processes in off-site
groundwater. Off-site geochemical conditions are likely to be more conducive to
reductive de-chlorination, especially in areas of adjacent to the streams where natural
organic materials are present.
While a remedy is not currently being proposed for off-site groundwater, the on-site source
remedy (which involves aggressive treatment of the Source Area) will provide significant
benefits, reducing mass flux from the Source Area to downgradient areas and reducing the
longevity of groundwater impacts. The aggressive nature of the proposed source remedies is
considered to improve the viability of MNA (if potential risks and exposures are acceptable) as
an off-site groundwater remedy.
The primary data gaps identified in the existing data sets are the lack of water level, bedrock
structural and unknown water quality conditions in three off-site areas shown in Figure 4-1.
These areas include the bedrock at wells MW-15 A/B; residuum, bedrock and surface water near
the headwater of the unnamed creek; and the residuum and bedrock south-southwest from wells
MW-16 A/B/C. To provide sufficient data to facilitate the detailed assessment of remedial
alternatives for groundwater, the following scope of work has been proposed to assess
groundwater downgradient of the Site:

Corrective Action Investigation
4-21
1. Installation of 10 monitoring wells (access dependent) to further evaluate the presence of
VOCs in groundwater downgradient of the Site (A zone wells indicate upper residuum, B
zone wells indicate lower residuum and C zone indicate upper bedrock):
MW-15C
MW-18 A/B/C
MW-19A/B/C
MW-20 A/B/C
The rationalization for these monitoring wells was described in the Final Pilot Test Report
and Groundwater Corrective Action Investigation Workplan (EHS, 2011c).
2. Installation of two staff gauges in the unnamed creek west of the Site.
As noted in Section 3.0, surface water elevation, streambed elevation, surface water flow
and water quality are needed to complete the groundwater flow conceptualization. It is
recommended that surface water gauge SG-1 be located as close as possible to
monitoring wells MW-19A/B/C and MW-20A/B/C for accurate hydraulic gradient
evaluations. Surface water gage SG-2 is proposed near the previous surface water
sampling site T-1 or immediately upstream from the confluence of the unnamed creek
with the unnamed tributary (Figure 4-2). It is recommended that stormwater discharging
to the unnamed creek be sampled for water quality analysis when feasible.
3. Completion of robust groundwater monitoring event including monitored natural
attenuation (MNA) parameters to better understand the fate and transport of contaminants
in groundwater off-site
4. Completion of Fate and Transport modeling to assess the long-term stability of
groundwater impacts, the potential effects of source remediation and allow quantitative
evaluation of remedial alternatives in terms of predicted benefits to groundwater
concentrations, plume extent and plume longevity.
A general discussion of the methodologies is provided in the Final Pilot Test Report and
Groundwater Corrective Action Investigation Workplan (EHS, 2011c).
4.2 Potable Well Search
Ashland will complete a well search to determine the current status of the wells identified south
and southwest of the Site. The findings from this search will be provided in a supplemental
document to Georgia EPD.

Proposed Cleanup Standards
5-1
5.0 PROPOSED CLEANUP STANDARDS
Delineation for soil and groundwater (both on and off-site) is based on Type 1 through 4 RRSs
presented in Section 3.8. Under the VRP program, Ashland is proposing that the Source Area be
remediated to meet the Type 5 RRS for soil and groundwater. Pursuant to 391-3-19-.07 (10),
Type 5 standards allow the use of engineering controls such as a fence, placement of a cap,
installation of a slurry wall, or stabilization/ solidification/fixation of the waste or waste residues.
Under Type 5 RRSs removal, decontamination, or treatment are used where appropriate to
remove the principal threats at a site. Further, it is understood that compliance with Type 5
standards also requires the following:
1. Long-term monitoring and maintenance, as appropriate for implemented remedial
measures, plus a restrictive covenant provided in accordance with Rule 391-3-19-.08(7);
2. Type 1, 2, 3, or 4 risk reduction standards, as applicable, be met beyond the boundary of
the area for which compliance with Type 5 standards are sought whenever
implementation of remedial measures is complete; and
3. Remedial measures designed to achieve compliance with Type 5 standards shall be
consistent with the general requirements of Rule 391-3-19-.07(10)(a) and meet all the
performance criteria set forth in subparts 10(d)1 through 5.
Ashland proposed Site-specific cleanup standards will be developed following Source Area
remediation and will be based upon direct exposure factors for surficial soils within two ft of
land surface, construction worker exposure factors for subsurface soils to a specified
construction depth, and soil concentrations for protection of groundwater criteria at an
established point of exposure for groundwater for soils situated above the uppermost
groundwater zone. Ashland will also propose continuing actions and controls necessary to
maintain compliance with Type 5 RRS and to prevent any unacceptable exposure from
contamination at the Site. If necessary, institutional controls for soil, groundwater and/or soil
vapor will be implemented in compliance with Georgia EPD environmental standards.
Ashland understands that as the responsible party it has the burden of being able to demonstrate
to the satisfaction of the Georgia EPD that the particular mix of removal, decontamination,
treatment and/or control measures is appropriate to eliminate or abate present and future threats
to human health and the environment and that institutional controls should not be substituted for
active remedial measures unless such active measures are determined not to be practicable.
Section 6.0 describes the remedial alternatives Ashland is currently evaluating for the Source
Area remediation.

Evaluation of Remedial Technologies
6-2
6.0 EVALUATION OF REMEDIAL TECHNOLOGIES
A preliminary evaluation of remedial options for the source area identified the following
candidate technologies:
In-situ Electrical Resistive Heating (ERH)
Soil excavation and off-site disposal
In-situ Solidification/Stabilization (S/S) utilizing large diameter auger (LDA)
Electro Thermal Dynamic Stripping Process (ET-DSPTM
), also referred to as ERH, was
previously approved by the Georgia EPD in late 2010 with Tara Retail as the lead for Source
Area remediation. In 2011, disagreements within Tara Retail lead to the postponement of
remediation activities and in December 2011, Ashland signed a Remediation Agreement with
Tara Retail and assumed lead remediation oversight at the Site. Additional technologies are
being evaluated to determine which technology is likely to be most effective in treating the
Source Area, most implementable, and most cost effective. Once the final technology is
selected, Ashland will submit a detailed Final Remediation Plan and implementation schedule.
A brief summary of each technology is provided below.
6.1 Electrical Resistive Heating
ET-DSPTM
/ERH may be used in combination with a vapor extraction system for remediation of
the Source Area. The approach is based upon the success of other ET-DSPTM
projects in
conjunction with Site-specific data. The goal of the ERH remediation system is to efficiently
heat up the defined treatment area; maintain a temperature of 100°C or the azeotropic boiling
point of PCE, whichever is greater; create sufficient steam for thorough dynamic stripping; and
extract enough liquids and vapors to maintain hydraulic and pneumatic control during
contaminant recovery without removing excessive energy from the subsurface. A vapor cap, in
the form of the existing concrete and asphalt surfaces will be used around the perimeter to
increase vapor recovery, maximize thermal efficiency, and optimize the well-field geometry.
The thermal remediation approach includes ET-DSPTM
electrode wells, multi-phase extraction
(MPE) wells and Temperature Sensor Wells. The ET-DSPTM
electrodes will increase the
temperature in the subsurface through the heat transfer mechanisms associated with conduction,
convection, and electrical heating. This remediation technology, therefore, has many beneficial
effects that will aid in the removal of the primary COCs at the Site.
The boiling point of a compound is the temperature at which the compounds’ vapor pressure is
equal to atmospheric pressure. Thus, by increasing the temperature of the subsurface using
ET-DSPTM
the vapor pressure of the contaminants increases. Consequently, by heating the
subsurface the volatility of the VOCs increase, which increases their removal efficiency via soil
vapor extraction.
The MPE wells will be used to extract VOCs in both vapor and liquid phases. Each MPE well
will have a drop tube or pneumatic pump for liquid extraction. A trailer mounted skid system
will be used for treatment and extraction process. The MPE well will be connected to a vacuum

Evaluation of Remedial Technologies
6-3
blower. The resulting vacuum in the MPE well will be the driving force for extraction of soil
vapors and VOCs.
The treatment system is designed to process two flow streams; (1) vapors and entrained liquids
and (2) groundwater. Discharge of contaminants that have been removed from the subsurface
will be controlled primarily with carbon absorption. A secondary method used to control
emissions will be vacuum capture of fugitive emissions from treatment system vessels. The
vapor control system has been designed with both regenerative and sacrificial carbon adsorption
systems. The regenerative carbon will be regenerated using steam and associated wastewater
treated using the groundwater treatment system as described above in the process groundwater
treatment and DNAPL (recovered as part of the regenerative process) will be separated and
containerized prior to treatment of the groundwater stream.
It is estimated that 90% to 95% of the mass removed from the subsurface will be in the vapor
stream. The total subsurface mass estimate in the treatment area is approximately 7,375 pounds
(lbs). Approximately 6,638 to 7,006 lbs will be in the vapor phase and will be removed with the
two vapor-phase granular activated carbon (GAC) vessels. Therefore, approximately 520
gallons (~7,000 lbs) of PCE will be removed and sent off-site for disposal. Removal efficiency
for these vessels will be at least 95%. Therefore, total mass released to the atmosphere from the
vapor phase is estimated to be less than 350 lbs over the duration of the project.
6.2 Excavation and Off-Site Disposal
The excavation and off-site disposal option would involve the removal of unsaturated source
soils to a depth of 25 ft bgs in Areas 1A and 1B and saturated source soils to a depth of
approximately 35 ft bgs in Area 1 (Figure D-17). In addition unsaturated source soils within
Areas 2 and 3 that are likely to be a continuing source of dissolution to groundwater would also
be excavated. Approximately 27,000 tons of soils potentially will be excavated and transported
off-site to an authorized disposal facility under proper waste manifests. The excavation will be
backfilled with certified clean material in accordance with local and state regulations. The area
would be restored to pre-excavation conditions.
This remedial option would potentially involve the demolition and removal of buildings to
facilitate the excavation or sheetpiling and shoring to enable excavation close to the building.
The presence of buildings and utilities (both private and public) is a significant impediment to
the performance of this remedial option.
6.3 In-situ Treatment with a Large Diameter Auger
In-situ Treatment using LDA typically includes the term "solidification/stabilization" (S/S) and
refers to a general category of processes used to treat a wide variety of wastes, including solids
and liquids. Solidification and stabilization are each distinct technologies.
Solidification refers to processes that encapsulate a waste to form a solid material and to
restrict contaminant migration by decreasing the surface area exposed to leaching and/or
by coating the waste with low-permeability materials. Solidification can be
accomplished by mechanical processes or by a chemical reaction between a waste and
binding (solidifying) reagents, such as cement, kiln dust, or lime/fly ash. Solidification

Evaluation of Remedial Technologies
6-4
of fine waste particles is referred to as microencapsulation, while solidification of a large
block or container of waste is referred to as macroencapsulation.
Stabilization refers to processes that involve chemical reactions that reduce the leach-
ability of a waste. Stabilization chemically immobilizes hazardous materials or reduces
their solubility through a chemical reaction. The physical nature of the waste may or may
not be changed by this process.
In-situ stabilization typically involves the addition of binding agents to an area of sludge or soils
and addition of water where necessary, followed by repeated in-place mixing with the bucket of
a back or track hoe to mix and stabilize the sludges or soils in place. A growing method of in
situ S/S involves the use of very large flighted rotary augers, 6 to 8 or more ft in diameter,
capable of injecting slurry chemicals and water through the auger flights. The auger bores and
mixes a large-diameter "plug" of the contaminated material. During augering, stabilization
chemicals and water (if needed) are injected into the soils. After thorough mixing, the auger is
removed and the setting slurry is left in place. The auger is advanced to overlap the last plug
slightly, and the process is repeated until the contaminated area is completed.
As conventional S/S does not remove or destroy the contaminants present, the selection of
binders must address (1) compatibility between the binders and the materials being treated, (2)
the presence of chemicals that interfere with the setting and durability of the product, and (3)
anticipated ground and groundwater conditions over the long term. Because of the variable
nature of contaminated soil encountered, bench-scale testing to evaluate the effectiveness of
potential binder systems is an essential prerequisite to S/S in the field. The nature of
contaminants may vary across a site requiring remediation, which means that more than one
binder formulation may be required for use during an S/S operation. Furthermore, the effects of
otherwise unforeseen contaminant/binder interactions can be identified during treatability
studies.
The efficiency of S/S treatment of organic contaminants can be improved by using adsorbents for
the organic components. The adsorbents can be incorporated as additives in the cement mix or
used as a pretreatment prior to conventional cement-based solidification. Many of these
additives are waste products of industrial processes. Additives such as activated carbon,
shredded tire particles, and organoclays (sorbents) can increase the chemical containment of the
contaminant. Additives such as silica fume and fly ash can improve the physical containment of
organic compounds by reducing waste form porosity and permeability.
Immobilization of organic compounds in a cement matrix, with or without adsorbent, is mainly a
result of physical entrapment. For better long-term effectiveness, a more desirable process
would be to transform the organic wastes to less hazardous constituents. Degradative S/S is a
novel remediation technology that combines the immobilization and degradation of
contaminants. Cement slurries containing ferrous oxide have been tested on PCE, effectively
reducing the chlorinated compound to non-chlorinated byproducts. In such a system, the
contaminants can be retained in the system until enough time has elapsed for degradation to
occur, thereby preventing any environmental releases.

Evaluation of Remedial Technologies
6-5
S/S using LDA will utilize 6-ft, 8-ft, or 10-ft diameter augers to mix soils in situ at the Site (See
Picture below). This technology will solidify and stabilize unsaturated source soils to a depth of
25 ft bgs in Areas 1A and 1B and saturated source soils to a depth of approximately 35 ft bgs in
Area 1 (Figure D-17). Unsaturated source soils within Areas 2 and 3 are likely to be a continual
source of dissolution to groundwater and therefore, will also be solidified and stabilized.
Picture of LDA
Solidification and stabilization of the impacted soils would most likely be achieved using a 5%
cement addition and a 1%-2% activated carbon addition. However, a treatability study would
need to be performed on the soils to determine the actual type and quantity of reagents. A
treatability study would involve collecting and reviewing key geotechnical and analytical data
including, but not limited to, soil types, density, compressive strength, permeability, levels of
contamination, odor issues, water table/perched water issues, potential subsurface obstructions,
etc. After remediation is complete, the area will be restored to pre-remediation conditions.
This remedial option would potentially involve the demolition and removal of buildings to
facilitate the treatment of soils under the former dry cleaning building. The presence of buildings
and utilities (both private and public) is a significant impediment to the design and
implementation of this remedial option.
6.4 Remedial Alternative Selection
Prior to selecting one of the technologies referenced above, Ashland will first complete a
treatability study to further evaluate the LDA technology as well as further evaluate costs
associated with potential soil excavation described above. It is anticipated the treatability study
will take 60-90 days to complete. The results of the treatability study and excavation cost
bidding will be compared to the previously approved ERH technology so that Ashland can
determine which technology is likely to be most effective in treating the Source Area, most
implementable, and most cost effective. As noted above, once the final technology is selected,
Ashland will submit a detailed Final Remediation Plan and implementation schedule. A
projected milestone schedule is provided in Section 7.0.

Projected Milestone Schedule
7-6
7.0 PROJECTED MILESTONE SCHEDULE
A Projected Milestone Schedule, showing estimated timelines for the following items, is
included in Appendix E.
Proposed Groundwater Corrective Action Investigation
Source Area Treatability Test
Updated CSM Submittal
Final Source Area Remediation Plan and Preliminary Cost Estimate Submittal
Implementation of Source Area Remedy
Final Off-site Groundwater Remediation Plan and Preliminary Cost Estimate Submittal
Implementation of Off-site Groundwater Remedy
Semi-Annual Progress Report Submittals
Compliance Status Report (CSR) Submittal
References
8-1
8.0 REFERENCES
EHS, 2011a. EHS Support, Inc., Surface Water Monitoring Plan for Ashland Inc., Tara
Shopping Center, Jonesboro, Georgia: GA EPD HSI Site No. 10798, February 3, 2011.
EHS, 2011b. EHS Support, Inc., Surface Water Monitoring Report, for Ashland Inc., Tara
Shopping Center, Jonesboro, Georgia: GA EPD HSI Site No. 10798, May 23, 2011.
EHS, 2011c. EHS Support, Inc., Pilot Test Effectiveness Repot and Groundwater Corrective
Action Investigation Workplan, Tara Shopping Center, 8564 Tara Boulevard, Jonesboro,
Georgia, July 8, 2011.
EHS, 2011d. EHS Support, Inc., Surface Water Monitoring Report, for Ashland Inc., Tara
Shopping Center, Jonesboro, Georgia: GA EPD HSI Site No. 10798, December 21,
2011.
EPS, 2005. Environmental Planning Specialists, Inc. Limited Phase II Environmental Site
Assessment, Tara Plaza Shopping Center, Dry Cleaner Location, 8564 Tara Boulevard,
Jonesboro, Georgia 30236. July 11, 2005.
EPD, 2008a. Georgia EPD, Proposed Risk Reduction Standards, March 11, 2008.
EPD, 2008b. Georgia EPD, Risk Reduction Standard Approval, September 25, 2008.
EPD, 2009. Georgia EPD, Groundwater Corrective Action Plan Approval letter, June 26, 2009.
Legrand, 2004. Legrand, H.E., A Master Conceptual Model for Hydrogeological Site
Characterization in the Piedmont and Mountain Region of North Carolina, A guidance
manual: North Carolina Department of Environment and Natural Resources.
Miller, 1990. Miller, J.A., Groundwater Atlas of the United States – Piedmont and Blue Ridge
Aquifers. U.S. Geological Survey HA 730-G.
Peachtree, 2010a. Peachtree Environmental, Inc. Remedial Design Report, In-Situ Thermal
Treatment of the Tara Shopping Center, Jonesboro, Georgia, Final Version, December 7,
2010.
Peachtree, 2010b. Peachtree Environmental, Inc. Phase Soil Treatment Design for Areas 2 and
3, Tara Shopping Center, Jonesboro, Clayton County, Georgia, December 2010.
Qore, 2004. Report of Phase I Environmental Site Assessment and Additional Services. Dunkin
Donuts, 8650 Tara Boulevard, Jonesboro, Clayton County, Georgia 30236. August 2004.

References
8-2
Terracon, 2004. Limited Site Investigation. Dunkin Donuts Facility, 8650 Tara Boulevard,
Jonesboro, Clayton County, Georgia. September 17, 2004.
Toth, 1963. Toth, J., A Theoretical Analysis of Groundwater Flow in a Small Drainage Basin,
Journal of Geophysical Resources, vol. 68(16), pp. 4795-4812.
URS, 2006a. URS Corporation, Compliance Status Report, Tara Shopping Center, Jonesboro,
Georgia: HSI 10798, October 18, 2006 (revised November 30, 2006).
URS, 2006b. URS Corporation, Revised Compliance Status Report, Tara Shopping Center,
8564 Tara Boulevard, Jonesboro, Georgia, November 30, 2006.
URS, 2009a. URS Corporation, Groundwater Correction Action Plan for Ashland Inc., Tara
Shopping Center, Jonesboro, Georgia: GA EPD HSI Site No. 10798, March 20, 2009.
URS, 2009b. URS Corporation, In-Situ Remediation Pilot Test Workplan, Jonesboro, Georgia,
August 10, 2009.
URS, 2009c. URS Corporation, Groundwater Correction Action Plan Addendum for Ashland
Inc., Tara Shopping Center, Jonesboro, Georgia: GA EPD HSI Site No. 10798,
September 28, 2009.
URS, 2010a. URS Corporation, PRZ Pilot Test Progress Report, Tara Shopping Center, January
18, 2010.
URS, 2010b. URS Corporation, PRZ Pilot Test Progress Report, Tara Shopping Center, April
21, 2010.
URS, 2010c. URS Corporation, Third PRZ Pilot Test Progress Report, Tara Shopping Center,
August 6, 2010.
URS, 2010d. URS Corporation, Surface Water Quality Letter report, Tara Shopping Center,
September 17,2010.

TABLES

Table 2-2Summary of Historical Soil Analytical Summary
Tara Shopping CenterJonesboro, GA
VRP Application 1 of 2
Date Collected PID Report
Sample IDSoil boring (depth) ppm ug/kg mg/kg ug/kg mg/kg ug/kg mg/kg
SB-1 (3-4)* 9-Jun-05 NA ND - 24 0.024 300 0.30 EPS, 2005SB-2 (1-2)* 9-Jun-05 NA 15,000 15 8.2 0.0082 3,600 3.60 EPS, 2005TMW-1 (0-4)* 9-Jun-05 NA 1,200,000 1,200 ND - 2,400 2.4 EPS, 2005SB-1 (0-2) 28-Mar-06 689.0 <4.8 <4.8 <4.8 URS, 2006aSB-1 (2-6) 28-Mar-06 401.0 78 0.078 5.9 0.006 <5 URS, 2006aSB-1 (6-10) 28-Mar-06 220.0 99 0.099 6.8 0.007 <5.5 URS, 2006aSB-1 (10-14) 28-Mar-06 7.0 10 0.01 <5.7 <5.7 URS, 2006aSB-1 (14-18) 28-Mar-06 8.1 <5.8 <5.8 <5.8 URS, 2006aSB-2 (2-6) 29-Mar-06 1,027.0 6,000 6.0 <1100 15,000 15 URS, 2006aSB-2 (6-10) 29-Mar-06 78.9 2,700 2.7 270 0.270 1,800 1.80 URS, 2006aSB-2 (10-14) 29-Mar-06 1,698.0 7,400 7.4 590 0.590 2,100 2.10 URS, 2006aSB-2 (14-18) 29-Mar-06 350.0 1,300 1.3 <260 670 0.67 URS, 2006aSB-2 (18-22) 29-Mar-06 506.0 9,900 9.9 830 0.830 2,000 2.00 URS, 2006aSB-3 (0-2) 29-Mar-06 150.0 37,000 37 3,800 3.8 3,600 3.60 URS, 2006aSB-3 (2-6) 29-Mar-06 1,725.0 44,000 44 <2400 2,500 2.50 URS, 2006aSB-3 (6-10) 29-Mar-06 191.0 9,800 10 <510 3,300 3.30 URS, 2006aSB-3 (10-14) 29-Mar-06 3,094.0 65,000 65 <2700 <2700 URS, 2006aSB-3 (14-18) 29-Mar-06 373.0 4,900 4.9 330 0.330 1,100 1.1 URS, 2006aSB-3 (18-22) 29-Mar-06 264.0 33,000 33 <1700 3,700 3.7 URS, 2006aSB-4 (0-2) 28-Mar-06 820.0 26,000 26 <2400 <2400 URS, 2006aSB-4 (2-6) 28-Mar-06 2,810.0 2,400 2.4 <2300 44,000 44.0 URS, 2006aSB-4 (6-10) 28-Mar-06 1,155.0 18,000 18 <2000 11,000 11.0 URS, 2006aSB-4 (10-14) 28-Mar-06 1,558.0 5,900 5.9 <1200 2,500 2.5 URS, 2006aSB-4 (14-18) 28-Mar-06 NM 12,000 12 660 0.660 2,400 2.4 URS, 2006aSB-4 (18-22) 28-Mar-06 512.0 30,000 30 <1700 3,700 3.7 URS, 2006aSB-5 (0-2) 29-Mar-06 829.0 6,500 6.5 10,000 10.0 <530 URS, 2006aSB-5 (2-6) 29-Mar-06 6,036.0 2,400,000 2,400 <90000 <90000 URS, 2006aSB-5 (6-10) 29-Mar-06 3,875.0 11,000,000 11,000 <500000 <500000 URS, 2006aSB-5 (10-14) 29-Mar-06 2,569.0 2,000,000 2,000 <500000 <500000 URS, 2006aSB-5 (14-18) 29-Mar-06 561.0 2,900,000 2,900 <160000 <160000 URS, 2006aSB-5 (18-22) 29-Mar-06 1,706.0 17,000 17 1,200 1.2 2,100 2.1 URS, 2006aSB-6 (0-2) 29-Mar-06 21.7 3,000 3 2,800 2.8 4,300 4.3 URS, 2006aSB-6 (2-6) 29-Mar-06 306.0 1,100,000 1,100 <49000 <49000 URS, 2006aSB-6 (6-10) 29-Mar-06 96.3 12,000 12 1,800 1.8 5,100 5.1 URS, 2006aSB-6 (10-14) 29-Mar-06 83.6 540,000 540 <25000 <25000 URS, 2006aSB-6 (14-18) 29-Mar-06 22.3 29,000 29 2,400 2.4 4,000 4.0 URS, 2006aSB-6 (18-22) 29-Mar-06 263.0 14,000 14 1,500 1.5 2,700 2.7 URS, 2006aSB-7 (6-10)** 30-Mar-06 9,999.0 <4.4 <4.4 <4.4 URS, 2006aSB-8 (0-2) 29-Mar-06 34.3 <5.0 <5.0 9.6 0.0 URS, 2006aSB-8 (2-6) 29-Mar-06 56.2 160 0.16 <5.4 <5.4 URS, 2006aSB-8 (6-10) 29-Mar-06 41.1 90 0.09 <5.6 <5.6 URS, 2006aSB-8 (10-14) 29-Mar-06 239.0 920 0.92 <210 <210 URS, 2006aSB-8 (14-18) 29-Mar-06 110.0 2,400 2.4 <280 <280 URS, 2006aSB-8 (18-22) 29-Mar-06 15.4 2,500 2.5 <270 <270 URS, 2006aSB-9 (10-14)** 30-Mar-06 9,999.0 15 0.015 <4.9 <4.9 URS, 2006aSB-9 (14-18)** 30-Mar-06 9,999.0 45 0.045 <6.0 <6.0 URS, 2006aSB-10 (2-6) 30-Mar-06 4.5 <5.4 <5.4 <5.4 URS, 2006aSB-11 (14-18) 30-Mar-06 6.8 18 0.018 <7.3 <7.3 URS, 2006aSB-12 (6-10) 30-Mar-06 14.1 <5.5 <5.5 <5.5 URS, 2006aSB-13 (14-18) 30-Mar-06 28.0 <5.3 <5.3 <5.3 URS, 2006aSB-14 (18-22) 3-Apr-06 4.7 <5.4 <5.4 <5.4 URS, 2006aSB-15 (0-2) 3-Apr-06 10.8 <5.6 <5.6 <5.6 URS, 2006aSB-16 (2-6) 3-Apr-06 304.0 <5.9 <5.9 <5.9 URS, 2006aSB-17 (0-2)** 3-Apr-06 NM <5.5 <5.5 <5.5 URS, 2006aSB-18 (0-3)** 3-Apr-06 NM <6.2 <6.2 <6.2 URS, 2006aSB-19 (0-1) 29-Mar-06 NM 370,000 370 <14,000 <14,000 URS, 2006aSB-19 (1-5) 31-Mar-06 71.3 2,900 2.9 <500 10,000 10.0 URS, 2006aSB-19 (5-9) 31-Mar-06 406.0 3,400 3.4 430 0.430 5,400 5.4 URS, 2006a
cis-1,2-Dichloroethene (cis-1,2-DCE)Trichloroethene (TCE)Tetrachloroethene (PCE)

Table 2-2Summary of Historical Soil Analytical Summary
Tara Shopping CenterJonesboro, GA
VRP Application 2 of 2
Date Collected PID Report
Sample IDSoil boring (depth) ppm ug/kg mg/kg ug/kg mg/kg ug/kg mg/kg
cis-1,2-Dichloroethene (cis-1,2-DCE)Trichloroethene (TCE)Tetrachloroethene (PCE)
SB-19 (9-13) 31-Mar-06 788.0 3,900 3.9 550 0.550 2,200 2.2 URS, 2006aSB-19 (13-17) 31-Mar-06 721.0 1,900 2 250 0.250 1,200 1.2 URS, 2006aSB-19 (17-21) 31-Mar-06 1,489.0 10,000 10 1,100 1.10 2,700 2.7 URS, 2006aSB-20 (1-5) 31-Mar-06 4,405.0 6,300,000 6,300 <280000 <280000 URS, 2006aSB-20 (5-9) 31-Mar-06 3,617.0 3,600,000 3,600 <260000 <260000 URS, 2006aSB-20 (9-13) 31-Mar-06 4,086.0 14,000 14 <610 1,800 1.8 URS, 2006aSB-20 (13-17) 31-Mar-06 6,503.0 23,000 23 <1200 2,900 2.9 URS, 2006aSB-20 (17-21) 31-Mar-06 4,129.0 17,000 17 1,600 1.60 3,800 3.8 URS, 2006aSB-21 (1-5) 31-Mar-06 2,233.0 38,000 38 62,000 62.00 32,000 32.0 URS, 2006aSB-21 (5-9) 31-Mar-06 482.0 28,000 28 2,400 2.40 10,000 10.0 URS, 2006aSB-21 (9-13)** 31-Mar-06 9,999.0 3,300 3.3 380 0.380 1,700 1.7 URS, 2006aSB-21 (13-17) 31-Mar-06 598.0 2,300 2.3 300 0.30 1,200 1.2 URS, 2006aSB-21 (17-21) 31-Mar-06 98.6 5,800 5.8 570 0.570 2,000 2.0 URS, 2006aSB-22 (1-5) 31-Mar-06 495.0 63,000 63 4,400 4.40 3,900 3.9 URS, 2006aSB-22 (5-9) 31-Mar-06 1,413.0 13,000 13 <1000 3,300 3.3 URS, 2006aSB-22 (9-13) 31-Mar-06 246.0 720 0.7 <270 740 0.7 URS, 2006aSB-22 (13-17) 31-Mar-06 341.0 3,900 3.9 560 0.560 1,600 1.6 URS, 2006aSB-22 (17-21) 31-Mar-06 978.0 19,000 19 2,000 2.0 3,800 3.8 URS, 2006aSB-33 (28-30) 10-Dec-08 NM 27,000 27 <2,600 <2,600 URS, 2009aSB-33 (38-40) 10-Dec-08 NM <5.9 <5.9 <5.9 URS, 2009aSB-33 (48-50) 10-Dec-08 NM <6.1 <6.1 <6.1 URS, 2009aSB-33 (56-58) 10-Dec-08 NM <5.7 <5.7 <5.7 URS, 2009aSB-34 (28-30) 10-Dec-08 NM 3,000 3 <580 <580 URS, 2009aSB-34 (38-40) 10-Dec-08 NM 44 0 <6.2 <6.2 URS, 2009aSB-34 (48-50) 10-Dec-08 NM <5.7 <5.7 <5.7 URS, 2009aSB-34 (54-56) 10-Dec-08 NM <5.6 <5.6 <5.6 URS, 2009aSB-35 (28-30) 10-Dec-08 NM 5,700 5.7 <460 <460 URS, 2009aSB-35 (38-40) 10-Dec-08 NM 26 0.03 <7.1 <7.1 URS, 2009aSB-35 (48-50) 10-Dec-08 NM 38 0.04 <6.5 <6.5 URS, 2009aSB-35 (55-57) 10-Dec-08 NM 60 0.06 <5.7 <5.7 URS, 2009aSB-36 (28-30) 10-Dec-08 NM 1,100,000 1,100 <120,000 <120,000 URS, 2009aSB-36 (38-40) 10-Dec-08 NM 150 0 <6.9 <6.9 URS, 2009aSB-36 (48-50) 10-Dec-08 NM 21 0.02 <6.5 <6.5 URS, 2009aSB-36 (54-56) 10-Dec-08 NM 20 0.02 <5.3 <5.3 URS, 2009aSB-37 (28-30) 11-Dec-08 NM 8,300 8.3 480 4.8 670 0.67 URS, 2009aSB-37 (38-40) 11-Dec-08 NM <6.7 <6.7 <6.7 URS, 2009aSB-37 (48-50) 11-Dec-08 NM <6.9 <6.9 <6.9 URS, 2009aSB-37 (54-56) 11-Dec-08 NM 21 0 <5.1 <5.1 URS, 2009aSB-38 (28-30) 11-Dec-08 NM 1,700 1.7 <240 <240 URS, 2009aSB-38 (38-40) 11-Dec-08 NM 59 0.059 <5.9 <5.9 URS, 2009aSB-38 (48-50) 11-Dec-08 NM <6.7 <6.7 <6.7 URS, 2009aSB-38 (54-56) 11-Dec-08 NM <9.4 <9.4 <9.4 URS, 2009aMW-13B (15-17) 27-Feb-08 NM <5.7 <5.7 40 0.040 URS, 2009aMW-13B (20-22) 27-Feb-08 NM 120 0.12 93 0.093 750 D 0.750 D URS, 2009a
Notes:ug/kg - microgram per kilogram; mg/kg milligrams per kilogram
*Trans-1,2-dichloroethane: SB-1 (7.9 ug/kg), SB-2 (2,300 ug/kg); TMW-1 (20,000 ug/kg).** Moisture prevented accurate PID reading.NA: Not Available.ND/<: Not detected above laboratory detection limit (EPS, 2005).NM - Not measured due to malfunction of the PID.
Colored areas greater than PCE RRS of 2,000 ug/kg (2 mg/kg)

Table 2-3 - Summary of Monitoring Well Construction DetailsTara Shopping Center
Jonesboro, GeorgiaHSI 10798
VRP Application Page 1 of 2
Well Identification Date Installed
Well Casing
Diameter (in.)
Total Depth of Well (ft.
bgs)
Total Depth of Boring (ft. bgs)
Depth of Bedrock (ft.
bgs)Construction
Material
6-inch dia. Steel Casing
Depth (ft)Well
Completion
Screen Interval(ft. bgs)
Top of Casing Elevation
(ft. above MSL)
Ground Surface Elevation
(ft. above MSL)
MW-1A 04/25/06 2-IN. 25 25 NE PVC n/a FM 15-25 898.81 899.14MW-2A 04/25/06 2-IN. 25 25 NE PVC n/a FM 15-25 896.63 896.90MW-3A 05/03/06 2-IN. 25 25 NE PVC n/a FM 15-25 892.26 892.51MW-4A 04/28/06 2-IN. 25 25 NE PVC n/a FM 15-25 884.52 884.82MW-5A 05/01/06 2-IN. 25 25 NE PVC n/a FM 15-25 883.40 883.61MW-6A 05/02/06 2-IN. 25 25 NE PVC n/a FM 15-25 881.31 881.73MW-8A 07/26/06 2-IN. 32.5 32.5 NE PVC n/a FM 22.5-32.5 895.17 895.23MW-9A 07/25/06 2-IN. 32.5 32.5 NE PVC n/a FM 22.5-32.5 891.59 891.07MW-10A 02/19/08 2-IN. 37 38 NE PVC n/a FM 27 - 37 896.85 897.08MW-11A 02/20/08 2-IN. 30 30 NE PVC n/a FM 20 - 30 893.92 894.19MW-12A 02/20/08 2-IN. 30 30 NE PVC n/a FM 20 - 30 891.16 891.29MW-13A 03/27/08 2-IN. 24 24 NE PVC n/a FM 14 - 24 880.99 881.25MW-14A 02/20/08 2-IN. 35 35 NE PVC n/a FM 25 - 35 899.66 899.94MW-15A 09/12/08 2-IN. 37.7 37.7 NE PVC n/a FM 27- 37 887.96 888.20MW-16A 09/12/08 2-IN. 32.5 32.5 NE PVC n/a FM 22 - 32 879.36 880.00MW-17A 03/30/11 2-IN. 30 30 NE PVC n/a FM 20 - 30 NS NSMW-18A Proposed 2-IN. TBD TBD TBD PVC n/a TBD TBD NS NSMW-19A Proposed 2-IN. TBD TBD TBD PVC n/a TBD TBD NS NSMW-20A Proposed 2-IN. TBD TBD TBD PVC n/a TBD TBD NS NS
MW-2B 04/26/06 2-IN. 60 60 60 PVC n/a FM 50-60 896.51 896.83MW-3B 05/03/06 2-IN. 55 55 55 PVC n/a FM 45-55 892.39 892.52MW-4B 04/28/06 2-IN. 60 60 60 PVC n/a FM 50-60 884.55 884.82MW-5B 05/01/06 2-IN. 46 46 46 PVC n/a FM 36-46 883.35 883.63MW-6B 05/02/06 2-IN. 67 67 67 PVC n/a FM 57-67 881.42 881.67MW-7B 07/27/06 2-IN. 33 33 33 PVC n/a FM 23-33 896.96 897.11MW-8B 07/26/06 2-IN. 57 57 57 PVC n/a FM 47-57 895.04 895.19MW-9B 07/25/06 2-IN. 62 62 62 PVC n/a FM 52-62 892.02 892.05
MW-10B 02/19/08 2-IN. 50 50 N/A PVC n/a FM 40 - 50 896.73 896.97MW-11B 02/20/08 2-IN. 56 56 57 PVC n/a FM 46 - 56 893.84 894.15MW-13B 03/27/08 2-IN. 72 72 72 PVC n/a FM 62 -72 881.00 881.20MW-15B 09/12/08 2-IN. 43 44 49 PVC n/a FM 34 - 44 888.07 888.30MW-16B 09/12/08 2-IN. 41 PVC n/a FM 31 - 41 879.50 880.00MW-18B Proposed 2-IN. TBD TBD TBD PVC n/a TBD TBD NS NSMW-19B Proposed 2-IN. TBD TBD TBD PVC n/a TBD TBD NS NSMW-20B Proposed 2-IN. TBD TBD TBD PVC n/a TBD TBD NS NS
Shallow Residuum
Deep Residuum

Table 2-3 - Summary of Monitoring Well Construction DetailsTara Shopping Center
Jonesboro, GeorgiaHSI 10798
VRP Application Page 2 of 2
Well Identification Date Installed
Well Casing
Diameter (in.)
Total Depth of Well (ft.
bgs)
Total Depth of Boring (ft. bgs)
Depth of Bedrock (ft.
bgs)Construction
Material
6-inch dia. Steel Casing
Depth (ft)Well
Completion
Screen Interval(ft. bgs)
Top of Casing Elevation
(ft. above MSL)
Ground Surface Elevation
(ft. above MSL)
MW-1C 04/09/08 2-IN. 98 99 64 PVC 69 FM 83 - 98 898.94 899.19MW-2C 04/10/08 2-IN. 91 101 67 S.S. 71 FM 76 -91 896.72 896.69MW-5C 04/10/08 2-IN. 90 94 59 PVC 64 FM 75 - 90 883.52 883.76MW-7C 04/10/08 2-IN. 62 68 33 PVC 38 FM 52 - 62 896.95 897.18MW-8C 04/11/08 2-IN. 85 93 58 PVC 63 FM 70 - 85 895.04 895.32MW-9C 04/11/08 2-IN. 100 111 76 PVC 81 FM 85 - 100 891.83 892.01MW-10C 04/11/08 2-IN. 90 99 64 PVC 69 FM 75 - 90 896.82 897.01MW-11C 04/10/08 2-IN. 88 92 57 PVC 62 FM 73 -88 894.07 894.32MW-13C 10/16/08 2-IN. 89 105 71 PVC 75 FM 78 - 89 881.00 881.20MW-15C Proposed 2-IN. TBD TBD TBD PVC TBD TBD TBD NS NSMW-16C 10/16/08 2-IN. 68 74.5 41 PVC 44.6 FM 58 - 68 878.82 879.00MW-18C Proposed 2-IN. TBD TBD TBD PVC TBD TBD TBD NS NSMW-19C Proposed 2-IN. TBD TBD TBD PVC TBD TBD TBD NS NSMW-20C Proposed 2-IN. TBD TBD TBD PVC TBD TBD TBD NS NS
Notes:Depth to bedrock in Deep Residuum - auger refusalft. bgs = feet below ground surfaceMSL = Mean Sea LevelFM = Flush MountNI = Not installedNM = Not measuredNE = Not encounteredTBD = To Be Determined. Information based in field conditions during installation. Depth to bedrock varies across the investigation area.NS = Not Surveyed. Proposed well location will be surveyed during next phase of investigation.
Bedrock

Table 2-4Summary Historical Groundwater Analytical Results, 2006 through 2011
Tara Shopping CenterJonesboro, Georgia
VRP Application1 of 5
Well ID Sample DateTetrachloroethene
(PCE)Trichloroethene
(TCE)
cis-1,2-Dichloroethene (cis-1, 2 DCE) Vinyl Chloride Chloroform Total VOCs
ug/L ug/L ug/L ug/L ug/L ug/LType 3 RRS (*Type 4 RRS) 5 5 1,022* 2 80TMW-1* 9-Jun-06 48,000 2,400 3,400 2.3 NA NAMW-1A 11-May-06 4.3 <1.0 <1.0 <1.0 <1.0 4.3MW-1A 20-Oct-08 DRY DRY DRY DRY DRY -MW-1A 20-Aug-09 DRY DRY DRY DRY DRY -MW-1A 16-May-11 DRY DRY DRY DRY DRY -MW-1C(73-83) 8-Apr-08 <1.0 <1.0 <1.0 <1.0 <1.0 0MW-1C (86-B) 8-Apr-08 <1.0 <1.0 <1.0 <1.0 <1.0 0MW-1C 21-Oct-08 <1.0 <1.0 <1.0 NA <1.0 0MW-1C 24-Aug-09 <1.0 <1.0 <1.0 <10 <1.0 0MW-1C 18-May-11 <1.0 <1.0 <1.0 <1.0 <1.0 0MW-2A 11-May-06 51,000 2,800 2,500 <50 <50.0 56,300MW-2A 20-Oct-08 DRY DRY DRY DRY DRY 0MW-2A 20-Aug-09 DRY DRY DRY DRY DRY 0MW-2A 25-Feb-10 110,000 5,100 5,900 <50 <2,000 121,000MW-2A 23-Mar-10 98,000 4,600 5,300 <1000 <1,000 107,900MW-2A 27-Apr-10 89,000 5,000 5,000 <1000 <1000 99,000MW-2A 25-May-10 100,000 5,800 5,600 <1000 <1000 111,400MW-2A 27-Aug-10 DRY DRY DRY DRY DRY 0MW-2A 31-Mar-11 DRY DRY DRY DRY DRY 0MW-2A 18-May-11 DRY DRY DRY DRY DRY 0MW-2B 5-Mar-08 4,800 300 220 <50 <50.0 5,320MW-2B 22-Oct-08 4,500 170 150 <50 <50.0 4,820MW-2B 24-Aug-09 3,200 120 78 <20 < 20 3,398MW-2B 16-Oct-09 3,400 97 76 <50 < 50 3,573MW-2B 13-Nov-09 2,000 60 26 <20 < 20 2,086MW-2B 17-Dec-09 830 30 13 <10 < 50 873MW-2B 29-Jan-10 1,400 91 35 <20 < 50 1,526MW-2B 25-Feb-10 500 24 8.7 <1.0 <10 533MW-2B 23-Mar-10 350 9 4.8 <2.0 <1.0 364MW-2B 27-Apr-10 390 39 17 <4.0 <4.0 446MW-2B 25-May-10 280 14 9.3 <4.0 <4.0 303MW-2B 27-Aug-10 1,500 65 73 <10 <4.0 1,638MW-2B 31-Mar-11 230 18 20 <2.0 <2.0 268MW-2B 23-May-11 88 11 26 <1.0 <1.0 125MW-2C (70-80) 8-Apr-08 190 16 16 <1.0 3.6 226MW-2C (84-B) 8-Apr-08 320 32 38 <2.0 8.4 398MW-2C 22-Oct-08 160 23 27 <1.0 2.3 212MW-2C 24-Aug-09 55 8.1 2.1 <1.0 < 1.0 65MW-2C 16-Oct-09 140 15 13 <1.0 2.0 170MW-2C 13-Nov-09 160 19 13 <1.0 2.3 194MW-2C 17-Dec-09 78 9.8 7.6 <1.0 1.4 97MW-2C 29-Jan-10 110 13 11 <1.0 1.7 136MW-2C 25-Feb-10 29 3.1 2.8 <1.0 <1.0 35MW-2C 23-Mar-10 51 5.8 4.9 <1.0 <1.0 62MW-2C 27-Apr-10 51 6.2 4.8 <1.0 <1.0 62MW-2C 25-May-10 9 <1.0 <1.0 <1.0 <1.0 9MW-2C 27-Aug-10 21 2.1 <1.0 <1.0 1.6 25MW-2C 31-Mar-11 6.2 <2.0 <2.0 <2.0 <2.0 6MW-2C 23-May-11 3.2 <1.0 <1.0 <1.0 <1.0 3MW-3A 9-May-06 14 <1.0 <1.0 <1.0 <1.0 14MW-3A 5-Mar-08 20 <1.0 <1.0 <1.0 <1.0 20MW-3A 20-Oct-08 64 <1.0 <1.0 <1.0 <1.0 64MW-3A 20-Aug-09 38 <1.0 <1.0 <1.0 <1.0 38MW-3A 17-May-11 42 <1.0 <1.0 <1.0 <1.0 42MW-3B 10-May-06 <1.0 <1.0 <1.0 <1.0 <1.0 0MW-3B 5-Mar-08 <1.0 <1.0 <1.0 <1.0 <1.0 0MW-3B 20-Oct-08 <1.0 <1.0 <1.0 <1.0 <1.0 0MW-3B 20-Aug-09 <1.0 <1.0 <1.0 <1.0 <1.0 0MW-3B 17-May-11 <1.0 <1.0 <1.0 <1.0 <1.0 0MW-4A 10-May-06 4.7 <1.0 <1.0 <1.0 <1.0 5MW-4A 5-Mar-08 5.9 <1.0 <1.0 <1.0 <1.0 6MW-4A 22-Oct-08 33 <1.0 <1.0 <1.0 <1.0 33MW-4A 24-Aug-09 3.6 <1.0 <1.0 <1.0 <1.0 4

Table 2-4Summary Historical Groundwater Analytical Results, 2006 through 2011
Tara Shopping CenterJonesboro, Georgia
VRP Application2 of 5
Well ID Sample DateTetrachloroethene
(PCE)Trichloroethene
(TCE)
cis-1,2-Dichloroethene (cis-1, 2 DCE) Vinyl Chloride Chloroform Total VOCs
ug/L ug/L ug/L ug/L ug/L ug/LType 3 RRS (*Type 4 RRS) 5 5 1,022* 2 80MW-4A 23-May-11 8.6 <1.0 <1.0 <1.0 <1.0 9MW-4B 10-May-06 <1.0 <1.0 <1.0 <1.0 <1.0 0MW-4B 5-Mar-08 <1.0 <1.0 <1.0 <1.0 <1.0 0MW-4B 22-Oct-08 <1.0 <1.0 <1.0 <1.0 <1.0 0MW-4B 24-Aug-09 <1.0 <1.0 <1.0 <1.0 <1.0 0MW-4B 23-May-11 1.2 <1.0 <1.0 <1.0 <1.0 1MW-5A 10-May-06 3.9 1.8 4.0 <1.0 <1.0 10MW-5A 5-Mar-08 59 41 110 4.7 <1.0 215MW-5A 21-Oct-08 30 19 63 NA <1.0 112MW-5A 24-Aug-09 6.5 6.5 14 <4.0 <1.0 27MW-5A 23-May-11 4.3 5.0 15 <1.0 <1.0 24MW-5B 9-May-06 4,300 1,900 3,800 <50 <5.0 10,000MW-5B 5-Mar-08 540 420 1,100 <10 <10 2,060MW-5B 21-Oct-08 130 99 300 NA <5.0 529MW-5B 21-Oct-08 350 290 740 <5.0 5.8 1,386MW-5B 23-May-11 450 370 1,600 <20 <20 2,420MW-5C (63-73) 10-Apr-08 140 5.5 5.2 <1.0 <1.0 151MW-5C (82-B) 10-Apr-08 120 5.1 5.1 <2.0 <1.0 130MW-5C 21-Oct-08 11 1.1 72 NA <1.0 84MW-5C 24-Aug-09 15 1.6 12 <1.0 <1.0 29MW-5C 23-May-11 4.1 1.4 28 <1.0 <1.0 34MW-6A 9-May-06 <1.0 <1.0 <1.0 <1.0 <1.0 0MW-6A 5-Mar-08 <1.0 <1.0 <1.0 <1.0 <1.0 0MW-6A 20-Oct-08 <1.0 <1.0 <1.0 <1.0 <1.0 0MW-6A 21-Aug-09 <1.0 <1.0 <1.0 <1.0 <1.0 0MW-6A 16-May-11 NM NM NM NM NM 0MW-6B 9-May-06 <1.0 <1.0 <1.0 <1.0 <1.0 0MW-6B 5-Mar-08 <1.0 <1.0 <1.0 <1.0 <1.0 0MW-6B 20-Oct-08 <1.0 <1.0 <1.0 <1.0 <1.0 0MW-6B 21-Aug-09 <1.0 <1.0 <1.0 <1.0 <1.0 0MW-6B 16-May-11 NM NM NM NM NM 0MW-7B 2-Aug-06 3.5 <1.0 <1.0 <1.0 <1.0 4MW-7B 5-Mar-08 2.4 <1.0 <1.0 <1.0 <1.0 2MW-7B 20-Oct-08 3.1 <1.0 <1.0 <1.0 <1.0 3MW-7B 20-Aug-09 2.3 <1.0 <1.0 <1.0 <1.0 2MW-7B 16-May-11 8.5 <1.0 <1.0 <1.0 <1.0 9MW-7C (54-B) 9-Apr-08 1.7 <1.0 <1.0 <1.0 <1.0 2MW-7C 20-Oct-08 <1.0 <1.0 <1.0 <1.0 <1.0 0MW-7C 20-Aug-09 <1.0 <1.0 <1.0 <1.0 <1.0 0MW-7C 19-May-11 <1.0 <1.0 <1.0 <1.0 <1.0 0MW-8A 2-Aug-06 550 58 25 <5.0 <1.0 633MW-8A 5-Mar-08 710 91 35 <5.0 <5.0 836MW-8A 27-Oct-08 490 56 25 <4.0 <5.0 571MW-8A 20-Aug-09 760 83 30 <4.0 4.2 877MW-8A 16-Oct-09 750 64 26 <5.0 <5.0 840MW-8A 12-Nov-09 850 69 24 <5.0 <5.0 943MW-8A 17-Dec-09 910 60 27 <5.0 <5.0 997MW-8A 29-Jan-10 84 6.4 3.1 <1.0 <1.0 94MW-8A 25-Feb-10 930 53 24 <1.0 1.2 1,008MW-8A 23-Mar-10 840 31 8.9 <1.0 1.3 881MW-8A 27-Apr-10 760 <10.0 <10.0 <10 <10.0 760MW-8A 25-May-10 600 <10.0 <10.0 <10 <10.0 600MW-8A 26-Aug-10 DRY DRY DRY DRY DRY 0MW-8A 31-Mar-11 DRY DRY DRY DRY DRY 0MW-8A 18-May-11 630 17 <10 <10 <10 647MW-8B 2-Aug-06 86 7.7 3.6 <1.0 <1.0 97MW-8B 5-Mar-08 140 10 5.4 <1.0 <1.0 155MW-8B 16-Oct-08 75 4.4 2.7 <1.0 <1.0 82MW-8B 19-Aug-09 98 5.9 2.7 <1.0 <1.0 107MW-8B 16-Oct-09 150 7.0 3.7 <1.0 <1.0 161MW-8B 12-Nov-09 190 9.2 3.3 <2.0 <2.0 203MW-8B 17-Dec-09 220 11 4.8 <2.0 <2.0 236MW-8B 29-Jan-10 180 8.8 4.3 <2.0 <2.0 193

Table 2-4Summary Historical Groundwater Analytical Results, 2006 through 2011
Tara Shopping CenterJonesboro, Georgia
VRP Application3 of 5
Well ID Sample DateTetrachloroethene
(PCE)Trichloroethene
(TCE)
cis-1,2-Dichloroethene (cis-1, 2 DCE) Vinyl Chloride Chloroform Total VOCs
ug/L ug/L ug/L ug/L ug/L ug/LType 3 RRS (*Type 4 RRS) 5 5 1,022* 2 80MW-8B 25-Feb-10 290 13 4.5 <2.0 <2.0 308MW-8B 23-Mar-10 260 12 4.4 <2.0 <2.0 276MW-8B 27-Apr-10 200 8.2 3.2 <2.0 <2.0 211MW-8B 25-May-10 180 5 2.0 <2.0 <2.0 187MW-8B 26-Aug-10 240 13 5.3 <2.0 <2.0 258MW-8B 31-Mar-11 220 <2.0 <2.0 <2.0 <2.0 220MW-8B 18-May-11 170 <2.0 <2.0 <2.0 <2.0 170MW-8C (62-72) 11-Apr-08 <1.0 1.9 <1.0 <1.0 99.0 101MW-8C (76-B) 11-Apr-08 <2.0 <2.0 <2.0 <1.0 58.0 58MW-8C 16-Oct-08 <1.0 <1.0 <1.0 <1.0 50.0 50MW-8C 19-Aug-09 <1.0 <1.0 <1.0 <1.0 7.1 7MW-8C 16-Oct-09 <1.0 <1.0 <1.0 <1.0 6.9 7MW-8C 12-Nov-09 <1.0 <1.0 <1.0 <1.0 7.1 7MW-8C 17-Dec-09 <1.0 <1.0 <1.0 <1.0 9.6 10MW-8C 29-Jan-10 <1.0 <1.0 <1.0 <1.0 9.7 10MW-8C 25-Feb-10 <1.0 <1.0 <1.0 <1.0 5.3 5MW-8C 23-Mar-10 <1.0 <1.0 <1.0 <1.0 3.7 4MW-8C 27-Apr-10 <1.0 <1.0 <1.0 <1.0 3.5 4MW-8C 25-May-10 <1.0 <1.0 <1.0 <1.0 4.2 4MW-8C 26-Aug-10 <1.0 <1.0 <1.0 <1.0 1.9 2MW-8C 31-Mar-11 <2.0 <2.0 <2.0 <2.0 1.0 1MW-8C 18-May-11 <1.0 <1.0 <1.0 <1.0 <1.0 0MW-9A 2-Aug-06 1,000 15 <10 <10 <1.0 1,015MW-9A 5-Mar-08 110 3.8 <1.0 <1.0 <1.0 114MW-9A 20-Oct-08 75 3.5 <1.0 <1.0 <1.0 79MW-9A 20-Aug-09 240 25 3.1 <1.0 <1.0 268MW-9A 18-May-11 790 48 <10 <10 <10 838MW-9B 2-Aug-06 4.7 1.0 <1.0 <1.0 <1.0 6MW-9B 5-Mar-08 <1.0 <1.0 <1.0 <1.0 <1.0 0MW-9B 20-Oct-08 <1.0 <1.0 <1.0 <1.0 <1.0 0MW-9B 20-Aug-09 <1.0 <1.0 <1.0 <1.0 <1.0 0MW-9B 18-May-11 <1.0 <1.0 <1.0 <1.0 <1.0 0MW-9C (79-89) 11-Apr-08 <1.0 <1.0 <1.0 <1.0 28 28MW-9C 20-Oct-08 <1.0 <1.0 <1.0 <1.0 42 42MW-9C 20-Aug-09 <1.0 <1.0 <1.0 <1.0 2.5 3MW-9C 18-May-11 <1.0 <1.0 <1.0 <1.0 4.9 5MW-10A 5-Mar-08 670 110 46 <5.0 12 838MW-10A 22-Oct-08 1,700 250 83 <20 37 2,070MW-10A 21-Aug-09 770 94 49 <5.0 21 934MW-10A 16-Oct-09 800 85 35 <5.0 18 938MW-10A 13-Nov-09 570 64 25 <5.0 14 673MW-10A 17-Dec-09 650 75 34 <5.0 14 773MW-10A 28-Jan-10 180 12 6.1 <2.0 7.8 206MW-10A 25-Feb-10 260 18 8.5 <2.0 6.1 293MW-10A 23-Mar-10 290 23 10 <2.0 5.9 329MW-10A 27-Apr-10 360 29 14 <2.0 8.3 411MW-10A 25-May-10 360 29 13 <2.0 9.4 411MW-10A 27-Aug-10 770 83 31 <5.0 16 900MW-10A 31-Mar-11 590 79 32 <5.0 12 713MW-10A 16-May-11 380 64 42 <5.0 9.2 495MW-10B 5-Mar-08 2.6 <1.0 <1.0 <1.0 <1.0 3MW-10B 22-Oct-08 3.4 <1.0 <1.0 <1.0 <1.0 3MW-10B 21-Aug-09 <1.0 <1.0 <1.0 <1.0 <1.0 0MW-10B 16-Oct-09 2.0 <1.0 <1.0 <1.0 <1.0 2MW-10B 13-Nov-09 1.0 <1.0 <1.0 <1.0 <1.0 1MW-10B 17-Dec-09 1.2 <1.0 <1.0 <1.0 <1.0 1MW-10B 28-Jan-10 <1.0 <1.0 <1.0 <1.0 <1.0 0MW-10B 25-Feb-10 <1.0 <1.0 <1.0 <1.0 <1.0 0MW-10B 23-Mar-10 <1.0 <1.0 <1.0 <1.0 <1.0 0MW-10B 27-Apr-10 <1.0 <1.0 <1.0 <1.0 <1.0 0MW-10B 25-May-10 <1.0 <1.0 <1.0 <1.0 <1.0 0MW-10B 27-Aug-10 <1.0 <1.0 <1.0 <1.0 <1.0 0MW-10B 31-Mar-11 3.3 <1.0 <1.0 <1.0 <1.0 3

Table 2-4Summary Historical Groundwater Analytical Results, 2006 through 2011
Tara Shopping CenterJonesboro, Georgia
VRP Application4 of 5
Well ID Sample DateTetrachloroethene
(PCE)Trichloroethene
(TCE)
cis-1,2-Dichloroethene (cis-1, 2 DCE) Vinyl Chloride Chloroform Total VOCs
ug/L ug/L ug/L ug/L ug/L ug/LType 3 RRS (*Type 4 RRS) 5 5 1,022* 2 80MW-10B 18-May-11 1.2 <1.0 <1.0 <1.0 <1.0 1MW-10C (76-86) 11-Apr-08 <1.0 <1.0 <1.0 <1.0 73.0 73MW-10C (90-B) 11-Apr-08 <1.0 <1.0 <1.0 <1.0 78.0 78MW-10C 22-Oct-08 <1.0 <1.0 <1.0 <1.0 34.0 34MW-10C 21-Aug-09 <1.0 <1.0 <1.0 <1.0 16.0 16MW-10C 16-Oct-09 <1.0 <1.0 <1.0 <1.0 9.6 10MW-10C 13-Nov-09 <1.0 <1.0 <1.0 <1.0 1.2 1MW-10C 17-Dec-09 <1.0 <1.0 <1.0 <1.0 <1.0 0MW-10C 28-Jan-10 <1.0 <1.0 <1.0 <1.0 <1.0 0MW-10C 25-Feb-10 <1.0 <1.0 <1.0 <1.0 <1.0 0MW-10C 23-Mar-10 <1.0 <1.0 <1.0 <1.0 <1.0 0MW-10C 27-Apr-10 2.7 <1.0 <1.0 <1.0 <1.0 3MW-10C 25-May-10 <1.0 <1.0 <1.0 <1.0 <1.0 0MW-10C 27-Aug-10 <1.0 <1.0 <1.0 <1.0 <1.0 0MW-10C 31-Mar-11 <1.0 <1.0 <1.0 <1.0 <1.0 0MW-10C 19-May-11 1.1 <1.0 <1.0 <1.0 <1.0 1MW-11A 5-Mar-08 5,100 100 80 <50 <50.0 5,280MW-11A 17-Oct-08 2,600 67 53 <50 <50 2,720MW-11A 20-Aug-09 4,700 100 71 <50 <50 4,871MW-11A 5-Oct-09 6,500 82 89 <50 <50 6,671MW-11A 13-Nov-09 6,000 110 65 <50 <50 6,175MW-11A 17-Dec-09 5,400 89 69 <50 <50 5,558MW-11A 29-Jan-10 2,700 61 <50 <50 <50 2,761MW-11A 25-Feb-10 3,300 62 39 <20 <20 3,401MW-11A 23-Mar-10 3,000 53 51 <50 <50 3,104MW-11A 27-Apr-10 2,700 65 <50 <50 <50 2,765MW-11A 25-May-10 2,900 61 <50 <50 <50 2,961MW-11A 27-Aug-10 3,800 72 69 <50 <50 3,941MW-11A 31-Mar-11 3,300 74 54 <50 <50 3,428MW-11A 16-May-11 DRY DRY DRY DRY DRY 0MW-11B 5-Mar-08 3.2 <1.0 <1.0 <1.0 <1.0 3MW-11B 16-Oct-08 <1.0 <1.0 <1.0 <1.0 <1.0 0MW-11B 20-Aug-09 <1.0 <1.0 <1.0 <1.0 <1.0 0MW-11B 5-Oct-09 <1.0 <1.0 <1.0 <1.0 <1.0 0MW-11B 13-Nov-09 <1.0 <1.0 <1.0 <1.0 <1.0 0MW-11B 17-Dec-09 <1.0 <1.0 <1.0 <1.0 <1.0 0MW-11B 29-Jan-10 <1.0 <1.0 <1.0 <1.0 <1.0 0MW-11B 25-Feb-10 <1.0 <1.0 <1.0 <1.0 <1.0 0MW-11B 23-Mar-10 <1.0 <1.0 <1.0 <1.0 <1.0 0MW-11B 27-Apr-10 <200 <200 <200 <200 <200 0MW-11B 25-May-10 <200 <200 <200 <200 <200 0MW-11B 27-Aug-10 <200 <200 <200 <200 <200 0MW-11B 31-Mar-11 140 <50 <50 <50 <50 140MW-11B 19-May-11 NS NS NS NS NS 0MW-11C (62-72) 7-Apr-08 1.1 <1.0 <1.0 <1.0 1.2 2MW-11C (76 - B) 7-Apr-08 <1.0 <1.0 <1.0 <1.0 <1.0 0MW-11C 16-Oct-08 <1.0 <1.0 <1.0 <1.0 <1.0 0MW-11C 20-Aug-09 <1.0 <1.0 <1.0 <1.0 <1.0 0MW-11C 5-Oct-09 <1.0 <1.0 <1.0 <1.0 <1.0 0MW-11C 13-Nov-09 <50 <50 <50 <50 <50 0MW-11C 17-Dec-09 <1.0 <1.0 <1.0 <1.0 <1.0 0MW-11C 29-Jan-10 <1.0 <1.0 <1.0 <1.0 <1.0 0MW-11C 25-Feb-10 <1.0 <1.0 <1.0 <1.0 <1.0 0MW-11C 23-Mar-10 <1.0 <1.0 <1.0 <1.0 <1.0 0MW-11C 27-Apr-10 <1.0 <1.0 <1.0 <1.0 <1.0 0MW-11C 25-May-10 1.1 <1.0 <1.0 <1.0 <1.0 1MW-11C 27-Aug-10 1.6 <1.0 <1.0 <1.0 <1.0 2MW-11C 31-Mar-11 <1.0 <1.0 <1.0 <1.0 <1.0 0MW-11C 17-May-11 <1.0 <1.0 <1.0 <1.0 <1.0 0MW-12A 5-Mar-08 12 <1.0 <1.0 <1.0 <1.0 12MW-12A 20-Oct-08 23 <1.0 1.0 <1.0 <1.0 24MW-12A 20-Aug-09 22 <1.0 <1.0 <1.0 <1.0 22MW-12A 17-May-11 18 <1.0 <1.0 <1.0 <1.0 18
Table 2-4Summary Historical Groundwater Analytical Results, 2006 through 2011
Tara Shopping CenterJonesboro, Georgia
VRP Application5 of 5
Well ID Sample DateTetrachloroethene
(PCE)Trichloroethene
(TCE)
cis-1,2-Dichloroethene (cis-1, 2 DCE) Vinyl Chloride Chloroform Total VOCs
ug/L ug/L ug/L ug/L ug/L ug/LType 3 RRS (*Type 4 RRS) 5 5 1,022* 2 80MW-13A 5-Mar-08 1,400 640 1,300 31 <20 3,371MW-13A 21-Oct-08 1,100 500 1,300 NA <10 2,900MW-13A 21-Oct-08 1,200 840 2,300 NA < 20 4,340MW-13A 24-Aug-09 1,200 840 2,300 79 <20 4,419MW-13A 23-May-11 1,200 800 2,300 71 <25 4,371MW-13B 5-Mar-08 17 2.2 9.1 <1.0 <1.0 28MW-13B 21-Oct-08 4.1 <1.0 3.1 NA <1.0 7MW-13B 24-Aug-09 14 5.4 12 <1.0 <1.0 31MW-13B 23-May-11 20 5.5 21 <1.0 <1.0 47MW-13C 15-Oct-08 93 7.3 28 <1.0 1.9 130MW-13C 20-Oct-08 19 1.1 5.3 NA <1.0 25MW-13C 24-Aug-09 21 3.7 24 <1.0 <1.0 49MW-13C 23-May-11 39 8.1 62 <1.0 <1.0 109MW-14A 5-Mar-08 2.2 <1.0 <1.0 <1.0 <1.0 2MW-14A 21-Oct-08 4.6 <1.0 <1.0 NA <1.0 5MW-14A 21-Aug-09 3.5 <1.0 <1.0 <1.0 <1.0 4MW-14A 19-May-11 5.9 <1.0 <1.0 <1.0 <1.0 6MW-15A 17-Oct-08 750 31 <10 <10 <10 781MW-15A 21-Aug-09 1,300 55 10 <10 <10 1,365MW-15A 20-May-11 350 <100 <100 <100 <100 350MW-15B 17-Oct-08 150 2.1 <2.0 <2.0 <2.0 152MW-15B 21-Aug-09 130 2.3 <2.0 <2.0 <2.0 132MW-15B 20-May-11 98 4.5 1.1 <1.0 <1.0 104MW-16A 17-Oct-08 620 87 98 <10 <10 805MW-16A 21-Aug-09 1,000 220 200 <10 <10 1,420MW-16A 23-May-11 930 110 200 <10 <10 1,240MW-16B 16-Oct-08 510 35 49 <1.0 <1.0 594MW-16B 21-Aug-09 760 84 96 <5.0 <5.0 940MW-16B 23-May-11 1,200 100 210 <10 <10 1,510MW-16C (41 - 56) 14-Oct-08 830 63 71 <1.0 <10.0 964MW-16C (56 - 74) 14-Oct-08 820 64 63 <1.0 <10.0 947MW-16C 16-Oct-08 640 49 65 <1.0 <10 754MW-16C 21-Aug-09 540 55 37 <5.0 <5 632MW-16C 20-May-11 780 61 62 <5.0 <5.0 903MW-17A 31-Mar-11 950 <10 <10 <10 <10 <10MW-17A 19-May-11 350 <2.0 <2.0 <2.0 2.1 352Note:NR - Not RecordedNM - Not MeasuredTotal VOCs - total volatile organic compoundsDO - dissolved oxygenORP - oxidation reduction potentialShading - Concentrations exceeds Type 3 Risk Reduction Standard (RRS).< Value - Concentration was not detected above the method detection limit.*Trans-1,2-dichloroethane: TMW-1 (2,300 ug/l). 1,2-dichloroethene: TMW-1 (5.5 ug/l).

Table 2-5Summary of Historical Groundwater Geochemical Results, October 2008 through May 2011
Tara Shopping CenterJonesboro, Georgia
VRP Application Page 1 of 4
Well ID Sample Date pH
Dissolved Oxygen (mg/L)
Conductivity (ms/cm)
Temperature (Celsius)
ORP (mV)
Turbidity (NTU)
Observations (i.e., color)
MW-2A 24-Aug-09 DRYMW-2A 17-Dec-09 DRYMW-2A 28-Jan-10 DRYMW-2A 25-Feb-10 5.38 2.32 0.116 20.59 292 530 -MW-2A 23-Mar-10 5.18 1.67 0.077 21.94 510 660 -MW-2A 27-Apr-10 4.99 2.40 0.066 21.00 477 421 -MW-2A 25-May-10 4.85 1.40 0.050 23.77 438 >1000 -MW-2A 27-Aug-10 DRYMW-2A 31-Mar-11 DRYMW-2A 16-May-11MW-2B 22-Oct-08 5.06 2.43 0.142 20.80 164 89.5 -MW-2B 24-Aug-09 7.49 3.06 0.115 22.57 150 21.3 -MW-2B 16-Oct-09 NA NA NA NA NA NA -MW-2B 13-Nov-09 NA NA NA NA NA NA -MW-2B 17-Dec-09 6.20 7.07 0.156 17.32 333 390 -MW-2B 28-Jan-10 7.25 6.19 0.166 16.31 204 >1000 -MW-2B 25-Feb-10 7.11 2.66 0.132 19.04 207 828 -MW-2B 23-Mar-10 6.27 1.70 0.198 21.66 449 77.8 -MW-2B 27-Apr-10 6.95 3.70 0.173 20.00 350 116 -MW-2B 25-May-10 6.15 1.53 0.152 22.62 263 263 -MW-2B 27-Aug-10 6.19 8.09 0.121 24.20 479 146 -MW-2B 31-Mar-11 5.27 1.86 0.143 19.35 549 NA -MW-2B 16-May-11 5.56 0.77 0.109 21.85 243 NA -MW-2C 22-Oct-08 9.16 2.22 0.777 20.40 -62* 162 -MW-2C 24-Aug-09 13.37 4.72 1.140 23.89 -135* 13.8 -MW-2C 16-Oct-09 NA NA NA NA NA NA -MW-2C 13-Nov-09 NA NA NA NA NA NA -MW-2C 17-Dec-09 5.76 6.11 0.817 17.25 260 245 -MW-2C 28-Jan-10 7.93 3.02 0.900 16.23 128 330 -MW-2C 25-Feb-10 8.91 2.63 0.782 18.10 151 554 -MW-2C 23-Mar-10 8.61 1.36 0.898 22.03 224 645 -MW-2C 27-Apr-10 8.46 2.20 0.875 20.00 253 219 -MW-2C 25-May-10 7.96 2.55 0.552 24.41 217 274 -MW-2C 27-Aug-10 8.59 1.06 0.654 25.60 209 76.1 -MW-2C 31-Mar-11 8.34 0.52 0.425 19.36 260 NA -MW-2C 16-May-11 8.35 0.66 0.388 22.42 126 7.99 -MW-8A 27-Oct-08 4.94 1.79 0.065 20.90 251 18 -MW-8A 19-Aug-09 5.35 0.31 0.075 24.08 77 39.7 -MW-8A 16-Oct-09 NA NA NA NA NA NA -MW-8A 12-Nov-09 NA NA NA NA NA NA -MW-8A 17-Dec-09 6.28 5.50 0.090 19.33 98 276 -MW-8A 28-Jan-10 5.78 3.79 0.079 18.62 173 177 -MW-8A 25-Feb-10 6.30 2.02 0.088 21.02 249 490 -MW-8A 23-Mar-10 5.81 1.47 0.075 22.09 470 222 -
DRY

Table 2-5Summary of Historical Groundwater Geochemical Results, October 2008 through May 2011
Tara Shopping CenterJonesboro, Georgia
VRP Application Page 2 of 4
Well ID Sample Date pH
Dissolved Oxygen (mg/L)
Conductivity (ms/cm)
Temperature (Celsius)
ORP (mV)
Turbidity (NTU)
Observations (i.e., color)
MW-8A 27-Apr-10 6.31 2.37 0.100 20.00 453 73 -MW-8A 25-May-10 5.79 1.10 0.079 22.96 531 648 -MW-8A 25-May-10 DRYMW-8A 31-Mar-11 DRYMW-8A 18-May-11 DRYMW-8B 16-Oct-08 5.30 5.17 0.390 24.20 274 238 -MW-8B 19-Aug-09 5.63 3.25 0.115 27.75 261 14.6 -MW-8B 16-Oct-09 NA NA NA NA NA NA -MW-8B 12-Nov-09 NA NA NA NA NA NA -MW-8B 17-Dec-09 7.08 7.57 0.149 18.52 245 678 -MW-8B 29-Jan-10 7.20 6.12 0.129 18.08 231 202 -MW-8B 25-Feb-10 6.06 4.89 0.111 19.90 502 155 -MW-8B 23-Mar-10 6.56 3.69 0.132 21.83 510 130 -MW-8B 27-Apr-10 5.51 5.53 0.119 23.00 585 90 -MW-8B 25-May-10 5.41 3.50 0.113 25.87 624 154 -MW-8B 26-Aug-10 5.47 4.15 0.135 23.00 191 39 -MW-8B 31-Mar-11 4.73 4.74 0.127 21.54 792 11 -MW-8B 18-May-11 5.46 4.73 0.110 20.90 63 131 -MW-8C 16-Oct-08 10.33 2.80 0.654 25.40 -208* 105 -MW-8C 19-Aug-09 11.12 0.36 0.928 27.55 -128* 6.6 -MW-8C 16-Oct-09 NA NA NA NA NA NA -MW-8C 12-Nov-09 NA NA NA NA NA NA -MW-8C 17-Dec-09 9.06 5.00 0.777 17.66 48 730 -MW-8C 28-Jan-10 9.08 4.80 0.620 17.30 107 >1000 -MW-8C 25-Feb-10 9.77 3.66 0.543 19.26 80 833 -MW-8C 23-Mar-10 9.42 9.58 0.516 21.50 241 263 -MW-8C 27-Apr-10 6.17 3.54 0.475 20.00 264 181 -MW-8C 25-May-10 9.03 1.86 0.432 23.66 261 504 -MW-8C 26-Aug-10 9.35 2.82 0.426 26.00 -58* 83.8 -MW-8C 31-Mar-11 8.68 5.20 0.247 23.92 303 27.9 -MW-8C 18-May-11 6.59 2.87 0.196 20.50 525 7.6 -MW-10A 22-Oct-08 4.53 4.40 0.081 25.10 374 115 -MW-10A 21-Aug-09 6.47 4.32 0.067 22.57 270 337 -MW-10A 16-Oct-09 NA NA NA NA NA NA -MW-10A 13-Nov-09 NA NA NA NA NA NA -MW-10A 17-Dec-09 5.08 7.18 0.076 19.17 407 870 -MW-10A 28-Jan-10 5.48 7.81 0.078 20.50 258 900 -MW-10A 25-Feb-10 5.28 3.73 0.073 19.84 253 950 -MW-10A 23-Mar-10 5.30 9.38 0.074 18.89 419 820 -MW-10A 27-Apr-10 5.23 5.70 0.080 21.00 309 491 -MW-10A 25-May-10 5.16 2.47 0.072 22.45 194 1,000 -MW-10A 27-Aug-10 5.27 8.28 0.070 23.90 186 781 -MW-10A 31-Mar-11 4.51 4.65 0.071 21.54 630 NA -MW-10A 19-May-11 7.28 4.50 0.130 22.85 259 7 -

Table 2-5Summary of Historical Groundwater Geochemical Results, October 2008 through May 2011
Tara Shopping CenterJonesboro, Georgia
VRP Application Page 3 of 4
Well ID Sample Date pH
Dissolved Oxygen (mg/L)
Conductivity (ms/cm)
Temperature (Celsius)
ORP (mV)
Turbidity (NTU)
Observations (i.e., color)
MW-10B 22-Oct-08 5.54 4.61 0.175 24.70 351 32.5 -MW-10B 21-Aug-09 7.42 5.00 0.155 21.97 184 44.6 -MW-10B 16-Oct-09 NA NA NA NA NA NA -MW-10B 13-Nov-09 NA NA NA NA NA NA -MW-10B 17-Dec-09 5.85 8.33 0.219 18.91 329 160 -MW-10B 28-Jan-10 6.03 7.45 0.160 19.45 196 49.8 -MW-10B 25-Feb-10 6.27 3.87 0.162 18.80 150 46 -MW-10B 23-Mar-10 6.22 9.73 0.170 17.96 370 31.6 -MW-10B 27-Apr-10 6.24 5.70 0.177 20.00 250 345 -MW-10B 25-May-10 5.91 2.46 0.169 22.66 117 76.2 -MW-10B 27-Aug-10 6.13 6.39 0.151 23.58 119 27.1 -MW-10B 31-Mar-11 5.45 4.30 0.160 21.31 548 NA -MW-10B 19-May-11 8.55 4.81 0.181 22.80 214 30.9 -MW-10C 22-Oct-08 7.17 2.35 0.368 22.40 -174* 183 -MW-10C 21-Aug-09 11.42 0.42 0.441 29.81 -401* 33.2 -MW-10C 16-Oct-09 NA NA NA NA NA NA -MW-10C 13-Nov-09 NA NA NA NA NA NA -MW-10C 17-Dec-09 5.77 5.30 0.134 17.92 245 450 -MW-10C 28-Jan-10 6.25 4.85 0.138 19.16 -46* 405 -MW-10C 25-Feb-10 7.11 1.59 0.230 16.76 253 367 -MW-10C 23-Mar-10 7.38 2.66 0.218 17.07 228 834 -MW-10C 27-Apr-10 6.86 1.30 0.275 19.00 83* 168 -MW-10C 25-May-10 6.99 2.10 0.231 21.92 15* 926 -MW-10C 27-Aug-10 6.95 1.13 0.241 21.99 109 194 -MW-10C 31-Mar-11 9.37 1.83 0.312 21.27 143 9.17 -MW-10C 19-May-11 8.83 0.03 0.231 23.10 274 18 -MW-11A 17-Oct-08 4.16 0.74 0.072 24.50 274 238 -MW-11A 20-Aug-09 4.03 0.23 0.036 25.14 359 60.1 -MW-11A 5-Oct-09 NA NA NA NA NA NA -MW-11A 13-Nov-09 NA NA NA NA NA NA -MW-11A 17-Dec-09 4.74 5.01 0.049 19.80 501 1,000 -MW-11A 28-Jan-10 4.75 3.11 0.053 20.22 425 240 -MW-11A 25-Feb-10 4.79 1.98 0.051 20.44 614 716 -MW-11A 23-Mar-10 4.74 1.79 0.050 21.65 695 310 -MW-11A 27-Apr-10 4.67 1.30 0.059 22.00 640 204 -MW-11A 25-May-10 4.23 0.58 0.051 24.92 705 748 -MW-11A 27-Aug-10 4.91 1.42 0.047 24.10 679 485 -MW-11A 31-Mar-11 4.65 0.37 0.045 23.64 615 5.59 -MW-11A 16-May-11MW-11B 16-Oct-08 5.19 4.74 0.145 23.40 348 180 -MW-11B 20-Aug-09 5.37 2.55 0.105 26.54 271 181 -MW-11B 5-Oct-09 NA NA NA NA NA NA -MW-11B 13-Nov-09 NA NA NA NA NA NA -MW-11B 17-Dec-09 5.92 8.11 0.920 18.46 518 195 -
DRY

Table 2-5Summary of Historical Groundwater Geochemical Results, October 2008 through May 2011
Tara Shopping CenterJonesboro, Georgia
VRP Application Page 4 of 4
Well ID Sample Date pH
Dissolved Oxygen (mg/L)
Conductivity (ms/cm)
Temperature (Celsius)
ORP (mV)
Turbidity (NTU)
Observations (i.e., color)
MW-11B 28-Jan-10 6.19 5.70 0.187 17.90 438 37.2 -MW-11B 26-Feb-10 6.19 4.10 0.172 20.30 599 127 vivid purpleMW-11B 23-Mar-10 6.47 4.21 0.228 21.08 690 33.5 dark purpleMW-11B 27-Apr-10 5.99 4.90 0.637 21.00 711 6.2 v. dark purpleMW-11B 25-May-10 5.88 3.14 0.456 25.88 674 76.8 purpleMW-11B 27-Aug-10 5.59 8.27 2.540 24.72 749 35.5 v. dark purpleMW-11B 31-Mar-11 5.26 5.83 0.410 22.96 806 5.59 -MW-11B 19-May-11 NS NS NS NS NS NS Blockage in wellMW-11C 16-Oct-08 6.76 3.40 0.344 23.20 156 67 -MW-11C 20-Aug-09 6.25 1.79 0.222 26.31 184 10 -MW-11C 5-Oct-09 NA NA NA NA NA NA -MW-11C 13-Nov-09 NA NA NA NA NA NA -MW-11C 17-Dec-09 5.80 6.90 0.287 18.06 554 59.9 -MW-11C 29-Jan-10 6.03 4.87 0.213 17.40 199 38 -MW-11C 25-Feb-10 6.74 3.74 0.218 19.06 304 97 -MW-11C 23-Mar-10 6.79 2.49 0.224 20.45 362 39.7 -MW-11C 27-Apr-10 6.15 1.50 0.224 21.00 269 3.6 -MW-11C 25-May-10 6.25 2.17 0.238 25.60 235 34 -MW-11C 27-Aug-10 6.42 2.71 0.184 25.60 533 17.1 purpleMW-11C 31-Mar-11 6.64 2.91 0.216 20.29 593 5.59 -MW-11C 17-May-11 6.61 5.52 0.260 19.50 279 7.9 -
Notes:NA: Not Available. NS: Not Sampled.Baseline groundwater sampling completed the week of August 17, 2009.Potassium permanganate slurry injection completed the week of August 24, 2009.Injection completed upgradient of MW-11 cluster at injection points IW-1A, IW-1B, and IW-2.*: Value may be erroneous and may not represent actual aquifer conditions at the time of the monitoring event.

Table 2-6Summary of Surface Water Analytical Results
Tara Shopping CenterJonesboro, Georgia
VRP Application 1 of 1
Sample ID Sample Date
PCE TCE cis-1, 2 DCE
Vinyl Chloride
84 472 1,3503 9302
10/5/2009 16 1.2 1.9 <1.08/27/2010 170 15 9.8 <1.03/31/2011 33 24 2.0 <1.011/2/2011 52 3.7 5.6 <1.010/5/2009 22 <1.0 1.0 <1.08/27/2010 81 5.9 6.5 <1.03/31/2011 12 <1.0 <1.0 <1.011/2/2011 4.0 <1.0 <1.0 <1.0
T-1 3/31/2011 1.3 <1.0 <1.0 <1.0T-2 3/31/2011 <1.0 <1.0 <1.0 <1.0T-3 3/31/2011 <1.0 <1.0 <1.0 <1.0T-4 3/31/2011 <1.0 <1.0 <1.0 <1.0
EB-2011 11/2/2011 <1.0 <1.0 <1.0 <1.0Tripblank 11/2/2011 <1.0 <1.0 <1.0 <1.0
Notes: 1. Source: http://www.epa.gov/region4/waste/ots/ecolbul.html#tbl1 2. No USEPA Region IV Freshwater criteria. USEPA Region V RCRA Ecological Screening Levels (2003) used as an alternative. Source: http://www.epa.gov/reg5rcra/ 3. Value equal to USEPA Region IV Freshwater criteria for trans-1,2-DCE based on ECOSAR evaluation
PCE - Tetrachloroethene TCE - Trichloroethene
cis-1,2-DCE - cis-1,2-Dichloroethene mg/L - micrograms per liter
Shading - Concentrations exceeds standard.
USEPA Region IV Freshwater Surface Water Chronic Screening
Values1 (mg/L)
SS-1
SS-2

FIGURES

FIGURE 1-1
SITE LOCATION MAP
JONESBORO, GEORGIA


REFERENCE:
URS Groundwater Corrective Action Plan Addendum,
dated September 28, 2009.
FIGURE 2-1
SITE LAYOUT AND PROPERTY OWNERSHIP MAP
ASHLAND INC.
TARA HOLDINGS
8564 TARA BOULEVARD
JONESBORO, GEORGIA
REVISIONS
Rev.
Rev.
Rev.
Rev.
By:
By:
By:
By:
Disc.:
Disc.:
Disc.:
Disc.:
Date Drawn:
Date Reviewed:
Plot Date:
Reviewed By:
Drawn By:
Project Number.:
Scale:
MDO
MN
1" = 140'
01/05/201201/201201/2012
Date:
Date:
Date:
Date:

FIGURE 2-2
HISTORICAL SOIL BORING LOCATIONS AND
MONITORING WELL LOCATIONS
ASHLAND INC.
TARA HOLDINGS
8564 TARA BOULEVARD
JONESBORO, GEORGIA
REVISIONS
Rev.
Rev.
Rev.
Rev.
By:
By:
By:
By:
Disc.:
Disc.:
Disc.:
Disc.:
Date Drawn:
Date Reviewed:
Plot Date:
Reviewed By:
Drawn By:
Project Number.:
Scale:
MDO
MN
1" = 140'
12/06/201212/201212/2012
Date:
Date:
Date:
Date:
REFERENCE:
URS Groundwater Corrective Action Plan Addendum,
dated September 28, 2009.
POTENTIOMETRIC SURFACE CONTOURS OF THE LOWER RESIDUUM – AUGUST 19, 2009 AND OFF-SITEREGIONS REQUIRING HYDRAULIC CONTROLS AND WATER QUALITY RECONNAISSANCE
FIGURE41
May, 2011
Areas currentlylacking hydraulicand structuralcontrols;water qualityreconnaissance
Residuumand Bedrock
Residuum,Bedrock andCreek
BedrockMW-15 A/B
MW-16 A/B/C
TARA SHOPPING CENTERJONESBORO, GEORGIA

PROPOSED OFF-SITE MONITORING WELL NEST/WELL FIGURE4-2
May, 2011
Site
Flint River Road
TaraB
ou
levard
Surface water gaging and survey(approximate locations)
SG-1
SG-2
TARA SHOPPING CENTERJONESBORO, GEORGIA

APPENDIX A
Voluntary Investigation and Remediation Plan Application Form and Checklist


APPENDIX B
Tax Map and Warranty Deed


APPENDIX C
Remediation Agreement


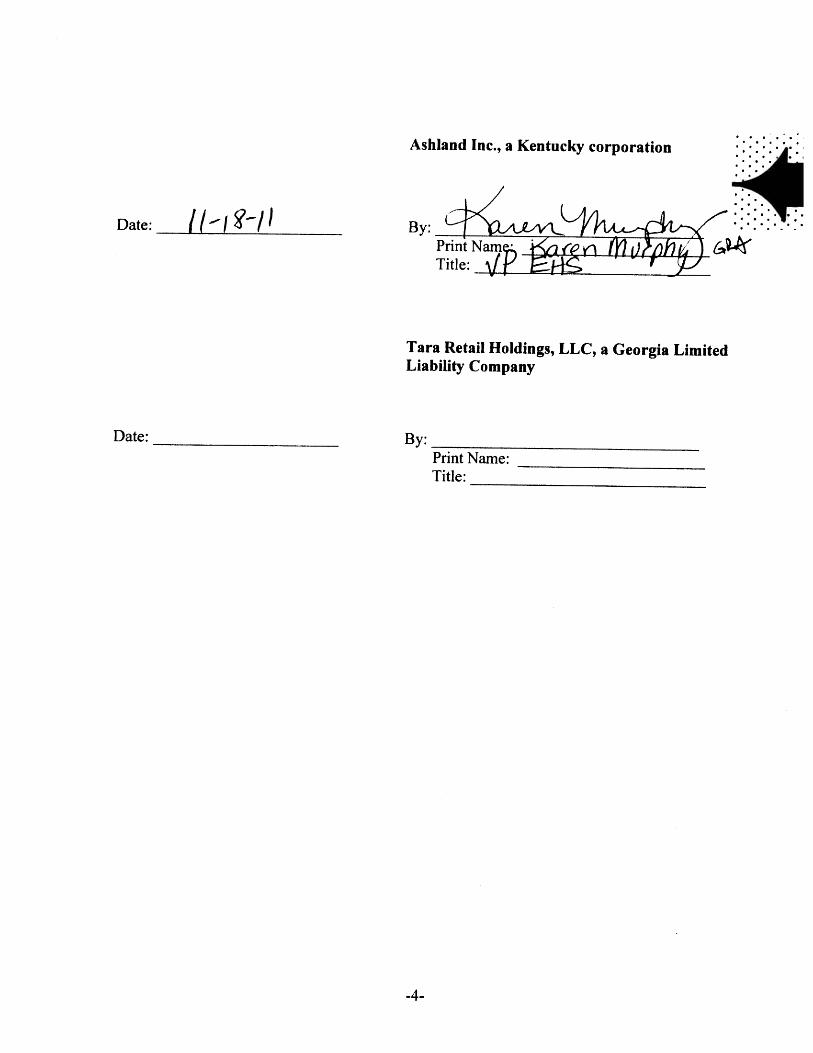


APPENDIX D
Conceptual Site Model Figures

WATERSHED BOUNDARIES FIGURED-1
May, 2011
#Flint River Rd
TaraBlvd
Tara
Blvd
Faye
t tevi ll
eR
d
Fay
ette
ville
Rd
138
138
North Ave
SM
ainSt
Jone
sboro
Rd
Flint River Rd SW
SITEFl in
tR
i ver
Rum Creek
Sw
am
pC
reek
Unnam
edCrk.
Cleburnes Crk.
Unnamed Trib.
Beave
rdam
Cre
ek
Jester Creek
Fl int
Rive
r
Lake Spivey
Vaughn
Branc
h
Line Creek
Lake Tara
Joy Lake
Drakes Lake
Rock Hill Lake
Wrights Lake
HeadwatersFlint River
Upper Little Cotton Indian Creek
Murphy Creek-Flint River
Camp Creek
(031300050101)
(030701030202)
(031300050104)
(031300050102)
0 0.5 1 1.5 2 Miles
Hydrography
Water BodyLakePondReservoirSwampMarsh
RailroadTransportation
Watershed Boundary(Hydrologic Unit Code 12)
LEGEND
Source: U.S.G.S. National Hydrography Dataset
TARA SHOPPING CENTERJONESBORO, GEORGIA
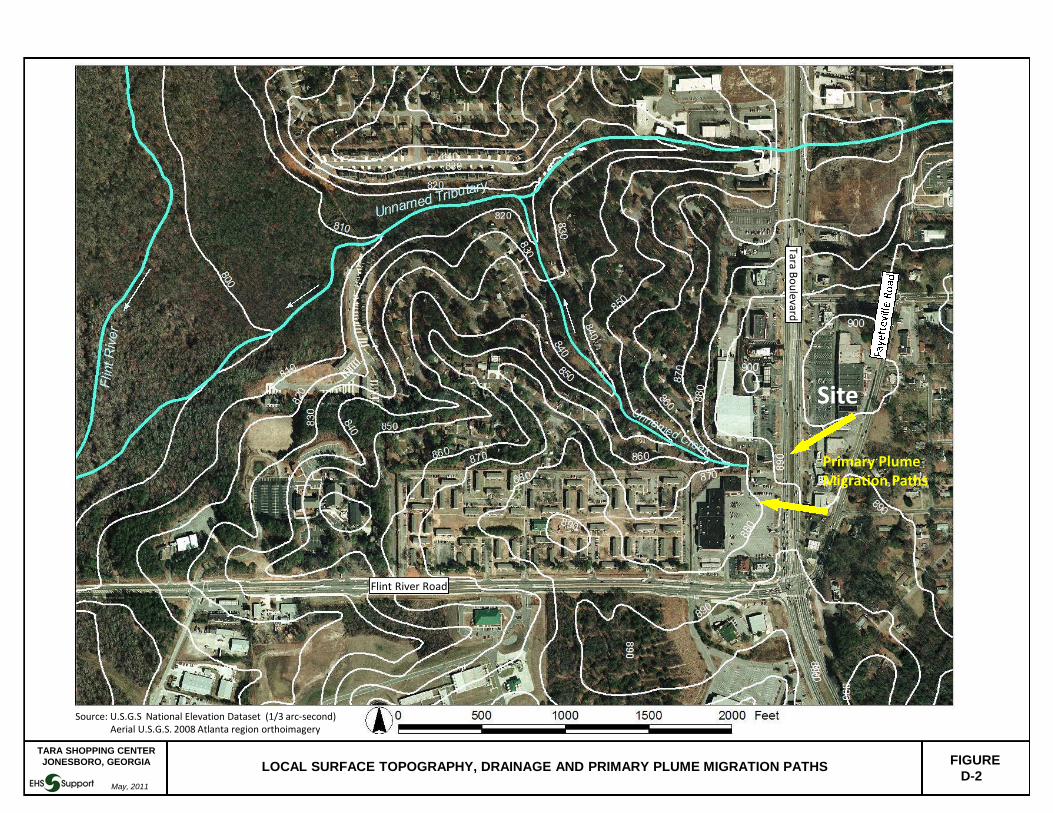
LOCAL SURFACE TOPOGRAPHY, DRAINAGE AND PRIMARY PLUME MIGRATION PATHS FIGURED-2
May, 2011
Site
Primary PlumeMigration Paths
Source: U.S.G.S National Elevation Dataset (1/3 arc-second)Aerial U.S.G.S. 2008 Atlanta region orthoimagery
Flint River Road
TaraB
ou
levard
TARA SHOPPING CENTERJONESBORO, GEORGIA

MAJOR AQUIFERS IN GEORGIA FIGURED-3
TARA SHOPPING CENTERJONESBORO, GEORGIA
May, 2011
Site(Jonesboro, Clayton Co.)

CONCEPTUAL VIEW OF GROUNDWATER FLOW IN THE PIEDMONT AQUIFER SYSTEM FIGURED-4
May, 2011
Modified from:Miller, J.A.,1990, Ground water atlas of the United States – Piedmont and Blue Ridgeaquifers: U.S. Geological Survey HA 730-G; andLegrand, H.E., 2004, A master conceptual model for hydrogeological sitecharacterization in the Piedmont and Mountain region of North Carolina, A guidancemanual: North Carolina Department of Environment and Natural Resources
Fault
UD
TARA SHOPPING CENTERJONESBORO, GEORGIA

FIGURE D-5
CROSS SECTION LOCATION MAP
ASHLAND INC.
TARA HOLDINGS
8564 TARA BOULEVARD
JONESBORO, GEORGIA
REVISIONS
Rev.
Rev.
Rev.
Rev.
By:
By:
By:
By:
Disc.:
Disc.:
Disc.:
Disc.:
Date Drawn:
Date Reviewed:
Plot Date:
Reviewed By:
Drawn By:
Project Number.:
Scale:
MDO
MN
1" = 140'
01/05/2012
?????????????
01/201201/2012
Date:
Date:
Date:
Date:
REFERENCE:
URS Groundwater Corrective Action Plan Addendum,
dated September 28, 2009.

FIGURE D-6
CROSS SECTIONS A-A', B-B' AND C-C'
ASHLAND INC.
TARA HOLDINGS
8564 TARA BOULEVARD
JONESBORO, GEORGIA
REVISIONS
Rev.
Rev.
Rev.
Rev.
By:
By:
By:
By:
Disc.:
Disc.:
Disc.:
Disc.:
Date Drawn:
Date Reviewed:
Plot Date:
Reviewed By:
Drawn By:
Project Number.:
Scale:
MDO
MN
AS SHOWN
01/05/2012
01/2012
01/2012
Date:
Date:
Date:
Date:
CROSS SECTION LOCATION

CONCEPTUAL SITE MODEL BLOCK DIAGRAM FIGURED-7
TARA SHOPPING CENTERJONESBORO, GEORGIA
May, 2011

(871.88)
(NS)
FIGURE D-8
UPPER RESIDUUM POTENTIOMETRIC SURFACE
MAY 2011
ASHLAND INC.
TARA HOLDINGS
8564 TARA BOULEVARD
JONESBORO, GEORGIA
REVISIONS
Rev.
Rev.
Rev.
Rev.
By:
By:
By:
By:
Disc.:
Disc.:
Disc.:
Disc.:
Date Drawn:
Date Reviewed:
Plot Date:
Reviewed By:
Drawn By:
Project Number.:
Scale:
MDO
MN
1" = 140'
01/05/201201/201201/2012
Date:
Date:
Date:
Date:
REFERENCE:
URS Groundwater Corrective Action Plan Addendum,
dated September 28, 2009.

(871.59)
FIGURE D-9
LOWER RESIDUUM POTENTIOMETRIC SURFACE
MAY 2011
ASHLAND INC.
TARA HOLDINGS
8564 TARA BOULEVARD
JONESBORO, GEORGIA
REVISIONS
Rev.
Rev.
Rev.
Rev.
By:
By:
By:
By:
Disc.:
Disc.:
Disc.:
Disc.:
Date Drawn:
Date Reviewed:
Plot Date:
Reviewed By:
Drawn By:
Project Number.:
Scale:
MDO
MN
1" = 140'
01/05/201201/201201/2012
Date:
Date:
Date:
Date:
REFERENCE:
URS Groundwater Corrective Action Plan Addendum,
dated September 28, 2009.

(862.01)
(863.09)*
FIGURE D-10
BEDROCK POTENTIOMETRIC SURFACE
MAY 2011
ASHLAND INC.
TARA HOLDINGS
8564 TARA BOULEVARD
JONESBORO, GEORGIA
REVISIONS
Rev.
Rev.
Rev.
Rev.
By:
By:
By:
By:
Disc.:
Disc.:
Disc.:
Disc.:
Date Drawn:
Date Reviewed:
Plot Date:
Reviewed By:
Drawn By:
Project Number.:
Scale:
MDO
MN
1" = 140'
01/06/201201/201201/2012
Date:
Date:
Date:
Date:
REFERENCE:
URS Groundwater Corrective Action Plan Addendum,
dated September 28, 2009.

CONCEPTUAL GROUNDWATER FLOW IN THE VICINITY OF SURFACE WATER DRAINAGE FIGURED-11
May, 2011
Bedrock
Saprolite residuum
Bedrock
Saprolite residuum
StreamStream
Groundwater discharge nearstreambed incised into residuum Groundwater discharge near
streambed at or incised into bedrock
TARA SHOPPING CENTERJONESBORO, GEORGIA

AVERAGE GROUNDWATER HEAD DIFFERENCES BETWEEN THE UPPER AND LOWER RESIDUUM FIGURED-12
May, 2011
Average difference of groundwater headsmeasured between the upper residuum (Awells) and the lower residuum (B wells) infeet.Negative value indicates the groundwaterhead in the lower residuum is greater thanthe upper residuum indicating an upwardflow. Positive value indicates the reversecondition and vertical flow is downward.
Site
Flint River Road
TaraB
ou
levard
0.07
0.030.51
-0.08
-0.07
0.26
0.24
0.1
0.08
0.050.03
0.24
MW-5BMW-13B
MW-9B
MW-11B
MW-2B
MW-10BMW-8B
MW-7B MW-1A
MW-15B
MW-16B
TARA SHOPPING CENTERJONESBORO, GEORGIA
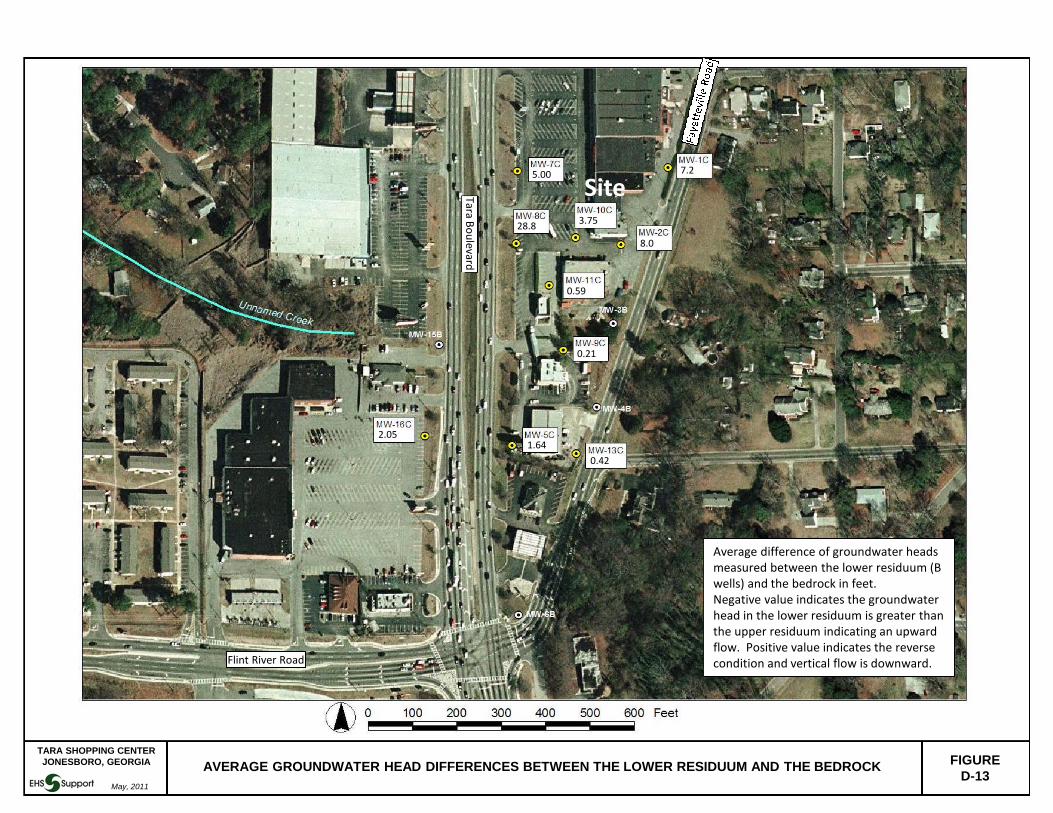
FIGURED-13
May, 2011
AVERAGE GROUNDWATER HEAD DIFFERENCES BETWEEN THE LOWER RESIDUUM AND THE BEDROCK
Average difference of groundwater headsmeasured between the lower residuum (Bwells) and the bedrock in feet.Negative value indicates the groundwaterhead in the lower residuum is greater thanthe upper residuum indicating an upwardflow. Positive value indicates the reversecondition and vertical flow is downward.
Site
Flint River Road
TaraB
ou
levard
0.42
1.642.05
0.21
0.59
28.83.75
8.0
7.25.00
TARA SHOPPING CENTERJONESBORO, GEORGIA
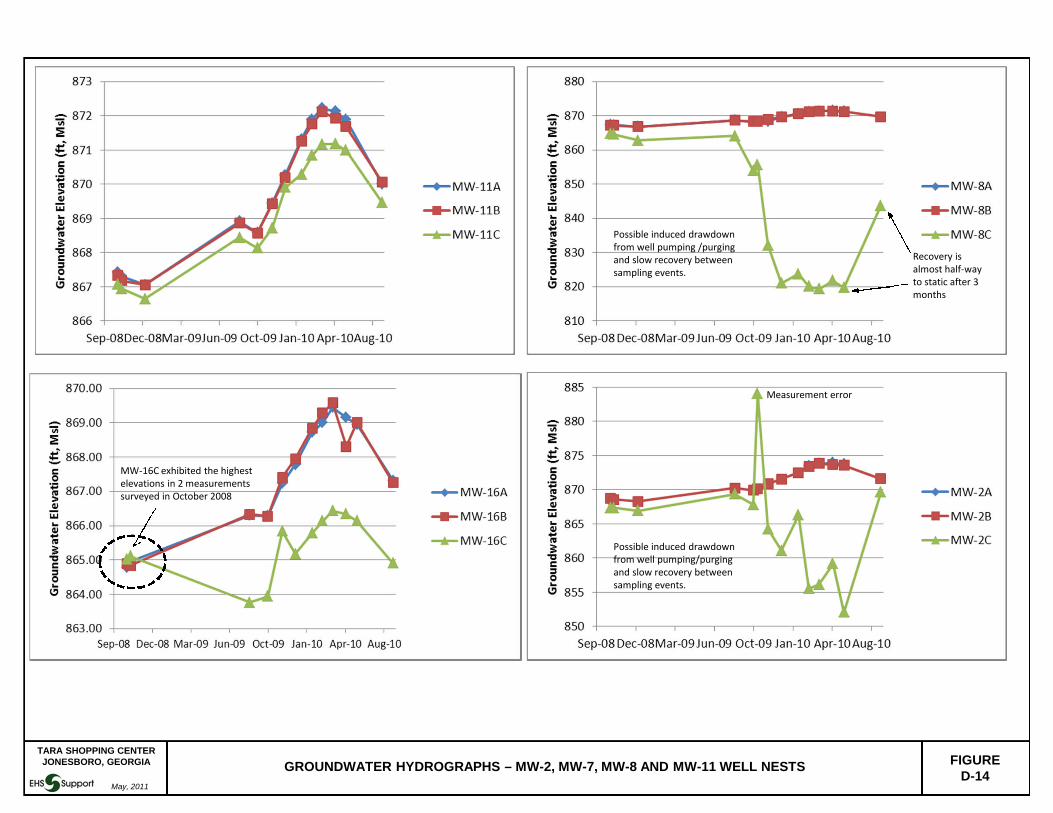
GROUNDWATER HYDROGRAPHS – MW-2, MW-7, MW-8 AND MW-11 WELL NESTS FIGURED-14
May, 2011
Possible induced drawdownfrom well pumping /purgingand slow recovery betweensampling events.
Possible induced drawdownfrom well pumping/purgingand slow recovery betweensampling events.
Measurement error
MW-16C exhibited the highestelevations in 2 measurementssurveyed in October 2008
Recovery isalmost half-wayto static after 3months
TARA SHOPPING CENTERJONESBORO, GEORGIA
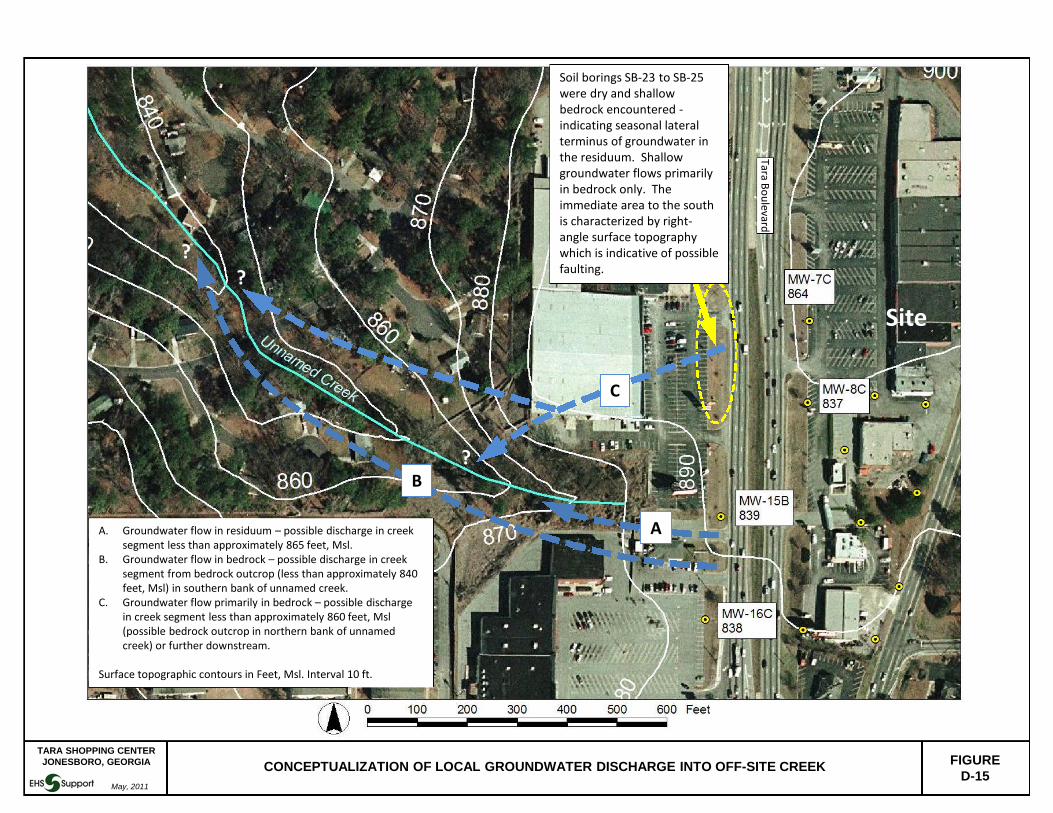
CONCEPTUALIZATION OF LOCAL GROUNDWATER DISCHARGE INTO OFF-SITE CREEK FIGURED-15
May, 2011
TaraB
ou
levard
Site
Soil borings SB-23 to SB-25were dry and shallowbedrock encountered -indicating seasonal lateralterminus of groundwater inthe residuum. Shallowgroundwater flows primarilyin bedrock only. Theimmediate area to the southis characterized by right-angle surface topographywhich is indicative of possiblefaulting.
A. Groundwater flow in residuum – possible discharge in creeksegment less than approximately 865 feet, Msl.
B. Groundwater flow in bedrock – possible discharge in creeksegment from bedrock outcrop (less than approximately 840feet, Msl) in southern bank of unnamed creek.
C. Groundwater flow primarily in bedrock – possible dischargein creek segment less than approximately 860 feet, Msl(possible bedrock outcrop in northern bank of unnamedcreek) or further downstream.
Surface topographic contours in Feet, Msl. Interval 10 ft.
C
A
B
??
?
TARA SHOPPING CENTERJONESBORO, GEORGIA

REFERENCE:
URS Groundwater Corrective Action Plan Addendum,
dated September 28, 2009.
FIGURE 2-1
SITE LAYOUT AND PROPERTY OWNERSHIP MAP
ASHLAND INC.
TARA HOLDINGS
8564 TARA BOULEVARD
JONESBORO, GEORGIA
REVISIONS
Rev.
Rev.
Rev.
Rev.
By:
By:
By:
By:
Disc.:
Disc.:
Disc.:
Disc.:
Date Drawn:
Date Reviewed:
Plot Date:
Reviewed By:
Drawn By:
Project Number.:
Scale:
MDO
MN
1" = 140'
01/05/201201/201201/2012
Date:
Date:
Date:
Date:
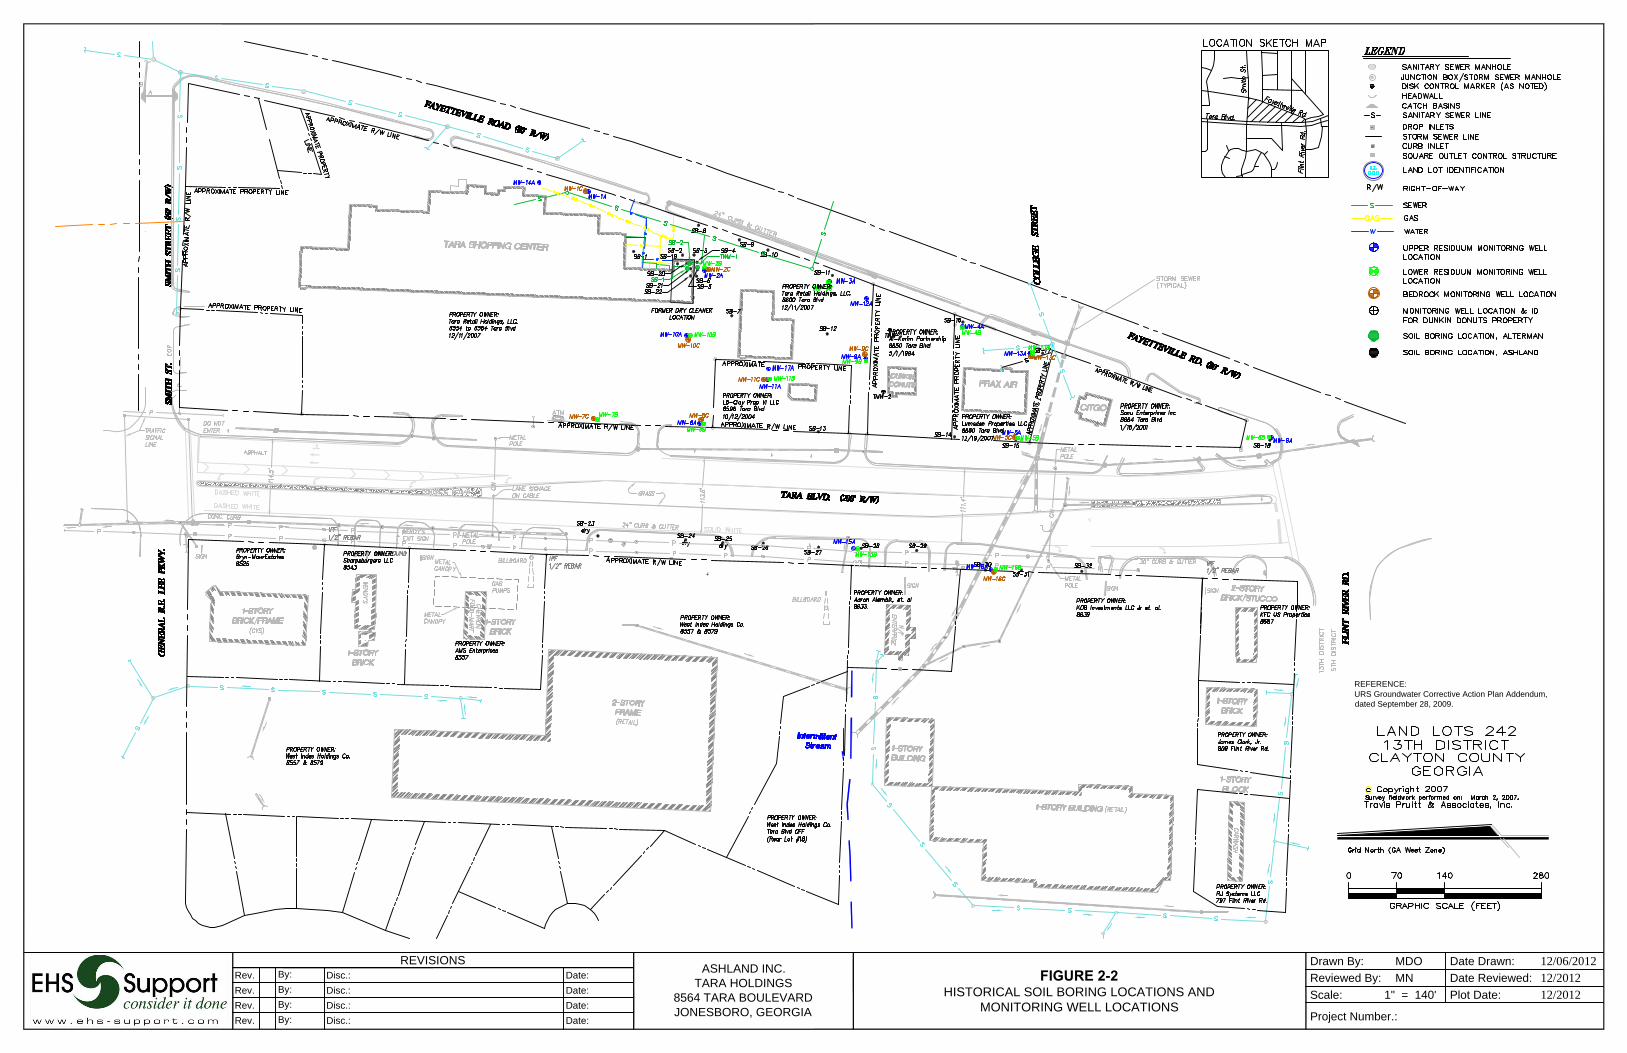
FIGURE 2-2
HISTORICAL SOIL BORING LOCATIONS AND
MONITORING WELL LOCATIONS
ASHLAND INC.
TARA HOLDINGS
8564 TARA BOULEVARD
JONESBORO, GEORGIA
REVISIONS
Rev.
Rev.
Rev.
Rev.
By:
By:
By:
By:
Disc.:
Disc.:
Disc.:
Disc.:
Date Drawn:
Date Reviewed:
Plot Date:
Reviewed By:
Drawn By:
Project Number.:
Scale:
MDO
MN
1" = 140'
12/06/201212/201212/2012
Date:
Date:
Date:
Date:
REFERENCE:
URS Groundwater Corrective Action Plan Addendum,
dated September 28, 2009.


REFERENCE:
URS Groundwater Corrective Action Plan Addendum, dated
September 28, 2009.
FIGURE D-23
TOTAL VOC ISOCONCENTRATION MAP UPPER RESIDUUM AQUIFER
MAY 2011
ASHLAND INC.
TARA HOLDINGS
8564 TARA BOULEVARD
JONESBORO, GEORGIA
REVISIONS
Rev.
Rev.
Rev.
Rev.
By:
By:
By:
By:
Disc.:
Disc.:
Disc.:
Disc.:
Date Drawn:
Date Reviewed:
Plot Date:
Reviewed By:
Drawn By:
Project Number.:
Scale:
MDO
MN
1" = 140'
06/201106/201106/2011
Date:
Date:
Date:
Date:
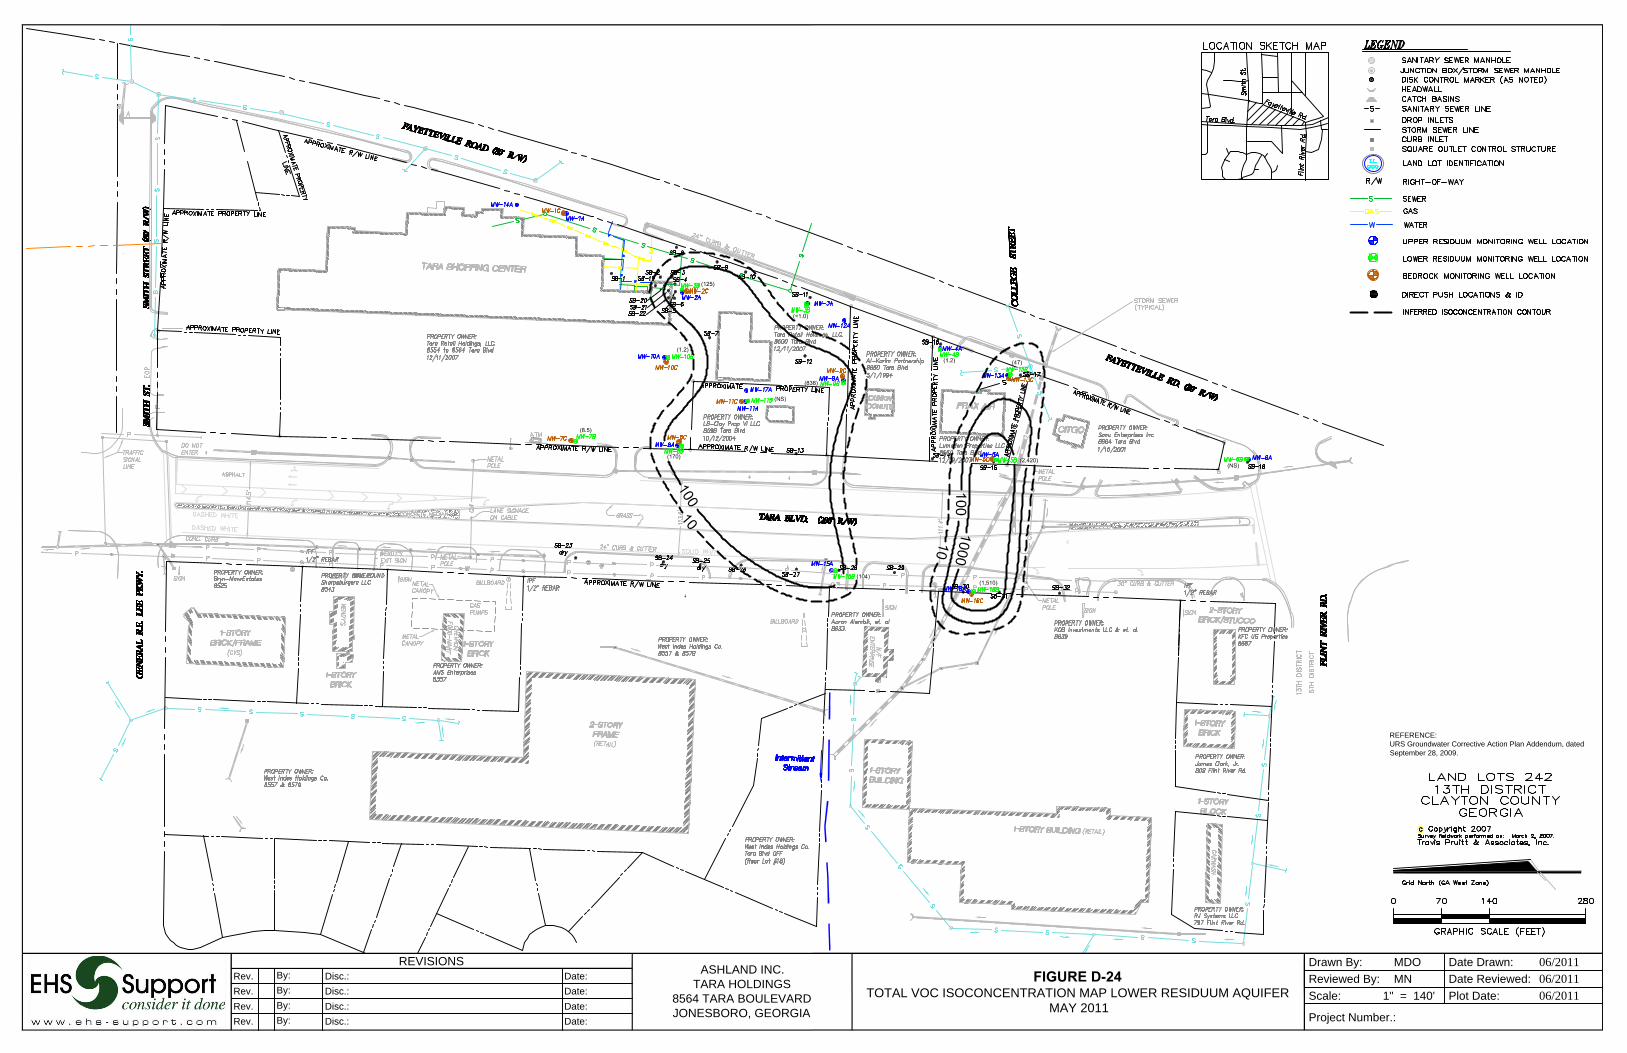
REFERENCE:
URS Groundwater Corrective Action Plan Addendum, dated
September 28, 2009.
FIGURE D-24
TOTAL VOC ISOCONCENTRATION MAP LOWER RESIDUUM AQUIFER
MAY 2011
ASHLAND INC.
TARA HOLDINGS
8564 TARA BOULEVARD
JONESBORO, GEORGIA
REVISIONS
Rev.
Rev.
Rev.
Rev.
By:
By:
By:
By:
Disc.:
Disc.:
Disc.:
Disc.:
Date Drawn:
Date Reviewed:
Plot Date:
Reviewed By:
Drawn By:
Project Number.:
Scale:
MDO
MN
1" = 140'
06/201106/201106/2011
Date:
Date:
Date:
Date:

REFERENCE:
URS Groundwater Corrective Action Plan Addendum, dated
September 28, 2009.
FIGURE D-25
TOTAL VOC ISOCONCENTRATION MAP BEDROCK AQUIFER
MAY 2011
ASHLAND INC.
TARA HOLDINGS
8564 TARA BOULEVARD
JONESBORO, GEORGIA
REVISIONS
Rev.
Rev.
Rev.
Rev.
By:
By:
By:
By:
Disc.:
Disc.:
Disc.:
Disc.:
Date Drawn:
Date Reviewed:
Plot Date:
Reviewed By:
Drawn By:
Project Number.:
Scale:
MDO
MN
1" = 140'
06/201106/201106/2011
Date:
Date:
Date:
Date:

SURFACE WATER SAMPLING SITES, PCE CONCENTRATIONS AND INSTANTANEOUS DISCHARGE FIGURED-26
May, 2011
Site
Flint River Road
TaraB
ou
levard
T-1ug/L
Mar 2011 – 1.3Flow 0.85 cfs (Mar 2011)
SS-2ug/L
Oct 2009 – 22Aug 2010 - 81Mar 2011 - 12Flow 0.28 cfs (Mar 2011)
SS-1ug/L
Oct 2009 – 16Aug 2010 - 170Mar 2011 - 33Flow 0.46* cfs (Mar 2011)*Possible error in flow
measurement
T-2ug/L
Mar 2011 – <1.0Flow 0.41 cfs (Mar 2011)
T-3ug/L
Mar 2011 – <1.0Flow 1.07 cfs (Mar 2011)
T-4ug/L
Mar 2011 – <1.0Flow 7.4 cfs (Mar 2011)
TARA SHOPPING CENTERJONESBORO, GEORGIA

APPENDIX E
Proposed Milestone Schedule

Appendix EProject Milestone Schedule
Tara Shopping CenterJonesboro, Georgia
Page 1 of 3 VRP Application
Task Description Weeks 1 2 3 4 5 6 7 8 9 10 11 12 13 14 15 16 17 18 19 20 21 22 23 24 25 26 27 28 29 30 31 32 33 34 35 36 37 38 39 40 41 42 43 44 45 46 47 48 49 50 51 52
1 Source Area Remediation
1.1 Perform Source Area Treatability Study Assumes 1 wk for utility locate and sample collection; 6 wks for treatability test; 3 wks for report
1.2 Preparation of Source Area Remediation Plan
1.3 Agency Review/Comment Period
1.4 Prepare and Submit Final Source Area Remediation Plan
1.5 Implementation of Source Area Remedy1
2 Off-site Groundwater Investigation
2.1 Obtain Access Agreements
2.2 Complete Drilling Program
2.3 Complete Baseline Sampling
2.4 Prepare and Submit Groundwater and Surface Water Remediation Plan
2.5 Agency Review/Comment Period
2.6 Prepare and Submit Final Groundwater and Surface Water Remediation Plan
2.7 Implement Groundwater and Surface Water Remedy(s)2
3 Deliverables3.1 Source Area Remediation Plan Draft Final
3.2 Groundwater and Surface Water Remediation Plan Draft Final
3.3 Semi-Annual Progress Reports3
3.4 Compliance Status Report4 (To Be Determined)
Notes: 1 Assumes source remedy will be solidification/stabilization usting large diameter
augers; add an additional month for excavation and an additional 7+ months for electrical resistive heating.
2 Assumes Monitored Natural Attentual (on a semi-annual basis) for the final groundwater remedy and no further action for the surface water remedy.
3 Assumes Semi-annual Progress Reports will be submitted approximately 2 months after the end of the reporting period.
4 Compliance Status Report will be submitted once remediation is complete.
Year 1

Appendix EProject Milestone Schedule
Tara Shopping CenterJonesboro, Georgia
Page 2 of 3 VRP Application
Task Description Weeks
1 Source Area Remediation
1.1 Perform Source Area Treatability Study
1.2 Preparation of Source Area Remediation Plan
1.3 Agency Review/Comment Period
1.4 Prepare and Submit Final Source Area Remediation Plan
1.5 Implementation of Source Area Remedy1
2 Off-site Groundwater Investigation
2.1 Obtain Access Agreements
2.2 Complete Drilling Program
2.3 Complete Baseline Sampling
2.4 Prepare and Submit Groundwater and Surface Water Remediation Plan
2.5 Agency Review/Comment Period
2.6 Prepare and Submit Final Groundwater and Surface Water Remediation Plan
2.7 Implement Groundwater and Surface Water Remedy(s)2
3 Deliverables3.1 Source Area Remediation Plan
3.2 Groundwater and Surface Water Remediation Plan
3.3 Semi-Annual Progress Reports3
3.4 Compliance Status Report4 (To Be Determined)
Notes: 1 Assumes source remedy will be solidification/stabilization usting large diameter
augers; add an additional month for excavation and an additional 7+ months for electrical resistive heating.
2 Assumes Monitored Natural Attentual (on a semi-annual basis) for the final groundwater remedy and no further action for the surface water remedy.
3 Assumes Semi-annual Progress Reports will be submitted approximately 2 months after the end of the reporting period.
4 Compliance Status Report will be submitted once remediation is complete.
1 2 3 4 5 6 7 8 9 10 11 12 13 14 15 16 17 18 19 20 21 22 23 24 25 26 27 28 29 30 31 32 33 34 35 36 37 38 39 40 41 42 43 44 45 46 47 48 49 50 51 52Year 2

Appendix EProject Milestone Schedule
Tara Shopping CenterJonesboro, Georgia
Page 3 of 3 VRP Application
Task Description Weeks
1 Source Area Remediation
1.1 Perform Source Area Treatability Study
1.2 Preparation of Source Area Remediation Plan
1.3 Agency Review/Comment Period
1.4 Prepare and Submit Final Source Area Remediation Plan
1.5 Implementation of Source Area Remedy1
2 Off-site Groundwater Investigation
2.1 Obtain Access Agreements
2.2 Complete Drilling Program
2.3 Complete Baseline Sampling
2.4 Prepare and Submit Groundwater and Surface Water Remediation Plan
2.5 Agency Review/Comment Period
2.6 Prepare and Submit Final Groundwater and Surface Water Remediation Plan
2.7 Implement Groundwater and Surface Water Remedy(s)2
3 Deliverables3.1 Source Area Remediation Plan
3.2 Groundwater and Surface Water Remediation Plan
3.3 Semi-Annual Progress Reports3
3.4 Compliance Status Report4 (To Be Determined)
Notes: 1 Assumes source remedy will be solidification/stabilization usting large diameter
augers; add an additional month for excavation and an additional 7+ months for electrical resistive heating.
2 Assumes Monitored Natural Attentual (on a semi-annual basis) for the final groundwater remedy and no further action for the surface water remedy.
3 Assumes Semi-annual Progress Reports will be submitted approximately 2 months after the end of the reporting period.
4 Compliance Status Report will be submitted once remediation is complete.
1 2 3 4 5 6 7 8Year 3