u.s. department of education annual performance report for fy11
TRANSCRIPT


FY 2011 Annual Performance Report—U.S. Department of Education
U.S. Department of Education
Arne Duncan
Secretary
Office of the Chief Financial Officer
Thomas Skelly
Delegated to perform the functions and duties of Chief Financial Officer
February 13, 2012
This report is in the public domain. Authorization to reproduce it in whole or in part is granted. While permission to reprint this publication is not necessary, the citation should be: U.S. Department of Education, FY 2011 Annual Performance Report, Washington D.C., 2012.
This report and the summary of the draft FY 2011–14 Strategic Plan are available on the Department’s website at:
http://www2.ed.gov/about/reports/strat/plan2011-14/draft-strategic-plan.pdf.
On request, this publication is available in alternative formats, such as Braille, large print, computer diskette, and in other languages. For more information, please contact the Department’s Alternate Format Center at (202) 260-0852 or (202) 260-0818. For language assistance services, please call 1-800-USA-LEARN (TTY: 1-800-437-0833).
Department annual plans and annual reports are available on the web at: http://www.ed.gov/about/reports/annual/index.html.
The Department welcomes all comments and suggestions on both the content and presentation of this report. Please forward them to: [email protected].
Office of the Chief Financial Officer U.S. Department of Education Washington, D.C. 20202-0600
The following companies were contracted to assist in the preparation of the U.S. Department of Education FY 2011 Annual Performance Report:
For general layout and Web design: ICF Macro For database design: Plexus Corporation

FY 2011 Annual Performance Report —U.S. Department of Education
Foreword
As required by the GPRA Modernization Act of 2010, each federal agency must report annually on its progress in meeting the goals and objectives established by its Strategic Plan. The United States Department of Education’s (the Department’s) Annual Performance Report (APR) for fiscal year (FY) 2011 presents to Congress, the President, and the American people detailed information about progress in meeting the Department’s strategic goals and objectives and key performance measures. The APR accompanies the Administration’s budget request to Congress. The complete budget request for the Department will be available at http://www.ed.gov/about/overview/focus/performance.html.
The APR is one in a series of three reports required under the Office of Management and Budget’s Program for Alternative Approaches to Performance and Accountability Reporting. The Department is participating in this voluntary program in an effort to strengthen its annual reporting documents and to present more streamlined and timely information to clarify the relationship between performance, budgetary resources, and financial reporting.
The Department’s FY 2011 annual reporting includes the following three documents:
Summary of Performance and Financial Information [available February 2012]
This document provides an integrated overview of performance and financial information and consolidates the Agency Financial Report (AFR) and the Annual Performance Report (APR) into a user-friendly format.
Annual Performance Report (APR) [available February 2012]
The APR is produced in conjunction with the FY 2013 President’s Budget Request and provides more detailed performance information and analysis of performance results.
Agency Financial Report (AFR) [published November 15, 2011] The AFR is organized into three major sections:
The Management’s Discussion and Analysis section provides executive-level information on the Department’s history, mission, organization, key activities, analysis of financial statements, systems, controls and legal compliance, accomplishments for the fiscal year, and management and performance challenges facing the Department.
The Financial Details section provides a Message From the Chief Financial Officer, consolidated and combined financial statements, the Department’s notes to the financial statements, and the Report of the Independent Auditors.
The Other Accompanying Information section provides improper payments reporting details and other statutory reporting requirements.
All three reports will be available on the Department’s website at
http://www2.ed.gov/about/reports/annual/index.html

ii FY 2011 Annual Performance Report—U.S. Department of Education
Message From the Secretary
February 2012 I am pleased to present the Department’s Fiscal Year (FY) 2011 Annual Performance Report. This is the second of three integrated reporting components that are included in the alternative approach to the Performance and Accountability Report (PAR) and is released in conjunction with the President’s Budget. The other two reports are the FY 2011 Agency Financial Report, which was released on November 15, 2011, and the FY 2011 Summary of Performance and Financial Information, which is scheduled to be released in February 2012.
The performance data presented in this report are based on the goals in our draft FY 2011–14 Strategic Plan. In
some cases, data for our new draft Strategic Plan are preliminary, and baselines are being established for the performance measures that, going forward in the remainder of FY 2012, will inform our new strategic goals. As we operationalize our new Strategic Plan, we are striving to ensure that our data will be complete and reliable.
We are continuing to monitor our progress in areas of concern that could hinder efficiency, effectiveness, and integrity in our programs and operations, and to identify actions needed to address any deficiencies. Going forward in the remainder of FY 2012, our Office of Inspector General has identified four challenges that the Department will work to address: (1) improper payments, (2) information technology security, (3) oversight and monitoring, and (4) data quality and reporting.
This report reflects that the Department provides critical support to states and districts as they continue the difficult work of education reform. The Annual Performance Report supports our draft Strategic Plan and our budget justification to Congress and identifies ways in which we can improve our performance and the educational performance of our beneficiaries so that once again America will have the highest proportion of college graduates in the world.
A well-rounded education is the key to our long-term economic prosperity. In all areas, and especially in areas related to science, technology, engineering, and mathematics, we must ensure that all children and adults in America receive a world-class education, as the country that out-educates us today will outcompete us tomorrow. Over the past two and a half years, our country has undertaken a collective effort to reform our schools, work that is inextricably linked to the future of our nation’s economy. As a result, we have seen more progress in reform in the past two years than in the previous two decades.
45 states and the District of Columbia have adopted a common set of college- and career-ready standards.
45 states and the District of Columbia are working together to create the next generation of assessments that will track students’ growth toward college and career readiness.

MESSAGE FROM THE SECRETARY
FY 2011 Annual Performance Report—U.S. Department of Education iii
School districts are taking on the hard work of turning around more than 1,000 low-performing schools.
Across the country, labor and management are working together to use the collective bargaining process to support reform and student success.
Education is more than an economic issue—it is the civil rights issue of our generation. To close the achievement gap, we must also close the opportunity gap for all Americans. From improving access to, and the effectiveness of, early learning programs; to reforming elementary and secondary education; to making higher education more accessible, effective, and meaningful; to working to improve the teaching profession, we have made an unprecedented federal commitment to education, but it must be a national effort. I am proud that the Department has played a significant role in supporting these important reforms that are spreading throughout our country.
Through Race to the Top, states are creating the next generation of reforms. In general, we are seeing progress in the 18 states and the District of Columbia that won grants, as well as states that did not win an award.
Through Investing in Innovation, 72 projects are developing and implementing breakthrough ideas that will accelerate student learning.
In Promise Neighborhoods, community groups are creating comprehensive plans to fight poverty by putting a high-quality public school at the center of their work.
We want to support state and local districts as they lead reforms to increase the quality of instruction and improve student achievement, which is why the President announced that we would offer states flexibility under certain provisions of the No Child Left Behind Act (NCLB). NCLB expanded the standards and accountability movement by exposing achievement gaps and challenging schools to focus on the achievement of all children, particularly high-needs subgroups. However, for all that NCLB got right, some of the law’s requirements are hindering state and local school district reforms. This is why, to help states, districts, and schools that are moving forward with education reform, the Administration is providing relief from specific NCLB requirements in exchange for a real commitment to undertake change. The purpose is not to give states and districts a reprieve from accountability, but rather to unleash energy to improve our schools at the local level even as Congress continues to work to reauthorize the law.
This report reflects the Department’s work to make a positive contribution to what must become an ―all-hands-on-deck‖ approach among communities across America—involving local leaders, educators, families, and the students themselves—to building the best-educated workforce and citizenry in the world.
Sincerely, /s/ Arne Duncan

iv FY 2011 Annual Performance Report—U.S. Department of Education
Contents
Overview About the Report ................................................................................................................. 2
FY 2011 Agency Financial Report Highlights ...................................................................... 2
Office of Inspector General’s (OIG) Management Challenges for Fiscal Year 2012 Highlights ...................................................................................................................... 3
FY 2011 Financial Highlights and Information ..................................................................... 3
Summary of Performance Results ................................................................................... 4 Performance Details Challenges Linking Program Performance to Funding ........................................................ 6 The Department’s Approach to Data Collection and Analysis .............................................. 6
The Department’s Evaluation Initiatives .............................................................................. 8
The Department’s Priority Performance Goals for FY 2010–11 ........................................... 9
The Department’s Strategic Plan for FY 2011–14 ............................................................. 14 Goal 1. Postsecondary Education, Career and Technical Education, and Adult
Education .................................................................................................................... 14 Goal 2. Elementary and Secondary ................................................................................... 17 Goal 3. Early Learning ...................................................................................................... 20 Goal 4. Equity ................................................................................................................... 22 Goal 5. Continuous Improvement of the U.S. Education System ....................................... 24 Goal 6. U.S. Department of Education Capacity ................................................................ 27 Appendices Appendix A: Performance Results for Discontinued Measures .......................................... 32 Appendix B1: Summary of Inspector General and Government Accountability Office
Reports ....................................................................................................................... 39 Appendix B2: Summary of FY 2011 Performance Evaluations .......................................... 46 Appendix C: Selected Department Web Links and Education Resources ......................... 51 Appendix D: Glossary of Acronyms and Abbreviations ...................................................... 55

FY 2010 Annual Performance Report—U.S. Department of Education
FY 2011 Performance
Report
2 FY 2011 Annual Performance Report—U.S. Department of Education
Overview
About the Report
The United States Department of Education’s Annual Performance Report (APR) for fiscal year (FY) 2011 provides information on the current status of the Department’s strategic goals for its draft FY 2011–14 Strategic Plan. This is the first year in which we have tracked the progress of the measures for our new draft strategic goals. While there is substantial trend data for many of our national measures of success, we must establish new baselines in order to show progress towards meeting the new strategic goals.
The FY 2011 Agency Financial Report (AFR), released in November 2011, provides detailed information on the Department’s financial performance and stewardship over its financial resources. To review the full report, go to: http://www2.ed.gov/about/reports/annual/2011report/index.html.
The Secretary has outlined accomplishments, ongoing initiatives, and management challenges for the Department in FY 2011 and certified that the Department’s performance data are fundamentally complete and reliable in his letter published in the AFR. For more information, go to http://www2.ed.gov/about/reports/annual/2011report/1-message.pdf.
This document is released with the Congressional Budget Justifications for FY 2013, as well as other budget and performance documents that support the budget process for the upcoming year. For more information, go to: http://www.ed.gov/about/overview/focus/performance.html.
FY 2011 Agency Financial Report Highlights
The FY 2011 Agency Financial Report identified a range of information, including:
the American Recovery and Reinvestment Act of 2009 (Recovery Act) as well as the Education Jobs Fund;
http://www2.ed.gov/about/reports/annual/2011report/2d-mda-recovery-act.pdf
Federal Student Aid initiatives; and
http://www2.ed.gov/about/reports/annual/2011report/2c-mda-federal-loans.pdf
steps to increase college affordability by making it easier to manage student loan debt and provide state educational agencies and local educational agencies with flexibility regarding specific requirements of the Elementary and Secondary Education Act of 1965 (ESEA), as amended.
http://www2.ed.gov/about/reports/annual/2011report/2e-mda-future-challenges.pdf

OVERVIEW
FY 2011 Annual Performance Report—U.S. Department of Education 3
Office of Inspector General’s (OIG) Management Challenges for
Fiscal Year 2012 Highlights
The Office of Inspector General (OIG) works to promote efficiency, effectiveness, and integrity in the programs and operations of the Department. Through its audits, inspections, investigations, and other reviews, OIG continues to identify areas of concern within the Department’s programs and operations, and recommend actions the Department should take to address these weaknesses. The Reports Consolidation Act of 2000 requires OIG to identify and summarize the most significant management challenges facing the Department each year.
Last year, the OIG presented four management challenges: (1) implementation of new programs/statutory changes, (2) oversight and monitoring, (3) data quality and reporting, and (4) information technology security. All of the prior management challenges remain challenges for FY 2012. The first FY 2011 challenge, implementation of new programs/statutory changes, which incorporated aspects of the Recovery Act, and the Ensuring Continued Access to Student Loans Act of 2008, was incorporated into the oversight and monitoring challenge. In addition, OIG added a new challenge related to improper payments. The FY 2012 management challenges are improper payments, information technology security, oversight and monitoring, and data quality and reporting.
The full report is published by the Department’s OIG. To view the full report, go to: http://www2.ed.gov/about/offices/list/oig/managementchallenges.html.
FY 2011 Financial Highlights and Information
For the tenth consecutive year, the Department achieved an unqualified (clean) audit opinion on its annual financial statements. Since 2003, the independent auditors have identified no material weaknesses in the Department’s internal control over financial reporting. To read the full report of the independent auditors, please go to: http://www2.ed.gov/about/reports/annual/2011report/4-auditors.pdf.
For an overview and analysis of the Department’s sources of funds and financial position, please go to: http://www2.ed.gov/about/reports/annual/2011report/2h-mda-financial-highlights.pdf.
To review the Department’s financial summary and complete financial statements—including required supplementary stewardship information and notes to the principal financial statements for the fiscal years ended September 30, 2011, and September 30, 2010—please go to: http://www2.ed.gov/about/reports/annual/2011report/3-financial-details.pdf.
For information on improper payments reporting details, which includes a risk assessment of certain programs, please go to: http://www2.ed.gov/about/reports/annual/2011report/5a-improper-payments.pdf.
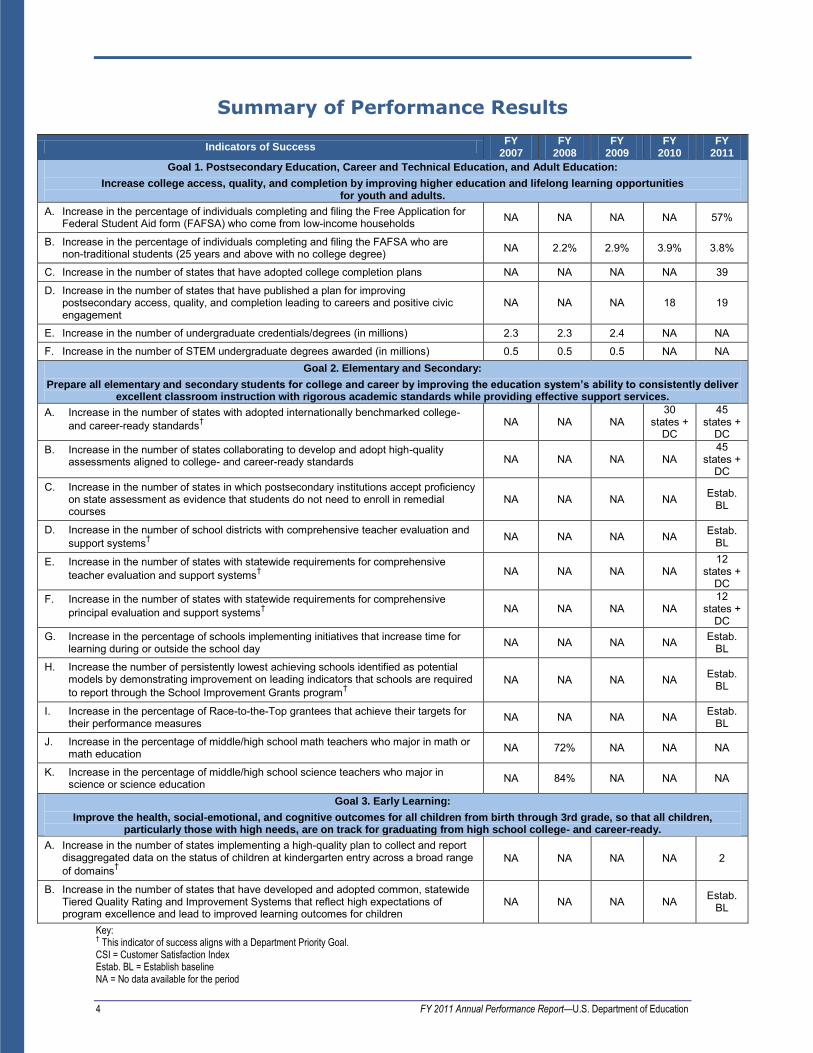
Key: † This indicator of success aligns with a Department Priority Goal.
CSI = Customer Satisfaction Index Estab. BL = Establish baseline NA = No data available for the period
4 FY 2011 Annual Performance Report—U.S. Department of Education
Summary of Performance Results
Indicators of Success FY
2007 FY
2008 FY
2009 FY
2010 FY
2011
Goal 1. Postsecondary Education, Career and Technical Education, and Adult Education:
Increase college access, quality, and completion by improving higher education and lifelong learning opportunities for youth and adults.
A. Increase in the percentage of individuals completing and filing the Free Application for Federal Student Aid form (FAFSA) who come from low-income households NA NA NA NA 57%
B. Increase in the percentage of individuals completing and filing the FAFSA who are non-traditional students (25 years and above with no college degree) NA 2.2% 2.9% 3.9% 3.8%
C. Increase in the number of states that have adopted college completion plans NA NA NA NA 39
D. Increase in the number of states that have published a plan for improving postsecondary access, quality, and completion leading to careers and positive civic engagement
NA NA NA 18 19
E. Increase in the number of undergraduate credentials/degrees (in millions) 2.3 2.3 2.4 NA NA
F. Increase in the number of STEM undergraduate degrees awarded (in millions) 0.5 0.5 0.5 NA NA Goal 2. Elementary and Secondary:
Prepare all elementary and secondary students for college and career by improving the education system’s ability to consistently deliver excellent classroom instruction with rigorous academic standards while providing effective support services.
A. Increase in the number of states with adopted internationally benchmarked college- and career-ready standards† NA NA NA
30 states +
DC
45 states +
DC B. Increase in the number of states collaborating to develop and adopt high-quality
assessments aligned to college- and career-ready standards NA NA NA NA 45
states + DC
C. Increase in the number of states in which postsecondary institutions accept proficiency on state assessment as evidence that students do not need to enroll in remedial courses
NA NA NA NA Estab. BL
D. Increase in the number of school districts with comprehensive teacher evaluation and support systems† NA NA NA NA Estab.
BL
E. Increase in the number of states with statewide requirements for comprehensive teacher evaluation and support systems† NA NA NA NA
12 states +
DC F. Increase in the number of states with statewide requirements for comprehensive
principal evaluation and support systems† NA NA NA NA 12
states + DC
G. Increase in the percentage of schools implementing initiatives that increase time for learning during or outside the school day NA NA NA NA Estab.
BL
H. Increase the number of persistently lowest achieving schools identified as potential models by demonstrating improvement on leading indicators that schools are required to report through the School Improvement Grants program†
NA NA NA NA Estab. BL
I. Increase in the percentage of Race-to-the-Top grantees that achieve their targets for their performance measures NA NA NA NA Estab.
BL
J. Increase in the percentage of middle/high school math teachers who major in math or math education NA 72% NA NA NA
K. Increase in the percentage of middle/high school science teachers who major in science or science education NA 84% NA NA NA
Goal 3. Early Learning:
Improve the health, social-emotional, and cognitive outcomes for all children from birth through 3rd grade, so that all children, particularly those with high needs, are on track for graduating from high school college- and career-ready.
A. Increase in the number of states implementing a high-quality plan to collect and report disaggregated data on the status of children at kindergarten entry across a broad range of domains†
NA NA NA NA 2
B. Increase in the number of states that have developed and adopted common, statewide Tiered Quality Rating and Improvement Systems that reflect high expectations of program excellence and lead to improved learning outcomes for children
NA NA NA NA Estab. BL

SUMMARY OF PERFORMANCE RESULTS
Key: † This indicator of success aligns with a Department Priority Goal.
CSI = Customer Satisfaction Index Estab. BL = Establish baseline NA = No data available for the period
*In addition to the measure below, other measures tracking Equity Indicators of Success are shared across goals, including: Measures 1A and 1B, FAFSAs among low-income and non-traditional students; measure 2H, monitoring of School Improvement Grants; measure 3A, states implementing high-quality early education plans; measure 5C, percentage of state report cards addressing specific metrics; measure 5G, Departmental priorities to address equity-related issues in grants and awards; and measure 6F, student access data.
FY 2011 Annual Performance Report—U.S. Department of Education 5
Indicators of Success FY
2007 FY
2008 FY
2009 FY
2010 FY
2011
C. Increase in the number of states that have statewide coordinated systems of professional development for early childhood educators serving children birth through third grade
NA NA NA NA Estab. BL
D. Increase in the number of states implementing a Comprehensive Assessment System that includes screening and referral processes, formative measures, kindergarten entry assessments, measures of classroom quality and adult-child interactions, measures of child outcomes, and program evaluation
NA NA NA NA Estab. BL
Goal 4. Equity:*
Ensure effective educational opportunities for all students regardless of race, ethnicity, national origin, age, sex, disability, language, and socioeconomic status.
A. Increase in the combined annual number of significant proactive and outreach activities related to civil rights enforcement (new policy documents, compliance reviews, and technical assistance activities)
NA NA NA NA Estab. BL
Goal 5. Continuous Improvement of the U.S. Education System:
Enhance the education system’s ability to continuously improve through better and more widespread use of data, research and evaluation, transparency, innovation, and technology.
A. Increase in the number of states implementing comprehensive statewide longitudinal data systems†
Link students with teachers NA NA 30 36 41
Link P-12 with college NA NA 28 34 40
B. Increase in the number of high-value datasets that are published through data.gov or ED.gov websites NA NA NA NA 9
C. Increase in the percentage of state report cards that include student achievement, school climate, college enrollment, and teacher and school leader measures NA NA NA NA Estab.
BL
D. Increase in the number of Department programs with awards made based on the strength of the evidence (strong or moderate) provided in grant applications NA NA NA 1 5
E. Increase in the number of Department programs, practices, or strategies that are adopted as a result of Scale Up, Validation, or Development grants NA NA NA NA Estab.
BL
F. Increase in the percentage of parents and teachers who believe that the effective implementation of technology within instruction is important to student success
Parents NA NA NA NA 52%
Teachers NA NA NA NA 37%
G. Increase Departmental priorities to address equity-related issues in the Department’s grants and awards NA NA NA NA Estab.
BL Goal 6. U.S. Department of Education Capacity:
Improve the organizational capacities of the Department to implement this Strategic Plan.
A. Increase in the Department’s rank in the report on the Best Places to Work (BPTW) in the Federal Government
28 out of 30 NA 27 out
of 30 30 out of 32
29 out of 33
B. Increase in the percentage of Department’s positive responses that the Department receives on the Talent Management measure in the Federal Viewpoint Survey NA 58% 54% 54% 58%
C. Increase in the percentage of positive responses that the Department receives on the Performance Culture measure in the Federal Viewpoint Survey 49% 52% 50% 52% 53%
D. Increase in the percentage of Department programs that use a risk index and corresponding solutions for identifying and mitigating grantee risk NA NA NA NA Estab.
BL
E. Increase in the percentage of states and other grantees reporting satisfaction with support provided by the Department CSI: 63 CSI: 65 CSI: 68 CSI: 72 CSI: 72
F. Increase in the availability of data related to student access to resources and opportunities to succeed, such as disaggregated student access to college- and career-ready math and science courses; disparate discipline rates, school-based arrests, and referrals to law enforcement; and school-level expenditures
NA NA NA NA Estab. BL

6 FY 2011 Annual Performance Report—U.S. Department of Education
Performance Details
The Department has identified performance measures centered on desired outcomes for each of the six strategic goals established by the draft FY 2011–14 Strategic Plan. Each goal section provides insight into how the Department will work to achieve its strategic goals. Some performance measures are based on trend data over several years. Since the Department has begun to report on a new draft Strategic Plan for the first time in FY 2011, additional measures for which there is currently only a baseline target for FY 2011 were developed to support each strategic goal.
Challenges Linking Program Performance to Funding
Linking performance results, expenditures, and budget for Department programs is complicated. Most of the Department’s funding is disbursed through grants and loans. Only a portion of a given fiscal year’s appropriation is available to state, school, organization, or student recipients during the fiscal year in which the funds are appropriated. The remainder is available at or near the end of the appropriation year or in a subsequent year.
The processes required for conducting grant competitions often result in the award of grants near the end of the fiscal year, with funding available to grantees for future fiscal years.
Therefore, program results cannot be attributed solely to the actions taken related to FY 2011 funds but to a combination of funds from across several fiscal years, as well as state and local investments, and to many external factors, including economic conditions. Furthermore, the results of some education programs may not be apparent for many years after the funds are expended. In addition, results may be due to the effects of multiple programs.
The Department’s Approach to Data Collection and Analysis
The Government Performance and Results Act of 1993, reauthorized as the GPRA Modernization Act of 2010, requires federal departments and agencies to describe the goals and objectives of their programs clearly, identify resources and actions needed to accomplish goals and objectives, develop a means of measuring progress made, and report regularly on achievement. The goals of the act include: improving program effectiveness by promoting a focus on results, service quality, and customer satisfaction; improving congressional decision-making by providing objective information on achieving statutory objectives; and focusing on the relative effectiveness and efficiency of federal programs and spending.
The Education Dashboard: In FY 2011, the Department took significant steps toward enhancing its ability to provide more timely and consistent information to the public by improving its use of education data through a variety of electronic formats. The Department has implemented a data dashboard that contains high-level indicators of education outcomes, ranging from student participation in early learning through completion of postsecondary education.
In addition, the State of the States in Education shows the 10 highest and lowest performing states (based on 2009 data) on basic indicators of educational performance.

PERFORMANCE DETAILS
FY 2011 Annual Performance Report—U.S. Department of Education 7
Disparities in educational performance highlight that demographics alone do not explain differences in educational performance and that state policies matter.
In addition to data provided on the dashboard, data.ed.gov provides links to the Department’s various data sources, including: the Institute of Education Sciences’ National Center for Education Statistics, EDFacts, Federal Student Aid Data Center, and the ED Data Express.
The Data Quality Initiative: The Data Quality Initiative (DQI), begun in 2006, is designed to improve the quality of the Department’s program performance data and reporting.
The DQI has worked with the Department’s program offices and with grantees to review grantee evaluation plans and reports; develop annual performance reporting methodologies; develop data collection and reporting guidance; review and analyze grantee annual performance data; and deliver grantee briefings and workshops focused on evaluation issues. See http://ies.ed.gov/ncee/projects/evaluation/assistance_data.asp for more details.
Consolidating Data Collection Through EDFacts: Complete and accurate data are essential for effective decision-making. EDFacts is the Department’s initiative to put performance data at the center of policy, management, and budget decision-making for elementary and secondary educational programs. EDFacts centralizes performance data supplied by state educational agencies (SEAs) and enables the Department to better analyze and use data in policy development, planning, and management. The EDFacts system enables the consolidation of separate data collections and is able to reduce the reporting burden for states by eliminating redundant data requests. Data are available for both state and local educational agencies and school data include data on demographics, program participation, implementation, and outcomes. See http://www2.ed.gov/about/inits/ed/edfacts/index.html for insights into the program.
Statewide Longitudinal Data Systems: The Statewide Longitudinal Data Systems (SLDS) grant program, as authorized by the Educational Technical Assistance Act of 2002, Title II, is designed to aid state educational agencies in developing and implementing longitudinal data systems. Most statewide longitudinal data systems funds are awarded as state grants, but a portion of the funds are used for activities to improve data quality, coordination and use. Current such activities include the Education Data Technical Assistance Program, the Privacy Technical Assistance Center, and work on common education data standards. These systems are intended to enhance the ability of states to efficiently and accurately manage, analyze, and use education data, including individual student records. The data systems developed with funds from these grants should help states, districts, schools, and teachers make data-driven decisions to improve student learning, as well as facilitate research to increase student achievement and close achievement gaps. More information on the SLDS grant program is available at http://nces.ed.gov/Programs/SLDS/.
Civil Rights Data Collection: The Department collects data on key education and civil rights issues in our nation's public schools for use by the Office for Civil Rights in its enforcement and monitoring efforts, by other Department offices, and by policymakers and researchers outside of the Department. The Department has increased the availability of data related to student access to resources and opportunities to succeed, as well as data that illuminate barriers to equity and success, such as data on harassment, school discipline, and restraint/seclusion. The website displaying this data has been enhanced as well. See http://ocrdata.ed.gov/.

PERFORMANCE DETAILS
8 FY 2011 Annual Performance Report—U.S. Department of Education
Data Strategy Team: The Data Strategy Team (DST) addresses the issue of inconsistent and uncoordinated data strategies among the various principal offices within the Department. The mission of the DST is to coordinate the Department’s public-facing data initiatives by building cohesiveness in internal processes and data policies and by improving transparency in all matters surrounding the Department’s collection of data. The DST supports states’ use of education data through data websites and technical assistance and identifies best practices for the use and promotion of data policy.
Mapping State Standards: In FY 2011, the Department released a report comparing the relative rigor of state proficiency standards in reading and mathematics using the National Assessment of Educational Progress (NAEP) scale as a common yardstick. Each individual state develops its own state assessments in reading and math and sets its own proficiency standard. As a result, states vary widely in the standards they set for students. By using NAEP as a benchmark, it was possible to compare state proficiency standards.
This report is the latest in a series of similar reports mapping state proficiency standards to the NAEP scale. Data are available for 2005, 2007, and 2009, as well as 2003 using a slightly different methodology. More information on prior reports and detailed state-by-state information is available at http://nces.ed.gov/nationsreportcard/studies/statemapping/.
Uniform Graduation Rate: In FY 2011, states began recording high school graduation rates for the 2010–11 school year using a more rigorous four-year adjusted cohort, as developed by the nation’s governors in 2005. Since data reporting requirements were first implemented, states have calculated graduation rates using varying methods, creating inconsistent data from one state to the next. The transition to a uniform high school graduation rate requires all states to report the number of students who graduate in four years with a standard high school diploma, divided by the number of students who entered high school four years earlier, and accounting for student transfers in and out of school.
The Department’s Evaluation Initiatives
In May 2010, the Department launched a new agency-wide evaluation planning process to better align its investments in knowledge building with the Department’s strategic plan and its budget and policy priorities and to support appropriate resource allocation. The process was developed to identify the Department’s key priorities for evaluations that can provide reliable measures of the impacts of programs, policies, and strategies, as well as for a range of research and evaluation activities that build knowledge important to inform policy and practice more broadly.
In FY 2011, the Department developed and approved a set of priority research questions which will help shape its future investments in knowledge building. Each principal office was asked to identify its highest priority research questions, as well as any program-specific research questions. The evaluation planning team’s recommendations are designed to ensure that the evaluation activities supported annually by the Department respond to those research questions identified as highest priority to the policy and program offices. The Department plans to engage annually in a similar strategic planning process for investments in knowledge building.

PERFORMANCE DETAILS
FY 2011 Annual Performance Report—U.S. Department of Education 9
The Department’s Priority Performance Goals for FY 2010–11
Overview
The GPRA Modernization Act of 2010 requires federal agencies covered by the Chief Financial Officer’s (CFO) Act of 1990 to submit priority goals to the Office of Management and Budget (OMB) and to review progress quarterly towards achieving those priorities. The Department’s priority goals support improvements in near-term outcomes, customer service, and efficiencies, and advance progress toward longer-term goals. These goals, which will help measure the success of the Department’s cradle-to-career education strategy, reflect the importance of teaching and learning at all levels of the education system. Targets and milestones for each priority goal have been set by the Department and overall progress toward their achievement is tracked quarterly through reviews and assessments of progress.
These goals are consistent with the Department’s draft four-year strategic plan that is currently being finalized and will be used to regularly monitor and report progress. The Department is in the process of developing some new and continuing some previous priority goals to accompany the President’s FY 2013 Budget.
National Outcomes
The National Outcomes are the improvements in student achievement needed at every level of education to achieve the President’s 2020 goal for all students to be college and career ready. Improving these outcomes will require a concerted effort from all stakeholders in the education system.
1. Early Learning: All states improving overall and disaggregated health, social-emotional, and cognitive outcomes for all children at kindergarten entry.
2. Elementary and Secondary: All states improving overall and disaggregated high school graduation rates.
3. Postsecondary Completion: Nation improving overall and disaggregated college completion rates.
4. Postsecondary Attainment: Nation improving the percent of 25- to 34-year-olds who have attained an associate’s or higher degree.
5. Achievement Gap: All states significantly reducing the achievement gap for all students, regardless of race, ethnicity, national origin, age, disability, language, sex, and socioeconomic status.

PERFORMANCE DETAILS
10 FY 2011 Annual Performance Report—U.S. Department of Education
To see educational trend information for the National Outcome goals, please go to http://www2.ed.gov/about/reports/annual/2011report/2f-mda-performance-highlights.pdf.
FY 2010–11 Priority Goals
1. Evidence-Based Policy
Goal
Implementation of a comprehensive approach to using evidence to inform the Department’s policies and major initiatives, including:
using high-quality and timely data for the Department’s largest discretionary programs, including evaluations and performance measures, for continuous improvement; and
doubling the number of the Department’s programs and initiatives that are evaluated using methods that are consistent with the What Works Clearinghouse standards for evidence and effectiveness.
Progress for FY 2011
In 2010, the Department launched a new Department-wide evaluation planning process to better align its investments in knowledge building with the Department’s Strategic Plan and its budget and policy priorities and to support appropriate resource allocation. The evaluation planning process focuses the Department’s key priorities on evaluations that provide reliable measures of the impacts of programs, policies, and strategies, as well as a range of research and evaluation activities that build knowledge important to informing policy and practice.
The Department plans to increase its fiscal investment in evaluations that produce high-quality findings on program impacts and to apply the use of high-quality and timely data in the Department’s programs to make programmatic decisions.
2. Struggling Schools Reform
Goal
Demonstrate progress in turning around the lowest-achieving schools by identifying as potential models the 500 persistently lowest-achieving schools that demonstrate improvement on leading indicators that schools are required to report through the School Improvement Grant (SIG) program.
Progress for FY 2011
States have identified the 2,000 persistently lowest-achieving schools throughout the country, and the Department has designed the SIG program to provide assistance to help school districts in turning around these schools. Through the SIG program, and the newly formed Office of School Turnaround, the Department has awarded $3.5 billion to all 50 states, the District of Columbia, Puerto Rico, and the Department of the Interior/Bureau of Indian Education. This includes awards for 831 schools to implement one of the four rigorous intervention models required by the SIG grant. In addition, a second round of SIG grants is currently in process, with an additional $546 million to enable even more persistently lowest-achieving schools to implement meaningful interventions and

PERFORMANCE DETAILS
FY 2011 Annual Performance Report—U.S. Department of Education 11
dramatically improve outcomes for students. Moreover, 43 states developed reform plans through the Race to the Top competition that included rigorous turnaround interventions, and the Department awarded over $4.3 billion to 11 states and the District of Columbia to implement their plans.
3. Effective Teachers and Leaders: World-Class Teaching and Learning
Goal
Improve the quality of teaching and learning:
increase the number of school districts with comprehensive teacher evaluation systems based on student growth in significant part, as well as other measures, that may be used for professional development, retention, tenure, promotion, and compensation decisions; and
increase the number of states with statewide requirements for comprehensive teacher evaluation systems based on student growth that may be used for professional development, retention, tenure, promotion, and compensation decisions.
Progress for FY 2011
The Department has continued to support and advance comprehensive teacher evaluation systems through a variety of activities. At the end of FY 2011, the Department had awarded Race to the Top grants to 11 states and the District of Columbia to help them implement their comprehensive reform plans, which include a commitment to develop comprehensive evaluation systems based in significant part on student growth. The Department’s Implementation and Support Unit has been providing extensive technical assistance to these 12 Race to the Top winners. This work has included connecting key practitioners in these states with experts in the field, and with each other, to ensure high-quality implementation. Lessons learned from these states will inform the work of other states pursuing this work that are proceeding with plans developed as part of their Race to the Top applications.
The Department is also supporting the development of state and local comprehensive evaluation systems through the SIG program and the Teacher Incentive Fund program, both of which provide funding for building systems to evaluate teachers based in significant part on student growth. Additionally, the Department continues to work with Congress on the Elementary and Secondary Education Act (ESEA) reauthorization. The Administration’s Blueprint for Reform of the ESEA proposes requiring that all states develop comprehensive evaluation systems as a condition for state formula grants under Title II, Part A, and the Department has begun a rulemaking effort to improve the framework for state and institutional reporting on teacher preparation under the Higher Education Act (HEA), Title II. Furthermore, to help states, districts, and schools that are ready to move forward with education reform, the administration is providing relief from ESEA in exchange for a real commitment to undertake change. The purpose is not to give states and districts a reprieve from accountability, but rather, while the Department works with Congress on a full bipartisan ESEA reauthorization, to allow states the flexibility to adopt college- and career-ready standards, implement next-generation accountability systems, and develop and implement comprehensive teacher and principal evaluation and support systems.

PERFORMANCE DETAILS
12 FY 2011 Annual Performance Report—U.S. Department of Education
4. Data-Driven Decisions
Goal
All states implementing comprehensive statewide longitudinal data systems that link student achievement and teacher data and link K-12 data with higher education data and, to the extent possible, with early learning and workforce data.
Progress for FY 2011
Through the Statewide Longitudinal Data Systems grant program, the Department supports state efforts to implement comprehensive state longitudinal data systems. The Department also required, through the State Fiscal Stabilization Fund, that all states implement state longitudinal data systems that involve elements specified in the America COMPETES Act. Race to the Top applicants are required to show in their applications evidence of their efforts to implement these systems.
The Department has undertaken a number of other activities to support states’ efforts. One set of activities focuses on providing states with guidance and best practices for effectively creating such systems. In FY 2011, the Department provided either targeted online or onsite technical assistance to states. In FY 2012, the Department plans to extend such technical assistance to all 50 states and the District of Columbia.
The Department also created the Privacy Technical Assistance Center to be a one-stop resource for education stakeholders to learn about data privacy, confidentiality, and security practices related to student-level longitudinal data systems.
Additionally, NCES is working with states, districts, and a variety of other education stakeholders to develop Common Education Data Standards to help states and districts develop systems that support and enable the linkages needed to improve achievement and decision-making.
5. College- and Career-Ready Standards
Goal
All states with adopted, internationally benchmarked college- and career-ready standards.
World-class standards are essential for meaningful education reform. Absent clear, high expectations for what students need to know and be able to do, and absent high-quality assessments that accurately measure student performance against those expectations, it is difficult for the nation to ensure student success and prepare a skilled workforce.
Progress for FY 2011
States are now adopting the National Governors Association-led Common Core State Standards; 46 states and the District of Columbia are currently participating in one of two consortia to develop the next generation of assessment systems, aligned to Common Core State Standards. These consortia of states will develop assessments that are valid, support and inform instruction, provide accurate information about what students know and can do, and measure student achievement against standards designed to ensure that all students gain the knowledge and skills needed to succeed in college and the workplace.

PERFORMANCE DETAILS
FY 2011 Annual Performance Report—U.S. Department of Education 13
6. Simplified Student Aid
Goal
All participating higher education institutions and loan servicers operationally ready to originate and service Federal Direct Student Loans through an efficient and effective student aid delivery system with simplified applications and minimal disruption to students.
Progress for FY 2011
The Department moved aggressively to ensure a smooth transition for any schools that chose to participate in the Direct Loan Program. With the enactment of the SAFRA Act, the Department expanded and accelerated these efforts dramatically. Federal Student Aid (FSA) quickly updated systems, increased capacity, and provided specialized training and technical assistance to ensure that nearly 3,000 foreign and domestic institutions experienced a smooth transition to Direct Loans.
As of the end of September 2011, 100 percent of domestic schools and 80 foreign schools that previously participated in the FFEL program have originated Direct Loans. FSA will continue to monitor new participating schools and offer assistance as necessary. FSA will also continue to provide participating schools with the most up-to-date information about the Direct Loan program.
PERFORMANCE DETAILS
14 FY 2011 Annual Performance Report—U.S. Department of Education
The Department’s Strategic Plan for FY 2011–14
The Department’s Strategic Plan supports its mission to promote student achievement and preparation for global competitiveness by fostering educational excellence and ensuring equal access. The Department’s Priority Goals, which are described in the preceding section, tie closely to the Department’s performance goals identified in its new Strategic Plan. An analysis of these strategic goals follows.
The draft FY 2011–2014 Strategic Plan addresses the key outcome-oriented goals, focusing on improving student achievement to increase high school graduation, college completion, and educational attainment with an emphasis on the importance of early learning in the Department, recognizing that the path to college completion and a productive career begins at birth.
Goal 1. Postsecondary Education, Career and Technical Education, and Adult Education:
Increase college access, quality, and completion by improving higher education and lifelong learning opportunities for youth
and adults.
Overview
Meeting the President’s 2020 goal of once again having the highest proportion of college graduates in the world will require millions of additional Americans to earn a college degree. The President has also challenged every American to commit to at least one year of higher education or career training.
Whether for recent high school graduates or adult learners, the responsibility of the Department is to ensure that all students are well-prepared for college and careers, help more students enroll in postsecondary education, and increase the number that complete programs of study with a degree or certificate. Dramatically boosting completion rates for bachelor’s and associate’s degrees is essential for Americans to compete in a global economy.
The Department will work to close the opportunity gap by improving the affordability of and access to college and workforce training, especially among adult learners, low-income students, first-in-family college-goers, students with disabilities, English learners, and other underrepresented populations.
The Department’s commitment to ensure the delivery of federal student aid will be essential to success. Further, we will foster institutional quality, accountability, and transparency to ensure that postsecondary education credentials represent effective preparation for students to excel in a global society and a changing economy.
The Department will continue to support teacher preparation initiatives to further the transformation already underway in how we recruit and prepare teachers.
Finally, the Department will support degree and certificate completion and job placement in high demand areas, especially science, technology, engineering, and mathematics, particularly among underrepresented and economically disadvantaged populations.

PERFORMANCE DETAILS
FY 2011 Annual Performance Report—U.S. Department of Education 15
Goal 1: Details
Postsecondary Education, Career and Technical Education, and
Adult Education Indicators of Success
Results
FY 2007 FY 2008 FY 2009 FY 2010 FY 2011
Actual Actual Actual Actual Actual 1.A. Increase in the percentage of individuals completing and filing the Free Application for Federal Student Aid form (FAFSA) who come from low-income households
NA NA NA NA 57%
1.B. Increase in the percentage of individuals completing and filing the FAFSA who are non-traditional students (25 years and above with no college degree)
NA 2.2% 2.9% 3.9% 3.8%
1.C. Increase in the number of states that have adopted college completion plans
NA NA NA NA 39
1.D. Increase in the number of states that have published a plan for improving postsecondary access, quality, and completion leading to careers and positive civic engagement
NA NA NA 18 19
1.E. Increase in the number of undergraduate credentials/degrees (in millions)
2.3 2.3 2.4 NA NA
1.F. Increase in the number of STEM undergraduate degrees awarded (in millions)
0.5 0.5 0.5 NA NA
NA = No data available for the period Sources: 1.A. Central Processing System (CPS) database (Federal Student Aid data) 1.B. CPS and U.S. Bureau of Labor Statistics (BLS) Labor Force Statistics 1.C. U.S. Department of Education, Program and Policy Studies Service 1.D. U.S. Department of Education, Program and Policy Studies Service 1.E. Integrated Postsecondary Education Data System. Numbers reflect total associate’s degrees and bachelor’s degrees
awarded. 1.F. Tabulated by National Science Foundation/Division of Science Resources Statistics; data from Department of
Education/National Center for Education Statistics: Integrated Postsecondary Education Data System Completions Survey.
Explanation and Analysis of Progress: Measures 1A and 1C will establish a baseline using FY 2011 data. Measures 1B, 1D, 1E, and 1F have existing data prior to FY 2011. Data for measures 1A and 1B are reported by the Department and measure 1B includes data reported by a federal agency other than the Department. Data for measures 1C and 1D are collected from states or grantees. Data for measure 1F are reported by the National Center for Education Statistics.
Data for measures 1A, 1B, 1C, 1D, and 1E are most influenced by actions taken by the Department, but also are influenced by factors that are beyond the control of the Department. Data for measure 1F are most influenced by actions taken by local educational agencies or grantees in response to state and federal policy initiatives, but also are influenced by factors that are beyond the control of the local educational agencies, the states, or the Department. Data are collected annually.
PERFORMANCE DETAILS
16 FY 2011 Annual Performance Report—U.S. Department of Education
Success will depend, to some degree, on the extent to which states and postsecondary institutions implement policies and programs to increase student retention and persistence to graduation.
In addition, modifications to statewide longitudinal data systems and other data systems are necessary to better track the nation’s progress on improving access to postsecondary education, completion of postsecondary degrees and certificates, and success in the workforce and society.
More reliable information is needed to determine whether postsecondary institutions that receive Federal grant and loan funds are achieving performance expectations. Specifically, certain data elements and reporting features need to be added to many of the state-owned and managed state longitudinal data systems and to the Integrated Postsecondary Education Data System (IPEDS), from which comparative data can be drawn.
PERFORMANCE DETAILS
FY 2011 Annual Performance Report—U.S. Department of Education 17
Goal 2. Elementary and Secondary:
Prepare all elementary and secondary students for college and career by improving the education system’s ability to consistently
deliver excellent classroom instruction with rigorous academic standards while providing effective support services.
Overview
There is a clear national consensus that the elementary and secondary education system should prepare every student for college and a career. However, there also is broad agreement that the education system fails to ensure that all students graduate not only on time, but also graduate prepared for college and a career.
The Department’s elementary and secondary education reforms focus on the building blocks needed for schools, school districts, and states to more consistently deliver excellent classroom instruction for all students, especially students with disabilities and English learners:
a system for improving learning and teaching that aligns internationally benchmarked college- and career-ready standards, high-quality formative and summative assessments, and engaging and effective instructional content;
an effective teacher for every student, an effective leader for every school, and all teachers and leaders with access to the support and feedback needed to be effective;
school environments that are conducive to teaching and learning for all students, and as required by laws, including those for students with disabilities and English learners;
communities that work together to ensure that children know they are the highest priority and receive the support they need to succeed;
dramatic improvements among the persistently lowest-achieving schools; and
the preservation and promotion of a well-rounded education for all students, along with an increase in the capacity of students to fulfill the needs of the Science, Technology, Engineering and Mathematics (STEM) pipeline.
PERFORMANCE DETAILS
18 FY 2011 Annual Performance Report—U.S. Department of Education
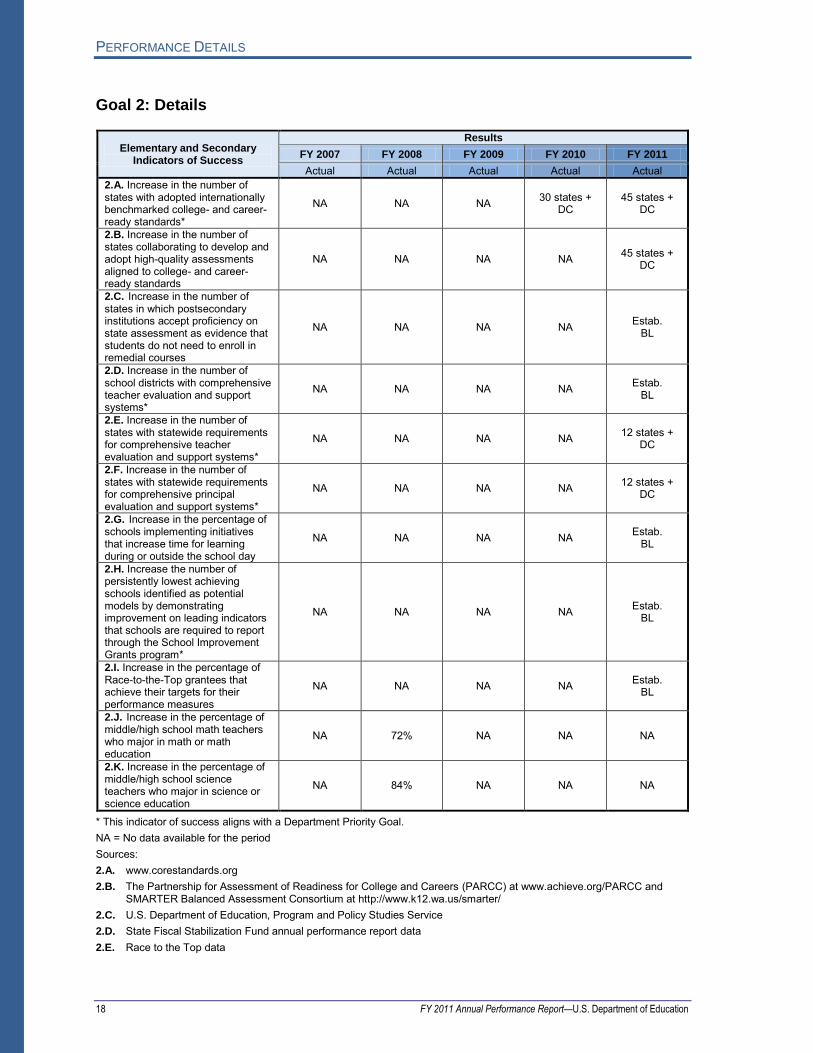
Goal 2: Details
Elementary and Secondary Indicators of Success
Results
FY 2007 FY 2008 FY 2009 FY 2010 FY 2011
Actual Actual Actual Actual Actual 2.A. Increase in the number of states with adopted internationally benchmarked college- and career-ready standards*
NA NA NA 30 states + DC
45 states + DC
2.B. Increase in the number of states collaborating to develop and adopt high-quality assessments aligned to college- and career-ready standards
NA NA NA NA 45 states + DC
2.C. Increase in the number of states in which postsecondary institutions accept proficiency on state assessment as evidence that students do not need to enroll in remedial courses
NA NA NA NA Estab. BL
2.D. Increase in the number of school districts with comprehensive teacher evaluation and support systems*
NA NA NA NA Estab. BL
2.E. Increase in the number of states with statewide requirements for comprehensive teacher evaluation and support systems*
NA NA NA NA 12 states + DC
2.F. Increase in the number of states with statewide requirements for comprehensive principal evaluation and support systems*
NA NA NA NA 12 states + DC
2.G. Increase in the percentage of schools implementing initiatives that increase time for learning during or outside the school day
NA NA NA NA Estab. BL
2.H. Increase the number of persistently lowest achieving schools identified as potential models by demonstrating improvement on leading indicators that schools are required to report through the School Improvement Grants program*
NA NA NA NA Estab. BL
2.I. Increase in the percentage of Race-to-the-Top grantees that achieve their targets for their performance measures
NA NA NA NA Estab. BL
2.J. Increase in the percentage of middle/high school math teachers who major in math or math education
NA 72% NA NA NA
2.K. Increase in the percentage of middle/high school science teachers who major in science or science education
NA 84% NA NA NA
* This indicator of success aligns with a Department Priority Goal. NA = No data available for the period Sources: 2.A. www.corestandards.org 2.B. The Partnership for Assessment of Readiness for College and Careers (PARCC) at www.achieve.org/PARCC and
SMARTER Balanced Assessment Consortium at http://www.k12.wa.us/smarter/ 2.C. U.S. Department of Education, Program and Policy Studies Service 2.D. State Fiscal Stabilization Fund annual performance report data 2.E. Race to the Top data

PERFORMANCE DETAILS
FY 2011 Annual Performance Report—U.S. Department of Education 19
2.F. Race to the Top data 2.G. Current (School Improvement Grant grantee data): EDFacts. Future collection method: EDFacts survey of
districts/schools 2.H. Results from School Improvement Grant reports due in February 2012 2.I. Race to the Top annual performance reports 2.J. U.S. Department of Education, National Center for Education Statistics, Schools and Staffing Survey (SASS):
http://nces.ed.gov/surveys/sass/tables/sass0708_006_t1n.asp 2.K. U.S. Department of Education, National Center for Education Statistics, Schools and Staffing Survey (SASS)
Explanation and Analysis of Progress: Measures 2B-2I will establish a baseline using FY 2010 and 2011 data. Measures 2A, 2J, and 2K have existing data prior to FY 2011. Data for measures 2C-2K are reported by the Department and measures 2A and 2B include data that are reported by a non-federal organization. Data for measures 2D-2H are collected from states or grantees. Data for measure 2J and 2K are reported by the National Center for Education Statistics. Data for measures 2A-2K are most influenced by actions taken by local educational agencies or grantees in response to state and federal policy initiatives, but also are influenced by factors that are beyond the control of the local educational agencies, the states, or the Department.
Developing appropriate assessment instruments and approaches for very young children poses significant challenges, especially for children from low-income families, children who are English learners, and children with disabilities. Developing and administering the next generation of assessments and supporting teachers through training related to the new standards will require continuing financial support. As teacher and school leader evaluation systems and compensation decisions are governed by state and local policies, without revisions in state policies and new partnerships with teacher organizations, reforms of existing evaluation and compensation systems are unlikely to be successful.
PERFORMANCE DETAILS
20 FY 2011 Annual Performance Report—U.S. Department of Education
Goal 3. Early Learning:
Improve the health, social-emotional, and cognitive outcomes for all children from birth through 3rd grade, so that all children,
particularly those with high needs, are on track for graduating from high school college- and career-ready.
Overview
The Department’s strategy for sustaining the President’s 2020 college attainment goal depends on improving learning in the earliest years. Participation in high-quality early learning programs will lead to both short- and long-term positive outcomes for all children, including increased school readiness and success and improved high school graduation and college attendance and completion rates.
Developing our nation’s educational pipeline requires increasing both access to and the quality of early learning programs and services. This is particularly important for children with high needs, including Children with Disabilities and English learners, since these children have less access to high-quality early learning programs, and often enter kindergarten behind their peers.
In 2006–07, only 41 percent of three- to five-year-olds from low-income families were enrolled in center-based early childhood care and education programs, compared to 60 percent from families above the poverty line.
The Department prioritizes improving the health, social-emotional, cognitive, and educational outcomes for young children from birth through third grade by enhancing the quality of early learning programs, and increasing the access to high-quality early learning programs—especially for young children at risk for school failure.
The Department’s role in promoting early learning is significant and includes: administering several early learning programs; collaborating and coordinating early learning programs, research, and technical assistance with the U.S. Department of Health and Human Services; encouraging states and local school districts to target resources for early learning; promoting state and local education agency partnerships with other early learning agencies and programs in the state or community; conducting research on early learning; funding technical assistance on early learning domains, including early literacy and social-emotional development; and supporting the development of state longitudinal data systems that include early learning programs.

PERFORMANCE DETAILS
FY 2011 Annual Performance Report—U.S. Department of Education 21
Goal 3: Details
Early Learning Indicators of Success
Results
FY 2007 FY 2008 FY 2009 FY 2010 FY 2011
Actual Actual Actual Actual Actual 3.A. Increase in the number of states implementing a high-quality plan to collect and report disaggregated data on the status of children at kindergarten entry across a broad range of domains*
NA NA NA NA 2
3.B. Increase in the number of states that have developed and adopted common, statewide Tiered Quality Rating and Improvement Systems that reflect high expectations of program excellence and lead to improved learning outcomes for children
NA NA NA NA Estab. BL
3.C. Increase in the number of states that have statewide coordinated systems of professional development for early childhood educators serving children birth through third grade
NA NA NA NA Estab. BL
3.D. Increase in the number of states implementing a Comprehensive Assessment System that includes screening and referral processes, formative measures, kindergarten entry assessments, measures of classroom quality and adult-child interactions, measures of child outcomes, and program evaluation
NA NA NA NA Estab. BL
* This indicator of success aligns with a Department Priority Goal. NA = No data available for the period Sources: 3.A. U.S. Department of Education, Program and Policy Studies Service 3.B. U.S. Department of Health and Human Services (HHS) Child Care and Development Fund (CCDF) state plans, other
publicly available data sources (Web searches) 3.C. U.S. Department of Health and Human Services (HHS) Child Care and Development Fund (CCDF) state plans 3.D. Race to the Top – Early Learning Challenge Program data
Explanation and Analysis of Progress: Measures 3A-3D will establish a baseline using FY 2011 data. Data for measures 3A and 3D are collected from states or grantees and reported by the Department and measures 3B and 3C include data that are reported by a non-federal organization. Data for measures 3A-3D are influenced most by actions taken by state educational agencies or grantees in response to state and federal policy initiatives, but also are influenced by factors that are beyond the control of the local educational agencies, the states, or the Department.

PERFORMANCE DETAILS
22 FY 2011 Annual Performance Report—U.S. Department of Education
Goal 4. Equity:
Ensure effective educational opportunities for all students regardless of race, ethnicity, national origin, age, sex, disability,
language, and socioeconomic status.
Overview
All students—regardless of circumstance—deserve a world-class education. Yet far too often, the quality of a child’s education, and the opportunities that the child has to succeed are determined by his or her background or status.
To ensure that America has the best-educated population, with the most competitive workforce and the highest proportion of college graduates of any country in the world, we must close the pervasive achievement and attainment gaps that exist in our nation.
A key federal role in education is to ensure that all students have opportunities to learn and excel by closing the gap between high-need students and their more advantaged peers in access to opportunities and resources. As it is at the core of the Department’s mission, addressing issues of equity are addressed in the goals already listed (Postsecondary Education, Career and Technical Education, and Adult Education; Elementary and Secondary; and Early Learning).
The Department will ensure that equity is embedded throughout its initiatives, and will vigorously enforce the federal civil rights laws to ensure students are free from discrimination in our nation’s schools and colleges.
The Department of Education enforces federal civil rights laws that prohibit discrimination on the basis of race, color, national origin, sex, disability and age in our nation’s schools—primarily in educational institutions that receive federal funds from the Department. In addition, the Department ensures that the Boy Scouts of America and other designated youth groups have equal access to meeting space in elementary and secondary schools that receive funds through the Department.
The Office for Civil Rights, a law enforcement agency within the Department, performs the Department’s civil rights enforcement responsibilities in a variety of ways, including: investigating complaints alleging discrimination; conducting compliance reviews to determine whether educational institutions are meeting their legal obligations; and providing technical assistance to help educational institutions understand how to comply with the laws and to inform parents and students of their legal rights.
The Department also issues regulations on civil rights laws, develops policy guidance interpreting the laws, and distributes the information broadly.

PERFORMANCE DETAILS
FY 2011 Annual Performance Report—U.S. Department of Education 23
Goal 4: Details
Equity Indicators of Success*
Results
FY 2007 FY 2008 FY 2009 FY 2010 FY 2011
Actual Actual Actual Actual Actual 4.A. Increase in the combined annual number of significant proactive and outreach activities related to civil rights enforcement (new policy documents, compliance reviews, and technical assistance activities)
NA NA NA NA Estab. BL
* In addition to the measure below, other measures tracking Equity Indicators of Success are shared across goals, including: Measures 1A and 1B, FAFSAs among low-income and non-traditional students; measure 2H, monitoring of School Improvement Grants; measure 3A, states implementing high-quality early education plans; measure 5C, percentage of state report cards addressing specific metrics; measure 5G, Departmental priorities to address equity-related issues in grants and awards; and measure 6F, student access data. NA = No data available for the period Source: 4.A. U.S. Department of Education, Office for Civil Rights.
Explanation and Analysis of Progress: Measure 4A will establish a baseline using FY 2011 data. Data for measure 4A are collected and reported by the Department. Data for measure 4A are most influenced by actions taken by the Department, but also are influenced by factors that are beyond the control of the Department. Equity-focused efforts could be held back because of differences in availability of funding at the state and local levels, and the fact that state and local resources are often not targeted at the highest-need students.
PERFORMANCE DETAILS
24 FY 2011 Annual Performance Report—U.S. Department of Education
Goal 5. Continuous Improvement of the U.S. Education System:
Enhance the education system’s ability to continuously improve through better and more widespread use of data, research and
evaluation, transparency, innovation, and technology.
Overview
Achieving the President’s 2020 college attainment goal will require better and stronger data, research, and evaluation systems, powered by information and innovation. The Department aims to foster a culture of continuous system improvement at the national, state, and local levels. To achieve this goal, the Department will support robust and comprehensive data systems; a strategic use of research and evaluation; transparency in sharing results; increased flexibility and innovation; and effective and systemic use of technology.
In May 2010, the Department launched a new agency-wide evaluation planning process to better align its investments in knowledge building with the Department’s strategic plan and its budget and policy priorities and to support appropriate resource allocation.
The process—led jointly by the Department’s Office of Planning, Evaluation and Policy Development (OPEPD) and the Institute of Education Sciences (IES)—was developed to identify the Department’s key priorities for evaluations that can provide reliable measures of the impacts of programs, policies, and strategies, as well as for a range of research and evaluation activities that build knowledge important to inform policy and practice more broadly (e.g., performance measurement, grantee evaluation, and support).
This planning process includes regular discussions with program and policy offices within the Department and reviews of existing research and recent and ongoing evaluation investments in the Department. While the planning process is informed by the knowledge generated through the Department’s investments in long term programs of research, it focuses on knowledge building activities initiated and carried out by the Department.
In FY 2011, the Department developed and approved a set of priority research questions that will help shape its future investments in knowledge building. Planning for FY 2011 investments was completed this spring and planning for FY 2012 is underway. The evaluation planning process consists of the evaluation planning team meeting with the Department’s policy and program offices and based on their input, developing recommendations for the evaluation activities the Department will support.

PERFORMANCE DETAILS
FY 2011 Annual Performance Report—U.S. Department of Education 25
Goal 5: Details
Continuous Improvement of the U.S. Education System Indicators of Success
Results
FY 2007 FY 2008 FY 2009 FY 2010 FY 2011
Actual Actual Actual Actual Actual
5.A. Increase in the number of states implementing comprehensive statewide longitudinal data systems*
Link students with teachers
NA NA 30 36 41
Link P-12 with college
NA NA 28 34 40
5.B. Increase in the number of high-value datasets that are published through data.gov or ED.gov websites
NA NA NA NA 9
5.C. Increase in the percentage of state report cards that include student achievement, school climate, college enrollment, and teacher and school leader measures
NA NA NA NA Estab. BL
5.D. Increase in the number of Department programs with awards made based on the strength of the evidence (strong or moderate) provided in grant applications
NA NA NA 1 5
5.E. Increase in the number of Department programs, practices, or strategies that are adopted as a result of Scale Up, Validation, or Development grants
NA NA NA NA Estab. BL
5.F. Increase in the percentage of parents and teachers who believe that the effective implementation of technology within instruction is important to student success
Parents NA NA NA NA 52%
Teachers NA NA NA NA 37%
5.G. Increase Departmental priorities to address equity-related issues in the Department’s grants and awards
NA NA NA NA Estab. BL
* This indicator of success aligns with a Department Priority Goal. NA = No data available for the period Sources: 5.A. http://nces.ed.gov/programs/slds/pdf/features_summary.pdf 5.B. www.data.gov or www.data.ed.gov 5.C. Search of report cards on state educational agency websites 5.D. Department of Education program office spending plans 5.E. Investing in Innovation Fund grantee reports 5.F. Speak Up for K12, http://www.tomorrow.org/speakup; Project Tomorrow Teacher Survey 5.G. U.S. Department of Education, internal analysis.

PERFORMANCE DETAILS
26 FY 2011 Annual Performance Report—U.S. Department of Education
Explanation and Analysis of Progress: Measures 5B, 5C, 5E, 5F, and 5G will establish a baseline using FY 2011 data. Measures 5A and 5D have existing data prior to FY 2011. Data for measures 5C and 5E are collected from states or grantees. Data for measures 5B, 5D, and 5G are collected and reported by the Department. Data for measure 5A are reported by the National Center for Education Statistics. Data for measure 5F are reported by a non-federal organization.
Data for measures 5B, 5D, and 5G are most influenced by actions taken by the Department, but also are influenced by factors that are beyond the control of the Department. Data for measures 5A, 5C, 5E, and 5F are most influenced by actions taken by local educational agencies or grantees in response to state and federal policy initiatives, but also are influenced by factors that are beyond the control of the local educational agencies, the states, or the Department.
Efforts to develop robust, integrated data systems will be constrained by the amount of time, financial resources, and support available to states and local educational agencies. Wide variations in state and district data systems present unique challenges for each state. Some district data systems, for example, far surpass their own state’s data system. Efforts to ensure that data systems lead to data-driven decision-making also need to address privacy concerns.

PERFORMANCE DETAILS
FY 2011 Annual Performance Report—U.S. Department of Education 27
Goal 6. U.S. Department of Education Capacity:
Improve the organizational capacities of the Department to implement this Strategic Plan.
Overview
The Department must retool its organizational capabilities and areas of expertise. In particular, transforming the Department means developing a new approach to grants management that better supports grantees in achieving their educational goals, while also continuing to hold grantees accountable for meeting financial requirements and legal obligations.
To do so, the Department will continue to:
build the skills and knowledge of its workforce, and rethink how it monitors and intervenes with high-risk grantees;
enhance workforce productivity through information technology and performance management;
recruit a diverse workforce that reflects the diversity of our students in public schools; and
transform the way the Department interacts on a day-to-day basis with states, districts, institutions of higher education, and other grantees across the country.
The results of this transformation will be demonstrated by improved performance results, increased stakeholder collaboration, and higher satisfaction among employees.

PERFORMANCE DETAILS
28 FY 2011 Annual Performance Report—U.S. Department of Education
Goal 6: Details
U.S. Department of Education Capacity
Indicators of Success
Results
FY 2007 FY 2008 FY 2009 FY 2010 FY 2011
Actual Actual Actual Actual Actual 6.A. Increase in the Department’s rank in the report on the Best Places to Work (BPTW) in the Federal Government
28 out of 30 NA 27
out of 30 30
out of 32 29
out of 33
6.B. Increase in the percentage of Department’s positive responses that the Department receives on the Talent Management measure in the Federal Viewpoint Survey
NA 58% 54% 54% 58%
6.C. Increase in the percentage of positive responses that the Department receives on the Performance Culture measure in the Federal Viewpoint Survey
49% 52% 50% 52% 53%
6.D. Increase in the percentage of Department programs that use a risk index and corresponding solutions for identifying and mitigating grantee risk
NA NA NA NA Estab. BL
6.E. Increase in the percentage of states and other grantees reporting satisfaction with support provided by the Department
CSI: 63 CSI: 65 CSI: 68 CSI: 72 CSI: 72
6.F. Increase in the availability of data related to student access to resources and opportunities to succeed, such as disaggregated student access to college- and career-ready math and science courses; disparate discipline rates, school-based arrests, and referrals to law enforcement; and school-level expenditures
NA NA NA NA Estab. BL
CSI = Customer Satisfaction Index NA = No data available for the period Sources: 6.A. Best Places to Work Survey (http://bestplacestowork.org/BPTW/rankings/) 6.B. Federal Viewpoint Survey 6.C. Federal Viewpoint Survey 6.D. U.S. Department of Education, Risk Management Service 6.E. Overall score on the Department’s annual Grantee Satisfaction survey 6.F. U.S. Department of Education, Civil Rights Data Collection
Explanation and Analysis of Progress: Data from measure 6A are from a non-federal source. Measures 6D and 6Fwill establish a baseline using FY 2011 data. Measures 6A, 6B, 6C, and 6E have existing data prior to FY 2011. Data for all other measures are collected and reported by the Department.
Human capital initiatives require support from the Department’s supervisors, managers, and senior leaders, as well as updates to internal policies. In addition, the Department will need a stronger, sustained commitment to meaningful professional development and succession planning programs, and implementation of new technology to support improved collaboration among staff. Maximizing the impact of the Department’s human capital and funding resources is limited by several factors, including the need for timely data for analysis.

PERFORMANCE DETAILS
FY 2011 Annual Performance Report—U.S. Department of Education 29
Risk is inherent in the grants management process; risk is greater in areas of innovation, where there are fewer precedents, proven strategies, or track records upon which to draw in the assessment and management of risk; and data limitations also can impede the Department’s efforts in managing risk.

PERFORMANCE DETAILS
30 FY 2011 Annual Performance Report—U.S. Department of Education

Appendices

APPENDICES
32 FY 2011 Annual Performance Report—U.S. Department of Education
Appendix A: Performance Results for Discontinued Measures
Strategic Plan Comparison
FY 2007–2012 Strategic Plan FY 2011–2014 Draft Strategic Plan
Mission: Promote student achievement and preparation for global competitiveness by fostering educational excellence and ensuring equal access
Mission: Promote student achievement and preparation for global competitiveness by fostering educational excellence and ensuring equal access
Goal 1: Improve student achievement, with a focus on bringing all students to grade level in reading and mathematics by 2014
Goal 2: Elementary and Secondary: Prepare all elementary and secondary students for college and career by improving the education system’s ability to consistently deliver excellent classroom instruction with rigorous academic standards while providing effective support services.
Goal 3: Early Learning: Improve the health, social-emotional, and cognitive outcomes for all children from birth through 3rd grade, so that all children, particularly those with high needs, are on track for graduating from high school college- and career-ready.
Goal 4: Equity: Ensure effective educational opportunities for all students regardless of race, ethnicity, national origin, age, sex, disability, language, and socioeconomic status.
Goal 5: Continuous Improvement of the U.S. Education System: Enhance the education system’s ability to continuously improve through better and more widespread use of data, research and evaluation, transparency, innovation, and technology.
Goal 2: Increase the academic achievement of all high school students
Goal 2: Elementary and Secondary: Prepare all elementary and secondary students for college and career by improving the education system’s ability to consistently deliver excellent classroom instruction with rigorous academic standards while providing effective support services.
Goal 4: Equity: Ensure effective educational opportunities for all students regardless of race, ethnicity, national origin, age, sex, disability, language, and socioeconomic status.
Goal 5: Continuous Improvement of the U.S. Education System: Enhance the education system’s ability to continuously improve through better and more widespread use of data, research and evaluation, transparency, innovation, and technology.
Goal 3: Ensure the accessibility, affordability, and accountability of higher education and better prepare students and adults for employment and future learning
Goal 1: Postsecondary Education, Career and Technical Education, and Adult Education: Increase college access, quality, and completion by improving higher education and lifelong learning opportunities for youth and adults.
Goal 4: Equity: Ensure effective educational opportunities for all students regardless of race, ethnicity, national origin, age, sex, disability, language, and socioeconomic status.
Goal 5: Continuous Improvement of the U.S. Education System: Enhance the education system’s ability to continuously improve through better and more widespread use of data, research and evaluation, transparency, innovation, and technology.
Management Goal: Cross-Goal Strategy on Management Goal 6: U.S. Department of Education Capacity: Improve the organizational capacities of the Department to implement this Strategic Plan.

APPENDICES
PERFORMANCE RESULTS FOR DISCONTINUED MEASURES
* Not met but improved over prior years
Notes
Actuals and Targets updated based on most recent data. ―Met‖ includes all measures met or exceeded.
FY 2011 Annual Performance Report—U.S. Department of Education 33
Performance Results Summary for Discontinued Measures Fiscal Year
Target Actual Status
Strategic Goal 1—Improve student achievement, with a focus on bringing all students to grade level in reading and mathematics by 2014
1.1. Improve student achievement in reading
A. Percentage of all students who achieve proficiency on state reading assessments
FY 2010 84.2% 72.2% Not Met
B. Percentage of low-income students who achieve proficiency on state reading assessments
FY 2010 77.7% 61.4% Not Met*
C. Percentage of American Indian/Alaska Native students who achieve proficiency on state reading assessments
FY 2010 80.1% 61.1% Not Met*
D. Percentage of African American students who achieve proficiency on state reading assessments
FY 2010 77.8% 60.9% Not Met
E. Percentage of Hispanic students who achieve proficiency on state reading assessments
FY 2010 76.0% 59.9% Not Met*
F. Percentage of students with disabilities who achieve proficiency on state reading assessments
FY 2010 69.4% 43.9% Not Met*
G. Percentage of Limited English Proficient students who achieve proficiency on state reading assessments
FY 2010 69.9% 40.7% Not Met*
H. Percentage of career and technical education concentrators meeting reading/language arts standards
FY 2010 69.0% 75.0% Met
1.2. Improve student achievement in mathematics
A. Percentage of all students who achieve proficiency on state mathematics assessments
FY 2010 82.5% 71.7% Not Met*
B. Percentage of low-income students who achieve proficiency on state mathematics assessments
FY 2010 76.2% 61.6% Not Met*
C. Percentage of American Indian/Alaska Native students who achieve proficiency on state mathematics assessments
FY 2010 76.6% 56.9% Not Met*
D. Percentage of African American students who achieve proficiency on state mathematics assessments
FY 2010 74.4% 59.2% Not Met*
E. Percentage of Hispanic students who achieve proficiency on state mathematics assessments
FY 2010 75.9% 61.2% Not Met*
F. Percentage of students with disabilities who achieve proficiency on state mathematics assessments
FY 2010 68.9% 46.3% Not Met*
G. Percentage of Limited English Proficient students who achieve proficiency on state mathematics assessments
FY 2010 71.7% 50.9% Not Met*
H. Percentage of career and technical education concentrators meeting mathematics standards
FY 2010 63.0% 71.0% Met
1.3. Improve teacher quality
A. Percentage of total core academic classes taught by highly qualified teachers
FY 2010 100.0% 96.7% Not Met*
B. Percentage of total core elementary classes taught by highly qualified teachers
FY 2010 100.0% 97.7% Not Met*
C. Percentage of core elementary classes in high-poverty schools taught by highly qualified teachers
FY 2010 100.0% 97.0% Not Met*
D. Percentage of core elementary classes in low-poverty schools taught by highly qualified teachers
FY 2010 100.0% 97.7% Not Met*
E. Percentage of total core secondary classes taught by highly qualified teachers
FY 2010 100.0% 95.8% Not Met*
F. Percentage of core secondary classes in high-poverty schools taught by highly qualified teachers
FY 2010 100.0% 94.1% Not Met*
G. Percentage of core secondary classes in low-poverty schools taught by highly qualified teachers
FY 2010 100.0% 97.2% Not Met*

APPENDICES
PERFORMANCE RESULTS FOR DISCONTINUED MEASURES
* Not met but improved over prior years
Notes
Actuals and Targets updated based on most recent data. ―Met‖ includes all measures met or exceeded.
34 FY 2011 Annual Performance Report—U.S. Department of Education
Performance Results Summary for Discontinued Measures Fiscal Year
Target Actual Status
1.4. Promote safe, disciplined and drug-free learning environments
A. Percentage of students in grades 9 through 12 who carried a weapon (such as a knife, gun, or club) on school property one or more times during the past 30 days
FY 2009 4.0% 5.6% Not met*
B. Percentage of students in grades 9 through 12 who missed one or more days of school during the past 30 days because they felt unsafe at school, or on their way to and from school
FY 2009 5.0% 5.0% Met
C. Percentage of students in grades 9 through 12 who were offered, given, or sold an illegal drug by someone on school property in the past year
FY 2009 26.0% 22.7% Met
1.5. Increase information and options for parents
A. Percentage of eligible students exercising choice FY 2008 2.4% 2.3% Not met
B. Percentage of eligible students participating in supplemental educational services
FY 2009 18.2% 15.6% Not met*
C. Number of charter schools in operation FY 2010 5,190 4,958 Not met*
1.6. Increase high school completion rate
A. Percentage of total 18–24-year-olds who have completed high school
FY 2009 87.6% 89.8% Met
B. Percentage of African American 18–24-year-olds who have completed high school
FY 2009 85.8% 87.1% Met
C. Percentage of Hispanic 18–24-year-olds who have completed high school
FY 2009 70.6% 76.8% Met
D. Averaged freshman graduation rate FY 2009 77.9% 75.5% Not met
1.7. Transform education into an evidence-based field
A. Number of Department-supported reading or writing programs and practices with evidence of efficacy using What Works Clearinghouse standards
FY 2010 15 15 Met
B. Number of Department-supported mathematics or science programs and practices with evidence of efficacy using What Works Clearinghouse standards
FY 2010 12 15 Met
C. Number of Department-supported teacher quality programs and practices with evidence of efficacy using What Works Clearinghouse standards
FY 2010 10 10 Met
D. Number of visits to the What Works Clearinghouse Web site FY 2010 641,000 919,883 Met
Sources 1.1.A.–1.1.G. Consolidated State Performance Reports. 1.1.H. U.S. Department of Education, Office of Vocational and Adult Education, Consolidated Annual
Performance, Accountability, and Financial Status Report (CAR) (grantee performance report). 1.2.A.–1.2.G. Consolidated State Performance Reports. 1.2.H. U.S. Department of Education, Office of Vocational and Adult Education, Consolidated Annual
Performance, Accountability, and Financial Status Report (CAR) (grantee performance report). 1.3.A.–1.3.G. Consolidated State Performance Reports. 1.4.A.–1.4.C. Centers for Disease Control and Prevention. Youth Risk Behavior Surveillance – United States, 2009.
Surveillance Summaries. MMWR 2010;59(No. SS-5). 1.5.A.–1.5.C. Consolidated State Performance Reports.
1.6.A.–1.6.C. U.S. Department of Commerce, Census Bureau, October Current Population Survey. Data are collected annually.
1.6.D. U.S. Department of Education, National Center for Education Statistics, Common Core of Data, State Non-fiscal Survey of Public Elementary/Secondary Education. Data are collected annually.
1.7.A.–1.7.C Grantees send journal articles or fully prepared manuscripts describing evaluations of specific interventions to the U.S. Department of Education, Institute of Education Sciences.
1.7.D. U.S. Department of Education, Institute of Education Sciences.

APPENDICES
PERFORMANCE RESULTS FOR DISCONTINUED MEASURES
* Not met but improved over prior years
Notes
Actuals and Targets updated based on most recent data. ―Met‖ includes all measures met or exceeded.
FY 2011 Annual Performance Report—U.S. Department of Education 35
Performance Results Summary for Discontinued Measures Fiscal Year
Target Actual Status
Strategic Goal 2—Increase the academic achievement of all high school students
2.1. Increase the proportion of high school students taking a rigorous curriculum
A. Percentage of low-income students who qualify for Academic Competitiveness Grants
FY 2009 49% 41% Not met*
B. Number of Advanced Placement classes available nationwide
No data No data
C. Number of Advanced Placement tests taken by all public school students
FY 2009 2,406,000 2,495,252 Met
D. Number of Advanced Placement tests taken by low-income public school students
FY 2009 378,272 387,986 Met
E. Number of Advanced Placement tests taken by minority (Black, Hispanic, Native American) public school students
FY 2009 544,716 538,249 Not met*
F. Number of teachers trained through Advanced Placement Incentive grants to teach Advanced Placement classes
No data No data
2.2. Promote advanced proficiency in mathematics and science for all students
A. Number of Advanced Placement tests in mathematics and science taken nationwide by all public school students
FY 2009 736,000 734,425 Not met*
B. Number of Advanced Placement tests in mathematics and science taken nationwide by low-income public school students
FY 2009 76,000 91,927 Met
C. Number of Advanced Placement tests in mathematics and science taken nationwide by minority (Black, Hispanic, Native American) public school students
FY 2009 94,171 111,532 Met
D. Number of teachers trained through Advanced Placement Incentive grants to teach Advanced Placement classes in mathematics and science
No data No data
2.3. Increase proficiency in critical foreign languages
A. Combined total number of Advanced Placement and International Baccalaureate tests in critical foreign languages passed by public school students
FY 2009 4,638 4,642 Met
Sources 2.1.A. Pell Grant End of Year Report; Academic Competitiveness Grant (ACG)/National SMART Grant
Programs End of Year Report; Pell Grant Merged Applicant and Recipient File. 2.1.B. 2.1.C.–2.1.E The College Board, Freeze File Report. Data are reported annually. 2.1.F. 2.2.A.–2.2.C. The College Board, Freeze File Report. Data are reported annually. 2.2.D. 2.3.A. The College Board, Freeze File Report. Data are reported annually. International Baccalaureate North
America, Examination Review and Data Summary. Data are reported annually.

APPENDICES
PERFORMANCE RESULTS FOR DISCONTINUED MEASURES
* Not met but improved over prior years
Notes
Actuals and Targets updated based on most recent data. ―Met‖ includes all measures met or exceeded.
36 FY 2011 Annual Performance Report—U.S. Department of Education
Performance Results Summary for Discontinued Measures Fiscal Year
Target Actual Status
Strategic Goal 3—Ensure the accessibility, affordability and accountability of higher education and better prepare students and adults for employment and future learning
3.1. Increase success in and completion of quality postsecondary education
A. Percentage of high school graduates aged 16–24 enrolling immediately in college
FY 2010 69.0% 70.1% Met
B. Percentage of Upward Bound participants enrolling in college
FY 2009 75.0% 83.0% Met
C. Percentage of career and technical education concentrators retained in postsecondary education or transferring to a baccalaureate degree program who have transitioned to postsecondary education or employment by December of the year of graduation
FY 2010 58.0% 72.0% Met
D. Percentage of full-time degree-seeking undergraduate students at Title IV institutions who were in their first year of postsecondary enrollment in the previous year and are enrolled in the current year at the same institution
FY 2010 72.0% 72.5% Met
E. Percentage of full-time degree-seeking undergraduate students at Historically Black Colleges and Universities who were in their first year of postsecondary enrollment in the previous year and are enrolled in the current year at the same institution
FY 2010
68.0%-4yr,
57.0%-2yr
68.0%-4yr,
53.0%-2yr
Met
Not met
F. Percentage of full-time degree-seeking undergraduate students at Hispanic-Serving Institutions who were in their first year of postsecondary enrollment in the previous year and are enrolled in the current year at the same institution
FY 2010
78.0%-4yr,
64.0%-2yr
77.0%-4yr,
58.0%-2yr
Not met
G. Percentage of students enrolled at all Title IV institutions completing a four-year degree within six years of enrollment
FY 2009 57.0% 57.4% Met
H. Percentage of freshmen participating in Student Support Services who complete an associate’s degree at original institution or transfer to a four-year institution within three years
FY 2010 28.0% 36.0% Met
I. Percentage of first-time full-time degree-seeking undergraduate students enrolled at 4-year Historically Black Colleges and Universities graduating within six years of enrollment
FY 2010 40.0% 34.0% Not met
J. Percentage of first-time, full time degree seeking students enrolled at 4-year Hispanic-Serving Institutions graduating within six years of enrollment
FY 2010 45.0% 41.0% Not met
K. Percentage of postsecondary career and technical education students who have completed a postsecondary degree or an industry-recognized credential, certificate, or degree
FY 2010 56.0% 53.0% Not met
3.2. Deliver student financial aid to students and parents effectively and efficiently
A. Direct administrative unit costs for origination and disbursement of student aid (total cost per transaction)
FY 2010 $3.76 $3.35 Met
B. Customer service level on the American Customer Satisfaction Index for the Free Application for Federal Student Aid (FAFSA) on the Web
FY 2011 85 points 89 points Met
C. Pell Grant improper payments rate FY 2011 3.28% 2.72% Met
D. Direct Loan recovery rate FY 2011 20.5% 16.2% Not met
E. Federal Family Education Loan recovery rate FY 2011 20.25% 27.70% Met
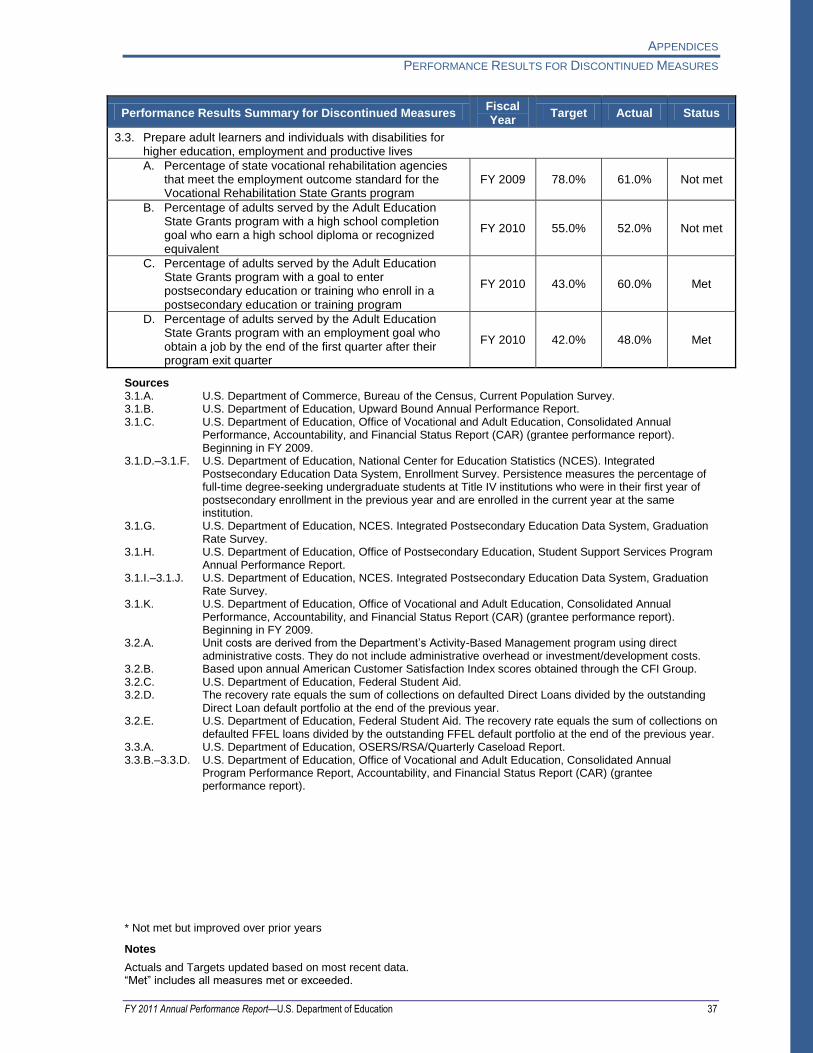
APPENDICES
PERFORMANCE RESULTS FOR DISCONTINUED MEASURES
* Not met but improved over prior years
Notes
Actuals and Targets updated based on most recent data. ―Met‖ includes all measures met or exceeded.
FY 2011 Annual Performance Report—U.S. Department of Education 37
Performance Results Summary for Discontinued Measures Fiscal Year
Target Actual Status
3.3. Prepare adult learners and individuals with disabilities for higher education, employment and productive lives
A. Percentage of state vocational rehabilitation agencies that meet the employment outcome standard for the Vocational Rehabilitation State Grants program
FY 2009 78.0% 61.0% Not met
B. Percentage of adults served by the Adult Education State Grants program with a high school completion goal who earn a high school diploma or recognized equivalent
FY 2010 55.0% 52.0% Not met
C. Percentage of adults served by the Adult Education State Grants program with a goal to enter postsecondary education or training who enroll in a postsecondary education or training program
FY 2010 43.0% 60.0% Met
D. Percentage of adults served by the Adult Education State Grants program with an employment goal who obtain a job by the end of the first quarter after their program exit quarter
FY 2010 42.0% 48.0% Met
Sources 3.1.A. U.S. Department of Commerce, Bureau of the Census, Current Population Survey. 3.1.B. U.S. Department of Education, Upward Bound Annual Performance Report. 3.1.C. U.S. Department of Education, Office of Vocational and Adult Education, Consolidated Annual
Performance, Accountability, and Financial Status Report (CAR) (grantee performance report). Beginning in FY 2009.
3.1.D.–3.1.F. U.S. Department of Education, National Center for Education Statistics (NCES). Integrated Postsecondary Education Data System, Enrollment Survey. Persistence measures the percentage of full-time degree-seeking undergraduate students at Title IV institutions who were in their first year of postsecondary enrollment in the previous year and are enrolled in the current year at the same institution.
3.1.G. U.S. Department of Education, NCES. Integrated Postsecondary Education Data System, Graduation Rate Survey.
3.1.H. U.S. Department of Education, Office of Postsecondary Education, Student Support Services Program Annual Performance Report.
3.1.I.–3.1.J. U.S. Department of Education, NCES. Integrated Postsecondary Education Data System, Graduation Rate Survey.
3.1.K. U.S. Department of Education, Office of Vocational and Adult Education, Consolidated Annual Performance, Accountability, and Financial Status Report (CAR) (grantee performance report). Beginning in FY 2009.
3.2.A. Unit costs are derived from the Department’s Activity-Based Management program using direct administrative costs. They do not include administrative overhead or investment/development costs.
3.2.B. Based upon annual American Customer Satisfaction Index scores obtained through the CFI Group. 3.2.C. U.S. Department of Education, Federal Student Aid. 3.2.D. The recovery rate equals the sum of collections on defaulted Direct Loans divided by the outstanding
Direct Loan default portfolio at the end of the previous year. 3.2.E. U.S. Department of Education, Federal Student Aid. The recovery rate equals the sum of collections on
defaulted FFEL loans divided by the outstanding FFEL default portfolio at the end of the previous year. 3.3.A. U.S. Department of Education, OSERS/RSA/Quarterly Caseload Report. 3.3.B.–3.3.D. U.S. Department of Education, Office of Vocational and Adult Education, Consolidated Annual
Program Performance Report, Accountability, and Financial Status Report (CAR) (grantee performance report).
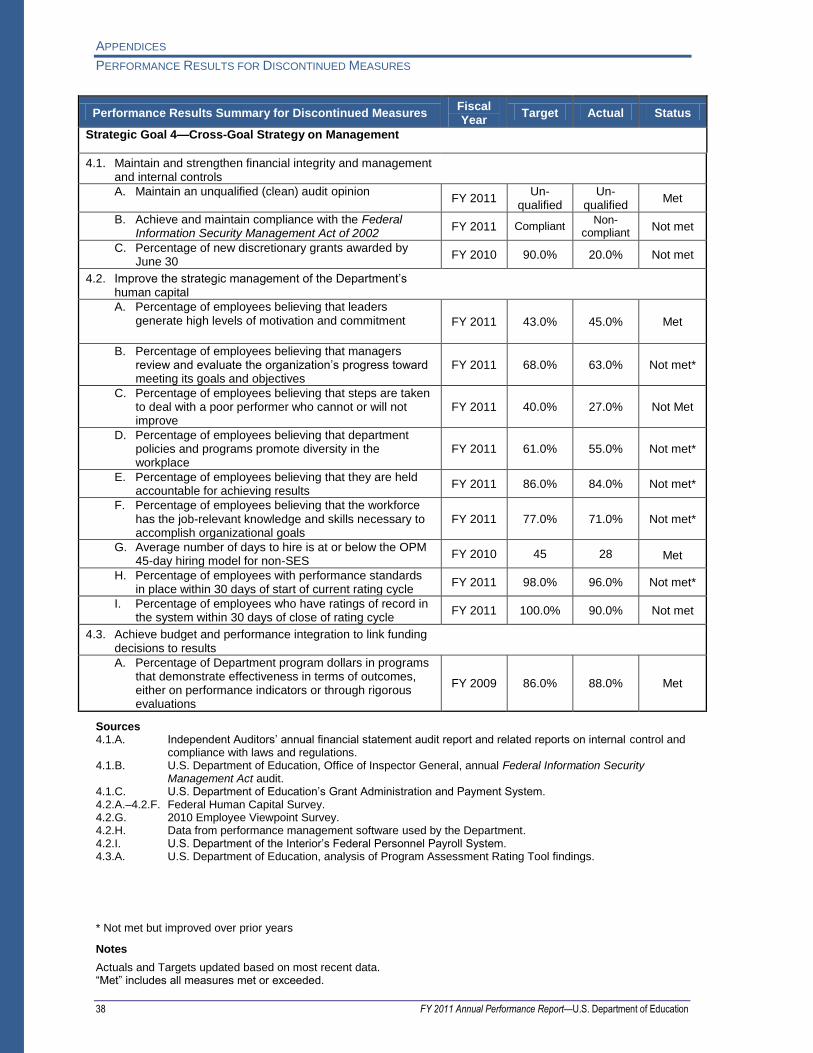
APPENDICES
PERFORMANCE RESULTS FOR DISCONTINUED MEASURES
* Not met but improved over prior years
Notes
Actuals and Targets updated based on most recent data. ―Met‖ includes all measures met or exceeded.
38 FY 2011 Annual Performance Report—U.S. Department of Education
Performance Results Summary for Discontinued Measures Fiscal Year
Target Actual Status
Strategic Goal 4—Cross-Goal Strategy on Management
4.1. Maintain and strengthen financial integrity and management and internal controls
A. Maintain an unqualified (clean) audit opinion FY 2011
Un-qualified
Un-qualified
Met
B. Achieve and maintain compliance with the Federal Information Security Management Act of 2002
FY 2011 Compliant Non-
compliant Not met
C. Percentage of new discretionary grants awarded by June 30
FY 2010 90.0% 20.0% Not met
4.2. Improve the strategic management of the Department’s human capital
A. Percentage of employees believing that leaders generate high levels of motivation and commitment FY 2011 43.0% 45.0% Met
B. Percentage of employees believing that managers review and evaluate the organization’s progress toward meeting its goals and objectives
FY 2011 68.0% 63.0% Not met*
C. Percentage of employees believing that steps are taken to deal with a poor performer who cannot or will not improve
FY 2011 40.0% 27.0% Not Met
D. Percentage of employees believing that department policies and programs promote diversity in the workplace
FY 2011 61.0% 55.0% Not met*
E. Percentage of employees believing that they are held accountable for achieving results
FY 2011 86.0% 84.0% Not met*
F. Percentage of employees believing that the workforce has the job-relevant knowledge and skills necessary to accomplish organizational goals
FY 2011 77.0% 71.0% Not met*
G. Average number of days to hire is at or below the OPM 45-day hiring model for non-SES
FY 2010 45 28 Met
H. Percentage of employees with performance standards in place within 30 days of start of current rating cycle
FY 2011 98.0% 96.0% Not met*
I. Percentage of employees who have ratings of record in the system within 30 days of close of rating cycle
FY 2011 100.0% 90.0% Not met
4.3. Achieve budget and performance integration to link funding decisions to results
A. Percentage of Department program dollars in programs that demonstrate effectiveness in terms of outcomes, either on performance indicators or through rigorous evaluations
FY 2009 86.0% 88.0% Met
Sources 4.1.A. Independent Auditors’ annual financial statement audit report and related reports on internal control and
compliance with laws and regulations. 4.1.B. U.S. Department of Education, Office of Inspector General, annual Federal Information Security
Management Act audit. 4.1.C. U.S. Department of Education’s Grant Administration and Payment System. 4.2.A.–4.2.F. Federal Human Capital Survey. 4.2.G. 2010 Employee Viewpoint Survey. 4.2.H. Data from performance management software used by the Department. 4.2.I. U.S. Department of the Interior’s Federal Personnel Payroll System. 4.3.A. U.S. Department of Education, analysis of Program Assessment Rating Tool findings.

APPENDICES
FY 2011 Annual Performance Report—U.S. Department of Education 39
Appendix B1: Summary of Inspector General and
Government Accountability Office Reports
For all Department of Education Inspector General reports for FY 2011, please visit the Inspector General’s website at http://www2.ed.gov/about/offices/list/oig/reports.html.
For Government Accountability Office reports on education for FY 2011, please visit GAO’s website at http://www.gao.gov/docsearch/agency.php.
Relevant Inspector General Reports
Recovery Act
States’ Treasury-State Agreements Might Need to Include American Recovery and Reinvestment Act, Education Jobs Fund, and Other Similarly Funded Programs http://www2.ed.gov/about/offices/list/oig/auditreports/AlertMemorandums/l05l0004.pdf
California: Use of Funds and Data Quality for Selected American Recovery and Reinvestment Act Programs http://www2.ed.gov/about/offices/list/oig/auditreports/fy2011/a09k0002.pdf
Illinois: Use of Funds and Data Quality for Selected American Recovery and Reinvestment Act Programs http://www2.ed.gov/about/offices/list/oig/auditreports/fy2011/a05k0005.pdf
Louisiana: Use of Funds and Data Quality for Selected American Recovery and Reinvestment Act Programs http://www2.ed.gov/about/offices/list/oig/auditreports/fy2011/a06k0003.pdf
Missouri: Use of and Reporting on Selected American Recovery and Reinvestment Act of 2009 Program Funds http://www2.ed.gov/about/offices/list/oig/auditreports/fy2011/a07k0002.pdf
Oklahoma: Use of Funds and Data Quality for Selected American Recovery and Reinvestment Act Programs http://www2.ed.gov/about/offices/list/oig/auditreports/fy2011/a06k0002.pdf
Commonwealth of Pennsylvania’s Local Educational Agencies’ Systems of Internal Controls over American Recovery and Reinvestment Act Funds http://www2.ed.gov/about/offices/list/oig/auditreports/fy2011/a03k0003.pdf
Systems of Internal Controls over Selected Recovery Act Funds in Puerto Rico http://www2.ed.gov/about/offices/list/oig/auditreports/fy2011/a04k0001.pdf
South Carolina: Use of Funds and Data Quality for Selected American Recovery and Reinvestment Act Program http://www2.ed.gov/about/offices/list/oig/auditreports/fy2011/a04k0005.pdf
South Carolina Governor’s Office: Use of Funds and Data Quality for Selected American Recovery and Reinvestment Act Programs http://www2.ed.gov/about/offices/list/oig/auditreports/fy2011/a04k0006.pdf
Utah: Use of Funds and Data Quality for Selected American Recovery and Reinvestment Act Programs http://www2.ed.gov/about/offices/list/oig/auditreports/fy2011/a09k0001.pdf

APPENDICES
IG AND GAO REPORTS
FY 2011 Annual Performance Report—U.S. Department of Education 40
Virginia: Use of Funds and Data Quality for Selected ARRA Funds http://www2.ed.gov/about/offices/list/oig/auditreports/fy2011/a03k0008.pdf
Wisconsin: Milwaukee Public Schools: Use of Funds and Data Quality for Selected American Recovery and Reinvestment Act Programs http://www2.ed.gov/about/offices/list/oig/auditreports/fy2011/a02k0009.pdf
Elementary and Secondary Education-Related
Camden City Public School District’s Administration of Federal Education Funds http://www2.ed.gov/about/offices/list/oig/auditreports/fy2011/a02j0002.pdf
Camden City Public School District’s Administration of its Supplemental Educational Services Program http://www2.ed.gov/about/offices/list/oig/auditreports/fy2011/a02k0011.pdf
Insufficient Controls for the Puerto Rico Department of Education’s Use of Education Funds for Personal Services Contracts http://www2.ed.gov/about/offices/list/oig/auditreports/fy2011/l04k0018.pdf
Kiryas Joel UFSD Title I, Part A of the Elementary and Secondary Education Act and Individuals with Disabilities Education Act Part B Expenditures http://www2.ed.gov/about/offices/list/oig/auditreports/fy2011/a02k0003.pdf
Puerto Rico Department of Education Award and Administration of Personal Services Contracts http://www2.ed.gov/about/offices/list/oig/auditreports/fy2011/a04j0005.pdf
Federal Student Aid
Sallie Mae, Inc.’s Compliance with Selected Requirements of the Loan Participation Purchase Program Authorized by the Ensuring Continued Access to Student Loans Act of 2008 http://www2.ed.gov/about/offices/list/oig/auditreports/fy2011/a02k0002.pdf
Wells Fargo Bank, National Association’s Management of Collection Account Funds and Oversight Activities under the Ensuring Continued Access to Student Loans Act http://www2.ed.gov/about/offices/list/oig/auditreports/fy2011/a04j0019.pdf
Ashford University’s Administration of the Title IV, Higher Education Act Programs http://www2.ed.gov/about/offices/list/oig/auditreports/fy2011/a05i0014.pdf
Zions First National Bank’s Management of Collection Account Funds and Oversight Activities Under the ECASLA Loan Participation Purchase Program http://www2.ed.gov/about/offices/list/oig/auditreports/fy2011/a09j0009.pdf
Survey of Federal Student Aid Contracts and Guaranty Agency Agreements that Provide Information Technology Support or Services http://www2.ed.gov/about/offices/list/oig/auditreports/fy2011/x11l0002.pdf
Review of the Department of Education’s Outreach Activities Related to the Student Aid and Fiscal Responsibility Act of 2009 for Compliance with Restrictions on Use of Appropriated Funds for Lobbying http://www2.ed.gov/about/offices/list/oig/aireports/i13k0003.pdf

APPENDICES
IG AND GAO REPORTS
FY 2011 Annual Performance Report—U.S. Department of Education 41
Investigative Program Advisory Report Distance Education Fraud Rings http://www2.ed.gov/about/offices/list/oig/invtreports/l42l0001.pdf
Internal Operations
Education Department Utility for Communications, Applications, and Technology Environment Information Security Audit http://www2.ed.gov/about/offices/list/oig/auditreports/fy2011/a11l0001.pdf
The Effectiveness of the Department’s Data Quality Review Processes http://www2.ed.gov/about/offices/list/oig/auditreports/fy2011/a19k0010.pdf
Department’s Processes for Validating the EDUCATE Contractor’s Performance http://www2.ed.gov/about/offices/list/oig/auditreports/fy2011/a19k0007.pdf
Closure of OIG Audit of the Appropriateness, Accuracy, and Timeliness of Processing Personnel Actions http://www2.ed.gov/about/offices/list/oig/auditreports/fy2011/a19i0005.pdf
Educational Credit Management Corporation’s 2006 Agreement with the United States Department of Education http://www2.ed.gov/about/offices/list/oig/auditreports/fy2011/a05k0001.pdf
Investigative Program Advisory Report Incident Response and Reporting Procedures http://www2.ed.gov/about/offices/list/oig/invtreports/l21l0001.pdf
Financial Statement Audits—Fiscal Years 2010 and 2009—U.S. Department of Education http://www2.ed.gov/about/reports/annual/2010report/agency-financial-report.pdf
Financial Statement Audits for Fiscal Years 2010 and 2009—U.S. Department of Education Special Purpose Financial Statements http://www2.ed.gov/about/offices/list/oig/auditreports/fy2011/a17k0003.pdf
Financial Statement Audits for Fiscal Years 2010 and 2009—Federal Student Aid http://www2.ed.gov/about/reports/annual/2010report/fsa-report.pdf
OIG’s Independent Report on the Department’s Detailed Accounting of Fiscal Year 2010 Drug Control Funds http://www2.ed.gov/about/offices/list/oig/auditreports/fy2011/b19l0001.pdf
OIG’s Independent Report on the Department’s Performance Summary Report for Fiscal Year 2010 http://www2.ed.gov/about/offices/list/oig/auditreports/fy2011/b19l0001a.pdf
Relevant Government Accountability Office Reports
For-Profit Schools: Large Schools and Schools that Specialize in Healthcare Are More Likely to Rely Heavily on Federal Student Aid
http://www.gao.gov/docdblite/details.php?rptno=GAO-11-4
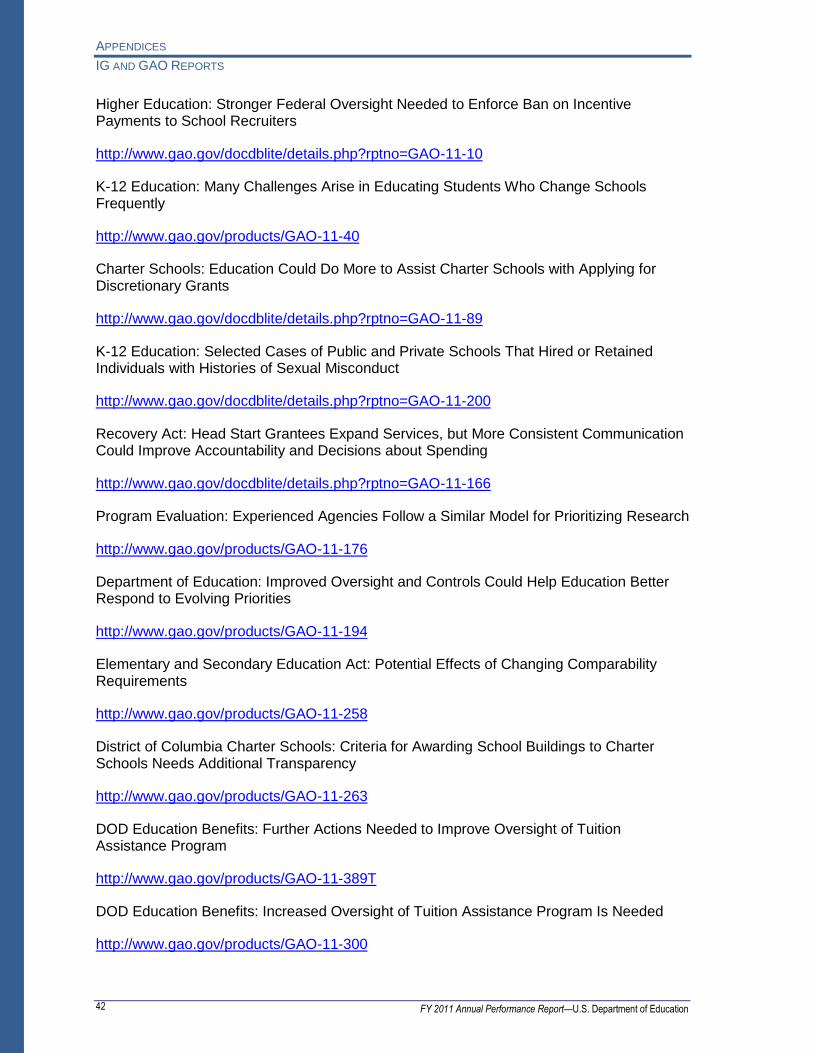
APPENDICES
IG AND GAO REPORTS
FY 2011 Annual Performance Report—U.S. Department of Education 42
Higher Education: Stronger Federal Oversight Needed to Enforce Ban on Incentive Payments to School Recruiters
http://www.gao.gov/docdblite/details.php?rptno=GAO-11-10
K-12 Education: Many Challenges Arise in Educating Students Who Change Schools Frequently
http://www.gao.gov/products/GAO-11-40
Charter Schools: Education Could Do More to Assist Charter Schools with Applying for Discretionary Grants
http://www.gao.gov/docdblite/details.php?rptno=GAO-11-89
K-12 Education: Selected Cases of Public and Private Schools That Hired or Retained Individuals with Histories of Sexual Misconduct
http://www.gao.gov/docdblite/details.php?rptno=GAO-11-200
Recovery Act: Head Start Grantees Expand Services, but More Consistent Communication Could Improve Accountability and Decisions about Spending
http://www.gao.gov/docdblite/details.php?rptno=GAO-11-166
Program Evaluation: Experienced Agencies Follow a Similar Model for Prioritizing Research
http://www.gao.gov/products/GAO-11-176
Department of Education: Improved Oversight and Controls Could Help Education Better Respond to Evolving Priorities
http://www.gao.gov/products/GAO-11-194
Elementary and Secondary Education Act: Potential Effects of Changing Comparability Requirements
http://www.gao.gov/products/GAO-11-258
District of Columbia Charter Schools: Criteria for Awarding School Buildings to Charter Schools Needs Additional Transparency
http://www.gao.gov/products/GAO-11-263
DOD Education Benefits: Further Actions Needed to Improve Oversight of Tuition Assistance Program
http://www.gao.gov/products/GAO-11-389T
DOD Education Benefits: Increased Oversight of Tuition Assistance Program Is Needed
http://www.gao.gov/products/GAO-11-300

APPENDICES
IG AND GAO REPORTS
FY 2011 Annual Performance Report—U.S. Department of Education 43
Education of Military Dependent Students: Better Information Needed to Assess Student Performance
http://www.gao.gov/products/GAO-11-231
VA Education Benefits: Actions Taken, but Outreach and Oversight Could Be Improved
http://www.gao.gov/products/GAO-11-256
Financial Literacy: The Federal Government’s Role in Empowering Americans to Make Sound Financial Choices
http://www.gao.gov/products/GAO-11-504T
Opportunities to Reduce Fragmentation, Overlap, and Potential Duplication in Federal Teacher Quality and Employment and Training Programs
http://www.gao.gov/products/GAO-11-509T
Opportunities to Reduce Potential Duplication in Federal Teacher Quality Programs
http://www.gao.gov/products/GAO-11-510T
Deaf and Hard of Hearing Children: Federal Support for Developing Language and Literacy
http://www.gao.gov/products/GAO-11-357
Federal Student Loans: Patterns in Tuition, Enrollment, and Federal Stafford Loan Borrowing Up to the 2007–08 Loan Limit Increase
http://www.gao.gov/products/GAO-11-470R
International School Feeding: USDA’s Oversight of the McGovern-Dole Food for Education Program Needs Improvement
http://www.gao.gov/products/GAO-11-544
School Meal Programs: More Systematic Development of Specifications Could Improve the Safety of Foods Purchased through USDA’s Commodity Program
http://www.gao.gov/products/GAO-11-376
Veterans’ Education Benefits: Enhanced Guidance and Collaboration Could Improve Administration of the Post-9/11 GI Bill Program
http://www.gao.gov/products/GAO-11-356R
Financial Literacy: A Federal Certification Process for Providers Would Pose Challenges
http://www.gao.gov/products/GAO-11-614

APPENDICES
IG AND GAO REPORTS
FY 2011 Annual Performance Report—U.S. Department of Education 44
Race to the Top: Reform Efforts Are Under Way and Information Sharing Could Be Improved
http://www.gao.gov/products/GAO-11-658
States Could Provide More Information on Education Programs to Enhance the Public’s Understanding of Fund Use
http://www.gao.gov/products/GAO-10-807
Institutions’ Reported Data Collection Burden Is Higher Than Estimated but Can Be Reduced through Increased Coordination
http://www.gao.gov/products/GAO-10-871
For-Profit Colleges: Undercover Testing Finds Colleges Encouraged Fraud and Engaged in Deceptive and Questionable Marketing Practices
http://www.gao.gov/products/GAO-10-948T
Improved Dissemination and Timely Product Release Would Enhance the Usefulness of the What Works Clearinghouse
http://www.gao.gov/products/GAO-10-644
Federal Student Loan Programs: Opportunities Exist to Improve Audit Requirements and Oversight Procedures
http://www.gao.gov/products/GAO-10-668
Recovery Act: Increasing the Public’s Understanding of What Funds Are Being Spent on and What Outcomes Are Expected
http://www.gao.gov/products/GAO-10-581
Many States Collect Graduates’ Employment Information, but Clearer Guidance on Student Privacy Requirements Is Needed
http://www.gao.gov/products/GAO-10-927
Student Loans: Federal Web-based Tool on Private Loans Would Pose Implementation Challenges and May Be Unnecessary
http://www.gao.gov/products/GAO-10-990
Cost and Legal Authority for Selected Financial Literacy Programs and Activities
http://www.gao.gov/products/GAO-11-781R

APPENDICES
IG AND GAO REPORTS
FY 2011 Annual Performance Report—U.S. Department of Education 45
Disadvantaged Students: School Districts Have Used Title I Funds Primarily to Support Instruction
http://www.gao.gov/products/GAO-11-595
Financial Education and Counseling Pilot Program
http://www.gao.gov/products/GAO-11-737R
School Improvement Grants: Early Implementation Under Way, but Reforms Affected by Short Time Frames
http://www.gao.gov/products/GAO-11-741
Hurricanes Katrina and Rita: Temporary Emergency Impact Aid Provided Education Support for Displaced Students
http://www.gao.gov/products/GAO-11-839
Recovery Act Education Programs: Funding Retained Teachers, but Education Could More Consistently Communicate Stabilization Monitoring Issues
http://www.gao.gov/products/GAO-11-804
Recovery Act Education Programs: Survey of School Districts' Uses of Funds
http://www.gao.gov/special.pubs/gao-11-885sp/index.htm

APPENDICES
46 FY 2011 Annual Performance Report—U.S. Department of Education
Appendix B2: Summary of FY 2011 Performance Evaluations
For a complete list of program evaluations and studies from the Office of Planning, Evaluation and Policy Development, please visit http://www.ed.gov/about/offices/list/opepd/ppss/reports.html. For a complete list of evaluation studies of the National Center for Education Evaluation and Regional Assistance, please visit http://ies.ed.gov/ncee/projects/evaluation/index.asp.
Selected Evaluation Reports
Policy and Program Studies Service (PPSS)
Supplemental Educational Services and Student Achievement in Five Waiver Districts
Presents final implementation and outcome findings from the five districts that received waivers to serve as Supplemental Educational Service (SES) providers, despite being identified for improvement, corrective action or restructuring. Federal regulations prohibit school districts identified for improvement or corrective action from serving as SES providers. The SES waiver pilot program allowed five identified districts to serve as SES providers beginning in 2005–06 (Boston and Chicago), 2006–07 (Hillsborough County, Florida and Anchorage, Alaska), and 2008–09 (Charlotte-Mecklenburg, North Carolina). In 2009–10, the pilot was replaced with a more expansive waiver opportunity that allows states to request a waiver from the U.S. Department of Education to approve identified districts or schools as SES providers.
Findings include:
In the three districts that did not serve as SES providers before the waiver (Anchorage, Charlotte Mecklenburg, and Hillsborough), SES participation rates increased in the first year of the waiver. (Boston and Chicago served as providers prior to receipt of the waiver.) There were few demographic or academic differences between students served by district providers and students served by non-district providers.
Students in three of the five districts demonstrated statistically significantly larger mathematics achievement gains during periods of SES participation than during periods of nonparticipation. In addition, in two districts, SES participation was associated with statistically significant reading gains.
Averaged across the five districts, the overall association between SES participation and achievement gains was statistically significant in both mathematics and reading, relative to nonparticipation.
Across the five districts, the achievement gains associated with SES participation relative to nonparticipation did not differ for district and non-district providers for either mathematics or reading.
All five districts reported using multiple communication strategies to reach eligible families, provided balanced information about SES providers, translated information into at least one language other than English, and provided extended enrollment periods.
http://www2.ed.gov/rschstat/eval/disadv/ses-waiver/ses-waiver-report.pdf

APPENDICES
SUMMARY OF FY 2011 PERFORMANCE EVALUATIONS
FY 2011 Annual Performance Report—U.S. Department of Education 47
Final Report on the Evaluation of the Growth Model Pilot Project
Documents the Growth Model Pilot Project (GMPP). GMPP was initiated to allow states to experiment with adjustments to the No Child Left Behind Act (NCLB) status accountability system, in order to improve the validity of Adequate Yearly Progress (AYP) determinations by giving schools credit for students who are making significant growth. The pilot allowed states, districts, and schools to count students who were ―on track‖ to being proficient but not yet there. Under NCLB, such students were not counted as proficient for the purpose of AYP determinations. The pilot was initiated in November 2005 with the goal of approving up to ten states to incorporate growth models in school AYP determinations. The project was written into regulation in late 2008; now any state may apply to use a growth model meeting certain core principles. Currently, 15 states are implementing growth models under this authority: Alaska, Arizona, Arkansas, Colorado, Delaware, Florida, Iowa, Michigan, Minnesota, Missouri, North Carolina, Ohio, Pennsylvania, Tennessee, and Texas.
Key findings include:
Growth models enabled additional schools to make AYP compared to status and safe-harbor rules alone, but the percentages of schools that made AYP because of the growth models were generally not large.
The impact of growth models varied widely across states.
Most (but not all) schools that made AYP by status would also have met their reading and math AMOs under a hypothetical ―growth-only‖ model (i.e., one using neither status nor safe harbor but only growth).
Controlled simulations comparing the impacts of different types of growth models on student and school growth results show that the ―projection model‖ functions in stark contrast with ―transition‖ and ―trajectory‖ models.
Simulations comparing the results of different growth models using the same data show that projection models have the highest correct classification rates for future proficiency: over 80 percent. These rates are 5 to 20 percentage points higher than trajectory and transition models, depending on the grade level and proximity to the growth model time limit. While the projection model is more accurate, it is theoretically more difficult to implement and to explain to practitioners and parents than the other models.
Although not an option under the Growth Model Pilot guidelines, growth models not tied directly to proficiency standards could identify a broader contingent of students as making adequate growth than current models. One alternative to the GMPP-permissible growth-to-proficiency models that could be used with vertical test score scales is the difference between proficiency cut scores in successive grade levels.
http://www2.ed.gov/rschstat/eval/disadv/growth-model-pilot/gmpp-final.pdf
The U.S.-China E-Language Project: A Study of a Gaming Approach to English Language Learning for Middle School Students
In 2001, the Department and the Ministry of Education in China entered into a bilateral partnership to develop a technology-driven approach to foreign language learning that integrates gaming, immersion, voice recognition, problem-based learning tasks, and other features that made it a significant research and development pilot project for study. The

APPENDICES
SUMMARY OF FY 2011 PERFORMANCE EVALUATIONS
FY 2011 Annual Performance Report—U.S. Department of Education 48
purpose of this report is to describe the evaluation of a key outcome of this bilateral partnership, The Forgotten World. This program was implemented as a supplementary activity in middle school classrooms in western China to teach the English language and American culture to eighth-grade students. The evaluation was conducted in five treatment schools and five comparison schools during the 2009–10 school year and included approximately 3,500 students. The evaluation showed statistically significant positive results of using The Forgotten World for the lower performing students along with the positive effects on student motivation. Almost all of the teachers in the treatment schools (95 percent) who participated in the project reported that their use of The Forgotten World changed the way they think about teaching.
http://www2.ed.gov/rschstat/eval/tech/us-china-e-language-project/report.pdf
Teachers’ Ability to Use Data to Inform Instruction: Challenges and Supports
This report describes an exploratory study on teachers’ thinking about data and the implications of the study’s findings for teacher preparation and support. Understanding the nature of teachers’ proficiencies and difficulties in data use is important for providing appropriate training and support to teachers because they are expected to use student data as a basis for improving the effectiveness of their practice.
Key findings include:
Data Location. Teachers in case study schools generally were adept at finding information shown explicitly in a table or graph.
Data Comprehension. A majority of case study teachers demonstrated reasonable skill in comparing data in a table or graph to corresponding prose characterizations. Common, however, were difficulties in evaluating written statements about data that required basic math calculations, distinguishing a histogram from a bar graph, and considering the difference between cross-sectional and longitudinal data sets. This finding suggests that teachers may come away from presentations of school or district data with misconceptions about their students’ performance.
Data Interpretation. Case study teachers were more likely to examine score distributions and to think about the potential effect of extremely high or low scores on a group average when shown individual students’ scores on a class roster than when looking at tables or graphs showing averages for a grade, school, or district. An implication of this finding is that teachers will need more support when they are expected to make sense of summaries of larger data sets as part of a grade-level, school, or district improvement team.
Data Use for Instructional Decision Making. Many case study teachers expressed a desire to see assessment results at the level of subscales (groups of test items) related to specific standards and at the level of individual items in order to tailor their instruction. After years of increased emphasis on accountability, these teachers appeared quite sensitive to the fact that students will do better on a test if they have received instruction on the covered content and had their learning assessed in the same way (e.g., same item format) in the past.
Question Posing. In order to use an electronic data system to identify areas for improvement, educators need to be able to frame questions that can be addressed by the data in the system. Most case study teachers struggled when trying to pose

APPENDICES
SUMMARY OF FY 2011 PERFORMANCE EVALUATIONS
FY 2011 Annual Performance Report—U.S. Department of Education 49
questions relevant to improving achievement that could be investigated using the data in a typical electronic system. They were more likely to frame questions around student demographic variables (e.g., ―Did girls have higher reading achievement scores than boys?‖ than around school variables (e.g., ―Do student achievement scores vary for different teachers?‖).
http://www2.ed.gov/rschstat/eval/data-to-inform-instruction/report.pdf
The Reading First Implementation Study 2008–09 Final Report
Examined states’ planned responses to the Reading First (RF) budget reduction which took place in FY 2008. (Funding for the program was reduced from approximately $1 billion to $400 million and has since been eliminated.) The study found that RF funds were used to support strategies to improve instruction in both RF-funded districts and schools as well as in non-funded districts and schools. State respondents discussed a variety of specific strategies to support continuation of RF teaching practices such as use of reading coaches, use of RF materials and curricula, use of data driven instruction, use of reading assessments, and scientifically based reading instruction.
http://www2.ed.gov/rschstat/eval/other/reading-first-implementation-study/report.pdf
Academic Competitiveness and National SMART Grant Programs: 2006–07 through 2008–09
This is the third report from a five-year study that examined program participation in the Academic Competitiveness Grant (ACG) and the National Science and Mathematics Access to Retain Talent (National SMART) Grant programs. Among the major purposes of the study were to determine whether or not the financial incentives provided by the ACG program induced more economically disadvantaged high school students to complete a rigorous high school program and enroll and succeed in postsecondary education and whether the National SMART Grants motivate more students to major and receive degrees in science, technology, engineering, mathematics (STEM) fields or languages critical to national interest .This third report summarizes participation data from the first three years of the ACG and National SMART Grant programs (2006–07 through 2008–09), and major findings include:
The number of ACG and National SMART Grant recipients has increased, although the percentage of Pell Grant recipients with these grants has remained low.
Many recipients could not meet the strict conditions required to renew their grants the following year.
First-year ACG recipients and third-year National SMART Grant recipients persisted at higher rates than their counterparts with only a Pell Grant.
http://www2.ed.gov/rschstat/eval/highered/smart-grant/acg-smart-grant-report-year-third-final.pdf

APPENDICES
SUMMARY OF FY 2011 PERFORMANCE EVALUATIONS
FY 2011 Annual Performance Report—U.S. Department of Education 50
National Center for Education Evaluation (NCEE)
Baseline Analyses of SIG Applications and SIG-Eligible and SIG-Awarded Schools
The Study of School Turnaround (SST) is an examination of the implementation of School Improvement Grants (SIG) authorized under Title I section 1003(g) of the Elementary and Secondary Education Act (ESEA) of 1965 and supplemented by the American Recovery and Reinvestment Act of 2009.
The report uses publicly-available data from State Educational Agency (SEA) Web sites, SEA SIG applications, and the National Center for Education Statistics’ Common Core of Data to examine the following: (1) the SIG related policies and practices that states intend to implement, and (2) the characteristics of SIG-eligible and SIG-awarded schools. This first report provides context on SIG.
http://ies.ed.gov/ncee/pubs/20114019/
Final Report on the Evaluation of the Comprehensive Technical Assistance Centers Program
This congressionally mandated report examines the work of the Comprehensive Technical Assistance Centers in three of the five program years (2006–07, 2007–08, 2008–09), starting with the second year of program funding.
The Comprehensive Technical Assistance Centers program is authorized under the Educational Technical Assistance Act of 2002 to provide technical assistance to states to implement provisions of NCLB through 16 Regional Comprehensive Centers (RCCs) and 5 Content Centers (CCs).
The evaluation focuses on the Centers’ work drawing upon information gathered from Center management plans, an inventory of each Center’s projects, interviews with staff from each Center, surveys of state managers and project participants, and an assessment of the projects by an expert panel.
http://ies.ed.gov/pubsearch/pubsinfo.asp?pubid=NCEE20114031
Other Evaluation Reports
http://ies.ed.gov/ncee/pubs/
Publications by Regional Education Laboratory or Search for a
Specific Publication
http://ies.ed.gov/ncee/edlabs/projects/index.asp

APPENDICES
FY 2011 Annual Performance Report—U.S. Department of Education 51
Appendix C: Selected Department Web Links and Education
Resources
Education Dashboard
The Department supports a data dashboard that contains high-level indicators, ranging from student participation in early learning through completion of postsecondary education, as well as indicators on teachers and leaders and equity. The Department will regularly update the dashboard’s data and enhance tools. http://dashboard.ed.gov/
College Cost Lists
The Department provides college affordability and transparency lists under the Higher Education Opportunity Act of 2008. Each list is broken out into nine different sectors, to allow students to compare costs at similar types of institutions, including career and technical programs. http://collegecost.ed.gov/catc/
College Navigator
The Department provides a multi-dimensional review of higher education options for students and provides links to other search sites. http://nces.ed.gov/collegenavigator/
College Preparation Checklist
This Departmental tool gives prospective college students step-by-step instructions on how to prepare academically and financially for education beyond high school. Each section is split into subsections for students and parents, explaining what needs to be done and which publications or websites might be useful to them. https://fafsa.ed.gov
Additional resources within the checklist assist students in finding scholarships and grants.
http://studentaid.ed.gov/students/publications/checklist/main.html
http://studentaid.ed.gov/students/publications/checklist/MoreSourcesOfStudentAid.html
Resources for Adult Education
The Department, through the Perkins Collaborative Resource Network, offers resources and tools for the development and implementation of comprehensive career guidance programs. This includes guides for students, parents, teachers, counselors, and administrators across relevant topics, such as planning and exploring careers, selecting institutions, finances, and guidance evaluation. This source is an example of interdepartmental cooperation between the Department and the U.S. Department of Labor. http://cte.ed.gov/nationalinitiatives/gandctools.cfm?&pass_dis=1
Federal Resources for Educational Excellence
Federal Resources for Educational Excellence (FREE) provides easily accessible resources in a wide gamut of subjects for educators. The tool breaks resources into categories, ranging from art and music to science and mathematics. It also offers a wide

APPENDICES
SELECTED DEPARTMENT WEB LINKS AND EDUCATION RESOURCES
FY 2011 Annual Performance Report—U.S. Department of Education 52
variety of primary documents, photos, and videos. In addition, FREE allows educators to follow via Twitter, a social network, which facilitates the sharing of ideas. This tool acts as a depository of ideas and resources for educators to help them supplement their lessons. http://free.ed.gov/
College Completion Toolkit
The College Completion Toolkit provides information that governors and other state leaders can use to help colleges in their state increase student completion rates. It highlights key strategies and offers models to learn from, as well as other useful resources.
http://www.ed.gov/sites/default/files/cc-toolkit.pdf
Practice Guides for Educators
The Department offers guides that help educators address everyday challenges they face in their classrooms and schools. Developed by a panel of nationally recognized experts, practice guides consist of actionable recommendations, strategies for overcoming potential roadblocks, and an indication of the strength of evidence supporting each recommendation. The guides themselves are subjected to rigorous external peer review. Users can sort by subject area, academic level, and intended audience to find the most recent, relevant, and useful guides. http://ies.ed.gov/ncee/wwc/publications_reviews.aspx
Doing What Works: Research Based Educational Practices
The purposes of this tool are to provide a convenient and easy way for educators to find research proven teaching methods and to translate research-based practices into practical applications in the classroom. The site is easy to navigate and offers useful tools for teachers to practice skills in key subject areas. http://dww.ed.gov/
TEACH
The Department’s TEACH campaign is designed to raise awareness of the teaching profession and to get a new generation of teachers to join the ones who are already making a difference in the classroom. The website provides valuable tools for educators around the country: from advice on building a career in teaching to connecting teachers to employers. Another component of TEACH is creating a network of teachers and mentors. Teachers can sign up to receive news and updates from TEACH. The purpose is for users to connect and share opportunities. http://www.teach.gov/
Department Evaluation Studies
The Department designs evaluation studies to produce rigorous scientific evidence on the effectiveness of education programs and practices. The two locations for finding studies are:
http://ies.ed.gov/ncee/projects/evaluation/index.asp
http://www.ed.gov/about/offices/list/opepd/ppss/reports.html

APPENDICES
SELECTED DEPARTMENT WEB LINKS AND EDUCATION RESOURCES
FY 2011 Annual Performance Report—U.S. Department of Education 53
Performance Data
EDFacts is a Department initiative to put performance data at the center of policy, management, and budget decisions for all K-12 educational programs.
http://www.ed.gov/about/inits/ed/edfacts/index.html
Condition of Education and Digest of Education Statistics
The Condition of Education is a congressionally mandated annual report that summarizes developments and trends in education using the latest available statistics. The report presents statistical indicators containing text, figures, and data from early learning through graduate-level education.
http://nces.ed.gov/programs/coe/
The primary purpose of the Digest of Education Statistics is to provide a compilation of statistical information covering the broad field of American education from pre-kindergarten through graduate school. The Digest includes a selection of data from many sources, both government and private, and draws especially on the results of surveys and activities carried out by the National Center for Education Statistics.
http://nces.ed.gov/programs/digest/
Projections of Education Statistics to 2019
For the 50 states and the District of Columbia, the tables, figures, and text in this report contain data on projections of public elementary and secondary enrollment and public high school graduates to the year 2019. The report includes a methodology section that describes the models and assumptions used to develop national and state-level projections.
http://nces.ed.gov/programs/projections/projections2019/
Discretionary Grant Programs for FY 2012
This site lists Department grant competitions previously announced, as well as those planned for later announcement, for new awards organized according to the Department's principal program offices.
http://www.ed.gov/fund/grant/find/edlite-forecast.html
Open Government Initiative
The Department’s Open Government Initiative is designed to improve the way the Department shares information, learns from others, and collaborates to develop the best solutions for America's students.
http://www2.ed.gov/about/open.html

APPENDICES
SELECTED DEPARTMENT WEB LINKS AND EDUCATION RESOURCES
FY 2011 Annual Performance Report—U.S. Department of Education 54
Research and Statistics
The Education Sciences Reform Act of 2002 established the Institute of Education Sciences within the Department to provide research, evaluation, and statistics to the nation’s education system.
http://ies.ed.gov/
National Assessment of Educational Progress
The National Assessment of Educational Progress (NAEP) assesses samples of students in grades 4, 8, and 12 in various academic subjects. Results of the assessments are reported for the nation and states in terms of achievement levels—basic, proficient, and advanced.
http://nationsreportcard.gov/
Government Accountability Office
The Government Accountability Office supports Congress in meeting its constitutional responsibilities and helps improve the performance and accountability of the federal government for the benefit of the American people.
http://www.gao.gov/docsearch/agency.php
Office of Inspector General
The Office of Inspector General has four primary business functions: audit, investigation, cyber security, and evaluation and inspection.
http://www.ed.gov/about/offices/list/oig/index.html
For a list of recent reports, go to:
http://www2.ed.gov/about/offices/list/oig/reports.html

APPENDICES
FY 2011 Annual Performance Report—U.S. Department of Education 55
Appendix D: Glossary of Acronyms and Abbreviations
ACG Academic Competitiveness Grant
ACSI American Customer Satisfaction Index
AFR Agency Financial Report
AGI Adjusted Gross Income
APR Annual Performance Report
ARRA American Recovery and Reinvestment Act of 2009 (Recovery Act)
ATA Assistive Technology Act of 2004
AYP Adequate Yearly Progress
CAROI Cooperative Audit Resolution and Oversight Initiative
CCRAA College Cost Reduction and Access Act of 2007
CFAAA Compact of Free Association Amendments Act of 2003
CFO Chief Financial Officer
CFDA Catalog of Federal Domestic Assistance
COO Chief Operating Officer
CRA Civil Rights Act of 1964
CSPR Consolidated State Performance Report
CSRS Civil Service Retirement System
CTEA Carl D. Perkins Career and Technical Education Act of 2006
ECASLA Ensuring Continued Access to Student Loans Act of 2008
EDEN Education Data Exchange Network
EFC Expected Family Contribution
EMAPS EDFacts Metadata and Process System
ESEA Elementary and Secondary Education Act of 1965
ESRA Education Sciences Reform Act of 2002
ESS EDEN Submission System
FAFSA Free Application for Federal Student Aid
FASAB Federal Accounting Standards Advisory Board

APPENDICES
GLOSSARY OF ACRONYMS AND ABBREVIATIONS
FY 2011 Annual Performance Report—U.S. Department of Education 56
FECA Federal Employees’ Compensation Act
FERS Federal Employees Retirement System
FFEL Federal Family Education Loan
FFMIA Federal Financial Management Improvement Act of 1996
FISMA Federal Information Security Management Act of 2002
FMFIA Federal Managers’ Financial Integrity Act of 1982
FREE Federal Resources for Educational Excellence
FSA Federal Student Aid
FY Fiscal Year
G5 Grants Management System
GA Guaranty Agency
GAPS Grant Administration and Payment System
GPRA Government Performance and Results Act of 1993
GPRMA GPRA Modernization Act of 2010
GSA General Services Administration
HBCUs Historically Black Colleges and Universities
HC Human Capital
HCMS Human Capital Management Staff
HEA Higher Education Act of 1965
HPPG High Priority Performance Goals (Priority Goals)
HR Human Resources
IDEA Individuals with Disabilities Education Act
IES Institute of Education Sciences
IP Improper Payments
IPERA Improper Payments Elimination and Recovery Act
IPIA Improper Payments Information Act of 2002
IRS Internal Revenue Service
i3 Investing in Innovation fund
IT Information Technology

APPENDICES
GLOSSARY OF ACRONYMS AND ABBREVIATIONS
FY 2011 Annual Performance Report—U.S. Department of Education 57
IUS Internal Use Software
IV&V Independent Verification and Validation
LEA Local Educational Agency
MD&A Management’s Discussion and Analysis
MECEA Mutual Educational and Cultural Exchange Act of 1961
NAEP National Assessment of Educational Progress
NCLB No Child Left Behind Act of 2001
NLA National Literacy Act of 1991
OCR Office for Civil Rights
OECD Organization for Economic Cooperation and Development
OELA Office of English Language Acquisition
OESE Office of Elementary and Secondary Education
OIG Office of Inspector General
OII Office of Innovation and Improvement
OM Office of Management
OMB Office of Management and Budget
OPE Office of Postsecondary Education
OPEPD Office of Planning, Evaluation, and Policy Development
OPM Office of Personnel Management
OSDFS Office of Safe and Drug-Free Schools
OSERS Office of Special Education and Rehabilitative Services
OVAE Office of Vocational and Adult Education
PAR Performance and Accountability Report
PARCC Partnership for Assessment of Readiness for College and Careers
PBO Performance-Based Organization
PIC Performance Improvement Council
PII Personally Identifiable Information
PIO Performance Improvement Officer
PLUS Parent Loans for Undergraduate Students

APPENDICES
GLOSSARY OF ACRONYMS AND ABBREVIATIONS
FY 2011 Annual Performance Report—U.S. Department of Education 58
RA/JF American Recovery and Reinvestment Act of 2009 (Recovery Act)/Education Jobs Fund
RMS Risk Management Service
RTT-ELC Race to the Top-Early Learning Challenge
SAFRA SAFRA Act
SAP Special Allowance Payment
SBAC SMARTER Balanced Assessment Consortium
SEA State Educational Agency
SFSF State Fiscal Stabilization Fund
SIG School Improvement Grant
SOF Statement of Financing
STEM Science, Technology, Engineering, and Mathematics
SY School Year
TASSIE Title I Accountability Systems and School Improvement Efforts
TIF Teacher Incentive Funds
TIMSS Trends in International Mathematics and Science Study
USC United States Code
VPS Visual Performance Suite
VR Vocational Rehabilitation
WWC What Works Clearinghouse
APPENDICES
GLOSSARY OF ACRONYMS AND ABBREVIATIONS
FY 2011 Annual Performance Report—U.S. Department of Education 59

OUR MISSION IS TO PROMOTE STUDENT ACHIEVEMENT AND PREPARATION FOR
GLOBAL COMPETITIVENESS BY FOSTERING EDUCATIONAL EXCELLENCE AND
ENSURING EQUAL ACCESS.
WWW.ED.GOV