u.s. department of the interior cruise report for a ... · cruise report for a seismic...
TRANSCRIPT

U.S. DEPARTMENT OF THE INTERIOR
U.S. GEOLOGICAL SURVEY
Cruise Report for a Seismic Investigation of Gas Hydrates in the Mississippi Canyon Region,Northern Gulf of Mexico -- Cruise M1-98-GM
By
Alan Cooper1, Patrick Hart1, Ingo Pecher2
1U.S. Geological SurveyMenlo Park, CA 94025
2Woods Hole Oceanographic InstituteWoods Hole, MA
Open-File Report 98-506
This report is preliminary and has not been reviewed for conformity with U.S. Geological Survey editorial standards (orwith the North American Stratigraphic Code). Any use of trade, product, or firm names is for descriptive purposes only and
does not imply endorsement by the U.S. Government.
1998

2
Introduction
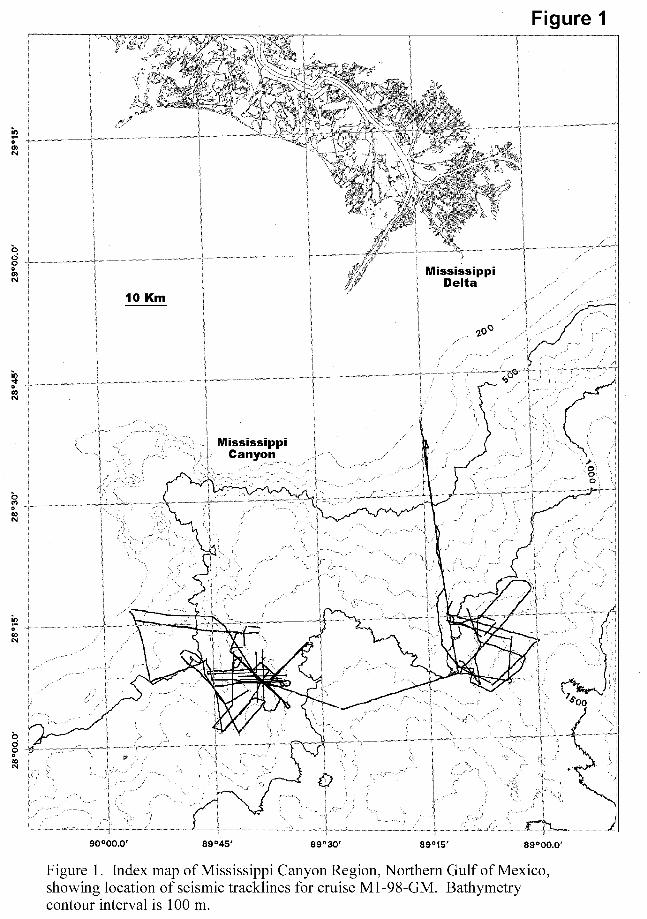
During June 1998, the U.S. Geological Survey (USGS) and the University of Mississippi Marine Minerals TechnologyCenter (MMTC) conducted a 12-day cruise in the Mississippi Canyon region of the Gulf of Mexico (Fig. 1). The R/VTommy Munro, owned by the Marine Research Institute of the University of Southern Mississippi, was chartered for thecruise. The general objective was to acquire very high resolution seismic-reflection data across of the upper and middlecontinental slope (200-1200-m water depths) to study the acoustic character, distribution and potential effects of gashydrates within the shallow subsurface, extending from the sea floor down to the base of the gas-hydrate stability zone.
The Gulf of Mexico is well known for hydrocarbon resources that include petroleum and related gases. Areas of the Gulfthat lie in waters deeper than about 250 m potentially have conditions (e.g., pressure, temperature, near-surface gas content,etc.) that are right for the shallow-subsurface formation of the ice-like substance (gas and water) known as gas hydrate(Kvenvolden, 1993). Gas hydrates have previously been sampled in sea-floor cores and observed as massive mounds inseveral parts of the northern Gulf, including the Mississippi Canyon region (e.g., Anderson et al., 1992). Extensive seismicdata have been recorded in the Gulf, in support of commercial drilling efforts, but few very high resolution data exist in thepublic domain to aid in gas-hydrate studies. Studies of long-term interest include those on the resource potential of gashydrates, the geologic hazards associated with dissociation and formation of hydrates, and the impact, if any, of gas-hydratedissociation on atmospheric warming (i.e., via release of methane, a "greenhouse" gas).
Several very high resolution seismic systems (surface-towed, deep-towed, and sea-floor) were used during the cruise to testthe feasibility of using such data for detailed structural (geometric) and stratigraphic (physical property) analyses based onthe acoustic data. The cruise was conducted in two regions, on opposite flanks of the Mississippi Canyon, where gashydrates are known and suspected from prior coring and seismic operations (e.g., Neurauter and Bryant, 1989). The regionsare also characterized by thick surficial, relatively young (Pleistocene and younger) sediments. Swath-bathymetry data (Fig.2) show extensive sea-floor faults, piercement features, and slumps -- features whose development could potentially berelated to gas hydrates. The specific objectives of the cruise were (a) to image the gas-hydrate stability zone across thecontinental margin to document bottom-simulating reflections (BSRs) and changes in geometry of the hydrate stabilityzone; (b) to image known hydrate features (with several seismic systems) to estimate physical properties for hydrate andnon-hydrate areas; (c) to outline the shallow structures of the hydrate stability zone to ascertain their potential effects on theformation/distribution of hydrates and on stability of the sea floor; and (d) to estimate, if possible, the amounts of hydratespresent in the shallow sub surface.
During the cruise about 850 km of multichannel and single-channel seismic data were recorded. Seismic measurements atnine ocean-bottom seismometer (OBS) stations were recorded for several of the multichannel tracklines (Fig. 3). Thefollowing report describes the field operations and equipment systems employed, gives two examples of ship-board seismicrecords, and outlines a few preliminary results.
3
Personnel
The following personnel participated in the cruise:
Science staff
Alan Cooper Co-chief scientist, geophysicist USGS
Tom McGee Co-chief scientist, geophysicist MMTC
Mike Belliveau Huntec deep-tow technician GC
Cathy Grace Geology Research Associate MMTC
Patrick Hart Geophysicist USGS
Bob Iuliucci OBS technician BCR
Larry Kooker Electronics Technician USGS
Walt Olsen Mechanical Technician USGS
Fred Payne Electronics Technician USGS
Ingo Pecher OBS geophysicist WHOI
Jim Petermann Electronics Technician MMTC
Hal Williams Mechanical Technician USGS
Ship's crew R/V Tommy Munro
Paul Beaugez Captain GCRL
Greg Skrmetti First mate / engineer GCRL
Kat Fletcher Cook GCRL
Buddy Ezell Deck hand GCRL
Chuck Block Deck hand GCRL
Van Overstreet Deck hand GCRL
Mike Kulivan Deck hand GCRL
Affiliations:BCR: Bear Cove Resources (under contract to WHOI)GC: Geoforce Consultants (under contract to USGS)GCRL: Gulf Coast Research Laboratory, University of Southern Mississippi, Biloxi, MIMMTC: Marine Minerals Technology Center, University of Mississippi, University, MIUSGS: U. S. Geological Survey, Menlo Park, CAWHOI: Woods Hole Oceanographic Institute, Woods Hole, MA
Equipment Systems
The equipment systems used during the cruise are listed in Table 1. Most equipment was provided by USGS, withexception of the SeaScope recording system and 15 in3 water gun, which were furnished by MMTC. Technical specificationfor the Ocean Bottom Seismometer (OBS) experiment are given in Table 2, and an operations log showing the amounts ofdata recorded with these systems is outlined in Table 3. Appendix A gives a detailed list of trackline data collected, andAppendix B gives a detailed list of OBS operations. Survey speeds ranged from 2.5 to 4 knots. Seismic systems were firedat different energy levels and rates, as noted. The seismic data were sampled at fast rates (4 kHz to 200 kHz) at or near the

5
capacity of the recording systems, to attain the greatest possible resolution of waveforms for later data analysis. With thefast rates, nearly 50 gigabytes of data were recorded during the 8 days of data collection.
Seas were generally calm, and mostly less than 4-6 feet, above which operations were halted. Data quality is generallygood, but is affected in various places by noise from several sources: electronic noise generated by corrosion (discovered atthe end of the cruise) in the deck connector of the MCS streamer's lead-in cable; ship-derived mechanical noise, seismic-shooting ships, and nearby drilling operations. Seismic tracklines have continuous large oscillations due to the slow-seeking(20-yr-old) auto-gyro control system that directed the ship's rudder.
Additional information about the data recorded on the cruise, and its public availability can be obtained at the website:http://walrus.wr.usgs.gov/docs/infobank/tiger/m/m198gm/html/m-1-98-gm.html
Table 1: Equipment systems used on cruise M1-98-GM
System Components Comments
Navigation USGS real-time YONAV system was used for lab/bridge displayof positions and data recording. Inputs were from a KVH HeadingIndicator and a SATPAK DGPS receiver.
Raster images of NOAA swathbathymetry were displayed for real-time positioning of tracks, to crosssea-floor features of interest.
Multi-channelseismic
MCS data were recorded using: 24-channel ITI streamer with 10m groups and 3 phones per group -- streamer was towed at anestimated 1-3 m depths (no depth sensors on the streamer), andfarthest offset channel was about 270 m behind the source;Geometrics STRATAVIEW digital recording system with marinecontroller; and 2/4 gbyte DAT tape drive.
MCS data were sampled at 4 kHzrate; and, one trace displayedaboard ship with a Printrex thermalplotter, via the STRATAVIEWmarine controller.
Single channelseismic
SCS data were recorded using different configurations:Config. 1: SeaScope system (owned by MMTC): receiver topreamplifier to a "SeaScope" laptop PC recording system withdata stored on hard drive and 1 gbyte Jaz drive, and transferred toCD-ROM.Config. 2: MudSeis system (developed by USGS): receiver topreamplifier to a 2-channel PC recording system with data storedon magneto-optical disk.Receivers used at different times:MMTC: 10-element ITI, 1 channel of ITI-MCS; Huntec externalstreamer; 3-element Benthos streamer.USGS: ITI-MCS streamer; Huntec internal phone and externalstreamer.
"SeaScope" sampled data at ratesfrom 9-200 kHz. MudSeis sampleddata at 33 kHz per channel.Data recorded via the Huntecstreamer (i.e., Huntec and watergun)were displayed onboard using anEPC graphic recorder. Lead-in cablefor SCS streamers too short topermit their use.
GI gun Two GI gun sizes (35/35 and 105/105 in3) were used in "Harmonicmode" (i.e., one chamber delayed relative to the other, by aSureShot gun-timing system. The navigation system providedgun-shot-triggers on a constant-time basis. A 50 scfm BauerCompressor provided air at a pressure of about 3000 psi.
Gun fire rates were: 14 sec. for35/35 in3 and 42 sec. for the105/105 in3 gun (used for only 1OBS line). Gun tow depth wasabout 1 m below surface and 25-30m behind the GPS navigationantenna.
Water gun A 15 in3 water gun was used in the same way as the GI guns, butfired at a pressure of about 2000 psi.
Gun fired at 5 sec. intervals, andtowed about 1m depth.
Huntec A Huntec system owned by USGS was used, with its boomersource fired at variable power settings of 500-1000 joules. Thesystems two receivers were used (a hydrophone inside of the towfish and a 1-m-long, 3-element streamer towed behind the fish).
A heavy duty generator was broughtfrom Menlo Park to provide powerfor the Huntec winch.The boomer was fired at rates of

6
Fish tow depth was about 200 m at a ship speed of 3.5 kt. Seismicsignals from the fish were fed through shipboard amplifier/filters(set to OUT) and then to the MudSeis recording systems and EPCgraphic recorder.
0.75 -1.25 sec. depending on waterdepth.Data were recorded at33 kHz sampling rate.
Ocean BottomSeismometers(OBS)
Six OBS were leased from Delhousie University for theexperiment. The parameters for the OBS are listed in Table 3.
All OBS were recovered andgenerally operated well, with minorproblems as noted.
Calibrationphone
A USN-calibrated hydrophone was taken for acquiring signaturesof the different seismic sources.
Strong ship noise and insufficientlead-in wire precluded calibrations.
Other A 1000 joule 2-tip minispark system was taken as a backup to theHuntec system, but was not used.
Prior sparker data in the areashowed good penetration (250msec) with a 400-1000 joule multi-tip system.
Table 2: OBS-experiment specifications for OBSs and seismic sources
Deployment 1: OBS Lines 1-5 (MCS Lines 11-15):
Geophone resonance frequency 4.5 HzSampling frequency 698 HzCorner frequency of anti-aliasing filter 200 HzDigitizing depth 16 bitGI-gun: Generator chamber 35 in3
GI-gun Injector chamber 35 in3
Source fire rate 14 secAir pressure ~2400-2800 psi
Deployment 1: OBS Line 6 (MCS Line 50):
OBS: Same as aboveGI-gun: Generator chamber 105 in3
GI-gun Injector chamber 105 in3
Source fire rate 42 secAir pressure ~2400-2800 psi
Deployment 2:
Geophone resonance frequency 100 HzSampling frequency 5000 HzCorner frequency of anti-aliasing filter 1000 HzDigitizing depth 12 bitWatergun chamber 15 in3
Firing rate 5 secAir pressure ~2300 psi

7
Table 3: Operations log for cruise M1-98-GM
Operation Time Spent Data Collected Comment
Multichannel seismic:GI gun
~40 hours 10 seismic lines 35/35 in3 GI gun
Multichannel seismic:water gun
~45 hours 21 seismic lines 15 in3 water gun
Single channel seismic:water gun
~24 hours 13 seismic lines 15 in3 water gun, deep-tow streamer
Huntec deep-towseismic system
~39 hours 24 seismic lines Boomer source
Ocean BottomSeismometer study
~37 hours 9 OBS stations and8 MCS lines
2 deployments, 3 seismic sources: 2@ GI gun and 1 water gun
Transit ~29 hours none To/from operational areaEquipment downtime ~15 hours none Startup and repairsLost time ~20 hours none Cruise reschedule and delaysWeather delay ~39 hours none Transit and 23-hour layoverTOTAL 288 hours 12 daysSeismic Studies
Several seismic studies were undertaken on the cruise using the equipment systems noted above -- the objectives aresummarized in Table 4. The studies were conducted in two general regions, on the east flank and west flank of theMissississippi Canyon in water depths of 250 to 1200 m. The studies fall into two general categories: 1) those relating to thedescription and analysis of the geologic environment and processes of the gas-hydrate stability zone, and 2) those relating to theacquisition and analysis of highly-sampled (i.e., very high resolution) seismic data, to determine properties of the data that canbe used for inferring physical characteristics of the hydrate system (e.g., inversion of seismic data, physical properties,impedances, AVO, P- to S-wave conversion, etc.) The USGS-seismic data sets are directed principally to the first objective, andthe MMTC-seismic and USGS-OBS data sets are focused largely to the second.
Table 4: Seismic studies undertaken on cruise M1-98-GM
Study Area Comments
Stratigraphy and structure of theuppermost sedimentary section (i.e., toa sub-surface depth of about 2 timesthe estimated thickness of the hydratestability field)
Upper- to middle-continental slope on bothsides of the canyon where sea-floorhydrates are known or inferred, and P-Tconditions are correct for hydrateformation.
Seek to establish criteria for identifyinggas hydrates, BSRs, and underlyingtrapped gases -- to aid in determiningextent and concentration of gashydrates.
Geometry and extent of the gas-hydratestability zone (GHSZ).
Upper- to middle-continental slope fromshallowest known hydrate occurrence inthe Gulf (225 m) to about 1200 m waterdepth.
Seek to identify local and regionalthickness variations on transects of thecontinental slope, based on changes inacoustic character, BSRs, structures,etc.
Possible links between sea-floorfailures, shallow faulting, intrusivestructures and gas hydrates of theuppermost sedimentary section.
Areas of apparent sea-floor scarps andslumps on the continental slope, based onregional 100-m-gridded swath bathymetrydata.
Seek to determine the role, if any, ofhydrates in surface and sub-surfacefailures.
Special processing of seismic data forestimating acoustic parameters of the
Representative areas of the continentalslope where hydrates are known or
Fast sampling rates (9-80 kHz) wereused for accurate amplitude

8
hydrate stability zone. suspected. measurements of subsurface andmultiple reflections.
Large-offset seismic-waveform-response of the hydrate stability zoneto high-frequency seismic energy.
Areas of known hydrate deposits (andinferred underlying free gas) on thecontinental slope.
Use ocean bottom seismometers to seekP- to S-wave conversions, high-resolution velocities and other large-offset seismic attributes.
The following sections briefly describe the field experiments outlined in Table 4, and give some initial field observations.
Stratigraphy and structure
The field experiments build on the extensive studies reported previously on the structure and stratigraphy of the NorthernGulf of Mexico and Mississippi Canyon regions (e.g., Goodwin and Prior (1989), Weimer et al. (1998)). Several longseismic lines were recorded down the slope and across the canyon to establish the regional character and variability of theupper part of the Pleistocene and younger sedimentary section that drapes the continental slope. The locations of the lineswere chosen, based on the NOAA swath bathymetry maps, to cross relatively undeformed sections of the continental slopeand canyon floor. The small GI-gun and MCS streamer were used to acquire seismic traces about every 25 m (the fastestrate possible), with penetration to at least the sea-floor multiple reflection (i.e., upper kilometer or so, on the middleslope)(e.g., Fig. 4). One long line was also done up the east flank with the water gun (fired about every 9 m) and the MCSstreamer. MCS data were recorded at 4 kHz, the fastest rate possible with the STRATAVIEW marine controller, to achievethe best possible resolution and continuity of reflections.
The acoustic character of the upper-sedimentary sections on the east and west flanks of the canyon is highly variable andcomplex. From shipboard monitor records, the uppermost parts of the sedimentary section is characterized by uniformlystratified acoustic units that although locally deformed can be traced over large distances on the upper slope. The underlyingstratigraphy in these areas is complex, with more-variable amplitudes and less continuity of reflections.
There is much evidence along transects down the continental slope for local structures and amplitude variations likelycaused by strong impedance changes (Fig 4). The polarity of the strong reflections could not be determined in the field, andthe cause is unknown (e.g., free gas, sands, hydrates, etc.). The large variability in reflection strength and continuity can inplaces be directly linked to underlying structures, indicating that materials are, in places, moving vertically into and throughthe uppermost strata. In the deeper-water areas (e.g., greater than 800 m) where shallow strata are certainly within thehydrate stability zone, some of the observed strong amplitude local features may be either hydrates or products associatedwith the hydrate system (e.g., migrating gases, authigenic carbonates, bacterial mats, etc.). This is particularly apparentwhere the sedimentary section is disrupted by diapiric structures, of likely mud/sand composition based on the variablethickness of adjacent buried beds. The piercement features extend to the sea floor and are sometimes denoted by strongamplitudes at the sea floor (in comparison with surrounding sea floor that is a lower-amplitude reflection)(Fig 5).
In general, the cause for the large variability in the acoustic characteristics in many of the field seismic records is not readilyapparent, and awaits processing and analyses of the data.
Geometry and extent
The geometry and extent of the gas hydrate stability zone (GHSZ) in the Gulf of Mexico is unknown. The thickness of theGHSZ depends on many factors (e.g., temperature, pressure, salinity, gas content, etc.), and formation of hydrates in thezone requires that adequate gas and water be present. In other areas, the base of the GHSZ is marked by a bottomsimulating reflection (BSR) that denotes the location where massive gas hydrates (within the GHSZ) lie above a horizoncontaining free gas (below the GHSZ). The BSR is commonly cited as evidence for the existence of gas hydrates, althougha BSR is not required and commonly does not exist. In the Gulf of Mexico, reports of BSRs are rare (e.g., Hedberg, 1980).The three seismic systems (GI-gun, water gun, and Huntec) were used to look beneath the continental slope for evidences ofa BSR, or equivalent acoustic transition at the inferred base of the GHSZ.
9
In the shipboard records, BSRs like those reported in other parts of the World (i.e., in lower-resolution seismic profiles) arenot readily apparent, but may be discovered following data processing. On the flanks of some piercement features, and inthe upper part of the sedimentary section where gas hydrates are known, high-amplitude reflections that have cross-cuttinggeometries are recorded (e.g., Fig. 4). However, the cross-cutting reflections are areally limited and do not extend farbeyond the zone of underlying high-amplitude reflections.
Another acoustic characteristics that may point to the base of GHSZ is a "shingling" of reflections with increased amplitudesat shallow depths. Elsewhere than the Gulf, such "shingling" is thought due to free gas trapped beneath the GHSZ in thesedimentary section. In some shipboard records, we see apparent "shingling" that varies from place to place in theunprocessed data due partly to the different center-frequencies of the different seismic sources used. Such localizedincreases in the amplitude of reflections, laterally and vertically, in the stratified sedimentary section could be associatedwith local trapping of upward-migrating gases. The trapping mechanism could be hydrates, or could be geologic faciesboundaries. The complete analyses await further data processing.
Possible links
There has been much speculation that gas hydrates may be linked to sea-floor failures and slumps -- the reasoning being thatwhen gas-hydrates disassociate the released gas may over-pressure a thin porous (sand) layer that then acts as a decollementfor a sea-floor slump. The continental slope of the Gulf of Mexico is characterized by numerous small-scale (hundreds ofmeters) and large-scale (many km wide) sea-floor failures that are clearly evident in the NOAA swath bathymetry data (Fig2). Such features have extensive and sometimes complex (e.g., en echelon, down-stepped) headwall scarps that surroundthe upslope edges of the failure. During the cruise, several tracklines were recorded across the edges of two large-scalefailures -- one on each side of the canyon -- to determine possible links with shallow hydrate features. Huntec and GI-gunprofiles were recorded across the feature on the west flank of the canyon, and water-gun profiles across the feature on thecanyon's east flank.
In swath bathymetry data, the failures seem somewhat similar in size and style of failure. In shipboard seismic profiles, thefeatures both show displacement of the sea floor and faulting of the uppermost sedimentary section, implying relativelyyoung deformation. Huntec profiles, like those shown in Figure 5 for other parts of the margin, show evidence of abruptfailures for the feature on the canyon's west flank. Unfortunately, the Huntec system was inoperable during the survey ofthe east Canyon flank, but water-gun profiles there indicate similar, albeit possibly broader, failure zones. For both sea-floor features, piercement and/or fold structures may lie close to some segments of the head-wall scarps. At first review,structural deformation resulting from salt tectonics appears to be the dominant cause for the sea-floor failures. However,confirmation of this assessment, and of the potential role, if any, of gases and hydrates in facilitating the degree and/or rateof failure awaits data processing and analysis.
Special processing
One objective of the cruise was to acquire seismic data at ultra-high sampling rates (up to 200 kHz) to give precisedefinition of waveforms (i.e., defined by a minimum of 10 samples per wavelength, equivalent to 5 times Nyquist sampling)for retaining phase and true-amplitude information and for gaining greater vertical and spatial resolution than possible fromNyquist sampling. Faster sampling rates also eliminate the need for anti-aliasing filters, to accurately preserve the 0.5-4.0kHz seismic frequencies of interest to this study. Underway seismic data were routinely recorded, one seismic-system at atime, at the maximum possible rates attainable by the recording system, for the record length and shot interval being used.The sampling rates were: 4 kHz for water-gun and GI-gun MCS (24-channel) data recorded by the Strataview system; 33kHz for water-gun and Huntec data recorded by the two-channel Mudseis system; and 9 kHz - 80 kHz for water-gun andHuntec data recorded by the single-channel SeaScope system. Seismic signatures were recorded by the SeaScope system at200 kHz during a stationary test. Due to time and space constraints, special processing was not possible at sea.
The highly sampled data will be used in particular to determine true relative-amplitudes for the uppermost sedimentarysection, for use in estimating reflectances, acoustic impedances, and physical properties of the gas-hydrate stability zone. Inone set of experiments, seismic data were collected along approximately the same trackline using each of the four seismicsources (2 GI-guns, water gun, Huntec) and the different receiver systems (2 different towed arrays and low-frequencyOBS). Data were recorded with only one seismic source operating, to eliminate the possibility of acoustic "cross-talk". Theprofile crossed Mississippi Canyon Lease Block 798, where Neurauter and Bryant (1989) had previously reported a hydratemound underlain by zone of high-amplitude reflections (gas?). The new seismic profiles from the same area showadditional mounds, a possible BSR, and likely mud diapirs (Figs. 4a,b and 5). Towed-array data from this experiment will

10
be processed at MMTC to derive estimates of reflection coefficients from a multiple-quotient analysis (Missiaen et al.,1996), to study frequency dependence of reflection coefficients for the hydrate stability zone based on the different seismicsources. For the OBS data, the variable response of the two different OBS recording systems will be assessed to look atnear-field response of possible hydrates in the underlying sedimentary section.
Large-offset seismic: OBS experiments
Seismic techniques for remote detection of gas hydrates and associated shallow gas are focusing on two observations thatcan be addressed with OBS studies:1. Gas hydrates are assumed to increase compressional (P-) wave velocity of sediments. Within a given lithology, regions ofhigh gas hydrate concentration are expected to be marked by elevated P-wave velocity (Vp). Free gas, on the other hand, isknown to drastically decrease Vp (e.g., Domenico, 1977)2. Compressional to shear (S-) conversion has been observed at a layer with high gas hydrate concentration on the BlakeRidge offshore South Carolina (Pecher et al., submitted) most likely caused by a sharp contrast in S-wave velocity (Vs).
The goals of the present OBS study were to use three-component instruments:1. To determine the three-dimensional (3-D) P-wave velocity field around an area were gas hydrates were reported at theseafloor, and2. To acquire possible P-to-S converted waves.
The experiment was done over a mound in Mississippi Canyon block MC798. Gas hydrates have been reported in a corefrom this mound (Neurauter and Bryant, 1989). Seismic reflections in single channel seismic data beneath the seafloorpromise adequate ray-coverage for this experiment (Fig. 3A).
Two OBS deployments were made. During the first and main experiment, six OBSs equipped with 4.5-Hz geophones weredeployed at 1.5 km spacing along two N-S-lines near the hydrate mound. An OBS was not placed directly on top of thediapir to avoid possible risks due to any brine pools that are commonly observed on similar hydrate mounds. Five profiles(two N-S, two E-W and one NW-SE) approximately 10 km long were shot with a 35/35 in3 generator-injector (GI) airgun.Reflections at ~1.25 and ~1.5 sec. two-way traveltime were expected to generate clear arrivals in the OBS data. Raycoverage should be sufficiently dense to calculate a 3-D distribution of Vp within the 1.5-km-by-1.5-km square between thesouthern and central OBSs above the deeper reflection. Vp can be computed in 2-D along the shooting lines in a largerregion.
A sixth line was shot in NW-SE direction, with the a 105/105 in3 GI gun. This source generated a stronger and lower-frequency (and lower-resolution) signal than the small GI gun. The large GI gun signals should facilitate detecting theusually relatively weak P-to-S converted waves. The orientation of the line was chosen to give near horizontal layers, toaccurately determine the fine Vs structure of converted waves via applying 1-D waveform analyses.
For the second experiment, three OBSs equipped with 100-Hz geophones were deployed at 600 m spacing along an E-Wline across the hydrate mound. A 15 in3-watergun was used, as it generates higher frequencies (above 500 Hz) than the GIguns. The goal was to observe reflections from the Holocene sediment drape, and thus obtain a very high resolutionvelocity profile in the uppermost 50-100 m beneath the seafloor near the mound.
Summary
A new suite of very high resolution seismic profiles and Ocean Bottom Seismometer transects were recorded in theMississippi Canyon region of the Gulf of Mexico to study the characteristics, evolution, and potential impacts of the gashydrate system. The new highly sampled seismic data should, after processing and enhancement, provide greater resolutionof subsurface structure and stratigraphy in the gas hydrate stability zone than previously known. Such data will hopefullyillustrate the relationship between vertically-migrating fluids/gases known in the Gulf, and the distribution of gas hydratesand associated features (e.g., sediment failures, velocity anomalies, hard grounds, etc.).
11
Acknowledgments
The financial support and cooperation of the MMTC is gratefully acknowledged. In particular, we appreciate the effortsof MMTC's Dr. Thomas McGee who as co-chief scientist promoted and helped conduct the cruise. Because MMTC policyprecludes cruise reports from presenting preliminary science observations, Dr. McGee chose to produce a separate detailedcruise-operations report for MMTC (McGee et al., 1998) and to not be an author herein, where preliminary observations arediscussed. MMTC funding was through the Minerals Management Service of the Department of Interior. Funding forUSGS was from the USGS Coastal and Marine Geology Program. The OBS work was funded by the Department of Energy. The efforts of the ships's crew, the USGS/MMTC science-support staff, and the Geoforce and Bear Cove technicians toensure a safe and productive cruise are gratefully acknowledged. The Institute of Marine Sciences, Gulf Coast ResearchLaboratory is thanked for providing gratis four days of ship time for mobilization and demobilization aboard the R/V"Tommy Munro". We thank also Rebecca Cooper for her work in compiling data and preparing maps, and Michael Hamer,Carolyn Degnan, Nancy Soderberg, and Dave Twichell for their help with preparation of swath-bathymetry maps. TheMinerals Management Service, New Orleans, provided valued assistance accessing data used in site selections. UnionPacific Resources of Fort Worth, Texas, gave the necessary permission to install seismometers on the sea floor inMississippi Canyon Lease Block 798.
References
Anderson, A.L., Sloan, E.D., and J.M. Brooks, 1992, Gas hydrate recoveries in the Gulf of Mexico: What is the shallowwater depth limit for hydrate occurrence?, Proceedings 24 th Offshore Technology Conference (1992), Paper 6853, 381-385.
Domenico, S.N., 1977, Elastic properties of unconsolidated porous sand reservoirs. Geophysics, 42, 1339-1368.
Goodwin, R.H., and D.B. Prior, 1989, Geometry and depositional sequences of the Mississippi Canyon, Gulf of Mexico,Journal of Sedimentary Petrology, 59/2, 318-329.
Hedberg, H.D., 1980, Methane generation and petroleum migration, IN Roberts., Q\W.H., and R.J. Cordell (eds), Problemsof Petroleum Migration, Amer. Assoc. Petroleum Geologists Studies in Geology No. 10., Tulsa, pp. 179-206.
Kvenvolden, K. A., 1993, Gas hydrates -- geological perspective and global change, Rev. Geophys, 31(2), 173-187.
McGee, T., Cooper, A.K., Pecher, I., Grace, C., and R. Buchannon, 1998, Operations Report for Cruise M1-98-GM, 8-19June 1998, Marine Minerals Technology Center internal report, 21 p.
Missiaen, T., McGee, T.M., Pearks, D., Ollier, G., and F. Theilen, 1996, An interdisciplinary approach to the evaluation ofphysical parameters of shallow marine sediments, IN De Batist, M., and P. Jacobs (eds), Geology of Siliciclastic Shelf Seas,Geological Society Special Publication No. 117, London, pp. 299-322.
Neurauter, T.W., and W.R. Bryant, 1989, Gas hydrates and their association with mud diapir/mud volcanoes on theLouisiana continental slope, Proceedings 21st Offshore Technology Conference (1989), Paper 5944, 599-608.
Pecher, I.A., Holbrook, W.S., Lizarralde, D., Hutchinson, D.R., Wood, W.T., Hoskins, H., and Stephen R.A., submitted,Shear waves through methane hydrate-bearing sediments -- Results from a combined walkaway-VSP and OBS experimentoffshore South Carolina. J. Geophys. Res.
Weimer, P. et al., 1998, Sequence stratigraphy of Pliocene and Pleistocene turbidite systems, northern Green Canyon andEwing Bank (offshore Louisiana), northern Gulf of Mexico, AAPG Bulletin, 82/5B, 918-960.


12
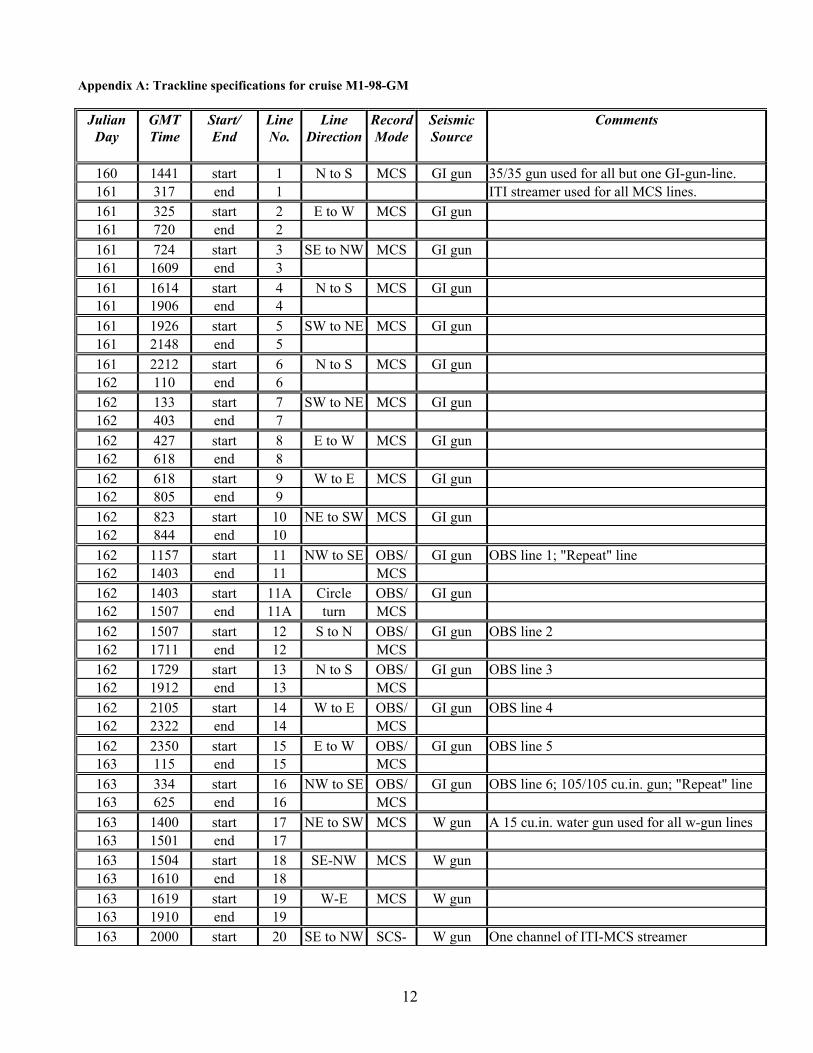
Appendix A: Trackline specifications for cruise M1-98-GM
JulianDay
GMTTime
Start/End
LineNo.
LineDirection
RecordMode
SeismicSource
Comments
160 1441 start 1 N to S MCS GI gun 35/35 gun used for all but one GI-gun-line.161 317 end 1 ITI streamer used for all MCS lines.161 325 start 2 E to W MCS GI gun161 720 end 2161 724 start 3 SE to NW MCS GI gun161 1609 end 3161 1614 start 4 N to S MCS GI gun161 1906 end 4161 1926 start 5 SW to NE MCS GI gun161 2148 end 5161 2212 start 6 N to S MCS GI gun162 110 end 6162 133 start 7 SW to NE MCS GI gun162 403 end 7162 427 start 8 E to W MCS GI gun162 618 end 8162 618 start 9 W to E MCS GI gun162 805 end 9162 823 start 10 NE to SW MCS GI gun162 844 end 10162 1157 start 11 NW to SE OBS/ GI gun OBS line 1; "Repeat" line162 1403 end 11 MCS162 1403 start 11A Circle OBS/ GI gun162 1507 end 11A turn MCS162 1507 start 12 S to N OBS/ GI gun OBS line 2162 1711 end 12 MCS162 1729 start 13 N to S OBS/ GI gun OBS line 3162 1912 end 13 MCS162 2105 start 14 W to E OBS/ GI gun OBS line 4162 2322 end 14 MCS162 2350 start 15 E to W OBS/ GI gun OBS line 5163 115 end 15 MCS163 334 start 16 NW to SE OBS/ GI gun OBS line 6; 105/105 cu.in. gun; "Repeat" line163 625 end 16 MCS163 1400 start 17 NE to SW MCS W gun A 15 cu.in. water gun used for all w-gun lines163 1501 end 17163 1504 start 18 SE-NW MCS W gun163 1610 end 18163 1619 start 19 W-E MCS W gun163 1910 end 19163 2000 start 20 SE to NW SCS- W gun One channel of ITI-MCS streamer

13
163 2309 end 20 SeaScp163 2315 start 21 SW to NE SCS- W gun One channel of ITI-MCS streamer164 2 end 21 SeaScp164 23 start 22 E to W SCS- W gun 3-element, 1-channel Benthos steamer.164 401 end 22 SeaScp164 624 start 23 W to E SCS Huntec Deep-tow: Source/receiver at about 200 m164 1123 end 23 below sea surface: range from 160-240 m.164 1142 start 24 E to W SCS Huntec164 1204 end 24164 1207 start 25 N to S SCS Huntec164 1244 end 25164 1250 start 26 N to S SCS Huntec164 1317 end 26164 1318 start 27 NW to SE SCS Huntec "Repeat" line164 1757 end 27164 1949 start 28 SE to NW SCS W gun Via Huntec streamer; "Repeat" line164 2230 end 28164 2330 start 29 N to S SCS Huntec165 238 end 29165 238 start 30 N to S SCS Huntec165 338 end 30165 357 start 31 W to E SCS Huntec165 430 end 31165 430 start 32 SW to NE SCS Huntec165 601 end 32165 601 start 33 NW to SE SCS Huntec165 635 end 33165 652 start 34 NE to SW SCS Huntec165 824 end 34165 840 start 35 SE to NW SCS Huntec165 1220 end 35165 1224 start 36 NE to SW SCS Huntec165 1236 end 36165 1239 start 37 NW to SE SCS Huntec165 1404 end 37165 1452 start 38 W to E SCS W gun Via Huntec streamer165 1756 end 38165 1827 start 39 SE to NW SCS Huntec Slow fire rate (5-sec): for special processing165 1948 end 39165 1948 start 40 NE to SW SCS Huntec Slow fire rate (5-sec): for special processing165 2019 end 40165 2019 start 41 NW to SE SCS Huntec Slow fire rate (5-sec): for special processing165 2055 end 41165 2103 start 42 SW to NE SCS W gun Via Huntec streamer165 2332 end 42

14
165/166 var. - 43-48 Var. SCS Huntec Short lines: searching for a diapiric structure166 9 start 49 SW to NE SCS Huntec166 421 end 49
166/167 - - - - - - Transit to shelter from high wind/seas167 2223 start 50 W to E OBS/ W gun OBS line 7168 137 end 50 MCS168 921 start 51 N to S SCS W gun Via Huntec streamer168 1024 end 51168 1035 start 52 NW to SE SCS W gun Via Huntec streamer168 1252 end 52168 1306 start 53 N to S SCS W gun Via Huntec streamer168 1448 end 53168 1452 start 54 E to W SCS W gun Via Huntec streamer168 1656 end 54168 1659 start 55 S to N SCS W gun Via Huntec streamer168 1740 end 55168 1744 start 56 NW to SE SCS W gun Via Huntec streamer168 1843 end 56168 1845 start 57 S to N SCS W gun Via Huntec streamer168 2140 end 57169 440 start 58 N to SE MCS W gun169 821 end 58169 821 start 59 NE to SW MCS W gun169 1040 end 59169 1044 start 60 SE to NW MCS W gun169 1143 end 60169 1148 start 61 SW to NE MCS W gun169 1449 end 61169 1449 start 62 E to W MCS W gun169 1537 end 62169 1537 start 63 NE to SW MCS W gun169 1818 end 63169 1838 start 64 NW to SE MCS W gun169 1946 end 64169 1954 start 65 SW to NE MCS W gun169 2024 end 65169 2030 start 66 SE to NW MCS W gun169 2108 end 66169 2108 start 67 N to S MCS W gun169 2151 end 67169 2151 start 68 NW to SE MCS W gun169 2321 end 68169 2321 start 69 NE to SW MCS W gun170 53 end 69170 53 start 70 SE to NW MCS W gun

15
170 137 end 70170 137 start 71 S to N MCS W gun170 209 end 71170 209 start 72 E to W MCS W gun170 235 end 72170 235 start 73 SE to NW MCS W gun170 325 end 73170 325 start 74 S to N MCS W gun170 1132 end 74

16
Appendix B: Specifications for OBS operations on cruise M1-98-GM
OBS Deployment 1:
JulianDay
Date1998
TimeGMT
Latitude(North)
Longitude(West)
Comments
162 6/11 9:28 28° 08.365’ 89° 38.992’ Release OBS 1B9:46 28° 07.607’ 89° 39.032’ Release OBS 1C
10:07 28° 07.619’ 89° 38.123’ Release OBS 1D10:24 28° 08.404’ 89° 38.107’ Release OBS 1F10:39 28° 09.166’ 89° 38.129’ Release OBS 1E10:54 28° 09.231’ 89° 39.060’ Release OBS 1A11:56 28° 10.833’ 89° 41.729’ SOL OBS 1 (MCS 11)12:00 28° 10.667’ 89° 41.615’ OBSs set to start recording14:02 28° 05.909’ 89° 36.140’ EOL OBS 1 (MCS 11), shoot in turn15:05 SOL OBS 2 (MCS 12)17:10 28° 11.653’ 89° 38.126’ EOL OBS 2 (MCS 12); shoot in turn17:25 28° 11.624’ 89° 39.039’ SOL OBS 317:28 28° 11.447’ 89° 39.093’ SOL MCS 1319:12 EOL OBS 3 (MCS 13)21:02 28° 07.616’ 89° 41.628’ SOL OBS 4 (MCS 14)23:21 28° 07.703’ 89° 34.884’ EOL OBS 4 (MCS 14), shoot in turn23:49 28° 08.394’ 89° 34.877’ SOL OBS 5 (MCS 15)
163 6/12 1:15 28° 08.396’ 89° 41.729’ EOL OBS 5 (MCS 15)~3:00 28° 11.756’ 89° 43.657’ SOL OBS 6 (MCS 16)6:25 28° 04.905’ 89° 35.088’ EOL OBS 6 (MCS 16).7:32 Release OBS 1D7:54 28° 07.634’ 89° 38.451’ OBS Alongside8:43 Release OBS 1F9:13 28° 08.403’ 89° 38.387’ Alongside9:36 Release OBS 1E
10:06 28° 09.133’ 89° 38.362’ Alongside10:37 Release OBS 1A11:12 28° 09.193 89° 39.311 Alongside11:41 Release OBS 1B
~12:15 28° 08.277’ 89° 39.241 Alongside12:30 Release OBS 1F12:59 28° 07.519’ 89° 39.272’ Alongside
Notes:* Data from the OBS disks were downloaded to a PC.* Intermittent problems: disk drives on PC; GPS clock times; OBS time log; seismic-shot trigger* OBSs drifted about 500 m from E to W between deployment and retrieval position.

17
OBS Deployment 2:
JulianDay
Date1998
TimeGMT
Latitude(North)
Longitude(West)
Comments
167 6/16 20:27 28° 07.776’ 89° 37.673’ OBS 2F released20:37 28° 07.712’ 89° 38.015’ OBS 2E released20:53 28° 07.778’ 89° 38.405’ OBS 2C released22:24 Start shooting22:30 28° 07.733’ 89° 41.667’ SOL OBS 7 (MCS 50)0:45 EOL OBS 7 (MCS 50), shoot in turn1:16 On line OBS 7a;1:36 28° 07.727’ 89° 37.348’ EOL OBS 7a2:23 Release OBS 2C2:52 28° 07.823’ 89° 38.600’ Alongside3:14 Release OBS 2E3:44 28° 07.746’ 89° 38.243’ Alongside4:05 Release OBS 2F4:34 28° 07.844’ 89° 37.882’ Alongside
Notes:* Only three of the planned six OBSs were deployed due to bad weather.* An E/W line was chosen to minimize effects of currents observed in the first deployment.* The eastern part of the profile was shot twice, because of trigger problems.