u.s. fish and wild service draft final function draft
TRANSCRIPT
U.S. Fish and Wild Service
DRAFT FINAL FunctionDRAFT FINAL Function--Based Stream Restoration Based Stream Restoration Project Process GuidelinesProject Process Guidelines
CBFOCBFO--S16S16--0303 June 2016June 2016

Appendix B - 7
DRAFT FINAL
FUNCTION-BASED STREAM RESTORATION PROJECT PROCESS
GUIDELINES
By: Richard Starr and Will Harman
Habitat Restoration Division
Chesapeake Bay Field Office
U.S. Fish and Wildlife Service
CBFO– S16 - 03
Annapolis, MD
June 2016


DRAFT Final Function-Based Stream Restoration Project Process Guidelines
U. S. Fish and Wildlife Service June 2016
Chesapeake Bay Field Office Page | i
TABLE OF CONTENTS
I. INTRODUCTION.................................................................................................................6
II. PURPOSE OF FUNCTION-BASED STREAM PROJECT PROCESS GUIDELINES6
III. PROJECT PROCESS GUIDELINES OVERVIEW .........................................................7
A. Overview ...........................................................................................................................7
B. Limitations ......................................................................................................................12 C. APPLICABILITY ...........................................................................................................12
IV. FUNCTION-BASED STREAM RESTORATION PROJECT PROCESS ...................13
A. Step 1 – Programmatic and Design Goals ......................................................................13
1. Purpose ...................................................................................................................13 2. Programmatic and Design Goal Development Process .........................................14
3. Programmatic and Project Goals Development Step-wise Process .......................15 B. Step 2 – Site Selection ....................................................................................................16
1. Purpose ...................................................................................................................16
2. Site Selection Process ............................................................................................16 3. Site Selection Step-wise Process ...........................................................................17
C. Step 3 – Watershed assessment.......................................................................................18 1. Purpose ...................................................................................................................18 2. Watershed Assessment Process .............................................................................19
3. Watershed Assessment Step-wise Process .............................................................21
4. Typical Watershed Assessment Parameters ...........................................................21 D. Step 4 - Reach Level Function-based Assessment .........................................................23
1. Purpose ...................................................................................................................23
2. Reach Level Function-based Assessment Process .................................................23 3. Reach Level Function-based Assessment Step-wise Process ................................27
4. Key Function-based Stream Assessment Parameters ............................................27 5. Other Ecological Function-based Assessments .....................................................29
E. Step 5 - Restoration Potential .........................................................................................29 1. Purpose ...................................................................................................................29
2. Restoration Potential Process .................................................................................30 3. Restoration Potential Step-wise Process ................................................................32
F. Step 6 - Design Objectives ..............................................................................................32
1. Purpose ...................................................................................................................32 2. Design Objectives Development Process ..............................................................32 3. Design Objectives Development Step-wise Process Steps ....................................33
G. Step 7 - Design Alternatives Analysis ............................................................................34
1. Purpose ...................................................................................................................34 2. Design Alternatives Analysis Process ...................................................................35 3. Design Alternatives Analysis Step-Wise Process ..................................................38
H. Step 8 - Design Development .........................................................................................39 1. Purpose ...................................................................................................................39

DRAFT Final Function-Based Stream Restoration Project Process Guidelines
U. S. Fish and Wildlife Service June 2016
Chesapeake Bay Field Office Page | ii
2. Design Development Process ................................................................................39 3. Design Development Step-wise Process ................................................................40
I. Step 9 - Monitoring .........................................................................................................41 1. Purpose ...................................................................................................................41
2. Monitoring Plan Development Process .................................................................41 3. Monitoring Plan Development Step-wise Process .................................................44 4. USFWS Rapid Stream Restoration Monitoring Protocol ......................................44
V. FUNCTION-BASED STREAM RESTORATION PROJECT REVIEW CHECK
LIST .....................................................................................................................................44
DRAFT Final Function-Based Stream Restoration Project Process Guidelines
U. S. Fish and Wildlife Service June 2016
Chesapeake Bay Field Office Page | iii
Title: DRAFT Final Function-Based Stream Restoration Project Process Guidelines
Date: June 2016
Prepared by:
Richard Starr, U.S. Fish and Wildlife Service, Annapolis MD
Will Harman, Stream Mechanics, Raleigh, NC
Appropriate Citation:
Starr, R. and W. Harman, 2016. DRAFT Final Function-Based Stream Restoration Project
Process Guidelines. U. S. Fish and Wildlife Service, Chesapeake Bay Field Office, Annapolis,
MD. CBFO S16-03.
DRAFT Final Function-Based Stream Restoration Project Process Guidelines
U. S. Fish and Wildlife Service June 2016
Chesapeake Bay Field Office Page | iv
LIST OF FIGURES
Figure 1. Stream Functions Pyramid
Figure 2. Stream Functions Pyramid Framework
Figure 3. Function-based Stream Restoration Project Process
Figure 4. Example Programmatic and Design Goals
Figure 5. Monitor Information Example
Figure 6. Review Checklist Structure
LIST OF TABLES
Table 1. Example of Assessment Parameters, Measurement Methods, and Performance
Standards
Table 2. Example Quantification Tool Assessment Display
Table 3. Example Quantification Tool Functional Lift Summary Display
Table 4. Restoration Potential Example
Table 5. Design Objectives Example
Table 6. Design Alternatives Analysis Example
Table 7. Monitoring Example

DRAFT Final Function-Based Stream Restoration Project Process Guidelines
U. S. Fish and Wildlife Service June 2016
Chesapeake Bay Field Office Page | v
APPENDICES
Appendix A. Project Process Review Checklist
Appendix B. “Step-wise” Function-based Project Process
Appendix C. Example Report Template
Appendix D. Example Goals, Objectives, Assessment Parameters based on Drivers
Appendix E. Example Site Selection Assessment
Appendix F. Regulatory Permit Requirements (Under review by MDE. Will be provided once
approved)


DRAFT Final Function-Based Stream Restoration Project Process Guidelines
U. S. Fish and Wildlife Service June 2016
Chesapeake Bay Field Office Page | 6
I. INTRODUCTION
The Maryland Department of Environment (MDE), Maryland State Highway Administration
(SHA) and the U.S. Fish and Wildlife Service (Service) - Chesapeake Bay Field Office (CBFO)
have entered into a partnership to assist MDE in meeting its goals for restoring and enhancing
the quality of Maryland’s water and floodplain resources. As part of this partnership, the Service
has developed six stream assessment and design review documents. This document is one of the
six. The other five documents include: 1) Function-based Rapid Stream Assessment
Methodology, 2) Analytical Design Review Checklist, 3) Natural Channel Design Review
Checklist, 4) Regenerative Storm Conveyance Design Review Checklist and 5) Valley
Restoration Design Review Checklist. All documents can be downloaded from the following
website: www.fws.gov/chesapeakebay/stream/protocols.html.
All of these documents have been developed to assist MDE regulators in the review of stream
restoration permit applications. However, they can also be used by stream restoration
practitioners and managers in implementing stream restoration projects. The documents are
based on the Stream Functions Pyramid Framework (SFPF) (Harman et al., 2012) and were
developed to be used together throughout the stream restoration project process. Additionally,
they were tailored for the Maryland nontidal wetland and waterway regulatory process and
requirements.
This document provides guidance on how to apply the SFPF to the stream restoration project
process. The function-based rapid stream assessment protocol is a rapid assessment protocol that
can be used to assist in the selection of restoration sites, evaluate stream systems for
prioritization purposes and validate detailed stream assessment results. The four design review
checklists are used to review stream restoration designs for completeness and potential for
success. Each document has a checklist to assist in the use of the guidelines. While these
documents are based on several existing and proven stream restoration project processes, they do
differ since they are based on the SFPF. Therefore, all six documents have been released as draft
finals. The Service and MDE requests feedback from users. The Service and MDE will then
revisit and potentially revise the documents based on feedback.
II. PURPOSE OF FUNCTION-BASED STREAM PROJECT PROCESS
GUIDELINES
The primary purposes of these guidelines are to provide a standardized science-based and
function-based stream restoration project process that can quantify the degree of functional uplift
and/or loss of biological, chemical and physical processes, and promote better communication
among all restoration stakeholders (e.g., restoration practitioners, regulators and scientists). The
function-based project process is also intended to assist the regulatory community in ensuring
that stream restoration efforts undertaken are consistent with the requirements of MDE and
implementation of the Clean Water Act (CWA). The document will guide users through the
stream restoration process from developing well-articulated goals and objectives, selecting
watershed and reach-level assessment parameters and measurement methods, conducting design
DRAFT Final Function-Based Stream Restoration Project Process Guidelines
U. S. Fish and Wildlife Service June 2016
Chesapeake Bay Field Office Page | 7
alternatives analysis, developing restoration designs and establishing quantifiable and
measureable monitoring performance standards. The goal of the guidelines is to assist applicants
in selecting and implementing the best project restoration solution based on watershed health,
stressors, constraints, reach-level conditions, restoration potential, goals and objectives and other
regulatory requirements.
These guidelines may also support recommendations made in the: Designing Sustainable Stream
Restoration Projects within the Chesapeake Bay Watershed - STAC Publication 15-003;
Chesapeake Bay – Stream Health Outcome Management Strategy – June 2015; Regional General
Permit for Chesapeake Bay TMDL, July 2015 - Baltimore District Corps of Engineers; and 2008
Compensatory Mitigation for Losses of Aquatic Resources – US Army Corps of Engineers
(USACE) and Environmental Protection Agency (EPA). All of which recommend the
development and/or use of a function-based stream restoration project process.
III. PROJECT PROCESS GUIDELINES OVERVIEW
A. OVERVIEW
The stream restoration project process is well established in the literature (EPA, 1995; Palmer et
al., 2005; Kondolf, 1995; Kondolf & Micheli, 1995; Ehrenfeld, 2000; Thorne et al., 2014). The
guidelines within this document are an extension of these processes. They are based on A
Function-Based Framework for Stream Assessment and Restoration Projects (Harman et al.,
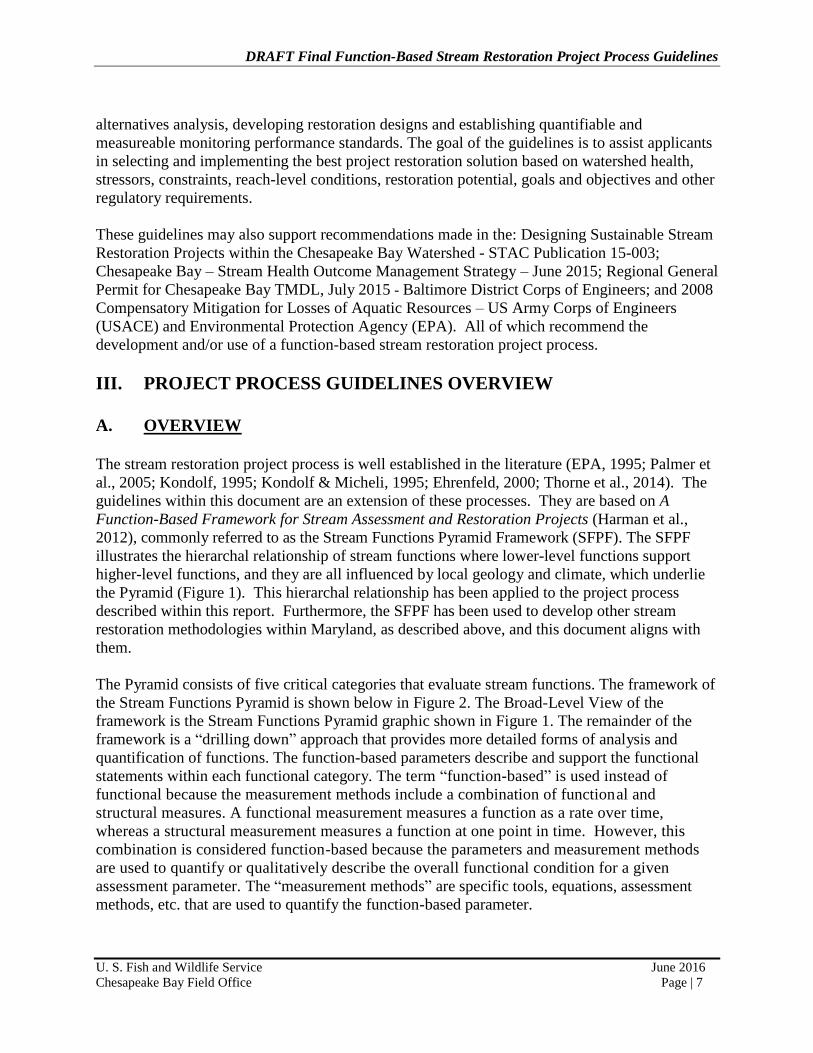
2012), commonly referred to as the Stream Functions Pyramid Framework (SFPF). The SFPF
illustrates the hierarchal relationship of stream functions where lower-level functions support
higher-level functions, and they are all influenced by local geology and climate, which underlie
the Pyramid (Figure 1). This hierarchal relationship has been applied to the project process
described within this report. Furthermore, the SFPF has been used to develop other stream
restoration methodologies within Maryland, as described above, and this document aligns with
them.
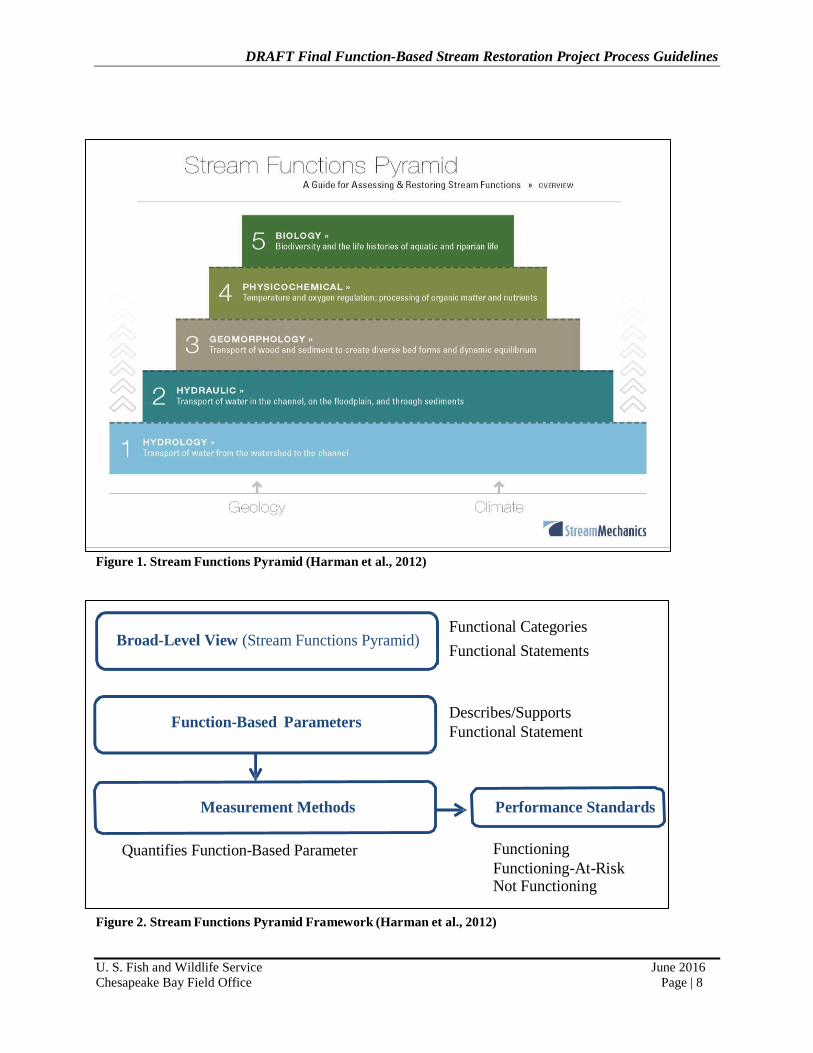
The Pyramid consists of five critical categories that evaluate stream functions. The framework of
the Stream Functions Pyramid is shown below in Figure 2. The Broad-Level View of the
framework is the Stream Functions Pyramid graphic shown in Figure 1. The remainder of the
framework is a “drilling down” approach that provides more detailed forms of analysis and
quantification of functions. The function-based parameters describe and support the functional
statements within each functional category. The term “function-based” is used instead of
functional because the measurement methods include a combination of functional and
structural measures. A functional measurement measures a function as a rate over time,
whereas a structural measurement measures a function at one point in time. However, this
combination is considered function-based because the parameters and measurement methods
are used to quantify or qualitatively describe the overall functional condition for a given
assessment parameter. The “measurement methods” are specific tools, equations, assessment
methods, etc. that are used to quantify the function-based parameter.
DRAFT Final Function-Based Stream Restoration Project Process Guidelines
U. S. Fish and Wildlife Service June 2016
Chesapeake Bay Field Office Page | 8
Figure 1. Stream Functions Pyramid (Harman et al., 2012)
Figure 2. Stream Functions Pyramid Framework (Harman et al., 2012)
Broad-Level View (Stream Functions Pyramid)
Functional Categories
Functional Statements
Function-Based Parameters
Describes/Supports
Functional Statement
Measurement Methods Performance Standards
Quantifies Function-Based Parameter Functioning
Functioning-At-Risk Not Functioning
DRAFT Final Function-Based Stream Restoration Project Process Guidelines
U. S. Fish and Wildlife Service June 2016
Chesapeake Bay Field Office Page | 9
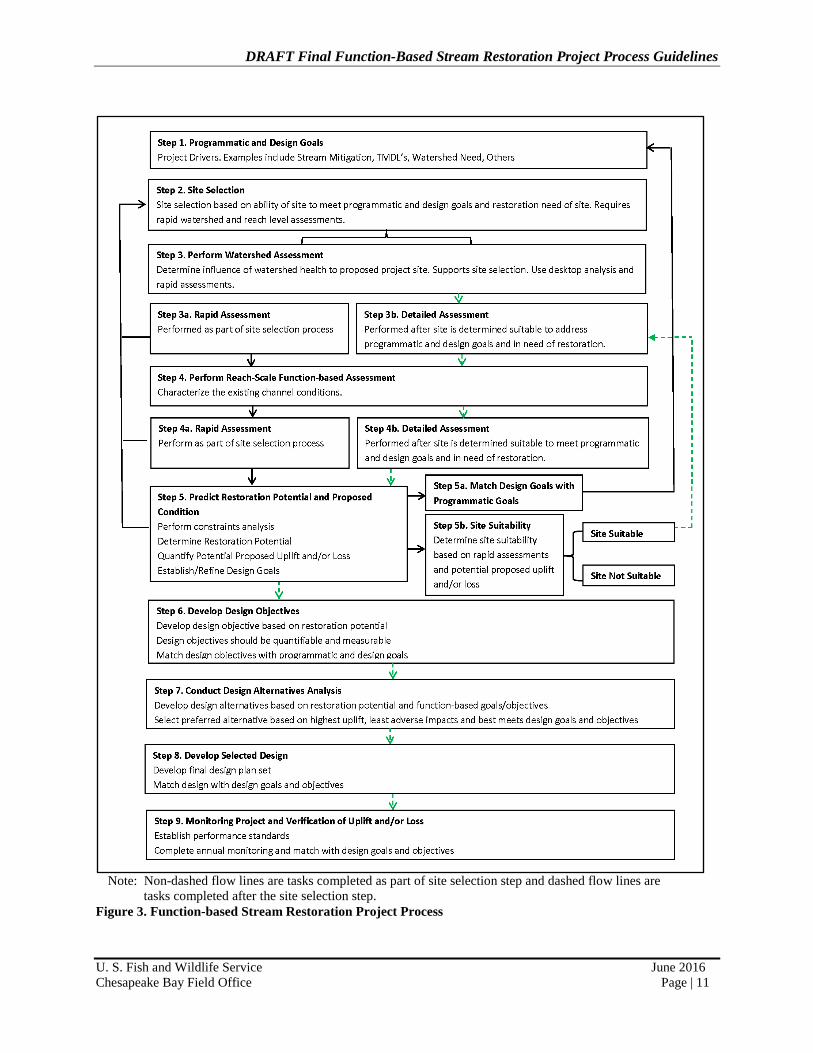
The Function-based Stream Restoration Project Process is comprised of nine sequential steps
(Figure 3) that create a transparent process which directly links programmatic goals with design
elements to support stream functions. Each step builds upon the previous step and at each step,
programmatic goals and design goals and objectives are re-evaluated to ensure they can still be
achieved. While each step builds upon the previous step, some steps can be repeated. For
example, as part of the site selection step, it is recommended that rapid watershed and reach
level assessments be conducted. A basic understanding of existing watershed health and reach
level function-based conditions is critical in determining whether a proposed project site is
suitable for restoration. Once the proposed site is deemed suitable for restoration (typically
after a pre-application meeting with regulators), detailed watershed and reach level assessments
might be necessary to properly develop and evaluate potential restoration solutions. The level
of detail for each step should be proportional to the complexity and size of the project site.
It is important to note that while all of these steps are necessary to complete a function-based
approach to a stream restoration project, they do not have to be completed concurrently with
review of a permit application. Watershed studies and assessments may be done in advance of
application submittal, as part of an MS-4 permit requirement, or as part of a comprehensive
watershed implementation plan to meet TMDL requirements. The existing supporting field
information generated during watershed plan development, plus the watershed plan itself, may be
submitted as part of the permit application. Function-based Stream Restoration Project Process:
Step 1 Programmatic and Design Goals – Program goals document why the
project is being proposed as typically stated by the owner, regulatory requirement
or funding source (e.g., stream mitigation, TMDL). Design goals are general
statements that describe why the project is needed (e.g., reduce streambank
erosion, improve brook trout habitat). This information is generally included in
the “project purpose” section of State/federal permit application.
Step 2 Site Selection - Determines if the site restoration potential can meet programmatic
and design goals as part of a site suitability decision making process. During this step in
the process, a pre-application meeting is recommended.
Step 3 Watershed Assessment – Determines the health of the drainage area
contributing water to the project reach and its influence on a project’s restoration
potential.
Step 4 Reach-Scale Function-based Assessment – Establishes the existing
function-based condition, identifies constraints and determines channel evolution.
Step 5 Restoration Potential – Determines the highest level of restoration that can be
achieved given the watershed conditions, function-based assessment results, stressors
and constraints. Also, it is at this point that the amount of potential functional lift will
be determined.
DRAFT Final Function-Based Stream Restoration Project Process Guidelines
U. S. Fish and Wildlife Service June 2016
Chesapeake Bay Field Office Page | 10
Step 6 Design Objectives – Establishes design objectives based on the
programmatic and design goals, results of the watershed and reach-scale
function-based assessment, constraints and restoration potential. Design
objectives are specific and tangible statements that define how the project is to
be completed (e.g., reduce streambank erosion to less than 0.01 ft/yr).
Step 7 Design Alternatives Analysis – Determines the restoration design approach that best meets the project goals, objectives and restoration potential of the site.
The focus is on how a design approach can change function-based parameters. During this step, further coordination with regulatory agencies is recommended to
ensure that there is general agreement on the design solution, so the application
review can be completed in a timely manner.
Step 8 Design Development – Documents the design development process, ensures
project feasibility, determines project implementation costs and produces a
constructible design set along with specifications and materials. Upon completion
of this step, an application should be submitted to regulatory agencies.
Step 9 Monitoring - The monitoring plan should determine if the quantifiable
project objectives are achieved.
This document contains a description of each step in the project process; guidance on how to conduct each step; brief examples; project process review checklist; and
examples of the project process applied to a variety of programmatic and design goals. Description will be brief and focus on how it relates to the SFPF. The
document is intended to be a guide in applying the SPFP to stream restoration projects and not a detailed methods protocol. Examples of how the SFPF project
process has been applied can be found on the U.S. Fish and Wildlife Service – Chesapeake Bay Field Office website at:
http://www.fws.gov/chesapeakebay/stream/projects.html. Additionally, a template
report format can be found in Appendix C.
DRAFT Final Function-Based Stream Restoration Project Process Guidelines
U. S. Fish and Wildlife Service June 2016
Chesapeake Bay Field Office Page | 11
Note: Non-dashed flow lines are tasks completed as part of site selection step and dashed flow lines are
tasks completed after the site selection step.
Figure 3. Function-based Stream Restoration Project Process

DRAFT Final Function-Based Stream Restoration Project Process Guidelines
U. S. Fish and Wildlife Service June 2016
Chesapeake Bay Field Office Page | 12
B. LIMITATIONS
Even though one of the purposes of this document is to ensure that stream restoration efforts
undertaken are consistent with the implementation of Maryland permit requirements and the
Clean Water Act, it does not address every permit application requirement. It does address
project purpose and need, objectives, existing conditions assessment, potential functional uplift,
potential impacts, design alternatives analysis and monitoring. It does not address other permit
requirements such as Section 7 Endangered Species Act, Section 6 Historic Resources,
mitigation requirements, design plan set requirements or any other special permit requirements.
Permit applicants should refer to MDE’s
(http://mde.maryland.gov/programs/Water/WetlandsandWaterways/Pages/Programs/WaterPrograms/wet
lands_waterways/index.aspx) and COE’s (http://www.nab.usace.army.mil/Missions/Regulatory.aspx)
websites for specific permit application requirements. However, some information related to
permit requirements is presented in Appendix F.
Another limitation to these guidelines is that they have been specifically developed to address
stream functions. It does not address other ecological resources which can exist within a stream
corridor (e.g., wetlands). It is common for stream restoration sites to have opportunities to
restore other stream corridor functions. If other ecological functions exist or are being proposed,
permit applicants should conduct appropriate assessments to document these ecological functions
so that they can be used during the design alternatives analysis.
C. APPLICABILITY
The applicability of the function-based stream restoration project process guidelines is
influenced by the type, size, location and complexity of a restoration effort. Stream restoration
projects that involve physical manipulation to intermittent and perennial stream channels can
benefit from these guidelines (Harman et al., 2012). However, restoration activities in ephemeral
channels and uplands may benefit less from using these guidelines. Implementation of upland
stormwater BMPs, Low Impact Development and other practices typically have goals to reduce
flow energy, reduce nutrients and remove other inorganic and organic compounds. These project
types would rely more on conventional approaches to stormwater treatment rather than the SFPF.
Water quality solutions like treating point source discharges and lime dosing may not need the
SFPF guidelines as well to set design goals or develop assessment methods. However, even in
these cases, it is always appropriate to ask, “What are the supporting functions and conditions
that are required to meet the desired result?” This is important because other problems may exist
in addition to the obvious impairment. For example, low pH is a commonly known problem in
some Maryland trout streams. If streams with low pH where dosed with lime and improvements
in trout populations were variable, then the actual cause of changes in populations could not be
determined. This is because only one parameter that influences trout populations was addressed.
Therefore, an understanding of key functions in all five levels is needed in order to find a
solution. Reducing pH may be the most important part of the solution, but other function-based

DRAFT Final Function-Based Stream Restoration Project Process Guidelines
U. S. Fish and Wildlife Service June 2016
Chesapeake Bay Field Office Page | 13
parameters may also need to be addressed, e.g. improved bed form diversity, to recover trout
populations.
While the purpose of these guidelines is to provide guidance on how to apply a function-based
approach to stream restoration projects, the SFPF has broader applications to stream related
efforts. As stated above, the SFPF is a framework that is intended to show the hierarchical
relationship among stream functions. Understanding how stream functions influence and are
influenced by each other allows those involved in stream related work to understand and predict
how functions could be influenced by in-stream and/or watershed changes. Even though many
stream restoration efforts consist of multi-discipline teams, they can still struggle in
understanding how individual functions interact and influence one another as well as support the
project goal(s). The SPFP provides a means for these different stream disciplines to effectively
communicate and see how lower-level functions support higher-level functions.
The SPFP can be applied to a variety of stream efforts including watershed assessments and
stressor identification, strategic planning and prioritization, on-the-ground implementation
(well-established and innovative approaches), management decisions, monitoring and research.
For example, a stream restoration manager would like to determine the best locations to achieve
the highest stream functional uplift within a particular watershed. The Function-based Rapid
Stream Assessment Protocol (Starr et al., 2015) could be used to assess all stream reaches within
the watershed. That data then could be used to show existing function-based conditions and the
restoration potential for each reach assessed. The reaches that are most degraded and have the
highest restoration potential would be the preferred stream restoration sites for the stream
restoration manager.
IV. FUNCTION-BASED STREAM RESTORATION PROJECT
PROCESS
This section contains a description of each step in the function-based project process, guidance
on how to conduct each step and brief examples.
A. STEP 1 – PROGRAMMATIC AND DESIGN GOALS
1. Purpose
Developing goals and objectives is important for projects of all sizes. Well-articulated goals and
objectives establish a foundation for project success. Vague, too broad or poorly articulated goals
and objectives often lead to project failure at worst, and misunderstandings at best. This is
directly related to project uncertainty and risk. As described in Section IV. G. Design
Alternatives Analysis, poor or inappropriate design goals and objectives increase project
uncertainty and risk.
The terms goals and objectives are often used interchangeably; however, there is a difference.
Goals are statements about why the project or effort is needed. They are general intentions and

DRAFT Final Function-Based Stream Restoration Project Process Guidelines
U. S. Fish and Wildlife Service June 2016
Chesapeake Bay Field Office Page | 14
often cannot be validated. The goal should relate to the primary function(s) of interest, e.g. life
history of some type of aquatic life. Objectives can also be used to identify the supporting
functions needed to meet the goal and should help explain how the functional improvement will
occur. Objectives are more specific. They are tangible and can be validated, typically by the
performance standard (Harman et al., 2012). A detailed description of objectives is presented
below in Section IV. F. Design Objectives.
Goals are divided into two categories: programmatic and design. Programmatic goals are created
from agency and organization funding programs or regulatory requirements. Examples include:
Total Maximum Daily Load (TMDL) allocations, providing stream mitigation credits, restoring
listed or candidate species, addressing watershed needs based on a watershed management plan
and others. They can be linked to regulatory requirements, but can also be initiatives developed
through voluntary efforts.
Design goals are general statements that describe why the project is needed (e.g., reduce
sediment loads coming from streambank erosion) and should align with the programmatic goals.
For example, if the programmatic goal is to implement stream restoration projects for a TMDL
associated with sediment and nutrient pollution, a design goal may be to reduce sediment and
nutrient loading from adjacent cropland. The process of matching the programmatic goal to the
project’s design goal can help ensure that a project is providing the intended functional benefit.
Furthermore, design goals must be based on the restoration potential at the proposed project site
(Refer to Section IV. E. Restoration Potential). Ensuring that design goals can be achieved based
on the restoration potential ensures that any proposed functional uplift can be supported by the
health of the contributing watershed and existing functional condition of the proposed project
site.
Since design goals are based on restoration potential, some general knowledge of the proposed
project site must exist. This information can come from watershed assessment and prioritization
documents or rapid reach level assessments. Refer to Section IV. B. Site Selection on how to
develop or refine design goals. If existing data are not available, then developing design goals
may have to wait until the proposed project site is assessed.
Programmatic and design goals are also part of the permit application. This information is
generally included in the “project purpose” (i.e., What is the need for the project?) section of
state/Federal joint permit application. Regulatory agencies have the authority to independently
define “project purpose.” This is more likely to happen when a project purpose is too broad or
too narrow or when a project may have other mandate considerations. Restoration practitioners
may find it beneficial and efficient to coordinate with regulatory agencies to arrive at a mutual
decision regarding the most appropriate goals for a proposed project site.
2. Programmatic and Design Goal Development Process
Establishing programmatic and design goals is a relatively easy process as long as they are not
mixed with objectives. It starts by identifying the driver(s) that is funding the stream restoration
DRAFT Final Function-Based Stream Restoration Project Process Guidelines
U. S. Fish and Wildlife Service June 2016
Chesapeake Bay Field Office Page | 15
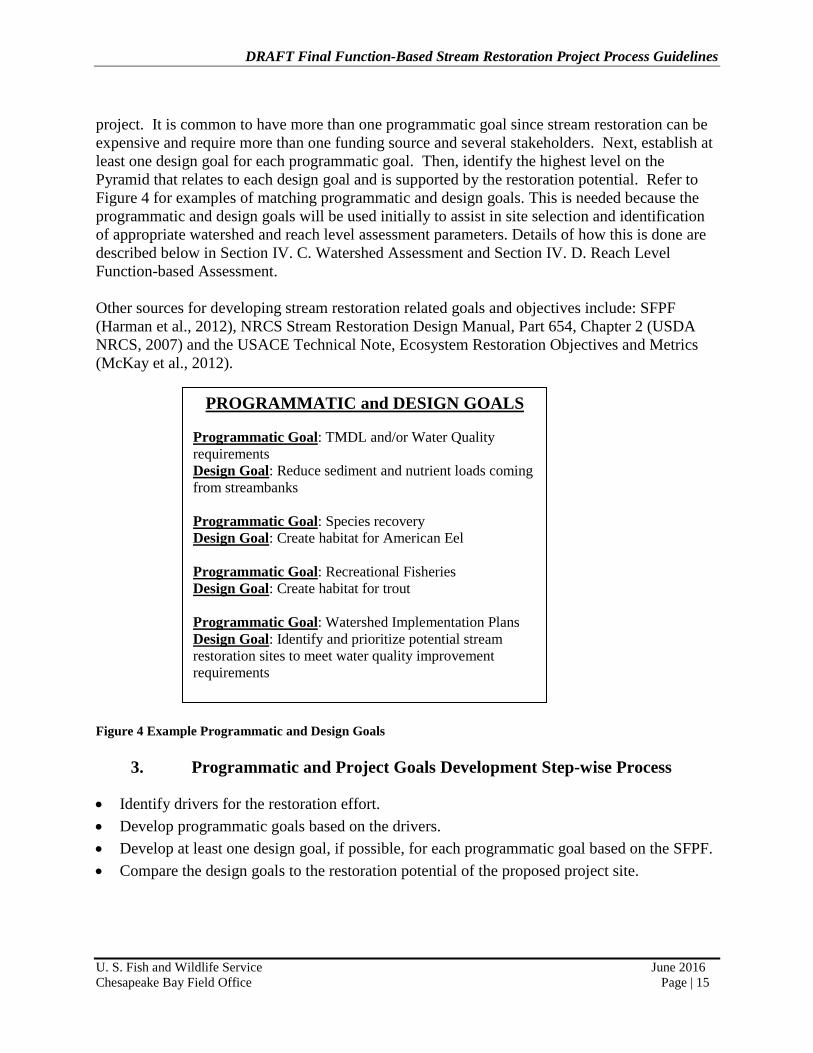
project. It is common to have more than one programmatic goal since stream restoration can be
expensive and require more than one funding source and several stakeholders. Next, establish at
least one design goal for each programmatic goal. Then, identify the highest level on the
Pyramid that relates to each design goal and is supported by the restoration potential. Refer to
Figure 4 for examples of matching programmatic and design goals. This is needed because the
programmatic and design goals will be used initially to assist in site selection and identification
of appropriate watershed and reach level assessment parameters. Details of how this is done are
described below in Section IV. C. Watershed Assessment and Section IV. D. Reach Level
Function-based Assessment.
Other sources for developing stream restoration related goals and objectives include: SFPF
(Harman et al., 2012), NRCS Stream Restoration Design Manual, Part 654, Chapter 2 (USDA
NRCS, 2007) and the USACE Technical Note, Ecosystem Restoration Objectives and Metrics
(McKay et al., 2012).
Figure 4 Example Programmatic and Design Goals
3. Programmatic and Project Goals Development Step-wise Process
Identify drivers for the restoration effort.
Develop programmatic goals based on the drivers.
Develop at least one design goal, if possible, for each programmatic goal based on the SFPF.
Compare the design goals to the restoration potential of the proposed project site.
PROGRAMMATIC and DESIGN GOALS
Programmatic Goal: TMDL and/or Water Quality
requirements
Design Goal: Reduce sediment and nutrient loads coming
from streambanks
Programmatic Goal: Species recovery
Design Goal: Create habitat for American Eel
Programmatic Goal: Recreational Fisheries
Design Goal: Create habitat for trout
Programmatic Goal: Watershed Implementation Plans
Design Goal: Identify and prioritize potential stream
restoration sites to meet water quality improvement
requirements

DRAFT Final Function-Based Stream Restoration Project Process Guidelines
U. S. Fish and Wildlife Service June 2016
Chesapeake Bay Field Office Page | 16
B. STEP 2 – SITE SELECTION
1. Purpose
The purpose of the site selection is to document existing function-based conditions and
determine whether the restoration potential of the site can meet the programmatic goal(s) and
develop or refine design goals. It is not to determine whether there is another potential site that
would better address the programmatic and design goals. The prioritization of potential
restoration sites is typically done through a broad-scale watershed assessment and is a different
process than what is described within this section. However, the results of such a study can be
used to assist in the identification of sites that could potentially meet the programmatic goal(s)
and to develop design goals. Study results should be included with a permit application.
Additionally, if there is a proposed restoration solution, the potential uplift and adverse impacts
to stream functions can be determined as part of the site selection assessment.
2. Site Selection Process
The site selection process begins by collecting readily available and relevant watershed and
reach level information (e.g., watershed assessments, management plans, reach level
assessments, water quality data, species data, etc.) related to a proposed project site. The existing
data should describe, at least qualitatively, the current functional condition of critical stream and
other ecological functions (e.g., wetlands, mature forest). This is important because the
evaluation of potential effects to all existing ecological functions from proposed design solutions
is a permit requirement. Refer to Section IV. C. Watershed Assessment and IV. D. Reach Level
Function-based Assessment on how to determine appropriate assessment parameters.
If data does not exist, some level of watershed and reach level assessment needs to occur. Even if
data does exist, field verification of the data should occur. The field verification assessment can
be rapid and qualitative, but must address critical functions on all levels of the Pyramid. Refer to
the Function-based Rapid Stream Assessment Methodology (Starr et al., 2015) for examples of
rapid watershed and reach level assessments. If other critical ecological resources exist,
assessments for these ecological resources need to be conducted. The reach level assessment
should also determine the channel evolution sequence (Refer to Section IV. D. Reach Level
Function-based Assessment). Lastly, identify any constraints that may influence reach level
functional uplift. Refer to Section IV. C. 2. Watershed Assessment Process for further detail on
identifying constraints.
Based on all the data collected, determine the highest restoration potential and the associated
Pyramid level. Refer to Section IV. F. Restoration Potential for a detailed description on how to
determine restoration potential. Also, if there is a proposed plan of action, identify any potential
uplift and/or adverse impacts to existing stream and other ecological functions. Note that a full
design alternatives analysis must occur later in the project process (Refer to Section IV. G.
Design Alternatives Analysis) before a preferred plan of action can be selected.
DRAFT Final Function-Based Stream Restoration Project Process Guidelines
U. S. Fish and Wildlife Service June 2016
Chesapeake Bay Field Office Page | 17
If design goals are not yet established, develop the goals based on the collected data and in line
with the programmatic goals. Compare the restoration potential to the programmatic and design
goals. Determine if there are potentially significant adverse impacts to existing functions. If the
restoration potential is at least as high as the programmatic and design goals and there are no
potential adverse impacts to existing functions, then the site is suitable for restoration. If the
programmatic and/or design goals cannot be achieved at the proposed project site and/or
potential adverse impacts are significant, then the site is not suitable for restoration for those
particular programmatic and/or design goals. If the site is not suitable for a certain type of
restoration, consider revising design goals and/or potential restoration solutions. If the site is not
suitable and the design goals and/or potential restoration solutions cannot be revised, then the
site should be eliminated from further consideration as a potential site to meet the programmatic
goal(s).
Lastly, describe how the proposed project supports existing and current larger-scale (Statewide,
regional, watershed) plans or policies, if applicable. Furthermore, describe how the
programmatic and design goals for the proposed project site cannot be achieved at other potential
sites. An example of how the site selection process can be applied to a proposed project site is
provided in Appendix E.
Pre-application consultation with regulatory agencies to determine their concurrence on goals
and suitability of the site for restoration is highly recommended at this step.
3. Site Selection Step-wise Process
Obtain readily available and relevant information (e.g., watershed assessments, management
plans, reach level assessments, water quality data, species data, etc.) related to a proposed
project site or study area. Some of this information may already be included in Watershed
Implementation Plans or watershed plans required for MS-4 permits.
Review the data to: determine the existing function-based conditions of the proposed project
site; identify constraints; establish restoration potential; if there is a proposed design solution,
predict potential functional uplift and/or loss; and develop or refine design goals.
To validate existing information or if existing data is not available, conduct rapid watershed
and reach level assessments. The assessment should assess parameters that support the
programmatic and design goals. Refer to the Function-based Rapid Stream Assessment
Methodology (Starr et al., 2015) for an example of a rapid watershed assessment.
Conduct a “windshield” tour of the watershed to validate the findings of the existing data
and/or rapid watershed assessment and focus on identifying stressors that may influence
reach level functional uplift.
Visit the proposed project site and conduct a rapid assessment to determine the existing
function-based conditions. Refer to the Function-based Rapid Stream Assessment
Methodology (Starr et al., 2015) for an example of a rapid reach level assessment.
Conduct other assessments necessary to document other ecological functions (e.g., wetlands,
mature forests) occurring within the project site.
DRAFT Final Function-Based Stream Restoration Project Process Guidelines
U. S. Fish and Wildlife Service June 2016
Chesapeake Bay Field Office Page | 18
Determine the channel evolution sequence. Refer to Section IV. D. Reach Level Function-
based Assessment.
Identify any constraints that may influence reach level functional uplift.
Determine the highest restoration potential and the associated Pyramid level of the proposed
project site based on the watershed health (i.e., stressors), constraints and reach level
function-based conditions. Refer to Section IV. F. Restoration Potential for a detailed
description on how to determine restoration potential.
If there is a proposed plan of action, identify any potential uplift and/or adverse impacts to
existing stream and other ecological (e.g., wetlands) functions.
Develop design goals, if not already established.
Compare the restoration potential to the programmatic and design goals.
Determine if there are potentially significant adverse impacts to existing functions.
If the restoration potential is at least as high as the programmatic and design goals and there
are no potential adverse impacts to existing functions, then the site is suitable for restoration.
If the programmatic and/or design goals cannot be achieved at the proposed project site
and/or potential adverse impacts are significant, then the site is not suitable for restoration to
meet those goals.
If the site is not suitable for restoration, consider revising design goals and/or potential
restoration solutions.
If the site is not suitable and the design goals and/or potential restoration solutions cannot be
revised, then the site should be eliminated from further consideration as a potential site to
meet the programmatic goal(s).
Describe how the proposed project supports existing and current larger-scale (Statewide,
regional, watershed) plans or policies, if applicable. Describe how the programmatic and design goals for the proposed project site cannot be
achieved at another potential site. Note: This determination may have already been
documented in a comprehensive watershed plan, MS-4 restoration plan; or Watershed
Implementation Plan.
Consider a pre-permit application meeting with regulatory agencies to discuss results of site
selection assessment.
C. STEP 3 – WATERSHED ASSESSMENT
1. Purpose
The purpose of the watershed assessment is to determine the health of the watershed and its
influence on the proposed project site. The watershed assessment is separate from the broad-
scale watershed planning process that recommends priority upland and in-stream restoration
projects. It focuses on identifying stressors, causes of stressors and the effects of stressors on the
existing function-based condition of a proposed project site. The process involves selecting
watershed assessment parameters, following the Pyramid, that support the programmatic goals
and using that information to determine if programmatic goals are achievable, as well as
establish the restoration potential of the proposed project site.
DRAFT Final Function-Based Stream Restoration Project Process Guidelines
U. S. Fish and Wildlife Service June 2016
Chesapeake Bay Field Office Page | 19
Two levels of watershed assessment typically occur during the stream restoration process. One
is a brief or rapid assessment used during the site selection process, as described above in
Section IV. B. Site Selection. The other is a more detailed assessment, if necessary, used in the
development and evaluation of design solutions.
This section focuses on describing how to apply the SFPF to a watershed assessment and is
not a “step-wise” description of how to conduct a watershed assessment.
2. Watershed Assessment Process
The watershed assessment process begins by selecting watershed assessment parameters.
Parameters on all levels of the Pyramid must be assessed, at least to some degree, to determine
the influence of the watershed health on the proposed project area. This is important because the
evaluation of potential effects to existing stream functions from proposed design solutions is a
permit requirement.
The level of detail associated with the watershed assessment is determined by programmatic and
design goals and when in the study process the assessment occurs (i.e., site selection versus
design alternative analysis). If it is during the site selection, a rapid assessment would, in most
cases, be appropriate. The rapid watershed assessment methodology described in the Function-
based Rapid Assessment Methodology (Starr et al., 2015) is a rapid assessment protocol that
assesses all levels of the Pyramid. Other protocols can be used; however, they should address all
levels of the Pyramid. To determine whether a protocol contains appropriate assessment
parameters, refer to Section IV. C. 3. Typical Watershed Assessment Parameters.
If the watershed assessment is used during the design alternative analysis, a more detailed
watershed assessment, in most cases, is required. The level of detail is based on the
programmatic and design goal. Enough information should be collected in order to determine
whether the watershed health could support the programmatic goal(s). This process starts by
determining what level of the Pyramid is targeted by the programmatic goal(s). For example, if
the programmatic goal is to reduce nutrients, then detailed watershed data will need to be
collected through Pyramid Level 4 – Physicochemical. The amount of nutrients being delivered
to the proposed project area needs to be quantified in order to determine if the proposed design
solution could reduce nutrient levels. However, if the programmatic goal is to reduce lateral
erosion (Pyramid Level 3 – Geomorphology), water quality still needs to be evaluated for
permitting requirements but can be qualitative based, such as based on watershed land uses and
observations. In this case, the level of information collected should be enough to determine
whether the existing biological condition of the proposed project site is more influenced by the
watershed health or existing reach level conditions, or possibly both. Lastly, the level of detail is
also influenced by project budget and watershed size and complexity.
Once the assessment is complete, the data needs to be related to functional processes. For
example, a watershed could have a percent impervious surface of 15 percent. This data point in

DRAFT Final Function-Based Stream Restoration Project Process Guidelines
U. S. Fish and Wildlife Service June 2016
Chesapeake Bay Field Office Page | 20
itself does not describe how it affects the watershed and stream functions. Therefore, a
description of how it influences watershed processes is needed. In this particular case, research
(Schueler et al., 2009) has shown that 15 percent imperviousness can increase flow regime (i.e.,
precipitation time and concentration) and adversely impact water quality, both of which affect
biology. Now the impervious surface data has meaning to the proposed project site and can be
used to determine restoration potential and develop restoration solutions.
Along with identifying natural watershed stressors, constraints must be identified. Constraints
are natural or man-made and limit potential restoration alternatives, which then influences
restoration potential. Typical man-made constraints include such things as roads, bridges, utility
lines, reservoirs, flood control structures, buildings, property boundaries and policies and
regulations. As stated in MDE COMAR 26.23.02.05B(2)e, natural features can also be
considered constraints. A natural constraint could be existing high-functioning or sensitive
natural or water resources and soil properties.
The final step in determining how the health of the watershed influences the proposed project
site is to describe all of the individual watershed data together. The description should include
how all of the watershed data relate (i.e., support and rely upon) to one another and influence the
potential project site. Furthermore, this description should state whether the watershed health
can support the project goals. The following example is an excerpt from the Little Tuscarora
Stream Restoration Project Assessment and Design Report (Hutzell et al., 2015):
“The Little Tuscarora Creek watershed is an actively developing watershed. It is
unique, in part, by the fact that it consists of two physiographic regions and is
underlain by 41 percent karst topography. These things alone are known to alter
flow volumes and duration. Additionally, decades of poor agriculture practices
have compromised much of the physical integrity of the channel and riparian
corridor. The more recent land use changes, including increased development,
has led to higher percentages of impervious surface, which contributes to higher
flows and thermal loading. While the flows have increased, they have not
increased to an amount to be considered flashy, therefore, the flow regime is
considered non-flashy. This means that the proposed project will have a ground
water recharge source and flood flows will not be as elevated as similar sized
watershed with higher runoff rates. However, these higher flows, coupled with
poor riparian buffers and erosive soils, have led to widespread lateral instability
throughout the watershed. Therefore, the proposed project area will have a
sediment supply that must be addressed in the proposed design. Lastly, the
increased impervious surfaces and poor riparian vegetation will increase water
temperatures. This adversely affects the ability of the proposed project area to
support brook trout. However, as noted by Frederick County’s CAMBI report
(Moore, 2011), the Little Tuscarora Creek watershed is dominated by coldwater
springs which is a positive effect on water temperatures.
DRAFT Final Function-Based Stream Restoration Project Process Guidelines
U. S. Fish and Wildlife Service June 2016
Chesapeake Bay Field Office Page | 21
Collectively, these “stressors” impact the restoration potential of the proposed
project area. While these stressors cannot currently be addressed at the
watershed level as part of this project, they can be addressed at the reach-level
with the appropriate design approach. As mention earlier, the Frederick County
Division of Public Works, Eastern Brook Trout Joint Venture and Maryland
Brook Trout Alliance has identified this watershed as a high priority for brook
trout restoration in their working draft CAMBI report (Moore, 2011).
Additionally, the upper, less impacted, portion of the watershed still holds and
nourishes an intact brook trout population. This, along with Frederick County
efforts, is enough to support the project goal of creating a habitat suitable for
seasonal brook trout usage.”
By understanding watershed conditions we are able to determine if programmatic and design
goals are achievable, as well as determine the restoration potential of the project reach.
3. Watershed Assessment Step-wise Process
Select watershed assessment parameters based on permit requirements and programmatic and
design goals. All levels of the Pyramid should be assessed.
Determine level of assessment and measurement methods based on when assessment occurs
during the study process, programmatic goals, project budget and watershed size and
complexity.
Determine if the measurement methods need to be adapted based on unique regional
characteristics (e.g. karst topography and location of endangered species).
Determine how to relate watershed data to functions so that it can be used to understand how
the watershed health influences the proposed project site.
Implement the appropriate level of watershed assessment, evaluate its effectiveness in
assessing watershed processes, and adapt method as necessary.
Identify stressors and constraints.
Combine all watershed data and determine if the watershed health will support the
programmatic and design goals. If the success of restoration depends on other actions taking
place in the watershed, note this information as well.
4. Typical Watershed Assessment Parameters
Watershed assessments typically assess such watershed characteristics as geology, soils, current
and future land uses, land cover types, percent impervious surfaces, hydrology, etc. to describe
watershed characteristics and processes and to identify stressors. However, these data by
themselves do not help us understand how they might influence the proposed project site and
support the programmatic and design goals. Therefore, a description of how watershed
characteristics influence watershed processes is needed. For stream restoration projects,
watershed data is typically collected to describe four watershed processes: hydrology (i.e., flow
regime) (Pyramid Level 1), sediment supply (i.e., sources and amount) (Pyramid Level 3), water

DRAFT Final Function-Based Stream Restoration Project Process Guidelines
U. S. Fish and Wildlife Service June 2016
Chesapeake Bay Field Office Page | 22
quality (i.e., types and sources) (Pyramid Level 4) and landscape connectivity (i.e., upstream and
downstream biological health) (Pyramid Level 5).
An understanding of flow regime is needed to determine how much and how quickly
precipitation runoff reaches a stream, typically referred to as time and concentration. The
amount and rate of precipitation runoff influences many stream processes (e.g., stream energy,
bedform diversity, based flows, etc.) (Knighton, 1998) which in turn influences stream
restoration solutions. Typical watershed characteristics used to understand flow regime include
precipitation, geology, soils, basin shape and relief, road systems, reservoirs and land uses.
Sediment transport is a critical stream function because it significantly influences the creation
and maintenance of stream channel dimensions (i.e., cross section and profile) (Yang, 2003).
Sediment transport is a product of sediment supply and hydrology/flow regime. A stream
typically must be able to transport the sediment supply being delivered by the watershed or
degradation and/or aggradation could occur. Assessment of sediment supply, at the watershed
level, focuses on identifying sources and estimating, qualitatively, the amount of sediment
supply. Typical watershed characteristics assessed for determining sediment supply include land
uses, riparian vegetation, percent impervious surfaces, stream stability, landscape topology,
depositional patterns, road systems, soils and geology.
Water quality is significant because it influences biological health (Schueler et al., 2009). If a
stream restoration project has biological uplift goals, then water quality must be assessed. There
are numerous water quality parameters and which ones are assessed is highly variable depending
upon programmatic goals and watershed characteristics. Additionally, assessment of water
quality involves identifying point source and non-point source pollution sources. Typical
watershed characteristics assessed for determining water quality include land uses, percent
impervious surfaces, soils and geology.
Landscape connectivity also influences biological health because it can be a source of
macroinvertebrates and fish that can populate a newly restored stream reach. If stream reaches
upstream and downstream are impaired and do not have healthy macroinvertebrates and fish,
then it is unlikely that a newly restored stream reach would have biological uplift. The
determination of landscape connectivity is mostly based on the health and condition of upstream
and downstream stream reaches and involves using the data collected as part of the watershed
assessment and a field visit inspection to determine the presence of macroinvertebrates and fish.
If there are biological programmatic goals, a detailed biological assessment, such as methods
used in the Maryland Biological Stream Survey, may be required.
DRAFT Final Function-Based Stream Restoration Project Process Guidelines
U. S. Fish and Wildlife Service June 2016
Chesapeake Bay Field Office Page | 23
D. STEP 4 - REACH LEVEL FUNCTION-BASED ASSESSMENT
1. Purpose
The purpose of the reach level function-based assessment is to establish the existing functional
condition, determine stressors and identify constraints at the proposed project site. This
information will be used to describe the hierarchical influences of existing functions and to
develop a cause and effect relationship between these functions and the stressors and constraints
at both the watershed and reach-level. Just like the watershed assessment, this process involves
selecting appropriate stream assessment parameters that support the design goals and establish
the restoration potential of the proposed project site.
This section focuses on describing how to apply the SFPF to a reach level function-based
assessment and is not a “step-wise” description of how to conduct a reach level function-based
assessment.
2. Reach Level Function-based Assessment Process
The reach level function-based assessment process generally follows the same process as the
watershed assessment. There are two levels of reach assessment that typically occur during the
stream restoration process. One is a brief or rapid assessment used during the site selection
process, as described above in Section IV. B. Site Selection. The other is a more detailed
assessment used in the development and evaluation of design solutions.
In both cases, appropriate parameters must be assessed. There are two factors that influence the
selection of assessment parameters. The first is programmatic and design goals. Parameters must
be selected that allow decision makers to determine if the goals can be achieved. The second is
permit requirements. Permit regulations require that applicants document potential effects to
physical, chemical and biological functions and resources. Therefore, parameters on all levels of
the Pyramid, which may be influenced by the proposed project, must be assessed to some degree.
An example of an appropriate rapid reach level assessment methodology is described in the
Function-based Rapid Assessment Methodology (Starr et al., 2015). Other protocols can be used;
however, they should address all levels of the Pyramid. To determine whether a protocol
contains appropriate assessment parameters, refer to Section IV. D. 3. Typical Reach Level
Assessment Parameters.
For detailed reach level assessment guidance, use the Pyramid as a guide to select specific
assessment parameters. Identify the highest Pyramid level that corresponds to the programmatic
and design goals. Then select assessment parameters at that level and all other lower levels that
can be used to determine whether the goals can be achieved. For example, if the programmatic
goals are to provide lateral and vertical stability, then the highest Pyramid level associated with
these goals would be Level 3 – Geomorphology. Parameters that influence lateral and vertical
DRAFT Final Function-Based Stream Restoration Project Process Guidelines
U. S. Fish and Wildlife Service June 2016
Chesapeake Bay Field Office Page | 24
stability with Level 3 – Geomorphology, as well as the lower levels (i.e., Level 2 – Hydraulics
and Level 1 – Hydrology) should be identified and assessed. Next, if there are Pyramid levels
higher than that of the Pyramid level that corresponds to the goals, select assessment parameters
for the remaining Pyramid levels to address regulatory requirements. Following the same
example above, Pyramid Levels 4 – Physicochemical and 5 - Biology would need parameters
identified and assessed.
For each selected assessment parameter, select at least one measurement method and a
corresponding performance standard for each measurement method. The level of effort of the
measurement methods is influenced by the proposed project length, functional complexity and
project budget. Table 1 is an example of potential assessment parameters and measurement
methods by Pyramid level. Examples of typical assessment parameters by programmatic and
design goals are in Appendix D. Additional examples can also be found in the SFPF (Harman et
al., 2012) and at the U.S. Fish and Wildlife Service – Chesapeake Bay Field Office website:
www.fws.gov/chesapeakebay/stream/projects.html.
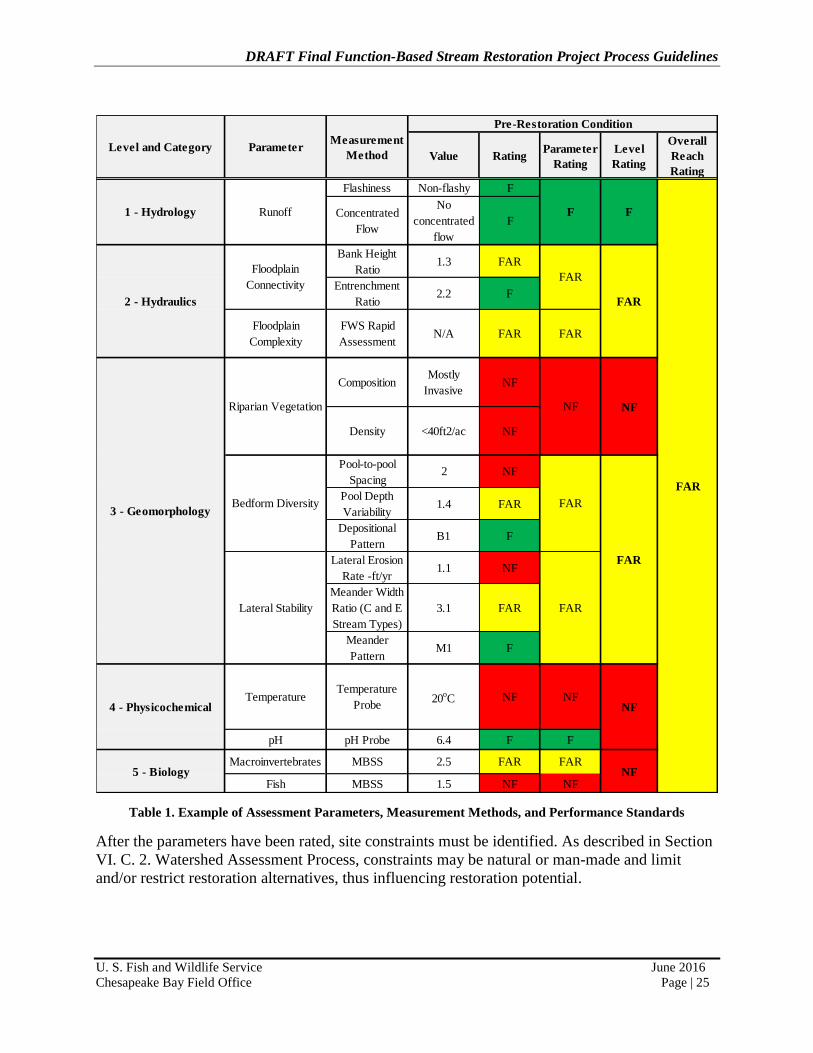
Once the assessment parameters and measurement methods are selected, conduct the reach level
function-based assessment. The data then needs to be related to a functional rating. Table 1
provides an example demonstration. Data are rated at three levels: 1) measurement method, 2)
Pyramid level and 3) overall reach. There are many ways to rate data. The example shown in
Table 1 uses Functioning, Functioning-at-Risk and Not Functioning along with color coding.
What is most important is that the data be described somehow so that the functional condition of
the proposed project site is known and can be used to determine whether the project goals are
achievable. In addition, data forms, modeling results and photographs are useful in supporting
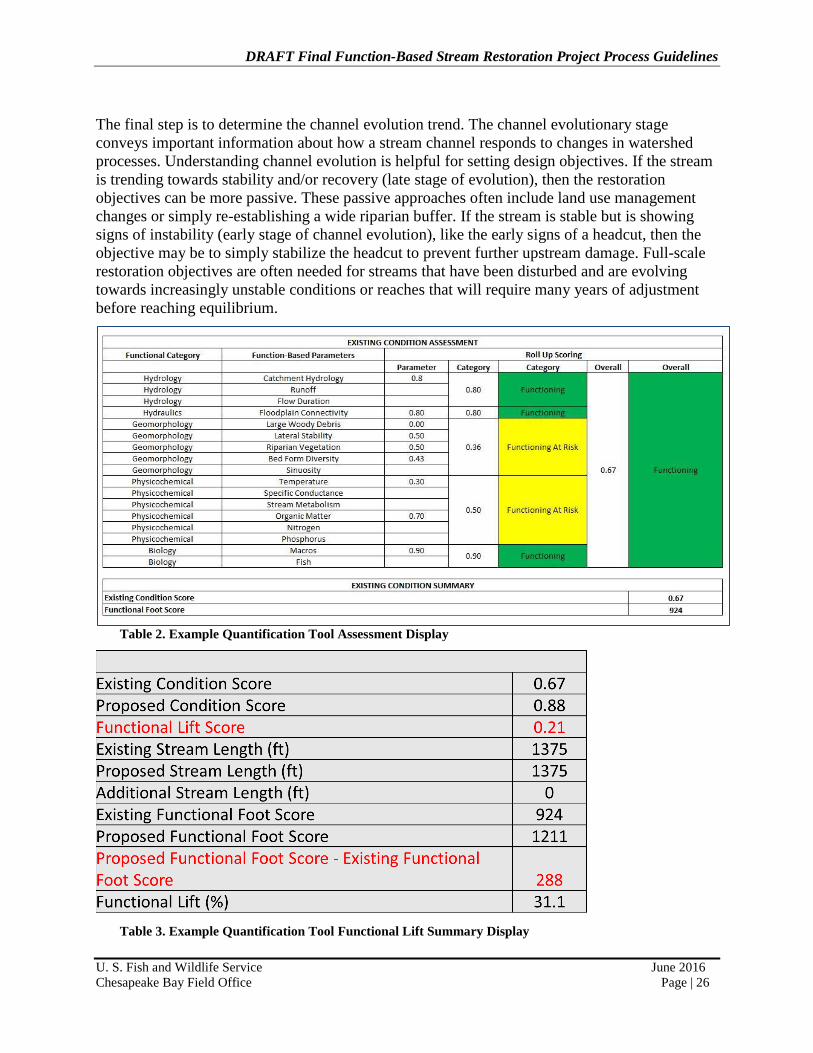
the functional rating determinations. Another tool that can be used to display assessment results
is the Functional Lift Quantification Tool. The tool was developed by Stream Mechanics for the
Environmental Defense Fund and NC Division of Mitigation Services. It is similar to Table 1 but
instead of functional ratings, it uses numeral values (Table 2). It also can summarize the
functional lift, numerically (Table 3). The tool can be downloaded from: http://stream-
mechanics.com/stream-functions-pyramid.
DRAFT Final Function-Based Stream Restoration Project Process Guidelines
U. S. Fish and Wildlife Service June 2016
Chesapeake Bay Field Office Page | 25
Table 1. Example of Assessment Parameters, Measurement Methods, and Performance Standards
After the parameters have been rated, site constraints must be identified. As described in Section
VI. C. 2. Watershed Assessment Process, constraints may be natural or man-made and limit
and/or restrict restoration alternatives, thus influencing restoration potential.
Value RatingParameter
Rating
Level
Rating
Overall
Reach
Rating
Flashiness Non-flashy F
Concentrated
Flow
No
concentrated
flow
F
Bank Height
Ratio1.3 FAR
Entrenchment
Ratio2.2 F
Floodplain
Complexity
FWS Rapid
Assessment N/A FAR FAR
CompositionMostly
InvasiveNF
Density <40ft2/ac NF
Pool Depth
Variability1.4 FAR
Depositional
PatternB1 F
Lateral Erosion
Rate -ft/yr1.1 NF
Meander Width
Ratio (C and E
Stream Types)
3.1 FAR
Meander
PatternM1 F
pH pH Probe 6.4 F F
Fish MBSS 1.5 NF NF5 - Biology
Level and Category ParameterMeasurement
Method
Pre-Restoration Condition
Riparian Vegetation NF
3 - Geomorphology
Pool-to-pool
Spacing2 NF
FAR
Lateral Stability
F
FAR
1 - Hydrology Runoff F
2 - Hydraulics
Floodplain
Connectivity
FAR
4 - PhysicochemicalTemperature
NF
Temperature
Probe20
oC NF NF
Macroinvertebrates MBSS 2.5 FAR
FAR
NF
Bedform Diversity
NF
FAR
FAR
FAR
DRAFT Final Function-Based Stream Restoration Project Process Guidelines
U. S. Fish and Wildlife Service June 2016
Chesapeake Bay Field Office Page | 26
The final step is to determine the channel evolution trend. The channel evolutionary stage
conveys important information about how a stream channel responds to changes in watershed
processes. Understanding channel evolution is helpful for setting design objectives. If the stream
is trending towards stability and/or recovery (late stage of evolution), then the restoration
objectives can be more passive. These passive approaches often include land use management
changes or simply re-establishing a wide riparian buffer. If the stream is stable but is showing
signs of instability (early stage of channel evolution), like the early signs of a headcut, then the
objective may be to simply stabilize the headcut to prevent further upstream damage. Full-scale
restoration objectives are often needed for streams that have been disturbed and are evolving
towards increasingly unstable conditions or reaches that will require many years of adjustment
before reaching equilibrium.
Table 2. Example Quantification Tool Assessment Display
Table 3. Example Quantification Tool Functional Lift Summary Display
DRAFT Final Function-Based Stream Restoration Project Process Guidelines
U. S. Fish and Wildlife Service June 2016
Chesapeake Bay Field Office Page | 27
3. Reach Level Function-based Assessment Step-wise Process
Select parameters from the Pyramid and/or other sources of information about parameters
that describe stream functions relevant to the programmatic and design goals and permit
requirements.
Select other assessments necessary to document other ecological functions (e.g., wetlands,
mature forests) occurring within the proposed project site.
Determine the appropriate methods for measuring the parameters, e.g. rapid versus intensive
and simple versus complex. This selection will also be dependent on the budget and purpose
of the assessment.
Determine if the measurement methods need to be adapted based on unique regional
characteristics, e.g. karst topography and location of endangered species.
Review the performance standards that are associated with the methods of measurement and
determine if they are appropriate based on local environmental conditions and the purpose of
the assessment. If possible, update performance standards with information from local
reference streams.
If deemed necessary by the purpose, develop a scoring method to determine the overall
functionality of the stream reach, i.e., Overall Functioning, Functioning-at-Risk, or Not
Functioning score. Consider having an overall score per functional category as well, e.g.
Geomorphology, to help show where functional problems may exist as well as an overall
score for the entire proposed project area.
Establish the length of the assessment period.
Implement function-based stream assessment and other ecological resource assessments
(when appropriate), evaluate its effectiveness in assessing stream functions, and adapt
method as necessary.
Describe the functional condition rating of the proposed project site based on the results of
the assessment data.
Identify site constraints.
Determine the channel evolution.
If the reach level assessment is part of the site selection process, determine if the proposed
project site is in need of restoration and whether restoration will support the programmatic
and design goals. If the success of restoration depends on other actions taking place in the
watershed, note this information as well.
4. Key Function-based Stream Assessment Parameters
As stated above, goals and permit requirements will determine which specific parameters will be
assessed. However, there are four key parameters that should be assessed for almost every stream
restoration because of their influence on stream functions. The key parameters include:
floodplain connectivity, riparian vegetation, lateral stability and bed form diversity (Harman et
al., 2012).

DRAFT Final Function-Based Stream Restoration Project Process Guidelines
U. S. Fish and Wildlife Service June 2016
Chesapeake Bay Field Office Page | 28
Floodplain Connectivity
Floodplain connectivity describes how often stream flows access the adjacent floodplain and
how much floodplain area is available for stream flows. In high functioning alluvial valleys, all
flows greater than the bankfull discharge spread across a wide floodplain (Leopold et al., 1992).
In humid environments, streams that are well connected to the floodplain also have relatively
high water tables, encouraging the development of riparian wetlands. In these systems, the
channel is just deep enough to maintain sediment transport equilibrium and to create diverse bed
forms and habitats. Channelization is the primary reason streams disconnect from their adjacent
floodplain. Additionally, indirect impacts, like urbanization and increases to impervious cover,
also contribute to channel enlargement and incision through increased runoff. The extra runoff
often causes an increase in stream power, which leads to headcuts and incision. The combination
of increased runoff and channelization can lead to rapid destabilization and adjustment of stream
channels. Floodplain connectivity is a lower level supporting function in the SFPF and therefore,
once a stream becomes disconnected from its floodplain many other higher level functions are
adversely affected.
It should be noted that streams located in colluvial valleys typically do not have floodplains but
instead have floodprone areas. Floodprone areas are still important for these streams because
they provide the needed area to carry only the amount of water necessary for sediment transport
requirements.
Riparian Vegetation
Riparian vegetation zones are the vegetated region adjacent to streams that provide multiple
benefits (Gordon et al, 1992). A functioning riparian vegetation corridor contains diverse plant
communities and a variety of habitat conditions for terrestrial and aquatic species. It provides a
wide range of benefits but it is considered a key assessment parameter because of the role it
provides in lateral stability. The roots of riparian vegetation assist streambanks in resisting the
erosive forces associated with stream flows. Riparian areas often include wetlands.
Lateral Stability
Lateral stream migration commonly occurs on rivers that flow through alluvial valleys. A
channel migrates within the floodplain through lateral erosion on the outside of meander bends
and deposition on the interior bend, or point bar. Streams and rivers are open systems, which
have a continual source of potential energy supplied by topographic elevation and precipitation.
The potential energy supplied by the rain and elevation is transformed to kinetic energy as water
flows downhill. Kinetic energy carries sediment downstream (sediment transport) and causes
some erosion from turbulence and friction along the channel boundary. In an alluvial valley
where the boundary conditions (bank materials) are erodible, meanders will form and continue to
erode until the stream achieves a plan form, where energy is expended uniformly and the least
amount of work possible is accomplished (Leopold, 1994). Once this equilibrium is achieved, a
DRAFT Final Function-Based Stream Restoration Project Process Guidelines
U. S. Fish and Wildlife Service June 2016
Chesapeake Bay Field Office Page | 29
stream may continue to migrate but will deposit materials in point bars to maintain a stable cross-
sectional area.
Bedform Diversity
Natural streams rarely have flat uniform beds (Knighton, 1998). Instead, hydraulic and sediment
transport processes shape the stream bed into a myriad of forms, depending on channel slope,
type of bed material (sand, gravel, cobble, boulder, bedrock) and other factors. These bed forms
are symptomatic of local variations in the sediment transport rate and represent vertical
fluctuations in the stream bed (Knighton, 1998) and dissipating energy. These vertical
fluctuations are essentially a form of meandering, but in the vertical direction rather than
horizontal (like sinuosity).
Bed forms are also important because they provide the environmental conditions that a variety of
aquatic organisms need for survival. For example, macroinvertebrates often colonize in riffle
habitats and fish tend to stay in pools. Without the diversity of riffles and pools, there is also a
loss of diversity in macroinvertebrates and fish species. Additionally, highly mobile bed features
that adjust frequently after storm events adversely affect aquatic species by disrupting their
cover, forage and nesting areas. The mobility of bed features is directly related to stream
stability.
5. Other Ecological Function-based Assessments
Many stream corridors provide more than just stream functions. Stream corridors can include
ecological resources such as wetlands, bogs, terrestrial forests and meadows that provide a
multitude of ecological functions. Appropriate assessments need to be conducted for any other
functions occurring within the stream corridor, which might be influenced by the proposed
project, to be considered during the design alternatives analysis. Refer to Section IV. F. Design
Alternatives Analysis for further information regarding design alternatives analysis and refer to
Appendix E for information regarding assessment of existing conditions.
E. STEP 5 - RESTORATION POTENTIAL
1. Purpose
Restoration potential is the highest level of restoration that can be achieved, given the watershed
and reach level conditions, stressors and constraints. Also, it is at this point the actual amount of
potential functional uplift will be determined. For example, the assessment results may indicate
that a stream reach is severely incised, has extreme bank erosion, low bed form diversity and no
riparian vegetation. If this site is in a rural setting (low lateral constraints) with a healthy
watershed, then the restoration potential is high because functional uplift can likely be achieved
for water quality and biological functions (Pyramid Levels 4 and 5). However, if this same site is
in an urban area or a setting with lateral constraints like a road or even cropland that cannot be

DRAFT Final Function-Based Stream Restoration Project Process Guidelines
U. S. Fish and Wildlife Service June 2016
Chesapeake Bay Field Office Page | 30
removed from production, then the restoration potential is lower because the functional uplift
may only occur for hydraulic and geomorphic functions (Pyramid Levels 2 and 3). Once the
restoration potential is known, specific design objectives can be established or original design
goals may need to be refined.
2. Restoration Potential Process
Determining the restoration potential involves using the results of the watershed and reach level
assessments. Watershed stressors, reach level impaired stream functions and constraints are
listed based on the assessment results. A cause and effect relationship between these data is
developed to understand how they interact and influence each other, by Pyramid level. It should
clearly show which functions support other functions and which ones are supported by others.
For example, the watershed assessment may have shown that there is a high percentage of
agricultural activities and the reach level assessment showed that the water quality had high
levels of nutrients. A conclusion can be drawn that the agricultural activities are the cause of the
high nutrient levels. Additionally, the reach level assessment may have shown that there is
active bank erosion and poor riparian vegetation. The conclusion can be drawn that the poor
riparian vegetation has caused the active bank erosion.
An understanding of the cause and effect relationship is critical in the development of restoration
solutions. Restoration activities may or may not need to occur at both the watershed and reach
levels to achieve design goals. Following the agricultural example provided above, watershed
level restoration activities to address the nutrient sources would have to occur in order to meet
reach level nutrient reduction design goals. However, following the bank erosion example
provided above, planting of riparian vegetation could address the bank erosion issues without
implementing any watershed level restoration activities. Ultimately, the level and success of
restoration is directly related to how well the cause and effect relationship is documented.
Next, a determination needs to be performed on whether the degraded reach level functions can
be restored and how much functional uplift could occur. Watershed and reach level constraints
should be considered during this process since they can limit restoration solutions. Table 4
builds on Table 1 – Example of Assessment Parameters, Measurement Methods, and
Performance Standards shown earlier and illustrates proposed functional uplift of baseline
functions. The table is an example that shows how the function-based parameters, measurement
methods, and performance standards can be used to demonstrate functional uplift using the
SFPF. It is important to note that only partial functional uplift could occur for some degraded
functions. Partial functional uplift is typically associated with functions occurring at Pyramid
Levels 4 – Physicochemical and 5 – Biology because these functions are significantly supported
by reach level functions and influenced by watershed health. For example, aquatic habitat
(Pyramid Level 3) can be a limiting factor influencing aquatic species health, and poor water
quality (Pyramid Level 4) can be a watershed stressor. The most feasible restoration solution
may only be to address the reach level issues and not the watershed level issues. Therefore,
habitat is improved, but only for tolerant aquatic species. This example also stresses the critical
role that the watershed health plays in restoration potential. If there are watershed stressors
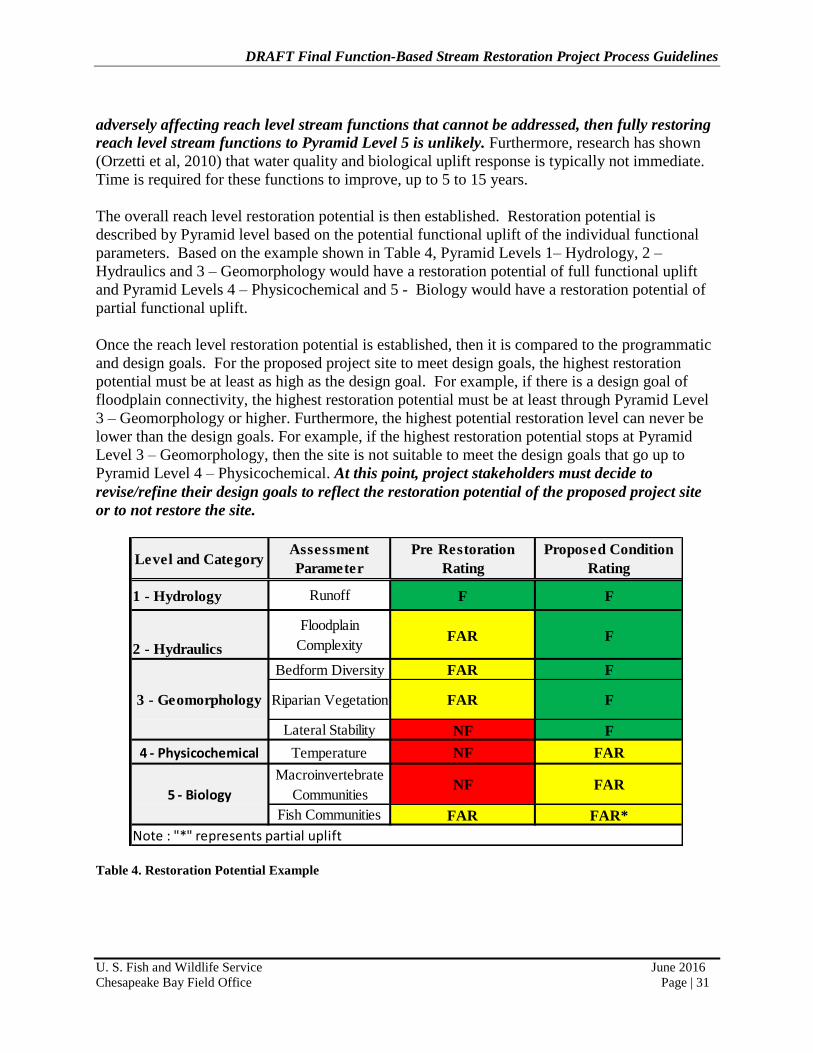
DRAFT Final Function-Based Stream Restoration Project Process Guidelines
U. S. Fish and Wildlife Service June 2016
Chesapeake Bay Field Office Page | 31
adversely affecting reach level stream functions that cannot be addressed, then fully restoring
reach level stream functions to Pyramid Level 5 is unlikely. Furthermore, research has shown
(Orzetti et al, 2010) that water quality and biological uplift response is typically not immediate.
Time is required for these functions to improve, up to 5 to 15 years.
The overall reach level restoration potential is then established. Restoration potential is
described by Pyramid level based on the potential functional uplift of the individual functional
parameters. Based on the example shown in Table 4, Pyramid Levels 1– Hydrology, 2 –
Hydraulics and 3 – Geomorphology would have a restoration potential of full functional uplift
and Pyramid Levels 4 – Physicochemical and 5 - Biology would have a restoration potential of
partial functional uplift.
Once the reach level restoration potential is established, then it is compared to the programmatic
and design goals. For the proposed project site to meet design goals, the highest restoration
potential must be at least as high as the design goal. For example, if there is a design goal of
floodplain connectivity, the highest restoration potential must be at least through Pyramid Level
3 – Geomorphology or higher. Furthermore, the highest potential restoration level can never be
lower than the design goals. For example, if the highest restoration potential stops at Pyramid
Level 3 – Geomorphology, then the site is not suitable to meet the design goals that go up to
Pyramid Level 4 – Physicochemical. At this point, project stakeholders must decide to
revise/refine their design goals to reflect the restoration potential of the proposed project site
or to not restore the site.
Table 4. Restoration Potential Example
1 - Hydrology Runoff F F
2 - Hydraulics
Floodplain
ComplexityFAR F
Bedform Diversity FAR F
Riparian Vegetation FAR F
Lateral Stability NF F
4 - Physicochemical Temperature NF FAR
Macroinvertebrate
CommunitiesNF FAR
Fish Communities FAR FAR*
Note : "*" represents partial uplift
3 - Geomorphology
5 - Biology
Level and CategoryAssessment
Parameter
Pre Restoration
Rating
Proposed Condition
Rating
DRAFT Final Function-Based Stream Restoration Project Process Guidelines
U. S. Fish and Wildlife Service June 2016
Chesapeake Bay Field Office Page | 32
3. Restoration Potential Step-wise Process
1. List watershed stressors and constraints and reach level constraints to determine those that
impact achieving design goals.
2. Develop a list of degraded and healthy stream functions.
3. Identify which degraded stream functions can be restored (i.e., fully or partially).
4. Establish restoration potential by Pyramid level and state the highest overall Pyramid level
achievable.
5. Compare the restoration potential to the design goals using the Pyramid (i.e., both achievable
functions and highest overall Pyramid level). If the restoration potential cannot achieve the
design goals, revise/refine the design goals or do not restore the proposed project site.
F. STEP 6 - DESIGN OBJECTIVES
1. Purpose
Design objectives state how the design goals will be achieved. This step is critical because it
connects design goals to the development of restoration solutions and assists in the establishment
of monitoring performance standards. For example, a design goal may be to increase brook trout
populations (i.e., Pyramid Level 5), but the functional assessment showed that water
temperatures were too high to support brook trout and the site is devoid of riparian vegetation. A
design objective for this project would be to have average water temperatures less than 16°C in
any given year. A design solution to achieve this objective could be to plant riparian vegetation
to shade the stream and reduce water temperatures. The monitoring performance standard would
be to not exceed water temperatures greater than 16°C in any given year.
2. Design Objectives Development Process
The development of design objectives start with using the watershed stressors and reach level
impaired stream functions identified as part of the restoration potential as well as the
interrelationship and/or “cause and effect” developed as part of the restoration potential. The
interrelationship plays a critical role in the development of design objectives. It is needed to
identify the stressors and impaired functions that are critical to meeting design goals. Not every
stressor or impaired stream function identified in the assessment process needs a design
objective. This is because some degraded functions will be restored through the restoration of
lower-level, supporting functions. For example, planting riparian vegetation (Level 3) could
stabilize lateral erosion (Level 3), reduce stream temperatures (Level 4) and increase food supply
for macroinvertebrates, which could increase macroinvertebrate populations (Level 5). Or, it is
possible that some degraded functions cannot be restored. For example, there may be degraded
water quality functions as a result of upstream land use activities that cannot be addressed as part
of the stream restoration project. Therefore, degraded water quality cannot be restored through
restoration activities within the proposed project site.
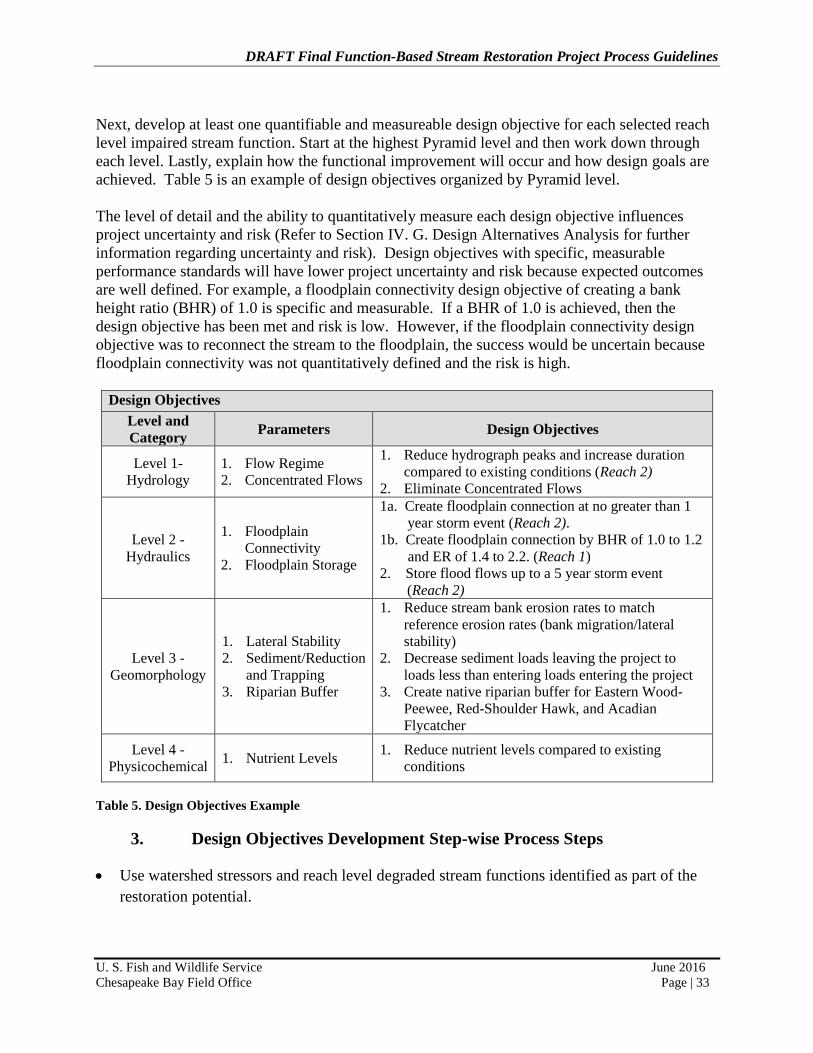
DRAFT Final Function-Based Stream Restoration Project Process Guidelines
U. S. Fish and Wildlife Service June 2016
Chesapeake Bay Field Office Page | 33
Next, develop at least one quantifiable and measureable design objective for each selected reach
level impaired stream function. Start at the highest Pyramid level and then work down through
each level. Lastly, explain how the functional improvement will occur and how design goals are
achieved. Table 5 is an example of design objectives organized by Pyramid level.
The level of detail and the ability to quantitatively measure each design objective influences
project uncertainty and risk (Refer to Section IV. G. Design Alternatives Analysis for further
information regarding uncertainty and risk). Design objectives with specific, measurable
performance standards will have lower project uncertainty and risk because expected outcomes
are well defined. For example, a floodplain connectivity design objective of creating a bank
height ratio (BHR) of 1.0 is specific and measurable. If a BHR of 1.0 is achieved, then the
design objective has been met and risk is low. However, if the floodplain connectivity design
objective was to reconnect the stream to the floodplain, the success would be uncertain because
floodplain connectivity was not quantitatively defined and the risk is high.
Design Objectives
Level and
Category Parameters Design Objectives
Level 1-
Hydrology
1. Flow Regime
2. Concentrated Flows
1. Reduce hydrograph peaks and increase duration
compared to existing conditions (Reach 2)
2. Eliminate Concentrated Flows
Level 2 -
Hydraulics
1. Floodplain
Connectivity
2. Floodplain Storage
1a. Create floodplain connection at no greater than 1
year storm event (Reach 2).
1b. Create floodplain connection by BHR of 1.0 to 1.2
and ER of 1.4 to 2.2. (Reach 1)
2. Store flood flows up to a 5 year storm event
(Reach 2)
Level 3 -
Geomorphology
1. Lateral Stability
2. Sediment/Reduction
and Trapping
3. Riparian Buffer
1. Reduce stream bank erosion rates to match
reference erosion rates (bank migration/lateral
stability)
2. Decrease sediment loads leaving the project to
loads less than entering loads entering the project
3. Create native riparian buffer for Eastern Wood-
Peewee, Red-Shoulder Hawk, and Acadian
Flycatcher
Level 4 -
Physicochemical 1. Nutrient Levels
1. Reduce nutrient levels compared to existing
conditions
Table 5. Design Objectives Example
3. Design Objectives Development Step-wise Process Steps
Use watershed stressors and reach level degraded stream functions identified as part of the
restoration potential.

DRAFT Final Function-Based Stream Restoration Project Process Guidelines
U. S. Fish and Wildlife Service June 2016
Chesapeake Bay Field Office Page | 34
Select only the reach level degraded stream function that are related to the design goals and
can be restored.
Organize the stressors and functions by Pyramid levels to show the interrelationship of the
stressors and stream functions.
Develop at least one quantifiable and measureable design objective for each reach level
degraded stream function starting at the highest Pyramid level and then work down through
each level.
Determine the uncertainty and risk of each design objective.
Provide a description of how the functional improvement will occur and design goals are
achieved.
G. STEP 7 - DESIGN ALTERNATIVES ANALYSIS
1. Purpose
The purpose of this step is to determine the best restoration design approach that meets the
design goals and objectives, has the highest possible functional uplift and is suitable for the site.
The Design Alternatives Analysis should not be confused with the broad-scale watershed
planning process described in the Watershed Assessment section above. The focus should be on
how a design approach could influence stream functions with a level of detail corresponding to
the complexity, existing functional conditions (of all stream corridor resources) and scale of the
project. For example, given a well-articulated set of design goals and objectives, an alternatives
analysis may compare different design approaches or techniques with expected post-restoration
conditions (uplift and loss) by simply including a narrative of why different alternatives were not
used. A detailed alternatives analysis is not always required, especially for smaller and less
complex project sites. The alternatives analysis would document the highest functional uplift
that may be achieved for each design alternative, including impacts to existing stream and other
ecological functions, costs, etc. At the end of the alternatives analysis, detailed design criteria
should be developed. A few examples of the design criteria metrics may include: floodplain and
channel velocities, frequency of floodplain inundation, radius of curvature ratio, meander width
ratio, bank height ratio, maximum slopes, pool to pool spacing, pool max depth ratio and width
to depth ratio.
The intent of the design alternatives analysis is to allow the watershed and reach level existing
conditions to guide stakeholders to the best design approach that meets design goals and
objectives and any other pertinent screening criteria. A design alternatives analysis should not
attempt to force a particular design approach in a landscape that would not naturally evolve and
be self-maintaining overtime.
This section focuses on describing the critical components and other considerations of the
design alternatives analysis and is not a “step-wise” description of how to conduct a design
alternatives analysis.

DRAFT Final Function-Based Stream Restoration Project Process Guidelines
U. S. Fish and Wildlife Service June 2016
Chesapeake Bay Field Office Page | 35
2. Design Alternatives Analysis Process
The design alternatives analysis described in this document includes two different perspectives.
There are five major elements to consider during the alternatives analysis as identified by
Pastorok et al., 1997; Yozzo et al., 1996: 1) goals and objectives, 2) ecological model and key
parameters, 3) uncertainty and risk, 4) restoration design, feasibility analysis and
experimentation and 5) implementation, monitoring and adaptive management. Based on MDE
requirements, the regulatory perspective regarding alternatives analysis is to avoid and minimize
adverse impacts to existing water resources and other natural resources. When there are nontidal
wetlands affected by the project, there may be requirements to evaluate other sites where the
basic purpose of the project can be accomplished with fewer adverse impacts. In many cases the
documentation that this requirement has been met may be found in comprehensive watershed
plans. In addition, there are requirements to demonstrate to MDE’s satisfaction that alternative
designs with fewer adverse impacts that would accomplish the basic project purpose have been
considered on the selected project site; and were found not to be practicable. (Environment
Article, Annotated Code of Maryland 5-907; COMAR 26.23.02.04D; 26.23.02.05A;
26.23.02.05B; 26.23.03.02A.) Minimization measures may also be required under Maryland
Waterway Construction regulations for adverse impacts to aquatic or terrestrial habitat.
(COMAR 26.17.04.04D; 26.17.04.07B(8); 26.17.04.11B.
The design alternatives analysis begins by the review of design goals and objectives, watershed
and reach level assessment results and restoration potential, all of which were completed earlier
in the project process. These are needed to assist in the development and comparison of design
alternatives. Only design alternatives that have the potential to meet design goals and objectives
should be considered. Furthermore, the design goals and objectives and existing resource
conditions will be used when determining uncertainty and risk. Increases in uncertainty and risk
can occur with poorly defined and/or overly ambitious design goals and objectives as well as
limited or inaccurate documentation of existing resource conditions. This is described in further
detail below.
Next is to document historic stream conditions and determine what stream conditions would
naturally form and be self-maintaining by current day watershed and reach level existing
conditions. Understanding how historic stream conditions have evolved to present day conditions
begins to describe what stream condition can be maintained over time. This understanding can
be drawn from the channel evolution evaluation conducted as part of the reach level function-
based assessment. The channel evolution evaluation not only describes what stream condition
could be maintained but it also describes what evolution must occur before quasi-equilibrium can
be achieved. This is important because it influences the level of restoration required, as well as
determining uncertainty and risk. A stream that is near quasi-equilibrium may only require some
localized restoration activities to meet design goals and objective versus a stream that is highly
unstable. A highly unstable stream would most likely need to undertake significant restoration
activities to meet design goals and objectives. A design solution that is implemented at a site that
would not naturally form or drastically changes existing stream and other ecological functions
DRAFT Final Function-Based Stream Restoration Project Process Guidelines
U. S. Fish and Wildlife Service June 2016
Chesapeake Bay Field Office Page | 36
could be considered high risk and long-term sustainability uncertain versus a design solution that
would naturally form over time.
Additional information that can assist in determining what stream functions may be self-
maintaining include stream energy and sediment supply. Specifically, does the stream have low
stream energy and a low sediment supply or does it have moderate to high stream energy and a
moderate to higher sediment supply? Stream energy and sediment supply significantly influence
the size and shape of a stream channel. A stream with low energy (typically valley slopes with
less than 1 percent) and a low sediment supply allows for a larger number of design alternatives
because potential for the stream to degrade or aggrade is limited.
A stream with moderate to high energy and moderate to high sediment supply has potential to
degrade or aggrade and could potentially limit design alternatives, but will certainly influence
design complexity and project uncertainty and risk. If a particular design approach cannot
transport sediment, it could have positive or adverse effects. If the sediment deposition occurs at
a rate that vegetation can establish, then the sediment is held in place. This is a positive effect,
especially for watersheds with excessive sediment supply. However, if the sediment deposition
occurs at a rate that vegetation cannot establish and hold the sediment in place, it could induce
bed and bank instability. This means that the stream channel and floodplain are in a constant
state of flux, adversely affecting water quality and biology.
After it is determined which stream functions would naturally form under existing watershed and
reach level conditions, design alternatives should be developed. Design alternatives should be
technically and economically feasible designs that could potentially meet design goals and
objectives and would result in the least amount of disturbance practical. The range of feasible
alternatives should allow for meaningful and informed decision making and include the “no
action” plan. Furthermore, the range of alternatives should not only be those considered
desirable from the standpoint of project stakeholders. Potential alternatives that fail to meet
design goals and objectives; do not avoid significant environmental impacts; and have high
uncertainty and risk can be eliminated from the range of design alternatives, but a narrative
should be provided explaining specifically why they were eliminated.
Alternatives to be evaluated should be developed to a comparable level of detail to allow for a
comparable level of analysis. The alternatives analysis should initially determine potential uplift
and/or loss of existing stream functions and other ecological functions. As stated above, this can
be done in a narrative form or for more complex projects, in table form. Table 6 is one summary
example of how an alternatives analysis can display potential functional uplift and/or loss, and
builds on Tables 1, 3, and 4 shown early in the document. However, a table with quantitative
scores alone is often not adequate to depict all pre-and post-construction outcomes. Narrative
information on other resources which are affected, such as wetlands, should be included with
functional assessment results as well as acreage changes in extent or type. Other requirements,
the regulatory decision process, and broader agency goals may also have to be considered. Then
spatial and temporal impacts and functional response time and longevity should be addressed.
DRAFT Final Function-Based Stream Restoration Project Process Guidelines
U. S. Fish and Wildlife Service June 2016
Chesapeake Bay Field Office Page | 37
Lastly, potential impacts from differing construction methods should be documented. Additional
screening criteria used in selecting the preferred design alternative is discussed below.
Uncertainty and risk of the potential uplift and/or loss in functions need to be discussed next.
Uncertainty describes situations where answers are not absolutely true and risk describes the
chance of something bad happening (Yoe, 1996). There are three classes of uncertainty: 1)
uncertainty of knowledge, 2) uncertainty about quantities and 3) uncertainty about models (Yoe,
1996). There are two parts of risk: 1) risk evaluation (i.e., How risky is a situation?) and 2) risk
management (i.e., What should be done about the risk?) (Yoe, 1996). The uncertainty classes and
parts of risk should be considered when evaluating the potential uplift and/or loss in functions of
the design alternatives. In general terms, uncertainty and risk can be expressed by basic
questions: What is the likelihood that this project will be able to successfully sustain itself over
time? What are the consequences of failure?
Uncertainty is first introduced when considering the level of detail in design goals and objectives
and the existing conditions assessments, as discussed above. Site suitability is another influential
uncertainty and risk factor. Stream functions that would naturally form and be maintained given
the existing watershed and reach level conditions would have low uncertainty and risk versus
functions that would not naturally form and be maintained. Unpredicted natural or anthropogenic
disturbances also affect uncertainty. Stakeholders can use planning documents to predict
potential future anthropogenic disturbances and even possibly modify design solutions that can
address the future changes. Stakeholders can also predict how some potential episodic natural
events (e.g., extreme storm events) could impact project effectiveness and again, even possibly
modify design solutions that can address the future episodic natural events. However, it is
impossible to predict all potential future actions that could affect the restoration project, but risk
management is a way to address the uncertainty of future disturbances. Risk management can be
incorporated in the maintenance/adaptive management and monitoring plans. If a particular
design alternative is expected to require maintenance/adaptive management, the alternatives
analysis should state how uncertainty and risk will be reduced through the maintenance/adaptive
management.
The final step of the alternatives analysis is to select the preferred design alternative. This is
based on which design alternative has the highest functional uplift, the least adverse impacts,
best meets design goals and design objectives, lowest uncertainty and risk and meets other
critical screen criteria (e.g., costs, level of effort, unique stakeholder needs, other regulatory
requirements, constraints, etc.). For more complex projects, stakeholders should consider
meeting with regulators to discuss the results of the design alternatives analysis before
proceeding to design development.

DRAFT Final Function-Based Stream Restoration Project Process Guidelines
U. S. Fish and Wildlife Service June 2016
Chesapeake Bay Field Office Page | 38
Table 6. Design Alternatives Analysis Example (Showing Only Quantitative Changes to Stream Functions;
Other factors not included in example).
3. Design Alternatives Analysis Step-Wise Process
Review design goals and design objectives.
Review watershed and reach level assessment results.
Review restoration potential.
Determine historic stream condition.
Determine stream functions that would naturally form and be maintained over time given
existing watershed and reach level conditions.
If valley slope is greater than 1 percent, consider only those design approaches based on
channel forming flows. If other design approaches are considered, the designer must
demonstrate how high shear stress conditions will be addressed.
Value Rating
Para-
meter
Rating
Level
RatingValue Rating
Para-
meter
Rating
Level
RatingValue Rating
Para-
meter
Rating
Level
Rating
Flashiness Non-flashy F Non-flashy F Non-flashy F
Concentrated
Flow
No
concentrated
flow
F
No
concentrated
flow
F
No
concentrated
flow
F
Bank Height
Ratio1.3 FAR 1 F 1 F
Entrenchment
Ratio2.2 F 2.2 F 2.2 F
Floodplain
Complexity
FWS Rapid
Assessment N/A FAR FAR N/A F F N/A F F
CompositionMostly
InvasiveNF All Natives F All Natives F
Density <40ft2/ac NF >60sqft/ac F >60sqft/ac F
Pool Depth
Variability1.4 FAR 2.5 F 1.2 FAR
Depositional
PatternB1 F B1 F B6 NF
Lateral Erosion
Rate -ft/yr1.1 NF 0.01 F 0.01 F
Meander Width
Ratio (C and E
Stream Types)
3.1 FAR 4.6 F 1.5 NF
Sinuosity 1.24 F 1.4 F 1.15 FAR
pH pH Probe 6.4 F F 6.4 F F 6.4 F F
Fish MBSS 1.5 NF NF 3.7 FAR FAR* 2 NF NF
F
F
F
FAR*
F
F
F
FAR
FAR
FAR
FAR*
FF
FAR*
Level and
CategoryParameter
Measurement
Method
F
FAR
NF
FAR
FAR
NF
FAR
F
F
NF
1 - Hydrology Runoff F F
FF
F
2 - Hydraulics
Floodplain
Connectivity
FAR F F
Bedform
Diversity
Pool-to-pool
Spacing2 NF
FAR
Lateral
Stability
4 -
Physicochemical
TemperatureTemperature
Probe20
oC
3 -
Geomorphology
Riparian
Vegetation
Pre-Restoration Condition Restoration Alternative 1 Restoration Alternative 2
17oC FAR
FAR
FAR
FAR
NFNF
15oC
F
4 F
F
3
FAR*2.5 FAR*
FAR*
Note: "*" represents partial uplift
5 - Biology
Macroinverte-
bratesMBSS 2.5 FAR
NF4.2

DRAFT Final Function-Based Stream Restoration Project Process Guidelines
U. S. Fish and Wildlife Service June 2016
Chesapeake Bay Field Office Page | 39
If there is a sediment supply, consider only those design approaches based on channel
forming flows. If other design approaches are considered, the designer must demonstrate
how sediment supply will be addressed.
Develop a range of technically and economically feasible (practicable) design alternatives
that could potentially meet design goals and objectives and would result in the least amount
of disturbance practicable. Include the “no action” plan.
Predict the potential functional uplift and/or loss associated with each design alternative.
Potential functional uplift and/or loss should be determined for all existing critical stream
corridor functions (e.g., streams, wetlands, floodplain vegetation, etc.).
Consider spatial and temporal impacts; functional response time and longevity; and
construction impacts.
Predict the potential uncertainty and risk associated with each design alternative.
Select the alternative based on: the highest functional uplift, the least adverse impacts, best
meets project goals and design objectives, lowest uncertainty and risk and meets other critical
screening and regulatory criteria.
For more complex projects, consider having a meeting with regulators to discuss the results
of the design alternatives analysis before proceeding to design development.
H. STEP 8 - DESIGN DEVELOPMENT
1. Purpose
The purpose of this step is to document the design development approach, ensure project
feasibility, determine project implementation costs and to produce a constructible design set
along with specifications and materials. At the end of the process, the design is compared to the
design objectives to ensure the programmatic and design goals will be achieved by the proposed
design. This section is not a “step-wise” design description, but rather describes certain
design milestones/products that should be produced to ensure design goals and objectives are
met.
2. Design Development Process
First select the appropriate design review checklist (Starr et al., 2015) based on the preferred plan
selected during the alternatives analysis process. This step is not necessary; however, MDE will
use these checklists to review stream restoration projects submitted for permits. The checklists
are not a “step-wise” design procedure, but rather intended to provide a reviewer with a method
for determining if a project design contains an appropriate level of information and for
identifying major design shortcomings. Using the checklist as a guide through the design
development process will assist in ensuring critical design questions are addressed.
The next step is to develop design criteria that support the design objectives. Some design
objectives can also be used as design criteria. The design criteria should include, at the
minimum, floodplain dimensions, stream channel dimensions, planform and profile, stream bed
material and riparian vegetation. These criteria are important because they significantly

DRAFT Final Function-Based Stream Restoration Project Process Guidelines
U. S. Fish and Wildlife Service June 2016
Chesapeake Bay Field Office Page | 40
influence stream energy and sediment transport and ultimately, long term stability. They are also
important if there are aquatic species design goals. Aquatic species have specific habitat
requirements that are typically addressed through bedform diversity such as large woody debris,
pool to riffle ratio, pool depths and stream bed materials (Pyramid Level 3 – Geomorphology).
Examples of design criteria are provided in the design review checklists (Starr et al., 2015).
From the design criteria, a concept plan should be developed. The focus of the concept plan
should be on the location of the stream (e.g., channel alignment and dimensions) within the
stream corridor and the connection with the floodplain (e.g., banks height ratio, storm flow return
interval, etc.). It should also address any unique or critical aspects and/or resources (e.g.,
constraints, wetlands, cultural resources, threaten and endangered species, etc.) associated with
the proposed project site. The concept design should then be reviewed to ensure that it meets the
design goals and objectives; has the least amount of disturbance practical; and minimizes adverse
impacts to all critical existing stream corridor functions. At this point, project stakeholders
should consider having a pre permit application meeting with regulators to receive initial
feedback on the proposed concept design.
Once a concept plan has been developed that addresses the design goals and objectives, a draft
final plan should be developed. The draft final plan should be developed to a level where
feasibility (i.e., stability) analysis can be completed. The feasibility analyses should include, at
the minimum, stage/discharge shear stress analysis, sediment transport analysis (i.e., competency
and capacity) and in-stream structure stability analysis. It should demonstrate that the proposed
design will not degrade or aggrade over time. If sediment aggradation is part of the proposed
design, then analyses (location, amount and rate) need to be completed to document that the
aggradation will not result in adverse impacts to stream corridor functions. Then the draft final
design should be reviewed again to ensure it meets the design goals and objectives.
Lastly, the final design and specifications should be reviewed one more time to ensure project
design goals and objectives were met, and that questions within the design review checklist were
adequately addressed.
3. Design Development Step-wise Process
Select the appropriate design review checklist and use as guide to develop design.
Develop design criteria.
Develop concept plan and review to ensure design objectives are met; has the least amount of
disturbance practical; and minimizes adverse impacts to all critical existing stream corridor
functions.
Consider having a pre permit application meeting with regulators to receive initial feedback
on the proposed concept design.
Develop draft final design; complete a feasibility analysis to demonstrate stability over time;
and review to ensure design objectives are met.
Develop final design and specifications and review to ensure design objectives are met.
Review design review checklist and ensure each question has been addressed.
DRAFT Final Function-Based Stream Restoration Project Process Guidelines
U. S. Fish and Wildlife Service June 2016
Chesapeake Bay Field Office Page | 41
I. STEP 9 - MONITORING
1. Purpose
The purpose of monitoring is to determine if the project achieved the design goals and
objectives. Additionally, monitoring is typically needed to demonstrate long-term restoration
integrity and stability. This section focuses on a process that can be used to develop monitoring
plans. Ultimately, regulators (COE and MDE) will set the monitoring requirements (Refer to
Appendix F for additional information).
The type, level of effort and period of monitoring should be based on the type and complexity of
the project. Additionally, monitoring plans should consider the time required for predicted
functional uplift to establish or a trajectory to establish. For example, if project goals include
geomorphic and biological objectives, a monitoring plan could conduct more detailed
geomorphic monitoring for the first 3 years and then less detailed monitoring for the following 2
years since stream restoration projects can typically reach stability within 3 to 5 years post
construction. However, biological monitoring would occur in years 5, 7 and 10 since it typically
takes a much longer period for biological uplift to occur (Orzetti et al., 2010). A monitoring plan
should also recognize that function-based conditions can fluctuate over time for many reasons.
Some years there may be uplift, and other years there may be no change or even loss. The intent
of the monitoring is to determine if function-based conditions are trending towards functioning.
The monitoring plan should consist of quantifiable and measureable assessment parameters,
measurement methods, performance standards, period, timing and frequency of monitoring and
who will conduct the monitoring and make repairs, if necessary.
There are many existing monitoring methods available. This section focuses on describing the
critical components and other considerations of a monitoring plan, and is not an all-inclusive
description of monitoring methods. Readers should refer to other sources for detailed
information regarding monitoring methods.
2. Monitoring Plan Development Process
The development of a monitoring plan begins with selecting assessment parameters that will
demonstrate whether the project has achieved the project goals. The assessment parameters
should be quantifiable, measureable and at a level commensurate with the complexity of the
stream restoration project. The assessment parameters should address the design objectives
established earlier in the restoration process and include any other assessment parameters needed
to demonstrate project success. Additional assessment parameters may be needed in order to
monitor any existing stream corridor functions that may be adversely impacted by the proposed
project. Next, organize the assessment parameters by Pyramid level to determine if any other
lower-level, supporting parameters are needed to determine project success. Use the “cause and
effect” relationship developed as part of the restoration potential to assist in selecting additional
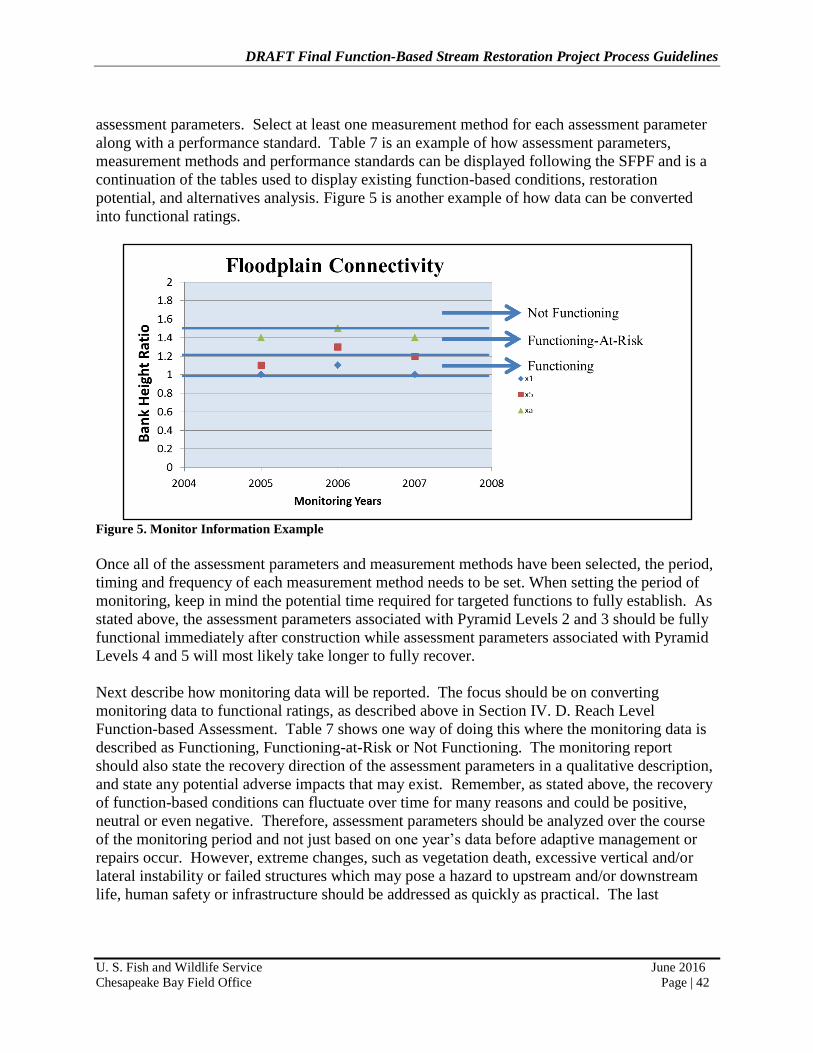
DRAFT Final Function-Based Stream Restoration Project Process Guidelines
U. S. Fish and Wildlife Service June 2016
Chesapeake Bay Field Office Page | 42
assessment parameters. Select at least one measurement method for each assessment parameter
along with a performance standard. Table 7 is an example of how assessment parameters,
measurement methods and performance standards can be displayed following the SFPF and is a
continuation of the tables used to display existing function-based conditions, restoration
potential, and alternatives analysis. Figure 5 is another example of how data can be converted
into functional ratings.
Figure 5. Monitor Information Example
Once all of the assessment parameters and measurement methods have been selected, the period,
timing and frequency of each measurement method needs to be set. When setting the period of
monitoring, keep in mind the potential time required for targeted functions to fully establish. As
stated above, the assessment parameters associated with Pyramid Levels 2 and 3 should be fully
functional immediately after construction while assessment parameters associated with Pyramid
Levels 4 and 5 will most likely take longer to fully recover.
Next describe how monitoring data will be reported. The focus should be on converting
monitoring data to functional ratings, as described above in Section IV. D. Reach Level
Function-based Assessment. Table 7 shows one way of doing this where the monitoring data is
described as Functioning, Functioning-at-Risk or Not Functioning. The monitoring report
should also state the recovery direction of the assessment parameters in a qualitative description,
and state any potential adverse impacts that may exist. Remember, as stated above, the recovery
of function-based conditions can fluctuate over time for many reasons and could be positive,
neutral or even negative. Therefore, assessment parameters should be analyzed over the course
of the monitoring period and not just based on one year’s data before adaptive management or
repairs occur. However, extreme changes, such as vegetation death, excessive vertical and/or
lateral instability or failed structures which may pose a hazard to upstream and/or downstream
life, human safety or infrastructure should be addressed as quickly as practical. The last

DRAFT Final Function-Based Stream Restoration Project Process Guidelines
U. S. Fish and Wildlife Service June 2016
Chesapeake Bay Field Office Page | 43
component of the monitoring plan should clearly state who is responsible for conducting the
monitoring and for making repairs when necessary.
Table 7. Monitoring Example
Value Rating
Para-
meter
Rating
Level
RatingValue Rating
Para-
meter
Rating
Level
RatingValue Rating
Para-
meter
Rating
Level
Rating
Flashiness Non-flashy F Non-flashy F Non-flashy F
Concentrated
Flow
No
concentrated
flow
F
No
concentrated
flow
F
No
concentrated
flow
F
Bank Height
Ratio1.3 FAR 1 F 1 F
Entrenchment
Ratio2.2 F 12 F 12 F
Floodplain
Complexity
FWS Rapid
Assessment N/A FAR FAR N/A F F N/A F F
CompositionMostly
InvasiveNF All Natives F
Mostly
Native and
some
Invasive
FAR
Density <40ft2/ac NF >80sqft/ac F >75sqft/ac F
Pool Depth
Variability1.4 FAR 2.5 F 3 F
Depositional
PatternB1 F B1 F B6 F
Lateral Erosion
Rate -ft/yr1.1 NF 0.025 F 0.01 F
Meander Width
Ratio (C and E
Stream Types)
3.1 FAR 4.6 F 4.7 F
Sinuosity 1.24 F 1.4 F 1.45 F
pH pH Probe 6.4 F F 6.4 F F 6.4 F F
Fish MBSS 1.5 NF NF 2 FAR* FAR* 2.5 FAR* FAR*
F
F
FAR
FAR*
F
F
FAR
F
F
FAR
FAR*
FARFAR
FAR*
Level and
CategoryParameter
Measurement
Method
F
FAR
NF
FARFAR
FAR
NF
FAR
F1 - Hydrology Runoff F F
F
F
F
F
2 - Hydraulics
Floodplain
Connectivity
FAR F F
Bedform
Diversity
Pool-to-pool
Spacing2 NF
Lateral
Stability
4 -
Physicochemical
TemperatureTemperature
Probe20
oC
3 -
Geomorphology
Riparian
Vegetation
Pre-Restoration Condition Monitoring Year 1 Monitoring Year 2
17oC FAR
FAR
F
F
NFNF
18oC
FAR
4 F
F
5
Note: "*" represent partial uplift
FAR*3 FAR*
FAR5 - Biology
Macroinverte-
bratesMBSS 2.5 FAR
NF2.7
DRAFT Final Function-Based Stream Restoration Project Process Guidelines
U. S. Fish and Wildlife Service June 2016
Chesapeake Bay Field Office Page | 44
3. Monitoring Plan Development Step-wise Process
Develop a list of assessment parameters to monitor that are quantifiable and measureable.
List should include parameters that address design goals and objectives and any existing
functions that may be adversely impacted by the proposed project.
Organize assessment parameters by Pyramid level and determine if any other lower-level,
supporting parameters are needed to determine project success.
Select measurement methods and performance standards for each assessment parameter.
Describe the period, timing and frequency of each measurement method.
Describe how monitoring data will be reported.
Convert monitoring data to functional rating (e.g., Functioning, Functioning-at-Risk or Not
Functioning).
State who is responsible for monitoring and repairs, if necessary.
4. USFWS Rapid Stream Restoration Monitoring Protocol
The Service has developed a rapid stream restoration monitoring protocol that promotes
consistency and reproducible results (Davis et al., 2014). The protocol is based on the SFPF
(Harman et al., 2012) and addresses stream hydraulics, geomorphic functions and in-stream
structures. It does not address physicochemical and biological stream functions or other stream
corridor ecological functions such as wetlands.
V. FUNCTION-BASED STREAM RESTORATION PROJECT REVIEW
CHECK LIST
A Function-based Stream Restoration Project Process Review Checklist has been developed to
assist regulators in reviewing stream restoration project permit applications and for practitioners
in conducting stream restoration projects (Appendix A). Just like the design review checklists,
the project process review checklist is not a “step-wise” assessment procedure. Rather, it is
intended to provide a regulator and/or practitioner with a method for ensuring the stream
restoration project process contains an appropriate level of information and for identifying and/or
avoiding major assessment shortcomings. For ease of use, the format of the review checklist
follows the Function-based Stream Restoration Project Process described in this document. The
checklist includes the following sections: programmatic and design goals, site selection,
watershed assessment, reach level function-based assessment, restoration potential, design
objectives, design alternatives analysis, design development, monitoring plan and overall project
process review.
The structure of the project process review checklist is the same as the design review checklists
(Starr et al., 2015). There are four columns for most questions, which include Submitted,
Acceptable, Page Number and Comments (Figure 6). The reviewer answers “yes”, “no” or
“partially” for Submitted and Acceptable and provides a reason/explanation for Comments. A
column is also provided to cite the page number where the information is discussed in the report.
This format is straightforward for some questions, like “3.0a – Was the watershed assessment
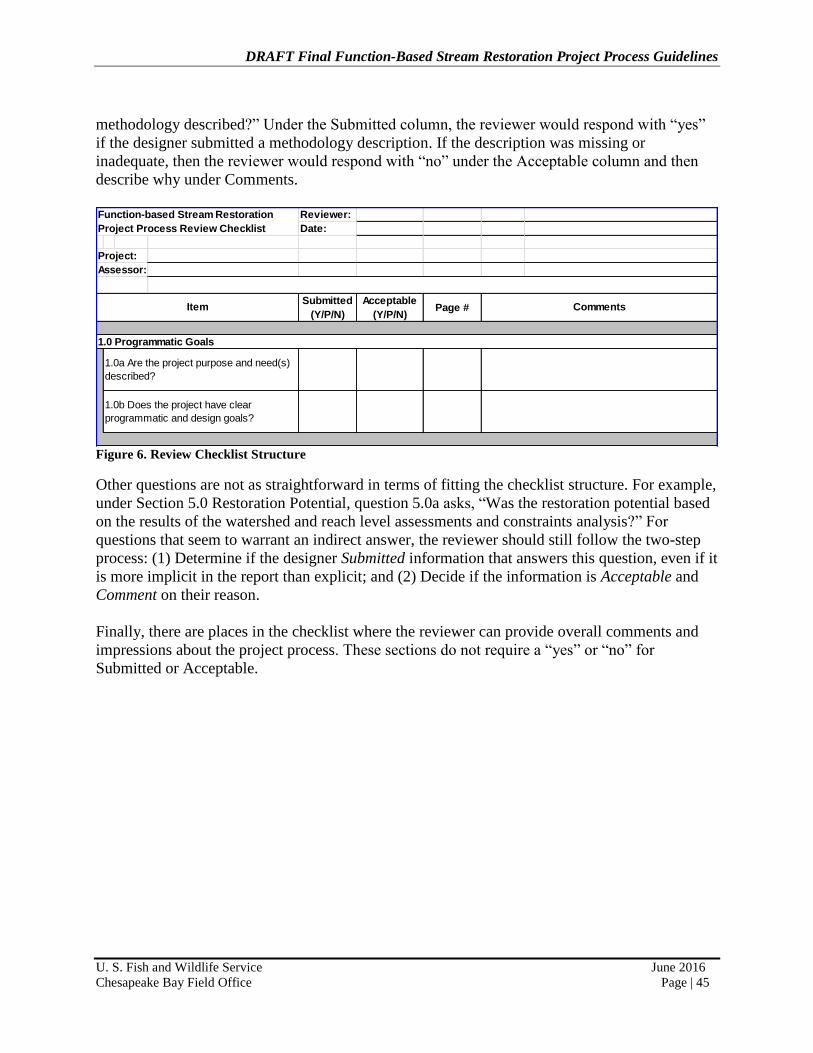
DRAFT Final Function-Based Stream Restoration Project Process Guidelines
U. S. Fish and Wildlife Service June 2016
Chesapeake Bay Field Office Page | 45
methodology described?” Under the Submitted column, the reviewer would respond with “yes”
if the designer submitted a methodology description. If the description was missing or
inadequate, then the reviewer would respond with “no” under the Acceptable column and then
describe why under Comments.
Figure 6. Review Checklist Structure
Other questions are not as straightforward in terms of fitting the checklist structure. For example,
under Section 5.0 Restoration Potential, question 5.0a asks, “Was the restoration potential based
on the results of the watershed and reach level assessments and constraints analysis?” For
questions that seem to warrant an indirect answer, the reviewer should still follow the two-step
process: (1) Determine if the designer Submitted information that answers this question, even if it
is more implicit in the report than explicit; and (2) Decide if the information is Acceptable and
Comment on their reason.
Finally, there are places in the checklist where the reviewer can provide overall comments and
impressions about the project process. These sections do not require a “yes” or “no” for
Submitted or Acceptable.
Reviewer:
Date:
Project:
Assessor:
Submitted
(Y/P/N)
Acceptable
(Y/P/N)Page #
1.0b Does the project have clear
programmatic and design goals?
Function-based Stream Restoration
Project Process Review Checklist
Comments
1.0a Are the project purpose and need(s)
described?
Item
1.0 Programmatic Goals
DRAFT Final Function-Based Stream Restoration Project Process Guidelines
U. S. Fish and Wildlife Service June 2016
Chesapeake Bay Field Office Page | 46
LITERATURE CITED
Davis, S., R.Starr and C.Eng, 2014. Rapid Stream Restoration Monitoring Protocols. U.S. Fish
and Wildlife Service. Annapolis, MD. CBFO-S14-01
Ehrenfeld, J. G., 2000. Defining the Limits of Restoration: The Need for Realistic Goals.
Restoration Ecology, 8: 2–9. doi: 10.1046/j.1526-100x.2000.80002.x
Gordon, N. D., T. A. McMahon and B. L. Finlayson, 1992. Stream Hydrology : An Introduction
for Ecologists. John Wiley & Sons Inc., 111 River Street, Hoboken, NJ 07030, USA
Harman, W., R. Starr, M. Carter, K. Tweedy, M. Clemmons, K. Suggs, C. Miller. 2012. A
Function-Based Framework for Stream Assessment and Restoration Projects. U.S.
Environmental Protection Agency, Office of Wetlands, Oceans, and Watersheds,
Washington, D.C. EPA 843-K-12-006.
Hutzel J. and R. Starr, 2015. Little Tuscarora Creek Restoration, Frederick County, Maryland:
Function-based Project Assessment and Design Report. U.S. Fish and Wildlife Service,
Chesapeake Bay Field Office, Annapolis, MD. CBFO-S15-01.
Kondolf, G. M. (1995), Five Elements for Effective Evaluation of Stream Restoration.
Restoration Ecology, 3: 133–136. doi: 10.1111/j.1526-100X.1995.tb00086.x
Kondolf, G. M. and E. Micheli, 1995. Evaluating Stream Restoration Projects. Environmental
Management, January 1995, Volume 19, Issue 1, pp 1-15.
Knighton, D., 1998. Fluvial Forms and Processes: A New Perspective. Oxford University Press
Inc., New York, New York.
Leopold, L.B., 1994. A View of the River. Harvard University Press, Cambridge, Massachusetts.
Leopold, L.B., M.G. Wolman and J.P. Miller, 1992. Fluvial Processes in Geomorphology. Dover
Publications, Inc., New York, New York.
McKay, K., I. Linkov, C. Fischenich, S. Miller, and J. Valverde, 2012. Ecosystem Restoration
Objectives and Metrics. EBA Technical Notes Collection, ERDC TN-EMRRP-EBA-16. U.S.
Army Engineer Research and Development Center, Vicksburg, Mississippi.
Orzetti, L.L., R.C. Jones, and R.F. Murphy, 2010. Stream Condition in Piedmont Streams with
Restored Riparian Buffers in the Chesapeake Bay Watershed. Journal of the American Water
Resources Association 46(3):474-485.
Palmer, M. A, et al, 2005. Standards for Ecologically Successful River Restoration. Journal of
Applied Ecology, 42, 208-217.

DRAFT Final Function-Based Stream Restoration Project Process Guidelines
U. S. Fish and Wildlife Service June 2016
Chesapeake Bay Field Office Page | 47
Pastorok, R.A., A. MacDonald, J. R. Sampson, P. Wilber, D. Yozzo and J. P Titre, 1997. An
Ecological Decision Framework for Environmental Restoration Projects. Ecological
Engineering. 9 (1997) 89 -107. DOI: 10.1016/S0925-8574(97)000036-0.
Schueler, T., Fraley-McNeal, L., and Cappiella, K., 2009. Is Impervious Cover Still Important?
Review of Recent Research. Journal of Hydrologic Engineering. DOI:10.1061/(ASCE) 1084-
0699 (2009) 14:4(309).
Starr, R. and W. Harman, 2015. Function-based Rapid Stream Assessment Protocol. U.S. Fish
and Wildlife Service – Chesapeake Bay Field Office. Annapolis, Maryland. CBFO-S15-09.
Starr, R. and W. Harman. 2015. Analytical Design Review Checklist Version 3. U.S. Fish and
Wildlife Service, Chesapeake Bay Field Office, Annapolis, MD. CBFO-S15-02. Starr, R. and W. Harman. 2015. Natural Channel Design Review Checklist Version 3. U.S. Fish
and Wildlife Service, Chesapeake Bay Field Office, Annapolis, MD. CBFO-S15-03.
Starr, R., W. Harman. 2015. Regenerative Storm Conveyance Design Review Checklist Version
3. U.S. Fish and Wildlife Service, Chesapeake Bay Field Office, Annapolis, MD. CBFO-
S15-04.
Starr, R. and W. Harman. 2015. Valley Restoration Design Review Checklist Version 3. U.S.
Fish and Wildlife Service, Chesapeake Bay Field Office, Annapolis, MD. CBFO-S15-05.
Thorne, C., et al, 2014. Project Risk Screening Matrix for River Management and Restoration.
River Research and Applications. Wiley Online Library. DOI: 10.1002/rrs.2753.
USDA, NRCS, 2007. Part 654 – Stream Restoration Design. In: NRCS National Engineering
Handbook Part 654 – Stream Restoration Design, H.210.NEH.654.
U.S. Environmental Protection Agency, 1995. Ecological Restoration: A tool to Manage Stream
Quality. U.S. Environmental Protection Agency, Office of Water, Washington D.C. EPA
841-F-95-007.
Yang, C. T., 2003. Sediment Transport: Theory and Practice. Krieger Publishing, Florida.
Yoe, C. E., 1996. An Introduction to Risk and Uncertainty in the Evaluation of Environmental
Investments. U.S. Corp of Engineers, Institute for Water Resources. Alexander, VA. IWR
Report 96-R-8.
Yozzo, D and J. Titre, 1996. Planning and Evaluating Restoration of Aquatic Habitats form an
Ecological Perspective. U.S. Corp of Engineers, Institute for Water Resources. Alexander,
VA. IWR Report 96-EL-4.

DRAFT Final Function-Based Stream Restoration Project Process Guidelines
U. S. Fish and Wildlife Service June 2016
Chesapeake Bay Field Office Page | 48

DRAFT Final Function-Based Stream Restoration Project Process Guidelines
U. S. Fish and Wildlife Service June 2016
Chesapeake Bay Field Office Page | 49
REFERENCES
Balon, E.K., 1975. Reproductive Guilds of Fish: A Proposal and Definition. Journal of the
Fisheries Research Board of Canada 32:821-864.
Barbour, M.T., J. Gerritsen, B.D. Snyder and J.B. Stribling, 1999. Rapid Bioassessment
Protocols for Use in Streams and Wadeable Rivers: Periphyton, Benthic Macroinvertebrates,
and Fish, Second Edition, EPA 841-B-99-002. U.S. Environmental Protection Agency,
Washington, DC. http://www.epa.gov/owow/monitoring/rbp/ch07main.html.
Barton D.R., W.D. Trylor and R.M. Bierre, 1985. Dimensions of Riparian Buffer Strips Required
to Maintain Trout Habitat in Southern Ontario Streams. North American Journal of Fishery
Management 5:364-378.
Bartsch, A.F. and W.M. Ingram, 1966. Biological Analysis of Water Pollution in North America.
Verhandlungen der Internationalen Vereinigung fur Theoretische und Angewandte 16:786-
800.
Eby, G.N., 2004. Principles of Environmental Geochemistry: Thomson Brooks/Cole, Pacific
Grove, CA.
Cairns, J. and J.R. Pratt, 1993. A History of Biological Monitoring Using Benthic
Macroinvertebrates. In: Freshwater Biomonitoring and Benthic Macroinvertebrates, D.M.
Rosenberg and V.H. Resh (Editors). Routledge, Chapman, and Hall, New York, New York.
Chaplin, J.J., 2005. Development of Regional Curves Relating Bankfull-Channel Geometry and
Dishcharge to Drainage Area for Streams in Pennsylvania and Selected Areas of Maryland.
U.S. Geological Survey Scientific Investigations Report 2005-5147.
Dolloff, C.A. and M.L.Warren, Jr., 2003. Fish Relationships with Large Wood in Small Streams.
American Fisheries Society Symposium 37:179–193.
Fischenich, J.C., 2006. Functional Objectives for Stream Restoration, EMRRP Technical Notes
Collection (ERDC TN-EMRRP-SR-52), U.S. Army Engineer Research and Development
Center, Vicksburg, Mississippi. http://el.erdc.usace.army.mil/elpubs/pdf/sr52.pdf.
Fisher, S.G., N.B. Grimm, E. Martı´, R.M. Holmes and J.B. Jones, Jr., 1998. Material Spiraling
in Stream Corridors: A Telescoping Ecosystem Model. Ecosystems 1:19-34.
Kuehne, R.A., 1962. A Classification of Streams, Illustrated by Fish Distribution in an Eastern
Kentucky Creek. Ecology 43(4):608-614.
Lowrance, R.R., R.L. Todd, J. Fail, O. Hendrickson, R. Leonard, and L.E. Asmussen, 1984.
Riparian Forests as Nutrient Filters in Agricultural Watersheds. Bioscience 34:374-377.
DRAFT Final Function-Based Stream Restoration Project Process Guidelines
U. S. Fish and Wildlife Service June 2016
Chesapeake Bay Field Office Page | 50
Magette, W.L., R.B. Brinsfield, R.E. Palmer, and J.D. Wood, 1989. Nutrient and Sediment
Removal by Vegetated Filter Strips. Transactions, American Society of Agricultural
Engineers 32:663–667.
Maryland Department of Natural Resources, 2004. Stream Macroinvertebrates. Annapolis,
Maryland.
Martin, E. H. and Apse, C.D., 2013. Chesapeake Fish Passage Prioritization: An Assessment of
Dams in the Chesapeake Bay Watershed. The Nature Conservancy, Eastern Division
Conservation Science. http://maps.tnc.org/erof_ChesapeakeFPP.
McCandless, T.L. and R.A. Everett, 2002. Maryland Stream Survey: Bankfull Discharge and
Channel Characteristics of Streams in the Piedmont Hydrologic Region. U.S. Fish and
Wildlife Service Technical Report CBFO-S02-01, U.S. Fish and Wildlife Service,
Chesapeake Bay Field Office, Annapolis, Maryland.
Maryland Department of Natural Resources, 1999. FIDS/Forestry Task Force Chesapeake Bay
Area Timber Harvest Plan Guidelines. Maryland Department of Natural Resources,
Annapolis, Maryland.
Opperman, J.J. and A.M. Merenlender, 2004. The Effectiveness of Riparian Restoration for
Improving Instream Fish Habitat in Four Hardwood-dominated California Streams. North
American Journal of Fisheries Management 24:822-834.
Powell, R., N. Pentz, and E. Gemmill, 1999. Hydrologic, Hydraulic and Geomorphologic
Assessment of Streams in the Piedmont Region of Maryland. Baltimore County Department
of Environment Projection and Resource Management, Towson, Maryland. (updated by
Powell in 2002).
Quinn, J.M., N.R. Phillips, and S.M. Parkyn, 2007. Factors Influencing Retention of Coarse
Particulate Organic Matter in Streams. Earth Surface Processes and Landforms 32:1186-
1203.
Rohde, F.C., R.G. Arndt, D.G. Lindquist, and J.F. Parnell, 1994. Fishes of the Carolinas,
Virginia, Maryland, and Delaware. University of North Carolina Press, Chapel Hill, North
Carolina.
Rosgen, D.L., 1994. A Classification of Natural Rivers. Catena 22:169-199.
Rosgen, D.L., 1996. Applied River Morphology. Wildland Hydrology Books, Pagosa Springs,
Colorado.
Rosgen, D.L., 2006. A Watershed Assessment for River Stability and Sediment Supply
(WARSSS). Wildland Hydrology Books, Fort Collins, Colorado. http://www.epa.gov/warsss
DRAFT Final Function-Based Stream Restoration Project Process Guidelines
U. S. Fish and Wildlife Service June 2016
Chesapeake Bay Field Office Page | 51
Simon, A., 1989. A Model of Channel Response in Disturbed Alluvial Channels. Earth Surface
Processes and Landforms 14:11-26.
Slattery, Britt E., Kathryn Reshetiloff, and Susan M. Zwicker. 2003. Native Plants for Wildlife
Habitat and Conservation Landscaping: Chesapeake Bay Watershed. U.S. Fish & Wildlife
Service, Chesapeake Bay Field Office, Annapolis, MD. 82 pp.
Stranko, S., D. Boward, J. Kilian, A.Becker, M.Ashton, M.Southerland, Franks, W.Harbold, and
J.Cessna, 2014. Maryland Biological Stream Survey:Round Four Field Sampling Manual.
Maryand Department of Natural Resources, Annapolis, MD.
U.S. Geological Survey, 2012, The StreamStats Program. http://streamstats.usgs.gov.
Warren, C.E., 1971. Biology and Water Pollution Control. W.B. Saunders, Philadelphia,
Pennsylvania.
Wilhm, J.L. and T.C. Dorris, 1968. Biological Parameters for Water Quality Criteria. Bioscience
18:477-481.
Wynn, T., S. Mostaghimi, J.A. Burger, A.A. Harpold, M.B. Henderson, and L. Henry, 2004.
Variation in Root Density along Stream Banks. Journal of Environmental Quality 33:2030-
2039.
DRAFT Final Function-Based Stream Restoration Project Process Guidelines
U. S. Fish and Wildlife Service May 2016
Chesapeake Bay Field Office
APPENDIX A

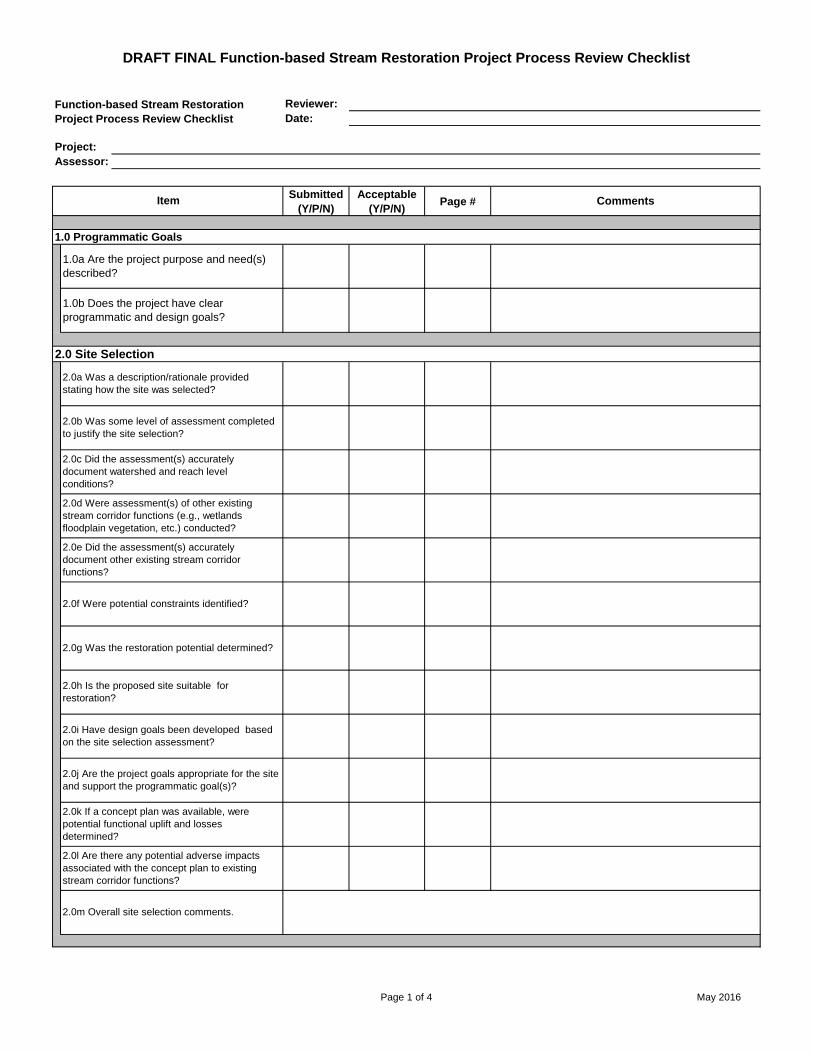
DRAFT FINAL Function-based Stream Restoration Project Process Review Checklist
Reviewer:
Date:
Project:
Assessor:
Submitted
(Y/P/N)
Acceptable
(Y/P/N)Page #
2.0k If a concept plan was available, were
potential functional uplift and losses
determined?
2.0l Are there any potential adverse impacts
associated with the concept plan to existing
stream corridor functions?
2.0d Were assessment(s) of other existing
stream corridor functions (e.g., wetlands
floodplain vegetation, etc.) conducted?
2.0e Did the assessment(s) accurately
document other existing stream corridor
functions?
2.0f Were potential constraints identified?
2.0g Was the restoration potential determined?
2.0i Have design goals been developed based
on the site selection assessment?
1.0b Does the project have clear
programmatic and design goals?
2.0m Overall site selection comments.
2.0c Did the assessment(s) accurately
document watershed and reach level
conditions?
2.0b Was some level of assessment completed
to justify the site selection?
Function-based Stream Restoration
Project Process Review Checklist
Comments
1.0a Are the project purpose and need(s)
described?
Item
1.0 Programmatic Goals
2.0 Site Selection
2.0a Was a description/rationale provided
stating how the site was selected?
2.0h Is the proposed site suitable for
restoration?
2.0j Are the project goals appropriate for the site
and support the programmatic goal(s)?
Page 1 of 4 May 2016
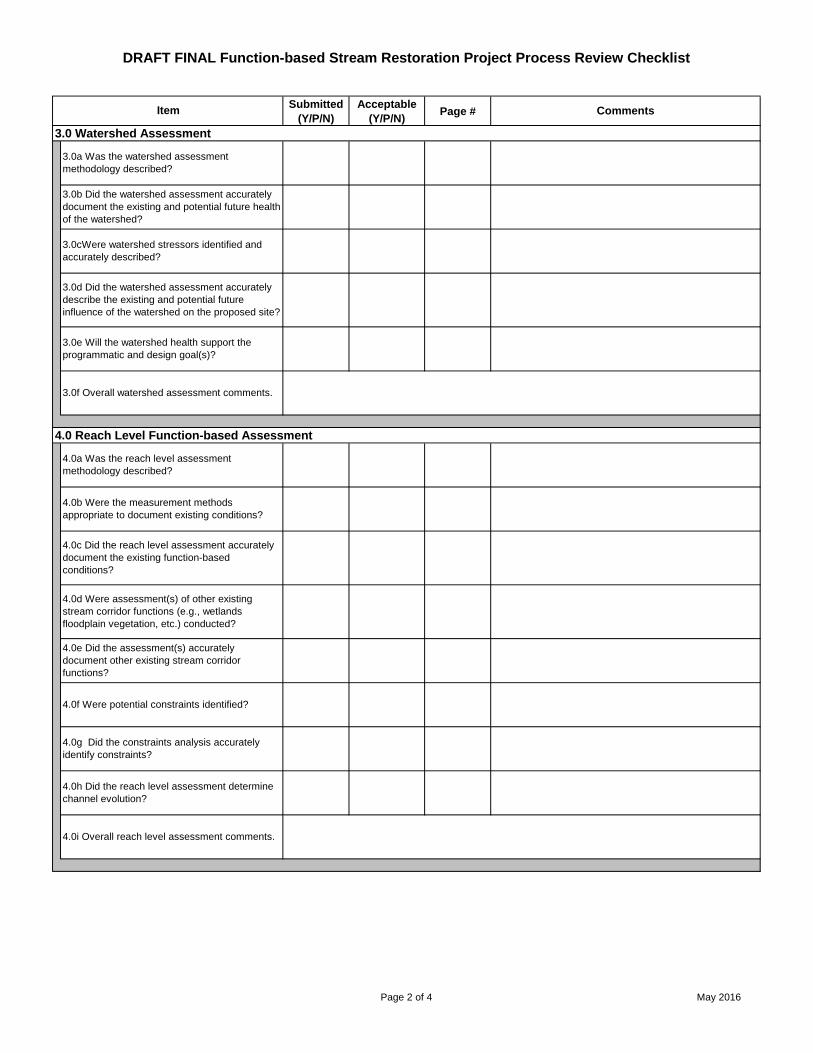
DRAFT FINAL Function-based Stream Restoration Project Process Review Checklist
Submitted
(Y/P/N)
Acceptable
(Y/P/N)Page # CommentsItem
4.0d Were assessment(s) of other existing
stream corridor functions (e.g., wetlands
floodplain vegetation, etc.) conducted?
4.0e Did the assessment(s) accurately
document other existing stream corridor
functions?
4.0g Did the constraints analysis accurately
identify constraints?
3.0e Will the watershed health support the
programmatic and design goal(s)?
4.0i Overall reach level assessment comments.
4.0f Were potential constraints identified?
3.0f Overall watershed assessment comments.
4.0a Was the reach level assessment
methodology described?
3.0 Watershed Assessment
3.0cWere watershed stressors identified and
accurately described?
4.0 Reach Level Function-based Assessment
3.0a Was the watershed assessment
methodology described?
3.0d Did the watershed assessment accurately
describe the existing and potential future
influence of the watershed on the proposed site?
4.0b Were the measurement methods
appropriate to document existing conditions?
4.0h Did the reach level assessment determine
channel evolution?
3.0b Did the watershed assessment accurately
document the existing and potential future health
of the watershed?
4.0c Did the reach level assessment accurately
document the existing function-based
conditions?
Page 2 of 4 May 2016
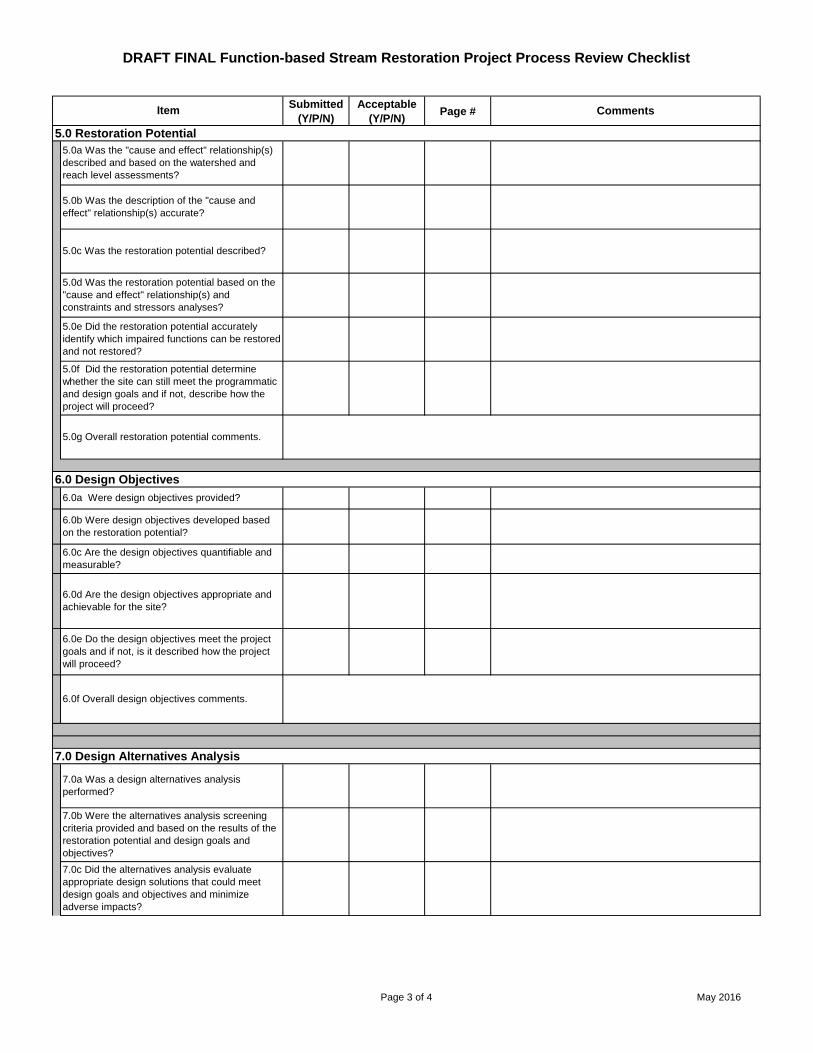
DRAFT FINAL Function-based Stream Restoration Project Process Review Checklist
Submitted
(Y/P/N)
Acceptable
(Y/P/N)Page # CommentsItem
5.0c Was the restoration potential described?
5.0b Was the description of the "cause and
effect" relationship(s) accurate?
5.0g Overall restoration potential comments.
5.0a Was the "cause and effect" relationship(s)
described and based on the watershed and
reach level assessments?
7.0c Did the alternatives analysis evaluate
appropriate design solutions that could meet
design goals and objectives and minimize
adverse impacts?
7.0 Design Alternatives Analysis
7.0a Was a design alternatives analysis
performed?
5.0e Did the restoration potential accurately
identify which impaired functions can be restored
and not restored?
5.0 Restoration Potential
5.0f Did the restoration potential determine
whether the site can still meet the programmatic
and design goals and if not, describe how the
project will proceed?
5.0d Was the restoration potential based on the
"cause and effect" relationship(s) and
constraints and stressors analyses?
6.0 Design Objectives
6.0a Were design objectives provided?
6.0d Are the design objectives appropriate and
achievable for the site?
6.0f Overall design objectives comments.
6.0e Do the design objectives meet the project
goals and if not, is it described how the project
will proceed?
6.0b Were design objectives developed based
on the restoration potential?
6.0c Are the design objectives quantifiable and
measurable?
7.0b Were the alternatives analysis screening
criteria provided and based on the results of the
restoration potential and design goals and
objectives?
Page 3 of 4 May 2016
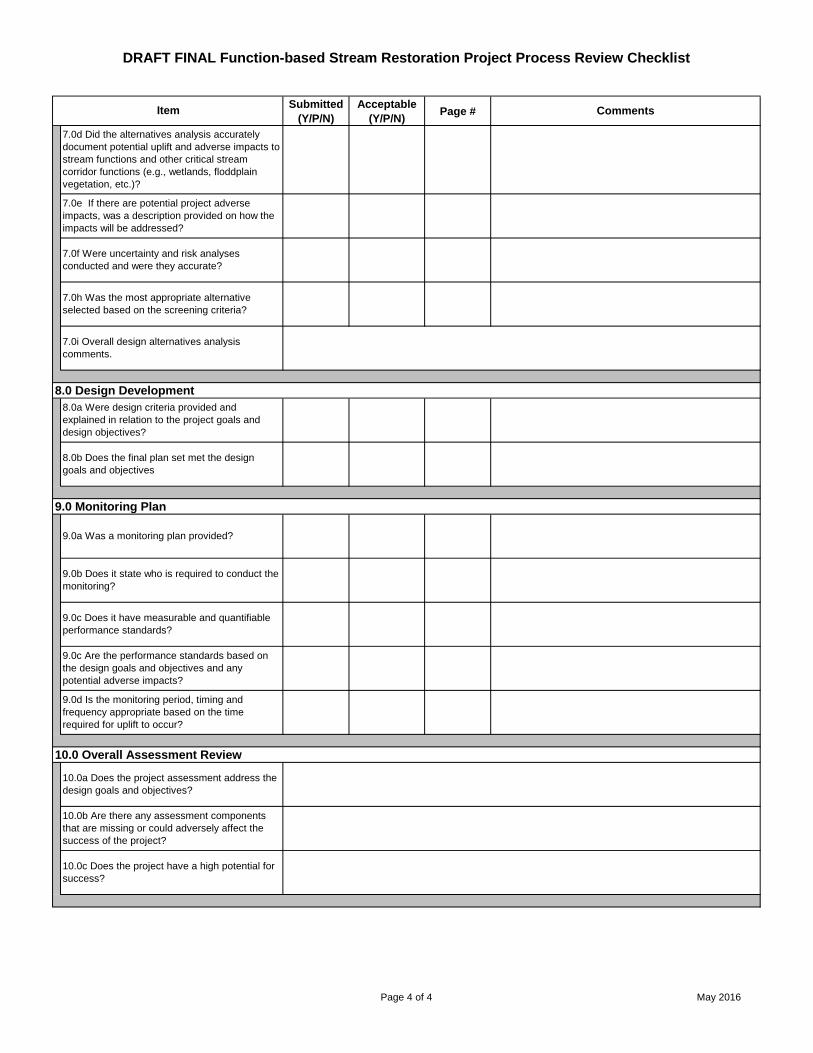
DRAFT FINAL Function-based Stream Restoration Project Process Review Checklist
Submitted
(Y/P/N)
Acceptable
(Y/P/N)Page # CommentsItem
7.0i Overall design alternatives analysis
comments.
7.0h Was the most appropriate alternative
selected based on the screening criteria?
9.0 Monitoring Plan
10.0b Are there any assessment components
that are missing or could adversely affect the
success of the project?
9.0c Does it have measurable and quantifiable
performance standards?
9.0d Is the monitoring period, timing and
frequency appropriate based on the time
required for uplift to occur?
10.0c Does the project have a high potential for
success?
9.0a Was a monitoring plan provided?
7.0e If there are potential project adverse
impacts, was a description provided on how the
impacts will be addressed?
7.0d Did the alternatives analysis accurately
document potential uplift and adverse impacts to
stream functions and other critical stream
corridor functions (e.g., wetlands, floddplain
vegetation, etc.)?
8.0 Design Development
8.0a Were design criteria provided and
explained in relation to the project goals and
design objectives?
8.0b Does the final plan set met the design
goals and objectives
9.0b Does it state who is required to conduct the
monitoring?
10.0 Overall Assessment Review
9.0c Are the performance standards based on
the design goals and objectives and any
potential adverse impacts?
10.0a Does the project assessment address the
design goals and objectives?
7.0f Were uncertainty and risk analyses
conducted and were they accurate?
Page 4 of 4 May 2016
DRAFT Final Function-Based Stream Restoration Project Process Guidelines
U. S. Fish and Wildlife Service May 2016
Chesapeake Bay Field Office
APPENDIX B


Appendix B - 1
“Step-wise” Function-based Project Process
Step 1. Programmatic and Project Goals Development Step-wise Process
• Identify drivers for the restoration effort.
• Develop programmatic goals based on the drivers.
• Develop at least one design goal, if possible, for each programmatic goal based on the SFPF.
• Compare the design goals to the restoration potential of the proposed project site.
Step 2. Site Selection Step-wise Process
• Obtain readily available and relevant information (e.g., watershed assessments, management
plans, reach level assessments, water quality data, species data, etc.) related to a proposed
project site or study area. Some of this information may already be included in Watershed
Implementation Plans or watershed plans required for MS-4 permits.
• Review the data to: determine the existing function-based conditions of the proposed project
site; identify constraints; establish restoration potential; if there is a proposed design solution,
predict potential functional uplift and/or loss; and develop or refine design goals.
• To validate existing information or if existing data is not available, conduct rapid watershed
and reach level assessments. The assessment should assess parameters that support the
programmatic and design goals. Refer to the Function-based Rapid Stream Assessment
Methodology (Starr et al., 2015) for an example of a rapid watershed assessment.
• Conduct a “windshield” tour of the watershed to validate the findings of the existing data
and/or rapid watershed assessment and focus on identifying stressors that may influence
reach level functional uplift.
• Visit the proposed project site and conduct a rapid assessment to determine the existing
function-based conditions. Refer to the Function-based Rapid Stream Assessment
Methodology (Starr et al., 2015) for an example of a rapid reach level assessment.
• Conduct other assessments necessary to document other ecological functions (e.g., wetlands,
mature forests) occurring within the project site.
• Determine the channel evolution sequence. Refer to Section IV. D. Reach Level Function-
based Assessment.
• Identify any constraints that may influence reach level functional uplift.
• Determine the highest restoration potential and the associated Pyramid level of the proposed
project site based on the watershed health (i.e., stressors), constraints and reach level
function-based conditions. Refer to Section IV. F. Restoration Potential for a detailed
description on how to determine restoration potential.
• If there is a proposed plan of action, identify any potential uplift and/or adverse impacts to
existing stream and other ecological (e.g., wetlands) functions.
• Develop design goals, if not already established.
• Compare the restoration potential to the programmatic and design goals.
• Determine if there are potentially significant adverse impacts to existing functions.

Appendix B - 2
• If the restoration potential is at least as high as the programmatic and design goals and there
are no potential adverse impacts to existing functions, then the site is suitable for restoration.
If the programmatic and/or design goals cannot be achieved at the proposed project site
and/or potential adverse impacts are significant, then the site is not suitable for restoration to
meet those goals.
• If the site is not suitable for restoration, consider revising design goals and/or potential
restoration solutions.
• If the site is not suitable and the design goals and/or potential restoration solutions cannot be
revised, then the site should be eliminated from further consideration as a potential site to
meet the programmatic goal(s).
• Describe how the proposed project supports existing and current larger-scale (Statewide,
regional, watershed) plans or policies, if applicable. • Describe how the programmatic and design goals for the proposed project site cannot be
achieved at another potential site. Note: This determination may have already been
documented in a comprehensive watershed plan, MS-4 restoration plan; or Watershed
Implementation Plan. • Consider a pre-permit application meeting with regulatory agencies to discuss results of site
selection assessment.
Step 3. Watershed assessment step-wise process
• Select watershed assessment parameters based on permit requirements and programmatic and
design goals. All levels of the Pyramid should be assessed.
• Determine level of assessment and measurement methods based on when assessment occurs
during the study process, programmatic goals, project budget and watershed size and
complexity.
• Determine if the measurement methods need to be adapted based on unique regional
characteristics (e.g. karst topography and location of endangered species).
• Determine how to relate watershed data to functions so that it can be used to understand how
the watershed health influences the proposed project site.
• Implement the appropriate level of watershed assessment, evaluate its effectiveness in
assessing watershed processes, and adapt method as necessary.
• Identify stressors and constraints.
• Combine all watershed data and determine if the watershed health will support the
programmatic and design goals. If the success of restoration depends on other actions taking
place in the watershed, note this information as well.
Step 4. Reach level function-based assessment step-wise process
• Select parameters from the Pyramid and/or other sources of information about parameters
that describe stream functions relevant to the programmatic and design goals and permit
requirements.
• Select other assessments necessary to document other ecological functions (e.g., wetlands,
mature forests) occurring within the proposed project site.
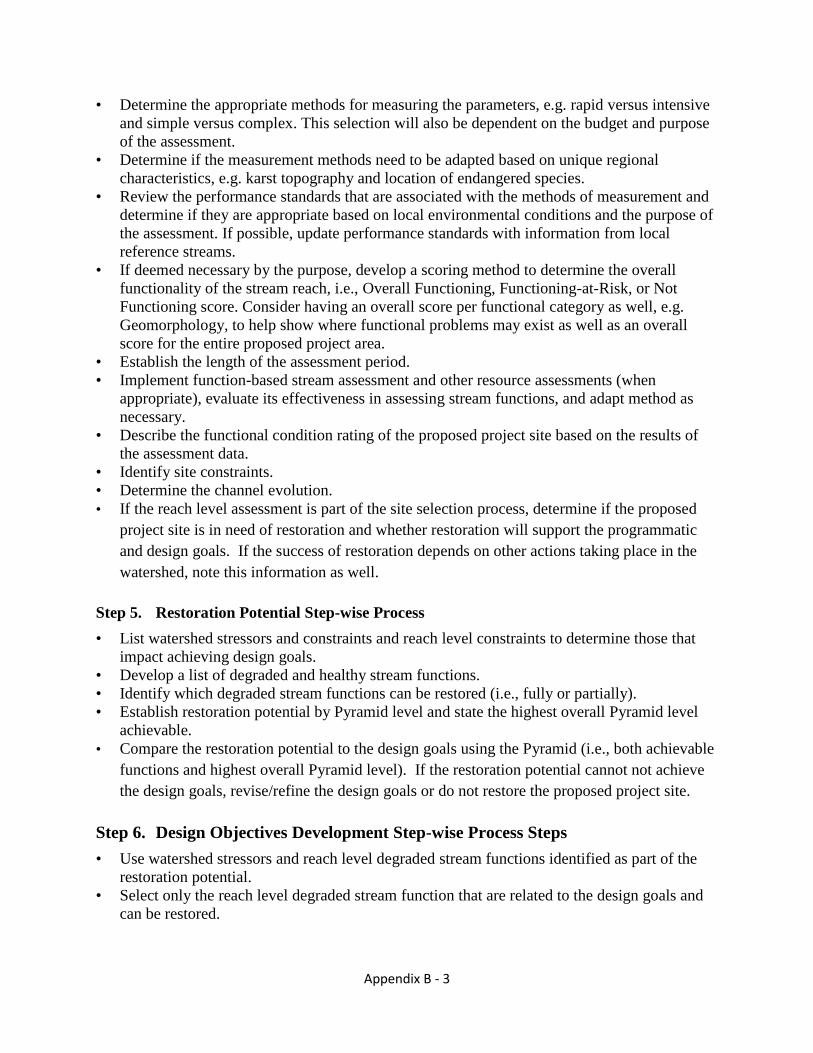
Appendix B - 3
• Determine the appropriate methods for measuring the parameters, e.g. rapid versus intensive
and simple versus complex. This selection will also be dependent on the budget and purpose
of the assessment.
• Determine if the measurement methods need to be adapted based on unique regional
characteristics, e.g. karst topography and location of endangered species.
• Review the performance standards that are associated with the methods of measurement and
determine if they are appropriate based on local environmental conditions and the purpose of
the assessment. If possible, update performance standards with information from local
reference streams.
• If deemed necessary by the purpose, develop a scoring method to determine the overall
functionality of the stream reach, i.e., Overall Functioning, Functioning-at-Risk, or Not
Functioning score. Consider having an overall score per functional category as well, e.g.
Geomorphology, to help show where functional problems may exist as well as an overall
score for the entire proposed project area.
• Establish the length of the assessment period.
• Implement function-based stream assessment and other resource assessments (when
appropriate), evaluate its effectiveness in assessing stream functions, and adapt method as
necessary.
• Describe the functional condition rating of the proposed project site based on the results of
the assessment data.
• Identify site constraints.
• Determine the channel evolution.
• If the reach level assessment is part of the site selection process, determine if the proposed
project site is in need of restoration and whether restoration will support the programmatic
and design goals. If the success of restoration depends on other actions taking place in the
watershed, note this information as well.
Step 5. Restoration Potential Step-wise Process
• List watershed stressors and constraints and reach level constraints to determine those that
impact achieving design goals.
• Develop a list of degraded and healthy stream functions.
• Identify which degraded stream functions can be restored (i.e., fully or partially).
• Establish restoration potential by Pyramid level and state the highest overall Pyramid level
achievable.
• Compare the restoration potential to the design goals using the Pyramid (i.e., both achievable
functions and highest overall Pyramid level). If the restoration potential cannot not achieve
the design goals, revise/refine the design goals or do not restore the proposed project site.
Step 6. Design Objectives Development Step-wise Process Steps
• Use watershed stressors and reach level degraded stream functions identified as part of the
restoration potential.
• Select only the reach level degraded stream function that are related to the design goals and
can be restored.

Appendix B - 4
• Organize the stressors and functions by Pyramid levels to show the interrelationship of the
stressors and stream functions.
• Develop at least one quantifiable and measureable design objective for each reach level
degraded stream function starting at the highest Pyramid level and then work down through
each level.
• Determine the uncertainty and risk of each design objective.
• Provide a description of how the functional improvement will occur and design goals are
achieved.
Step 7. Design Alternatives Analysis Step-Wise Process
• Review design goals and design objectives.
• Review watershed and reach level assessment results.
• Review restoration potential.
• Determine historic stream condition.
• Determine stream functions that would naturally form and be maintained over time given
existing watershed and reach level conditions.
• If valley slope is greater than 1 percent, consider only those design approaches based on
channel forming flows. If other design approaches are considered, the designer must
demonstrate how high shear stress conditions will be addressed.
• If there is a sediment supply, consider only those design approaches based on channel
forming flows. If other design approaches are considered, the designer must demonstrate
how sediment supply will be addressed.
• Develop a range of technically and economically feasible (practicable) design alternatives
that could potentially meet design goals and objectives and would result in the least amount
of disturbance practicable. Include the “no action” plan.
• Predict the potential functional uplift and/or loss associated with each design alternative.
Potential functional uplift and/or loss should be determined for all existing critical stream
corridor functions (e.g., streams, wetlands, floodplain vegetation, etc.).
• Consider spatial and temporal impacts; functional response time and longevity; and
construction impacts.
• Predict the potential uncertainty and risk associated with each design alternative.
• Select the alternative based on: the highest functional uplift, the least adverse impacts, best
meets project goals and design objectives, lowest uncertainty and risk and meets other critical
screening and regulatory criteria.
• For more complex projects, consider having a meeting with regulators to discuss the results
of the design alternatives analysis before proceeding to design development.
Step 8. Design Development Step-wise Process
• Select the appropriate design review checklist and use as guide to develop design.
• Develop design criteria.
• Develop concept plan and review to ensure design objectives are met; has the least amount of
disturbance practical; and minimizes adverse impacts to all critical existing stream corridor
functions.
• Consider having a pre permit application meeting with regulators to receive initial feedback
on the proposed concept design.

Appendix B - 5
• Develop draft final design; complete a feasibility analysis to demonstrate stability over time;
and review to ensure design objectives are met.
• Develop final design and specifications and review to ensure design objectives are met.
• Review design review checklist and ensure each question has been addressed.
Step 9. Monitoring Plan Development Step-wise Process
• Develop a list of assessment parameters to monitor that are quantifiable and measureable.
List should include parameters that address design goals and objectives and any existing
functions that may be adversely impacted by the proposed project.
• Organize assessment parameters by Pyramid level and determine if any other lower-level,
supporting parameters are needed to determine project success.
• Select measurement methods and performance standards for each assessment parameter.
• Describe the period, timing and frequency of each measurement method.
• Describe how monitoring data will be reported.
• Convert monitoring data to functional rating (e.g., Functioning, Functioning-at-Risk or Not
Functioning).
• State who is responsible for monitoring and repairs, if necessary.
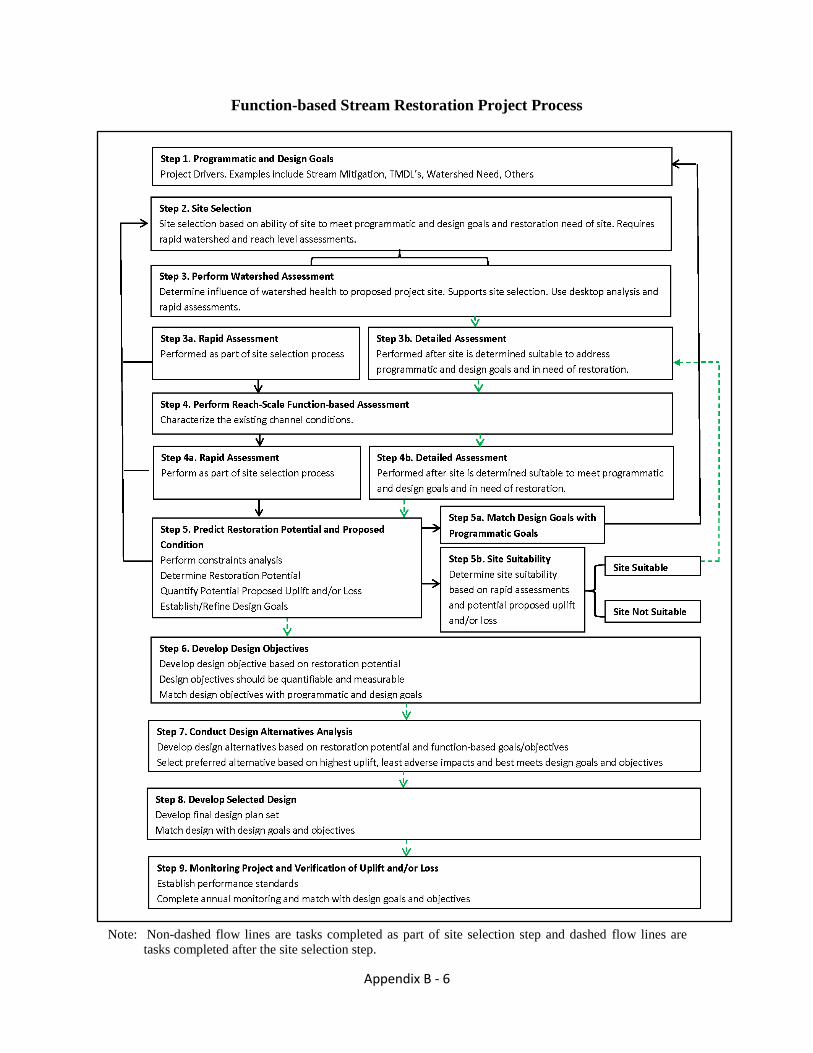
Appendix B - 6
Function-based Stream Restoration Project Process
Note: Non-dashed flow lines are tasks completed as part of site selection step and dashed flow lines are
tasks completed after the site selection step.
DRAFT Final Function-Based Stream Restoration Project Process Guidelines
U. S. Fish and Wildlife Service May 2016
Chesapeake Bay Field Office
APPENDIX C

EXAMPLE FUNCTION-BASED STREAM RESTORATION PROJECT PROCESS - TABLE OF CONTENTS
I. INTRODUCTION................................................................................................................... II. SITE SELECTION ................................................................................................................. III. PROJECT AND ASSESSMENT METHODOLOGY .........................................................
A. Project Process ................................................................................................................. B. Watersshed Assessment ................................................................................................... C. Reach Level Assessment..................................................................................................
IV. PROGRAMMATIC/PROJECT GOALS ............................................................................. V. WATERSHED AND REACH ASSESSMENT ....................................................................
A. Watershed Assessment..................................................................................................... B. Base Mapping .................................................................................................................. C. Reach Level Function-Based Assessment .......................................................................
1. Reach 1....................................................................................................................... 2. Reach 2................................................................... Error! Bookmark not defined. 3. Channel Evolution .....................................................................................................
D. Other Ecological Resource Assessments .........................................................................
VI. PRELIMINARY DESIGN ..................................................................................................... A. Constraints ................................................................... Error! Bookmark not defined. B. Restoration Potential ........................................................................................................ C. Design Objectives ............................................................................................................ D. Design Alternatives Analysis ...........................................................................................
1. Reach 1....................................................................................................................... 2. Reach 2....................................................................................................................... E. Design Development ........................................................................................................
1. Design Criteria ........................................................................................................... a. Natural Channel Design ...................................................................................... b. Storage and Infiltration System Design ..............................................................
2. Proposed Design ........................................................................................................ a. Reach 1................................................................................................................ b. Reach 2................................................................................................................
3. In-Stream Structures .................................................................................................. a. Cross-Vane .......................................................................................................... b. J-Hook Vane ....................................................................................................... c. Cobble Weir ........................................................................................................ d. Rock Sill..............................................................................................................
4. Hydrology & Hydraulics Analysis............................................................................. a. Bankfull Validation ............................................................................................. b. Geomorphic Indicators........................................................................................ c. Resistance Relationships ..................................................................................... d. Regional Relationships .......................................................................................
e. Bankfull Validation ............................................................................................. f. Hydraulic Assessment .........................................................................................
5. Sediment Analysis ..................................................................................................... 6. Vegetation Design ......................................................................................................
VII. MAINTENANCE AND MONITORING PLANS................................................................ A. Maintenance Plan ............................................................................................................. B. Monitoring Plan ...............................................................................................................
VIII. PERMIT REQUIREMENTS ................................................................................................. IX. LITERATURE CITED ..........................................................................................................
DRAFT Final Function-Based Stream Restoration Project Process Guidelines
U. S. Fish and Wildlife Service May 2016
Chesapeake Bay Field Office
APPENDIX D


Example Goals, Objectives, Assessment Parameters based on Drivers
This appendix provides examples of typical stream restoration design goals and objectives and assessment parameters based on typical restoration drivers following the SFPF. Three driver examples are provided: TMDL sediment reduction, TMDL nutrient and sediment reduction and aquatic species population improvement. Each example lists the driver(s) first. Then design goals and objectives that would typically be associated with the drivers are listed. The design objectives are displayed in a table format following the SFPF. The design goals and objectives can be modified or others can be added. Assessment parameters that would typically be assessed based on the drivers are also provided. The assessment parameters are also displayed in a table format following the SFPF. It shows the Pyramid level, assessment parameter, measurement method, value, rating, parameter level rating, Pyramid level rating and overall reach rating. Users can highlight the rating cells with color to further illustrate rating conditions, as shown in the main report. The assessment parameters are the minimum parameters that should be assessed. Other assessment parameters can be added. The measurement methods provided are only suggestions. Other measurement methods can be used instead as long as they are quantitative and have performance standards. For the nutrient and sediment examples, assessment parameters are shown for Pyramid Levels 4 – Physicochemical and 5 – Biology to meet permit requirements. The tables shown in the example are in a separate Excel file and can be downloaded from http://www.fws.gov/chesapeakebay/stream/protocols.html.

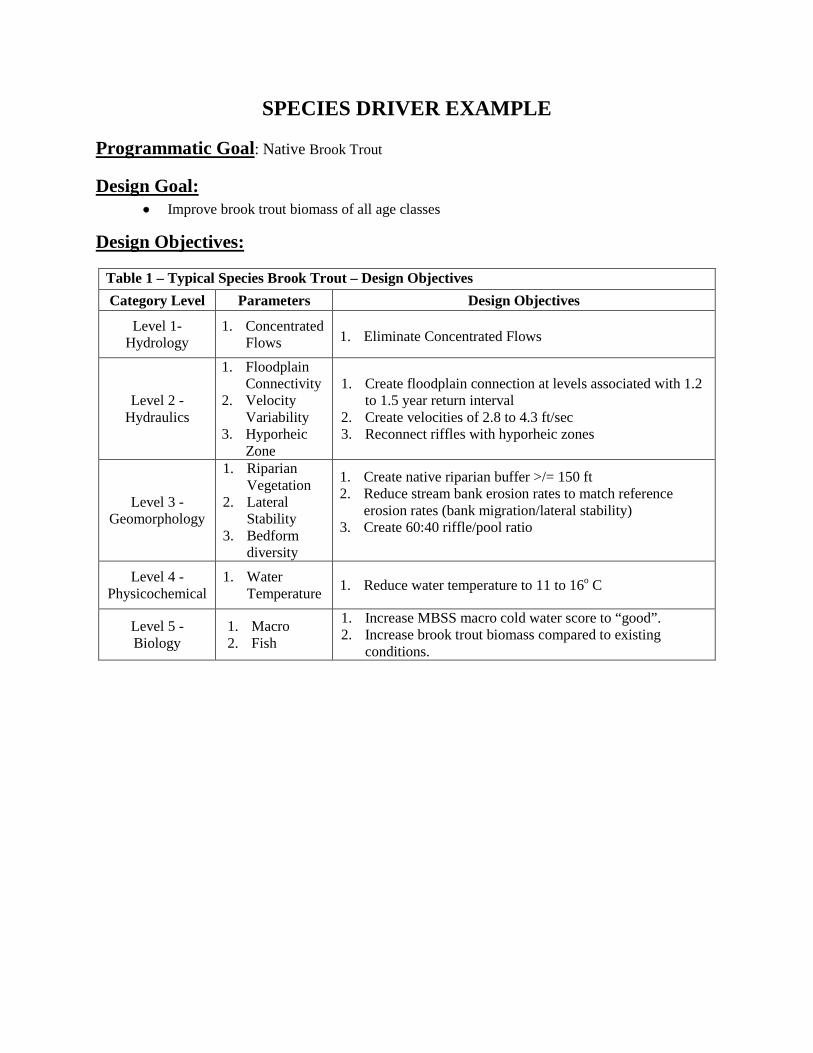
SPECIES DRIVER EXAMPLE
Programmatic Goal: Native Brook Trout
Design Goal: • Improve brook trout biomass of all age classes
Design Objectives:
Table 1 – Typical Species Brook Trout – Design Objectives Category Level Parameters Design Objectives
Level 1- Hydrology
1. Concentrated Flows
1. Eliminate Concentrated Flows
Level 2 - Hydraulics
1. Floodplain Connectivity
2. Velocity Variability
3. Hyporheic Zone
1. Create floodplain connection at levels associated with 1.2
to 1.5 year return interval 2. Create velocities of 2.8 to 4.3 ft/sec 3. Reconnect riffles with hyporheic zones
Level 3 - Geomorphology
1. Riparian Vegetation
2. Lateral Stability
3. Bedform diversity
1. Create native riparian buffer >/= 150 ft 2. Reduce stream bank erosion rates to match reference
erosion rates (bank migration/lateral stability) 3. Create 60:40 riffle/pool ratio
Level 4 - Physicochemical
1. Water Temperature 1. Reduce water temperature to 11 to 16o C
Level 5 - Biology
1. Macro 2. Fish
1. Increase MBSS macro cold water score to “good”. 2. Increase brook trout biomass compared to existing
conditions.
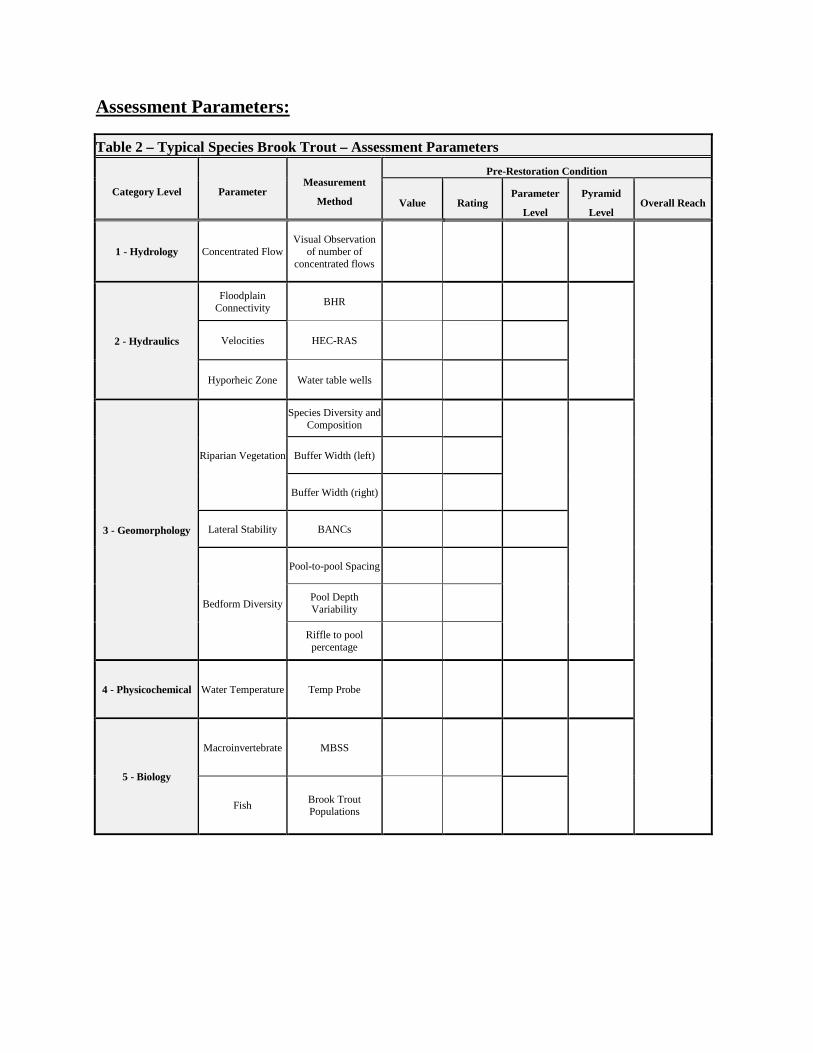
Assessment Parameters:
Table 2 – Typical Species Brook Trout – Assessment Parameters
Category Level Parameter Measurement
Method Pre-Restoration Condition
Value Rating Parameter
Level Pyramid
Level Overall Reach
1 - Hydrology Concentrated Flow Visual Observation
of number of concentrated flows
2 - Hydraulics
Floodplain Connectivity BHR
Velocities HEC-RAS
Hyporheic Zone Water table wells
3 - Geomorphology
Riparian Vegetation
Species Diversity and Composition
Buffer Width (left)
Buffer Width (right) Lateral Stability BANCs
Bedform Diversity
Pool-to-pool Spacing
Pool Depth Variability
Riffle to pool percentage
4 - Physicochemical Water Temperature Temp Probe
5 - Biology
Macroinvertebrate MBSS
Fish Brook Trout Populations

TMDL NUTRIENT and SEDIMENT DRIVER EXAMPLE
Programmatic Goal: TMDL Nutrient and Sediment Reduction
Design Goals: • Reduce sediment loads from eroding stream banks (Lvl 3) • Capture sediment loads from upstream sources (Lvl 3) • Reduce nutrients concentrations (Lvl 4)
Design Objectives:
Table 1 – Typical Nutrient and Sediment TMDL – Design Objectives Category Level Parameters Design Objectives
Level 1- Hydrology
1. Flow Regime 2. Concentrated
Flows
1. Reduce hydrograph peaks and increase duration compared to existing conditions
2. Eliminate Concentrated Flows
Level 2 - Hydraulics
1. Floodplain Connectivity
2. Floodplain Storage
3. Groundwater 4. Base flow
1. Create floodplain connection at levels associated with specified design storm event (e.g., return interval, storm event intensity, etc)
2. Store flood flows in the floodplain associated with a specified design discharge
3. Raise groundwater levels to (insert design depth) 4. Increase base flow levels to (insert design depths or
annual duration of base flows)
Level 3 - Geomorphology
1. Lateral Stability
2. Sediment Reduction and Trapping
3. Bedform Diversity
4. Riparian Buffer
1. Reduce stream bank erosion rates to match reference erosion rates (bank migration/lateral stability)
2. Decrease sediment loads leaving the project to loads less than entering loads entering the project
3. Increase Bedform Diversity – Create (insert design bed ratio) riffle/pool ratio
4. Create native riparian buffer >/= 150 ft
Level 4 - Physicochemical
1. Nutrient Levels
1. Reduce nutrient concentration compared to existing conditions
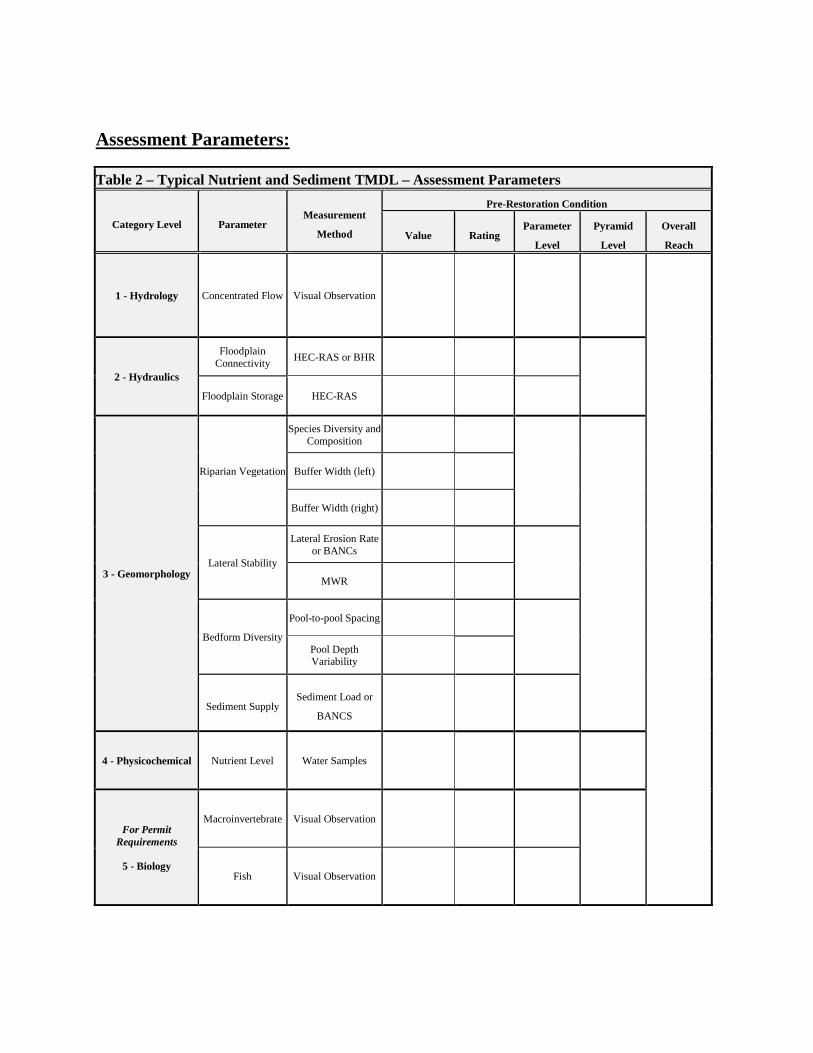
Assessment Parameters:
Table 2 – Typical Nutrient and Sediment TMDL – Assessment Parameters
Category Level Parameter Measurement
Method Pre-Restoration Condition
Value Rating Parameter
Level Pyramid
Level
Overall
Reach
1 - Hydrology Concentrated Flow Visual Observation
2 - Hydraulics Floodplain
Connectivity HEC-RAS or BHR
Floodplain Storage HEC-RAS
3 - Geomorphology
Riparian Vegetation
Species Diversity and Composition
Buffer Width (left)
Buffer Width (right)
Lateral Stability Lateral Erosion Rate
or BANCs
MWR
Bedform Diversity Pool-to-pool Spacing
Pool Depth Variability
Sediment Supply Sediment Load or
BANCS
4 - Physicochemical Nutrient Level Water Samples
For Permit Requirements
5 - Biology
Macroinvertebrate Visual Observation
Fish Visual Observation
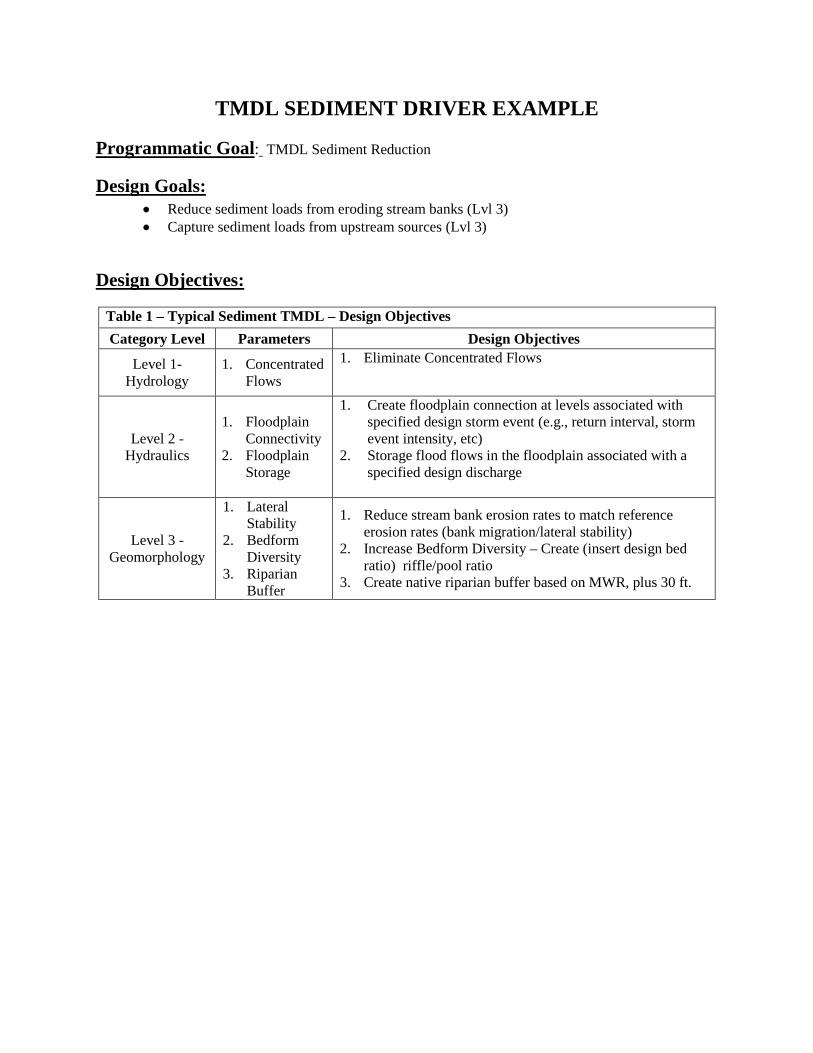
TMDL SEDIMENT DRIVER EXAMPLE
Programmatic Goal: TMDL Sediment Reduction
Design Goals: • Reduce sediment loads from eroding stream banks (Lvl 3) • Capture sediment loads from upstream sources (Lvl 3)
Design Objectives:
Table 1 – Typical Sediment TMDL – Design Objectives Category Level Parameters Design Objectives
Level 1- Hydrology
1. Concentrated Flows
1. Eliminate Concentrated Flows
Level 2 - Hydraulics
1. Floodplain Connectivity
2. Floodplain Storage
1. Create floodplain connection at levels associated with specified design storm event (e.g., return interval, storm event intensity, etc)
2. Storage flood flows in the floodplain associated with a specified design discharge
Level 3 - Geomorphology
1. Lateral Stability
2. Bedform Diversity
3. Riparian Buffer
1. Reduce stream bank erosion rates to match reference erosion rates (bank migration/lateral stability)
2. Increase Bedform Diversity – Create (insert design bed ratio) riffle/pool ratio
3. Create native riparian buffer based on MWR, plus 30 ft.
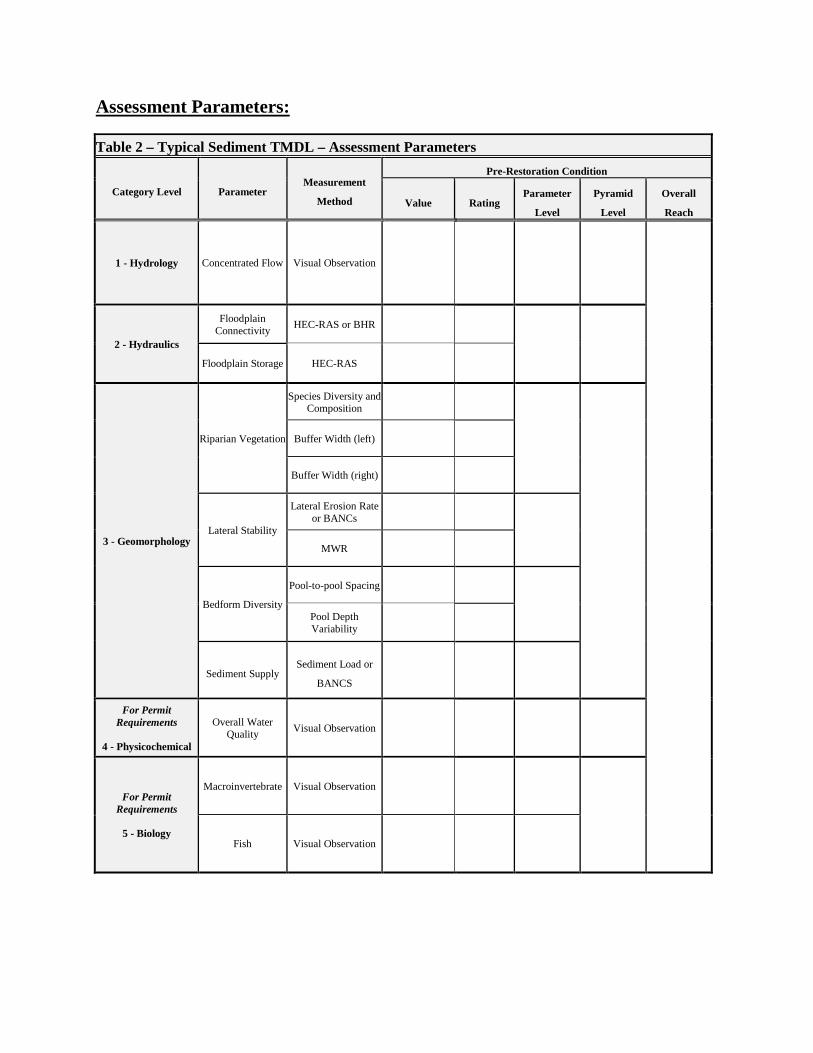
Assessment Parameters:
Table 2 – Typical Sediment TMDL – Assessment Parameters
Category Level Parameter Measurement
Method Pre-Restoration Condition
Value Rating Parameter
Level Pyramid
Level
Overall
Reach
1 - Hydrology Concentrated Flow Visual Observation
2 - Hydraulics Floodplain
Connectivity HEC-RAS or BHR
Floodplain Storage HEC-RAS
3 - Geomorphology
Riparian Vegetation
Species Diversity and Composition
Buffer Width (left)
Buffer Width (right)
Lateral Stability Lateral Erosion Rate
or BANCs
MWR
Bedform Diversity Pool-to-pool Spacing
Pool Depth Variability
Sediment Supply Sediment Load or
BANCS For Permit
Requirements
4 - Physicochemical Overall Water
Quality Visual Observation
For Permit Requirements
5 - Biology
Macroinvertebrate Visual Observation
Fish Visual Observation
DRAFT Final Function-Based Stream Restoration Project Process Guidelines
U. S. Fish and Wildlife Service May 2016
Chesapeake Bay Field Office
APPENDIX E

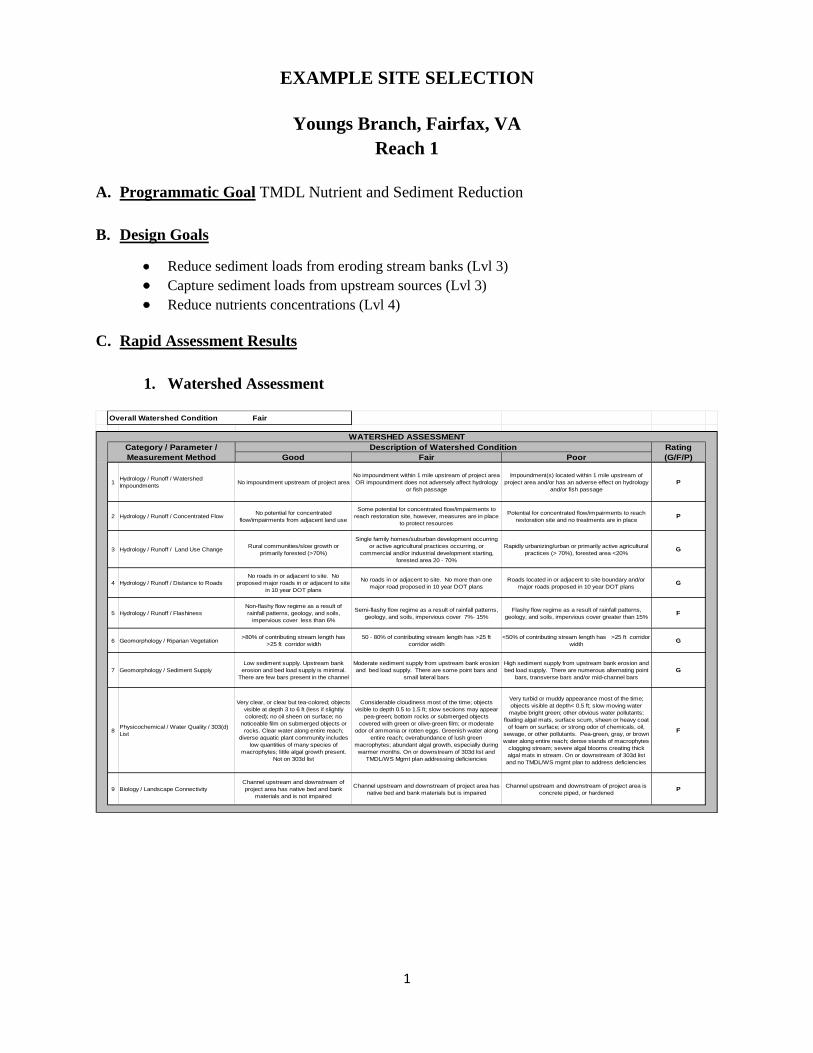
1
EXAMPLE SITE SELECTION
Youngs Branch, Fairfax, VA Reach 1
A. Programmatic Goal TMDL Nutrient and Sediment Reduction
B. Design Goals
• Reduce sediment loads from eroding stream banks (Lvl 3) • Capture sediment loads from upstream sources (Lvl 3) • Reduce nutrients concentrations (Lvl 4)
C. Rapid Assessment Results
1. Watershed Assessment
Good Fair Poor
1Hydrology / Runoff / Watershed Impoundments No impoundment upstream of project area
No impoundment within 1 mile upstream of project area OR impoundment does not adversely affect hydrology
or fish passage
Impoundment(s) located within 1 mile upstream of project area and/or has an adverse effect on hydrology
and/or fish passageP
2 Hydrology / Runoff / Concentrated Flow No potential for concentrated flow/impairments from adjacent land use
Some potential for concentrated flow/impairments to reach restoration site, however, measures are in place
to protect resources
Potential for concentrated flow/impairments to reach restoration site and no treatments are in place
P
3 Hydrology / Runoff / Land Use Change Rural communities/slow growth or primarily forested (>70%)
Single family homes/suburban development occurring or active agricultural practices occurring, or
commercial and/or industrial development starting, forested area 20 - 70%
Rapidly urbanizing/urban or primarily active agricultural practices (> 70%), forested area <20%
G
4 Hydrology / Runoff / Distance to RoadsNo roads in or adjacent to site. No
proposed major roads in or adjacent to site in 10 year DOT plans
No roads in or adjacent to site. No more than one major road proposed in 10 year DOT plans
Roads located in or adjacent to site boundary and/or major roads proposed in 10 year DOT plans
G
5 Hydrology / Runoff / FlashinessNon-flashy flow regime as a result of rainfall patterns, geology, and soils,
impervious cover less than 6%
Semi-flashy flow regime as a result of rainfall patterns, geology, and soils, impervious cover 7%- 15%
Flashy flow regime as a result of rainfall patterns, geology, and soils, impervious cover greater than 15%
F
6 Geomorphology / Riparian Vegetation>80% of contributing stream length has
>25 ft corridor width50 - 80% of contributing stream length has >25 ft
corridor width<50% of contributing stream length has >25 ft corridor
width G
7 Geomorphology / Sediment SupplyLow sediment supply. Upstream bank
erosion and bed load supply is minimal. There are few bars present in the channel
Moderate sediment supply from upstream bank erosion and bed load supply. There are some point bars and
small lateral bars
High sediment supply from upstream bank erosion and bed load supply. There are numerous alternating point
bars, transverse bars and/or mid-channel barsG
8Physicochemical / Water Quality / 303(d) List
Very clear, or clear but tea-colored; objects visible at depth 3 to 6 ft (less if slightly colored); no oil sheen on surface; no
noticeable film on submerged objects or rocks. Clear water along entire reach;
diverse aquatic plant community includes low quantities of many species of
macrophytes; little algal growth present. Not on 303d list
Considerable cloudiness most of the time; objects visible to depth 0.5 to 1.5 ft; slow sections may appear
pea-green; bottom rocks or submerged objects covered with green or olive-green film; or moderate
odor of ammonia or rotten eggs. Greenish water along entire reach; overabundance of lush green
macrophytes; abundant algal growth, especially during warmer months. On or downstream of 303d list and
TMDL/WS Mgmt plan addressing deficiencies
Very turbid or muddy appearance most of the time; objects visible at depth< 0.5 ft; slow moving water maybe bright green; other obvious water pollutants;
floating algal mats, surface scum, sheen or heavy coat of foam on surface; or strong odor of chemicals, oil,
sewage, or other pollutants. Pea-green, gray, or brown water along entire reach; dense stands of macrophytes
clogging stream; severe algal blooms creating thick algal mats in stream. On or downstream of 303d list and no TMDL/WS mgmt plan to address deficiencies
F
9 Biology / Landscape ConnectivityChannel upstream and downstream of project area has native bed and bank
materials and is not impaired
Channel upstream and downstream of project area has native bed and bank materials but is impaired
Channel upstream and downstream of project area is concrete piped, or hardened
P
Category / Parameter / Measurement Method
Description of Watershed Condition Rating (G/F/P)
Overall Watershed Condition Fair
WATERSHED ASSESSMENT

2
2. Reach Level Assessment
Rating Parameter Rating
Level Rating
Overall Reach Rating
Rating Parameter Rating
Level Rating
Overall Reach
Flashiness FAR FAR*Concentrated
FlowNF F
Bank Height Ratio
NF F
Entrenchment Ratio
NF F
Floodplain Drainage
FWS Rapid Assessment
NF F
Vertical Stability Extent
FWS Rapid Assessment
NF F
Riparain Vegetation
FWS Rapid Assessment
FAR FAR F F
Lateral Stability
Dominant Bank Ersoion Rate
NF NF F F
Shelter for Fish FAR F
Pool-to-pool Spacing
NF F
Pool Depth Variability
F F
Lateral Stability Extent
FWS Rapid Assessment
NF NF F F
Water Appearance
and Nutrients
FWS Rapid Assessment
FAR FAR FAR* FAR*
DetritusFWS Rapid Assessment
FAR FAR F F
Presence FAR FAR*Tolerance NF NF
Fish Presence FAR FAR FAR* FAR*Note: "*" indicates partial uplift
Rating
FAR
Constraints
NF
NF
FAR
FAR
FAR
F
F
F
FAR*
Parameter Measurement Method
Pre-Restoration Condition
1 - Hydrology Runoff FAR
FAR
2 - Hydraulics
FAR
4 - Physicochemical
FAR
Floodplain Connectivity
NF
FARBedform Diversity
FAR
Youngs Branch, Fairfax, VA: YB-R1
CommentTrending towards functioning. Bedrock downstream and pond upstream of reach. So no longer
downcutting but stream is incised and entrenched. Widespread lateral instability. Will be decades before equilibrium is met.
Inline pond at upstream end.
Proposed Condition
FAR*
FAR*
F
F
FAR*
FAR*
Channel Evolution
3 - Geomorphology
5 - BiologyMacro
Level and Category
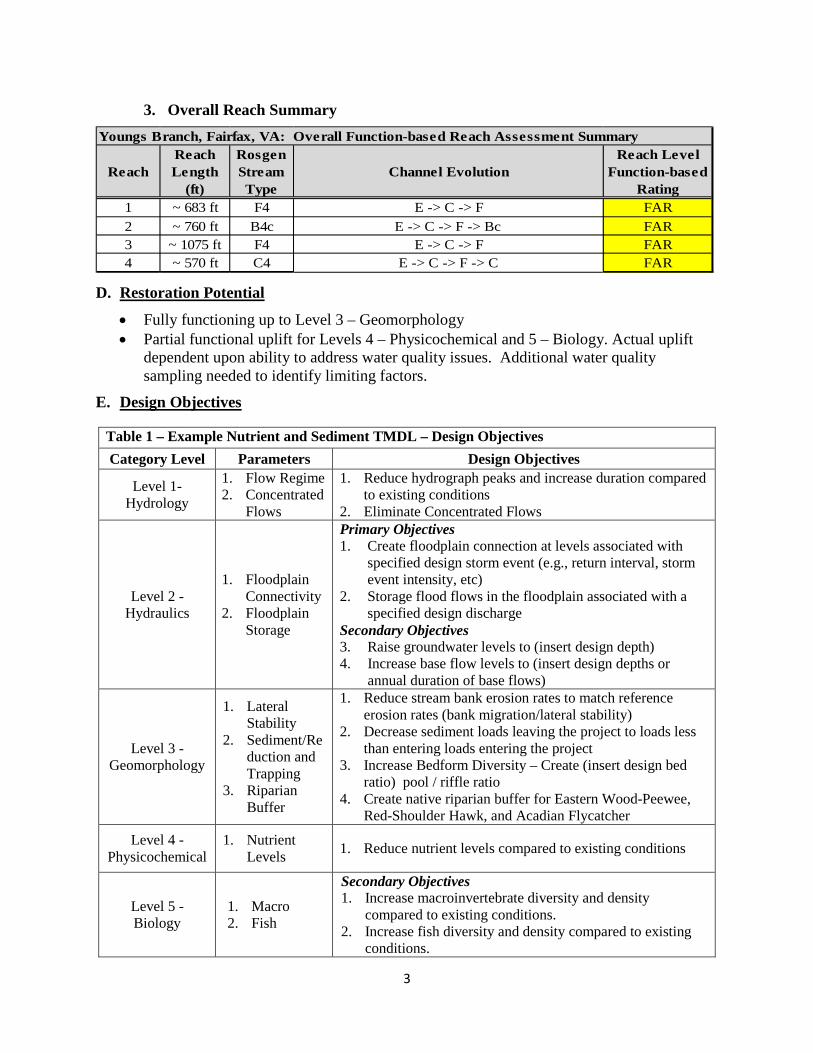
3
3. Overall Reach Summary
D. Restoration Potential
• Fully functioning up to Level 3 – Geomorphology • Partial functional uplift for Levels 4 – Physicochemical and 5 – Biology. Actual uplift
dependent upon ability to address water quality issues. Additional water quality sampling needed to identify limiting factors.
E. Design Objectives
Table 1 – Example Nutrient and Sediment TMDL – Design Objectives Category Level Parameters Design Objectives
Level 1- Hydrology
1. Flow Regime 2. Concentrated
Flows
1. Reduce hydrograph peaks and increase duration compared to existing conditions
2. Eliminate Concentrated Flows
Level 2 - Hydraulics
1. Floodplain Connectivity
2. Floodplain Storage
Primary Objectives 1. Create floodplain connection at levels associated with
specified design storm event (e.g., return interval, storm event intensity, etc)
2. Storage flood flows in the floodplain associated with a specified design discharge
Secondary Objectives 3. Raise groundwater levels to (insert design depth) 4. Increase base flow levels to (insert design depths or
annual duration of base flows)
Level 3 - Geomorphology
1. Lateral Stability
2. Sediment/Reduction and Trapping
3. Riparian Buffer
1. Reduce stream bank erosion rates to match reference erosion rates (bank migration/lateral stability)
2. Decrease sediment loads leaving the project to loads less than entering loads entering the project
3. Increase Bedform Diversity – Create (insert design bed ratio) pool / riffle ratio
4. Create native riparian buffer for Eastern Wood-Peewee, Red-Shoulder Hawk, and Acadian Flycatcher
Level 4 - Physicochemical
1. Nutrient Levels 1. Reduce nutrient levels compared to existing conditions
Level 5 - Biology
1. Macro 2. Fish
Secondary Objectives 1. Increase macroinvertebrate diversity and density
compared to existing conditions. 2. Increase fish diversity and density compared to existing
conditions.
ReachReach Length
(ft)
Rosgen Stream Type
Channel EvolutionReach Level
Function-based Rating
1 ~ 683 ft F4 E -> C -> F FAR2 ~ 760 ft B4c E -> C -> F -> Bc FAR3 ~ 1075 ft F4 E -> C -> F FAR4 ~ 570 ft C4 E -> C -> F -> C FAR
Youngs Branch, Fairfax, VA: Overall Function-based Reach Assessment Summary

4
F. Potential Design Solutions
1. Overall Project Length: • The possibly exists to build a Priority 1 stream restoration. The farthest upstream end
of the project would most likely be a Priority 3. As the stream moves downstream, a Priority 2 could be built. At the lower end of the project area, a Priority 1 could be built along or near the existing stream alignment or completely separate of the existing alignment. The possibility of this approach is mostly depended upon the overall grade drop of the project area. Enough grade drop has to occur to avoid any significant backwater affects. However, a portion of the upstream project area could be specifically designed to be a backwater area so that a Priority 1 stream could be constructed as far upstream as possible. Flood stages typically increase when building a Priority 1 project. However, the stream flows through a valley that has high, steep valley walls and there are no structures on the valley floor. Therefore, there would be no flooding impacts. There are though, sewer lines that are parallel and perpendicular to the stream that might be affected by elevated flood flows.
2. Reach Specific:
• Rosgen Priority 2 but significant grading and tree removal will be required since the stream is significantly incised and entrenched (Rosgen F4). To reduce grading a Priority 3 could be built. USGS shows that percent imperviousness is 1.15%. However, based on a visual observation of the watershed, the percent imperviousness could actually be higher. The correct percent imperviousness needs to be determined because it could significantly influence the design channel dimensions. Also there is an inline storm water pond at the upstream end of this reach. This is most likely controlling sediment supply and possibly the effects of percent imperviousness. H&H modelling will be required to determine the effects of the pond. If pond does control storm flows, a nested channel may not be required. If it does not, a nested channel should be considered. If a nested channel is built, the low flow channel would be based on a rural regional curve and the next channel, which would connect with the floodplain, would be based on a more urban regional curve.
• Modified valley restoration is also an option. Potential greater WQ uplift with valley restoration. Approach could use riffle grade controls to reconnect to floodplain with flows less than a bankfull flow. However, sediment supply being delivered to the project area must be determined. If sediment supply is low, then a modified valley restoration approach could be used.
3. Other Ecological Functions
• Wetlands – wetlands are located throughout the project area floodplain. Hydrology source appears to be from valley toe seeps. Wetlands have the potential to be enhanced as part of the proposed stream restoration project.
• Riparian vegetation – while there is a mature forest stand within the project area floodplain, it consists primarily of canopy tree. Trees will have to be removed as part of the restoration but they will be used as instream structures. Additionally, a planting plant will be installed within the floodplain to enhance the existing vegetation.
5
4. Other Implementation Considerations • Property Ownership – Fairfax County owned • Accessibility – will have to access through private property • Construction Impacts – while there is a mature forest stand within the project
floodplain, it consists primarily of canopy trees. So a construction road can be utilized with minimal impacts to existing trees. As stated above, the existing riparian will be enhanced
• Implementation Costs – potential costs could be feasible because there are few constraints and grading can be minimalized.
• Contaminant – none observed • Cultural Resources – none observed • Permitting Requirements – no unique permit requirements
G. Site Suitability
• Site is degraded • Potential for uplift exists • Minimal adverse impacts • No unreasonable implementation issues • Uncertainty and risk low • Design goals and objectives can be met • Suitable site for restoration
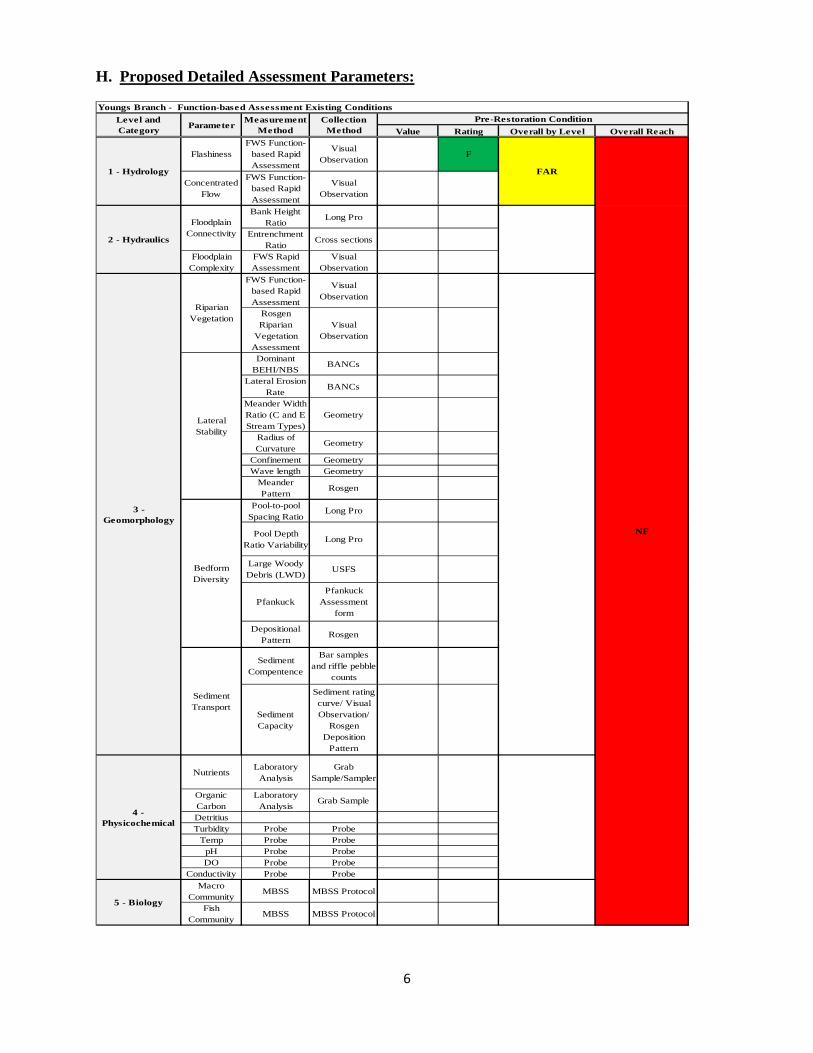
6
H. Proposed Detailed Assessment Parameters:
Value Rating Overall by Level Overall Reach
FlashinessFWS Function-
based Rapid Assessment
Visual Observation
F
Concentrated Flow
FWS Function-based Rapid Assessment
Visual Observation
Bank Height Ratio
Long Pro
Entrenchment Ratio
Cross sections
Floodplain Complexity
FWS Rapid Assessment
Visual Observation
FWS Function-based Rapid Assessment
Visual Observation
Rosgen Riparian
Vegetation Assessment
Visual Observation
Dominant BEHI/NBS
BANCs
Lateral Erosion Rate
BANCs
Meander Width Ratio (C and E Stream Types)
Geometry
Radius of Curvature
Geometry
Confinement GeometryWave length Geometry
Meander Pattern
Rosgen
Pool Depth Ratio Variability
Long Pro
Large Woody Debris (LWD)
USFS
PfankuckPfankuck
Assessment form
Depositional Pattern
Rosgen
Sediment Compentence
Bar samples and riffle pebble
counts
Sediment Capacity
Sediment rating curve/ Visual Observation/
Rosgen Deposition
Pattern
NutrientsLaboratory
AnalysisGrab
Sample/Sampler
Organic Carbon
Laboratory Analysis
Grab Sample
DetritiusTurbidity Probe Probe
Temp Probe ProbepH Probe ProbeDO Probe Probe
Conductivity Probe ProbeMacro
CommunityMBSS MBSS Protocol
Fish Community
MBSS MBSS Protocol
NF
Youngs Branch - Function-based Assessment Existing ConditionsLevel and Category Parameter
Measurement Method
Pre-Restoration Condition
1 - Hydrology FAR
Collection Method
Long Pro3 - Geomorphology
2 - Hydraulics
Floodplain Connectivity
Pool-to-pool Spacing Ratio
Riparian Vegetation
Lateral Stability
Bedform Diversity
Sediment Transport
4 - Physicochemical
5 - Biology
DRAFT Final Function-Based Stream Restoration Project Process Guidelines
U. S. Fish and Wildlife Service May 2016
Chesapeake Bay Field Office
APPENDIX F
(Under review by MDE. Will be added once approved)
